Abstract
Advances in near real-time rainstorm prediction using remote sensing have offered important opportunities for effective disaster management. However, this information is subject to several sources of systematic errors that need to be corrected. Temporal and spatial characteristics of both satellite and in-situ data can be combined to enhance the quality of storm estimates. In this study, we present a spatiotemporal object-based method to bias correct two sources of systematic error in satellites: displacement and volume. The method, Spatiotemporal Contiguous Object-based Rainfall Analysis for Bias Correction (ST-CORAbico), uses the spatiotemporal rainfall analysis ST-CORA incorporated with a multivariate kernel density storm segmentation for describing the main storm event characteristics (duration, spatial extension, volume, maximum intensity, centroid). Displacement and volume are corrected by adjusting the spatiotemporal structure and the intensity distribution, respectively. ST-CORAbico was applied to correct the early version of the Integrated Multi-satellite Retrievals for the Global Precipitation Mission (GPM-IMERG) over the Lower Mekong basin in Thailand during the monsoon season from 2014 to 2017. The performance of ST-CORABico is compared against the Distribution Transformation (DT) and Gamma Quantile Mapping (GQM) probabilistic methods. A total of 120 storm events identified over the study area were classified into short and long-lived storms by using a k-means cluster analysis method. Examples for both storm event types describe the error reduction due to location and magnitude by ST-CORAbico. The results showed that the displacement and magnitude correction made by ST-CORAbico considerably reduced RMSE and bias of GPM-IMERG. In both storm event types, this method showed a lower impact on the spatial correlation of the storm event. In comparison with DT and GQM, ST-CORAbico showed a superior performance, outperforming both approaches. This spatiotemporal bias correction method offers a new approach to enhance the accuracy of satellite-derived information for near real-time estimation of storm events.
1. Introduction
Rainfall is a key component in the hydrological cycle and the primary source of freshwater in many regions. However, climatic extremes, such as floods and landslides that are caused by heavy rainfall events, pose a great threat to communities causing loss of life and damage to properties [1,2]. Flood monitoring and water management applications require a high accuracy representation of rainfall in extreme conditions [3]. This is of particular importance in tropical monsoonal climates, such as the Mekong basin region, where convective storm events are localised in space and time.
Traditionally, rain gauges and ground-based weather radar networks have provided the most reliable precipitation data at the catchment scale [4]. However, in many areas around the world, these data are either scarce or not available. An irregular distribution of these ground-based observation stations makes it difficult to discern spatiotemporal features of convective storms and their associated rainfall fields. Therefore, satellite-based remote sensing measurements have become an important source of rainfall data e.g., [5,6,7]. These satellite-based measurements enable monitoring of storm events at a quasi-global scale in near real-time. In comparison to other remote systems, such as ground-based weather radar, satellite sensor observations provide a wider coverage, being able to acquire data on storm systems in regions where topographic variations limit or obstruct weather radars [8].
Satellite-based precipitation estimates are derived by combining visible to long-wave infrared (VIS/IR) sensors from the Geosynchronous Earth Orbit (GEO) satellite with Passive Microwave (PMW) sensors from the Low Earth Orbit (LEO) satellites. VIS/IR sensors are relevant to measure albedo and cloud top temperature with a high temporal and spatial resolution [9,10]. On the other hand, PMW sensors can penetrate clouds for measuring thermal emissions, which are attenuated by raindrops with a 3-h interval [11,12]. Currently available and commonly used Satellite-based Precipitation Products (SPP) include the Precipitation Estimation from Remotely Sensed Information using Artificial Neural Networks (PERSIANN) [13], the NOAA Climate Prediction Center MORPHing technique (CMORPH [14]), the Multi-satellite Precipitation Analysis from the Tropical Rainfall Measurement Mission (TMPA) [15,16], and the Integrated Multi-satellitE Retrievals from the Global Precipitation Measurement (GPM-IMERG) [17]. Sun et al. [18] details a comprehensive review of the main global available satellite-based precipitation datasets.
Despite advances in the field of remote sensing, SPP information is subject to several systematic and random errors that require correction e.g., [19,20,21]. A wide range of bias correction methodologies has been developed to improve the performance of SPP, leveraging ground-based observations. Several examples include linear scaling, local intensity scaling, the power and distribution transformation methods, and Gamma Quantile mapping e.g., [8,22,23]. These methods all adjust SPP as function of rainfall intensity values, ignoring important systematic errors, such as those that are caused by displacement and timing.
In the field of weather forecasting, displacement error in storm prediction has been taken using spatial verification methods into account [24,25,26]. These “nontraditional” methods do not rely on point-to-point matches between the observed and estimated fields for avoiding double penalties (e.g., rainfall estimated but not observed and vice versa) that are commonly found in traditional approaches. Methods can be broadly grouped into neighbour or fuzzy [27,28], scale separation [29,30,31], object-based e.g., [24,25,26], and field transformation [32,33]. The first two categories can be described as spatial filtering methods, in which the verification statistics are evaluated at coarser resolutions to provide information about the scale of the performance. Object-based and field transformation are considered as displacement verification methods when estimated rainfall fields, defined as an object, are spatially manipulated (displacement, rotation, scaling, etc.) to try to fit the observed value.
Several studies have used spatial verification methods to analyse and correct systematic error of SPP based on the characteristics of matched storm objects, such as location, rotation, intensity, and shape [34,35,36]. For instance, Demaria et al. [37] used the object-based method, Contiguous Rainfall Analysis (CRA, Ebert and McBride [24]), to correct the location error of CMORPH, PERSIANN, and the TMPA datasets over the Plata basin. Recently, Le Coz et al. [38] used the field transformation method, called Feature Calibration and Alignment technique (FCA), to correct the error due to location in the GPM-IMERG late version over Sub-Saharan Africa. These methods have been useful for correcting the displacement errors when the grid resolution is high and the storm event is small, while preserving the higher spatial variability of SPP storm. However, these methodologies are constrained by the two-dimensional analysis of the storm event.
The spatiotemporal analysis can provide a much deeper analysis on aspects of the entire life-cycle of the storm event, including time span, speed, evolution, among others. In the literature, error analysis using spatiotemporal approaches has been useful to evaluate the performance of several spatial rainfall products. For example, Ref. [39,40] used the Object-Based Diagnostic Evaluation time-domain (MODE-TD) that was proposed by Bullock [41] to evaluate the convection-allowing forecast from the Weather Forecast Model over the United States. Recently, Laverde-Barajas et al. [42] used the Spatiotemporal Contiguous Rainfall Analysis (ST-CORA; Laverde-Barajas et al. [43]) in the Southeast region of Brazil for analysing the error composition of the CMORPH SPP and evaluated the individual hydrological response of two systematic error sources: location and magnitude. This study demonstrated the importance of spatial and temporal storm characteristics to analyse the main systematic error sources in SPP.
Spatiotemporal storm analysis incorporated into bias correction methods is key to reduce several sources of systematic error in SPP. In this study, we present a spatiotemporal object-based bias correction method to reduce several systematic errors in storm events estimated by satellite. The method, called Spatiotemporal Contiguous Object-based Rainfall Analysis for Bias Correction (ST-CORAbico), uses the main storm characteristics of satellite and observed events detected by the ST-CORA method to remove errors due to displacement in space and time and volume. This method is evaluated over the lower Mekong Basin in Thailand to correct several storm event types in the Integrated Multi-satellitE Retrievals for GPM (GPM-IMERG) early version during the monsoon season from 2014 to 2017. The performance of ST-CORAbico is compared against two widely used probabilistic methods—Distribution Transformation and Gamma Quantile Mapping. This manuscript is organised, as follows: Section 2 describes the study and the rainfall data-sets; Section 3 details the methodology of ST-CORAbico; Section 4 and Section 5 contain the results and associated discussion; and finally, Section 6 presents the conclusions and future work.
2. Study Area and Data
2.1. Study Area and Period
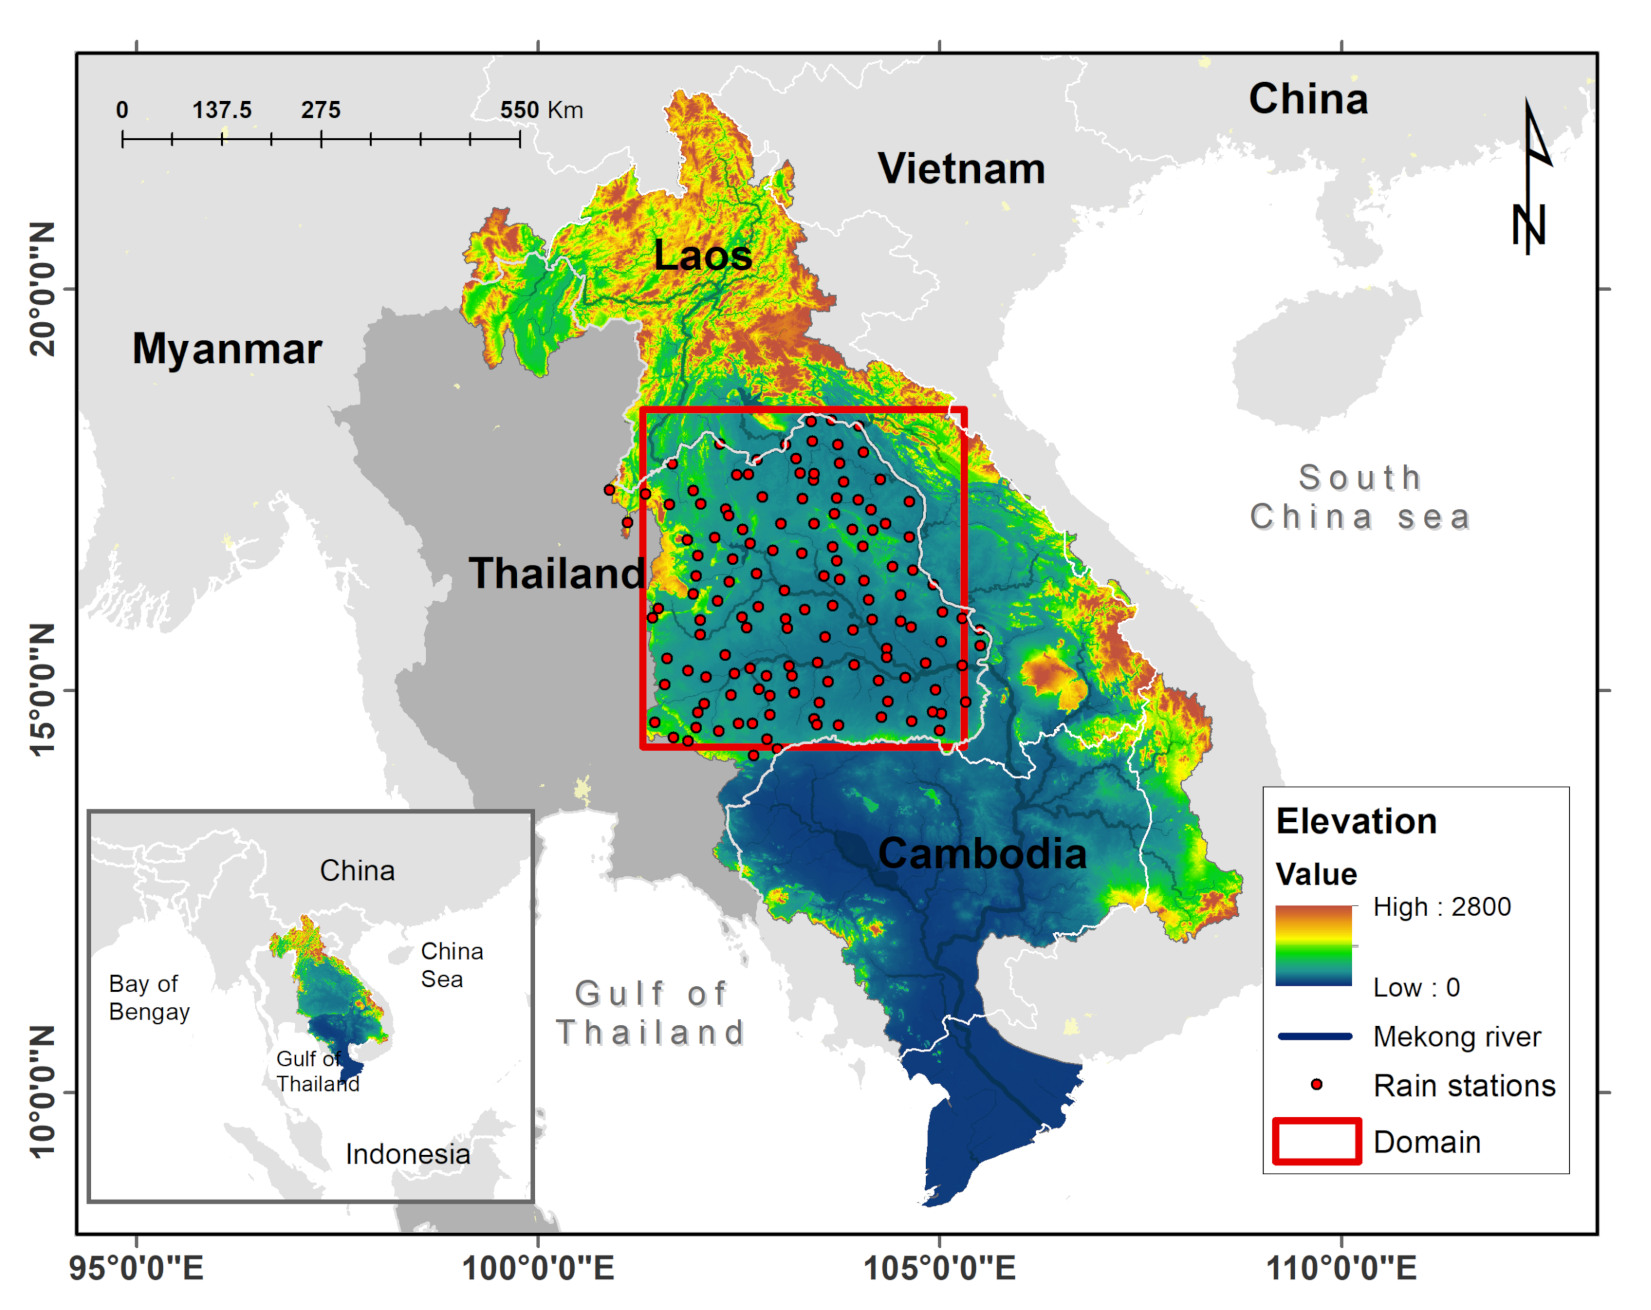
The study was conducted in Isan, in the northeastern region of Thailand (Figure 1). This region is part of the Mekong-river basin, with an average discharge of 475 km/year. The Mekong river basin covers a total drainage area of 795.000 km and it is characteristically divided into the upper and lower basins. The Lower Mekong river in Thailand is located in the Lower Mekong basin, covering 23% of the total drainage area (184.000 km) and representing 36% of the country (Figure 1).
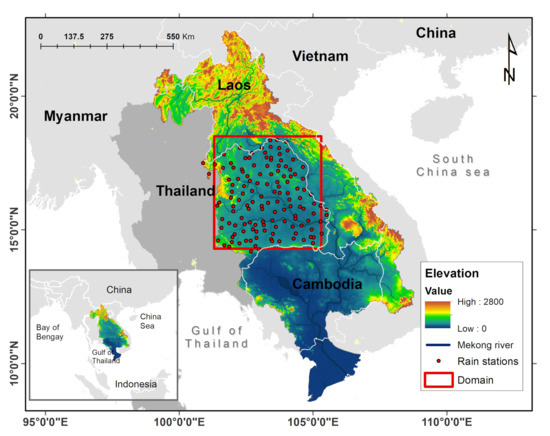
Figure 1.
Digital elevation of the Lower Mekong Basin in Thailand. Red rectangle corresponds to the study area in the Isan region. Red dots represent the hourly rain gauge stations from www.thaiwater.net. Blue line represents the Lower Mekong river network.
Heavy rainfall often occurs in the Lower Mekong river basin during the Asian monsoon period between June to October. In this period, the covariability of the Indian summer monsoon and East Asian summer monsoon impacts the Lower Mekong basin, causing high convective storm events that are the main trigger for flash floods and landslides [44,45]. We focused on the wet months for the years 2014 to 2017, as these disasters are mostly occurring during the wet season.
2.2. Satellite-based Precipitation Data
ST-CORAbico was used to correct storm events detected by the Integrated Multi-satellitE Retrievals for GPM (GPM-IMERG). GPM-IMERG is a high-resolution global precipitation product produced by [17] from the NASA/JAXA Global Precipitation Measurement (GPM) mission. The product combines information from multiple infrared, passive-microwave, and satellite-radar sensors to provide rainfall estimations at 0.1-degree spatial resolution every half-hour. GPM-IMERG computes Early, Late, and Final runs. The first two runs are near real-time versions of IMERG and are available at six hours and 18 hours latency, respectively. In the Early version, rainfall estimations are propagated forward while the Late has both forward and backward propagation allowing the incorporation of climatological gauge data. The final version is obtained three months after the measurements. In this run GPM-IMERG ingests the monthly rainfall analysis from the Global Precipitation Climatology Centre (GPCC; Schneider et al. [46]). This version is used for scientific purposes, as it is considered to be the most reliable version [17]. In this study, we evaluated the early run of GPM-IMERG at a half-hourly temporal resolution. This version was selected, given it is the lowest latency data product available, a crucial aspect for operational applications.
2.3. In-Situ Ground-Based Rainfall Observations
Hourly rainfall data during the monsoon season from 2014 to 2017 were obtained from a dense network of 138 rain gauge stations from the Thailand Integrated Water Resource Management System, operated by the Hydro-Informatics Institute (HII) in Thailand (Figure 1). Data were quality controlled by mirroring the density distribution functions of neighbouring stations to remove outlier values considered as noise. These observations were then further interpolated using the Ordinary Kriging interpolator from Golden Software [47] at 0.1 degrees for each hour to match the spatial and temporal resolution of the GPM-IMERG data. This method was selected due to the moderated topographic conditions of the study area and density of the rain gauge measurements. Raingauge data were interpolated using an exponential variogram with a sill of 1.14 (mm/h), a range of 4.4 km and a nugget of 0.66 (mm/h). It must be noted that interpolation methods for rainfall data are subject to uncertainty e.g., [48,49]; however, in our case, a dense and optimal rain gauge distribution can reduce the level of uncertainty from the interpolation method [50].
3. Methodology
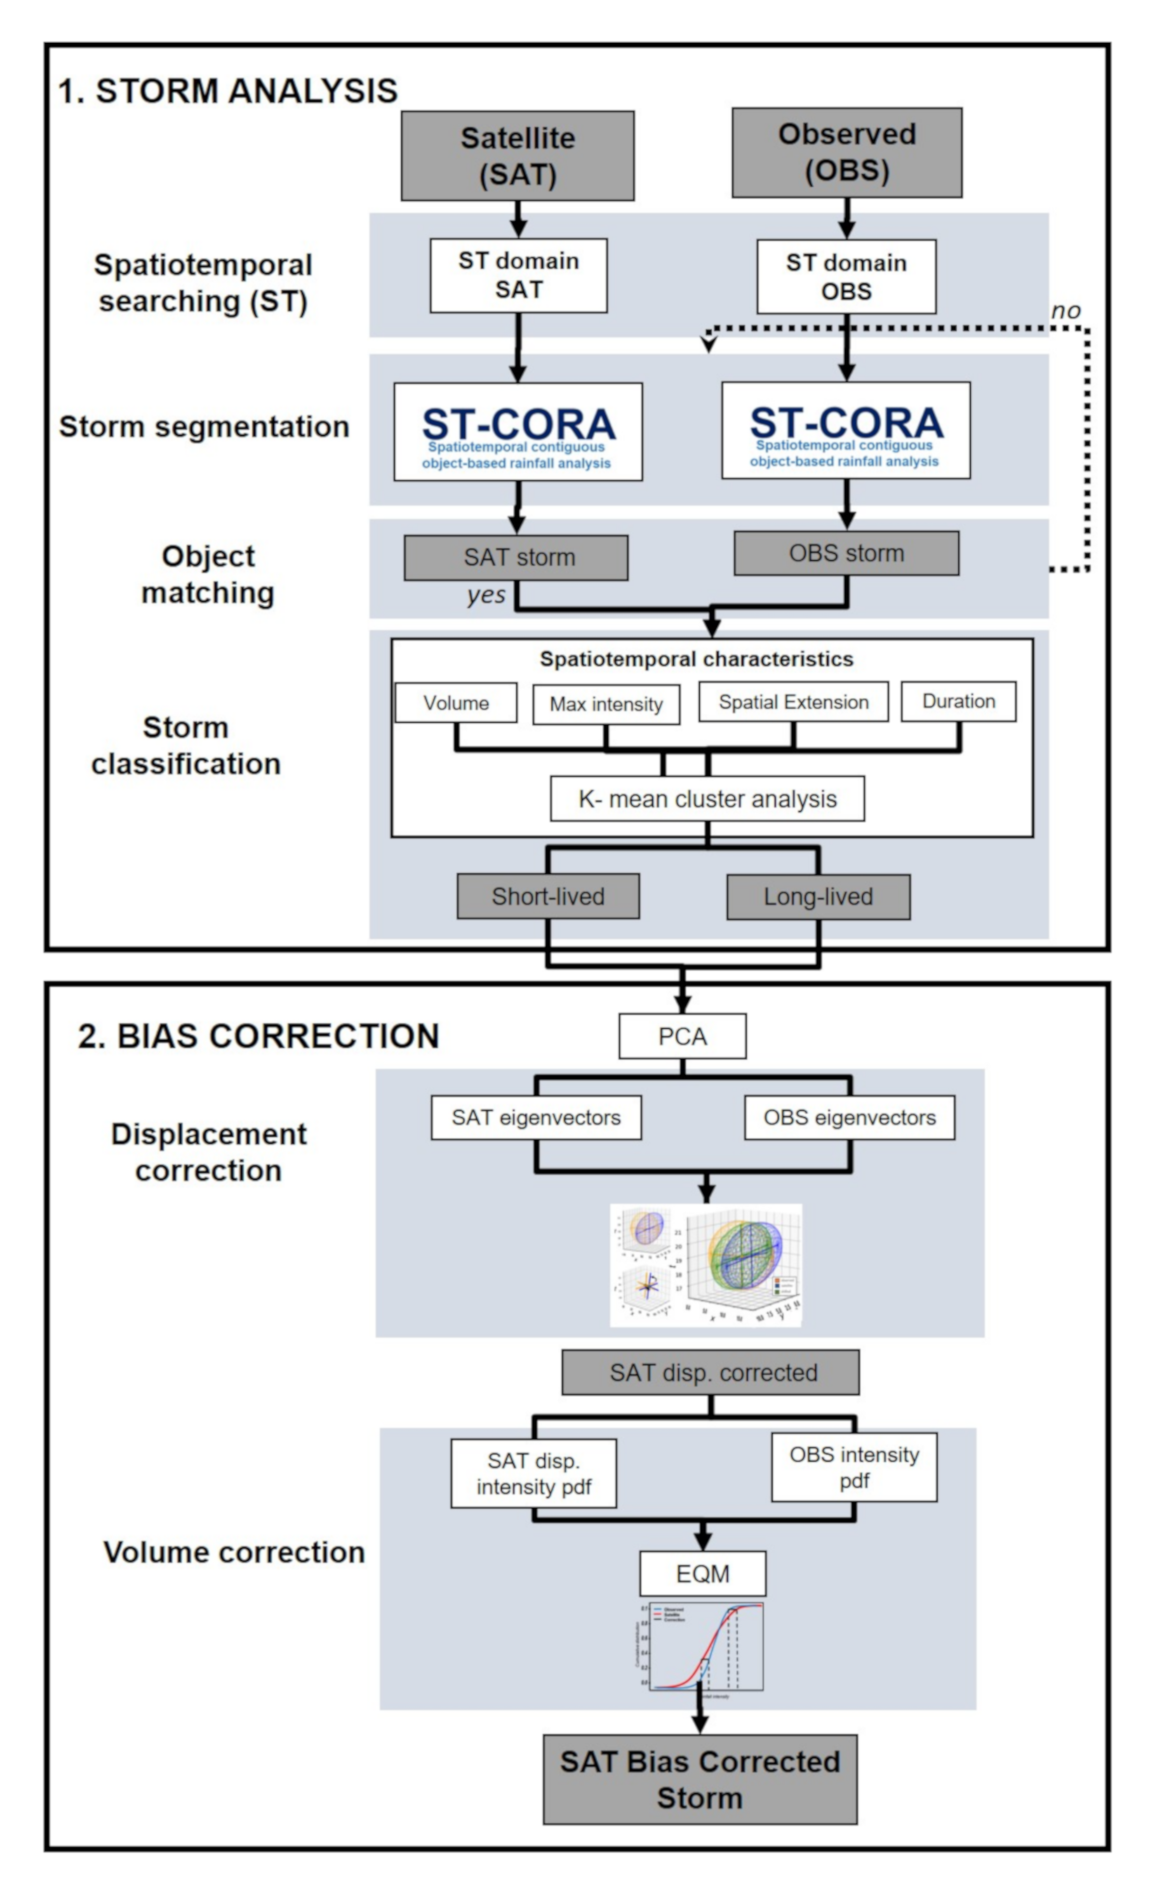
ST-CORAbico was developed in order to analyse the spatiotemporal characteristics of storm events and bias correct the main sources of systematic error in satellites. Figure 2 shows the methodology of ST-CORAbico. In this section, we describe the elements for storm analysis and bias correction in ST-CORAbico.
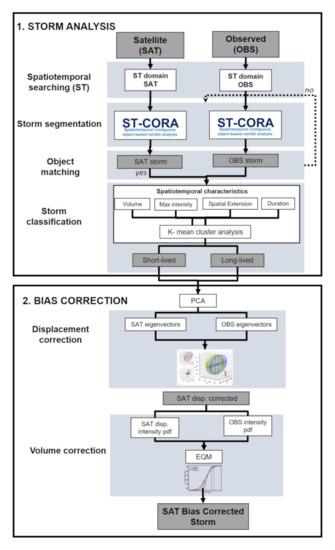
Figure 2.
Diagram of the Spatiotemporal Contiguous Object-based Rainfall Analysis for bias correction (ST-CORAbico) method. Grey boxes represent the input and output products while white boxes describe the methodological process for storm analysis and bias correction components.
3.1. Storm Analysis
In the storm analysis, ST-CORAbico uses ST-CORA to analyse the spatiotemporal characteristics of the storm events observed and detected by satellites. This process requires the definition of the spatial and temporal domain in order to reduce the computational time of ST-CORA. We applied a spatiotemporal searching algorithm to predetermine the region of analysis in ST-CORA. This algorithm uses the spatial searching algorithm concept that was proposed by Guttman [51] to index areas with rainfall information in both datasets. The indexing is made in a two-dimensional space compressing the latitude and longitude dimensions using a maximum intensity value as a reference. Once the spatiotemporal domain is defined, we use ST-CORA in the observed and SPP dataset to identify storms in the rainfall data. In this study, ST-CORA incorporates a multivariate kernel density function for storm segmentation.
3.1.1. Storm Segmentation Using the Spatiotemporal Object-Based Rainfall Analysis with Multivariate Kernel Density Segmentation
ST-CORA was applied to analyse the spatiotemporal characteristics of storm events at the catchment scale (duration, spatial extent, magnitude, and centroid). This method enables the feature extraction of different storm event types, classified based on hydrometeorological criteria. ST-CORA uses a multidimensional connected labelling component algorithm to associate connected voxels in space and time (a volume generalisation of pixels) into a disjoint object labelled with a unique classifier. This operation is built upon binary information that was created by voxels, considered to be ‘effective rainfall’. Effective rainfall voxels are defined according to rainfall voxels above the rainfall intensity threshold , as:
where, is defined by the user and is defined in terms of 1 = “true” or 0 =”false”. In this study, we used = 1mm/h to define effective rainfall [52]. Once binary voxels are created, the connected labelling component algorithm scans all voxels in a neighbour system (from top to bottom and left to right), assigning preliminary labels to , as follows:
where, is a preliminary label, , are properties of the voxel and its neighbours , respectively, while is the neighbour system in space and time. The labelling process is repeated to resolve equivalence classes of the spatiotemporal object.
Bethel et al. [53] found that object segmentation, while using image thresholding, such as the connected component labelling method, has limitations for edge detection in data with unknown topology. In the original ST-CORA, a size-filtering algorithm and morphological closing method are incorporated in order to remove both small noisy objects and a false merging effect, respectively. However, this process is based on a binary object not taking into account the intensity value of voxels. To overcome this limitation, we have incorporated a Multivariate Kernel Density Estimation (KDE) approach to segment rainfall objects when considering their four dimensions. This method assumes a non-parametric probability density distribution technique for d-dimensional data. Notably, KDE has been widely used in many fields for image detection and object tracking, e.g., [54,55,56,57,58]. Multivariate kernel density is estimated at point x from a random sample from a density function, f,
where K corresponds to the kernel function and h is the bandwidth matrix. Choosing the bandwidth matrix can be restricted to a class of positive diagonal matrices [59]. In the literature, there are several bandwidth selection methods for kernel density estimation [59,60]. For this approach, we use the normal reference rule-of-thumb proposed by Henderson and Parmeter [61]. This method estimates the bandwidth while assuming that the density distribution function follows a Gaussian distribution.
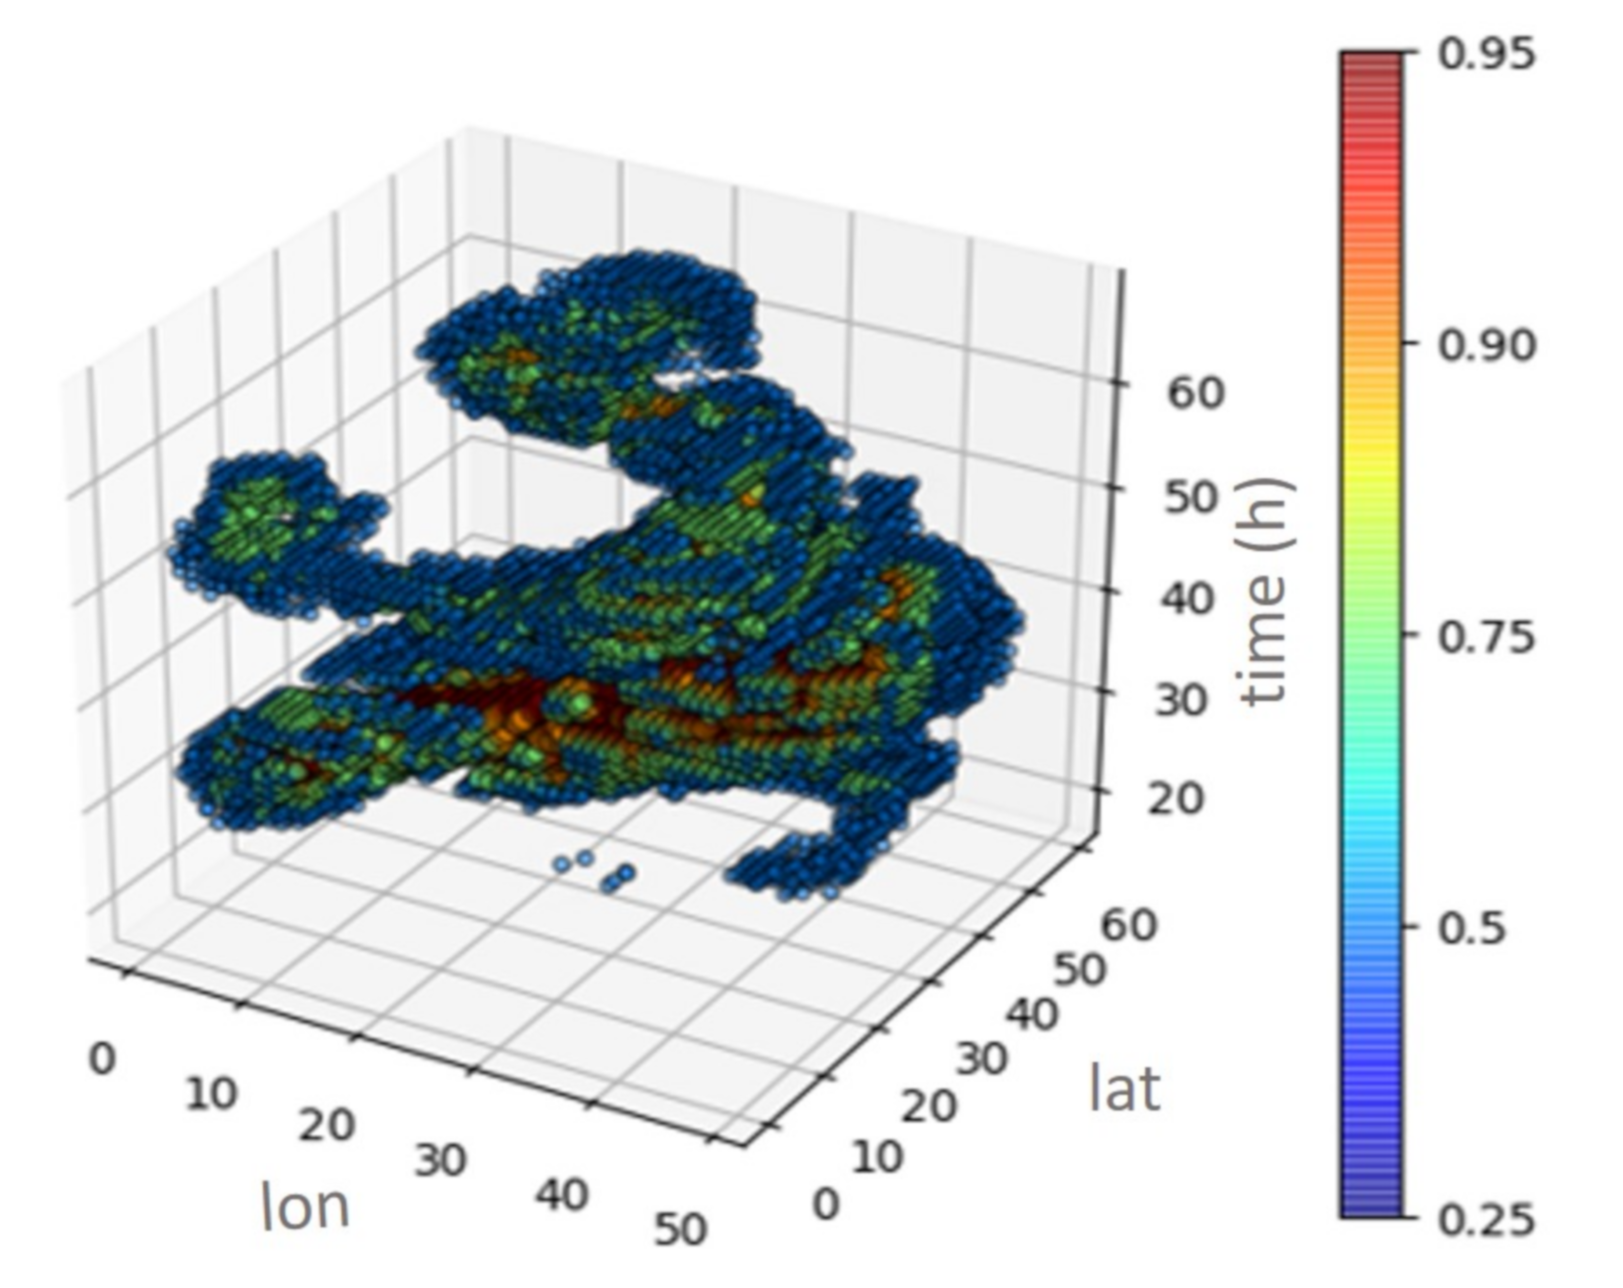
The process of edge detection using KDE is based on the Edge Detection by Density method that was developed by Pereira et al. [55]. This process evaluates the multivariate density distribution of the density of a four-dimensional (4D) rainfall object (Figure 3), and segments the object based on the density threshold, u. This threshold identifies the storm edges that are lower than a probability percentage. This parameter is calculated by analysing the relationship between threshold delineation and the connected intensity value. We found that the 25th distribution percentile for u threshold showed good results for storm segmentation over the Lower Mekong Basin, especially for intense storm events, which are characteristic of monsoon environments.
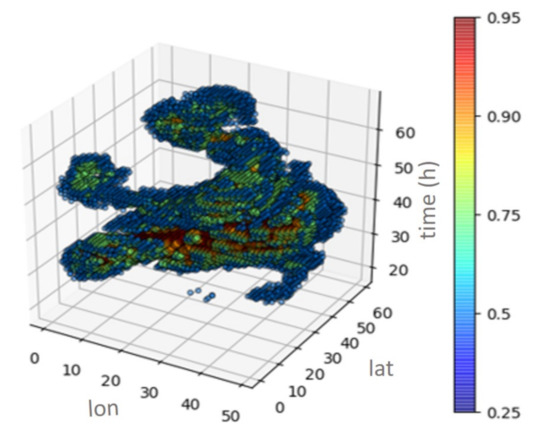
Figure 3.
Multivariable kernel density of a storm object in space and time. Example for the storm event 2014-07.
Rainfall Objects are considered to be storm based on the Critical Mass Threshold , which is defined as the minimum volume of rainfall (km) necessary to be considered as an extreme event [62]. The value of is calculated locally based on the sensitivity between the spatial extent and the total object volume [37,63]. In this analysis, we also incorporated the sensitivity of to the maximum intensity of the storm in order to evaluate the response of intense storm events in the study area. Based on the sensitivity analysis of those parameters, we selected a of 0.01 km for storm events with a maximum intensity greater than 10 mm/h. In the study area, these events correspond to rainfall objects bigger than 2000 km.
3.1.2. Matching Process
As a result of ST-CORA, multiple storm events are identified in both observed and satellite data sets. However, it is necessary to determine the observed and estimated storm matches. We used the Intersection-over-Union measure (IoU) in order to evaluate the level of similarity between predicted and observed data. IoU is defined as the ratio between the size of the intersection and the union of both objects. This is represented by the following equation:
where, represents true positives and and are false positives and negatives, respectively. The selection of the intersection rate value determines the level of matching between objects. If the values are too low, multiple objects will be indexed with the same object. On the other hand, high values indicate that the object does not have any match. We found the value to be 30 percent in the selected study area, which is a good balance for matching the observed and satellite storm events.
3.1.3. Storm Classification
Once all of the storm events are identified, ST-CORA classifies storm events into two types: small convective systems with a short duration (short-lived) and long duration systems extended over large areas (long-lived) [64,65]. We used an unsupervised K-means cluster analysis method to classify short- and long-lived storm events based on the four main storm characteristics (duration, spatial extent, maximum intensity, and total volume). This method divides n observations into k clusters in which each observation is a member of the cluster that minimises the objective function J, as follows:
where, X is the storm with dimensions corresponding to the storm characteristics duration, spatial extent, maximum intensity and total volume, respectively. C is the centroid of the cluster k and the absolute number represents the minimum Euclidean distance to C.
3.2. Bias Correction
Bias correction is the second component of the ST-CORAbico method. This component is based on the systematic error source extraction for SPP that was proposed by Laverde-Barajas et al. [42]. Based on the error decomposition for storm estimation defined by Ebert and McBride [24], satellite error is composed of systematic and aleatory errors due to displacement, volume, and pattern, as:
where displacement and volume represent the systematic errors and pattern is the aleatory error calculated as follows:
In Equations (7) and (8), location is the main source of error due to displacement, while the magnitude is the corresponding source of error for volume. Using the error subtraction from Laverde-Barajas et al. [42], ST-CORAbico corrects displacement and volume error using the following process:
Displacement Correction
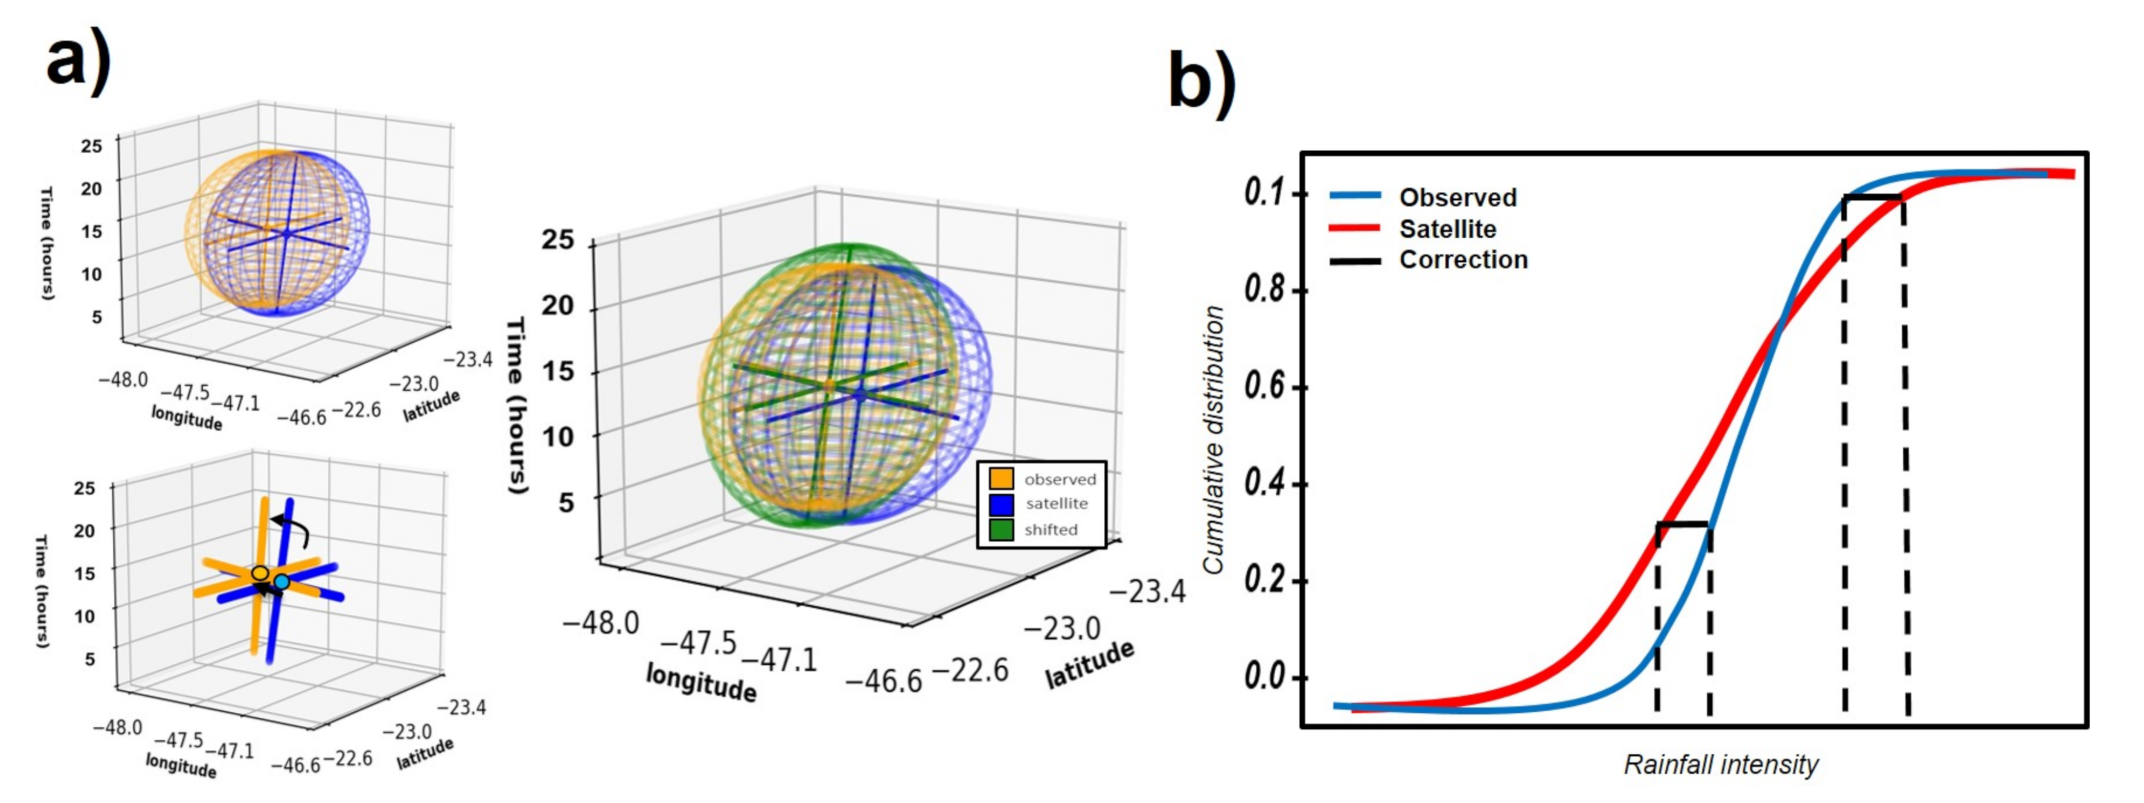
Displacement correction corresponds to removing the shifting effect of the estimated storm. In this step, the Principal Component Analysis method (PCA, Johnson and Hebert [66]) is used in order to obtain the weighted centroid and orthogonal variables (eigenvectors, eigenspace) of the SPP storm and reference data (Figure 4a). Once the geometric properties of the objects are obtained, the weighted centroid is matched and the object is rotated accordingly to fit the eigenvectors of the reference storm data.
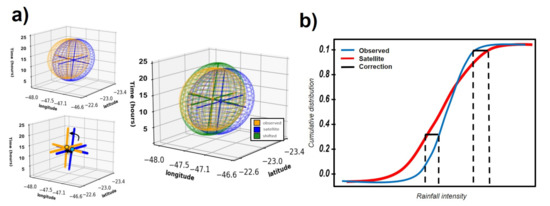
Figure 4.
ST-CORAbico systematic error subtraction. (a) In error correction, storm centroid and eigenvectors derived from principal component of GPM-IMERG are fitted to the observed event; and, (b) magnitude subtraction using both satellite and observed empirical distribution functions, with respect to intensity.
Volume Correction
Volume correction corresponds to the subtraction of the magnitude source of error of the SPP. Using the statistical Empirical Quantile Method (EQM) [67], magnitude error is subtracted by adjusting all moments of the empirical cumulative distribution functions of the SPP in terms of intensity, with respect to the reference data (Figure 4b). EQM builds the for the observed and the satellite while using the intensity storm distribution , as:
3.3. Evaluation of ST-CORAbico
The evaluation was done by comparing the bias-corrected results with two widely used probabilistic bias correction methods— the Distribution Transformation (DT) method and the Gamma Quantile Mapping (GQM). The DT method was originally developed for the statistical downscaling of climate model data [68]. The method corrects the mean and difference in variation of the SPP by matching the satellite and the observed distribution based on Equation (11):
where, and are the mean and standard deviation of the observed and satellite, respectively. and are the mean and standard deviation ratio between the observed and satellite data at time t.
The Gamma Quantile Mapping method uses the same methodology as the Empirical Quantile mapping method (10), based on the assumption that both observed and satellite intensity follows a gamma distribution [69]. DT and GQM are implemented for each time-step in order to correct the storm event. The bias correction performance is evaluated based on three widely used error metrics: the Root Mean Square Error (Equation (12)) for evaluating the magnitude error, the bias level (Equation (13)) to evaluate the systematic bias, and the correlation coefficient (Equation (14)) in order to analyse the linear correlation between the observed and the bias-corrected storm event.
where, represents the rainfall values of the reference rain gauge data and are the satellite and the bias-corrected storm obtained with each method.
4. Results
4.1. Storm Analysis
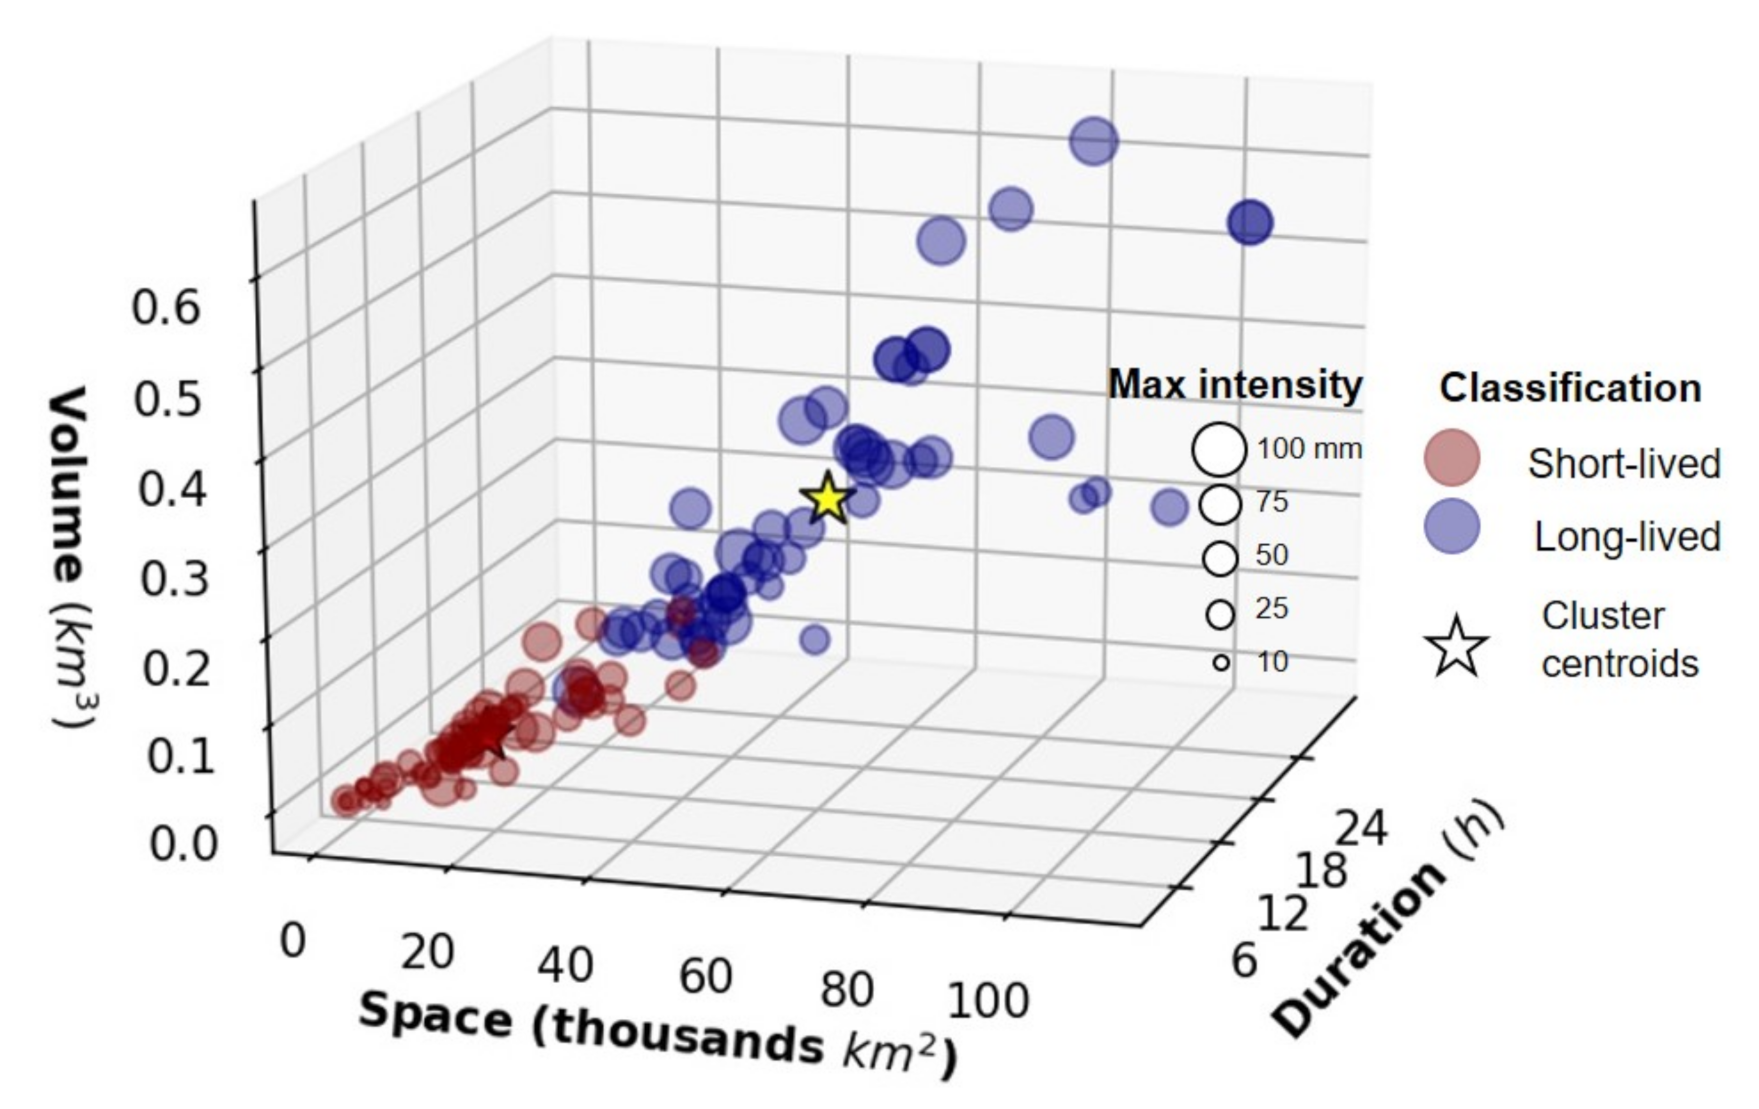
We identified 120 storm events observed and estimated by GPM-IMERG at an hourly scale for the 2014–2017 monsoon seasons. Figure 5 shows the scatter plot of the main storm characteristics (total volume, duration, spatial extent, and maximum intensity) and classification between short- and long-lived storm events using the k-means cluster analysis. For all events, 68 storms (56%) were classified as short-lived storms while 52 (44%) of storms were classified as long-lived events. Short-lived events had a duration that ranged between three and 17 h, with a maximum spatial extent of 42 thousand km. Long-lived events had a duration ranging between 18 and 31 h and covered between 54 and 110 thousand km. In terms of total volume and maximum intensity, short-lived events have a total volume of up to 0.15 km with low and intense storms ranging from 3 to 82 mm/h. On the other hand, long-lived storms are comprised of medium and high-intensity events with a total volume ranging from 0.27 to 0.65 km. Table 1 describes the observed storm characteristics for short and long-lived event types.
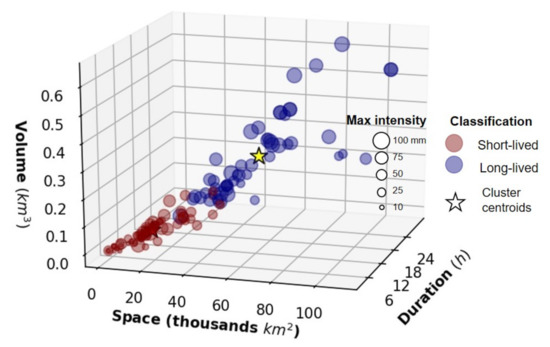
Figure 5.
Short- and long-lived cluster analysis classification for observed events during monsoon season 2014–2017.

Table 1.
Storm characteristics for short- and long-lived event types.
4.2. Results for Bias Correction
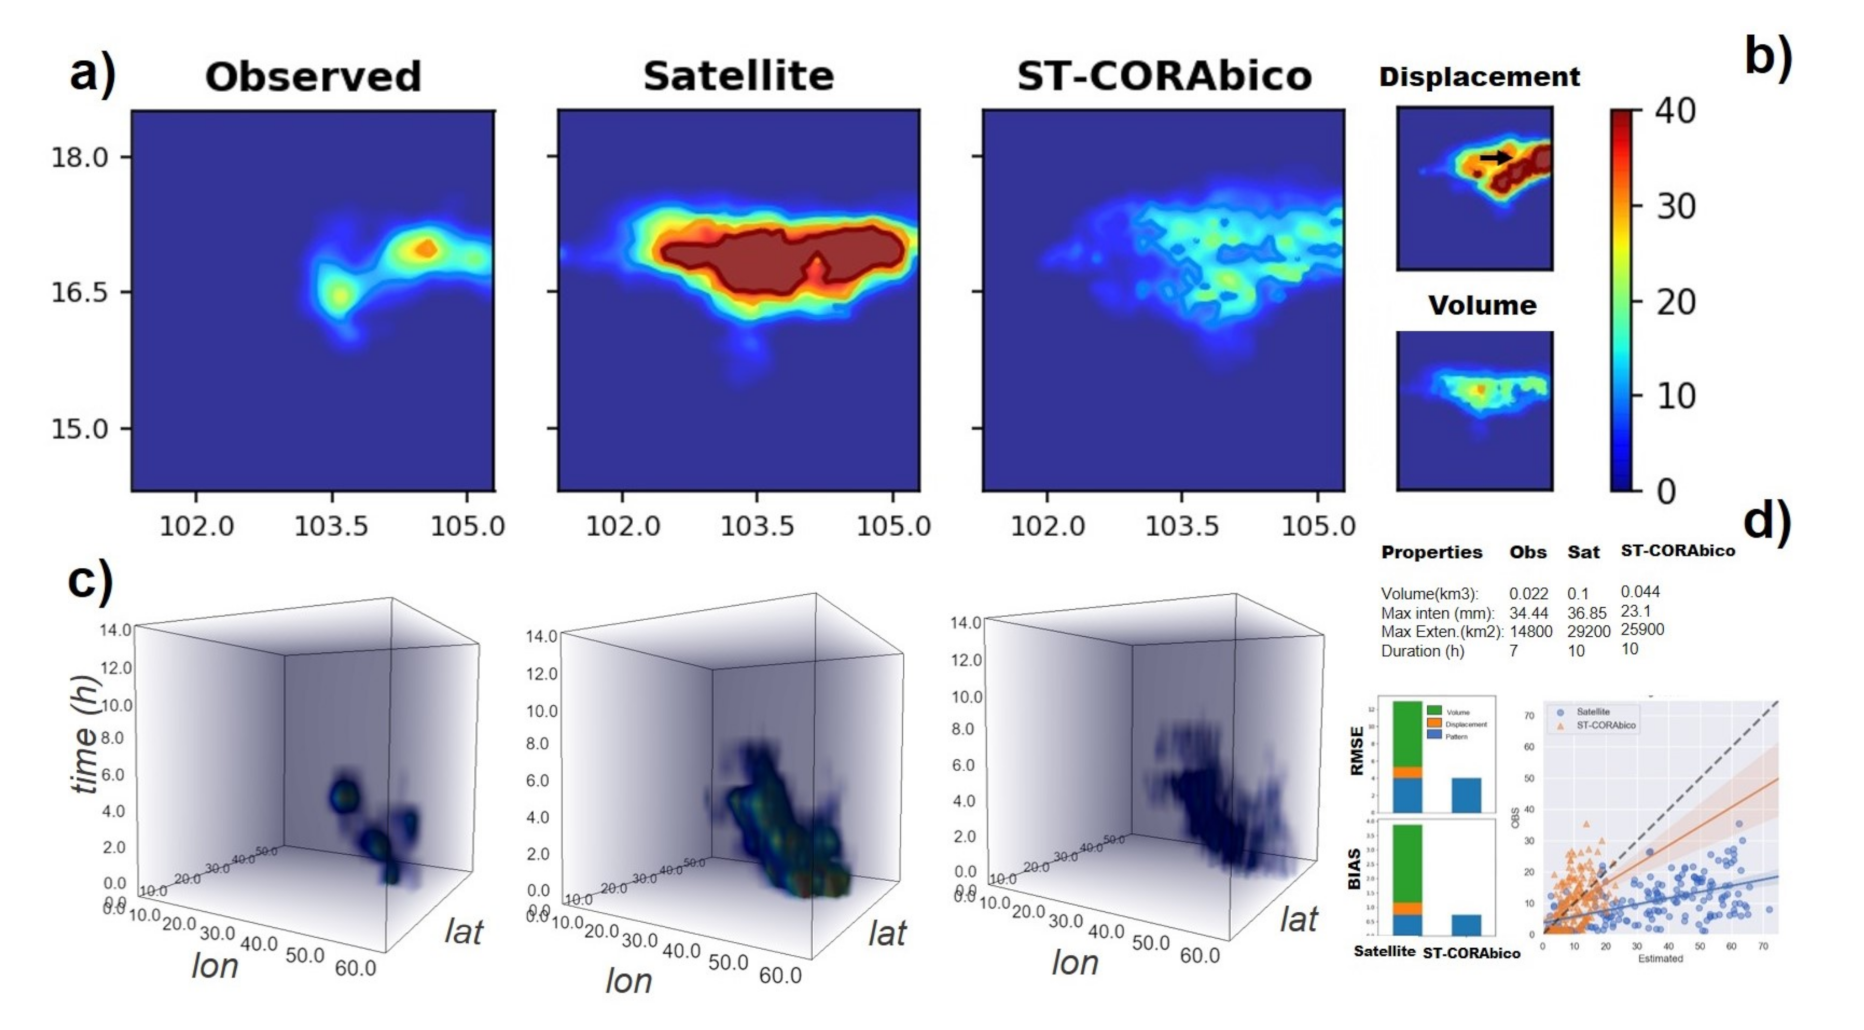
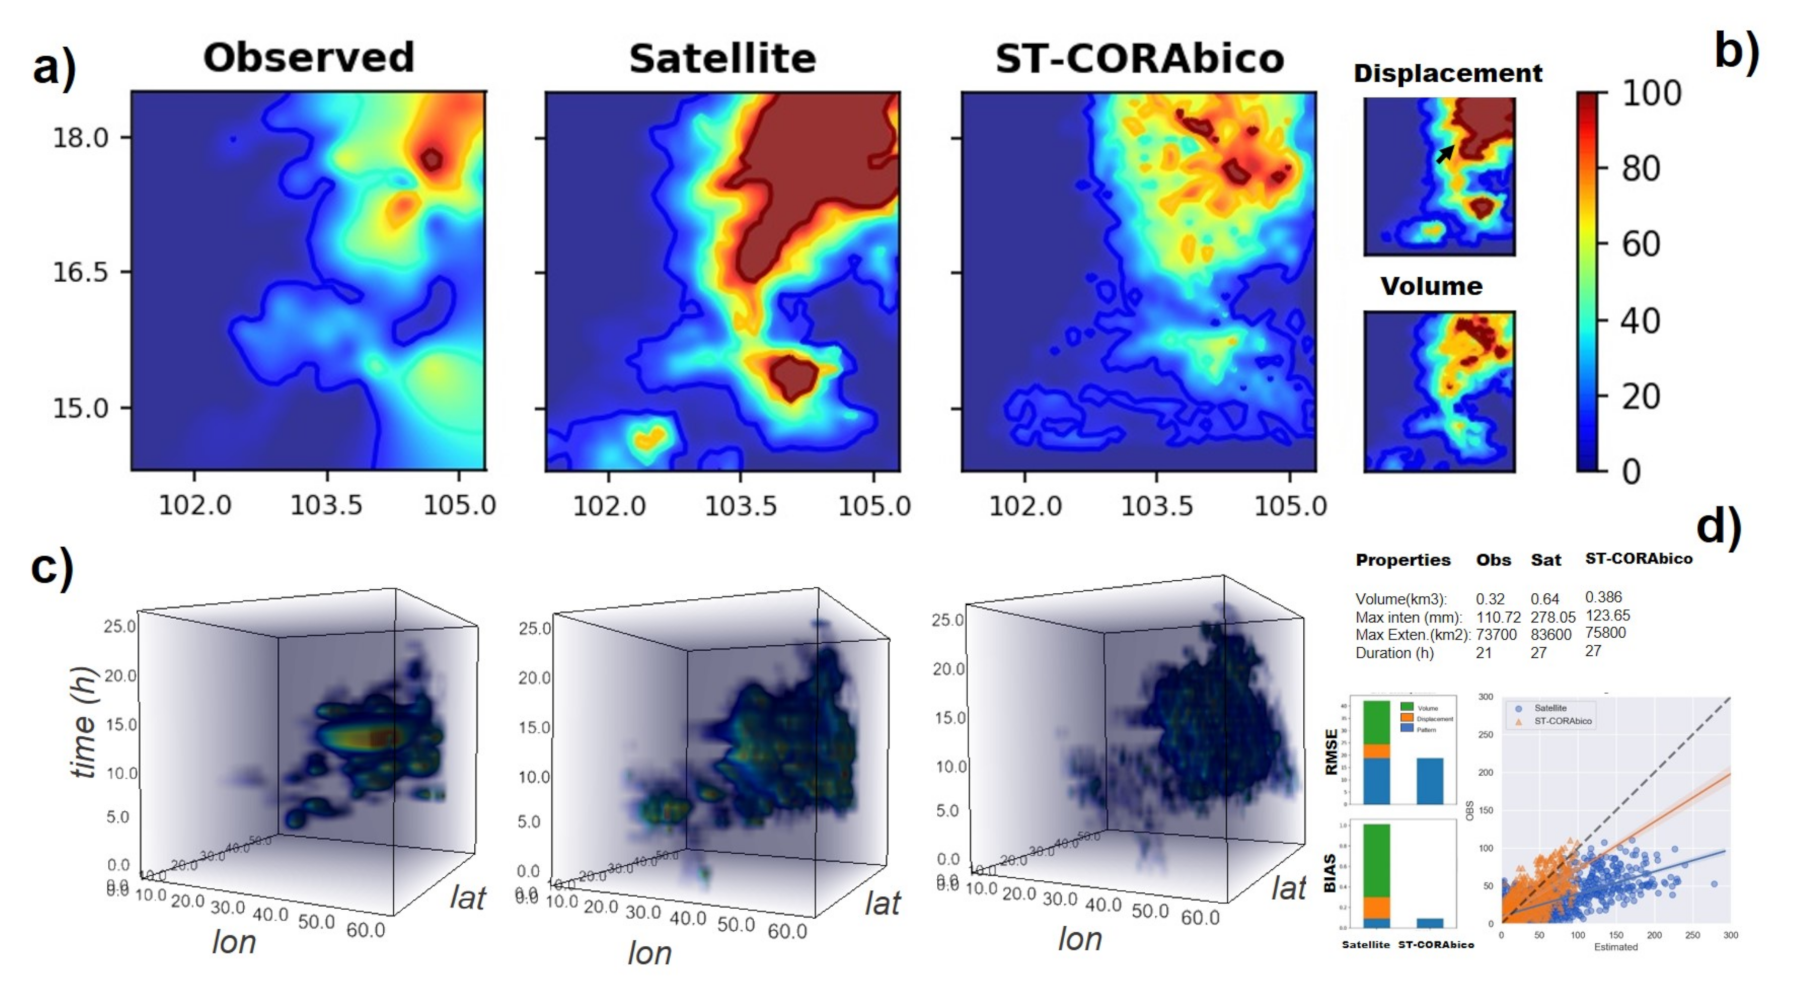
We selected a short-lived and a long-lived storm in order to describe the workflow for displacement and volume correction made by ST-CORAbico. Figure 6 and Figure 7 present the bias correction steps for each storm event type. Panel (a) shows the spatial distribution of the observed and satellite events as well as the bias-corrected satellite storm events that were obtained from the correction of location and magnitude errors in ST-CORAbico. Panel (b) describes the displacement and volume corrections. Panel (c) presents the four-dimensional (4D) spatiotemporal evolution of the observed and satellite as well as the bias-corrected storm (time in the z-axis). Panel (d) shows the bias and RMSE statistics as well the scatter and correlation between the observed storm and original and bias-corrected satellite events.
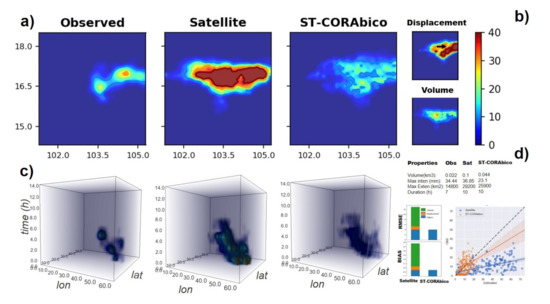
Figure 6.
Performance of ST-CORAbico for a short-lived storm event (2014-08-27). (a) total events for observed, satellite and ST-CORAbico; (b) volume, displacement correction maps; (c) four-dimensional (4D) spatiotemporal evolution (lat, lon, time, intensity); and, (d) bias, RMSE statistics, and scatter and correlation between observed and estimated rainfall values.
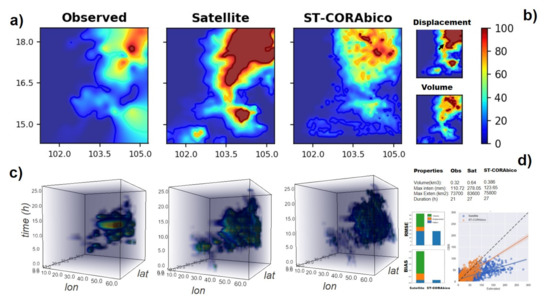
Figure 7.
Performance of ST-CORAbico for a long-lived storm event (2014-07-21). (a) total events for observed, satellite and ST-CORAbico; (b) volume, displacement correction maps; (c) 4D spatiotemporal evolution (lat, long, time, intensity); and, (d) bias, RMSE statistics and scatter and correlation between observed and estimated rainfall values.
Both examples (Figure 6 and Figure 7) show the importance of bias correction. In both the short and long-lived event scenarios, GPM-IMERG had a longer duration with a larger footprint. However, the long-lived event presented a better spatial agreement than the short-lived event. In terms of magnitude, GPM-IMERG considerably overestimated the total volume and rainfall intensity of the storm. Overall, the performance of GPM-IMERG shows a positive bias and high RMSE, mostly being caused by an excess of rainfall. The correlation coefficients for short- and long-lived event scenarios were 0.7 and 0.5, respectively.
The corrections in displacement and volume made by ST-CORAbico displayed notable changes in the satellite storm structure. In both scenarios, RMSE and bias were mostly reduced by correction due to volume, contributing 40 to 60% of the RMSE reduction and around 70% of the total bias reduction for both events. Displacement correction had an important impact on the reorientation of the satellite storm. The individual correction contributed to 5% of the RMSE correction and 10% reduction of the total bias for the short-lived event. In the case of the long-lived scenario, displacement correction contributed almost 15% of the RMSE reduction and 20% of the total bias reduction. In terms of the correlation coefficient, displacement and volume correction that were made by ST-CORAbico showed a marginal impact on the spatial correlation for the short-lived events. For the long-lived scenario, this did not impact the spatial correlation.
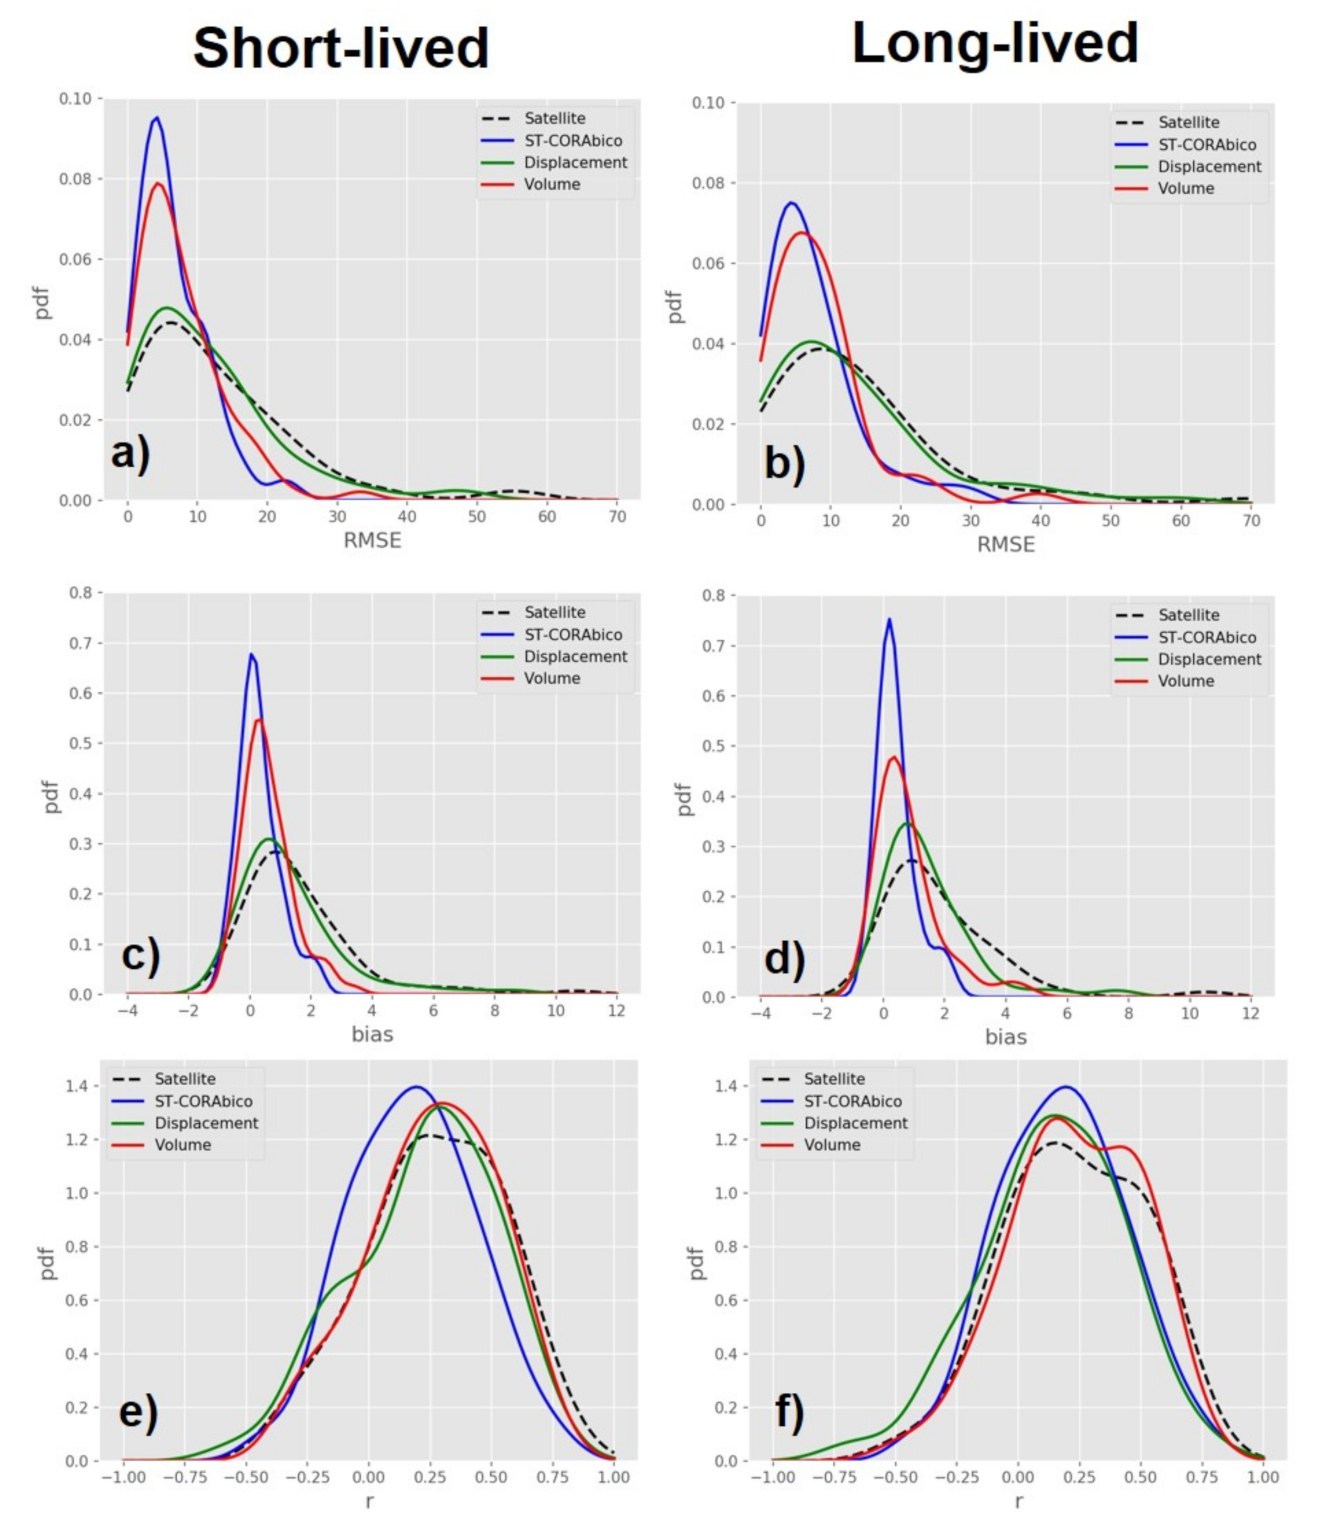
Figure 8 presents the performance of ST-CORAbico for short- and long-lived storm events. This figure describes the density distribution of RMSE (a–b), bias (c–d), and correlation coefficient (e–f) of the short- and long-lived storms estimated by GPM-IMERG, ST-CORAbico, and the individual corrections due to displacement and volume. It was found that ST-CORAbico has a smaller error distribution in RMSE and bias for short- and long-lived storm events when compared with the original GPM-IMERG. This error reduction is mostly caused by the correction due to volume. Displacement correction was an important factor in reducing the bias, especially for long-lived storm events. The results from the correlation coefficient showed that ST-CORAbico had a marginal effect on the spatial correlation of the storm event. Overall, it was found that ST-CORAbico considerably reduced the systematic error of GPM-IMERG.
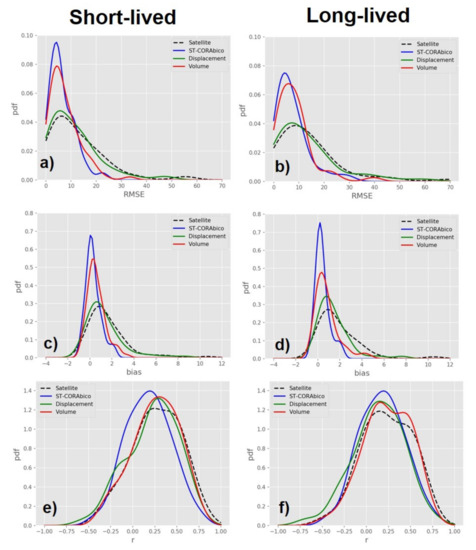
Figure 8.
Satellite and bias corrected error distribution for short and long-lived events during monsoon seasons 2014–2017: (a,b) RMSE; (c,d) bias; and, (e,f) correlation coefficient.
4.3. Model Comparison
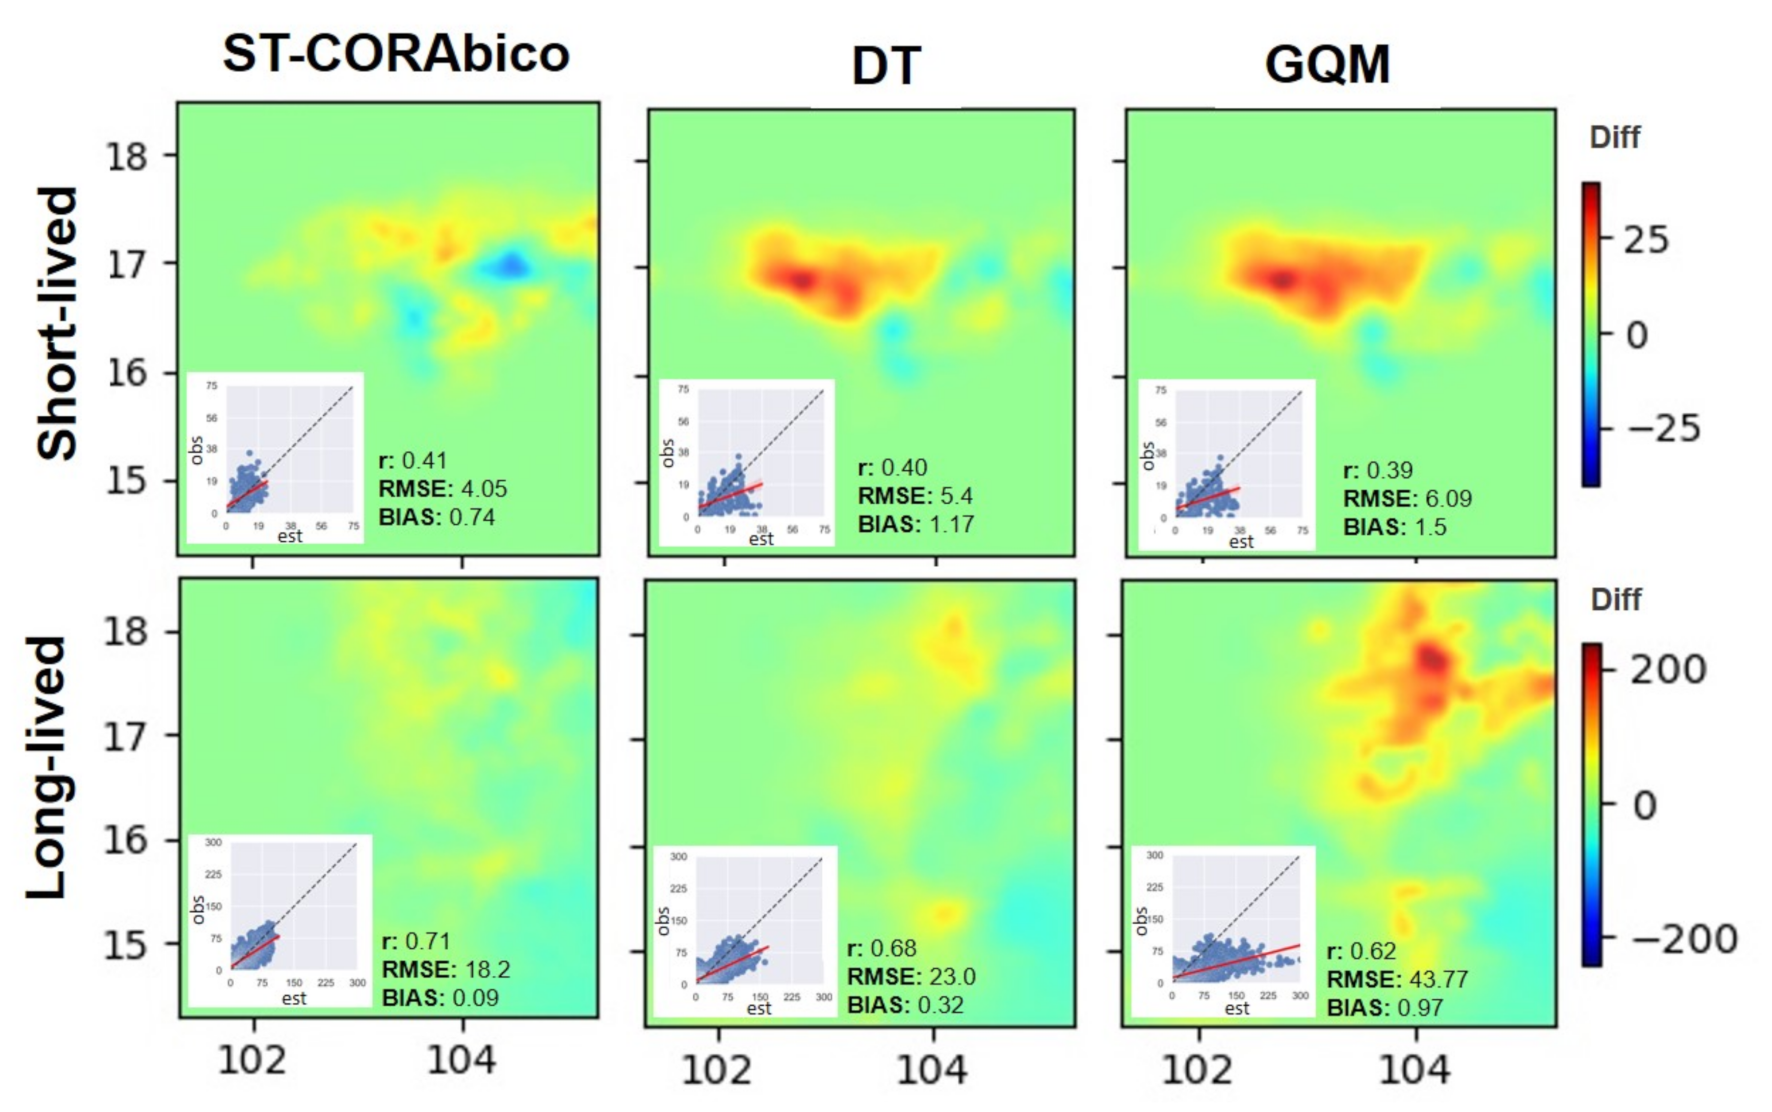
ST-CORAbico was compared with the Distribution Transformation method (DT) and the Gamma Quantile Mapping (GQM) method. Using the short- and long-lived storm scenarios that are presented above, Figure 9 presents the spatial differences and linear correlation between the total observed storms and the bias-corrected events obtained by ST-CORAbico, DT, and GQM. The results for both storm event scenarios showed that ST-CORAbico had the lowest spatial difference among the evaluated methods. For the short-lived storm scenario, ST-CORAbico displayed the highest correlation coefficient (r: 0.41) and the lowest RMSE and bias (RMSE: 4.05 mm; bias: 0.74) when compared with DT (r: 0.40; RMSE: 5.4 mm; bias: 1.17); and, GQM (r: 0.39 RMSE: 6.09mm and bias: 1.5). In the case of the long-lived storm, ST-CORAbico and DT showed a notable error reduction in contrast to the GQM method that showed the biggest differences. For this storm scenario, ST-CORAbico had the best performance (r: 0.71 RMSE: 18.02 mm; bias: 0.09), followed by DT (r: 0.68, RMSE: 23.0 mm; bias: 0.32), and finally GQM (r: 0.62, RMSE: 43.77 mm; bias: 0.97).
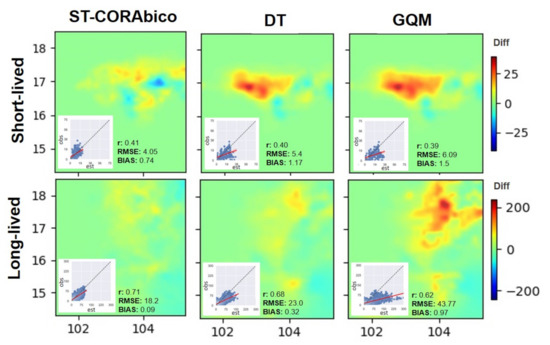
Figure 9.
Comparison between ST-CORAbico vs Distribution Transformation (DT) and Gamma Quantile Mapping (GQM).
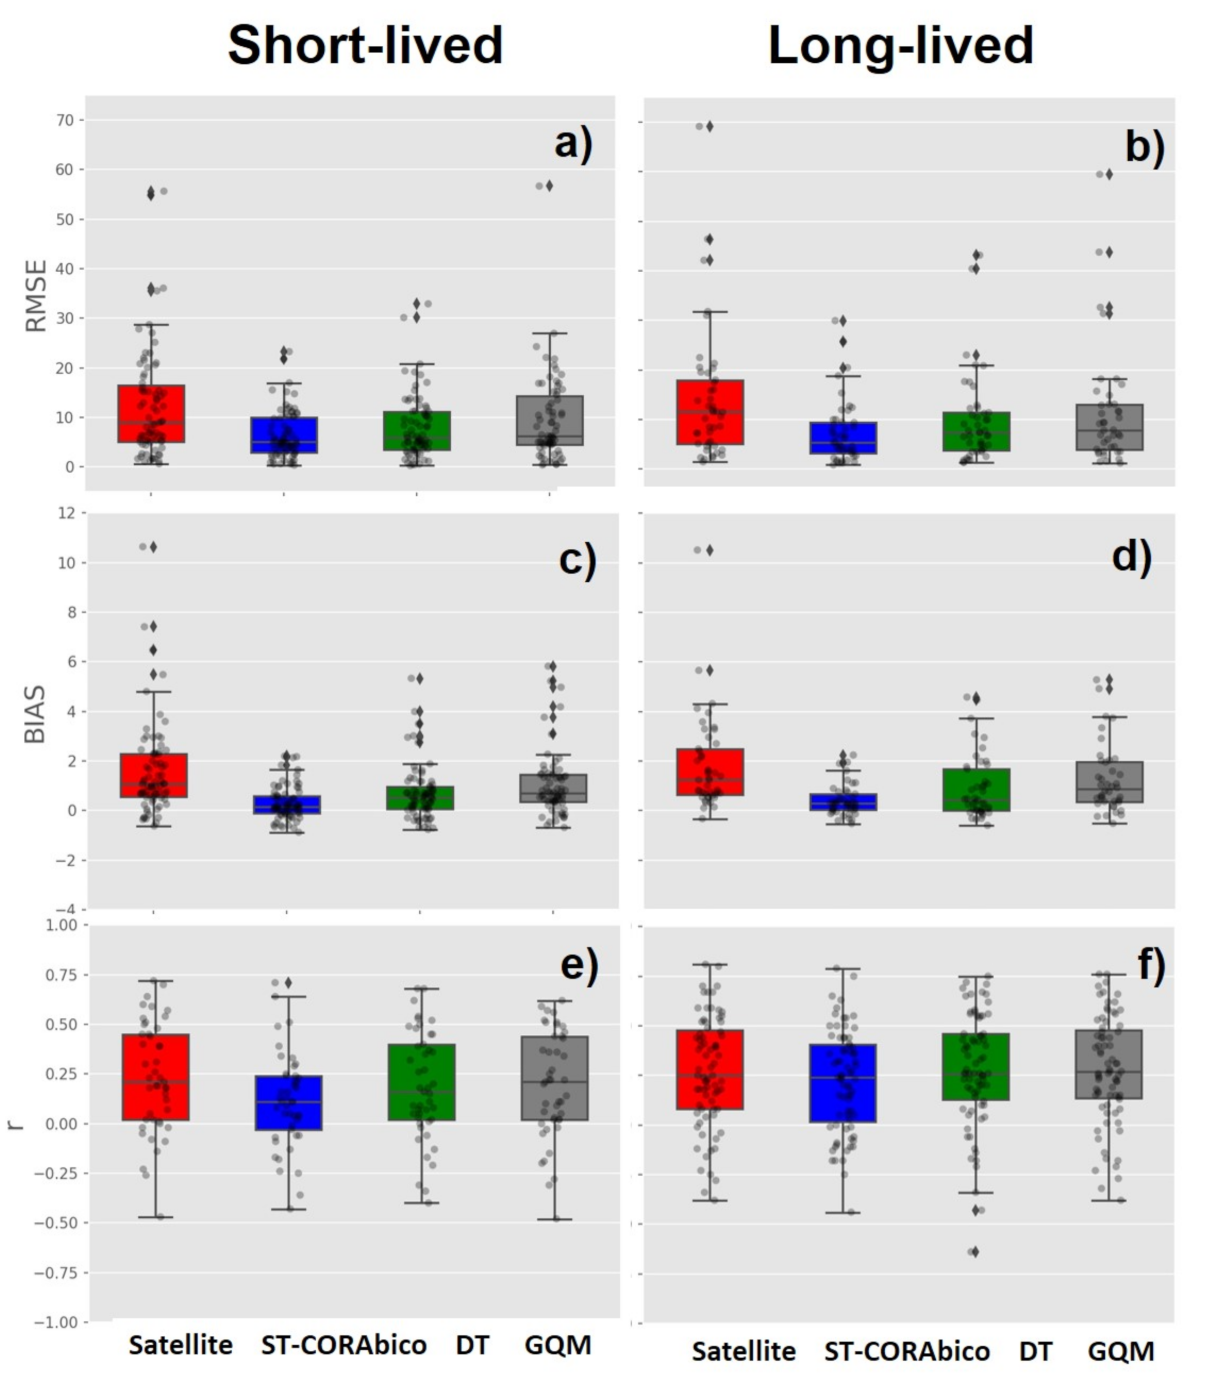
Figure 10 presents the comparison between ST-CORAbico, DT, and GQM for short- and long-lived storm events. The boxplots show the distributions of the RMSE (Figure 10a,b), the bias (Figure 10c,d), and the correlation coefficient (Figure 10d,f) between the 25% and 75% percentiles for the original GPM-IMERG and the different bias correction methods. The dots represent the individual error for each storm event. In comparison with the two probabilistic methods, we found that ST-CORAbico consistently had the lowest RMSE as well as the lowest bias for both short- and long-lived storm events. ST-CORAbico and DT had a lower impact on the correlation coefficient, especially for short-lived events.
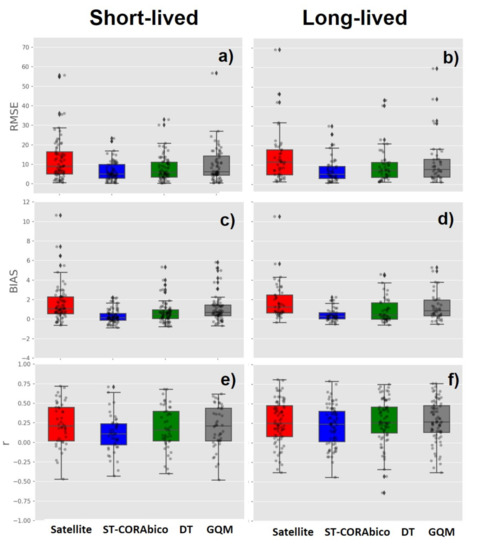
Figure 10.
Comparison between the satellite GPM-IMERG (red), ST-CORAbico (blue), Distribution Transformation (green) and Gamma Quantile Mapping (grey) error dispersion during monsoon seasons 2014–2017. (a,b) RMSE; (c,d) bias; and, (e,f) correlation coefficient.
5. Discussion
ST-CORAbico is a spatiotemporal object-based bias correction method that was designed to reduce the displacement and volume systematic errors of storm events detected by SPP. In comparison to spatial object-based bias correction methods e.g., [37,38], the inclusion of the temporal component of the storm event reduced additional error effects due to timing and orientation, improving the efficiency of the bias correction.
This research incorporated a multivariate kernel distribution algorithm into ST-CORA to segment the storm event using the four dimensions of the storm event. In comparison to binary segmentation in the previous version, ST-CORA with KDE segmentation was able to delineate intense storm events by removing unreal storm configurations as a consequence of false merging and false separation of storms due to the multidimensional connected labelling component algorithm. Based on the analysis of KDE threshold delineation and the connected intensity, we found that storm events that were segmented by the 25th percentile of the distribution showed a good result for segmenting intense storms with strong connection. However, further improvement is required.
The implementation of ST-CORAbico described the individual error correction due to displacement and volume. Results in the Lower Mekong basin indicated that volume errors were the main error correction, primarily resulting from the high overestimation of GPM-IMERG. These results agreed with multiple findings regarding hourly GPM-IMERG in monsoonal areas [70,71]. Overall, volume and displacement errors effectively contributed to the reduction of bias and RMSE, demonstrating the importance of reducing both of these systematic errors in satellite correction.
We acknowledge certain limitations of the study. Firstly, the uncertainty arising from the spatial interpolation method that was used for rain gauge values was not fully addressed in this research. Volume and especially displacement corrections in ST-CORAbico can be affected by the type of interpolation methods used to represent the spatiotemporal distribution of the observed storm. A dense rain gauge network can reduce the level of uncertainty; however, it is important to evaluate the impact of the type of interpolation method on the performance of ST-CORAbico, as mentioned above. Another limitation arises from the sensitivity of percentage to match observed and estimated storm events. Higher levels do not always correspond to similar events, which affects the bias correction. This process required an in-depth sensitivity analysis of in order to reduce the automatic storm matching. Additional analysis is required in order to identify why there is a strong correlation between observed and predicted storms in a spatiotemporal environment. In this study, we validated the performance of ST-CORAbico by comparing its performance against two widely used probabilistic methods. However, error metrics were calculated using the observed values, as there is no independent validation dataset available. Further implementations should consider an independent dataset to validate the error correction of the ST-CORAbico method.
This study was conducted in collaboration with the SERVIR-Mekong project and the Mekong River Commissions (MRC). SERVIR-Mekong is harnessing space and geospatial technologies to help decision-makers and key civil society groups to integrate geospatial information into their decision-making, planning, and communication. The application of this methodology can be used for various scientific purposes, including flood risk and water management. More specifically, the methodology enhances the input rainfall data, which are a crucial component of flood and drought early warning systems, landslide monitoring, as well as other water-related decision support systems. Future work will include the integration of machine learning technologies for near real-time bias correction of rainfall data when field data are scarce. In this regard, machine learning models will be trained and optimised using legacy field data and deployed on a near real-time basis.
6. Conclusions
We proposed a new spatiotemporal bias correction method for storm prediction detected by satellites. The method, called Spatiotemporal Contiguous Object-based Rainfall Analysis for bias correction (ST-CORAbico), analyses the main spatiotemporal characteristics of the observed and estimated storm events to correct systematic error sources due to displacement and volume. This methodology has two main elements: storm analysis for the segmentation and classification of storm event; and bias correction for correcting error due displacement and volume. In the storm analysis, we applied the ST-CORA method with a multivariate kernel segmentation in order to identify the spatiotemporal structure of the storm event. This method was applied over the Lower Mekong basin in Thailand to correct the GPM-IMERG Early version during the monsoon seasons from 2014 to 2017. The performance of ST-CORAbico was evaluated against the Distribution Transformation and the Gamma Quantile Mapping methods based on the reduction of RMSE, bias, and correlation coefficient. The results were divided by classifying the storm events into short- and long-lived storm events while using the k-means cluster analysis method.
We classified 68 storms (56%) as short-lived storms and 52 (44%) as long-lived events. The results of both storm event types showed that ST-CORAbico reduced the RMSE and bias of GPM-IMERG. Volume correction was the major error source due to the overestimation present in GPM-IMERG. Location error was most important in the reduction of the bias. ST-CORAbico displayed a marginal impact on the spatial structure of the satellite-derived rainfall, showing the original structure of the rainfall data.
The comparison of ST-CORAbico with the Distribution Transformation and the Gamma Quantile Mapping methods showed that ST-CORAbico had the lowest RMSE as well as the lowest bias in both short and long-lived events. In terms of the correlation coefficient, ST-CORAbico and DT had a lower impact on the correlation coefficient, especially for short-lived events.
ST-CORAbico improves the accuracy of satellite-derived near real-time information on storm events. It can be used in various flood monitoring and water management applications. Our future studies will also incorporate machine learning methods and related technologies in order to correct storm events in real-time, in situations where field observation data are scarce.
Author Contributions
Conceptualization, M.L.-B., G.A.C. and A.P.; Data curation, M.L.-B. and S.J.; Funding acquisition, P.T., L.S., S.K. and W.C.; Investigation, M.L., G.A.C., A.P., F.C., C.M., D.P.S. and S.B.-A.; Methodology, M.L.-B.; Project administration, C.M. and P.T.; Resources, M.L.-B., S.J., P.T., L.H.S., S.K., S.B.-A. and W.C.; Supervision, G.A.C., A.P., F.C., C.M., P.T., A.M., D.P.S., W.C., R.U. and D.P.S.; Visualization, C.M., S.B.-A. and W.C.; Writing—original draft, M.L.-B., A.P., F.C. and A.M.; Writing—review and editing, M.L.-B., G.A.C., A.P., F.C., C.M., S.J., P.T., A.M., D.S., L.H.S., K.S., S.B.-A., R.U. and D.P.S. All authors have read and agreed to the published version of the manuscript.
Funding
This work is part of a PhD study of the first author and was partially funded by the Colombian Administrative Department of Science, Technology and Innovation (COLCIENCIAS) under Grant number 646.
Acknowledgments
The authors would like to acknowledge the Asian Disaster Preparedness Center, in Thailand and the USAID-NASA SERVIR-Mekong program for the support provided. We would like to thank Hannah Priestley for her meticulous style corrections. GPM-IMERG information was extracted from SERVIR-Mekong’s Virtual Gauge and Stream Gauge Data service tool (VRSGS). Additionally, we would like to thanks the Hydroinformatics Institute in Thailand for the provision of hourly rain gauge data and also the space agencies responsible for the satellite data used in this research.
Conflicts of Interest
The authors declare no conflict of interest.
References
- Bui, Y.T.; Orange, D.; Visser, S.; Hoanh, C.T.; Laissus, M.; Poortinga, A.; Tran, D.T.; Stroosnijder, L. Lumped surface and sub-surface runoff for erosion modeling within a small hilly watershed in northern Vietnam. Hydrol. Process. 2014, 28, 2961–2974. [Google Scholar] [CrossRef]
- Markert, K.N.; Schmidt, C.M.; Griffin, R.E.; Flores, A.I.; Poortinga, A.; Saah, D.S.; Muench, R.E.; Clinton, N.E.; Chishtie, F.; Kityuttachai, K.; et al. Historical and operational monitoring of surface sediments in the lower mekong basin using Landsat and Google Earth Engine cloud computing. Remote Sens. 2018, 10, 909. [Google Scholar] [CrossRef]
- Poortinga, A.; Bastiaanssen, W.; Simons, G.; Saah, D.; Senay, G.; Fenn, M.; Bean, B.; Kadyszewski, J. A self-calibrating runoff and streamflow remote sensing model for ungauged basins using open-access earth observation data. Remote Sens. 2017, 9, 86. [Google Scholar] [CrossRef]
- Price, K.; Purucker, S.T.; Kraemer, S.R.; Babendreier, J.E.; Knightes, C.D. Comparison of radar and gauge precipitation data in watershed models across varying spatial and temporal scales. Hydrol. Process. 2014, 28, 3505–3520. [Google Scholar] [CrossRef]
- AghaKouchak, A.; Nakhjiri, N. A near real-time satellite-based global drought climate data record. Environ. Res. Lett. 2012, 7, 044037. [Google Scholar] [CrossRef]
- Azarderakhsh, M.; Rossow, W.B.; Papa, F.; Norouzi, H.; Khanbilvardi, R. Diagnosing water variations within the Amazon basin using satellite data. J. Geophys. Res. Atmos. 2011, 116. [Google Scholar] [CrossRef]
- Pan, M.; Li, H.; Wood, E. Assessing the skill of satellite-based precipitation estimates in hydrologic applications. Water Resour. Res. 2010, 46. [Google Scholar] [CrossRef]
- Tesfagiorgis, K.; Mahani, S.; Krakauer, N.; Khanbilvardi, R. Bias correction of satellite rainfall estimates using a radar-gauge product—A case study in Oklahoma (USA). Hydrol. Earth Syst. Sci. 2011, 2011 15, 2631–2647. [Google Scholar] [CrossRef]
- Griffith, C.G.; Woodley, W.L.; Grube, P.G.; Martin, D.W.; Stout, J.; Sikdar, D.N. Rain estimation from geosynchronous satellite imagery—Visible and infrared studies. Mon. Weather Rev. 1978, 106, 1153–1171. [Google Scholar] [CrossRef]
- Vicente, G.A.; Scofield, R.A.; Menzel, W.P. The operational GOES infrared rainfall estimation technique. Bull. Am. Meteorol. Soc. 1998, 79, 1883–1898. [Google Scholar] [CrossRef]
- Marzano, F.S.; Palmacci, M.; Cimini, D.; Giuliani, G.; Turk, F.J. Multivariate statistical integration of satellite infrared and microwave radiometric measurements for rainfall retrieval at the geostationary scale. IEEE Trans. Geosci. Remote Sens. 2004, 42, 1018–1032. [Google Scholar] [CrossRef]
- Tapiador, F. A physically based satellite rainfall estimation method using fluid dynamics modelling. Int. J. Remote Sens. 2008, 29, 5851–5862. [Google Scholar] [CrossRef]
- Sorooshian, S.; Hsu, K.L.; Gao, X.; Gupta, H.V.; Imam, B.; Braithwaite, D. Evaluation of PERSIANN system satellite-based estimates of tropical rainfall. Bull. Am. Meteorol. Soc. 2000, 81, 2035–2046. [Google Scholar] [CrossRef]
- Joyce, R.J.; Janowiak, J.E.; Arkin, P.A.; Xie, P. CMORPH: A method that produces global precipitation estimates from passive microwave and infrared data at high spatial and temporal resolution. J. Hydrometeorol. 2004, 5, 487–503. [Google Scholar] [CrossRef]
- Huffman, G.J.; Bolvin, D.T.; Nelkin, E.J.; Wolff, D.B.; Adler, R.F.; Gu, G.; Hong, Y.; Bowman, K.P.; Stocker, E.F. The TRMM multisatellite precipitation analysis (TMPA): Quasi-global, multiyear, combined-sensor precipitation estimates at fine scales. J. Hydrometeorol. 2007, 8, 38–55. [Google Scholar] [CrossRef]
- Huffman, G.J.; Adler, R.F.; Bolvin, D.T.; Nelkin, E.J. The TRMM multi-satellite precipitation analysis (TMPA). In Satellite Rainfall Applications for Surface Hydrology; Springer: Berlin/Heidelberg, Germany, 2010; pp. 3–22. [Google Scholar]
- Huffman, G.J.; Bolvin, D.T.; Nelkin, E.J. Integrated Multi-satellitE Retrievals for GPM (IMERG) technical documentation. NASA/GSFC Code 2015, 612, 2019. [Google Scholar]
- Sun, Q.; Miao, C.; Duan, Q.; Ashouri, H.; Sorooshian, S.; Hsu, K.L. A review of global precipitation data sets: Data sources, estimation, and intercomparisons. Rev. Geophys. 2018, 56, 79–107. [Google Scholar] [CrossRef]
- Thiemig, V.; Rojas, R.; Zambrano-Bigiarini, M.; Levizzani, V.; De Roo, A. Validation of satellite-based precipitation products over sparsely gauged African river basins. J. Hydrometeorol. 2012, 13, 1760–1783. [Google Scholar] [CrossRef]
- Guo, H.; Chen, S.; Bao, A.; Hu, J.; Gebregiorgis, A.S.; Xue, X.; Zhang, X. Inter-comparison of high-resolution satellite precipitation products over Central Asia. Remote Sens. 2015, 7, 7181–7211. [Google Scholar] [CrossRef]
- Kimani, M.W.; Hoedjes, J.C.B.; Su, Z. An Assessment of satellite-derived rainfall products relative to ground observations over East Africa. Remote Sens. 2017, 9, 430. [Google Scholar] [CrossRef]
- Vila, D.A.; De Goncalves, L.G.G.; Toll, D.L.; Rozante, J.R. Statistical evaluation of combined daily gauge observations and rainfall satellite estimates over continental South America. J. Hydrometeorol. 2009, 10, 533–543. [Google Scholar] [CrossRef]
- Habib, E.; Haile, A.T.; Sazib, N.; Zhang, Y.; Rientjes, T. Effect of bias correction of satellite-rainfall estimates on runoff simulations at the source of the Upper Blue Nile. Remote Sens. 2014, 6, 6688–6708. [Google Scholar] [CrossRef]
- Ebert, E.; McBride, J. Verification of precipitation in weather systems: Determination of systematic errors. J. Hydrol. 2000, 239, 179–202. [Google Scholar] [CrossRef]
- Davis, C.A.; Brown, B.G.; Bullock, R.; Halley-Gotway, J. The method for object-based diagnostic evaluation (MODE) applied to numerical forecasts from the 2005 NSSL/SPC Spring Program. Weather Forecast. 2009, 24, 1252–1267. [Google Scholar] [CrossRef]
- Wernli, H.; Paulat, M.; Hagen, M.; Frei, C. SAL—A novel quality measure for the verification of quantitative precipitation forecasts. Mon. Weather Rev. 2008, 136, 4470–4487. [Google Scholar] [CrossRef]
- Roberts, N. An investigation of the ability of a storm scale configuration of the Met Office NWP model to predict floodproducing rainfall. UK Met Off. Tech. Rep. 2005, 455, 80. [Google Scholar]
- Marsigli, C.; Montani, A.; Paccagnella, T. Verification of the COSMOLEPS new suite in terms of precipitation distribution. COSMO Newsl. 2006, 6, 134–141. [Google Scholar]
- Casati, B.; Ross, G.; Stephenson, D. A new intensity-scale approach for the verification of spatial precipitation forecasts. Meteorol. Appl. A J. Forecast. Pract. Appl. Train. Tech. Model. 2004, 11, 141–154. [Google Scholar] [CrossRef]
- Casati, B. New developments of the intensity-scale technique within the Spatial Verification Methods Intercomparison Project. Weather Forecast. 2010, 25, 113–143. [Google Scholar] [CrossRef]
- Mittermaier, M.P. Using an intensity-scale technique to assess the added benefit of high-resolution model precipitation forecasts. Atmos. Sci. Lett. 2006, 7, 36–42. [Google Scholar] [CrossRef]
- Keil, C.; Craig, G.C. A displacement-based error measure applied in a regional ensemble forecasting system. Mon. Weather Rev. 2007, 135, 3248–3259. [Google Scholar] [CrossRef]
- Keil, C.; Craig, G.C. A displacement and amplitude score employing an optical flow technique. Weather Forecast. 2009, 24, 1297–1308. [Google Scholar] [CrossRef]
- Skok, G.; Tribbia, J.; Rakovec, J.; Brown, B. Object-based analysis of satellite-derived precipitation systems over the low-and midlatitude Pacific Ocean. Mon. Weather Rev. 2009, 137, 3196–3218. [Google Scholar] [CrossRef]
- Li, J.; Hsu, K.; AghaKouchak, A.; Sorooshian, S. An object-based approach for verification of precipitation estimation. Int. J. Remote Sens. 2015, 36, 513–529. [Google Scholar] [CrossRef]
- Li, J.; Hsu, K.L.; AghaKouchak, A.; Sorooshian, S. Object-based assessment of satellite precipitation products. Remote Sens. 2016, 8, 547. [Google Scholar] [CrossRef]
- Demaria, E.; Rodriguez, D.; Ebert, E.; Salio, P.; Su, F.; Valdes, J.B. Evaluation of mesoscale convective systems in South America using multiple satellite products and an object-based approach. J. Geophys. Res. Atmos. 2011, 116. [Google Scholar] [CrossRef]
- Le Coz, C.; Heemink, A.; Verlaan, M.; Veldhuis, M.C.; van de Giesen, N. Correcting position error in precipitation data using image morphing. Remote Sens. 2019, 11, 2557. [Google Scholar] [CrossRef]
- Clark, A.J.; Kain, J.S.; Marsh, P.T.; Correia, J., Jr.; Xue, M.; Kong, F. Forecasting tornado pathlengths using a three-dimensional object identification algorithm applied to convection-allowing forecasts. Weather Forecast. 2012, 27, 1090–1113. [Google Scholar] [CrossRef]
- Clark, A.J.; Bullock, R.G.; Jensen, T.L.; Xue, M.; Kong, F. Application of object-based time-domain diagnostics for tracking precipitation systems in convection-allowing models. Weather Forecast. 2014, 29, 517–542. [Google Scholar] [CrossRef]
- Development and implementation of MODE time domain object-based verification. In In Proceedings of the 24th Conference Weather and Forecasting, Seattle, WA, USA, 24–27 January 2011.
- Laverde-Barajas, M.; Corzo Perez, G.; Chishtie, F.; Poortinga, A.; Uijlenhoet, R.; Solomatine, D. Decomposing satellite-based rainfall errors in flood estimation: Hydrological responses using a spatiotemporal object-based verification method. J. Hydrol. 2020, 125554. [Google Scholar] [CrossRef]
- Laverde-Barajas, M.; Corzo, G.; Bhattacharya, B.; Uijlenhoet, R.; Solomatine, D.P. Spatiotemporal Analysis of Extreme Rainfall Events Using an Object-Based Approach. In Spatiotemporal Analysis of Extreme Hydrological Events; Corzo, G., Varouchakis, E.A., Eds.; Elsevier: Amsterdam, The Netherlands, 2019; pp. 95–112. [Google Scholar] [CrossRef]
- Delgado, J.; Merz, B.; Apel, H. A climate-flood link for the lower Mekong River. Hydrol. Earth Syst. Sci. 2012, 16, 1533–1541. [Google Scholar] [CrossRef]
- Yang, R.; Zhang, W.K.; Gui, S.; Tao, Y.; Cao, J. Rainy season precipitation variation in the Mekong River basin and its relationship to the Indian and East Asian summer monsoons. Clim. Dyn. 2019, 52, 5691–5708. [Google Scholar] [CrossRef]
- Schneider, U.; Fuchs, T.; Meyer-Christoffer, A.; Rudolf, B. Global Precipitation Analysis Products of the GPCC; Global Precipitation Climatology Centre (GPCC), DWD, Internet Publication; Deutscher Wetterdienst: Offenbach, Germany, 2008; Volume 112. [Google Scholar]
- Golden Software, I. Surfer 12 Users’ Guide: Powerful Contouring, Gridding, and Surface Mapping, 12th ed.; Golden Software, Inc.: Golden, CO, USA, 2014. [Google Scholar]
- Ly, S.; Sohier, C.; Charles, C.; Degré, A. Effect of raingage density, position and interpolation on rainfall-discharge modelling. In EGU2012 Geophysical Research Abstracts; European Geophysical Society: Katlenburg-Lindau, Germany, 2012; p. 2592. [Google Scholar]
- Li, J.; Heap, A.D. Spatial interpolation methods applied in the environmental sciences: A review. Environ. Model. Softw. 2014, 53, 173–189. [Google Scholar] [CrossRef]
- Chen, Y.C.; Wei, C.; Yeh, H.C. Rainfall network design using kriging and entropy. Hydrol. Process. Int. J. 2008, 22, 340–346. [Google Scholar] [CrossRef]
- Guttman, A. R-Trees: A Dynamic Index Structure for Spatial Searching. In Proceedings of the 1984 ACM SIGMOD International Conference on Management of Data, Association for Computing Machinery, New York, NY, USA, 18–21 June 1984; pp. 47–57. Available online: http://www-db.deis.unibo.it/courses/SI-LS/papers/Gut84.pdf (accessed on 30 September 2020).
- Ebert, E.E.; Gallus, W.A., Jr. Toward better understanding of the contiguous rain area (CRA) method for spatial forecast verification. Weather Forecast. 2009, 24, 1401–1415. [Google Scholar] [CrossRef]
- Bethel, E.W.; Childs, H.; Hansen, C. High Performance Visualization: Enabling Extreme-Scale Scientific Insight; CRC Press: Boca Raton, FL, USA, 2012. [Google Scholar]
- Chen, T.B.; Lu, H.H.S.; Lee, Y.S.; Lan, H.J. Segmentation of cDNA microarray images by kernel density estimation. J. Biomed. Inf. 2008, 41, 1021–1027. [Google Scholar] [CrossRef]
- Pereira, O.; Torres, E.; Garcé, Y.; Rodríguez, R. Edge detection based on kernel density estimation. In Proceedings of the International Conference on Image Processing, Computer Vision, and Pattern Recognition (IPCV), The Steering Committee of The World Congress in Computer Science, Computer, Engineering and Applied Computing WorldComp, Las Vegas, NV, USA, 17–20 July 2017; pp. 123–128. [Google Scholar]
- Wang, L.; Lu, J.; Li, X.; Huan, Z.; Liang, J.; Chen, S. Learning arbitrary-shape object detector from bounding-box annotation by searching region-graph. Pattern Recognit. Lett. 2017, 87, 171–176. [Google Scholar] [CrossRef]
- Zivkovic, Z.; Van Der Heijden, F. Efficient adaptive density estimation per image pixel for the task of background subtraction. Pattern Recognit. Lett. 2006, 27, 773–780. [Google Scholar] [CrossRef]
- Berjón, D.; Cuevas, C.; Morán, F.; García, N. Real-time nonparametric background subtraction with tracking-based foreground update. Pattern Recognit. 2018, 74, 156–170. [Google Scholar] [CrossRef]
- Hyndman, R.L.; Zhang, X.; King, M.L. Bandwidth selection for multivariate kernel density estimation using MCMC. In Econometric Society 2004 Australasian Meetings; Econometric Society: Melbourne, Australia, 9 July 2004. [Google Scholar]
- Zhang, X.; King, M.L.; Hyndman, R.J. A Bayesian approach to bandwidth selection for multivariate kernel density estimation. Comput. Stat. Data Anal. 2006, 50, 3009–3031. [Google Scholar] [CrossRef]
- Henderson, D.J.; Parmeter, C.F. Normal reference bandwidths for the general order, multivariate kernel density derivative estimator. Stat. Probab. Lett. 2012, 82, 2198–2205. [Google Scholar] [CrossRef]
- Grams, J.S.; Gallus, W.A., Jr.; Koch, S.E.; Wharton, L.S.; Loughe, A.; Ebert, E.E. The use of a modified Ebert–McBride technique to evaluate mesoscale model QPF as a function of convective system morphology during IHOP 2002. Weather Forecast. 2006, 21, 288–306. [Google Scholar] [CrossRef]
- Steiner, M.; Houze, R.A., Jr.; Yuter, S.E. Climatological characterization of three-dimensional storm structure from operational radar and rain gauge data. J. Appl. Meteorol. 1995, 34, 1978–2007. [Google Scholar] [CrossRef]
- Molini, L.; Parodi, A.; Siccardi, F. Dealing with uncertainty: An analysis of the severe weather events over Italy in 2006. Nat. Hazards Earth Syst. Sci 2009, 9, 1775–1786. [Google Scholar] [CrossRef]
- Molini, L.; Parodi, A.; Rebora, N.; Craig, G. Classifying severe rainfall events over Italy by hydrometeorological and dynamical criteria. Q. J. R. Meteorol. Soc. 2011, 137, 148–154. [Google Scholar] [CrossRef]
- Johnson, A.E.; Hebert, M. Using spin images for efficient object recognition in cluttered 3D scenes. IEEE Trans. Pattern Anal. Mach. Intell. 1999, 21, 433–449. [Google Scholar] [CrossRef]
- Themeßl, M.J.; Gobiet, A.; Heinrich, G. Empirical-statistical downscaling and error correction of regional climate models and its impact on the climate change signal. Clim. Chang. 2012, 112, 449–468. [Google Scholar] [CrossRef]
- Brown, B.G.; Bullock, Y.R.; Davis, C.A.; Gotway, J.H.; Chapman, M.B.; Takacs, A.; Gillel, E.; Manning, K.; Mahoney, J.L. New verification approaches for convective weather forecasts. In Proceedings of the 11th Conference on Aviation, Range, and Aerospace, Hyannis, MA, USA, 4–8 October 2004; pp. 3–8. [Google Scholar]
- Piani, C.; Haerter, J.; Coppola, E. Statistical bias correction for daily precipitation in regional climate models over Europe. Theor. Appl. Climatol. 2010, 99, 187–192. [Google Scholar] [CrossRef]
- Oliveira, R.; Maggioni, V.; Vila, D.; Morales, C. Characteristics and diurnal cycle of GPM rainfall estimates over the central Amazon region. Remote Sens. 2016, 8, 544. [Google Scholar] [CrossRef]
- Tang, G.; Ma, Y.; Long, D.; Zhong, L.; Hong, Y. Evaluation of GPM Day-1 IMERG and TMPA Version-7 legacy products over Mainland China at multiple spatiotemporal scales. J. Hydrol. 2016, 533, 152–167. [Google Scholar] [CrossRef]
Publisher’s Note: MDPI stays neutral with regard to jurisdictional claims in published maps and institutional affiliations. |
© 2020 by the authors. Licensee MDPI, Basel, Switzerland. This article is an open access article distributed under the terms and conditions of the Creative Commons Attribution (CC BY) license (http://creativecommons.org/licenses/by/4.0/).

