1. Introduction
Through the ongoing growth of the automated vehicles (AV) trade, the classification of non-motorized road users such as pedestrians is becoming crucial in developing safety applications for the Cooperative Intelligent Transportation System (C-ITS) to enhance the safety of non-motorized road users [
1,
2]. The C-ITS has been widely investigate and used due to its ability to utilize the data and better manage the transportation networks. The C-ITS attempts to advance health, performance, and comfort through various connectivity technologies, such as vehicle-to-vehicle (V2V). C-ITS shares various forms of information, including knowledge about non-motorized road users, traffic congestion, accidents, and road threats [
3]. This helps C-ITS to create an integrated person, route, infrastructure, and vehicle network by implementing communications and other transportation technologies. Taking advantage of the new technology and available big datasets can create a fully functional, instant-time, precise, and secure transport facilities [
2,
4]. While C-ITS is now receiving attention globally, the academic community focused primarily on motorized road users such as motor vehicles, expressing less interest in non-motorized road users [
5]. Major planning challenges faced by deploying AV is intermodal traffic control, where AV regulations and programming should be structured to value human life by reducing the likelihood of crashes and protecting non-motorized road users [
6,
7].
The non-motorized road users are known to be one example of people intervening with AVs “humans that do not explicitly interact with the automated vehicle but still affect how the vehicle accomplishes its task by observing or interfering with the actions of the vehicle” [
1]. The non-motorized road users, which typically lack protection, can be described as ‘vulnerable.’ Those were identified in this research effort by the quantity of traffic safety they lack. The lethality of non-motorized road users, in particular pedestrians and cyclists, are greater than the norm. This is because of the discrimination factor for non-motorized road users’ collisions is small compared to motorized road users [
8].
Conversely, the use of smartphones in data analysis has also lately gained attention of academics and policymakers. Smartphone applications (apps) have been designed and used successfully in several fields to gather data from smartphones. Researchers can use smartphones in the transport industry to track and gather motion information, such as velocity and motion vector from the integrated Global Positioning System (GPS). This information has the potential to identify the travel mode of the individual, which can be used in a variety of different ways and may decrease the amount of time and expense of traditional travel surveys substantially.
An established practice in non-motorized road users’ classification and mode transportation recognition tasks is using the state-of-the-art algorithms for classification by integrating frame-level features over some period as an input. The common approach is to use the traditional statistic techniques, such as mean and standard deviation, resulting in a less resolution dataset and losing very valuable information such as the historical evolution and needs significant training time and expense. In this study, we explore the possibility of using Transfer Learning with Convolutional Neural Network to classify non-motorized road users with high precision (CNN-TL), which saves training time and cost, to classify images constructed from Recurrence Quantification Analysis (RQA). This approach has the potential to be popular in the transportation mode recognition field due to the potential high accuracy and ease of implementation.
2. Related Work
Scientists have established many methods to effectively differentiate between the modes of transport. Machine learning and artificial intelligence algorithms have shown outstanding performance in creating classification models with high precision, in particular with transportation mode classification. Throughout different experiments, supervised learning models, such as Support Vector Machines (SVMs) [
9,
10,
11], Random Forests (RFs) [
11,
12], and Decision Trees [
11,
13,
14,
15,
16,
17,
18], have been utilized in different research efforts.
These research efforts have obtained various levels of accuracy in the classification. There are many variables that influence the precision of detecting modes of transport, as for example the monitoring time, the source of the data, number of modes, among others [
12,
19]. A major factor influencing the precision of transportation mode recognition approach, however, is the classifier used in the approach. In most of the research conducted in the past, researchers used only one classification algorithm layer [
12,
14,
15]. This is called a conventional framework. On the other hand, a few researchers have used more than one classification algorithm layer, which is called a hierarchical framework [
11]. Rasti et al. have provided an overview over the deep feature extraction approaches with its applications to hyperspectral image classification, covering a wide range of techniques with different classification layers.
In addition to the number of classification layers, the domain of the extracted features is another important factor that needs to be considered in the transportation mode recognition approach. The domain of the features can be classified into two categories: time and frequency. Several research efforts were conducted using both as in [
9,
10,
11,
12,
14,
15,
20] [
9,
11,
15]. Both accomplished significant and high accuracy.
Zadeh et al. [
21] proposed a geometric approach to detect risky circumstances, so that their built-in alert system on smartphones can secure non-motorized road users. This approach can estimate the probability of a crash with the use of a fuzzy inference. In addition, a three-dimensional (3D) photonic mixer camera was developed to provide pedestrian identification using a sensor device to meet unique criteria for pedestrian safety in [
22]. Anaya et al. [
5] have used V2V communication to develop a novel Advanced Driver Assistance Program to prevent collisions between motorcyclists and cyclists. A multi-sensor approach was developed to non-motorized road users’ security as part of the PROTECTOR project by detecting and identifying non-motorized road users from vehicles in motion in [
23]. They explored the impact of using CNN-TL on the precision of the non-motorized road user’s classification, which was the first effort to the best of our knowledge in this respect. They aim at precisely detecting non-motorized road users through data obtained from sensors on smartphones with low power. High level C-ITS protection relies on a specific classification of the non-motorized road users. A binary classifier was introduced to discriminate non-motorized road user’s modes (i.e., cycling, running, and walking) from motorized road user’s modes (passenger car and taking a bus). A binary classifier is useful in situations where there are higher threats to non-motorized road users. For instance, at an intersection, all subjects’ smartphones detect non-motorized road users, and reports them to the C-ITS roadside unit. The C-ITS roadside also receives messages from vehicles, if any, and then transmits this message onto a warning sign if it detects a potential conflict between non-motorized road users and the vehicle.
We should emphasize that most of the methods proposed in the latest research efforts did not consider the shortcomings of GPS data such as signal failure or data loss, resulting in unreliable location information. In addition, turning on the GPS service in smartphones might quickly drain the battery; thus, this effort attempted to use collected data of various sensors in a smartphone without GPS information.
3. Data Collection
The dataset was obtained in Blacksburg, VA using a smartphone app by Jahangiri and Rakha [
12]. Ten travelers were provided with the app to track their movement in five different modes of transportation, namely: car, bicycle, bus, running, and walking. Data were gathered from four different sensors in the smartphone: The Global Positioning System (GPS), accelerometer, gyroscope, and rotation-vector. Data were warehoused at the maximum viable frequency. Data gathering took place on working days (Mondays to Fridays) and during working hours (from 8:00 AM to 6:00 PM). Several variables have been considered to gather meaningful data that represent natural behaviors. To ensure the sensor positioning has no impact on the data collected, travelers (i.e., participants) were asked to consider holding the smartphone in various positions with no limitations. The data were gathered on various road types, and some periods that indicate congestion conditions that occur in real-life circumstances. The gathering of 30-min of data per person during the study period was considered appropriate for each mode.
To equate the results of the analysis with results of previous research efforts [
11,
12], the selected features extracted from the signals were assumed to have a significant association with the modes of travel for the study. In addition, features that could be derived from the rotation-vector values were omitted for the same purpose. Furthermore, GPS features were ignored in this study, allowing this system to be applied in circumstances in which GPS data were unavailable and to resolve the issue of battery depletion when the GPS service is turned on.
4. RQA Features
Extracting features from the signal is the standard approach in solving mode classification problems in the literature, which can be then used as inputs into the various classification algorithms. The traditional method creates features mainly by using statistics such as the mean, median, and standard deviation values. This process might result in losing the temporal evolution and behavior of the signal, which is valuable information. Extracting features that represent this behavior maximizes the classification precision and accuracy, but it is not yet deeply investigated in the literature. In [
24], we proposed extracting features using Recurrence Quantification Analysis (RQA), which we proved provided extensive temporal behavior of the obtained signal. RQA is a nonlinear method for analyzing complex dynamic systems by quantifying the recurrence properties of the signal. Eckmann et al. [
25] implemented this as a visual tool for finding hidden recurring patterns and non-stationary and systemic shifts. RQA has proven to be a robust method for analyzing dynamic systems and is capable of quantitatively characterizing the magnitude and complexity of nonlinear, non-stationary, and small signals [
26,
27,
28,
29,
30,
31,
32]. It seems that RQA may result in more subtle kind of features to the variations in the signal and more robust against the noise in the signal data [
30,
31].
In this study we used the extracted features using RQA to create images (we called them RQA images) that could be then used as inputs in a classification algorithm instead of using many numerical features. This has many benefits, including the ability of using pretrained deep learning algorithms and representing the various features in one single image, which will save a significant amount of time in computing, reducing the complexity of the system. However, before we introduce the proposed framework, the following is a brief description of how we extracted the features using the quantification of patterns that occur in Recurrence Plots (RPs); more information and details can be found here [
24]. Extraction of RQA features involves the setting of three essential parameters: delay (
) (i.e., lag), phase space dimension (
), and threshold parameter (
). Delay is chosen as the minimum value for the Average Mutual Knowledge (AMI) function. We averaged the collective average information function over all participants and modes in order to calibrate the delay parameter for each channel, as can be seen in
Figure 1a. The phase space dimension is calculated using the False Nearest Neighbor (FNN) test, as seen in
Figure 1b. To calculate the value of
, the space dimension and the delay were used to create the RP and to extract RQA features at various
values. We use the resulted RQA features of each stream from applying RF algorithm as inputs. Consequently,
was calculated for each wave based on the precision of the classification. More information and details on how we found these parameters can be found in [
24].
Jahangiri and Rakha [
12] obtained measurements at a frequency of approximately 25 Hz from the various sensors. As the sensor output samples were not synchronized, a linear interpolation was implemented by the authors to generate continuous signals from the discrete samples. Subsequently, they sampled the designed sensor signals at 100 Hz and divided each sensor’s output in each direction (
) into 1-s long, non-overlapping windows (
). Using RQA, each point (
in the dimensional space is
, which means that each 1-s window (i.e.,
samples) results in
RP for
and
; and
RP for
and
. As a result, six RPs of
and three RP of
were extracted to be used in image classification.
Table 1 shows some information on the structure of used dataset.
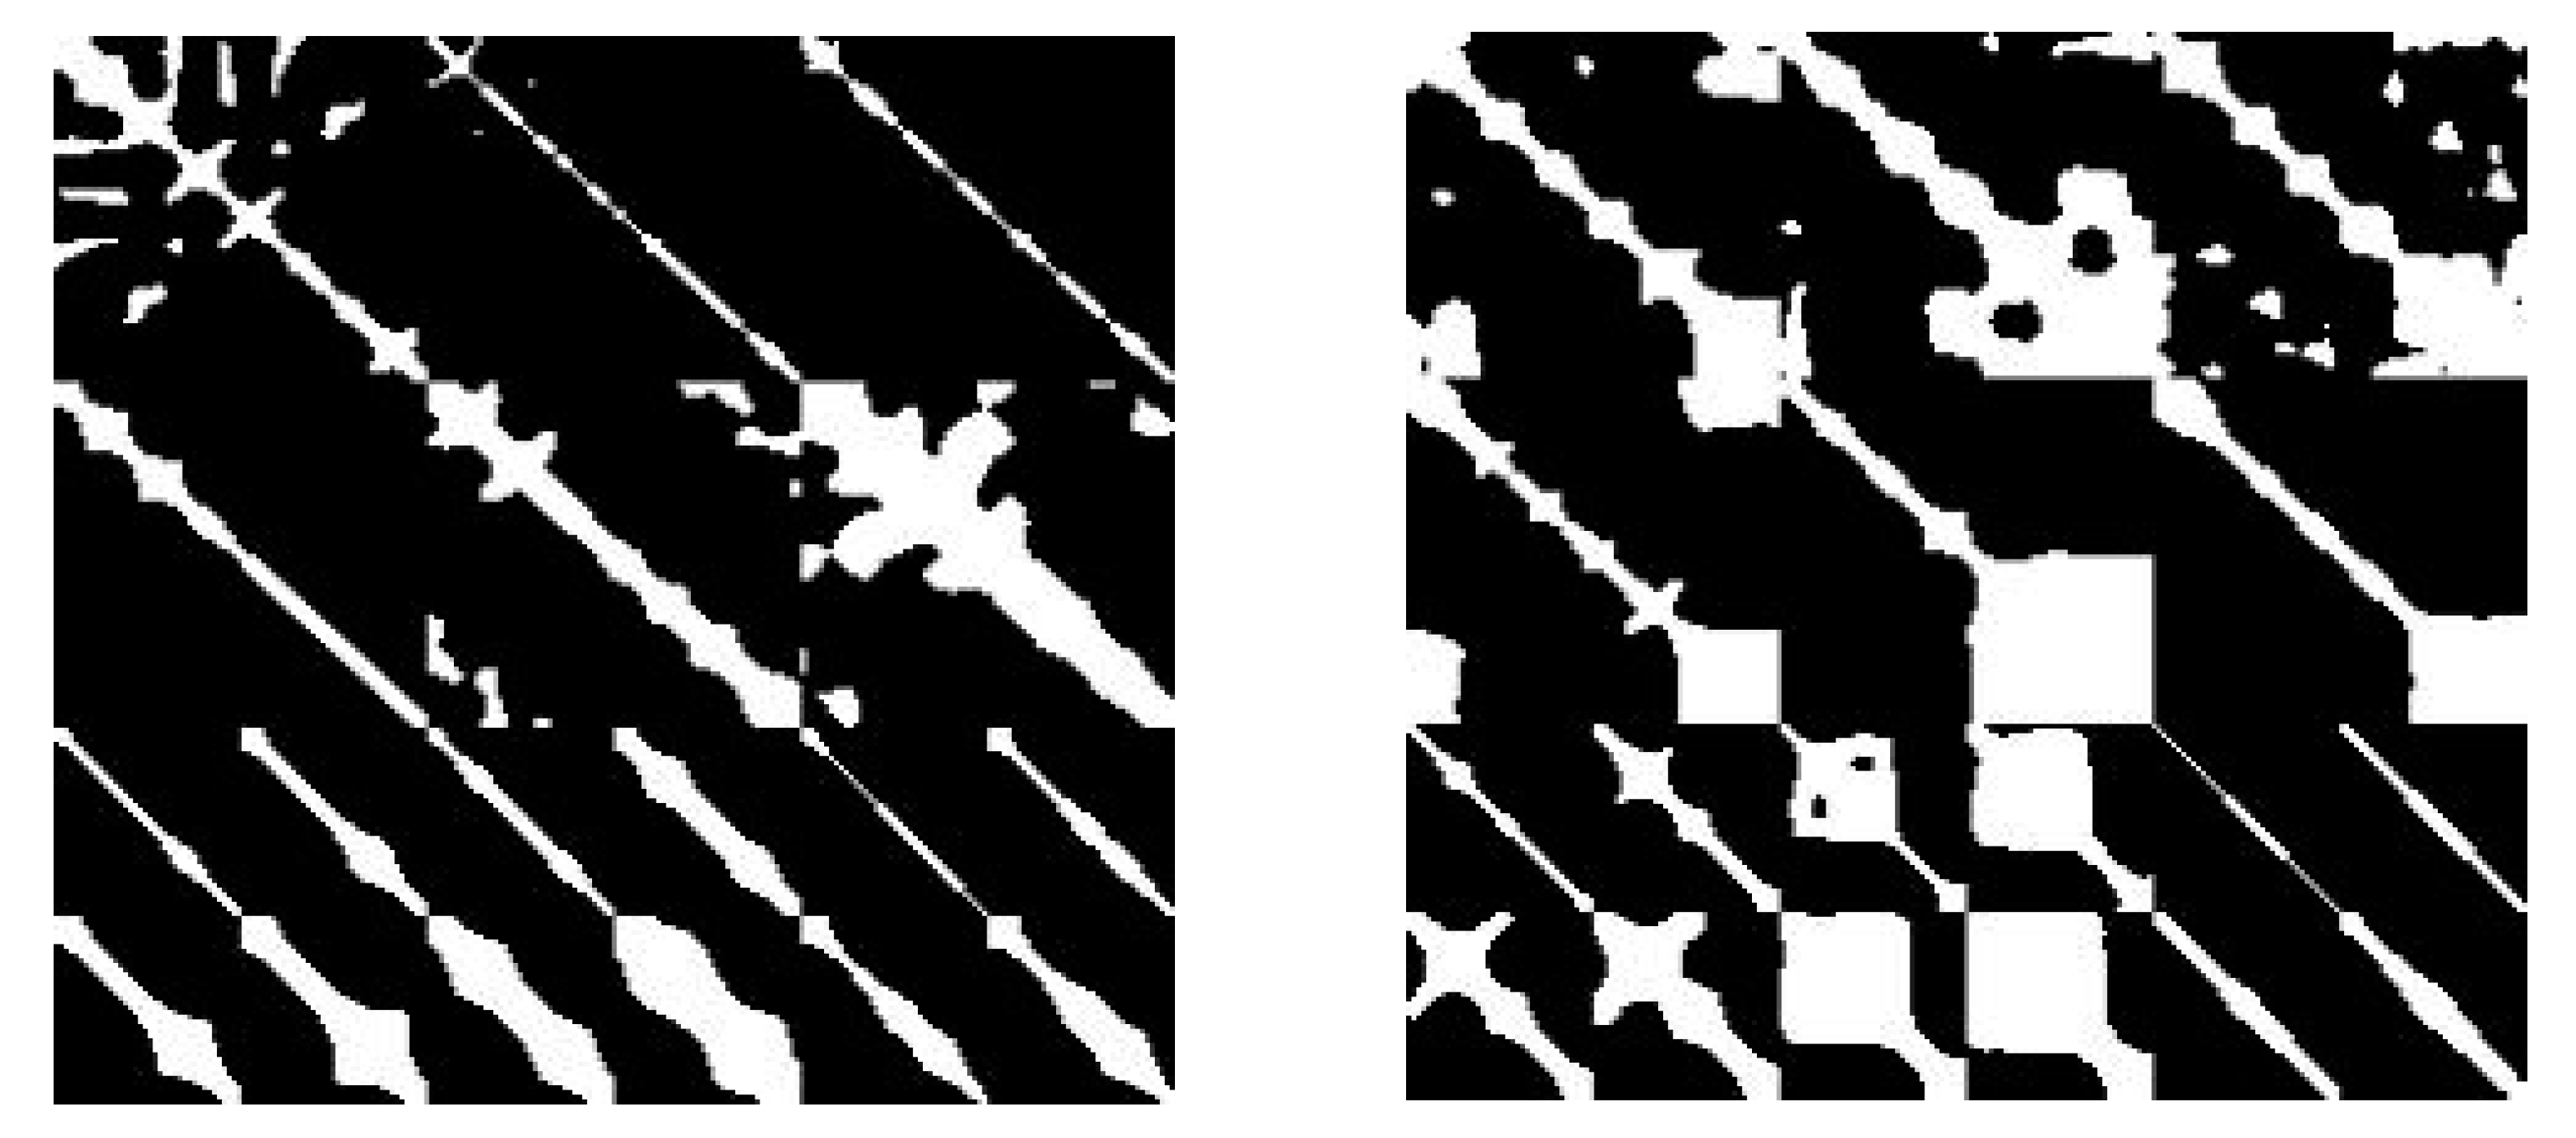
In addition, an example of the extracted RQA images of VRUs and non-VRUs modes are shown in
Figure 2.
5. Methods
Convolutional Neural Network Transfer Learning (CNN-TL)
Convolutional neural network (CNN) is a Deep Learning algorithm that has recently shown outstanding performance in many computer vision applications, such as image classification, object classification, and face recognition [
33]. In this study, we used CNN as it takes images as inputs, and was proven to be able to process and classify it. Technically, each input image processes through a series of convolution hidden layers with certain filters to classify it with a defined probabilistic value between 0 and 1. However, because training CNNs needs a relatively large number of input image data and parameters to be processed, Transfer Learning (TL) was introduced as a pretrained method to expedite training and advance the performance of the CNN models. TL is defined as “a machine learning method where a model developed for a task is reused as the starting point for a model on a second task, which can be used in computer vision and natural language processing aiming to transfer knowledge between related source and target domains” [
34,
35]. There are many benefits for using TL; namely, it “overcomes the deficit of training samples for some categories by adapting classifiers trained for other categories and to cope with different data distributions in the source and target domains for the same categories” [
33,
34].
In this study, we applied Convolutional Neural Network Transfer Learning (CNN-TL) to classify the resulted RQA images using: 1) AlexNet, which contains five convolutional, three fully connected, max-pooling, and dropout layers [
36]; 2) SqueezeNet, which contains two convolution layers, eight Fire Modules, and max-pooling layers [
37]; 3) VGG16 and 4) VGG19 [
38,
39], both of which contain three convolutional layers, max-pooling, and two fully-connected layers [
40]. However, the
and
stand for the number of weight layers in the network.
6. Proposed Framework and Results
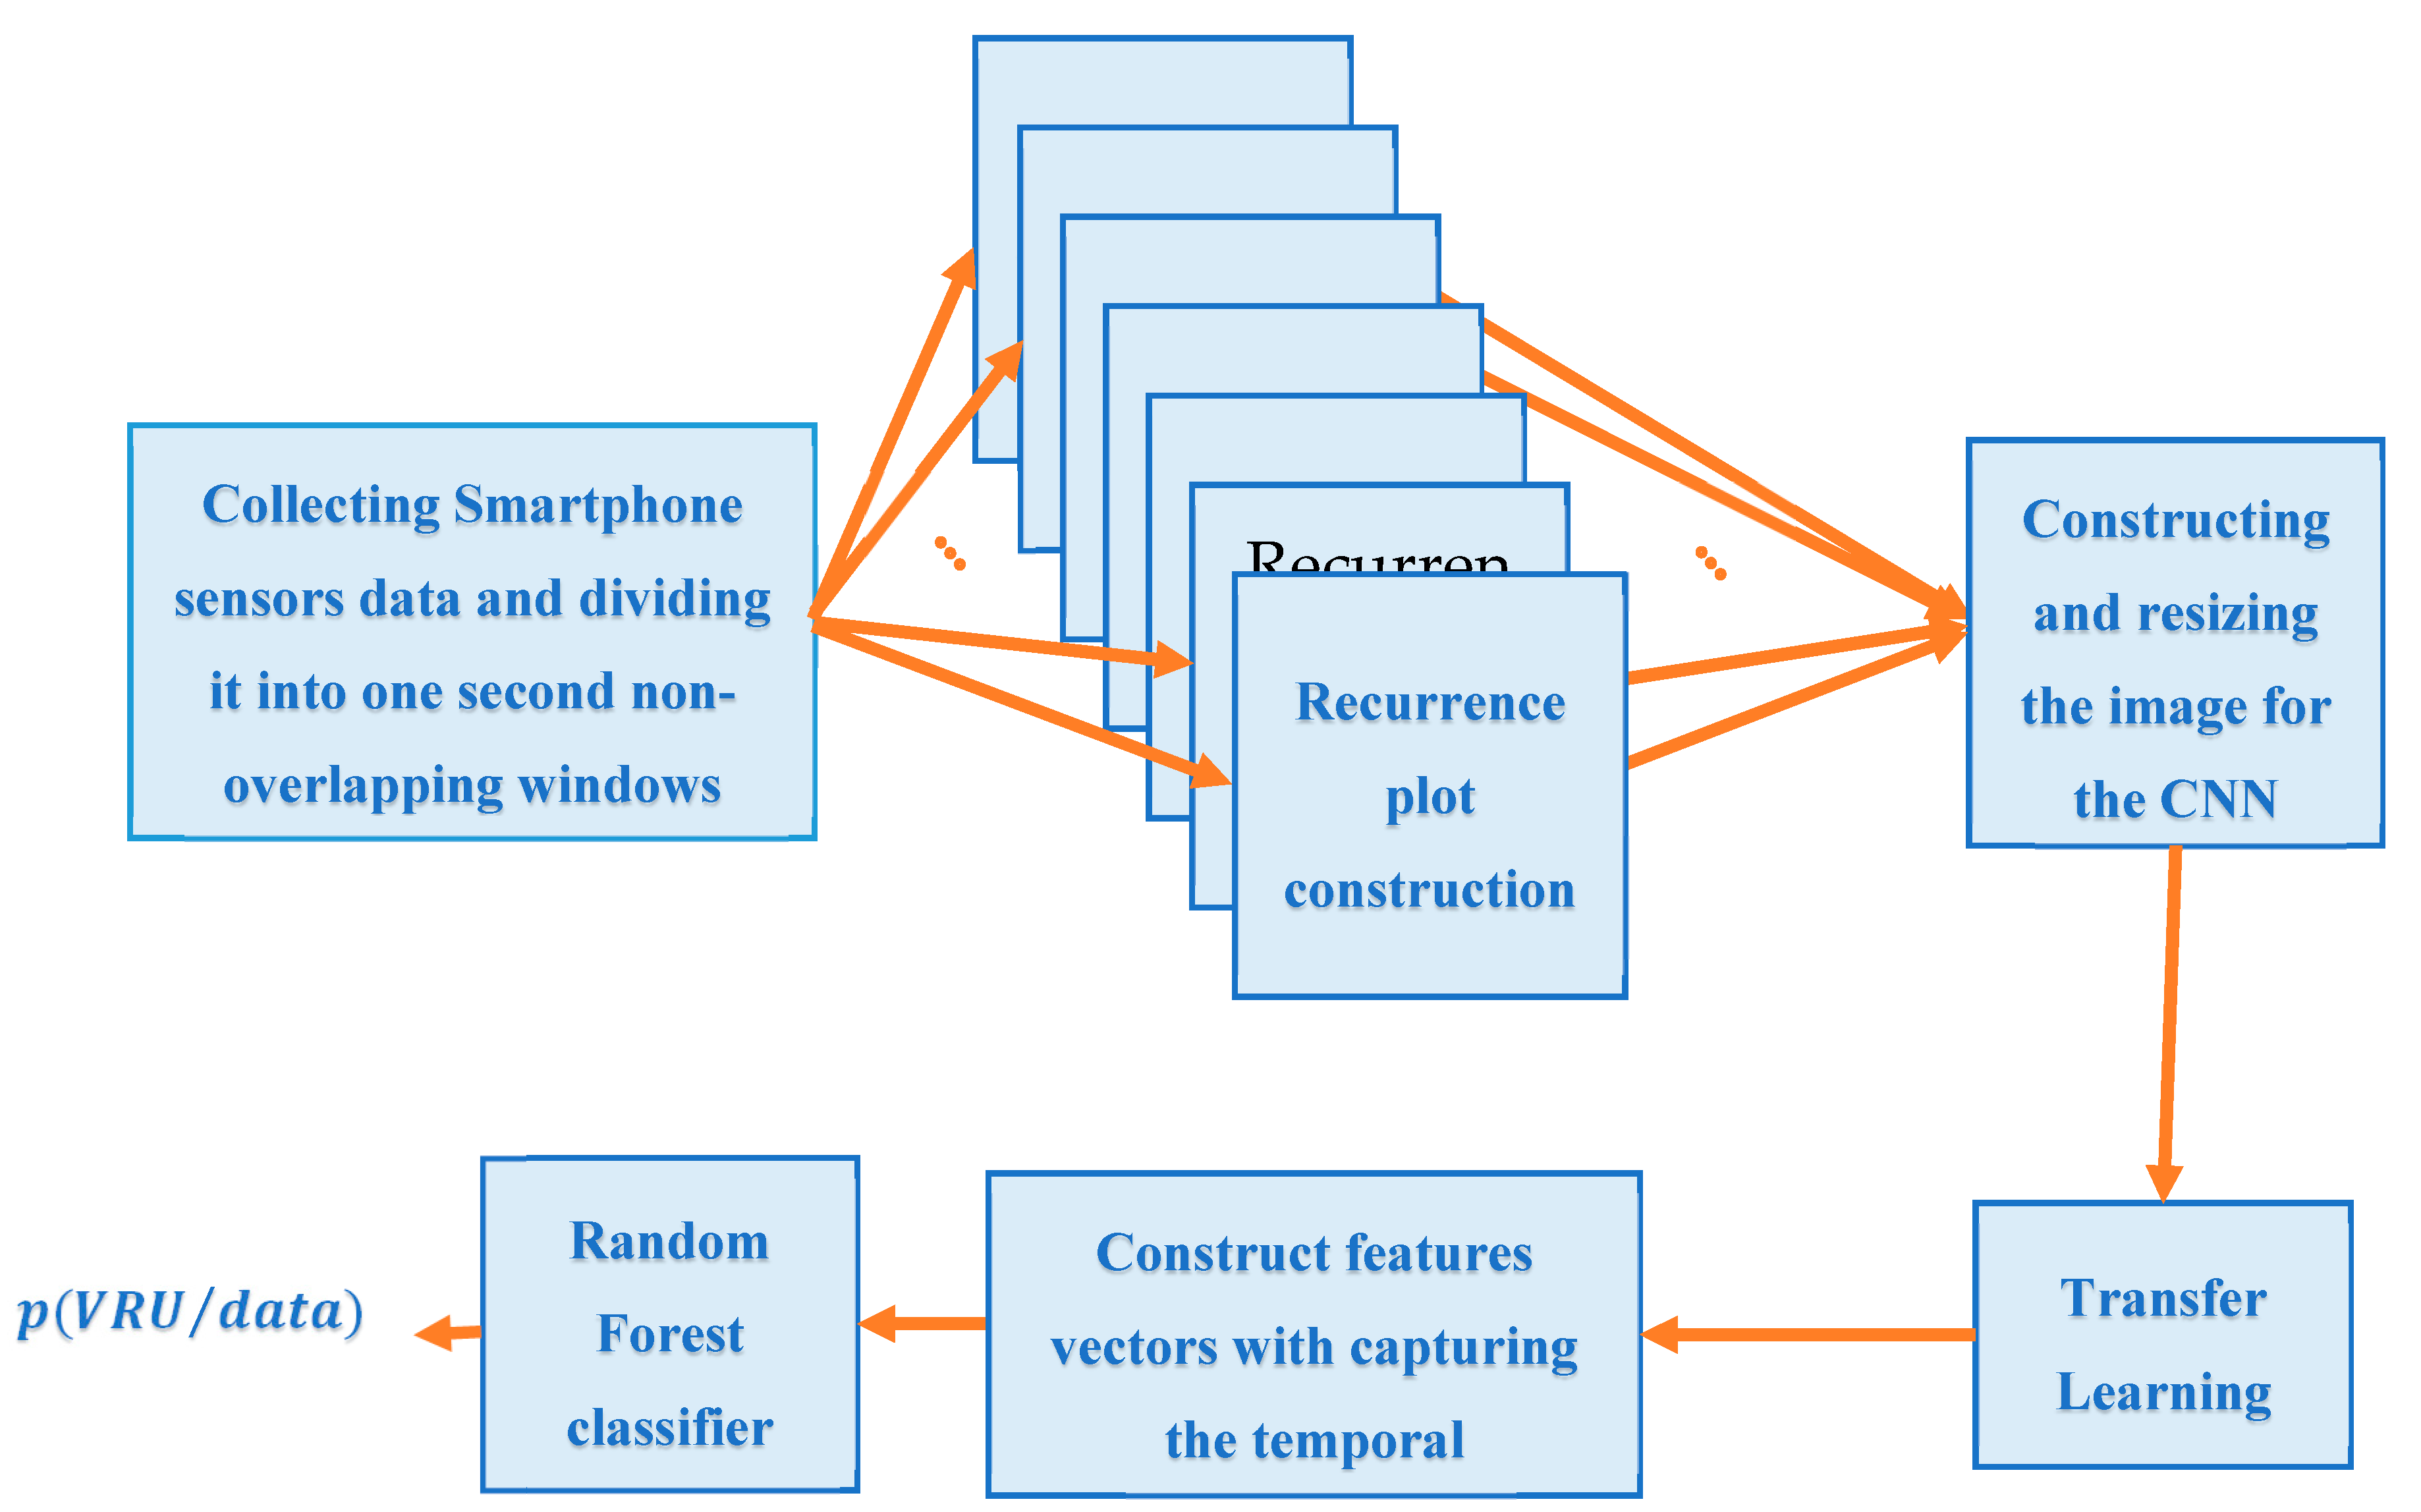
In order to use CNN-TL for classifying VRU and non-VRU, we proposed the framework for classifying VRU using CNN-TL and RF shown in
Figure 3. Following the extraction of RPs using RQA analysis, we resized and concatenated the nine resulting RPs to construct
images to be used for AlexNet and SqueezeNet, and
images to be used for VGG16,VGG19, shufflenet, and resnet101. For each CNN method, we used
of the images for training the pre-trained deep neural network using transfer learning,
of the images were used for validation, and the remaining
were used for testing. Consequently, as a key advantage of the proposed framework, we used RF with varying number of trees from
to
to capture the temporal dependencies between the consecutive non-overlapping windows (
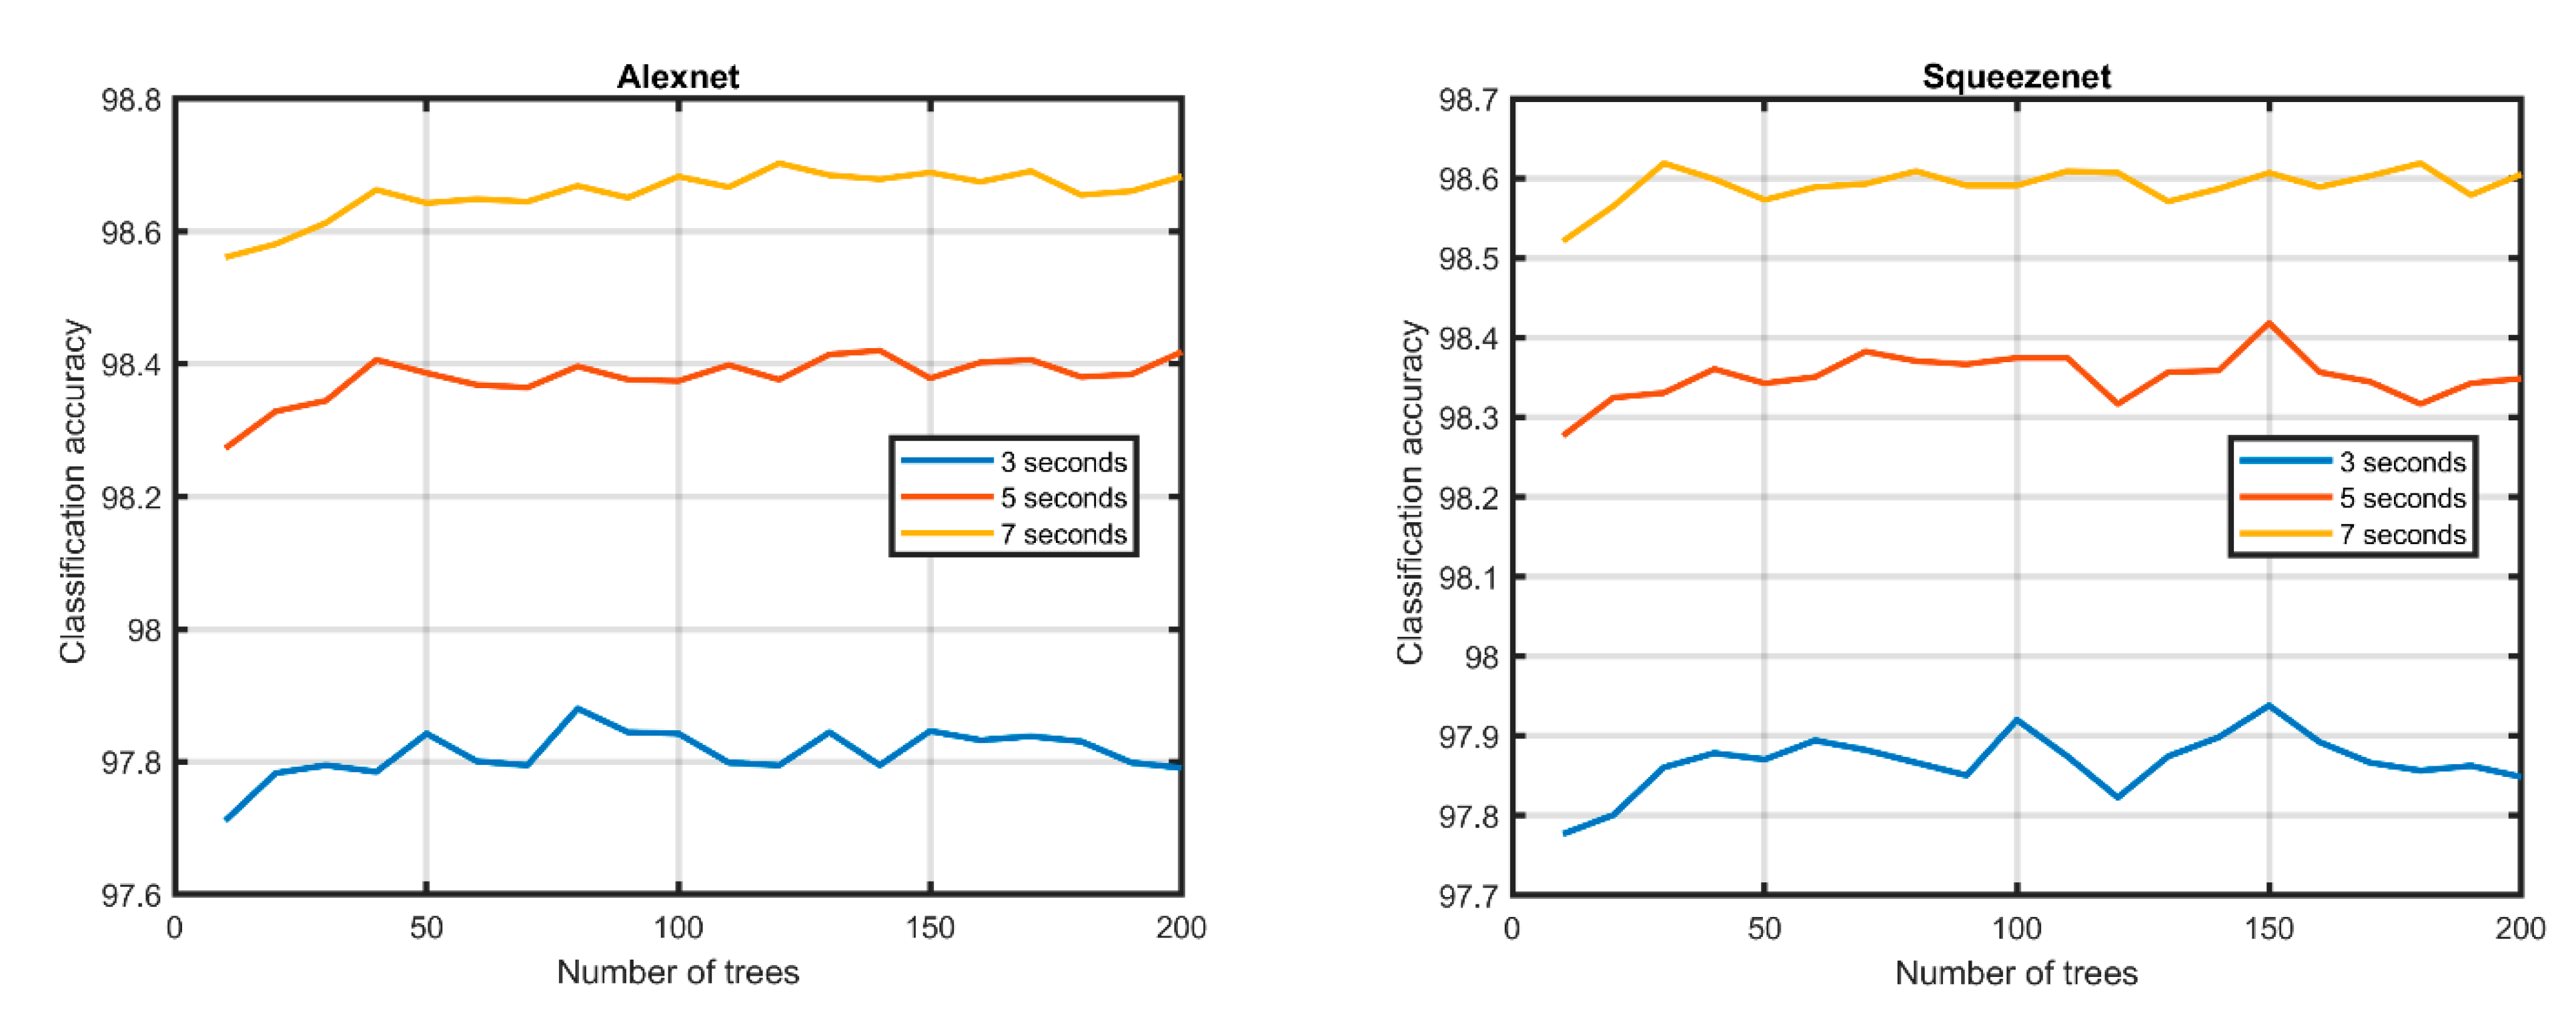
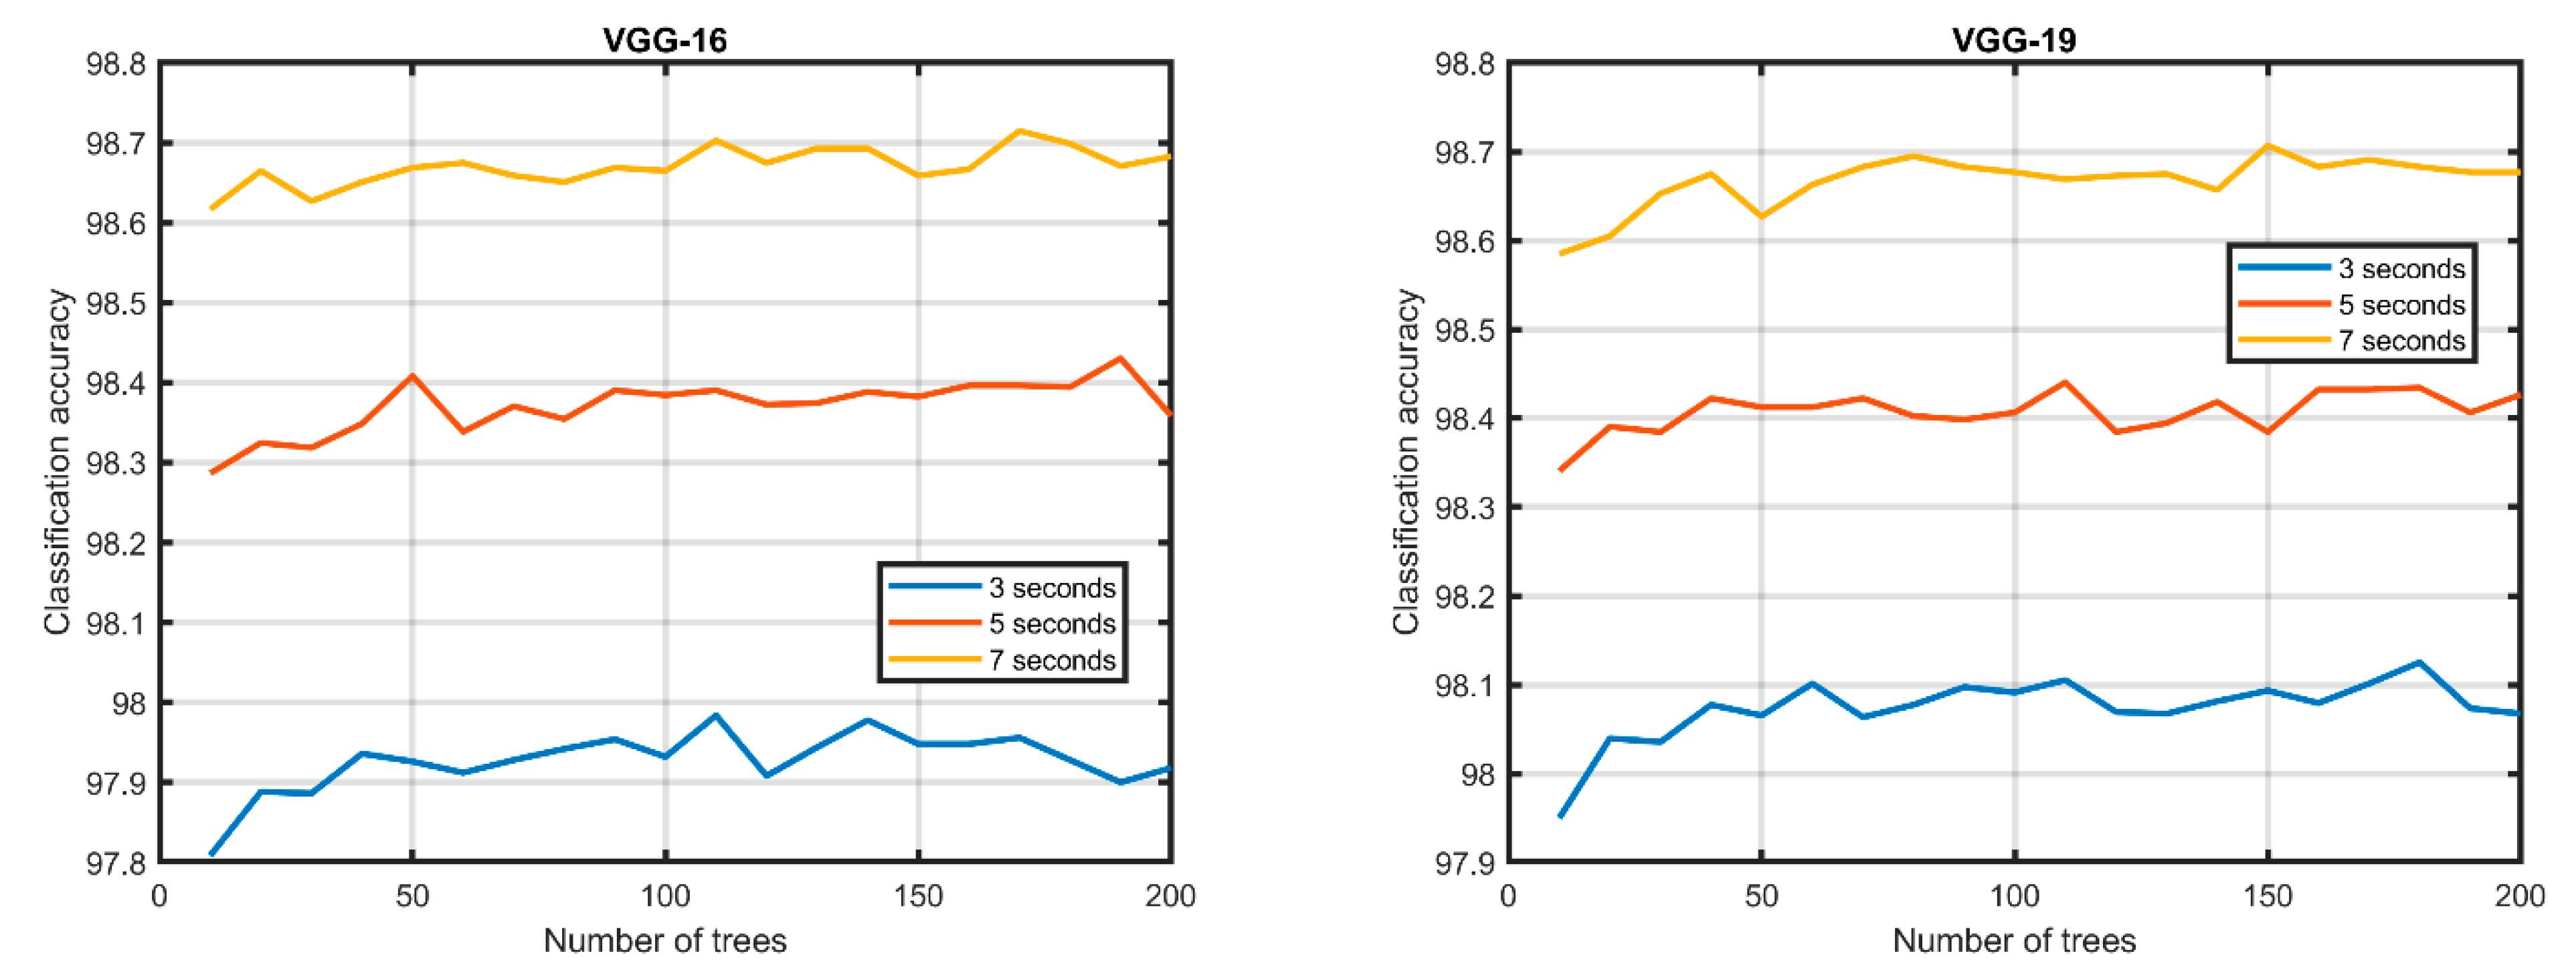
) of 1-s width and return the probability of a window/image being VRU. As this type of neural network fails to model the time dependency, RF aims to model this temporal relationship using the concatenating VRU probability of consecutive windows to form a vector of probabilities. In this study, we choose 3, 5, and 7 consecutive windows, which corresponds to 3, 5, and 7 s, respectively.
CNN-TL was trained and tested as a binary classifier (i.e., classifying whether the class is a VRU or a non-VRU). RQA images resulted from analyzing data collected using different smartphone sensors, namely: accelerometer, gyroscope, and rotation-vector. As
Figure 3 shows, the classification results reached the highest accuracy of
,
,
, and
using only seven consecutive non-overlapping windows for AlexNet, SqueezeNet, VGG16, and VGG19 respectively.
Figure 4 shows the results of the different CNN-TL methods.
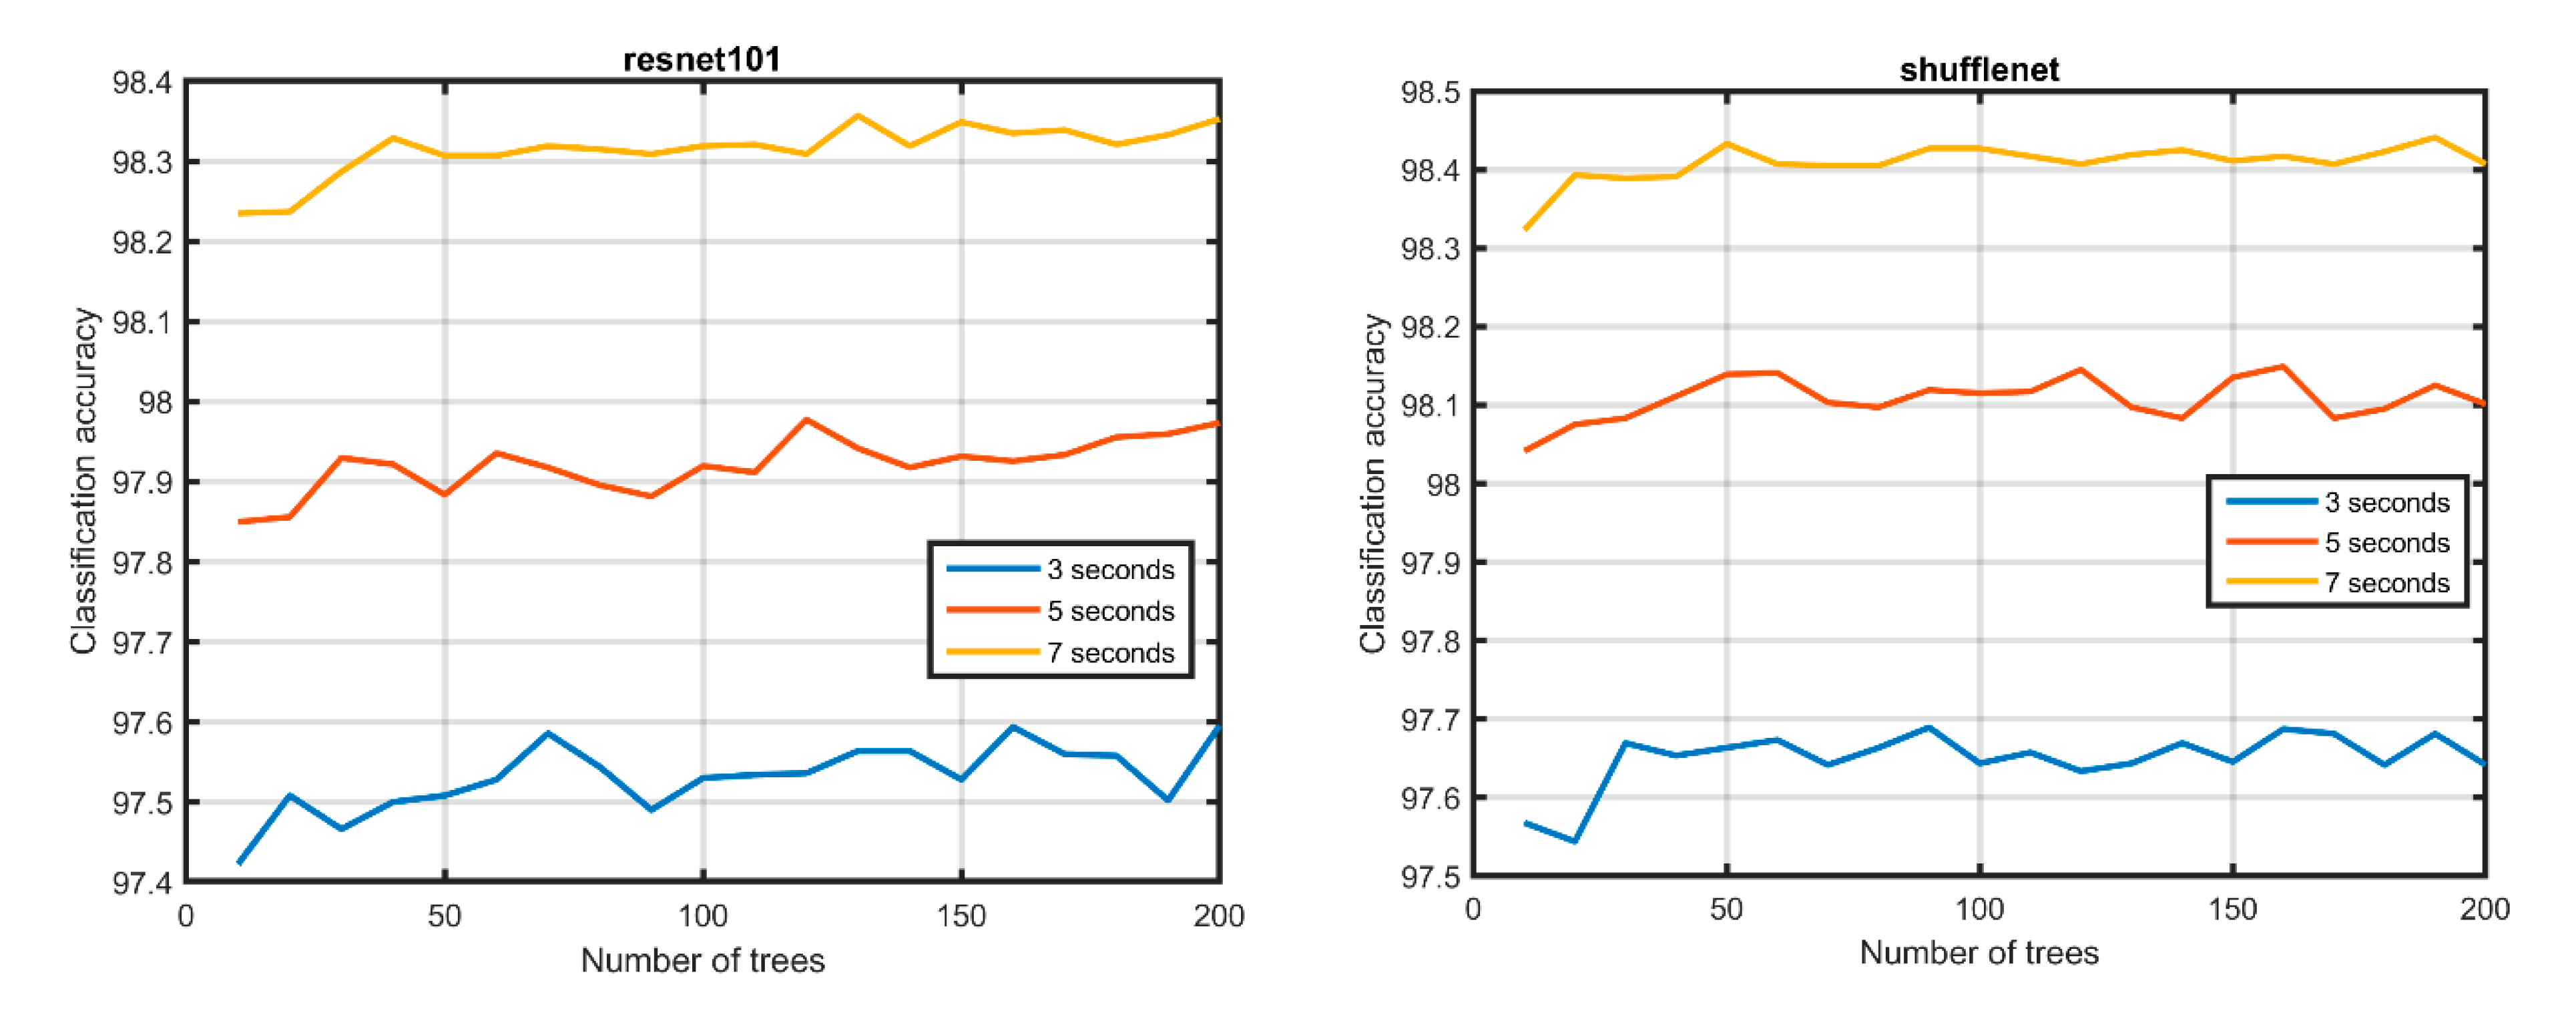
Finally, we used resnet101 and shufflenet, which are deeper networks than the previously used pre-trained networks. The two deeper networks are trained used the same data but for only one epoch, and then, the fine-tuned networks are used as weak learners where the output probabilities from both networks are fed into the RF classifier.
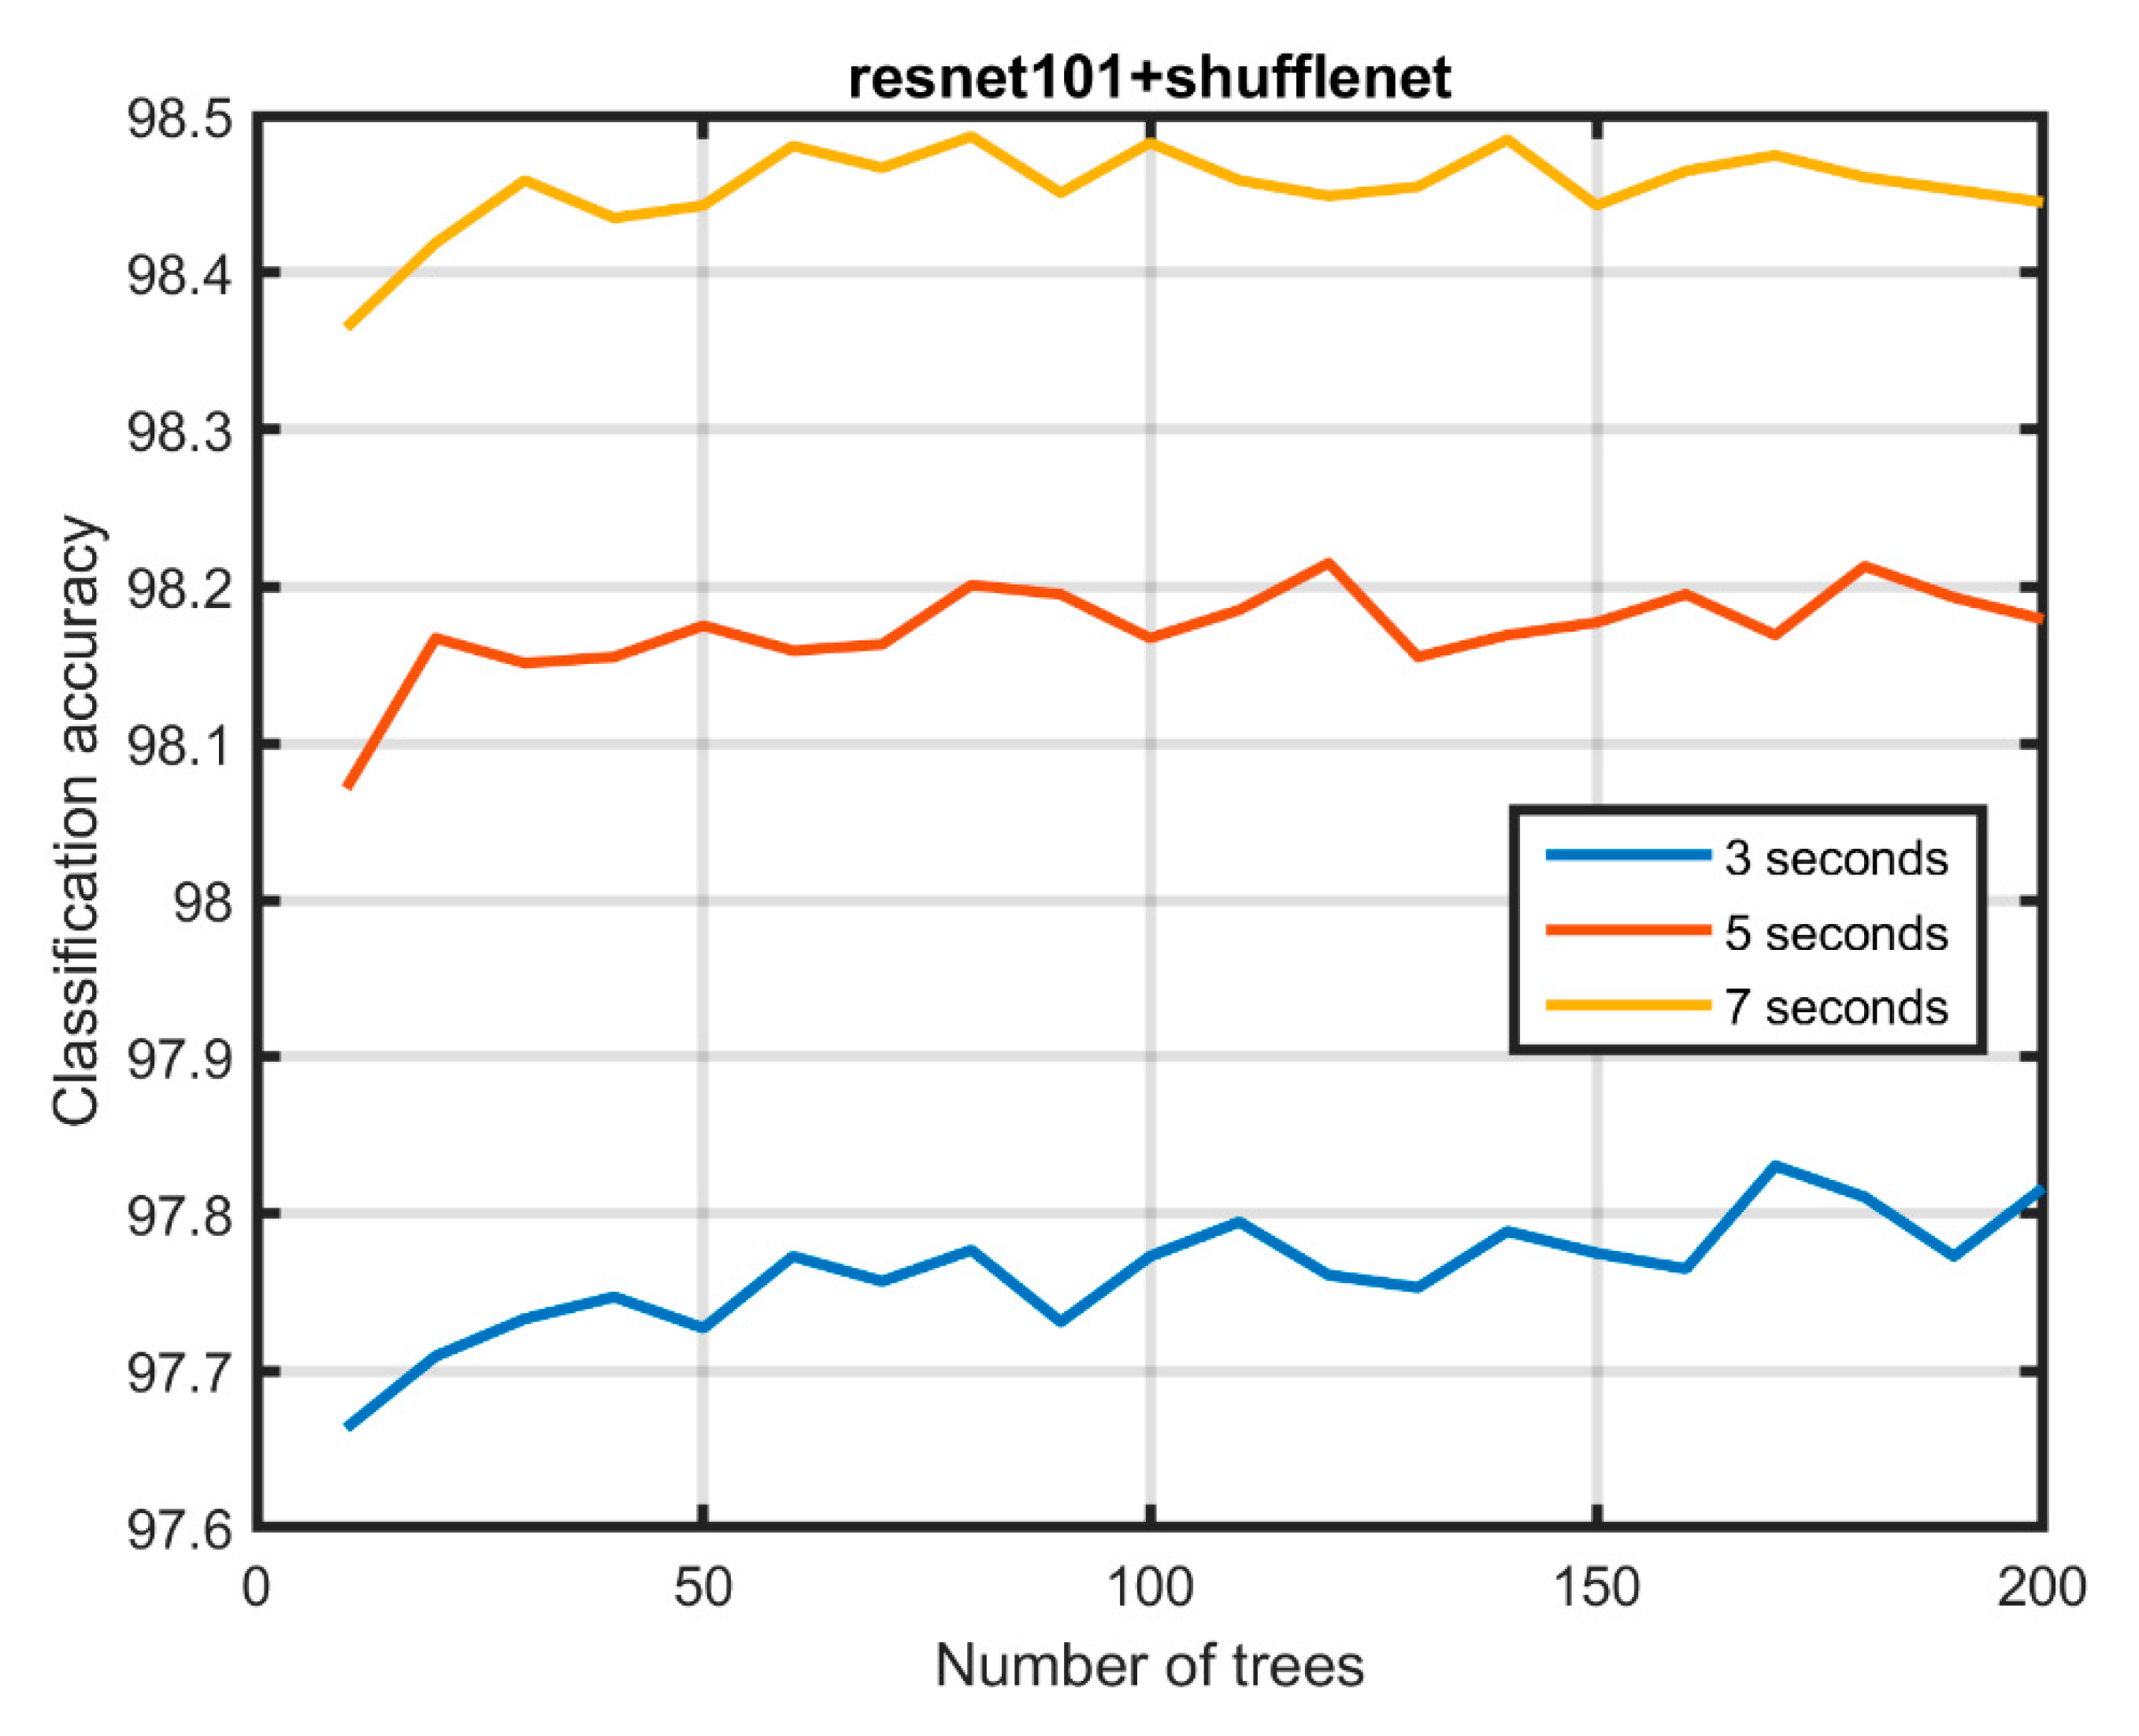
Figure 5 and
Figure 6 shows the classification accuracy of both networks after one training epoch and classification accuracy after feeding their outputs into the RF respectively.
As show in the figure above, the classification accuracy of resnet101 and shufflenet are 98.36% and 98.44% respectively. Moreover, the classification accuracy after feeding their outputs together into RF becomes 98.49%.
7. Conclusions
As the AV industry is rapidly advancing, non-motorized road user (i.e., VRUs) classification has become key to enhancing their safety in the road. In this research, by investigating the use of a novel CNN-TL image classification framework, we investigated the impact of extracted RPs, which captures the temporal evolution, on the precision of non-motorized road users’ classification. We extracted RPs using data from smartphone sensors such as gyroscope, accelerometer, and rotation vector, without GPS data (we assumed they might have some possible issues such as quickly depleting the smartphone’s battery if the service is turned on). We proposed a framework consisting of CNN-TL as a pretrained algorithm to reduce training time and increase the classification accuracy. We also applied the RF algorithm to capture the temporal relationships between non-overlapping windows. We applied different CNNs including AlexNet, SqueezeNet, VGG16, and VGG19. The classification accuracy reached 98.70%, 98.62%, 98.71%, and 98.71% using seven consecutive windows for AlexNet, SqueezeNet, VGG16, and VGG19 respectively. Moreover, we trained two resnet101 and shufflenet systems for a shorter time using one epoch of data and considered them weak learners. The outputs of the weak learners were feed into the RF for final classification.
Results of the proposed framework proved that the proposed framework is promising, and it outperformed the results in the literature. Our experimental results show that using CNN-TL applied to extracted RQA images has a significant discriminating ability for VRUs classification, which seems to not be captured using other classification algorithms. Unlike other methods, images resulted from RQA would relax the assumptions about linearity, multicollinearity, or stationarity of the data that would be required using other features. Because of its relative straightforwardness, the ability to be generalized and transferred, and its potential high accuracy, we anticipate that this framework might be able to solve various problems related to signal classification and would become a popular choice in the future.
8. Data Availability
The dataset used to support the findings of this study is owned by Virginia Tech Transportation Institute (VTTI),
https://www.vtti.vt.edu/index.html, and available upon request.
Author Contributions
Conceptualization, M.E. and H.I.A.; methodology, H.I.A. and M.E.; software, M.E. and M.M.; validation, M.E., M.M. and H.I.A.; formal analysis, M.E. and M.M.; investigation, M.E. and H.I.A.; resources, M.H.A.; data curation, M.H.A. and M.E.; writing—original draft preparation, H.I.A.; writing—review and editing, M.H.A.; visualization, M.E.; supervision, A.R. and H.A.R.; project administration, H.A.R.; funding acquisition, H.A.R. All authors have read and agreed to the published version of the manuscript.
Funding
This research received no external funding.
Acknowledgments
We acknowledge the work of Arash Jahangiri who developed the phone application to collect the data and managed the data collection activity.
Conflicts of Interest
The authors declare no conflict of interest.
References
- Saleh, K.; Hossny, M.; Nahavandi, S. Towards trusted autonomous vehicles from vulnerable road users perspective. In Proceedings of the 2017 Annual IEEE International Systems Conference (SysCon), Montreal, QC, Canada, 24–27 April 2017; pp. 1–7. [Google Scholar]
- Höfs, W.; Lappin, J.; Schagrin, M.; Cronin, B.; Resendes, R.; Hess, S.; Pincus, M.; Schade, H.J.; Sill, S.; Harding, J.; et al. International Deployment of Cooperative Intelligent Transportation Systems: Bilateral Efforts of the European Commission and United States Department of Transportation, U.S. Department of Transportation; Research and Innovative Technology Administration (RITA): Washington, DC, USA, 2012. [Google Scholar]
- Alam, M.; Ferreira, J.; Fonseca, J. Introduction to intelligent transportation systems. In Intelligent Transportation Systems; Springer: Cham, Switzerland, 2016; pp. 1–17. [Google Scholar]
- Elhenawy, M.; Bond, A.; Rakotonirainy, A. C-ITS Safety Evaluation Methodology based on Cooperative Awareness Messages. In Proceeding of the 21st International Conference on Intelligent Transportation Systems (ITSC), Maui, HI, USA, 4–7 November 2018; pp. 2471–2477. [Google Scholar]
- Anaya, J.J.; Talavera, E.; Gimenez, D.; Gomez, N.; Jiménez, F.; Naranjo, J.E. Vulnerable road users detection using v2x communications. In Proceedings of the IEEE 18th International Conference on Intelligent Transportation Systems, Las Palmas, Spain, 15–18 September 2015; pp. 107–112. [Google Scholar]
- Litman, T. Autonomous Vehicle Implementation Predictions; Victoria Transport Policy Institute: Victoria, BC, Canada, 2014. [Google Scholar]
- Papa, E.; Ferreira, A. Sustainable accessibility and the implementation of automated vehicles: Identifying critical decisions. Urban Sci. 2018, 2, 5. [Google Scholar] [CrossRef]
- SWOV. SWOV Fact Sheet: Vulnerable Road Users; SWOV Institute for Road Safety Research: Leidschendam, The Netherlands, 2012. [Google Scholar]
- Nham, B.; Siangliulue, K.; Yeung, S. Predicting Mode of Transport from iPhone Accelerometer Data; Machine Learning Final Projects; Stanford University: Stanford, CA, USA, 2008. [Google Scholar]
- Nick, T.; Coersmeier, E.; Geldmacher, J.; Goetze, J. Classifying means of transportation using mobile sensor data. In Proceedings of the 2010 International Joint Conference on Neural Networks (IJCNN), Barcelona, Spain, 18–23 July 2010; pp. 1–6. [Google Scholar]
- Ashqar, H.I.; Almannaa, M.; Elhenawy, M.; Rakha, H.A.; House, L. Smartphone transportation mode recognition using a hierarchical machine learning classifier and pooled features from time and frequency domains. IEEE Trans. Intell. Transp. Syst. 2018, 20, 244–252. [Google Scholar] [CrossRef]
- Jahangiri, A.; Rakha, H. Applying machine learning techniques to transportation mode recognition using mobile phone sensor data. IEEE Trans. Intell. Transp. Syst. 2015, 16, 2406–2417. [Google Scholar] [CrossRef]
- Xiao, Y.; Low, D.; Bandara, T.; Pathak, P.; Lim, H.B.; Goyal, D.; Santos, J.; Cottrill, C.D.; Pereira, F.; Zegras, C.; et al. Transportation activity analysis using smartphones. In Proceedings of the 2012 IEEE Consumer Communications and Networking Conference (CCNC), Las Vegas, NV, USA, 14–17 January 2012; pp. 60–61. [Google Scholar]
- Stenneth, L.; Wolfson, O.; Yu, P.S.; Xu, B. Transportation mode detection using mobile phones and GIS information. In Proceedings of the 19th ACM SIGSPATIAL International Conference on Advances in Geographic Information Systems, Chicago, IL, USA, 1–4 November 2011; pp. 54–63. [Google Scholar]
- Reddy, S.; Mun, M.; Burke, J.; Estrin, D.; Hansen, M.; Srivastava, M. Using mobile phones to determine transportation modes. ACM Trans. Sens. Netw. 2010, 6, 13. [Google Scholar] [CrossRef]
- Manzoni, V.; Maniloff, D.; Kloeckl, K.; Ratti, C. Transportation Mode Identification and Real-Time CO2 Emission Estimation Using Smartphones; Technical Report; Massachusetts Institute of Technology: Cambridge, MA, USA, 2010. [Google Scholar]
- Zheng, Y.; Liu, L.; Wang, L.; Xie, X. Learning transportation mode from raw gps data for geographic applications on the web. In Proceedings of the 17th International Conference on World Wide Web, Beijing, China, 21–25 April 2008; pp. 247–256. [Google Scholar]
- Widhalm, P.; Nitsche, P.; Brändie, N. Transport mode detection with realistic Smartphone sensor data. In Proceedings of the 2012 21st International Conference on Pattern Recognition (ICPR 2012), Tsukuba, Japan, 11–15 November 2012; pp. 573–576. [Google Scholar]
- Elhenawy, M.; Jahangiri, A.; Rakha, H.A. Smartphone Transportation Mode Recognition using a Hierarchical Machine Learning Classifier. In Proceedings of the 23rd ITS World Congress, Melbourne, Australia, 10–14 October 2016. [Google Scholar]
- Biljecki, F.; LeDoux, H.; Van Oosterom, P. Transportation mode-based segmentation and classification of movement trajectories. Int. J. Geogr. Inf. Sci. 2013, 27, 385–407. [Google Scholar] [CrossRef]
- Zadeh, R.B.; Ghatee, M.; Eftekhari, H.R. Three-phases smartphone-based warning system to protect vulnerable road users under fuzzy conditions. EEE Trans. Intell. Transp. Syst. 2018, 19, 2086–2098. [Google Scholar] [CrossRef]
- Fardi, B.; Douša, J.; Wanielik, G.; Elias, B.; Barke, A. Obstacle detection and pedestrian recognition using a 3D PMD camera. In Proceedings of the 2006 IEEE Intelligent Vehicles Symposium, Tokyo, Japan, 13–15 June 2006; pp. 225–230. [Google Scholar]
- Gavrila, D.M.; Kunert, M.; Lages, U. A multi-sensor approach for the protection of vulnerable traffic participants the PROTECTOR project. In Proceedings of the 18th IEEE Instrumentation and Measurement Technology Conference, Budapest, Hungary, 21–23 May 2001; Volume 3, pp. 2044–2048. [Google Scholar]
- Ashqar, H.I.; Elhenawy, M.; Masoud, M.; Rakotonirainy, A.; Rakha, H.A. Vulnerable Road User Detection Using Smartphone Sensors and Recurrence Quantification Analysis. In Proceedings of the 2019 IEEE Intelligent Transportation Systems Conference (ITSC), Auckland, New Zealand, 27–30 October 2019; pp. 1054–1059. [Google Scholar]
- Eckmann, J.-P.; Kamphorst, S.O.; Ruelle, D. Recurrence plots of dynamical systems. World Sci. Ser. Nonlinear Sci. Ser. A 1995, 16, 441–446. [Google Scholar]
- Librizzi, L.; Noè, F.; Vezzani, A.; De Curtis, M.; Ravizza, T.L. Seizure-induced brain-borne inflammation sustains seizure recurrence and blood-brain barrier damage. Ann. Neurol. 2012, 72, 82–90. [Google Scholar] [CrossRef] [PubMed]
- Roma, G.; Nogueira, W.; Herrera, P.; de Boronat, R. Recurrence quantification analysis features for auditory scene classification. IEEE AASP Chall. Detect. Classif. Acoust. Scenes Events 2013, 2, 1–2. [Google Scholar]
- Silva, L.; Vaz, J.R.; Castro, M.A.; Serranho, P.; Cabri, J.; Pezarat-Correia, P. Recurrence quantification analysis and support vector machines for golf handicap and low back pain EMG classification. J. Electromyogr. Kinesiol. 2015, 25, 637–647. [Google Scholar] [CrossRef] [PubMed]
- Webber, C.L., Jr.; Marwan, N. Recurrence Quantification Analysis: Theory and Best Practices; Springer: Cham, Switzerland, 2015. [Google Scholar]
- Yang, H. Multiscale recurrence quantification analysis of spatial cardiac vectorcardiogram signals. IEEE Trans. Biomed. Eng. 2011, 58, 339–347. [Google Scholar] [CrossRef] [PubMed]
- Zbilut, J.; Thomasson, N.; Webber, C.L. Recurrence quantification analysis as a tool for nonlinear exploration of nonstationary cardiac signals. Med. Eng. Phys. 2002, 24, 53–60. [Google Scholar] [CrossRef]
- Acharya, U.R.; Sree, S.V.; Swapna, G.; Martis, R.J.; Suri, J.S. Automated EEG analysis of epilepsy: A review. Knowledge-Based Syst. 2013, 45, 147–165. [Google Scholar] [CrossRef]
- Shin, H.-C.; Roth, H.R.; Gao, M.; Lu, L.; Xu, Z.; Nogues, I.; Yao, J.; Mollura, D.; Summers, R.M. Deep convolutional neural networks for computer-aided detection: CNN architectures, dataset characteristics and transfer learning. IEEE Trans. Med Imaging 2016, 35, 1285–1298. [Google Scholar] [CrossRef] [PubMed]
- Pan, S.J.; Yang, Q. A Survey on Transfer Learning. IEEE Trans. Knowl. Data Eng. 2010, 22, 1345–1359. [Google Scholar] [CrossRef]
- Weiss, K.; Khoshgoftaar, T.M.; Wang, D. A survey of transfer learning. J. Big Data 2016, 3, 9. [Google Scholar] [CrossRef]
- Krizhevsky, A.; Sutskever, I.; Hinton, G.E. Imagenet classification with deep convolutional neural networks. In Proceedings of the 26th Annual Conference on Neural Information Processing Systems (NIPS), Lake Tahoe, NV, USA, 3–8 December 2012; pp. 1097–1105. [Google Scholar]
- Iandola, F.N.; Han, S.; Moskewicz, M.W.; Ashraf, K.; Dally, W.J.; Keutzer, K. SqueezeNet: AlexNet-level accuracy with 50× fewer parameters and <0.5 MB model size. arXiv 2016, arXiv:1602.07360. [Google Scholar]
- Simonyan, K.; Zisserman, A. Very deep convolutional networks for large-scale image recognition. arXiv 2014, arXiv:1409.1556. [Google Scholar]
- Rasti, B.; Hong, D.; Hang, R.; Ghamisi, P.; Kang, X.; Chanussot, J.; Benediktsson, J.A. Feature Extraction for Hyperspectral Imagery: The Evolution from Shallow to Deep (Overview and Toolbox). IEEE Geosci. Remote Sens. Mag. 2020. [Google Scholar] [CrossRef]
- Elhenawy, M.; Glaser, S.; Bond, A.; Rakotonirainy, A.; Demmel, S.; Masoud, M. A framework for testing independence between lane change and cooperative intelligent transportation system. PLoS ONE 2020, 15, e0229289. [Google Scholar] [CrossRef] [PubMed]
| Publisher’s Note: MDPI stays neutral with regard to jurisdictional claims in published maps and institutional affiliations. |
© 2020 by the authors. Licensee MDPI, Basel, Switzerland. This article is an open access article distributed under the terms and conditions of the Creative Commons Attribution (CC BY) license (http://creativecommons.org/licenses/by/4.0/).

