Article

Spatio-Temporal Characteristics of PM2.5, PM10, and AOD over Canal Head Taocha Station, Henan Province

1
School of Environmental Science and Tourism, Nanyang Normal University, Nan Yang 473061, China
2
International Joint Laboratory of Watershed Ecological Security and Collaborative Innovation Center of Water Security for Water Source Region of Middle Route Project of South-North Water Diversion in Henan Province, College of Agricultural Engineering, Nanyang Normal University, Nanyang 473061, China
3
School of Earth Sciences and Engineering, Hohai University, Nanjing 210098, China
4
School of Marine Sciences, Nanjing University of Information Science & Technology, Nanjing 210444, China
5
Ecological Complexity and Modelling Laboratory, Department of Botany and Plant Sciences, University of California, Riverside, CA 92521-0124, USA
*
Author to whom correspondence should be addressed.
Authors with equal contributions.
Remote Sens. 2020, 12(20), 3432; https://doi.org/10.3390/rs12203432
Submission received: 15 September 2020 / Revised: 13 October 2020 / Accepted: 14 October 2020 / Published: 19 October 2020

Abstract

:
In this study, spatio-temporal characteristics of particulate matter (PMx; x = 2.5 and 10) mass concentrations and aerosol optical properties were analyzed over the water source area of the South–North Water Diversion Central Line. For this purpose, PM2.5 and PM10 mass concentrations were collected at the Taocha(TC)station from October 2018 to September 2019, and aerosol optical depth (AOD) was obtained from the Cloud-Aerosol LiDAR and Infrared Pathfinder Satellite Observation (CALIPSO) satellite from 2007 to 2019. The monthly, seasonal, and daily statistical analyses and related comparisons were conducted in the present study. The results showed that the PM10 concentrations meet China’s ambient air secondary quality standard (100 μg/m3 annual mean), whereas PM2.5 did not meet China’s ambient air secondary quality standard (35 μg/m3 annual mean) at the TC station, no obvious seasonal and diurnal variations are observed, and these particulates are caused by local emissions and outside sources. A significant positive correlation of PM2.5 and PM10 was observed with relative humidity and temperature, whereas no relationship was found with wind direction. The results also showed low (~0.1) AOD in spring, autumn, and winter, whereas slightly higher AOD (~0.3) was observed in summer. This may be caused by straw burning from long-distance transportation. This study may provide new data support for comprehensive ecological measures such as strengthening the ecological environment and water quality protection in the Middle Route Project of the South–North Water Diversion.

Graphical Abstract

1. Introduction

Atmospheric aerosols are solid or liquid or mixed particles suspended in the air with diameters in the range of 0.001–100 µm, while particles with diameters less than 0.1 µm are commonly referred to as ultrafine [1,2,3,4,5,6,7,8,9]. It is an important part of the Earth’s atmospheric environment and it has a great influence on atmospheric visibility, atmospheric radiation, surface temperature, and so on [10]. The atmospheric aerosol can affect the balance of atmospheric radiation through scattering and absorption of sunlight; it can also indirectly affect the radiation by changing the cloud life cycle acting as a cloud condensation nucleus [11,12]. Fine particulate matter (PM2.5: tiny particles with an aerodynamic diameter less than 2.5 μm) and coarse particulate matter (PM10: particles with an aerodynamic diameter less than 10 μm) can enter the human body through the respiratory system and are responsible for human diseases such as lung cancer, asthma, etc. [13,14,15,16,17,18]. Fine particles (such as PM2.5) can enter the lungs through the respiratory tract and be deposited on the alveoli; these fine particles carry a large number of bacteria, viruses, and harmful toxic substances, aggravating the health of patients with respiratory diseases and cardiovascular diseases [19]. Previous studies reported that high PM10 concentration can greatly increase the rates of cancer, pneumonia, and other diseases [20,21,22]. With the rapid development of China’s industrialization in recent years, the air pollution problem has become a serious problem and has greatly affected human health [23,24,25,26]. In particular, high concentrations of PM2.5 and PM10 have become the main causes of environmental pollution in China [27]. Therefore, the study of the spatio-temporal characteristics of PM2.5 and PM10 particles will help researchers to better understand the properties of air pollution and provide a theoretical basis for air pollution control.
Since 2011, with the grave situation of environmental problems in the Beijing–Tianjin–Hebei urban area [28,29], the North China Plain [30,31], Yangtze River Delta [32,33,34], and Pearl River Delta [35,36]. The environmental protection department and researchers have carried out a series of monitoring works on PM2.5 and PM10 by establishing ground-based air quality monitoring stations for studying the distribution and variation in the physical, chemical, and optical characteristics of PM2.5 and PM10.
Nanyang City is located at the link between the North China Plain and the Jianghan Plain, which is an ideal location in China for observing the phenomenon of trans-regional transport of atmospheric aerosols. At the same time, Nanyang City is also the starting point of the Middle Route Project of the“South-North Water Diversion” [37,38]. The Danjiangkou Reservoir in Taocha Town transports water northward to Beijing, Tianjin, and perimeter zones to solve the problem of water shortage in northern China [39]. Therefore, the ecological and environmental condition of the water source in the water resource district is the most important thing to ensure the quality of water delivery. The current environmental research on the water resource district is mainly focused on water and soil, but the study of the atmospheric environment, especially PM2.5 and PM10, has not been conducted to our knowledge. Research on atmospheric pollutants in the water resource district is a particularly urgent method to ensure green water diversion, while the quality of the atmospheric environment in the water source area is an important part of the ecological environment. Therefore, the objectives of this study are to analyze spatio-temporal variation patterns of PM2.5 and PM10 mass concentrations, and their relationships with meteorological factors at the Taocha station (TC, N: 32°40’32’’; E: 110°43’2’’) in the Central Water Resources Area (CWRA). This study can help researchers to understand the characteristics of atmospheric particulate matter in the CWRA and can provide a scientific basis and new data support for comprehensive atmospheric control and prevention in the CWRA.

2. Experimental Areas and Methods
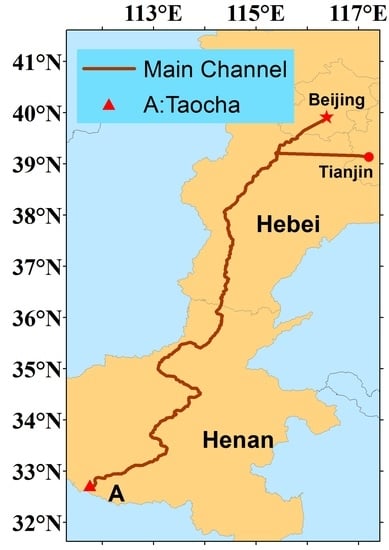
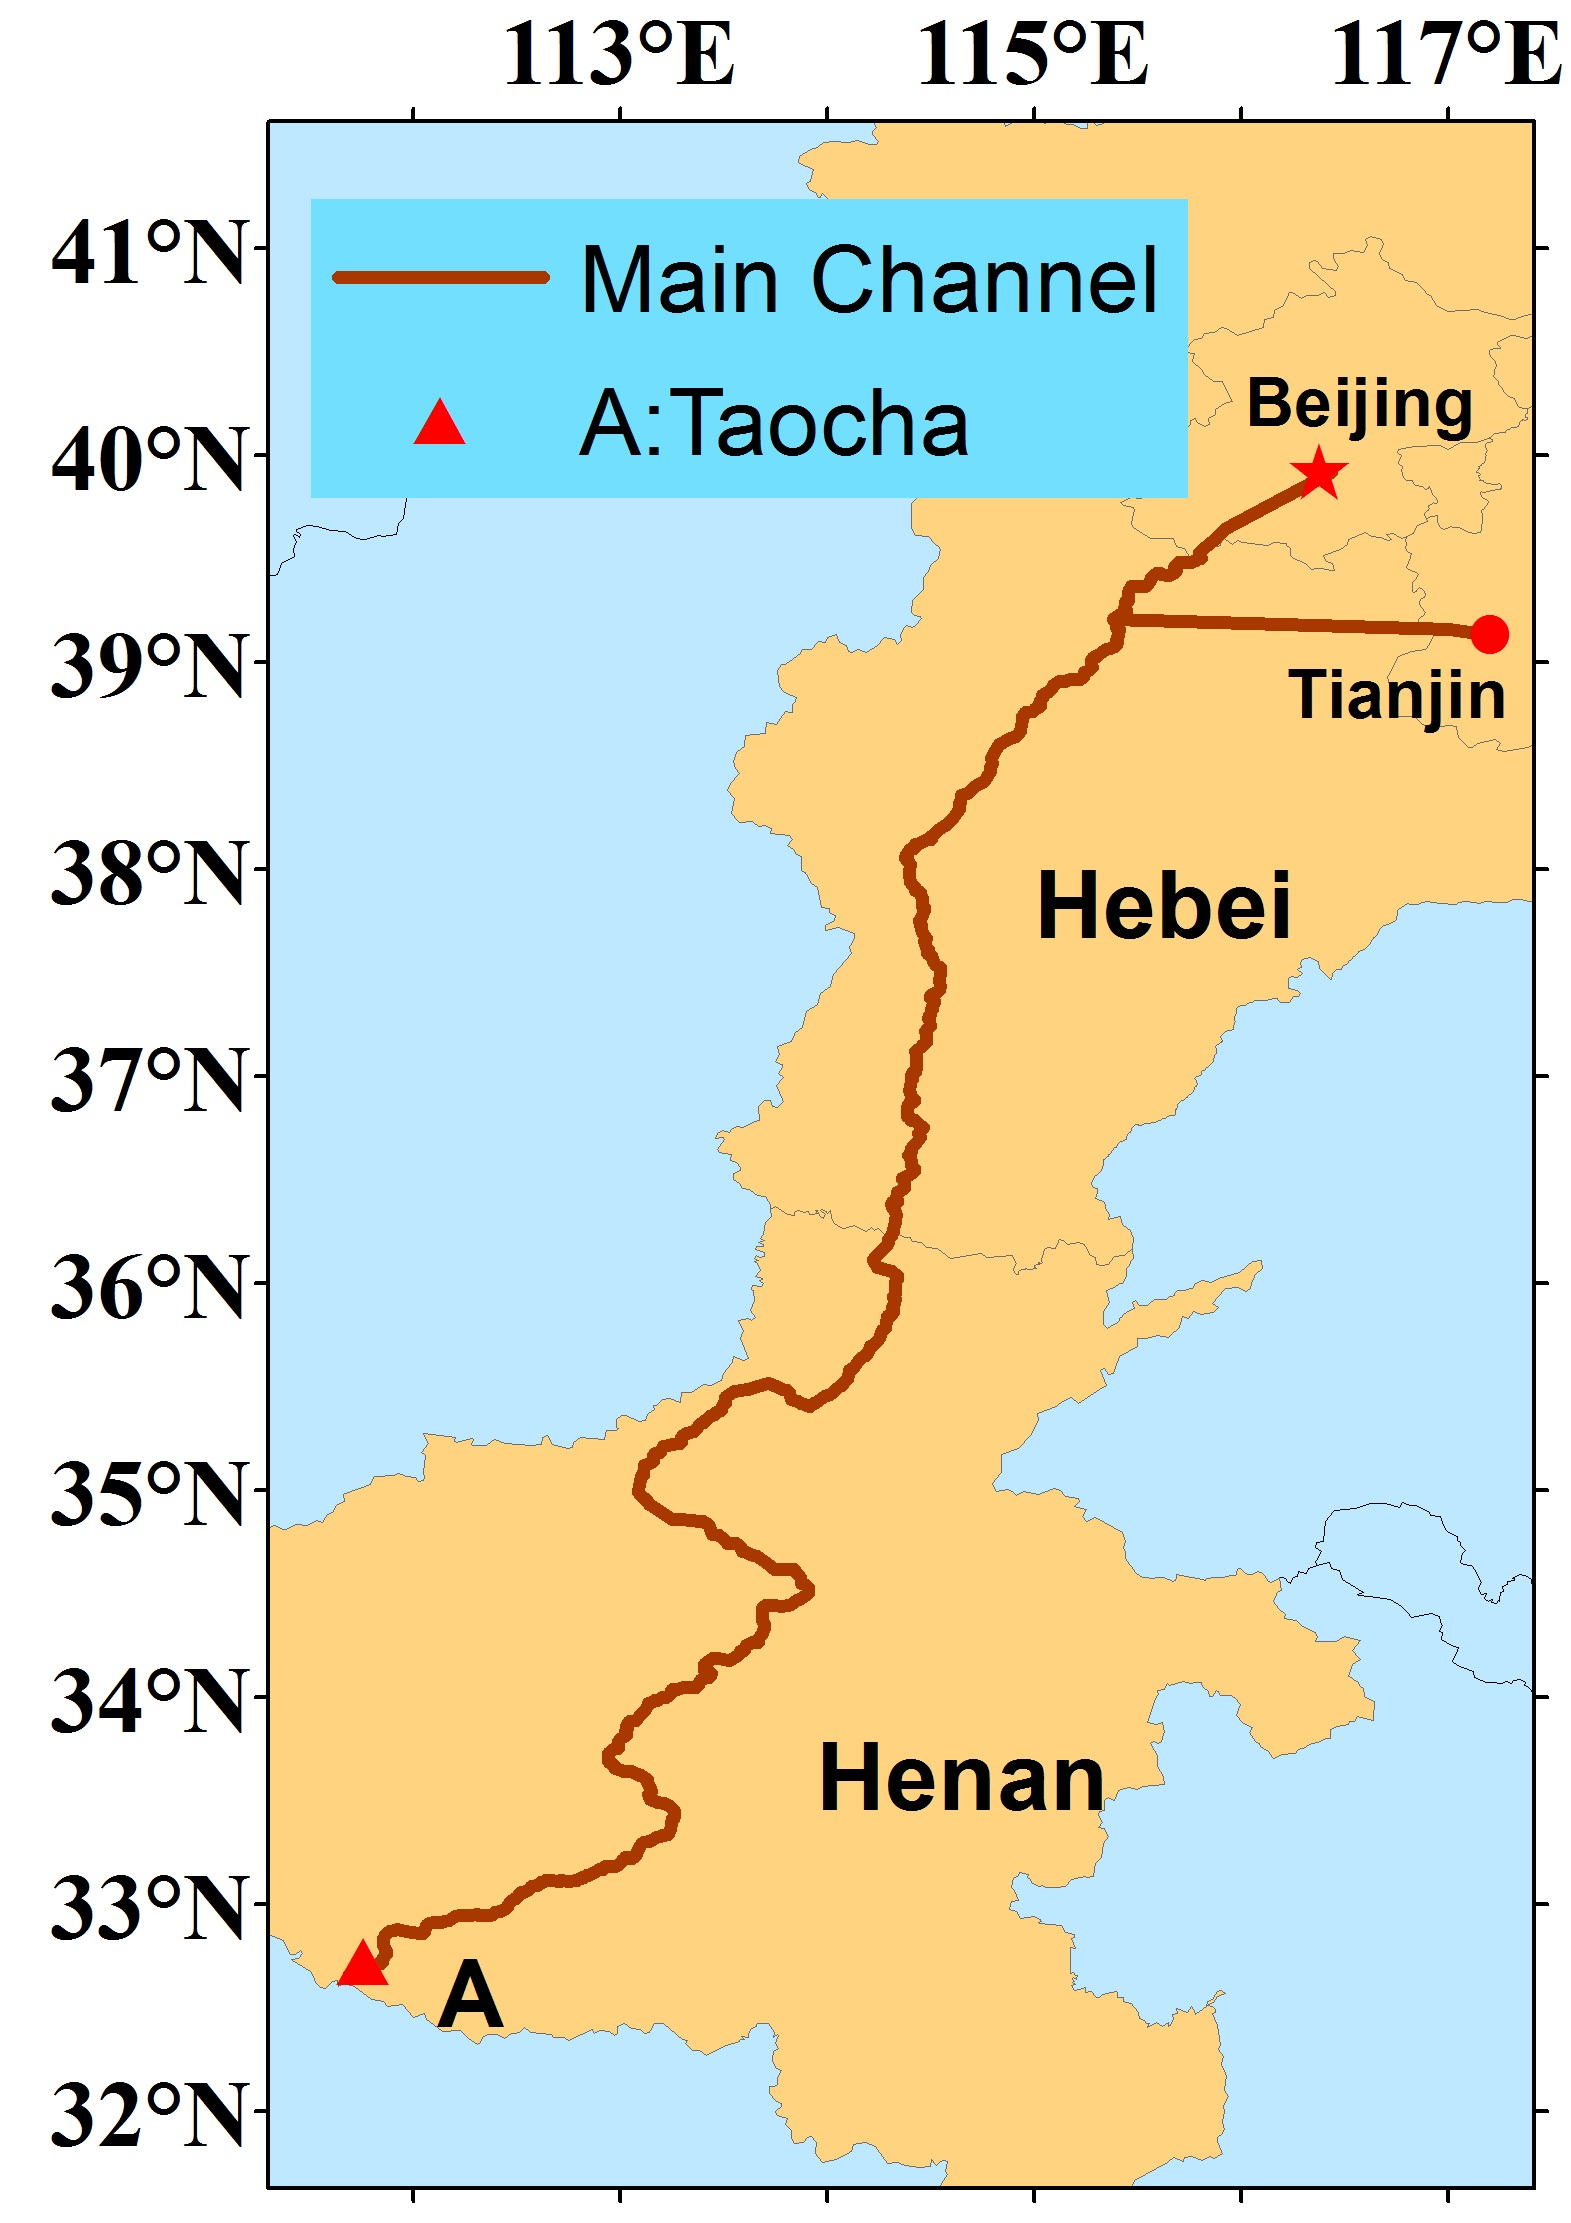
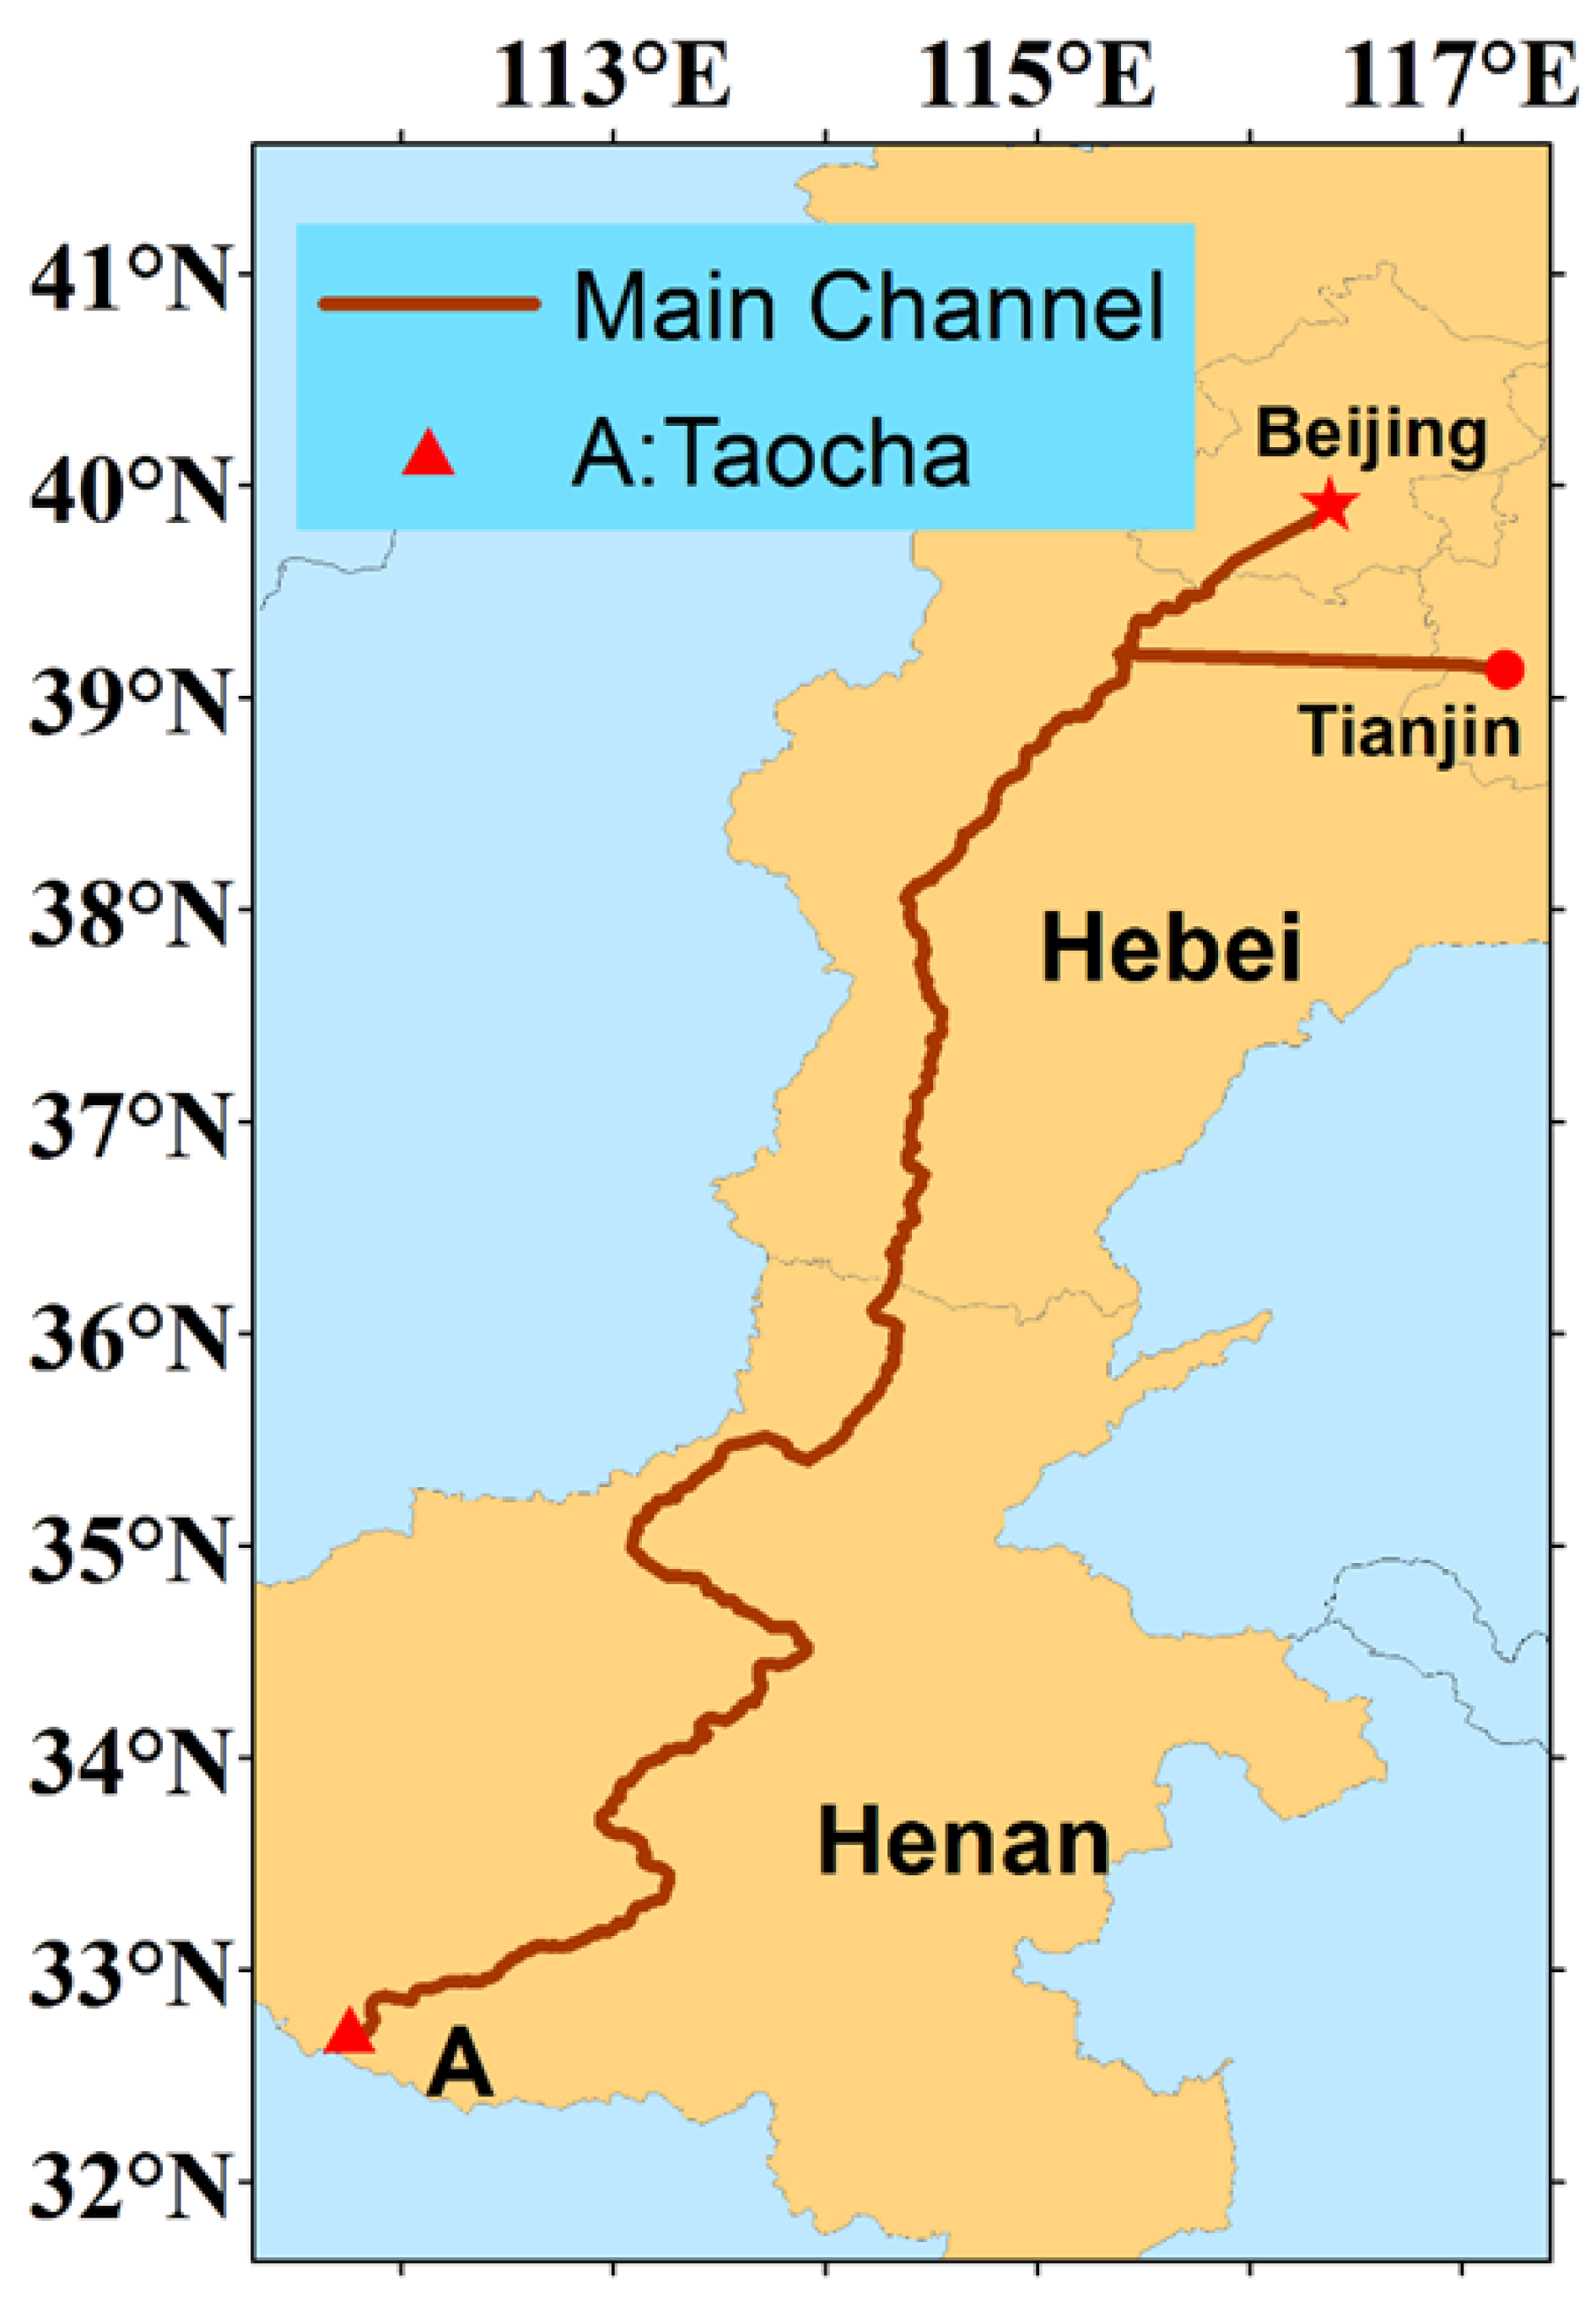
2.1. Study Area

The South–North Diversion Central Canal starts from the Taocha(TC) station, and the canal is 731 km long in the Henan province (Figure 1). The TC site is located in the TC administrative village under the jurisdiction of Nanyang city, Henan province. The TC village is located at the junction of Henan and Hubei province on the east bank of the Danjiangkou Reservoir. The Danjiangkou Reservoir is the largest artificial freshwater lake in Asia, which is between Tang mountain, Yu mountain, and Xing mountain. It spans the Yangtze River, Huai River, Yellow River, and Hai River. The region is a transition zone from subtropical climate (Nanyang City) to warm temperate climate (Anyang City), characterized by four distinct seasons, simultaneous rain and heat. The average annual temperature from north to south is 10.5 to 16.7 °C, the average annual precipitation is 407.7 to 1295.8 mm, the rainfall is greatest in June to August, the average annual sunshine is 1285.7 to 2292.9 hours, and the annual frost-free period is 201 to 285 d [37]. Due to TC station is located on the banks of the Danjiangkou reservoir, it has wet winter and dry summer seasons. According to the comprehensive ecological status, administrative division, and research objectives, a typical atmospheric monitoring station was set up on the right bank of the dam outlet at the TC station (111°43′2″E and 32°40′32″N). The geographical location of TC may play an important role in air quality conditions as TC is a suburban area far from the industrial zone and large highway, so it is affected by industrial as well as automobile emissions.

2.2. Methods

The instrument, the PC-8Z Atmospheric Grid Monitoring System, adopts the integrated air micro-station developed by Sunshine Company and connects to the Sunshine Intelligent Cloud Platform to perform the atmospheric grid monitoring. The instrument module automatically monitors the ambient temperature, ambient humidity, wind direction and speed, atmospheric pressure, fine particulate matter PM2.5 (particle size less than or equal to 2.5 μm) concentrations, respirable particulate matter PM10 (particle size less than or equal to 10 μm) concentrations, and the monitored datasets are automatically connected and stored to the cloud platform. The TC atmospheric monitoring instruments were installed in the scientific location based on its geographic characteristics, located on the right bank of the dam open area without tall buildings around. The monitoring period is from October 2018 to September 2019. Due to the installation, commissioning, and trial operation of the instrument during the period September‒October 2018, some data were missing. The temporal resolution of the datasets is 0.5 h. In this study, daily, monthly, and seasonal analyses were conducted. The seasons are defined as spring (March to May), summer (June to August), autumn (September to November), and winter (December to February).
On the other hand, we also used Cloud-Aerosol LiDAR and Infrared Pathfinder Satellite Observation (CALIPSO)aerosol optical depth (AOD) data to investigate the aerosol optical properties in the TC site. The CALIPSO satellite was launched on 28 April 2006, which is part of the “A-train” constellation with a repeat cycle of 16 days. The Cloud-Aerosol Lidar with Orthogonal Polarization (CALIOP), a type of double wavelength orthogonal polarization elastic backscatter lidar, is carried on CALIPSO. Its working wavelengths are 532 nm and 1064 nm, and the 532 nm wavelength is equipped with a polarized channel. CALIOP can work continuously on a global scale to provide high temporal–spatial resolution information on clouds and aerosols. CALIPSO level 2 layer data were obtained using an automatic layer detection algorithm. The level 2 aerosol layer products had a horizontal resolution of 5 km and described the spatial position and the classification information of aerosol layers such as aerosol subclasses. Level 2 aerosol layer products mainly provided the vertical layer information for backscatter, polarization, and extinction coefficients of the feature layer. In this study, level 2 aerosol products were used. Parameters used in this study include the aerosol all layer optical depth (AOD)at all layers at 532 nm with an uncertainty less than three. Additionally, the null values and values less than or equal to zero were eliminated. The data were resampled to 1° × 1° grid. We used the dataset on cloud-free conditions (about 30%)for day and night.

3. Results and Discussion

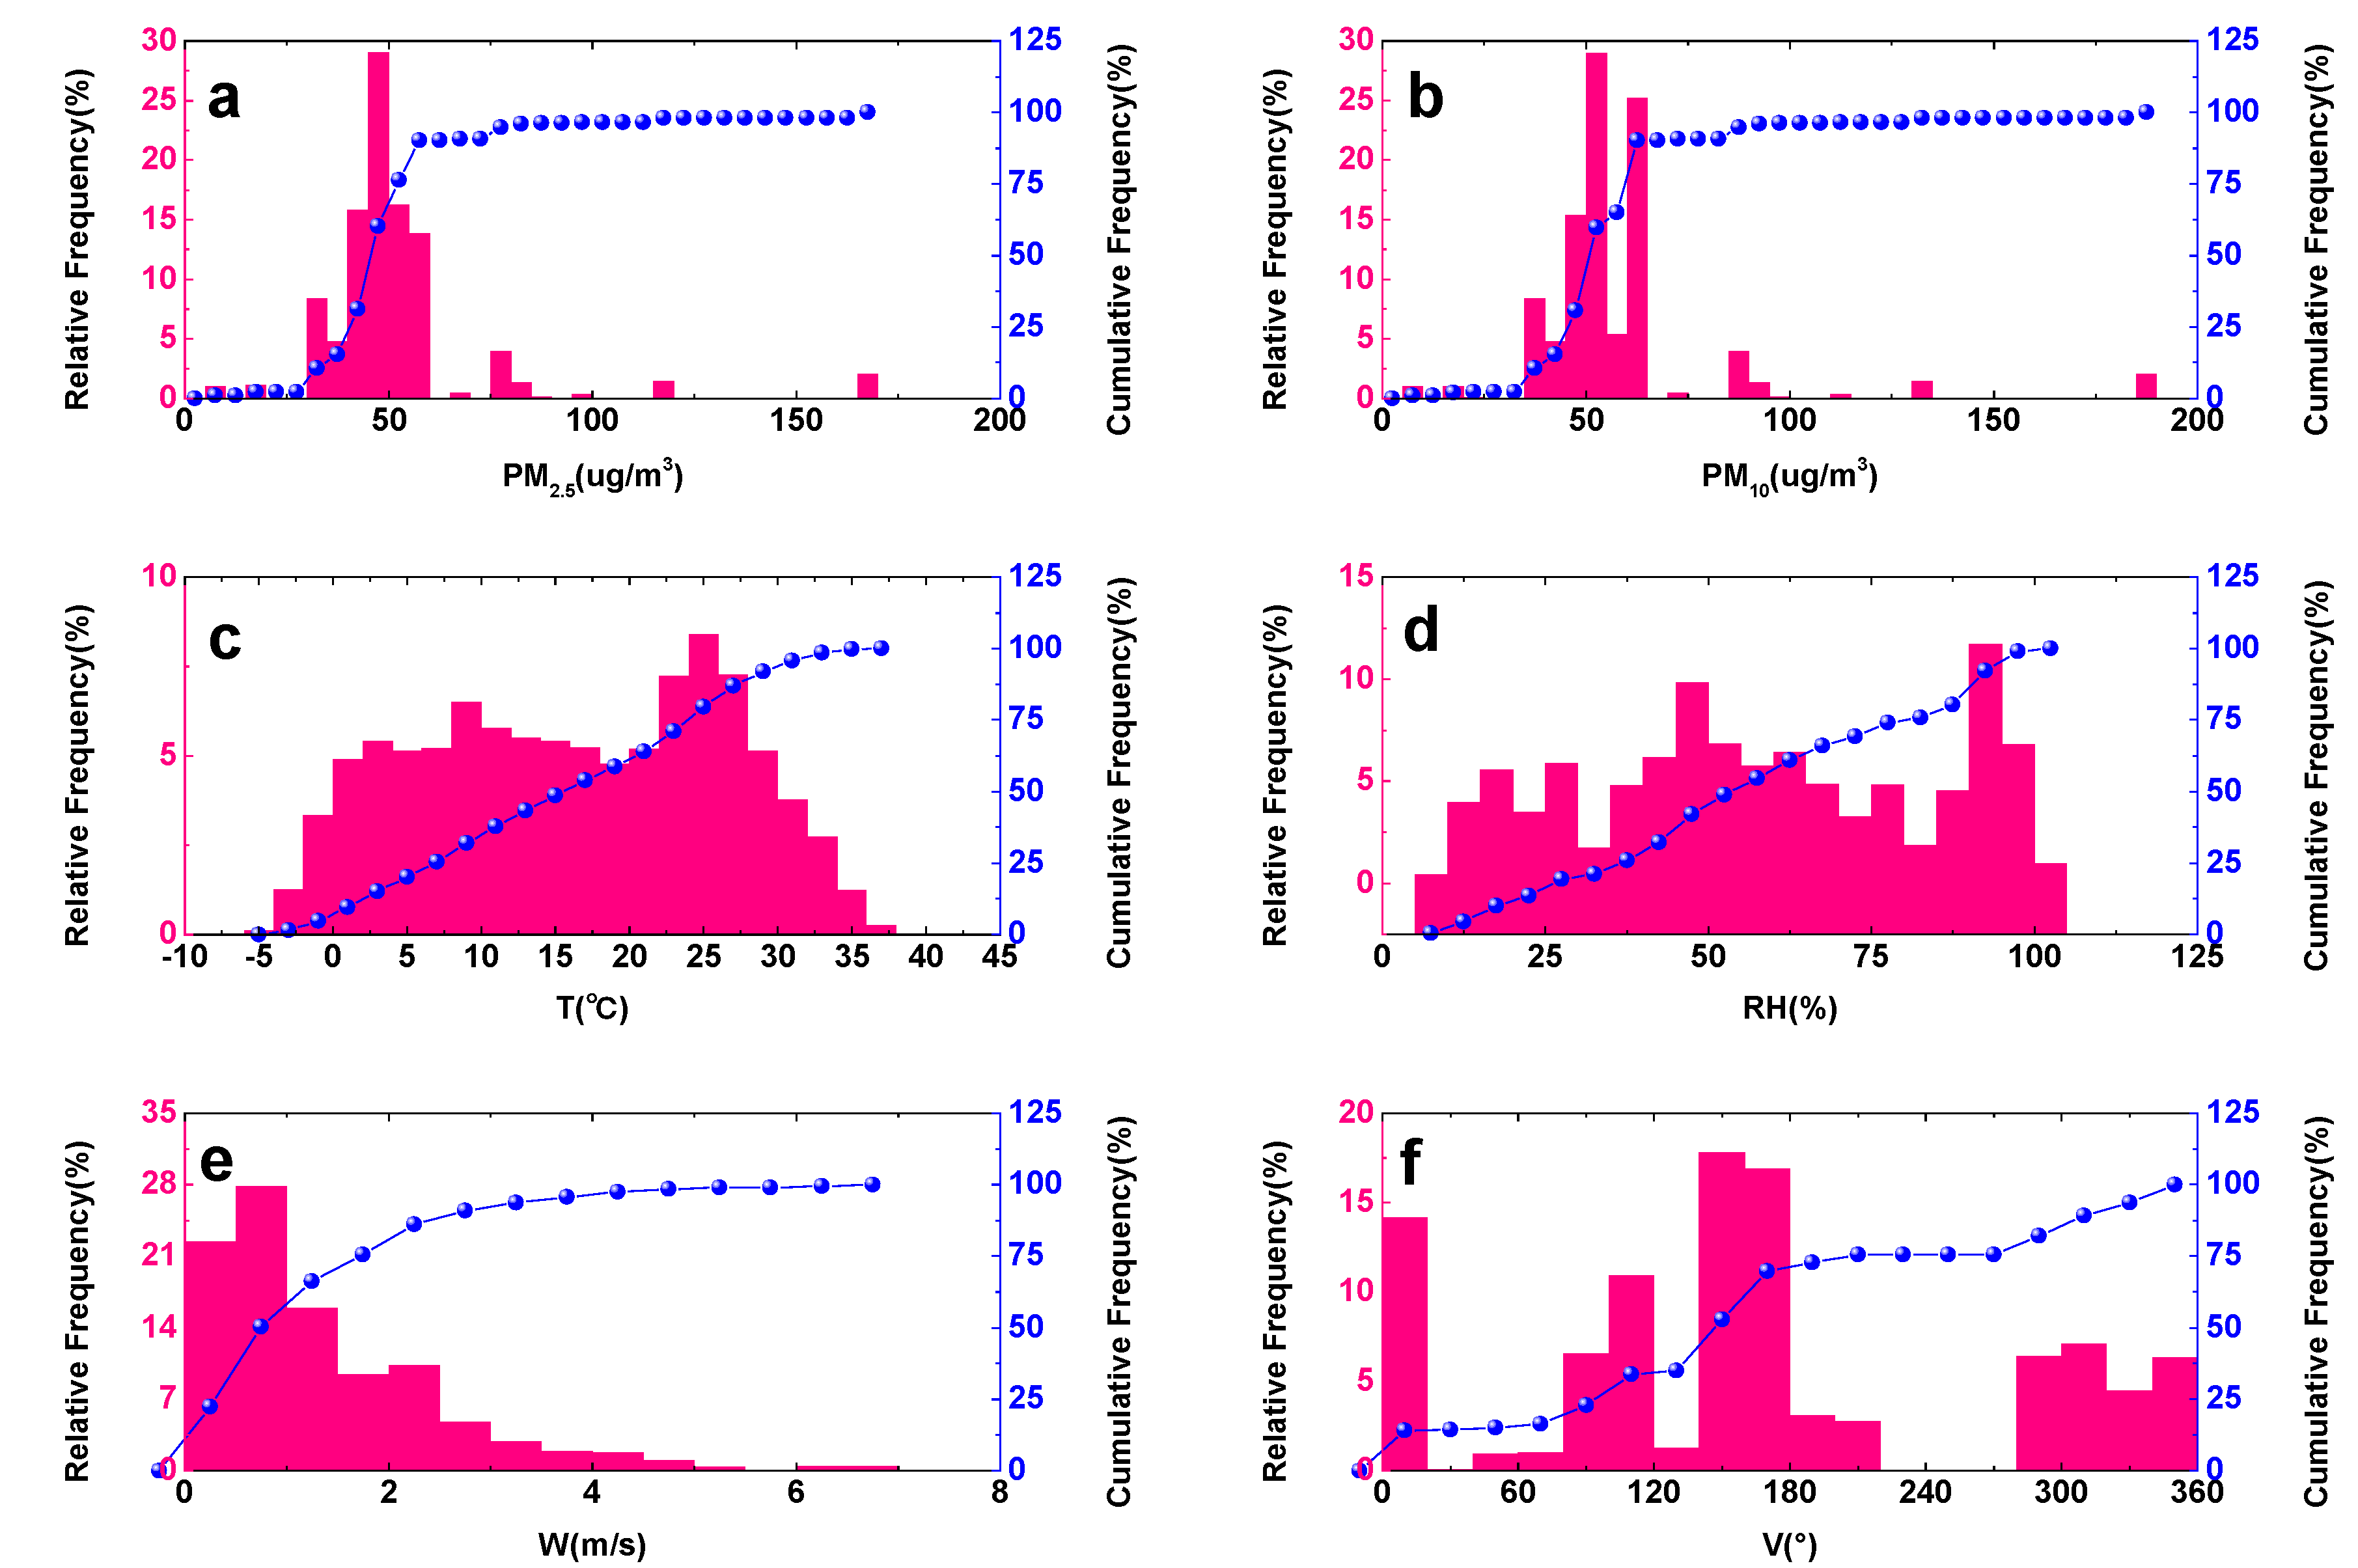
3.1. Overall Characteristics of PM10, PM2.5, and Meteorological Parameters at TC Station

The probability density distributions of PM2.5 and PM10 mass concentrations, and meteorological parameters at the TC station (Figure 2a–f). PM2.5 concentrations were concentrated in the range of 30‒60 μg/m3 and the maximum probability of PM2.5 mass concentrations appeared at 50 μg/m3, while PM10 concentrations were concentrated in the range of 35‒65 μg/m3 and the maximum probability of PM10 mass concentrations appeared at 50 μg/m3 and 65 μg/m3. The annual average concentrations of PM2.5 and PM10 were 50.91 μg/m3 and 57.18 μg/m3, respectively (Table 1). PM10 concentrations meet China’s ambient air quality standards (secondary quality standard, 100 μg/m3 annual mean), whereas PM2.5 did not meet China’s ambient air quality standards (secondary quality standard, 35 μg/m3 annual mean) (GB3095-2012). In comparison with big cities like Beijing (PM2.5: 63.3~122.3 μg/m3) [27], Shanghai (PM2.5: 57.9~61.4 μg/m3) [40], Guangzhou (PM10: 73 to 99 μg/m3) [41], and Shenzhen (PM10: 59~76 μg/m3) [41]. The TC station has relatively lower PM2.5 and PM10 concentrations, which indicates better air quality conditions compared to the other big cities.
In terms of meteorological parameters, the temperature (T) and relative humidity (RH) showed the multimodal distribution pattern (Figure 2c,d). The RH is the ratio of real water vapor values to saturation water vapor values. The values of T ranged between −5 °C and 38 °C, with two peaks at 10 °C and 25 °C.The RH values were between 5% and 100%, with two peaks of 50% and 90%. The annual average values of T and RH were 16.19 °C and 57.95% (Table 1), respectively, consistent with the characteristics of a continental sub-humid climate. Wind speed (W) values showed positively skewed distributions (Figure 2e), and the range of W values was between 0 m/s and 7 m/s, with a peak at 0.5 m/s. The annual average value of W was 1.30 m/s, which is very low, indicating that the TC station experiences low-speed winds all year round. Wind direction (V) showedirregular distributions, and no wind was observed between 210° and 280°, with the peak occurring at about 0° and 150° (Figure 2f). These analyses showed that the TC station is influenced by low-speed north wind or northerly wind winds throughout the year.

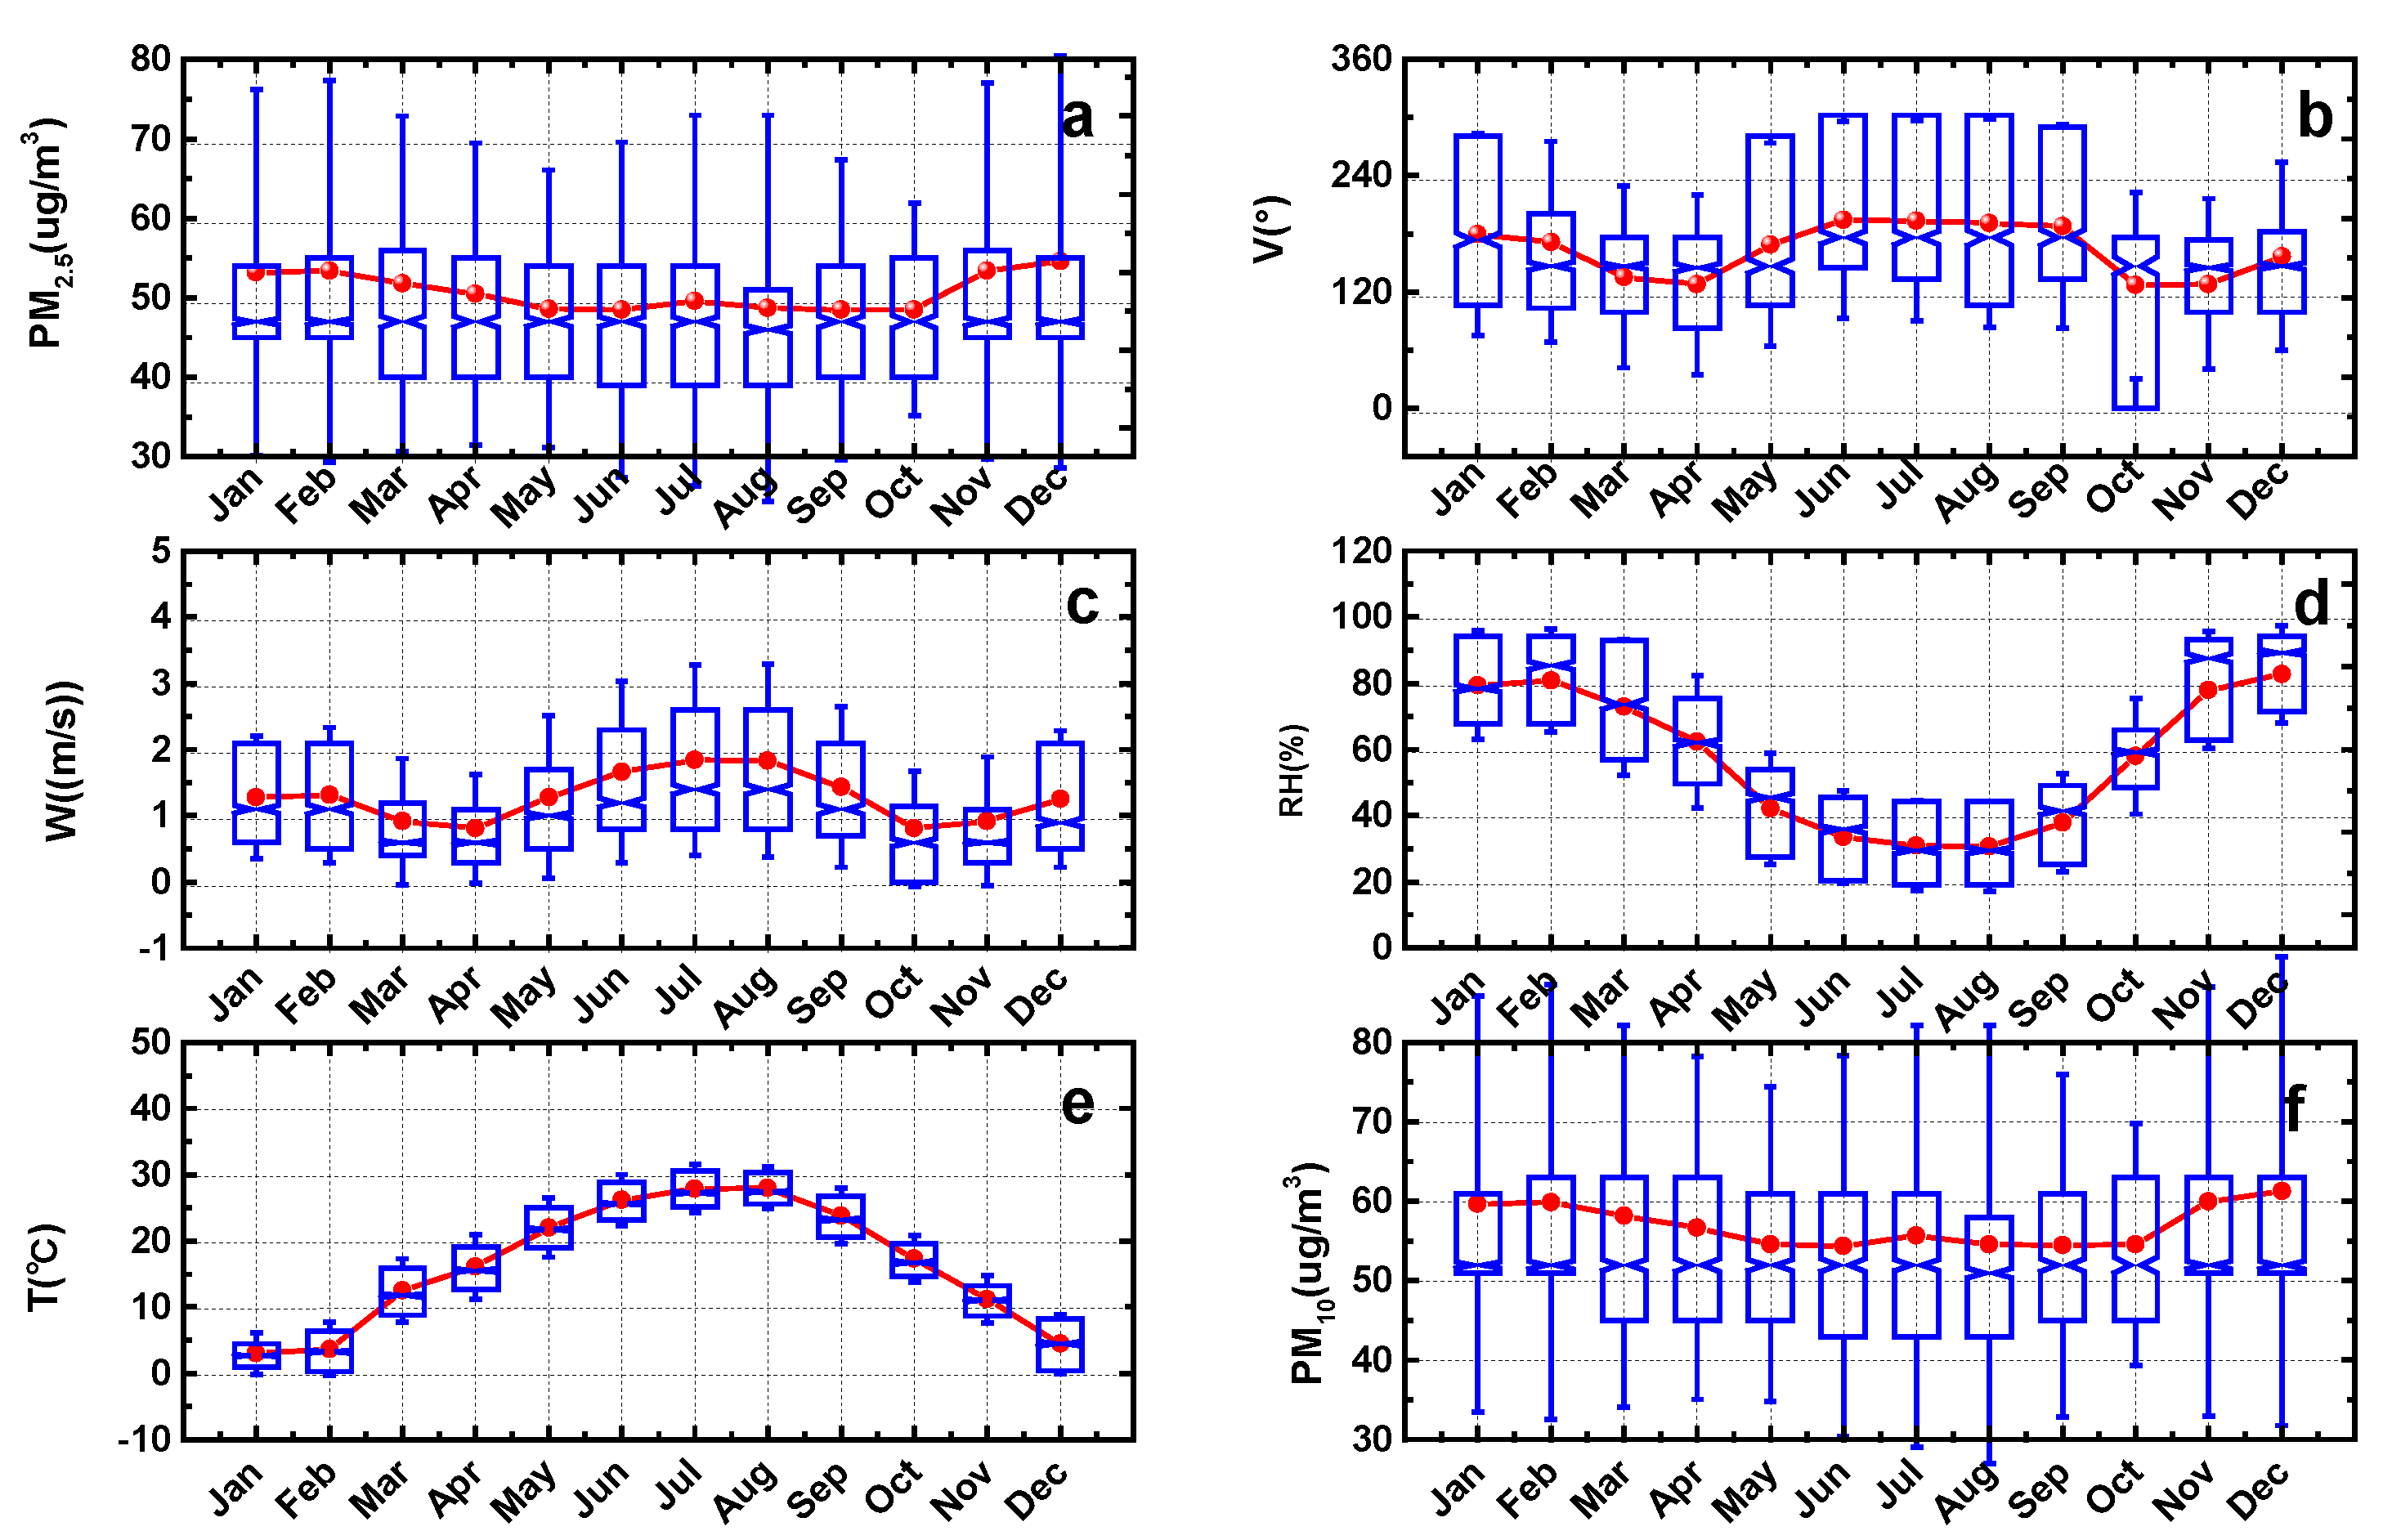
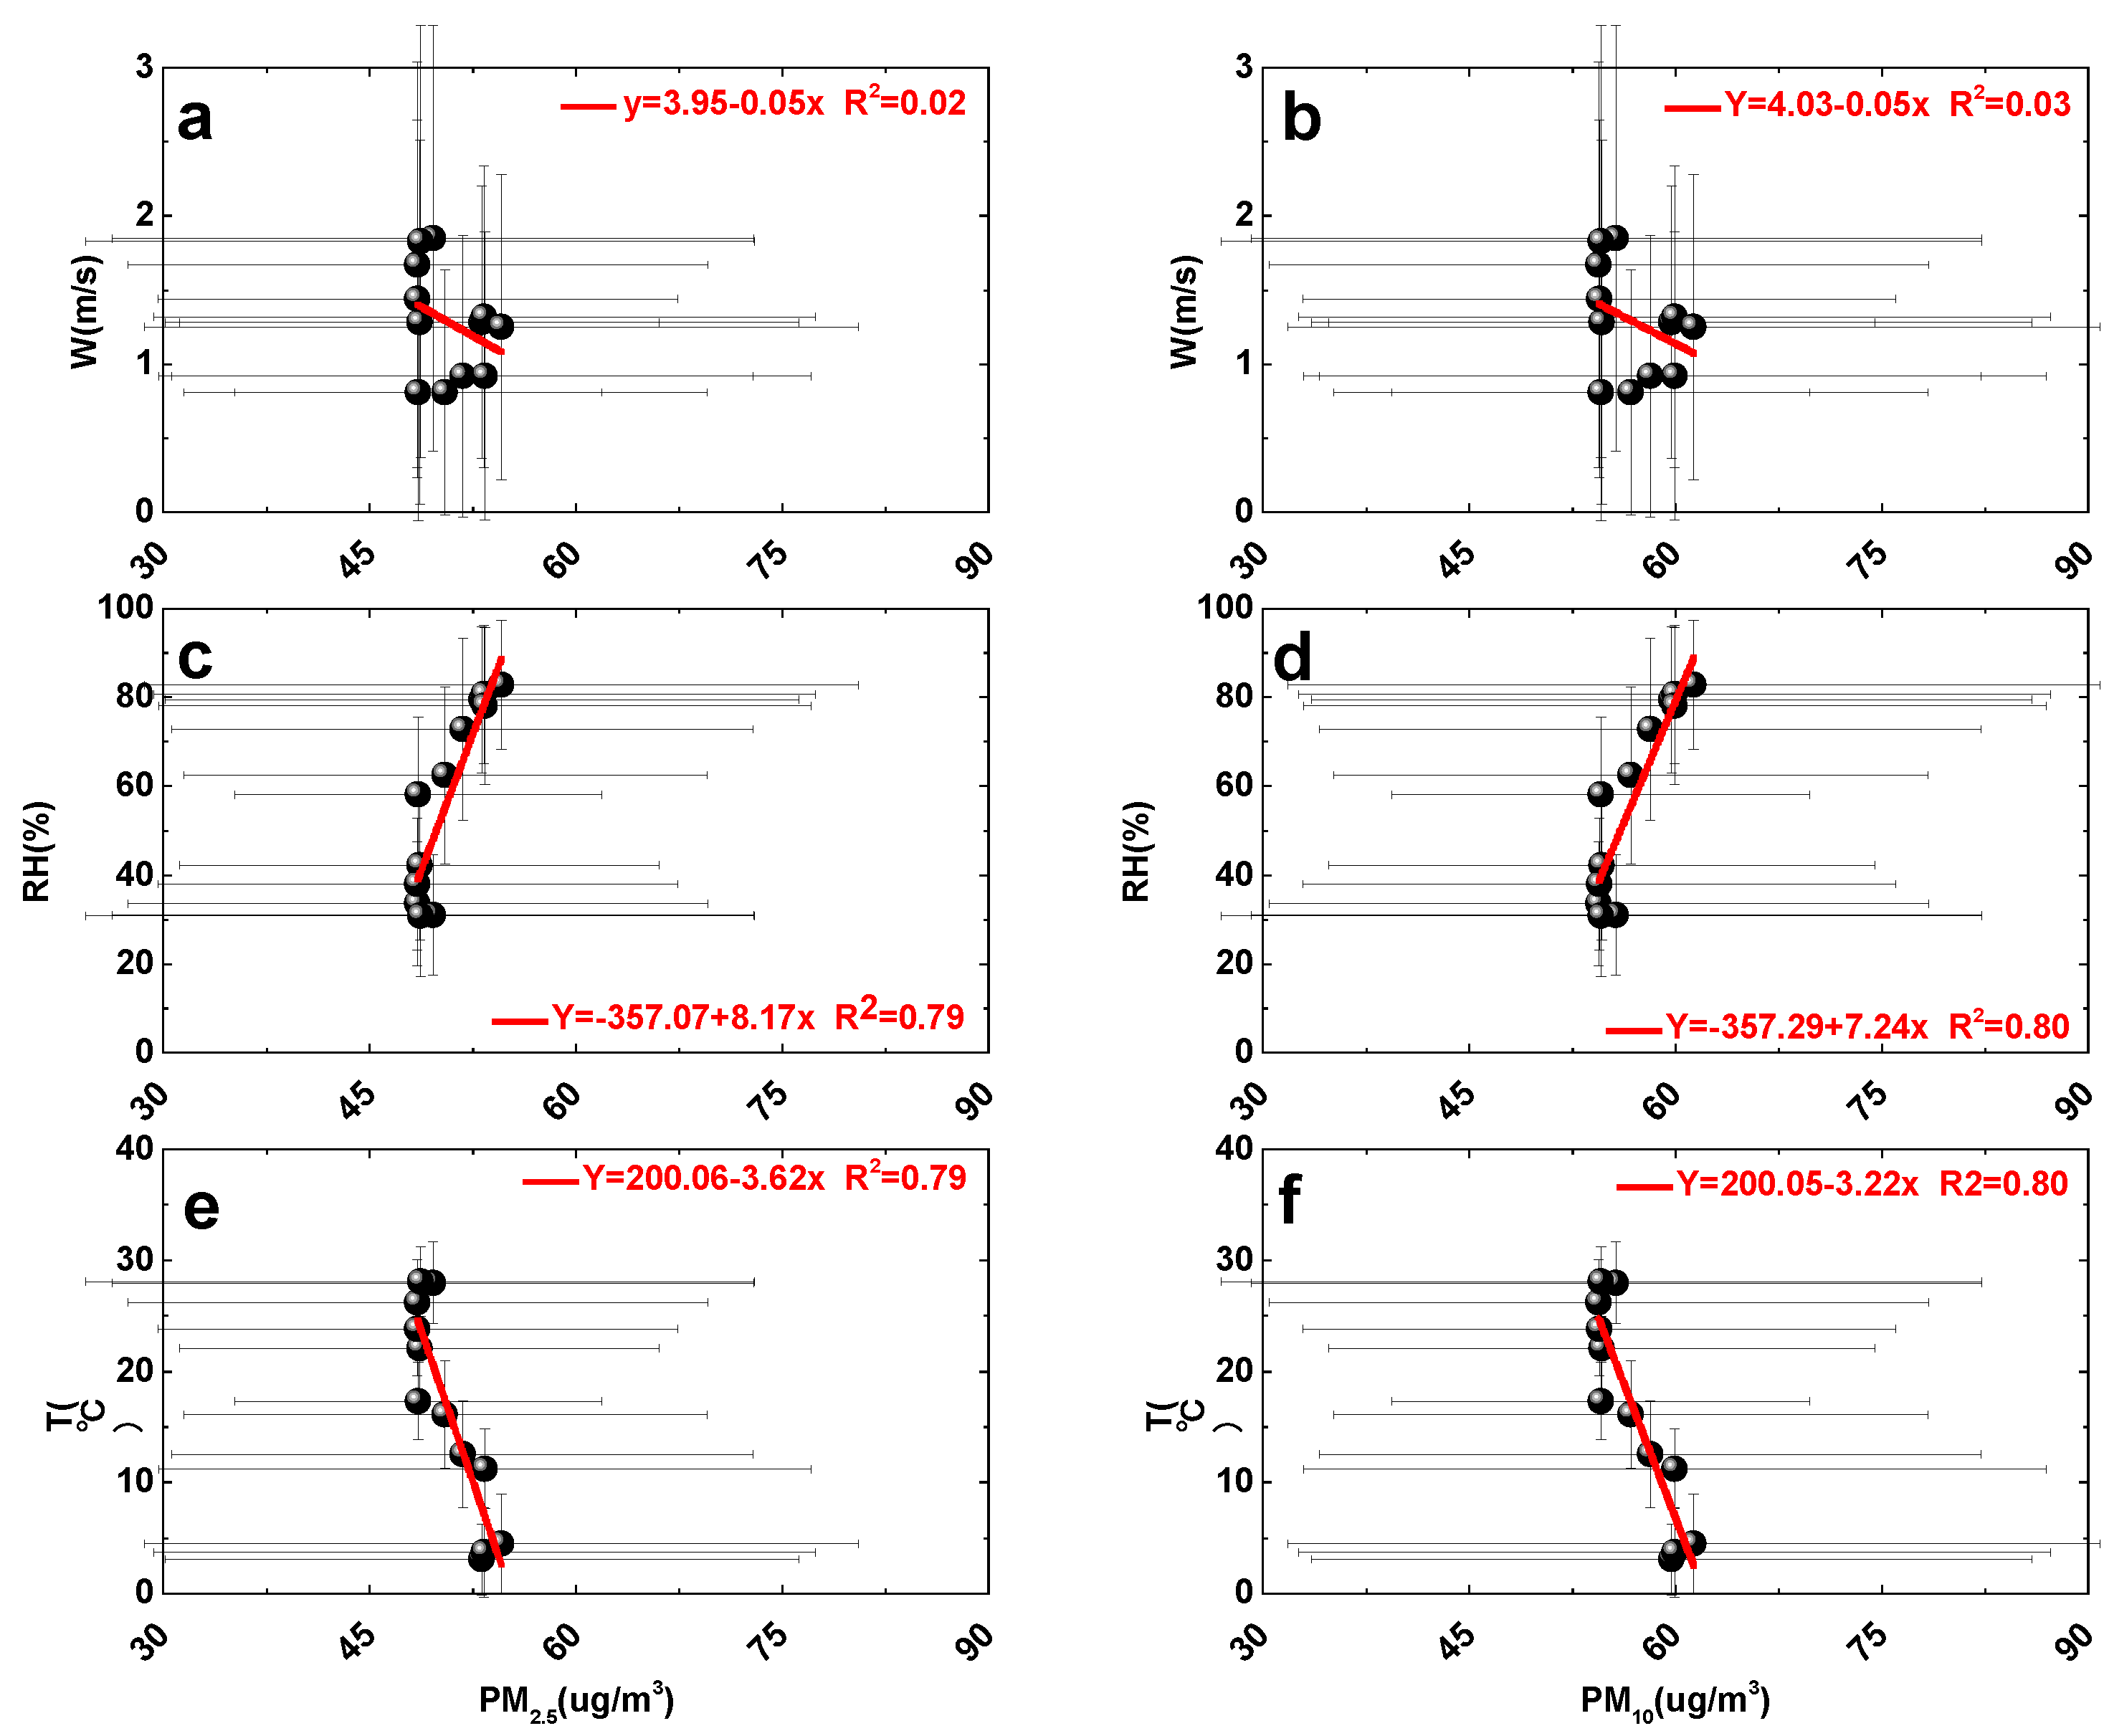
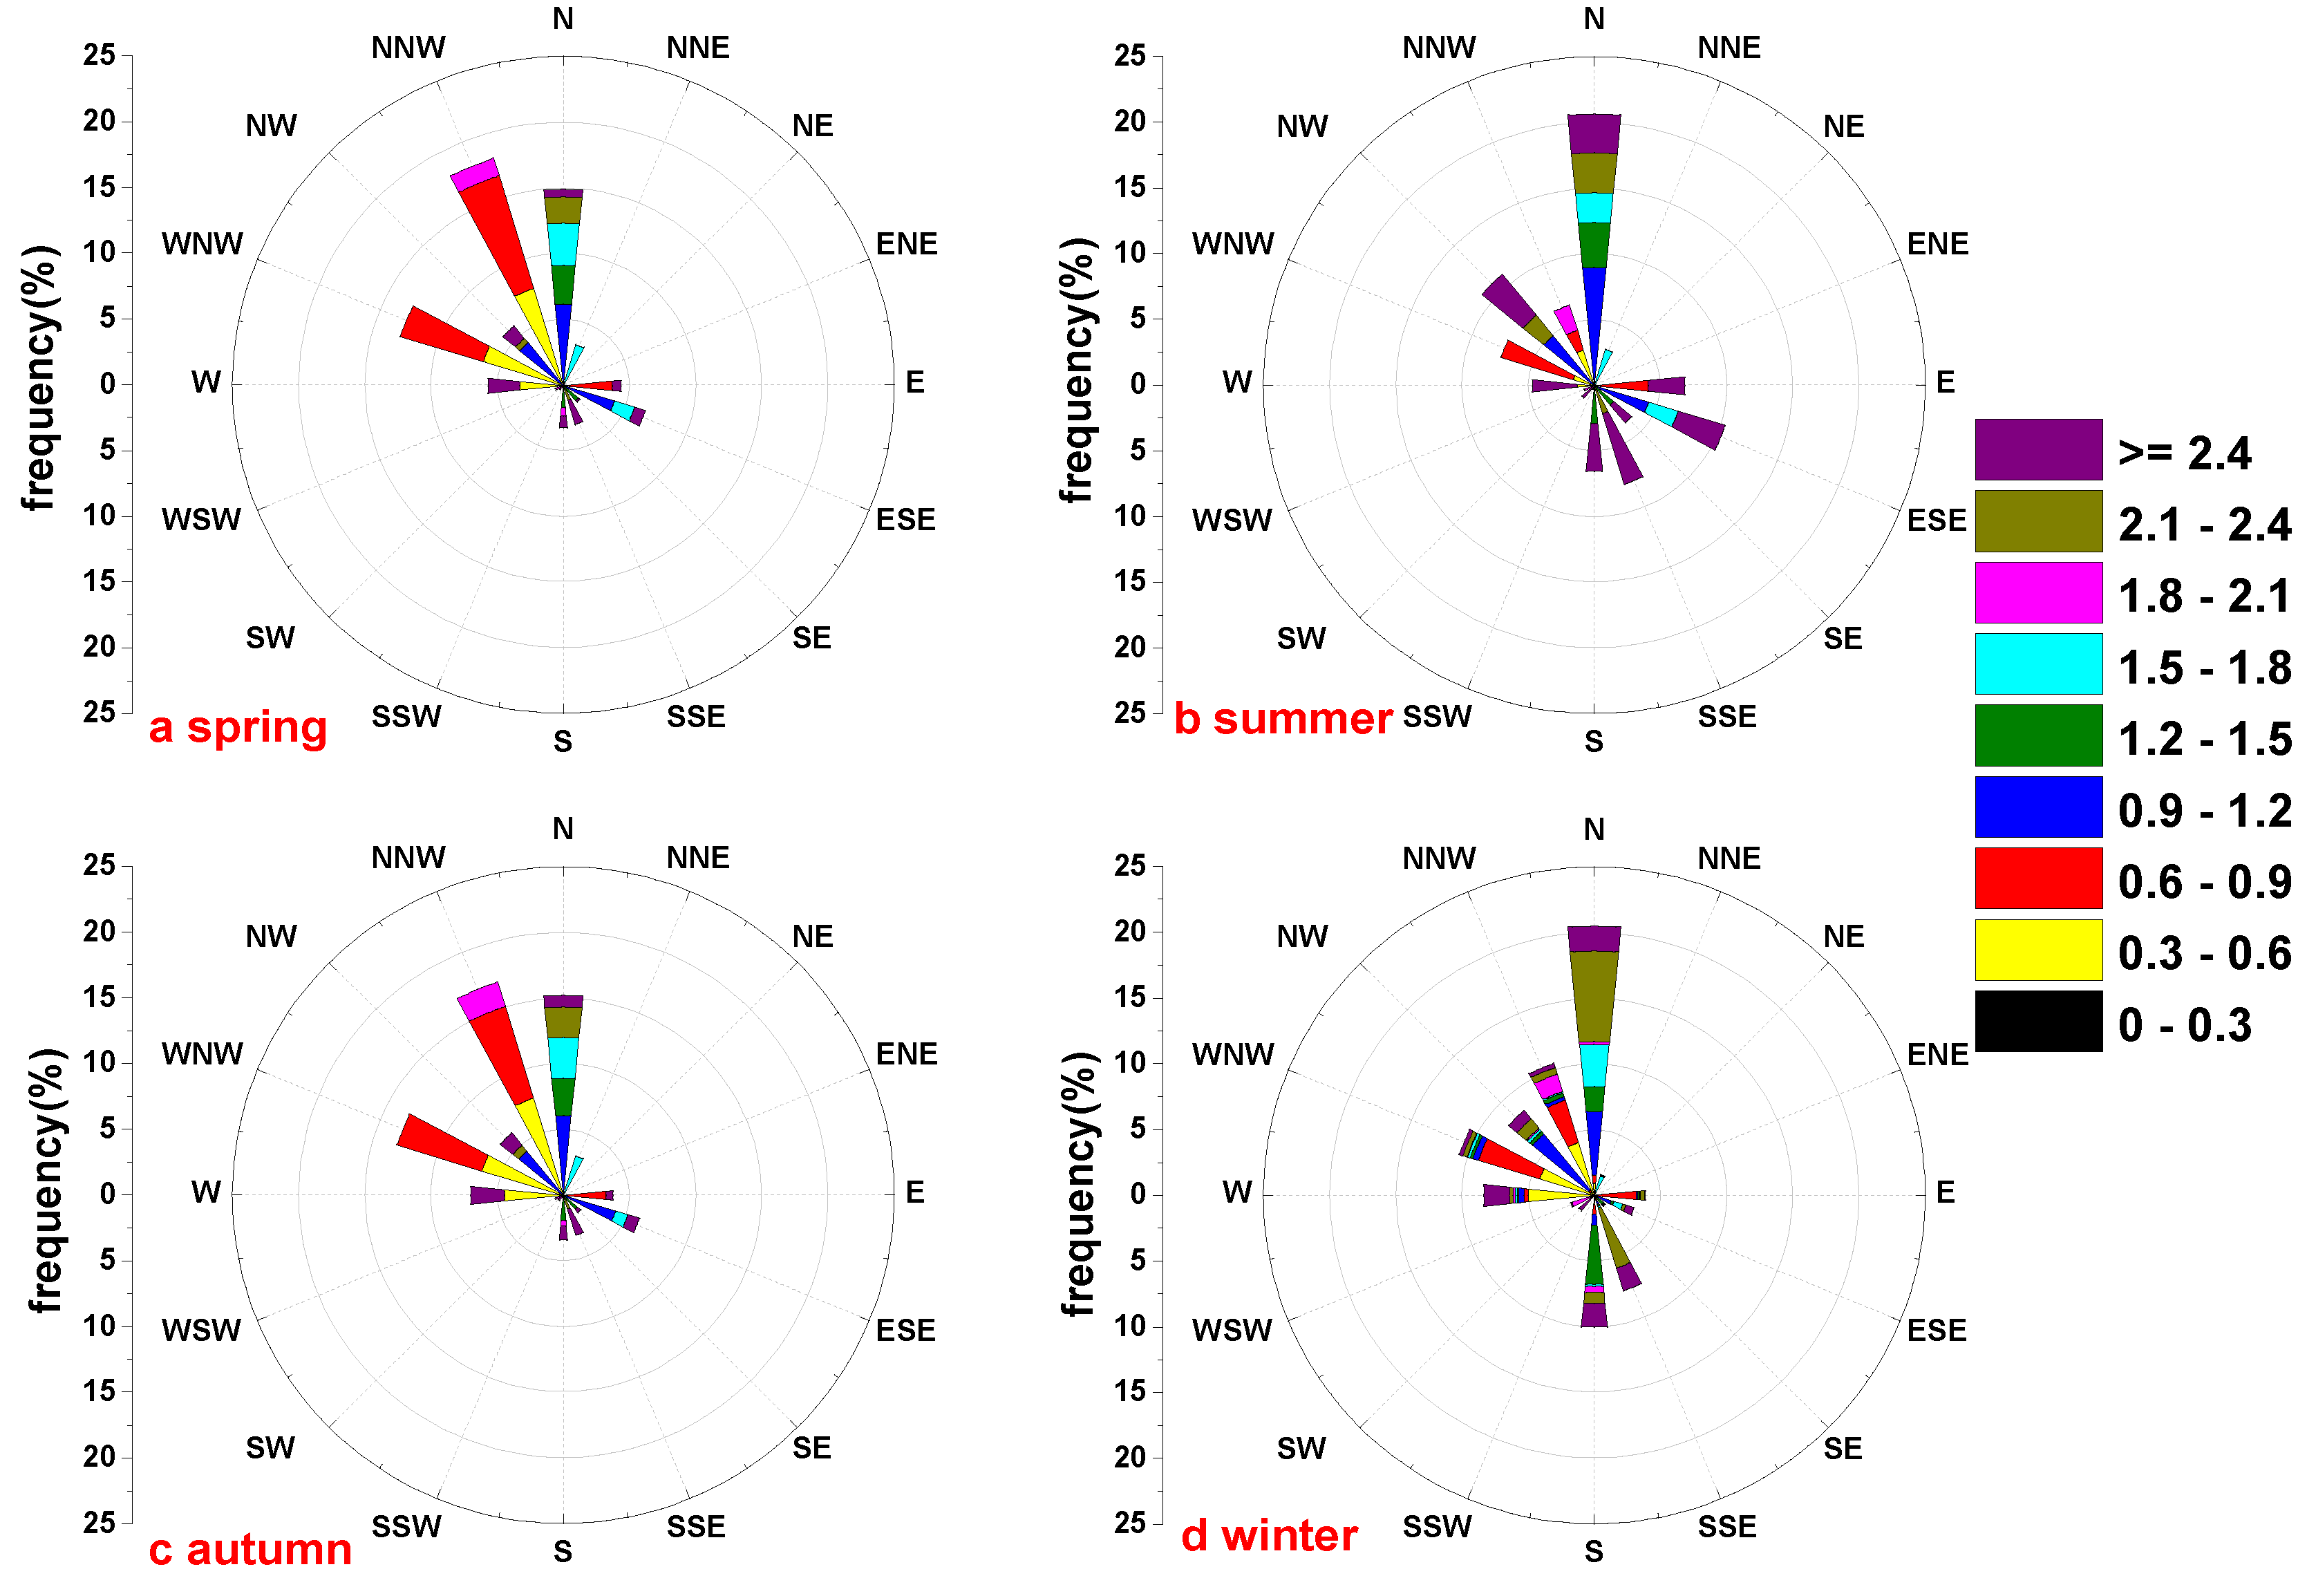
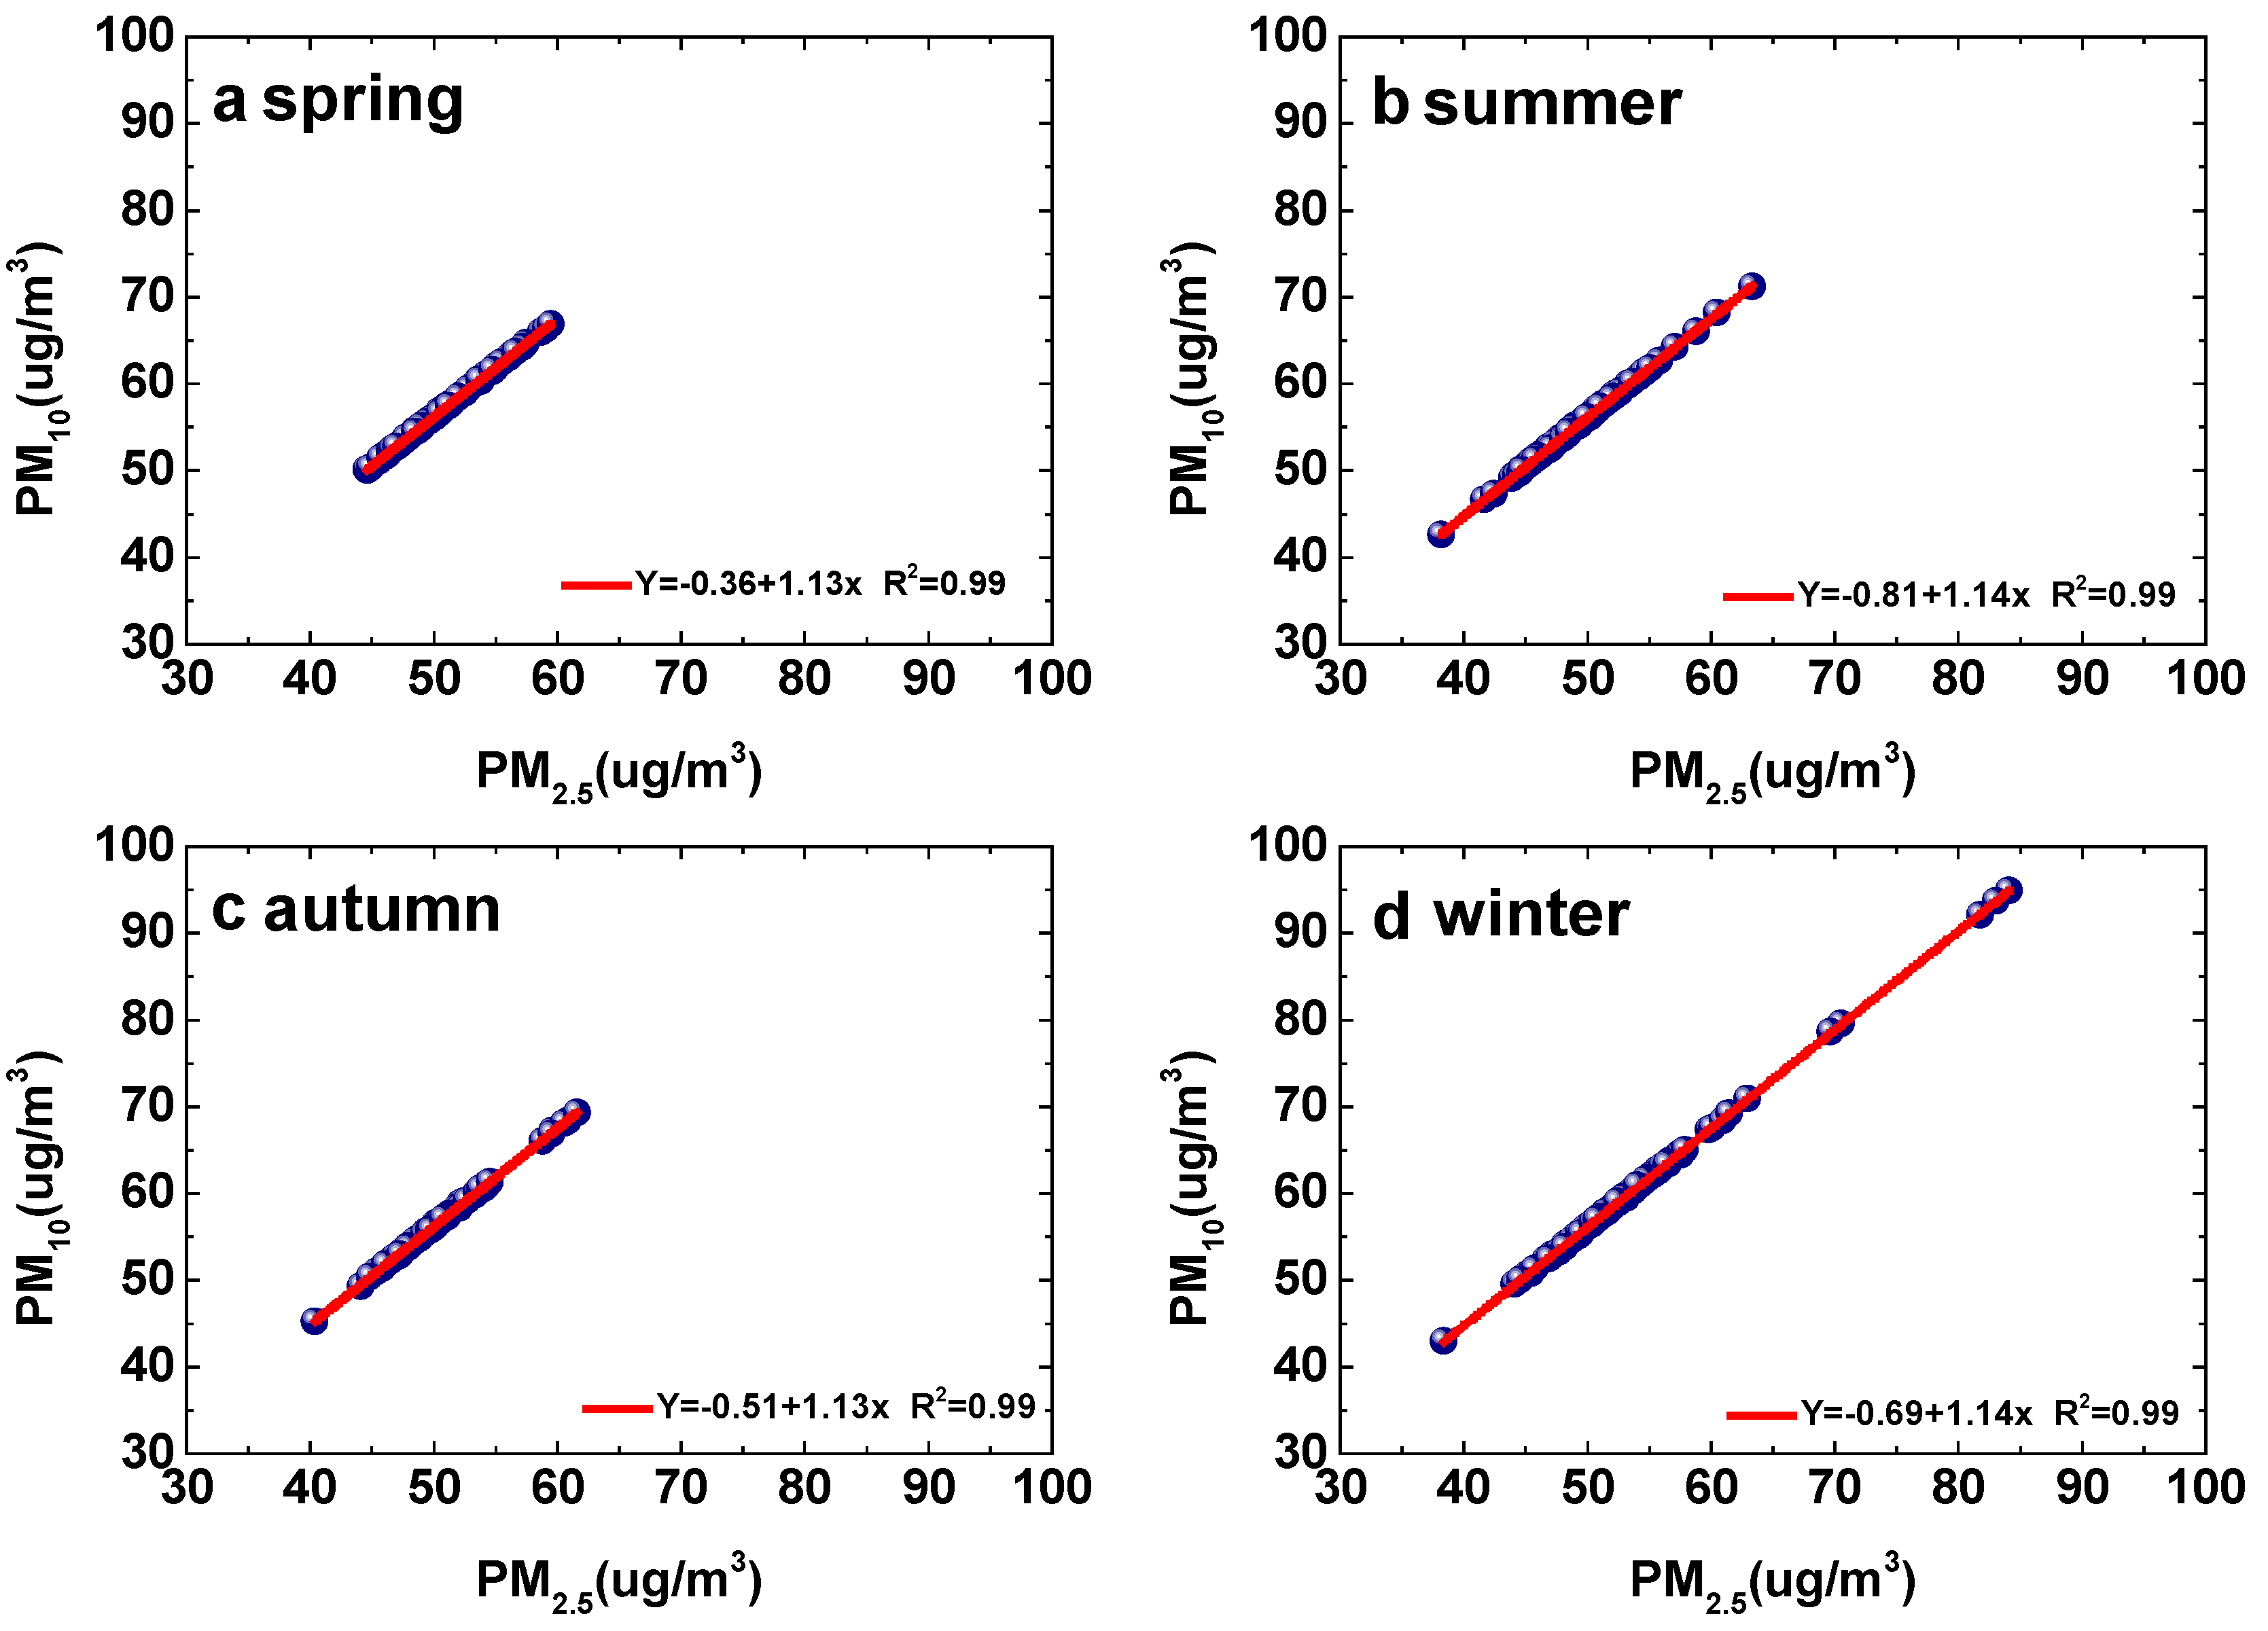
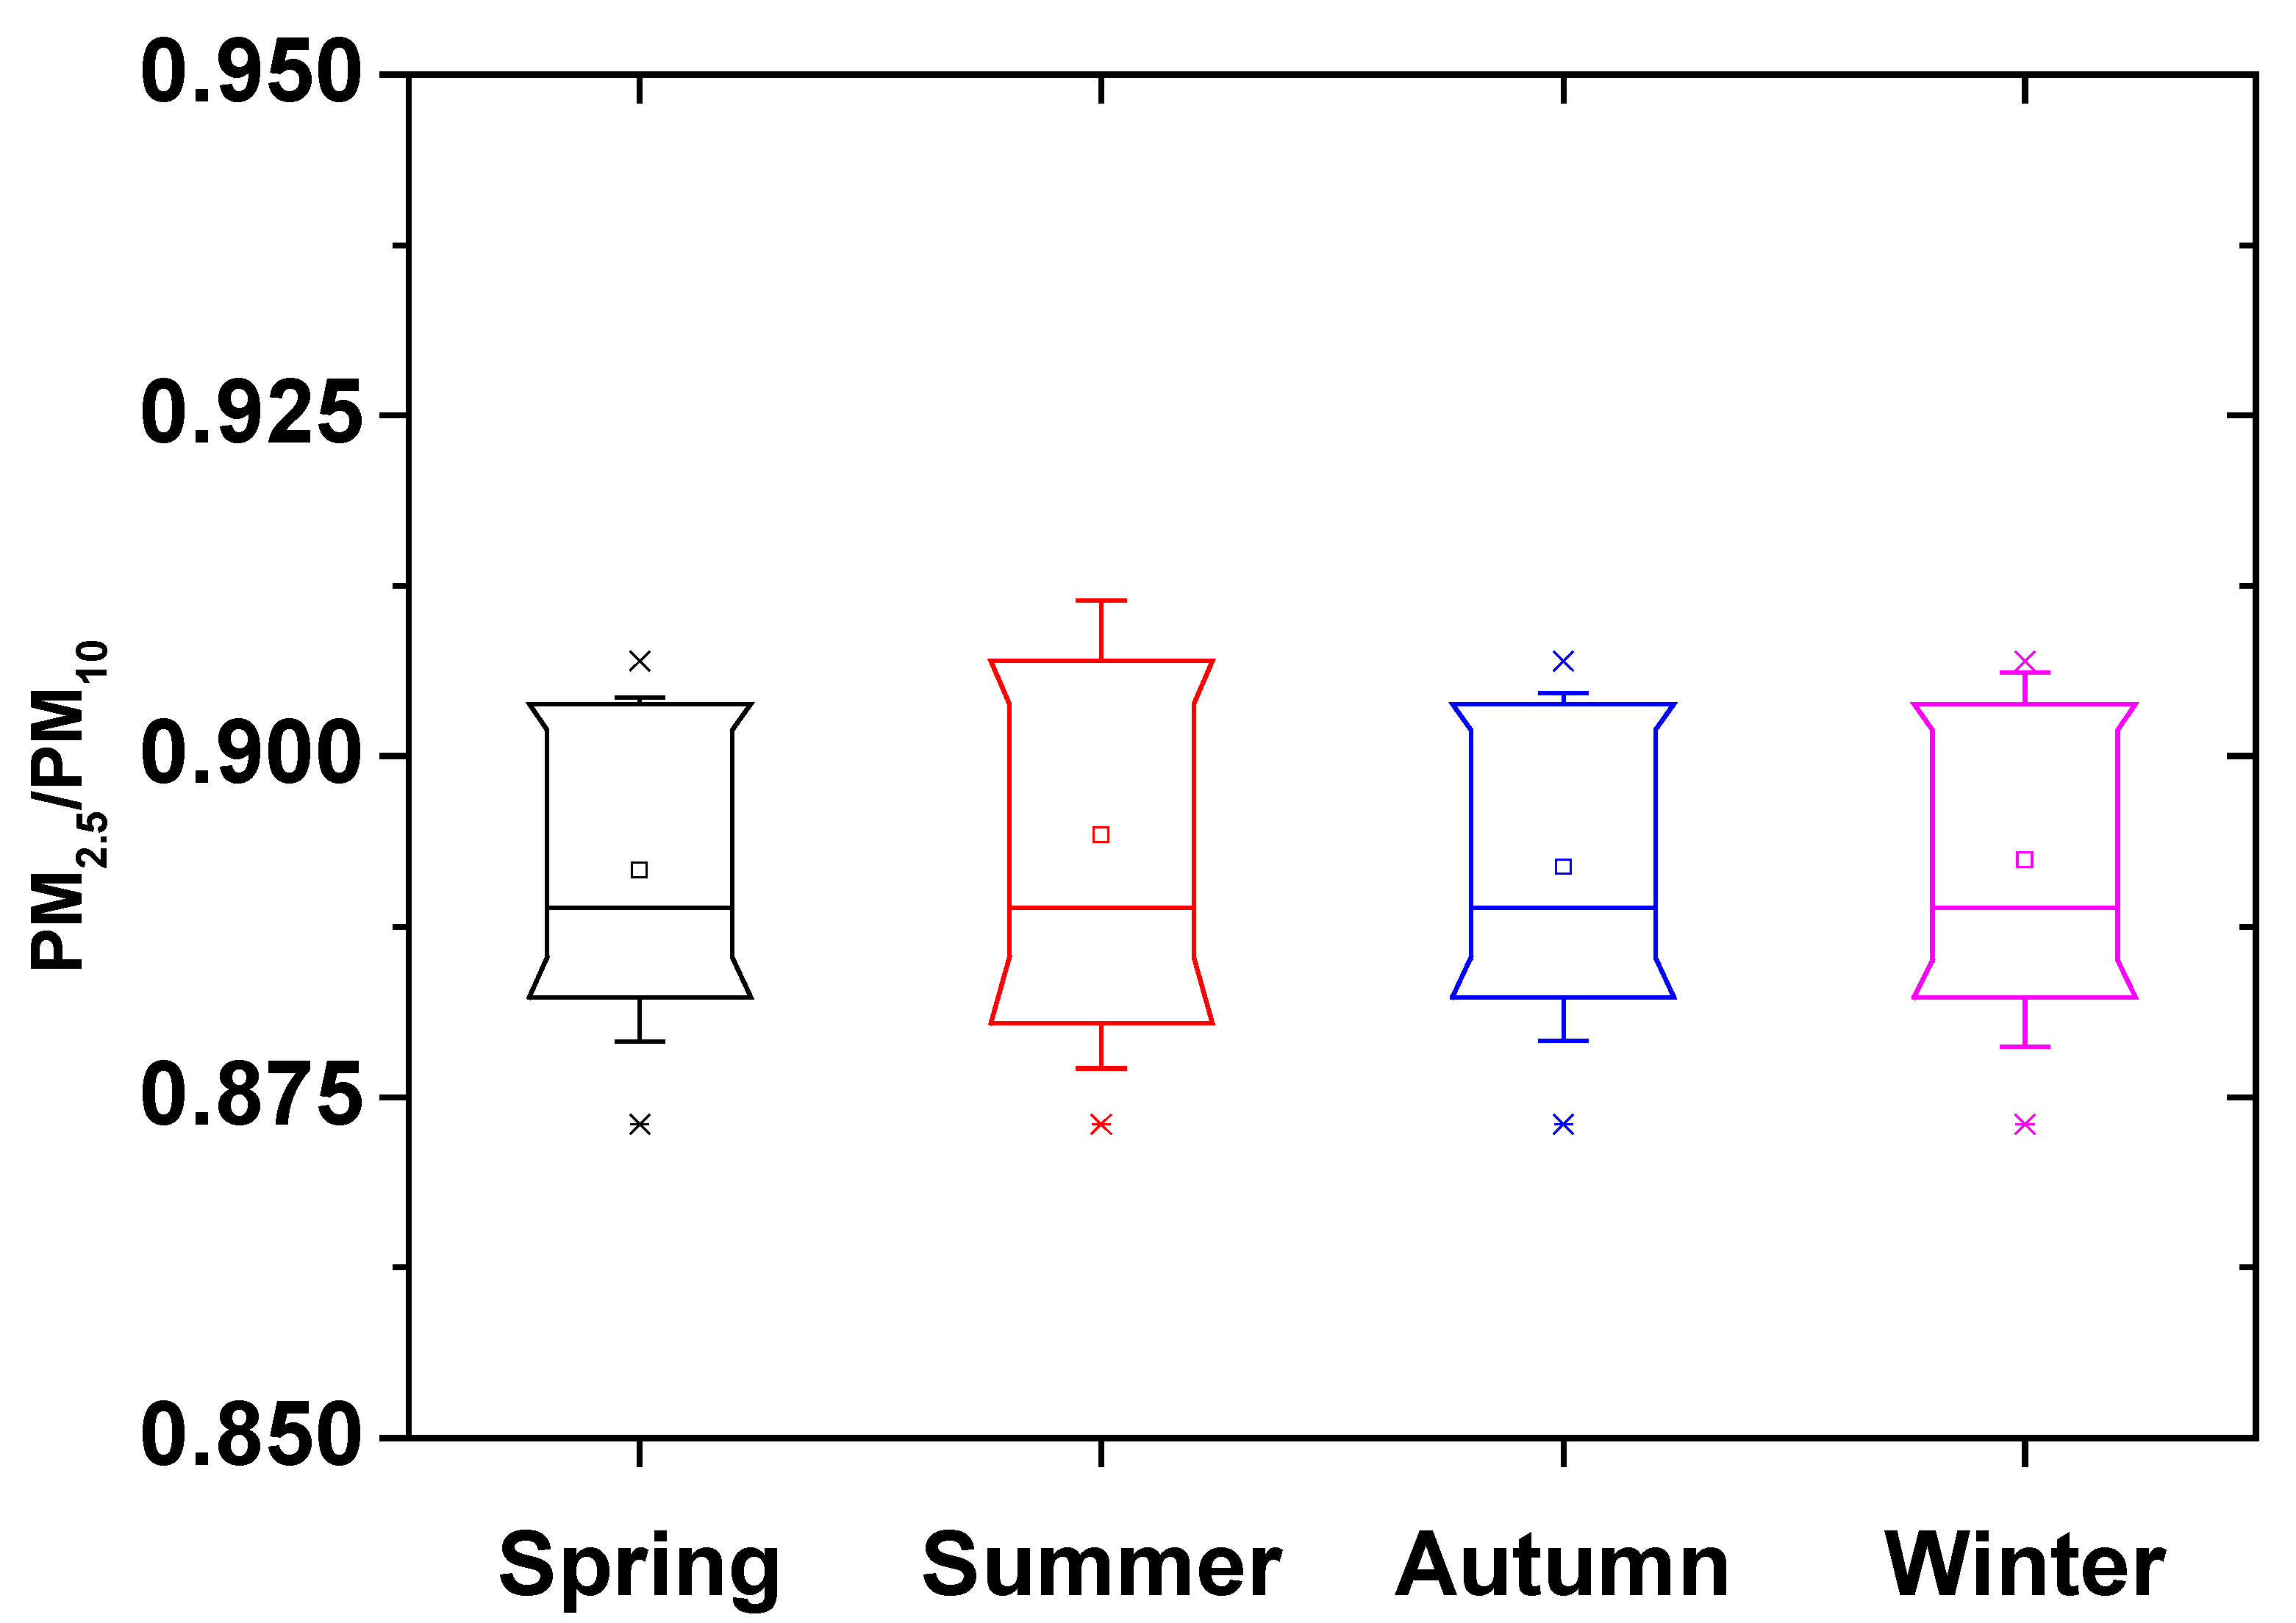
3.2. Seasonal Characteristics of PM10 and PM2.5 and Meteorological Parameters at TC Station

Figure 3 shows the box plot of the monthly changes of PM2.5, PM10, and meteorological parameters at the TC monitoring station. Table 2 shows monthly statistics of PM2.5 and PM10 mass concentrations and meteorological parameters at the TC monitoring station. In Figure 3, the synapses represent the standard deviation of each covariate, and the upper and lower edges of the box-shaped rectangle represent the 10% and 90% quantile values, respectively. It can be seen that the seasonal variation of PM2.5 is inconspicuous, the monthly mean values are low in summer and high in winter, but the difference between winter and summer is small (Figure 3a). The peak of PM2.5 occurred in December (54.58 μg/m3) and the trough occurred in June (48.5 μg/m3). The seasonal variations of PM10 were the same as that of PM2.5; i.e., the peak occurred in December (61.33 μg/m3) and the trough was in June (54.42 μg/m3) and the difference between winter and summer is small (Figure 3f).
The W exhibited weak seasonal variations, with the lowest speed in winter and the highest in summer with a peak in July at 1.85 m/s (Figure 3c). The V also showed a weak seasonal variability the same as W, i.e., slightly higher in summer than in winter (Figure 3b). The TC station belongs to the subtropical monsoon climate, therefore, RH values (Figure 3d) should be high in summer and low in winter [40,41]. However, the RH showed opposite behavior at the TC site, i.e., the lowest values in summer and the highest in winter with a peak in December at 82.85% and the trough in July at 31.05%. The high RH during winter may be due to the strong evaporation of water vapor in the atmosphere. RH reveals how the real air water vapor is close to saturation water vapor. Moreover, there is a strong negative correlation between T and RH, because saturation vapor pressure (RH’s denominator) is an exponentially increasing function of the temperature. In winter, the T was low, the saturation vapor values were relatively low, and the actual vapor values were not low in the winter at the TC site. So, RH values were high in winter. Figure 3e shows the seasonal variation of T at the TC station with the maximum and minimum values that occurred in August (28.09 °C) and January (3.06 °C), and the difference between the maximum and minimum values is significantly high. This may be due to the subtropical monsoon climate of the TC station.
Figure 4 shows the correlation plot between the PM2.5, PM10, and meteorological parameters at the TC monitoring station. In Figure 4, the dots and synapses represent the monthly mean value and monthly standard deviations of the parameters. The results showed that PM2.5 (Figure 4a) and PM10 were very poorly correlated with wind speed and this indicates that the higher PM2.5 and PM10 concentrations at TC were mainly due to the local activities. It can also be seen from the four seasons wind rosette plots (Figure 5) that the wind direction at the TC station is likely to be either south (N) or southeast (NNW) regardless of the season. There is only a small probability of south or southeast winds in summer or winter.
The results showed that PM2.5 and PM10 were strongly correlated with RH with a correlation coefficient (R2) of 0.79 and 0.80, respectively, as indicated by positive values of the slope. This reveals that higher PM2.5 and PM10 concentrations were associated with higher RH values(Figure 4c,d). The higher value of RH acts as a catalyst in the photochemical reaction to generate secondary aerosol particles, which are responsible for higher concentrations of PMx (x = 2.5 and 10) and aerosol optical depth (AOD) in winter. Similar results have been reported by previous studies over Beijing [27,42] and Shanghai [40].
Figure 4e shows a strong negative correlation of PM2.5 (R2 = 0.79) and PM10 (R2 = 0.80)T. These results suggest that higher PM2.5 and PM10 concentrations were associated with low T. These phenomena indicate that particulate matter mass concentrations are higher in winter than in summer. These results are supported by previous studies and this is maybe due to the lower atmospheric boundary layer in winter compared to summer due to low temperatures [40,43]. When the atmospheric boundary layer is low, particulate matter squeezes within the lower boundary layer, resulting in high particle mass concentrations. On the other hand, it can be seen from Figure 4a–f that both PM2.5 and PM10 have a narrow range, which indicates that the range of particulate matter at the TC site does not vary much throughout the year and the air is relatively clean, which echoes the findings in Figure 3a,f.
Figure 6 shows the relationship between PM2.5 and PM10 which can be helpful to reveal the source of particulate pollutants [42] at the TC station. The main sources of PM2.5 are soil particles, sea salt, plant pollen, volcanic ash, industrial smoke (heating, cooking, coal, gas, fuel oil), and exhaust gas from vehicle emissions [13]. PM10 not only includes PM2.5 but also particulates with slightly larger particle sizes, such as sand and dust [44]. The sources of PM10 and PM2.5 are generally different, such as sand and dust particles originating from natural sources, whereas fine particles (PM2.5) generally originate from anthropogenic emissions sources. In the study of Bilal et al., the source of particulates was mainly from the Pearl River Delta (PRD) through long-distance transportation in autumn and winter Hong Kong [45]. Therefore, the study of the relationship between PM2.5 and PM10 can qualitatively reveal the source of particles at the TC station. From Figure 6a–d, it is known that PM2.5 and PM10 maintain very strong positive linear correlations, with correlation coefficients of R2 = 0.99 in all four seasons. This phenomenon shows that the same variations of PM2.5 and PM10 existed at TC. At the same time, the slope of the fitted curve in Figure 6 shows that PM2.5 accounts for about 88% of the PM10 in all four seasons, a large proportion of the entire PM10, and the particles are mainly fine particles at TC. In Figure 7, the PM2.5/PM10 ratio showed high values, especially in summer compared to other seasons, which suggests that that PM2.5 could come from the anthropogenic activities [46]. To investigate the anthropogenic sources of PM in the TC site, the Hybrid Single-Particle Lagrangian Integrated Trajectory (HYSPLIT) model was utilized. We have selected a week time air mass trajectory in one season (Figure 8). It could be seen that on the ground surface, the air mass mainly came from the North, which was corresponding to the wind direction results above. Meanwhile, air masses of 500 m and 1000 m mainly came from Northeast provinces in the summer and Southeast provinces in autumn. In our previous research, the summer and autumn were grain harvest seasons; straw burning activities occurred frequently in Central China [47]. So straw burning activities could generate PM particles and these PM particles could also be blown to the TC site to formate a part of external pollution sources. This phenomenon might affect the air quality of the TC site. At the same time, from the analysis above, it can be seen that the mass concentrations of PM particles are low at the TC site, and the mass concentrations of PM2.5 and PM10 are all in line with the national secondary standard. The good atmospheric environment makes a certain contribution to the whole ecological environment required for water source regions. In the study of Chengdu, the average PM2.5/PM10 was 85%, which was the same as our study. It indicated that the proportions of PM2.5 contained within PM10 were quite high, further proving that fine particles were the greatest contributor to PM air pollution in Chengdu. Moreover, dust and sandstorms could cause the average PM2.5/PM10 to be lower (72%) in spring in the Chengdu site [43].

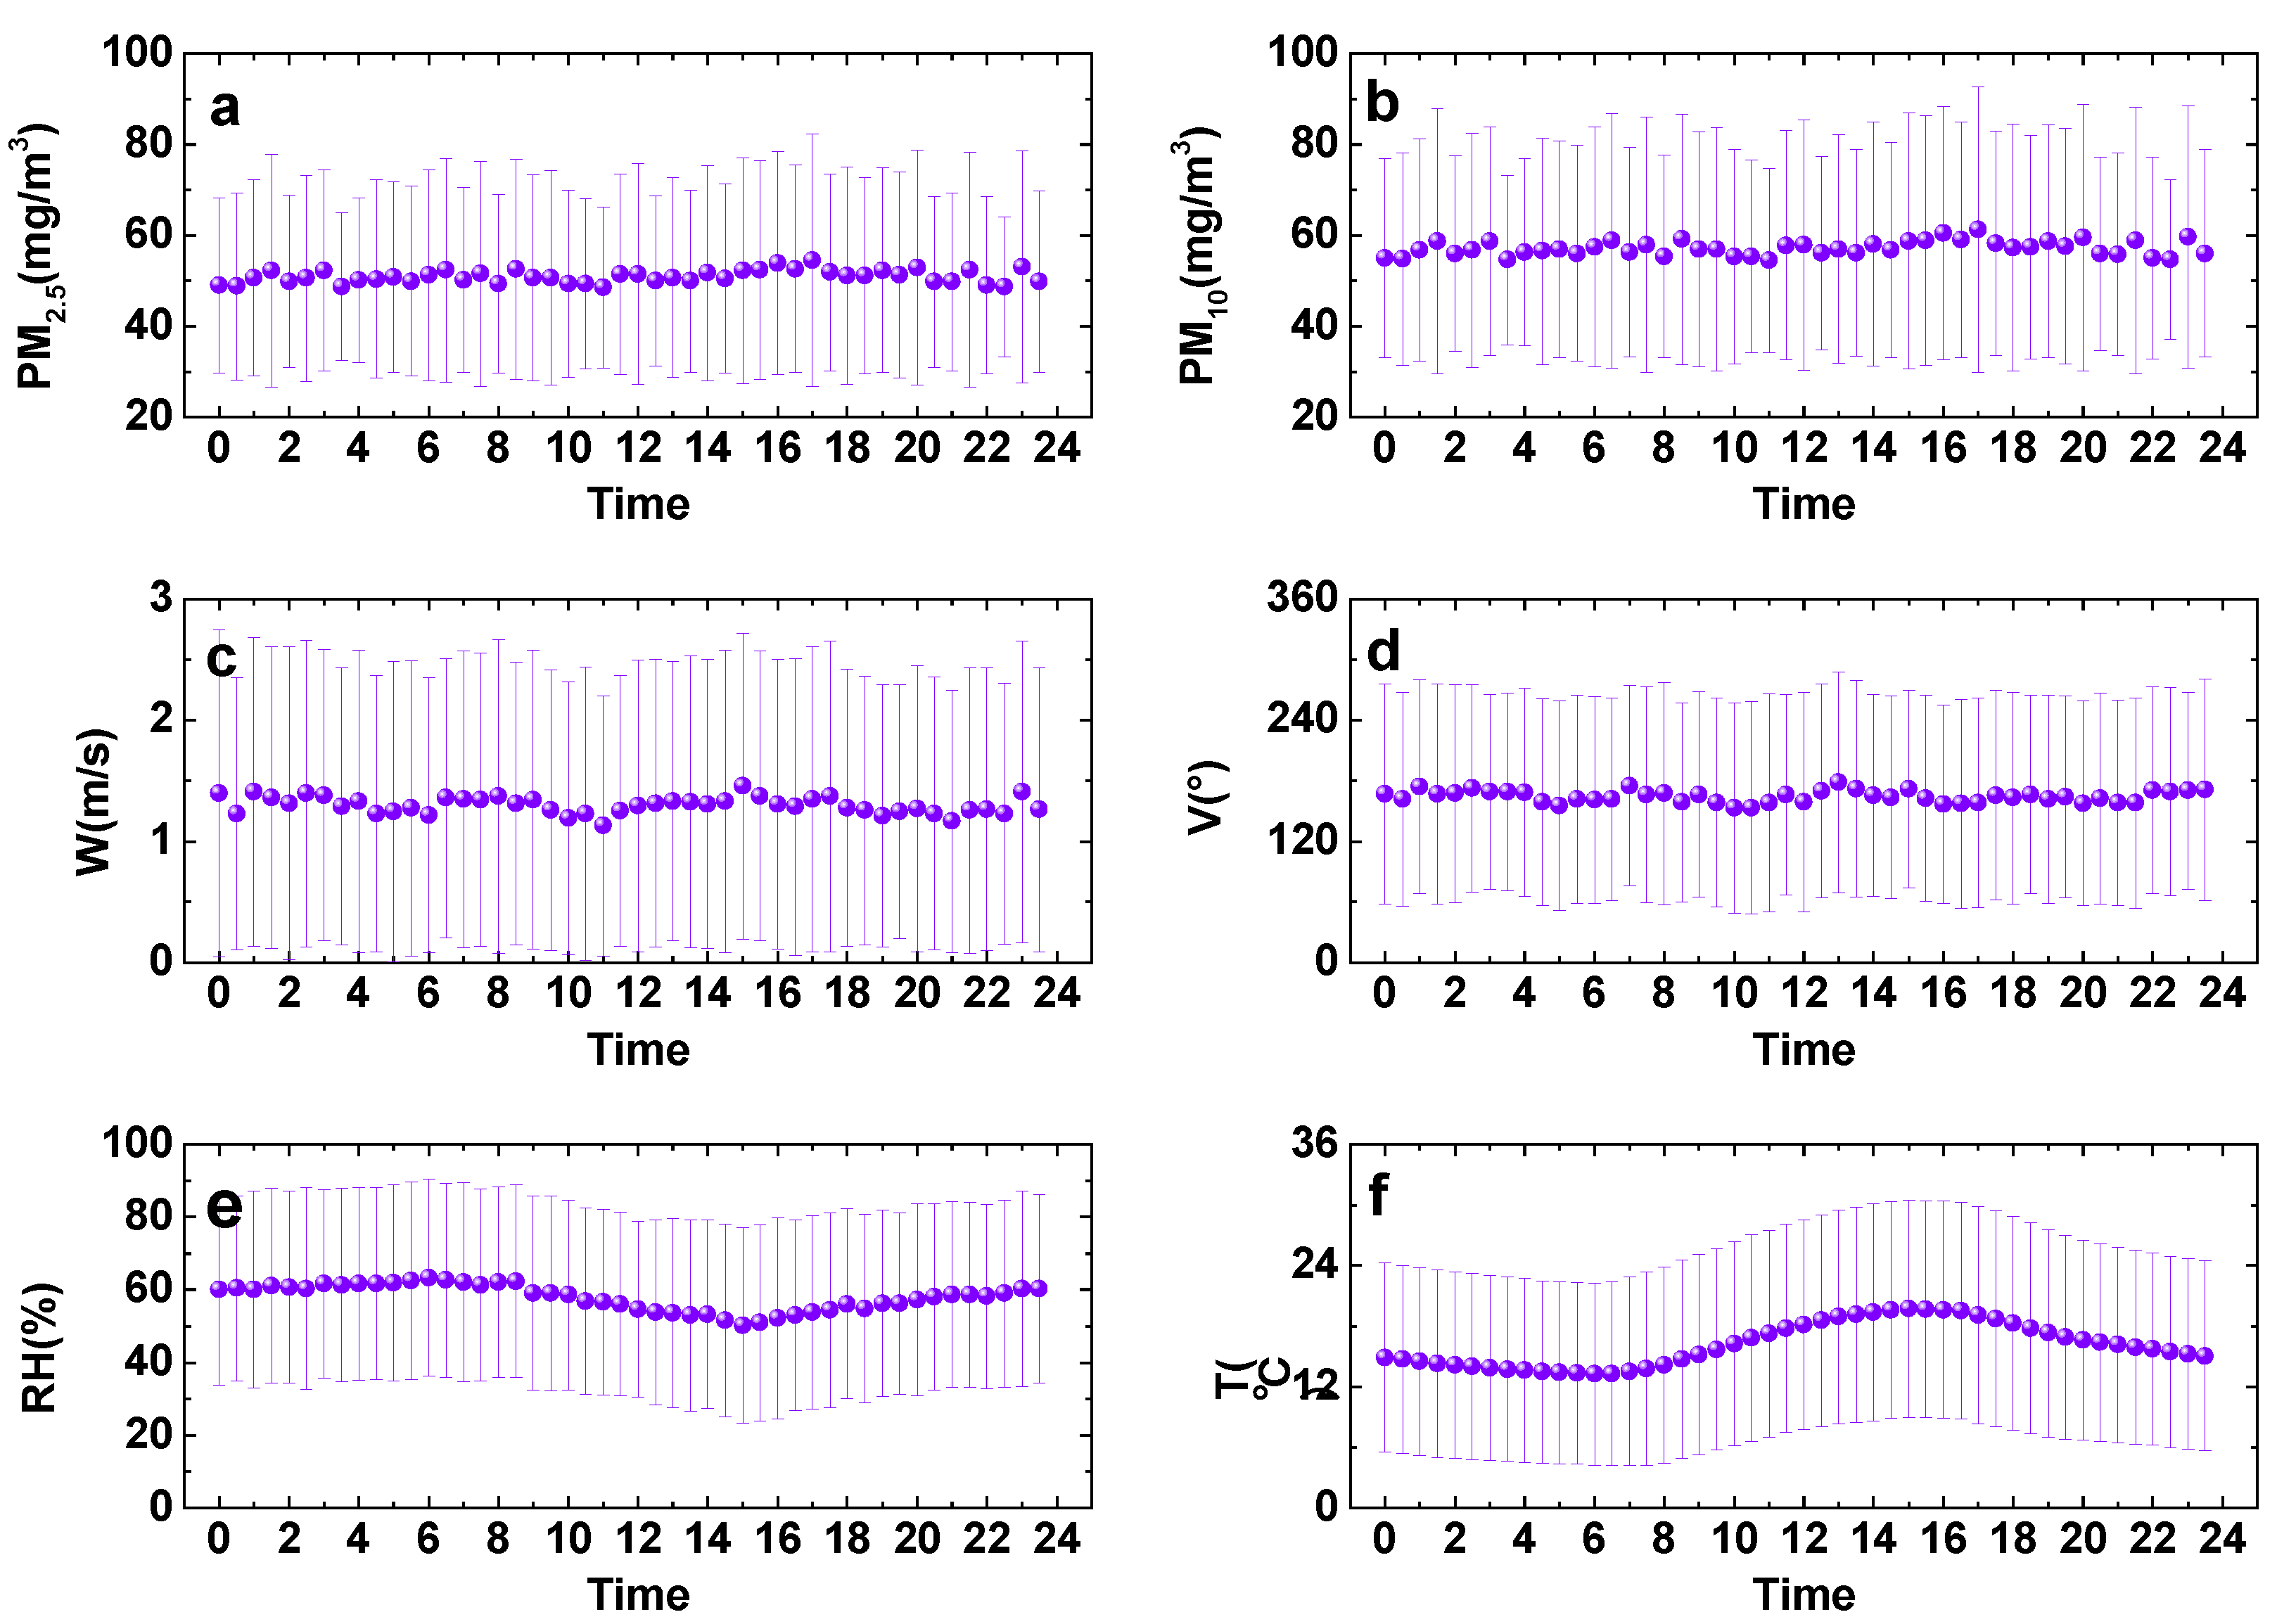
3.3. Daily Variation Characteristics of PM2.5 and PM10 and Meteorological Parameters at TC Station

Figure 9 and Table 3 show the daily variation of PM2.5, PM10, and meteorological parameters at the TC station. It can be seen that daily variations of the PM2.5 and PM10 mass concentrations are not obvious (Figure 9a,b), indicating that they do not change much at any time of the day or night, and remain at low values. This is consistent with the weak monthly variations of PM2.5 and PM10 shown previously in Figure 3a,f. At the same time, the daily characteristics of day-to-day changes in wind speed and wind direction are also not obvious. No matter what time of day, the wind speed and wind direction do not vary much. This is consistent with the aforementioned weak seasonal variation of wind speed and direction (Figure 3b,c). Therefore, it can be seen that PM2.5, PM10, W, and V all have weak seasonal and day-to-day variability at the TC station. The values of PM2.5, PM10, W, and V remained in relatively stable states throughout the year. However, the relative humidity (RH) exhibited more pronounced daily variability.The maximum values of RH appear at 6 a.m. (63.40%) and the minimum values of RH appear at 3 p.m. (50.24%). This was consistent with the results of Zhao et al. [27]. The temperature also showed clear day-to-day variability.The maximum values appear at 3 p.m. (19.72 °C) and the minimum values at 6:00 a.m. (13.26 °C). The day-to-day variation of RH and Tis as generally expected.The day-to-day variation of the sun results in temperature peak values in the afternoon and relative humidity trough values in the afternoon. As in Section 3.2, RH shows how close to saturation water vapor is. Moreover, there is a strong negative correlation between T and RH, because saturation vapor pressure (RH’s denominator) is an exponentially increasing function of the temperature. In the afternoon, the T was high and the saturation vapor values were also high. The actual vapor values were not relatively high in the winter at the TC site. So, RH values were relatively low in the afternoon.To sum up, it can be seen from the daily variation of each parameter that the mass of PM2.5 and PM10 is stable at the TC site.

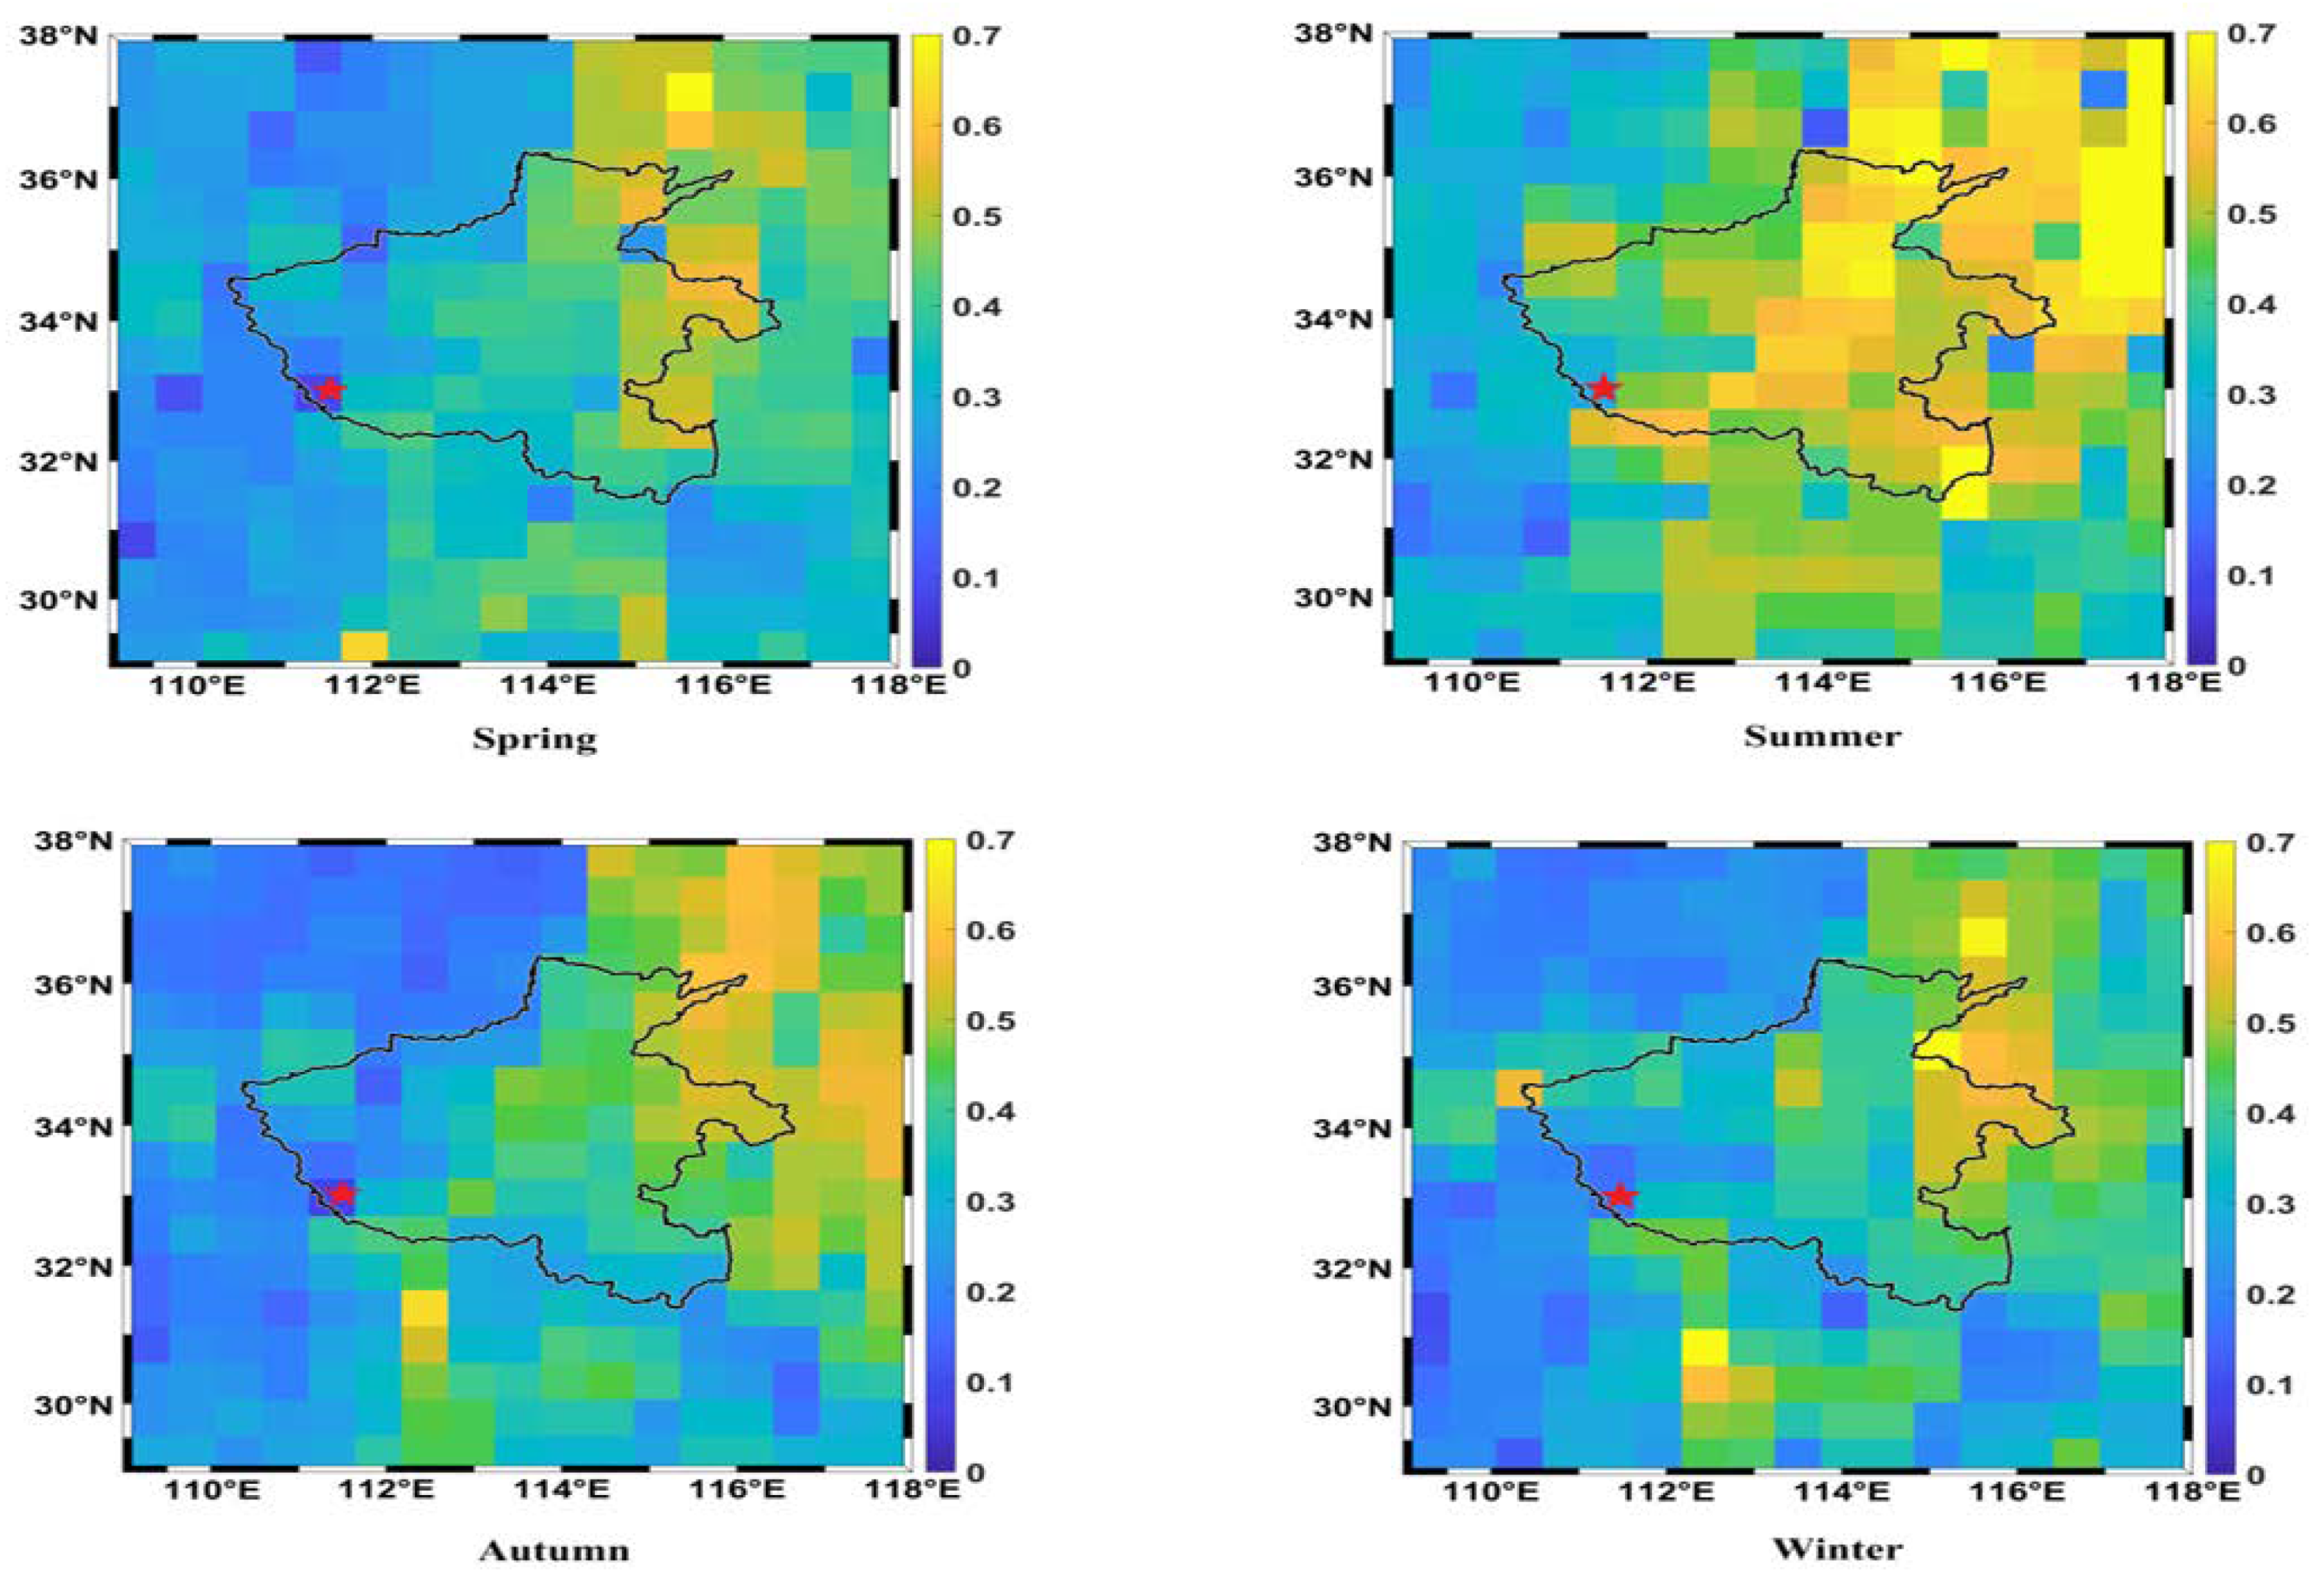
3.4. Remote Sensing Analysis of CALIPSO AOD

AOD is an important optical parameter to study the optical properties of aerosols. In the field of atmospheric remote sensing, AOD is the basic optical parameter for retrieval. It reflects the light-blocking effect of aerosol [1]. The higher the AOD values, the higher the particulate loadings, and vice versa. Therefore, this study utilized the AOD products of the Cloud-Aerosol LiDAR and Infrared Pathfinder Satellite Observation (CALIPSO) satellite [48,49] to study the atmospheric optical properties of aerosols of TC site from January 2007 to December 2019. The results (Figure 10) showed relatively higher AOD in summer (~0.3) around the TC site compared to the other seasons (AOD ~0.1). The relatively high AOD values might be caused by straw burning from long-distance transportation (Figure 8), as summer is the harvest time in the Henan province and farmers burn the crop-residue leading to relative high pollution particulates emission.

4. Conclusions

In this paper, the spatial and temporal characteristics of PM2.5 and PM10 particles and meteorological parameters were studied at the TC station in the Middle Route Project of the South–North Water Diversion in the Henan section from September 2018 to September 2019. AOD products of CALIPSO were also utilized to study the atmospheric optical properties of aerosols of TC site from 2007 to 2019. This study can help researchers understand the quality of the atmospheric environment in the water source area and can also provide new datasets and theoretical support for the protection of the ecological environment of the area. The specific findings are as follows:
(1) The mass concentrations of PM10 and PM2.5 all meet the second-level national standards at the TC station.The air quality in the water source area is good. Seasonal and daily variations of the mass concentrations of PM were not obvious.
(2) The mass concentrations of PM10 and PM2.5 at the TC station are mainly caused by anthropogenic activity sources and there was a part of external pollution sources (straw burning transmission). The types of particulate matter are mainly fine particulate matter (PM2.5) at the TC station.
(3) For monthly mean values, the mass concentrations of PM10 and PM2.5 are closely related to the relative humidity and temperature at TC station, but not to wind speed. Wind directions are northerly all year round at the TC site.
(4) CALIPSO AOD values were low (~0.1) in spring, autumn, and winter. CALIPSO AOD values were slightly high in summer (~0.3), which might be caused by straw burning from long-distance transportation.
Fine particles can also fall onto the land and into rivers and lakes together with other atmospheric and land-based pollutants. In future work, we should strengthen long-term monitoring by utilizing satellite remote sensing technology to explore in greater depth the correlation between atmospheric fallout and water quality in the Middle Route Project of the South–North Water Diversion. The future work can provide new technology and data support for comprehensive ecological measures, such as strengthening the ecological environment and water quality protection in the Middle Route Project of the South–North Water Diversion.

Author Contributions

Conceptualization, M.Z.; methodology, D.W., and B.S.; software, M.B.; validation, Y.L., and B.L.L.; investigation, M.Z.; writing—original draft preparation, M.Z.; writing—review and editing, M.B. and B.S.; project administration, M.Z.; funding acquisition, M.Z. All authors have read and agreed to the published version of the manuscript.

Funding

This research was funded by the National Natural Science Foundation of China (No. 41801282, 51879130), Programs for Science and Technology Development of Henan Province (No. 192102310008), and the National College Students Innovation and Entrepreneurship Training Program (No. 202010481049).

Acknowledgments

We would also like to thank the editors for modifying and revising this manuscript. We would like to thank the Drainage Head Branch of the South–North Diversion Central Line Construction Authority for its support and assistance, and the reviewers for their careful and meticulous review of the manuscript.

Conflicts of Interest

The authors declare no conflict of interest.

References

  1. Kaufman, Y.J.; Tanré, D.; Boucher, O. A satellite view of aerosols in the climate system. Nature 2002, 419, 215–223. [Google Scholar] [CrossRef] [PubMed]
  2. Lelieveld, J.; Evans, J.S.; Fnais, M.; Giannadaki, D.; Pozzer, A. The contribution of outdoor air pollution sources to premature mortality on a global scale. Nature 2015, 525, 367–371. [Google Scholar] [CrossRef] [PubMed]
  3. Pandolfi, M.; Cusack, M.; Alastuey, A.; Querol, X. Variability of aerosol optical properties in the western mediterranean basin. Atmos. Chem. Phys. 2011, 11, 8189–8203. [Google Scholar] [CrossRef] [Green Version]
  4. Kulmala, M.; Kontkanen, J.; Junninen, H.; Lehtipalo, K.; Manninen, H.E.; Nieminen, T.; Petaja, T.; Sipila, M.; Schobesberger, S.; Rantala, P. Direct observations of atmospheric aerosol nucleation. Science 2013, 339, 943–946. [Google Scholar] [CrossRef] [PubMed]
  5. Menon, S.; Hansen, J.; Nazarenko, L.; Luo, Y. Climate effects of black carbon aerosols in china and india. Science 2002, 297, 2250–2253. [Google Scholar] [CrossRef] [Green Version]
  6. Ramanathan, V.; Crutzen, P.J.; Kiehl, J.T. Aerosols, climate, and the hydrological cycle. Science 2005, 294, 2119–2126. [Google Scholar] [CrossRef] [PubMed] [Green Version]
  7. Obregón, M.A.; Costa, M.J.; Silva, A.M.; Serrano, A. Spatial and temporal variation of aerosol and water vapour effects on solar radiation in the mediterranean basin during the last two decades. Remote Sens. 2020, 12, 1316. [Google Scholar] [CrossRef] [Green Version]
  8. Stachlewska, I.S.; Zawadzka, O.; Engelmann, R. Effect of heat wave conditions on aerosol optical properties derived from satellite and ground-based remote sensing over poland. Remote Sens. 2017, 9, 1199. [Google Scholar] [CrossRef] [Green Version]
  9. Evgenieva, T.; Wiman, B.L.; Kolev, N.I.; Savov, P.B.; Donev, E.H.; Ivanov, D.I.; Kolev, I.N. Three-point observation in the troposphere over sofia-plana mountain, bulgaria. Int. J. Remote Sens. 2011, 32, 9343–9363. [Google Scholar] [CrossRef]
  10. Edenhofer, O.; Seyboth, K. Intergovernmental Panel on Climate Change (IPCC). Encyclopedia of Energy, Natural Resource, and Environmental Economics. Earth Syst. Environ. Sci. 2013, 1, 48–56. [Google Scholar]
  11. Pandolfi, M.; Ripoll, A.; Querol, X.; Alastuey, A. Climatology of aerosol optical properties and black carbon mass absorption cross section at a remote high-altitude site in the western mediterranean basin. Atmos. Chem. Phys. 2014, 14, 6443–6460. [Google Scholar] [CrossRef] [Green Version]
  12. Bergin, M.H.; Cass, G.R.; Xu, J.; Fang, C.; Zeng, L.M.; Yu, T.; Salmon, L.G.; Kiang, C.S.; Tang, X.Y.; Zhang, Y.H. Aerosol radiative, physical, and chemical properties in beijing during june 1999. J. Geophys. Res. 2001, 106, 17969–17980. [Google Scholar] [CrossRef] [Green Version]
  13. Zhang, Y.L.; Cao, F. Fine particulate matter (pm2.5) in china at a city level. Sci. Rep. 2015, 5, 14884. [Google Scholar] [CrossRef] [Green Version]
  14. Ho, K.F.; Cao, J.J.; Lee, S.C.; Chan, C.K. Source apportionment of pm2.5 in urban area of hong kong. J. Hazard. Mater. 2006, 138, 73–85. [Google Scholar] [CrossRef] [PubMed]
  15. Fraser, M.P.; Yue, Z.W.; Buzcu, B. Source apportionment of fine particulate matter in houston, tx, using organic molecular markers. Atmos. Environ. 2003, 37, 2117–2123. [Google Scholar] [CrossRef]
  16. Kappos, A.D.; Bruckmann, P.; Eikmann, T.; Englert, N.; Heinrich, U.; Hoeppe, P.; Koch, E.; Krause, G.H.M.; Kreyling, W.G.; Rauchfuss, K. Health effects of particles in ambient air. Int. J. Hyg. Environ. Health 2004, 207, 399–407. [Google Scholar] [CrossRef] [PubMed]
  17. Götschi, T.; Heinrich, J.; Sunyer, J.; Künzli, N. Long-term effects of ambient air pollution on lung function: A review. Epidemiology 2008, 19, 690–701. [Google Scholar] [CrossRef] [PubMed] [Green Version]
  18. Englert, N. Fine particles and human health--a review of epidemiological studies. Toxicol. Lett. 2004, 149, 235–242. [Google Scholar] [CrossRef]
  19. Shi, Y.; Liu, B.; Chen, S.; Gong, W.; Jin, Y. Characteristics of aerosol within the nocturnal residual layer and its effects on surface pm2.5 over china. Atmos. Environ. 2020, 241, 117841. [Google Scholar] [CrossRef]
  20. Pope Iii, C.A.; Burnett, R.T.; Thun, M.J.; Calle, E.E.; Krewski, D.; Ito, K.; Thurston, G.D. Lung cancer, cardiopulmonary mortality, and long-term exposure to fine particulate air pollution. JAMA 2002, 287, 1132–1141. [Google Scholar] [CrossRef] [Green Version]
  21. Ko, F.W.S.; Tam, W.; Wong, T.W.; Lai, C.K.W.; Wong, G.W.K.; Leung, T.F.; Ng, S.S.S.; Hui, D.S.C. Effects of air pollution on asthma hospitalization rates in different age groups in hong kong. Clin. Exp. Allergy 2010, 37, 1312–1319. [Google Scholar] [CrossRef]
  22. Wong, W.T. Associations between daily mortalities from respiratory and cardiovascular diseases and air pollution in hong kong, china. Occup. Environ. Med. 2002, 59, 30–35. [Google Scholar] [CrossRef] [PubMed] [Green Version]
  23. Mysliwiec, M.J.; Kleeman, M.J. Source apportionment of secondary airborne particulate matter in a polluted atmosphere. Environ. Ence Technol. 2002, 36, 5376. [Google Scholar] [CrossRef] [PubMed]
  24. Biswas, J.; Pathak, B.; Patadia, F.; Bhuyan, P.K.; Gogoi, M.M.; Babu, S.S. Satellite-retrieved direct radiative forcing of aerosols over north-east india and adjoining areas: Climatology and impact assessment. Int. J. Climatol. 2017, 37, 4756. [Google Scholar] [CrossRef] [Green Version]
  25. Wang, X.; Dickinson, R.E.; Su, L.; Zhou, C.; Wang, K. PM 2.5 pollution in china and how it has been exacerbated by terrain and meteorological conditions. Bull. Am. Meteorol. Soc. 2018, 99, 105–119. [Google Scholar] [CrossRef]
  26. Dominici, F.; Peng, R.D.; Bell, M.L.; Pham, L.; McDermott, A.; Zeger, S.L.; Samet, J.M. Fine particulate air pollution and hospital admission for cardiovascular and respiratory diseases. JAMA J. Am. Med Assoc. 2006, 295, 1127–1134. [Google Scholar] [CrossRef] [PubMed] [Green Version]
  27. Zhao, X.; Zhang, X.; Xu, X.; Jing, X.; Wei, M.; Pu, W. Seasonal and diurnal variations of ambient pm_(2.5) concentration in urban and rural environments in beijing. Atmos. Environ. 2009, 43, 2893–2900. [Google Scholar] [CrossRef]
  28. Wang, W.; Primbs, T.; Tao, S.; Simonich, S.L.M. Atmospheric particulate matter pollution during the 2008 beijing olympics. Environ. Ence Technol. 2009, 43, 5314. [Google Scholar] [CrossRef] [PubMed] [Green Version]
  29. Bilal, M.; Nichol, J.E. Evaluation of modis aerosol retrieval algorithms over the beijing-tianjin-hebei region during low to very high pollution events. J. Geophys. Res. Atmos. 2015, 120, 7941–7957. [Google Scholar] [CrossRef] [Green Version]
  30. Che, H.; Xia, X.; Zhu, J.; Li, Z.; Dubovik, O.; Holben, B.; Goloub, P.; Chen, H.; Estelles, V.; Cuevasagulló, E. Column aerosol optical properties and aerosol radiative forcing during a serious haze-fog month over north china plain in 2013 based on ground-based sunphotometer measurements. Atmos. Chem. Phys. 2014, 14, 2125–2138. [Google Scholar] [CrossRef] [Green Version]
  31. Wu, Z.J.; Ma, N.; Größ, J.; Kecorius, S.; Lu, K.D.; Shang, D.J.; Wang, Y.; Wu, Y.S.; Zeng, L.M.; Hu, M.; et al. Thermodynamic properties of nanoparticles during new particle formation events in the atmosphere of north china plain. Atmos. Res. 2017, 188, 55–63. [Google Scholar] [CrossRef]
  32. He, L.; Wang, L.; Lin, A.; Ming, Z.; Bilal, M.; Tao, M. Aerosol optical properties and associated direct radiative forcing over the yangtze river basin during 2001–2015. Remote Sens. 2017, 9, 746. [Google Scholar] [CrossRef] [Green Version]
  33. Qin, K.; Zou, J.; Guo, J.; Lu, M.; Bilal, M.; Zhang, K.; Ma, F.; Zhang, Y. Estimating pm1 concentrations from modis over yangtze river delta of china during 2014–2017. Atmos. Environ. 2018, 195, 149–158. [Google Scholar] [CrossRef]
  34. Zhang, M.; Ma, Y.; Wang, L.; Gong, W.; Hu, B.; Shi, Y. Spatial-temporal characteristics of aerosol loading over the yangtze river basin during 2001–2015. Int. J. Climatol. 2017, 38, 2138–2152. [Google Scholar] [CrossRef]
  35. Cheng, Y.F.; Wiedensohler, A.; Eichler, H.; Su, H.; Gnauk, T.; Brüggemann, E.; Herrmann, H.; Heintzenberg, J.; Slanina, J.; Tuch, T. Aerosol optical properties and related chemical apportionment at xinken in pearl river delta of china. Atmos. Environ. 2008, 42, 6351–6372. [Google Scholar] [CrossRef]
  36. Ansmann, A.; Engelmann, R.; Althausen, D.; Wandinger, U.; Hu, M.; Zhang, Y.; He, Q. High aerosol load over the pearl river delta, china, observed with raman lidar and sun photometer. Geophys. Res. Lett. 2005, 32. [Google Scholar] [CrossRef]
  37. Zhu, Y.P.; Zhang, H.P.; Chen, L.; Zhao, J.F. Influence of the south-north water diversion project and the mitigation projects on the water quality of han river. Ence Total Environ. 2008, 406, 57–68. [Google Scholar] [CrossRef]
  38. Ren, G.; Liu, H.; Chu, Z.; Zhang, L.; Zhang, Y. Multi-time-scale climatic variations over eastern china and implications for the south-north water diversion project. J. Hydrometeorol. 2011, 12, 600–617. [Google Scholar] [CrossRef]
  39. Li, S.; Xu, Z.; Cheng, X.; Zhang, Q. Dissolved trace elements and heavy metals in the danjiangkou reservoir, china. Environ. Geol. 2008, 55, 977–983. [Google Scholar] [CrossRef]
  40. Ye, B.; Ji, X.; Yang, H.; Yao, X.; Chan, C.K.; Cadle, S.H.; Chan, T.; Mulawa, P.A. Concentration and chemical composition of pm 2.5 in shanghai for a 1-year period. Atmos. Environ. 2003, 37, 499–510. [Google Scholar] [CrossRef]
  41. Chan, C.K.; Yao, X. Air pollution in mega cities in china. Atmos. Environ. 2008, 42, 1–42. [Google Scholar] [CrossRef]
  42. Hu, M.; Wong, H.; Yin, Q.; Wang, J. Estimation of daily pm2.5 concentration and its relationship with meteorological conditions in beijing. J. Environ. Sci. 2016, 48, 161–168. [Google Scholar] [CrossRef] [PubMed]
  43. Li, Y.; Chen, Q.; Zhao, H.; Wang, L.; Tao, R. Variations in pm10, pm2.5 and pm1.0 in an urban area of the sichuan basin and their relation to meteorological factors. Atmosphere 2015, 6, 150–163. [Google Scholar] [CrossRef] [Green Version]
  44. Charlson, R.J.; Schwartz, S.E.; Hales, J.M.; Cess, R.D.; Coakley, J.A.; Hansen, J.E.; Hofmann, D.J. Climate forcing by anthropogenic aerosols. Ence 1992, 255, 423–430. [Google Scholar] [CrossRef]
  45. Bilal, M.; Nichol, J.; Nazeer, M.; Shi, Y.; Wang, L.; Kumar, K.; Ho, H.; Mazhar, U.; Bleiweiss, M.; Qiu, Z. Characteristics of fine particulate matter (PM2.5) over urban, suburban, and rural areas of hong kong. Atmosphere 2019, 10, 496. [Google Scholar] [CrossRef] [Green Version]
  46. Wang, Y.Q.; Zhang, X.Y.; Sun, J.Y.; Zhang, X.C.; Che, H.Z.; Li, Y. Spatial and temporal variations of the concentrations of pm10, pm2.5 and pm1 in china. Atmos. Chem. Phys. Discuss. 2015, 15, 3585–13598. [Google Scholar] [CrossRef]
  47. Zhang, M.; Ma, Y.; Gong, W.; Zhu, Z. Aerosol optical properties of a haze episode in wuhan based on ground-based and satellite observations. Atmosphere 2014, 5, 699–719. [Google Scholar] [CrossRef] [Green Version]
  48. Winker, D.M.; Tackett, J.L.; Getzewich, B.J.; Liu, Z.; Vaughan, M.A.; Rogers, R.R. The global 3-d distribution of tropospheric aerosols as characterized by caliop. Atmos. Chem. Phys. 2013, 13, 3345–3361. [Google Scholar] [CrossRef] [Green Version]
  49. Zhang, M.; Su, B.; Bilal, M.; Atique, L.; Usman, M.; Qiu, Z.; Ali, M.; Han, G. An investigation of vertically distributed aerosol optical properties over pakistan using calipso satellite data. Remote Sens. 2020, 12, 2183. [Google Scholar] [CrossRef]
Figure 1. Location of Taocha (TC) atmospheric monitoring station in the Henan section of the Middle Route Project of South–North Water Diversion.
Remotesensing 12 03432 g001
Figure 2. Distribution of particulate matter (PM)2.5, PM10 concentration(a,b), and probability density of meteorological parameters(cf) at the Taocha monitoring station.
Remotesensing 12 03432 g002
Figure 3. Box plot of monthly changes of PM2.5 and PM10 mass concentrations and meteorological parameters at TC monitoring station: (a) PM2.5; (b) wind direction; (c) wind speed; (d) relative humidity; (e) temperature; (f) PM10. The synapses stand for standard deviations. The red dots stand for mean values.
Remotesensing 12 03432 g003
Figure 4. Correlation plot of PM2.5 and PM10 and meteorological parameters at Taocha monitoring station: (a) PM2.5 and W; (b) PM10 and W; (c) PM2.5 and RH; (d) PM10 and RH; (e) PM2.5 and T; (f) PM10 and T. The scatter points represent the monthly mean values of every parameter. The red solid lines represent the fitted lines. The synapses stand for standard deviations.
Remotesensing 12 03432 g004
Figure 5. Four seasons’ wind speed and wind direction rosettes at the Taocha monitoring station.
Remotesensing 12 03432 g005
Figure 6. Correlation diagram of PM2.5 and PM10 at the Taocha monitoring station of the South–North Water Diversion Central Line Project.
Remotesensing 12 03432 g006
Figure 7. Box diagram of the ratio of PM2.5 and PM10 at the Taocha monitoring station of the South–North Water Diversion Central Line Project.
Remotesensing 12 03432 g007
Figure 8. Seasonal variation characteristics of air mass at the Taocha monitoring station of the South–North Diversion Central Line Project from Hybrid Single-Particle Lagrangian Integrated Trajectory(HYSPLIT trajectory model: (a) spring; (b) summer; (c) autumn; (d) winter. The red five-pointed stars stand for the location of TC site.
Remotesensing 12 03432 g008aRemotesensing 12 03432 g008b
Figure 9. Daily variation characteristics of PM2.5 and PM10 and meteorological parameters at the Taocha monitoring station of the South–North Diversion Central Line Project: (a) PM2.5 mass concentration; (b) PM2.5 mass concentration; (c) W; (d) V; (e) RH; (f) T. The scatter points represent the number of days. The synapses stand for standard deviations.
Remotesensing 12 03432 g009
Figure 10. Seasonal variation characteristics of aerosol optical depth at the Taocha monitoring station of the South–North Diversion Central Line Project: spring; summer; autumn; winter. The red five-pointed stars stand for the location of the TC site.
Remotesensing 12 03432 g010
Table 1. Annual statistics of PM2.5 and PM10 mass concentrations and meteorological parameters at the Taocha (TC) monitoring station.
HourlyCountsMeanSDPercentiles
base 1025507590
T (℃)16,11516.1910.102.107.8016.5024.9029.10
RH (%)16,11557.9526.4719.7039.1056.2082.0094.40
W (m/s)16,1151.301.190.000.500.901.802.90
V(°)16,115164.42103.330103147201332
PM2.5 (μg/m3)16,11550.9122.0034.0040.0047.0054.0056.00
PM10 (μg/m3)16,11557.1825.0238.0045.0052.0061.0063.00
Table 2. Monthly statistics of PM2.5 and PM10 mass concentrations and meteorological parameters at the TC monitoring station.
MonthT (℃)RH (%)W (m/s)V (°)PM2.5(μg/m3)PM10(μg/m3)
MeanStdMeanStdMeanStdMeanStdMeanStdMeanStd
Jan3.063.1879.5516.471.280.92179.53104.0053.1623.0459.7126.2
Feb3.704.0280.7715.591.321.02171.71103.6553.3524.0559.9427.35
Mar12.534.8372.8620.560.920.95135.6193.9451.7621.1458.1624.04
Apr16.124.8562.4419.920.810.83127.6293.0550.51956.7421.61
May22.104.4942.2816.811.281.23168.99105.3048.6317.4254.6419.84
Jun26.233.8033.5913.941.671.37194.66101.7748.521.0854.4223.98
Jul27.963.6731.0513.551.851.44193.27103.3249.6223.3555.6826.54
Aug28.093.1530.7713.541.831.46191.31107.3148.724.3354.6127.63
Sep23.834.2437.9814.851.441.21187.89104.6548.518.9154.4621.54
Oct17.333.4758.0917.580.810.87126.9496.4048.5313.3454.5715.19
Nov11.243.6178.1017.640.920.97127.9988.1853.423.7359.9727
Dec4.474.5082.8514.581.251.03156.8397.1354.5825.9461.3329.51
Table 3. Hourly statistical table of PM2.5 and PM10 concentration and meteorological parameters of TC monitoring station.
MonthT(℃)RH(%)W(m/s)V(°)PM2.5(μg/m3)PM10(μg/m3)
MeanStdMeanStdMeanStdMeanStdMeanstdMeanStd
014.879.3860.0326.171.401.35166.96108.7248.9719.2854.9621.94
114.549.2960.1126.971.411.28173.90105.9750.5821.6056.7824.57
214.179.2460.7626.411.311.29167.30107.5249.9018.9656.0321.55
313.859.1661.6425.931.381.20169.2196.3452.2622.1158.7125.15
413.629.0861.6126.591.331.25168.51103.2950.1618.1056.3620.61
513.409.0261.8727.001.251.24155.18103.7350.7420.9856.9923.85
613.269.0463.4027.041.221.14161.01102.1551.2423.1457.5026.33
713.539.3262.0727.361.351.23175.1999.1750.1620.3056.3123.11
814.169.7462.1226.171.371.30167.34109.6849.3319.6755.3722.37
915.209.9059.1326.741.351.23166.26101.9350.7022.7156.9625.80
1016.2810.0958.6026.151.191.12152.95104.3149.3520.7055.3623.54
1117.2810.2456.5925.521.131.07158.13108.3048.5217.7554.4720.20
1218.1610.4054.7024.221.301.21159.00108.6251.5224.2857.9027.59
1318.9310.5653.5925.961.331.15178.29109.0950.6922.0556.9925.07
1419.3810.7453.2625.871.311.20165.53100.2251.7123.5958.1226.82
1519.7210.7850.2426.781.451.26171.7997.6252.3024.8058.7728.18
1619.6110.7852.1527.741.311.20156.9297.9553.8524.5360.5027.90
1719.0910.7253.7426.611.351.26158.18103.7254.5027.7161.3031.49
1818.3010.5856.0726.121.271.14162.96104.8751.0623.8757.3327.14
1917.3210.2856.2925.621.211.08161.98102.9152.3322.5458.7825.64
2016.629.8957.2326.371.271.18157.64101.2552.9425.8359.4629.38
2116.179.6958.6925.481.161.08158.36101.5649.7719.5655.8522.26
2215.749.5258.1725.291.271.17170.41102.3349.0719.5655.0622.25
2315.269.4560.2026.821.411.25170.2897.7753.0925.4359.6528.91
Publisher’s Note: MDPI stays neutral with regard to jurisdictional claims in published maps and institutional affiliations.

