National-Scale Variation and Propagation Characteristics of Meteorological, Agricultural, and Hydrological Droughts in China

 ,
, 

 ,
,
Abstract
:
1. Introduction
2. Materials and Methods
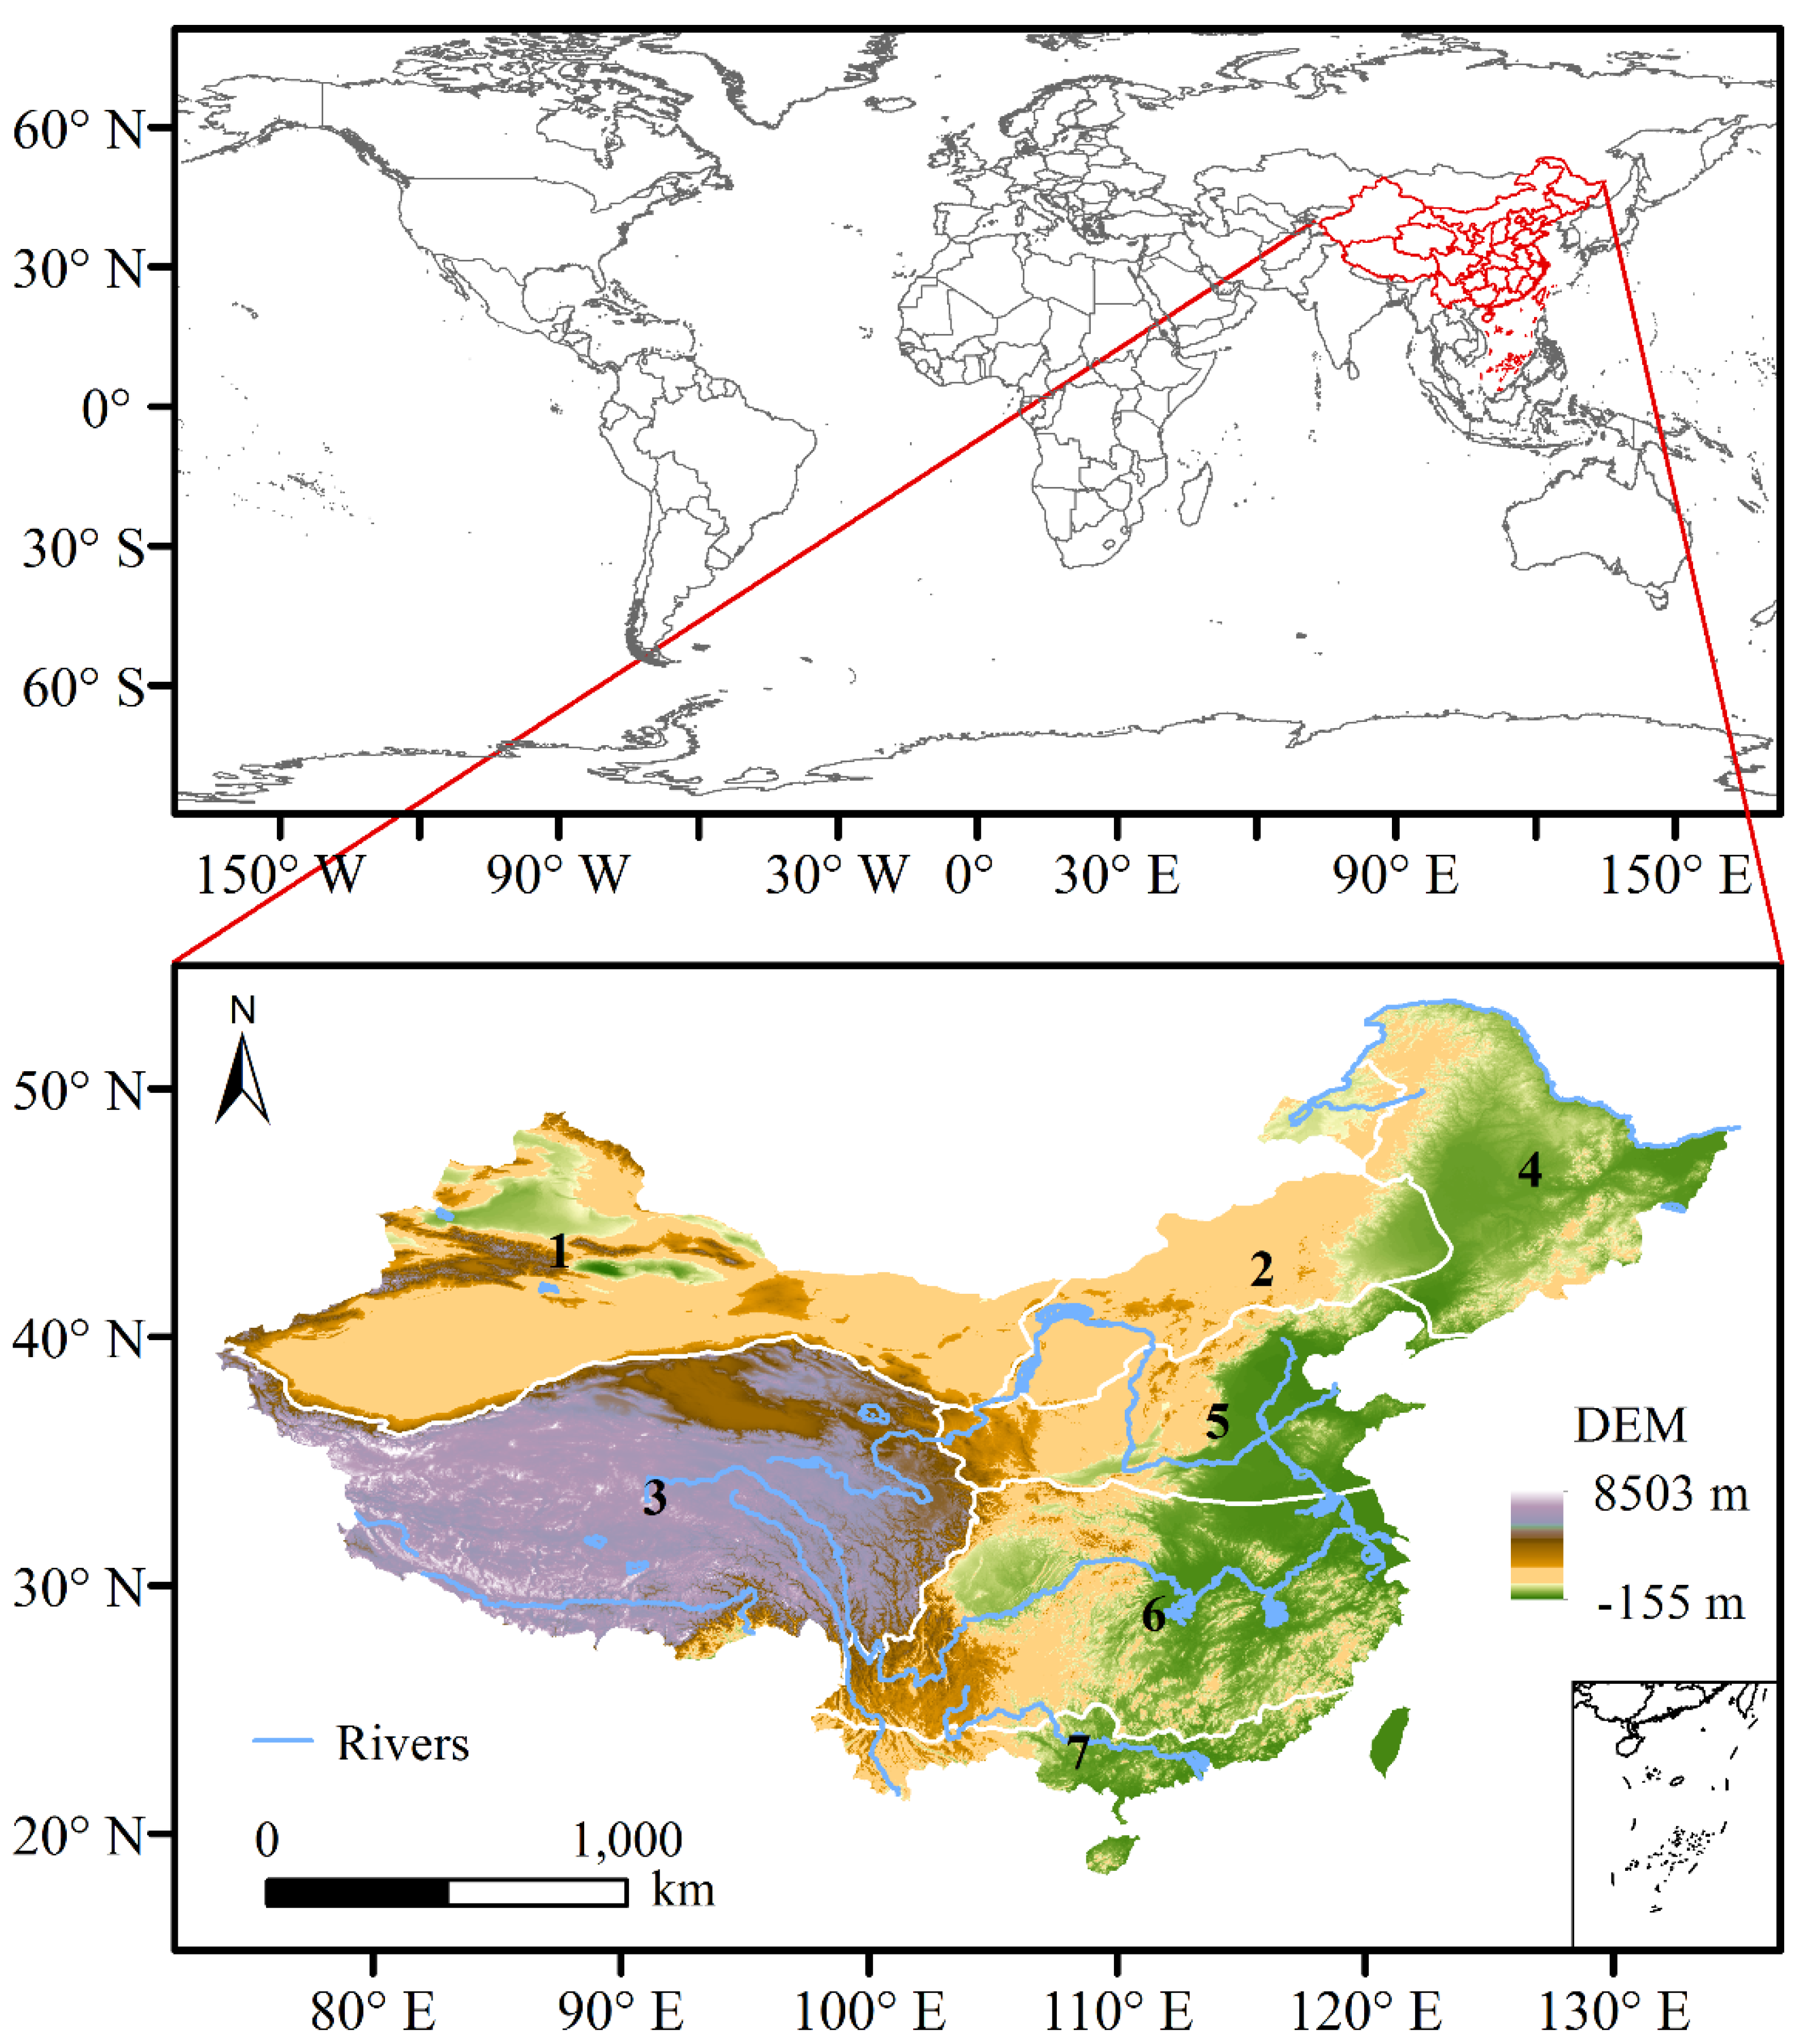
2.1. Regional Setting
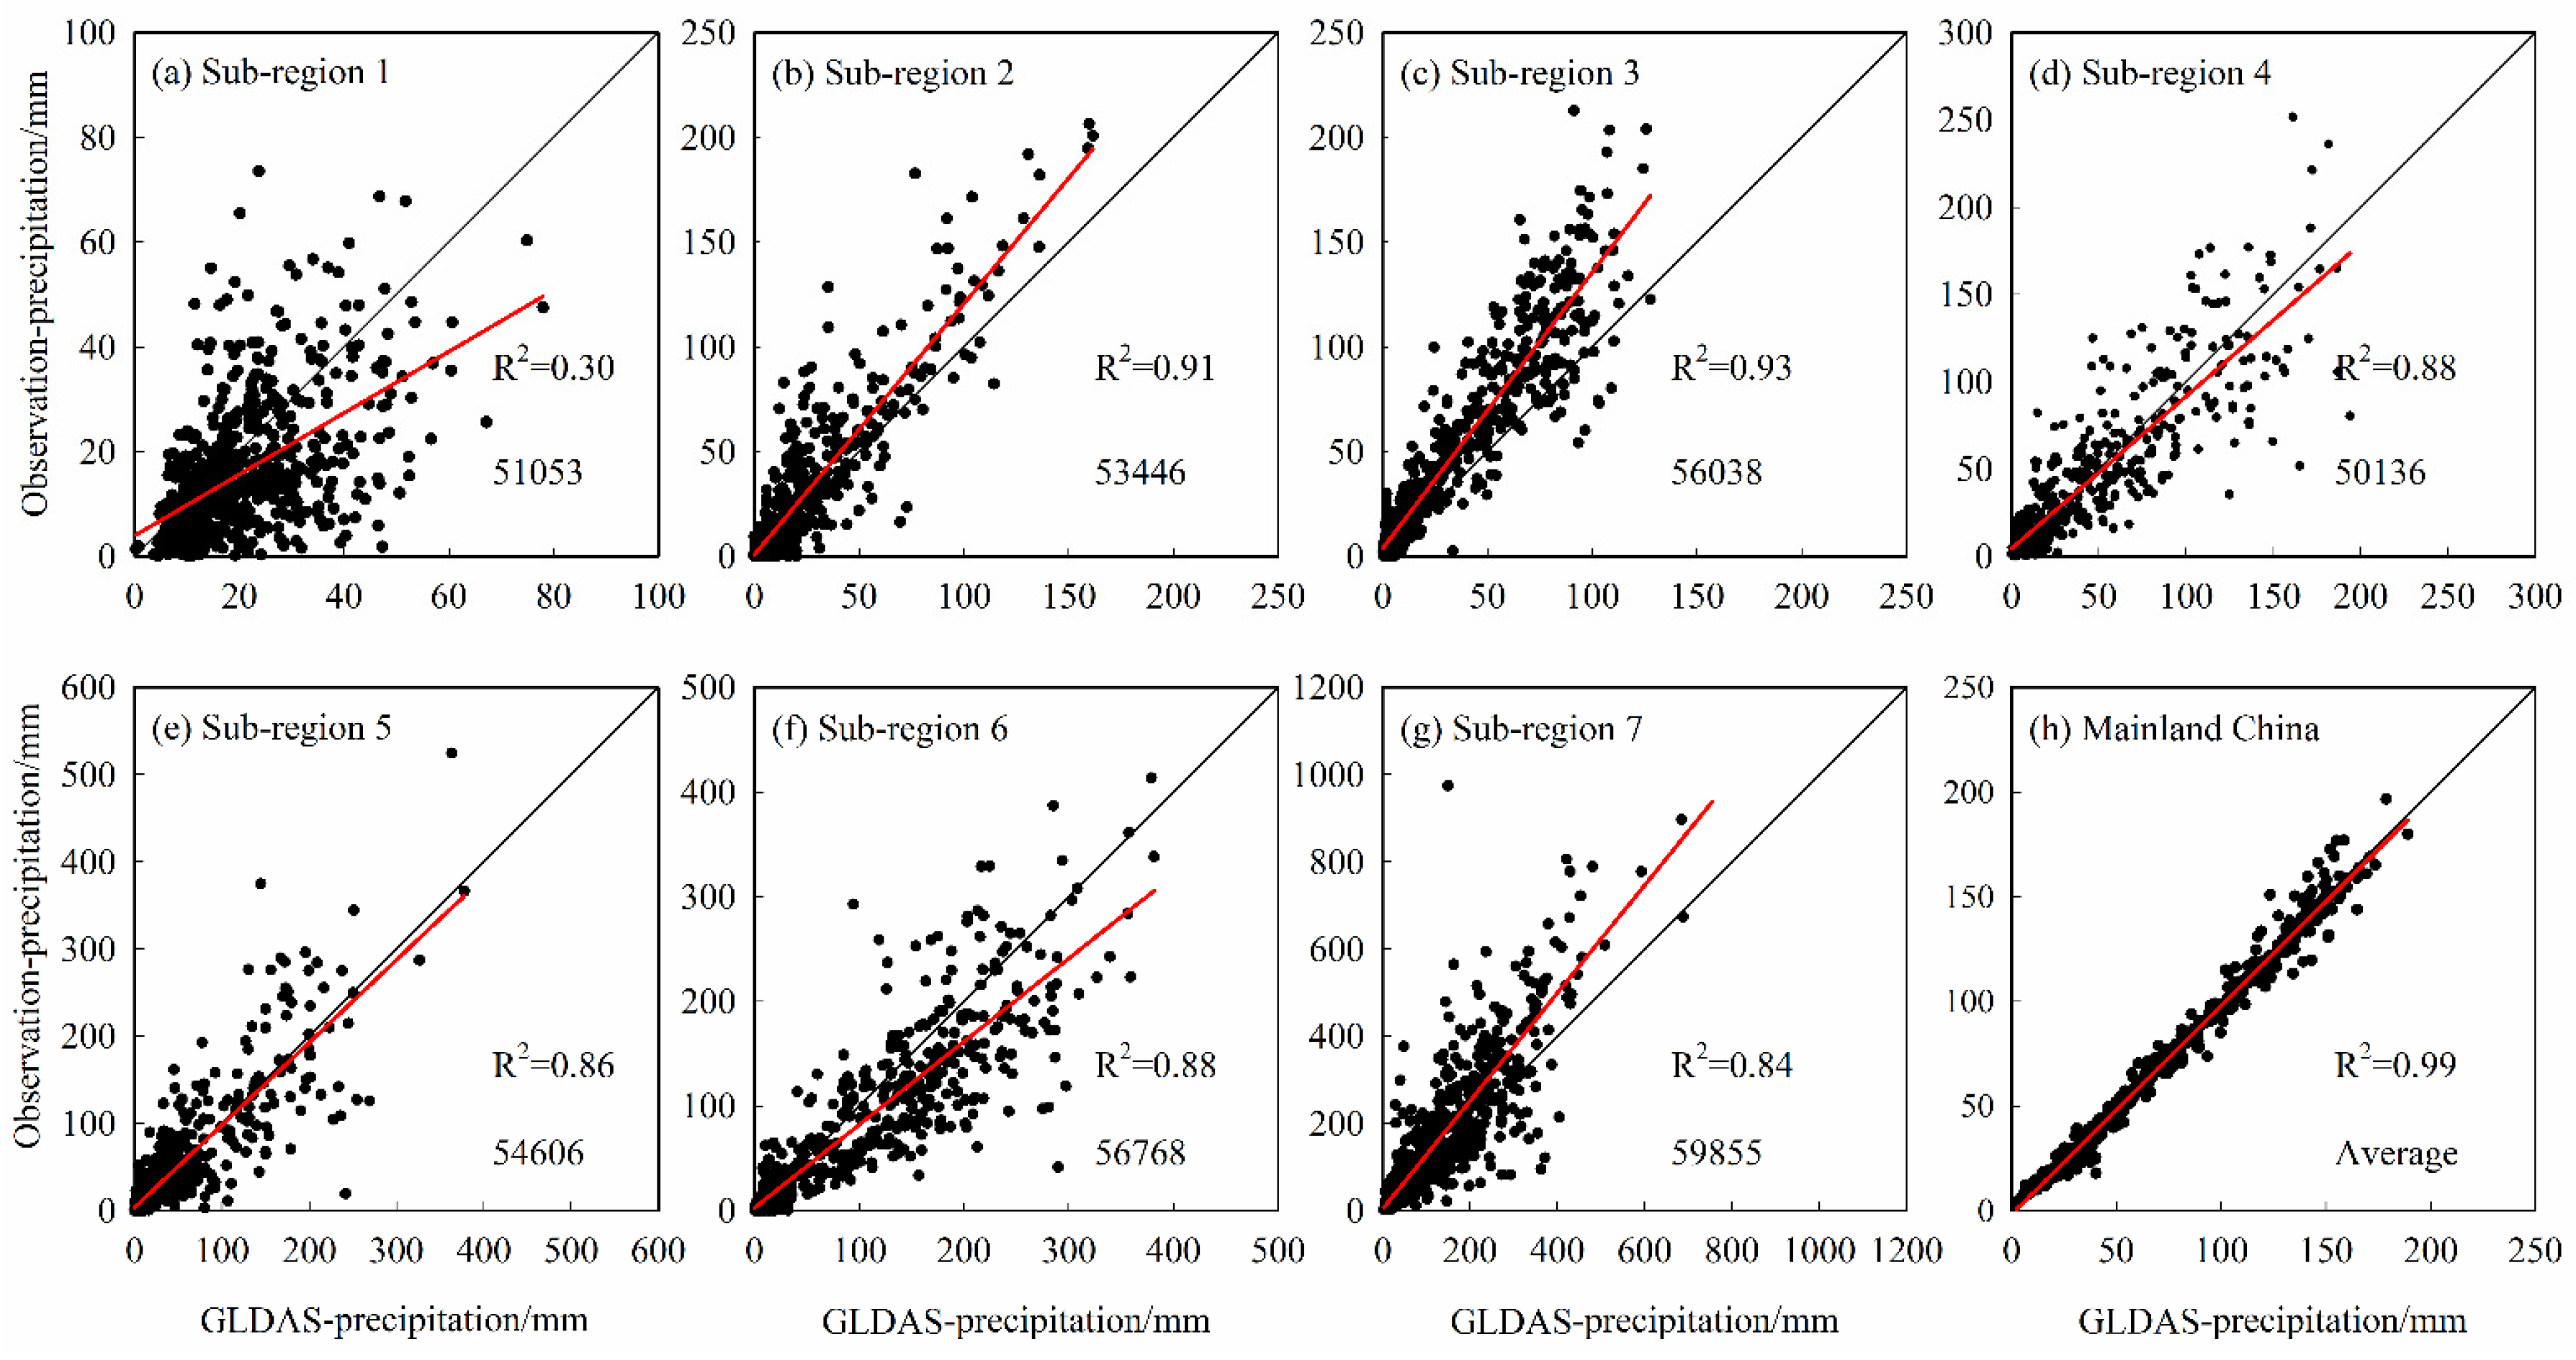
2.2. Datasets
2.3. The Computation of Standardized Precipitation Index (SPI), Standardized Soil Moisture Index (SSI), and Soil Runoff Index (SRI)
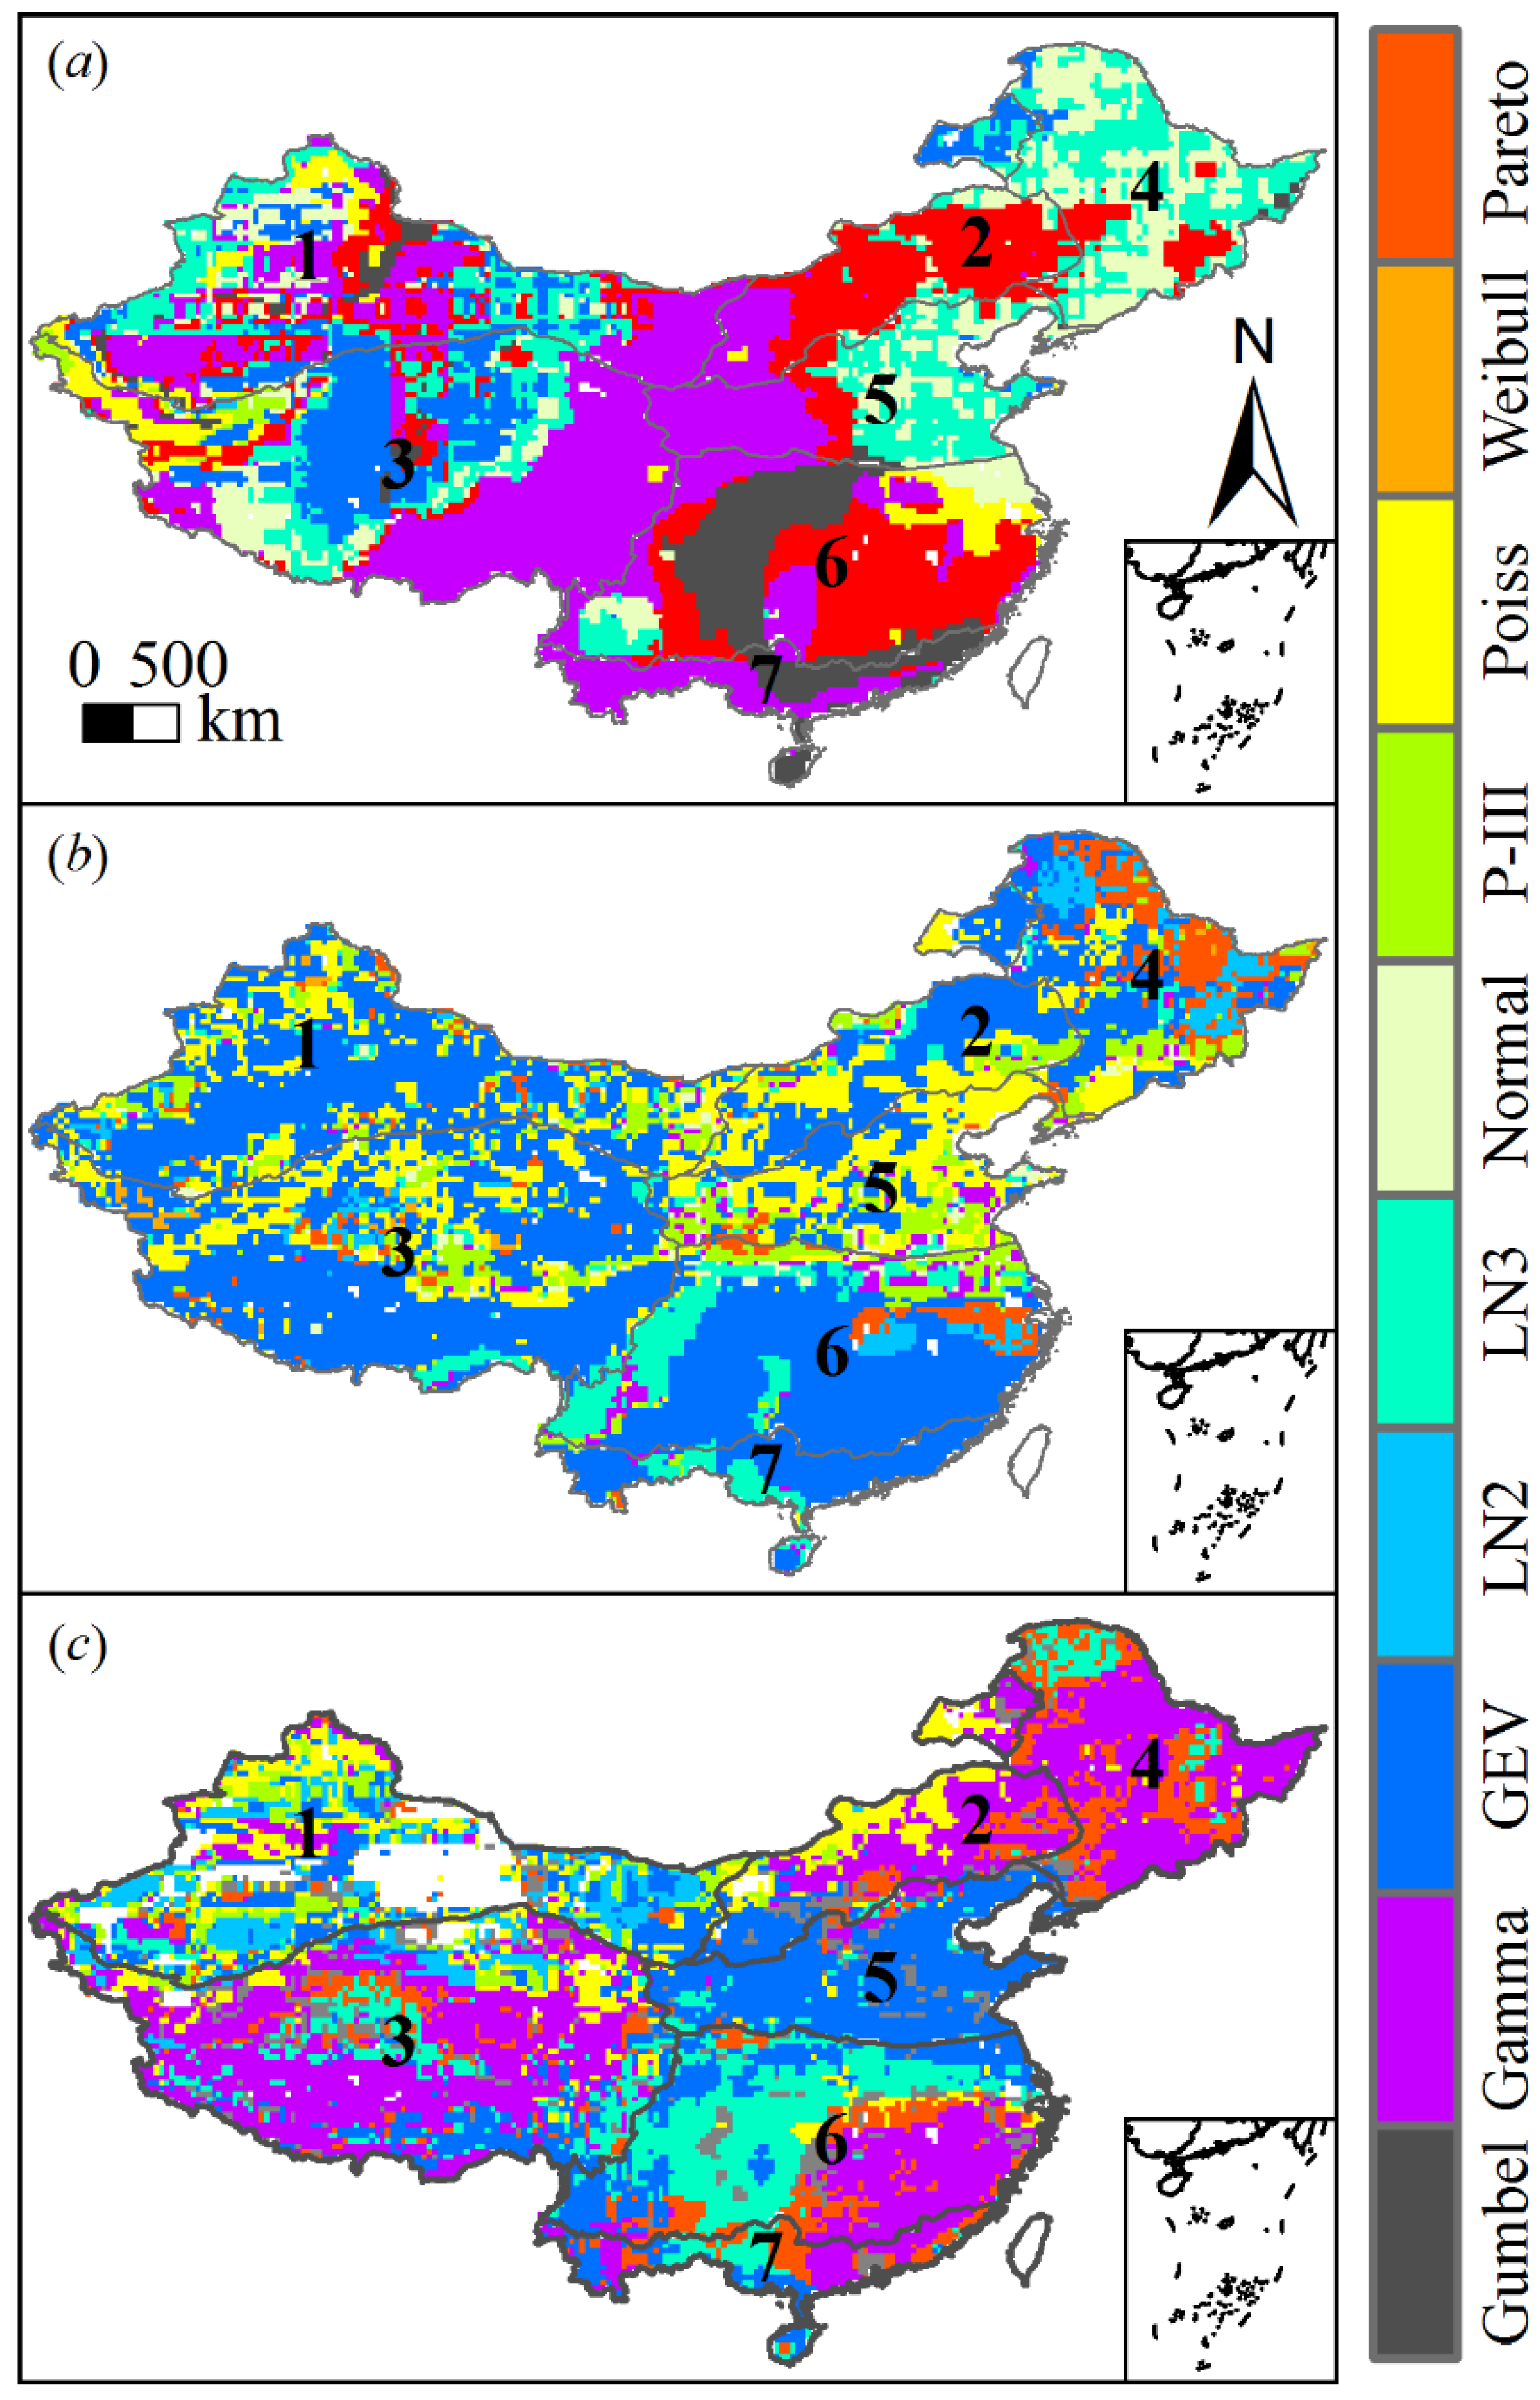
2.3.1. Selection of Suitable Probability Density Functions of Spatiotemporal Variations of Precipitation (PPT), Soil Water Storage (SWS), and Baseflow-Groundwater Runoff (BGR)
2.3.2. The Calculation of Standardized Drought Indices
2.4. Time Series Analysis of SPI, SSI, and SRI
2.4.1. Trend Test Using the Modified Mann-Kendall Method
2.4.2. Periodical Characteristics Based on Wavelet Analysis
2.5. Correlation Analysis
2.5.1. Pearson Correlation Analysis between Pairs of SPI, SSI, and SRI
2.5.2. Lag Time Analysis
3. Results
3.1. Spatiotemporal Variations in PPT, SWS, and BGR
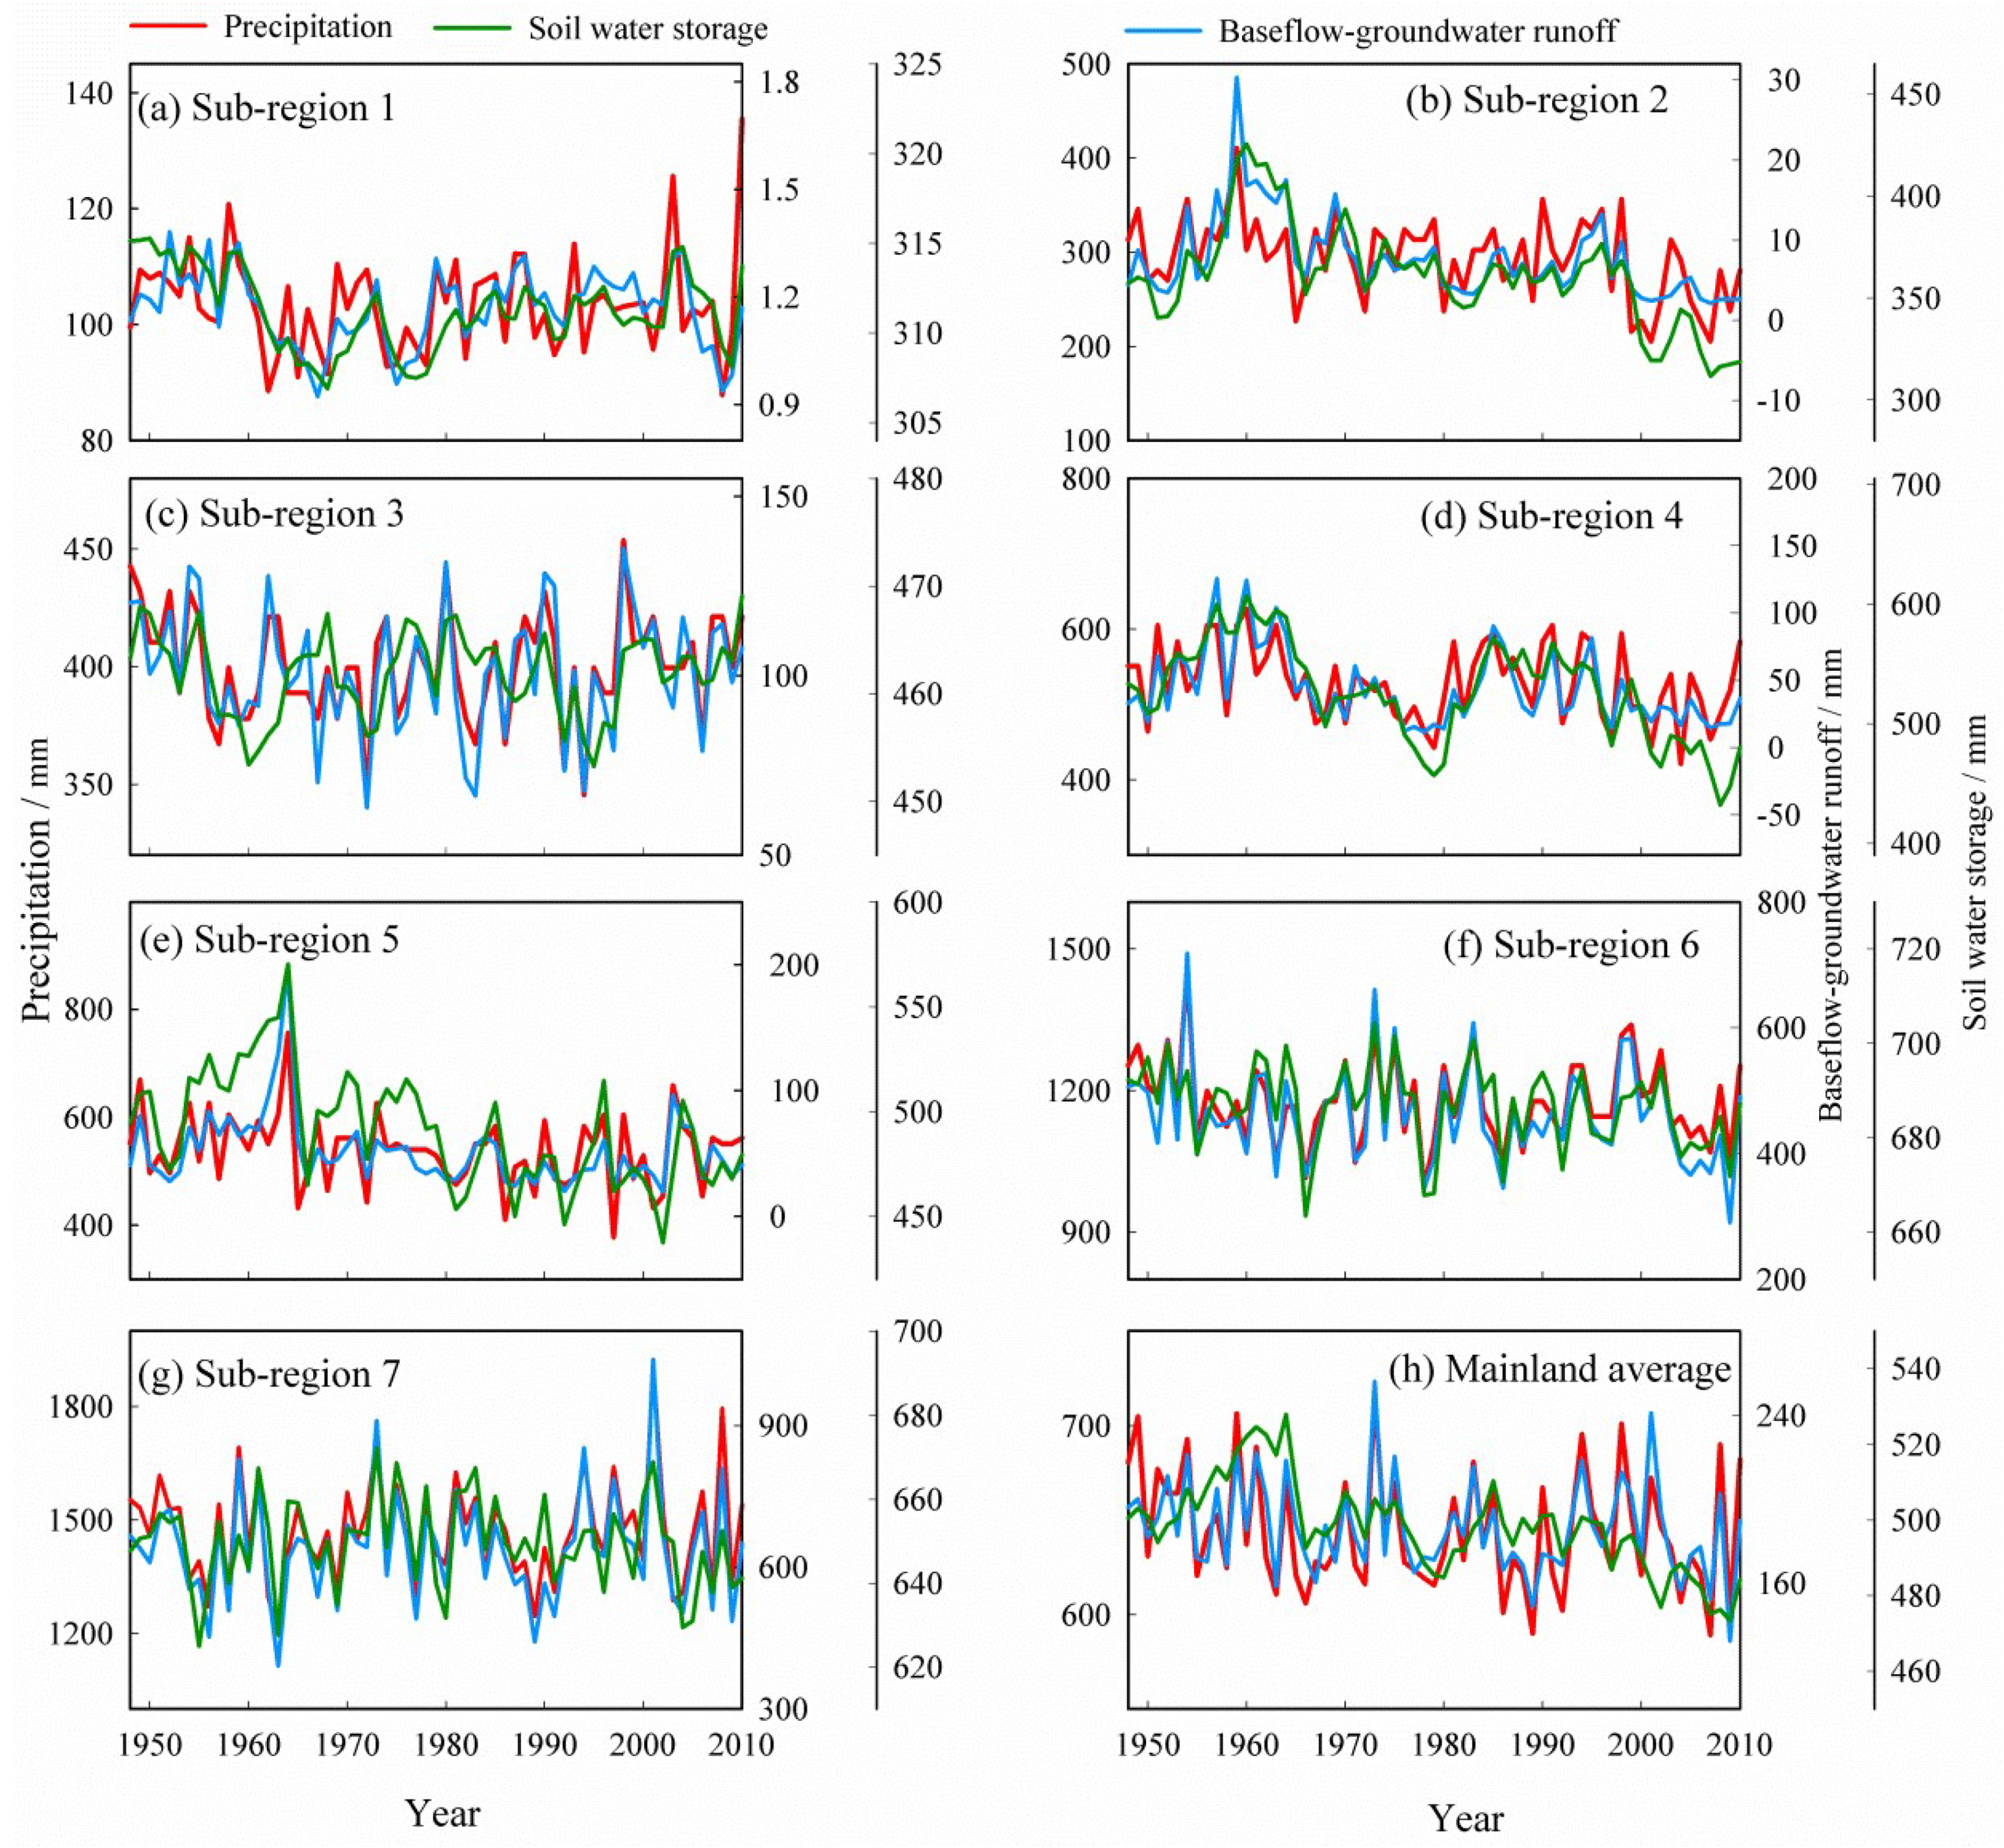
3.1.1. Temporal Variations
The Annual Variations
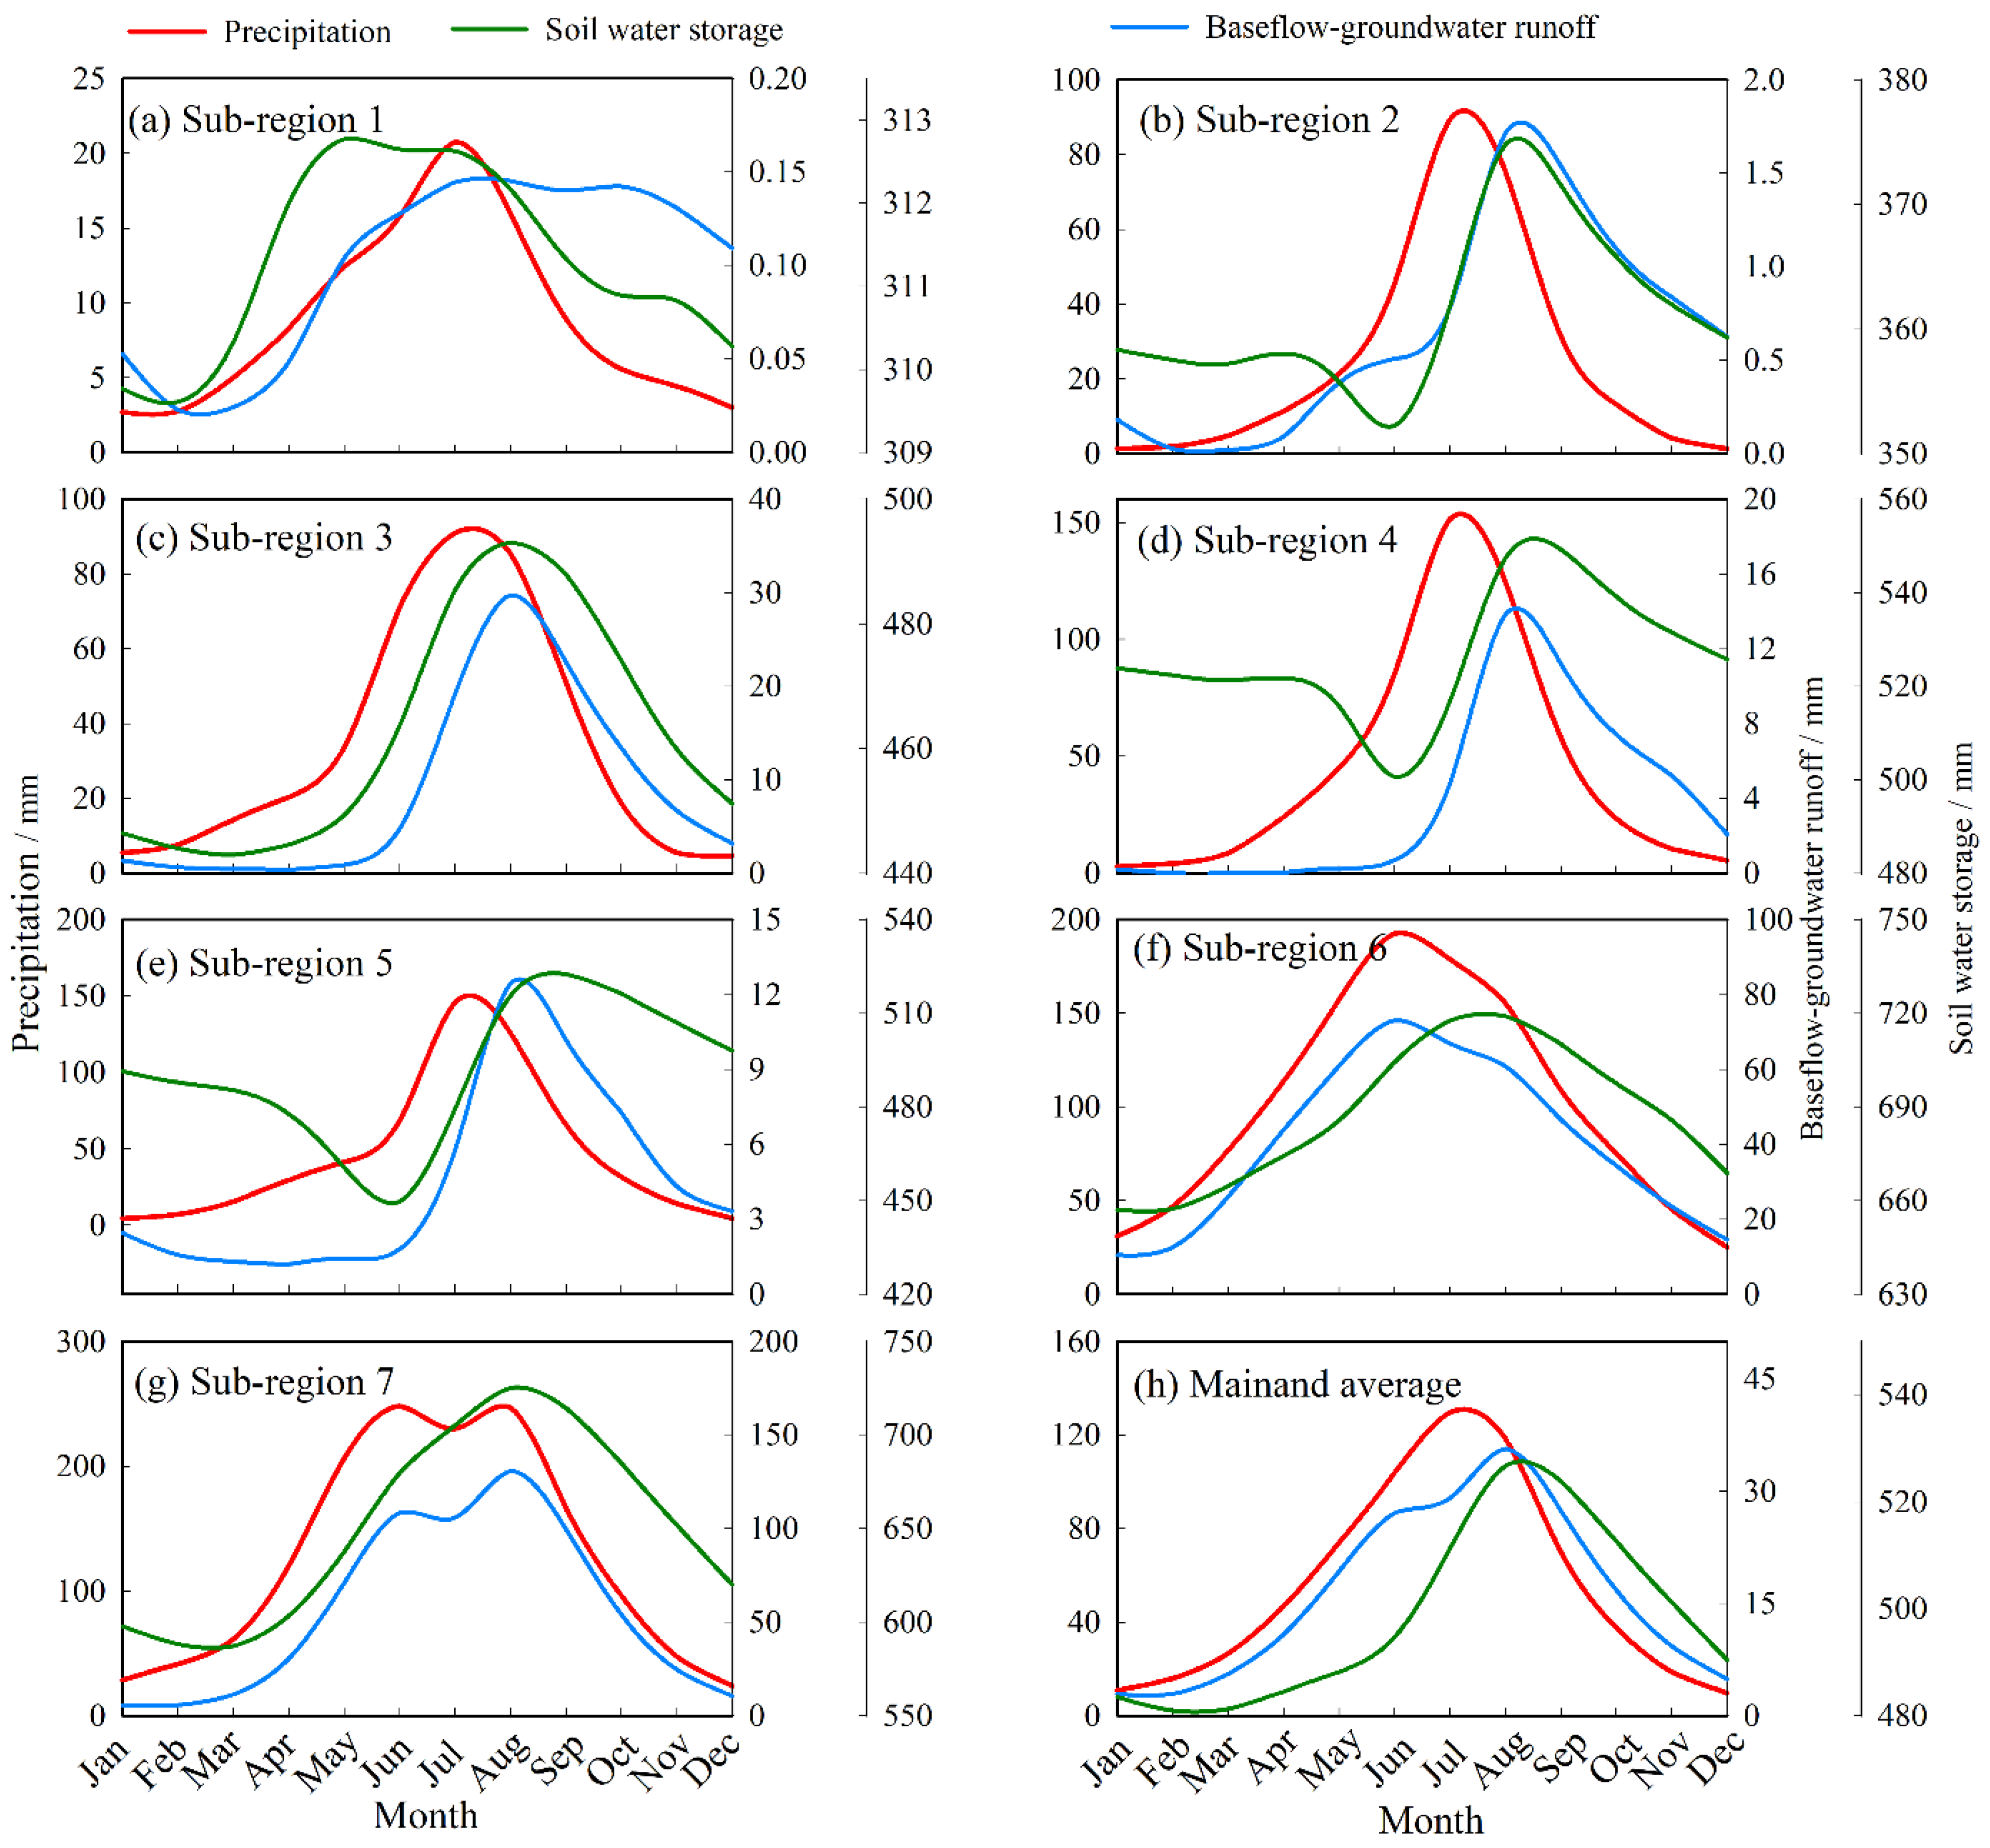
The Annual Mean Monthly Variations
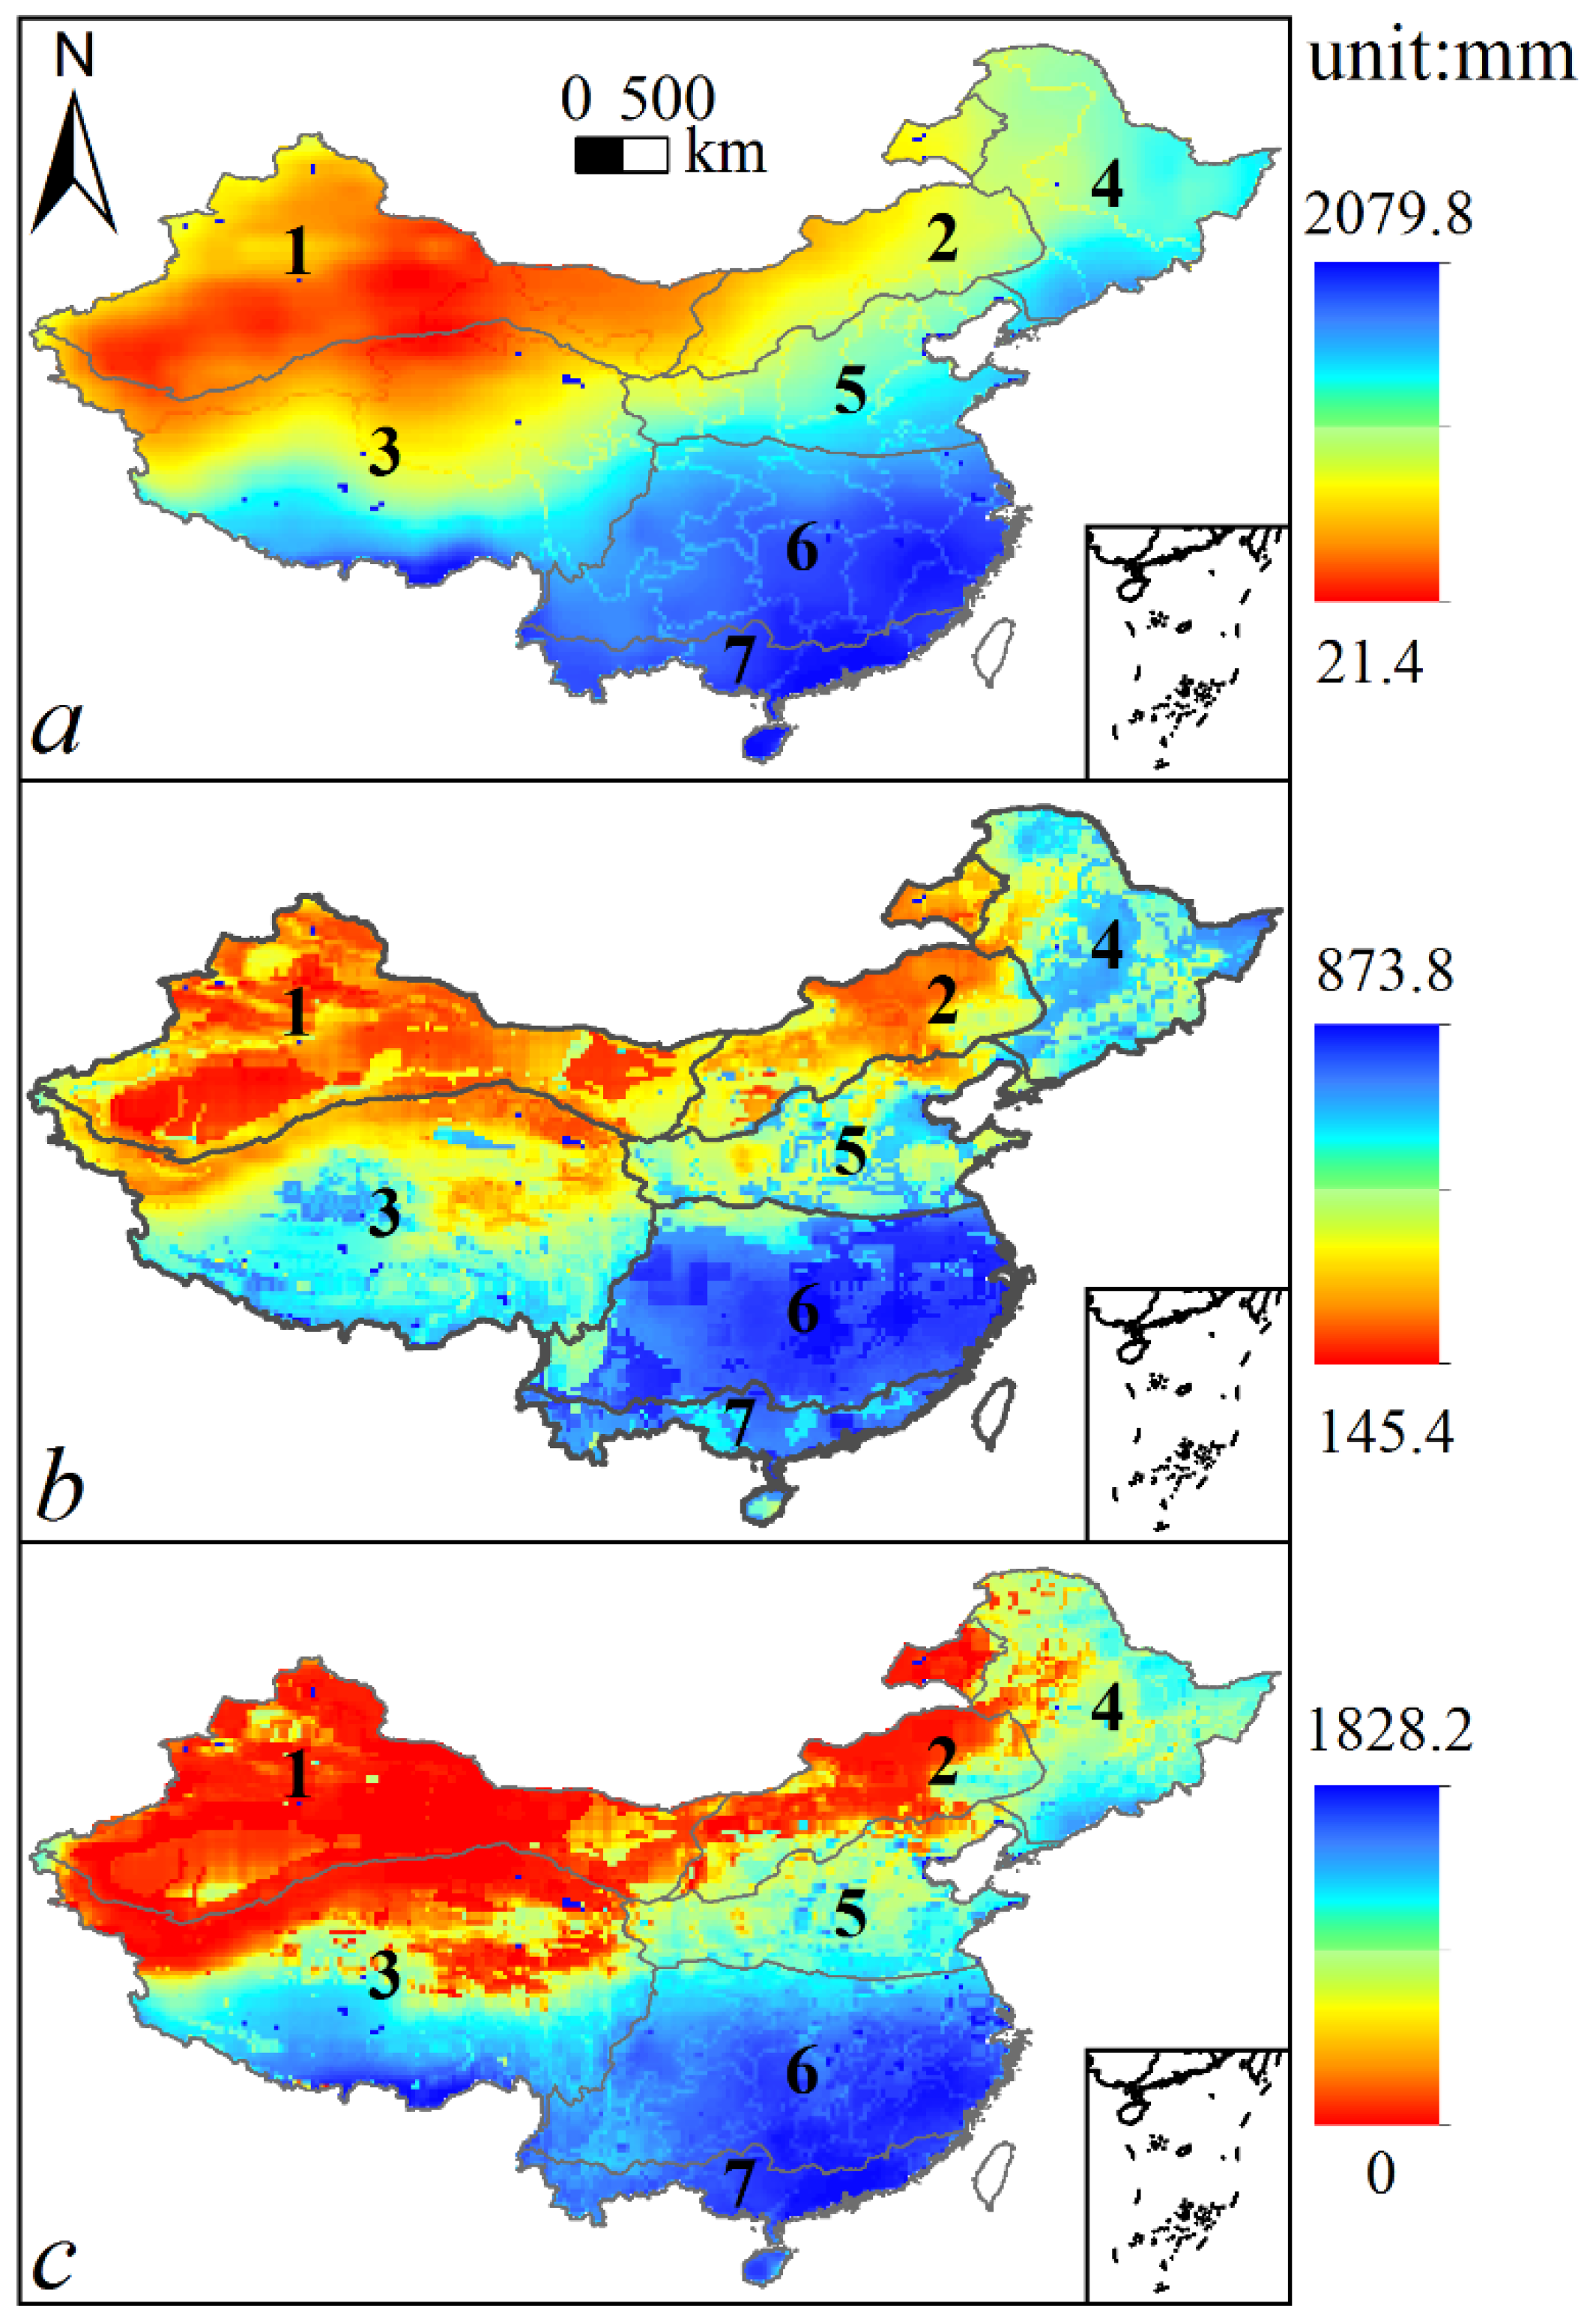
3.1.2. The Spatial Distributions
3.2. The Drought Characteristics Represented by 12-month SPI, SSI, and SRI
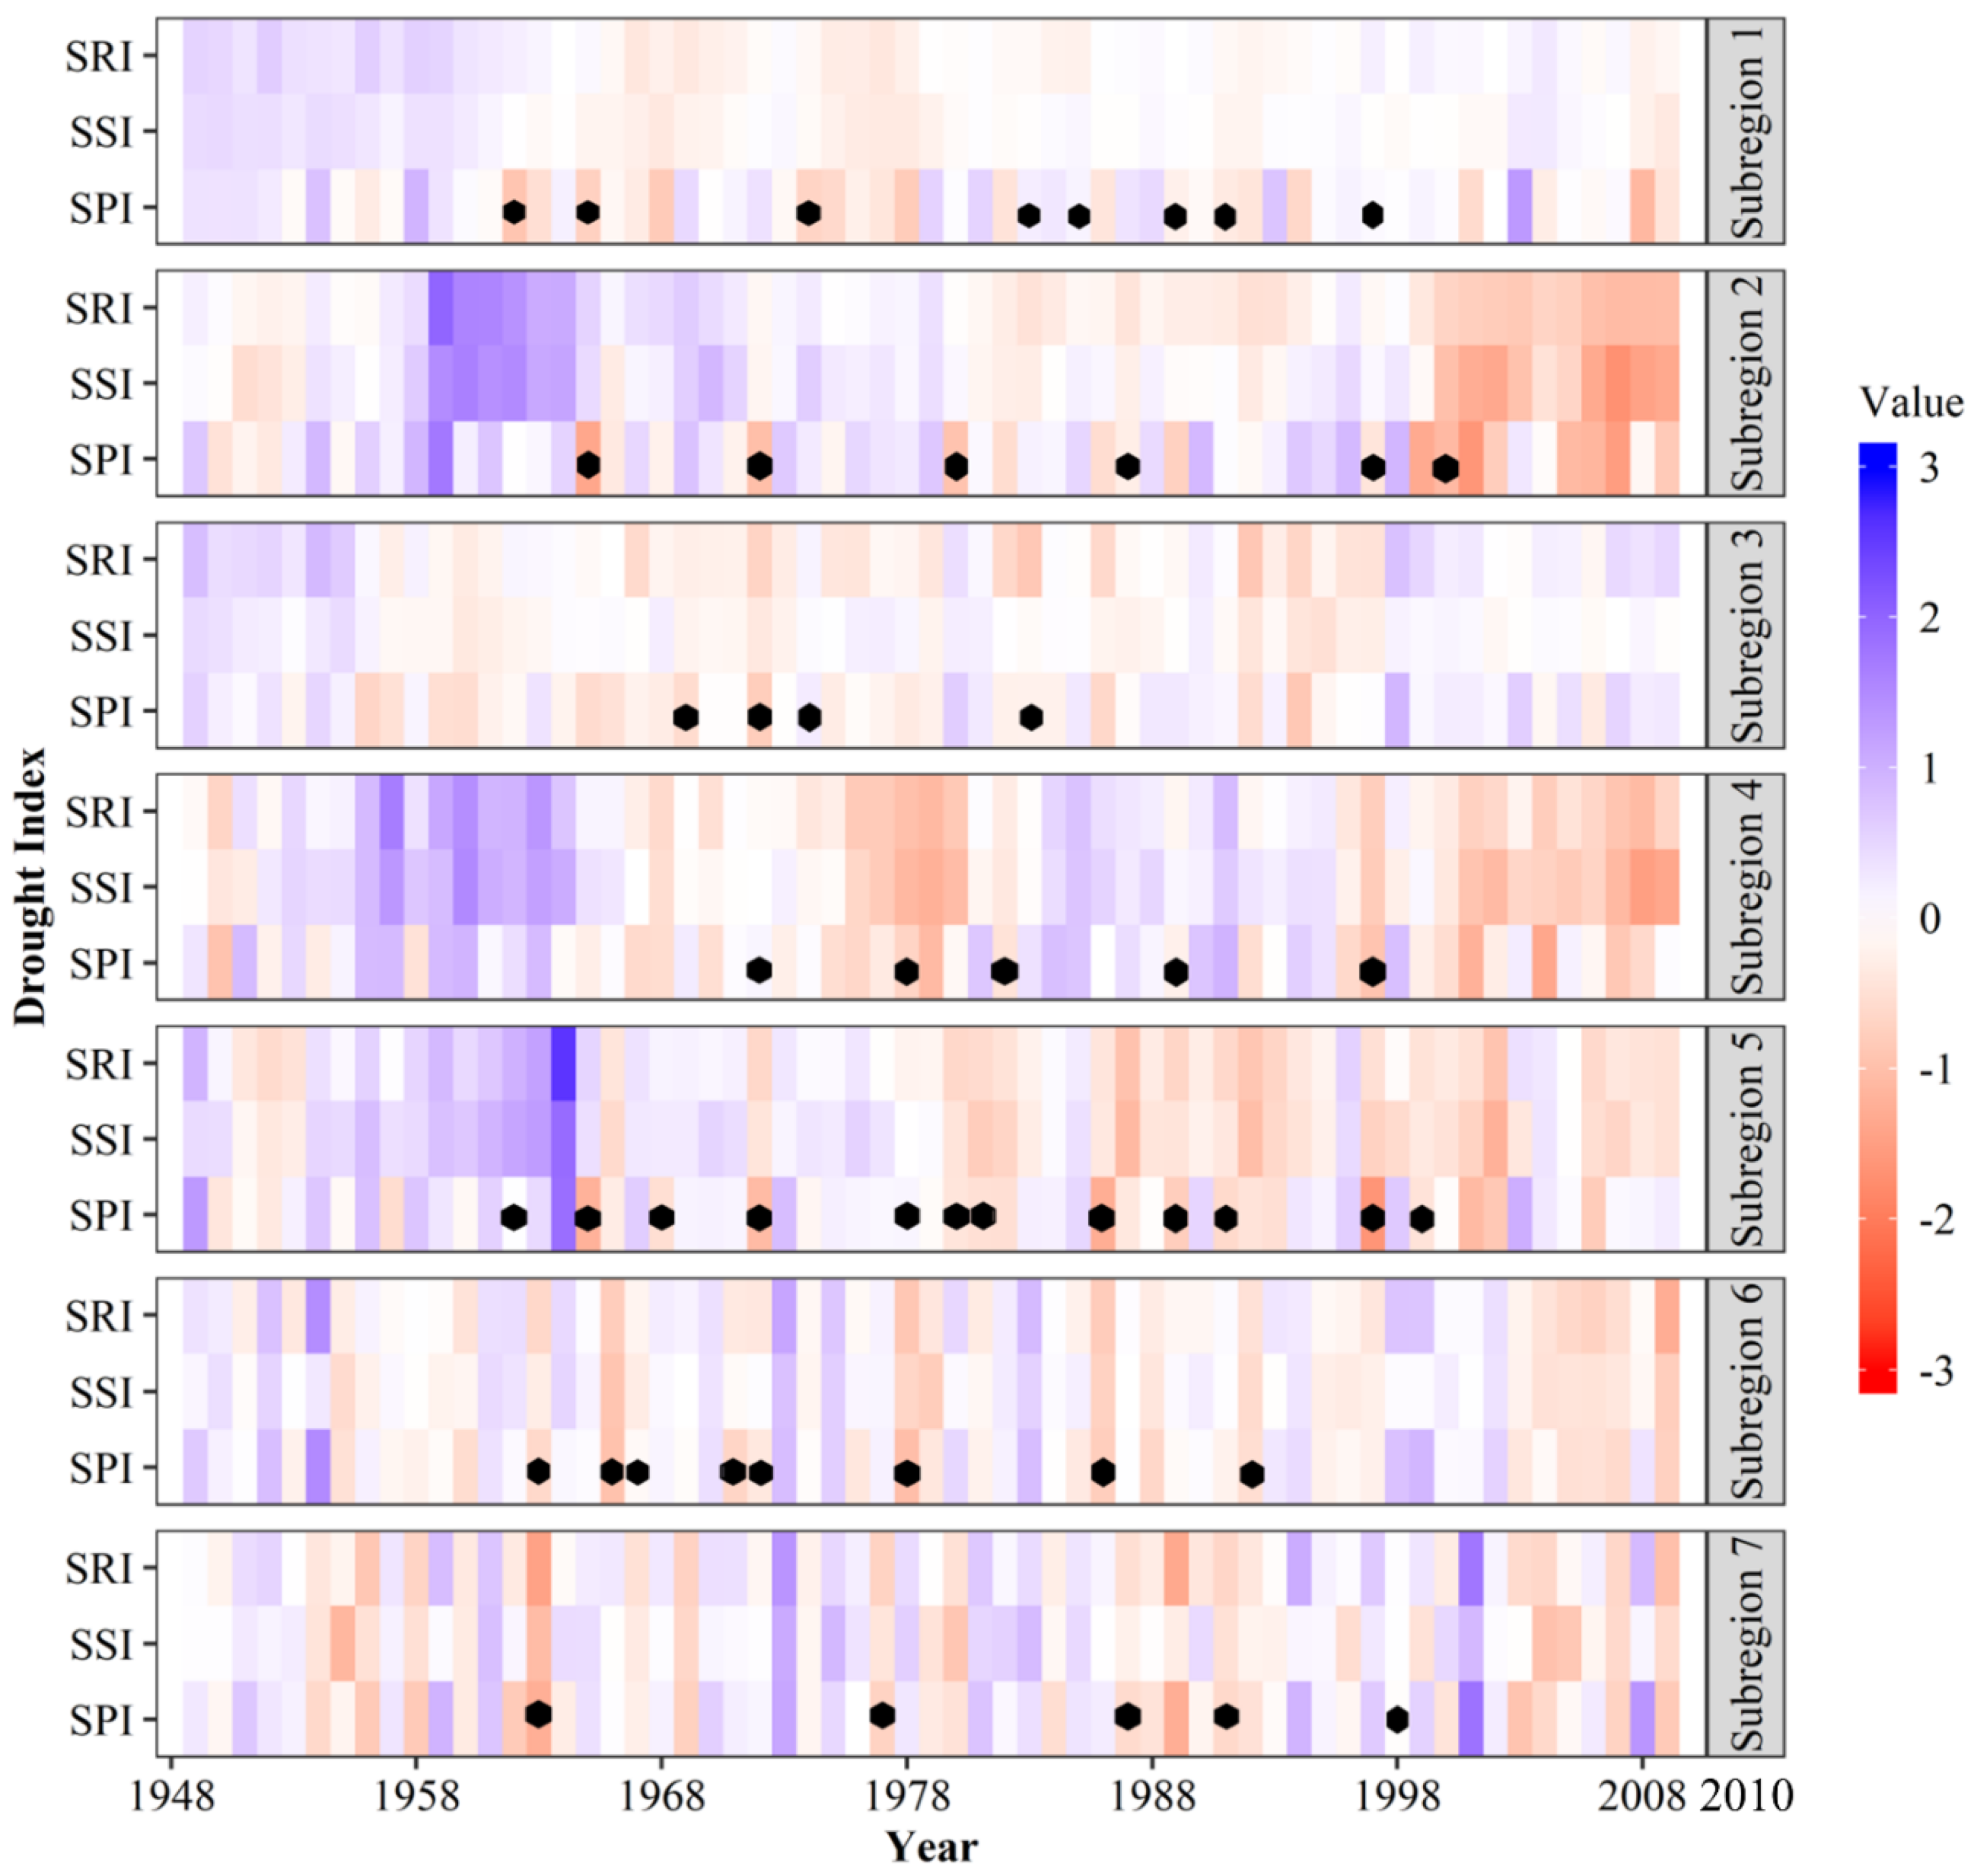
3.2.1. Temporal Variations over 1948–2010
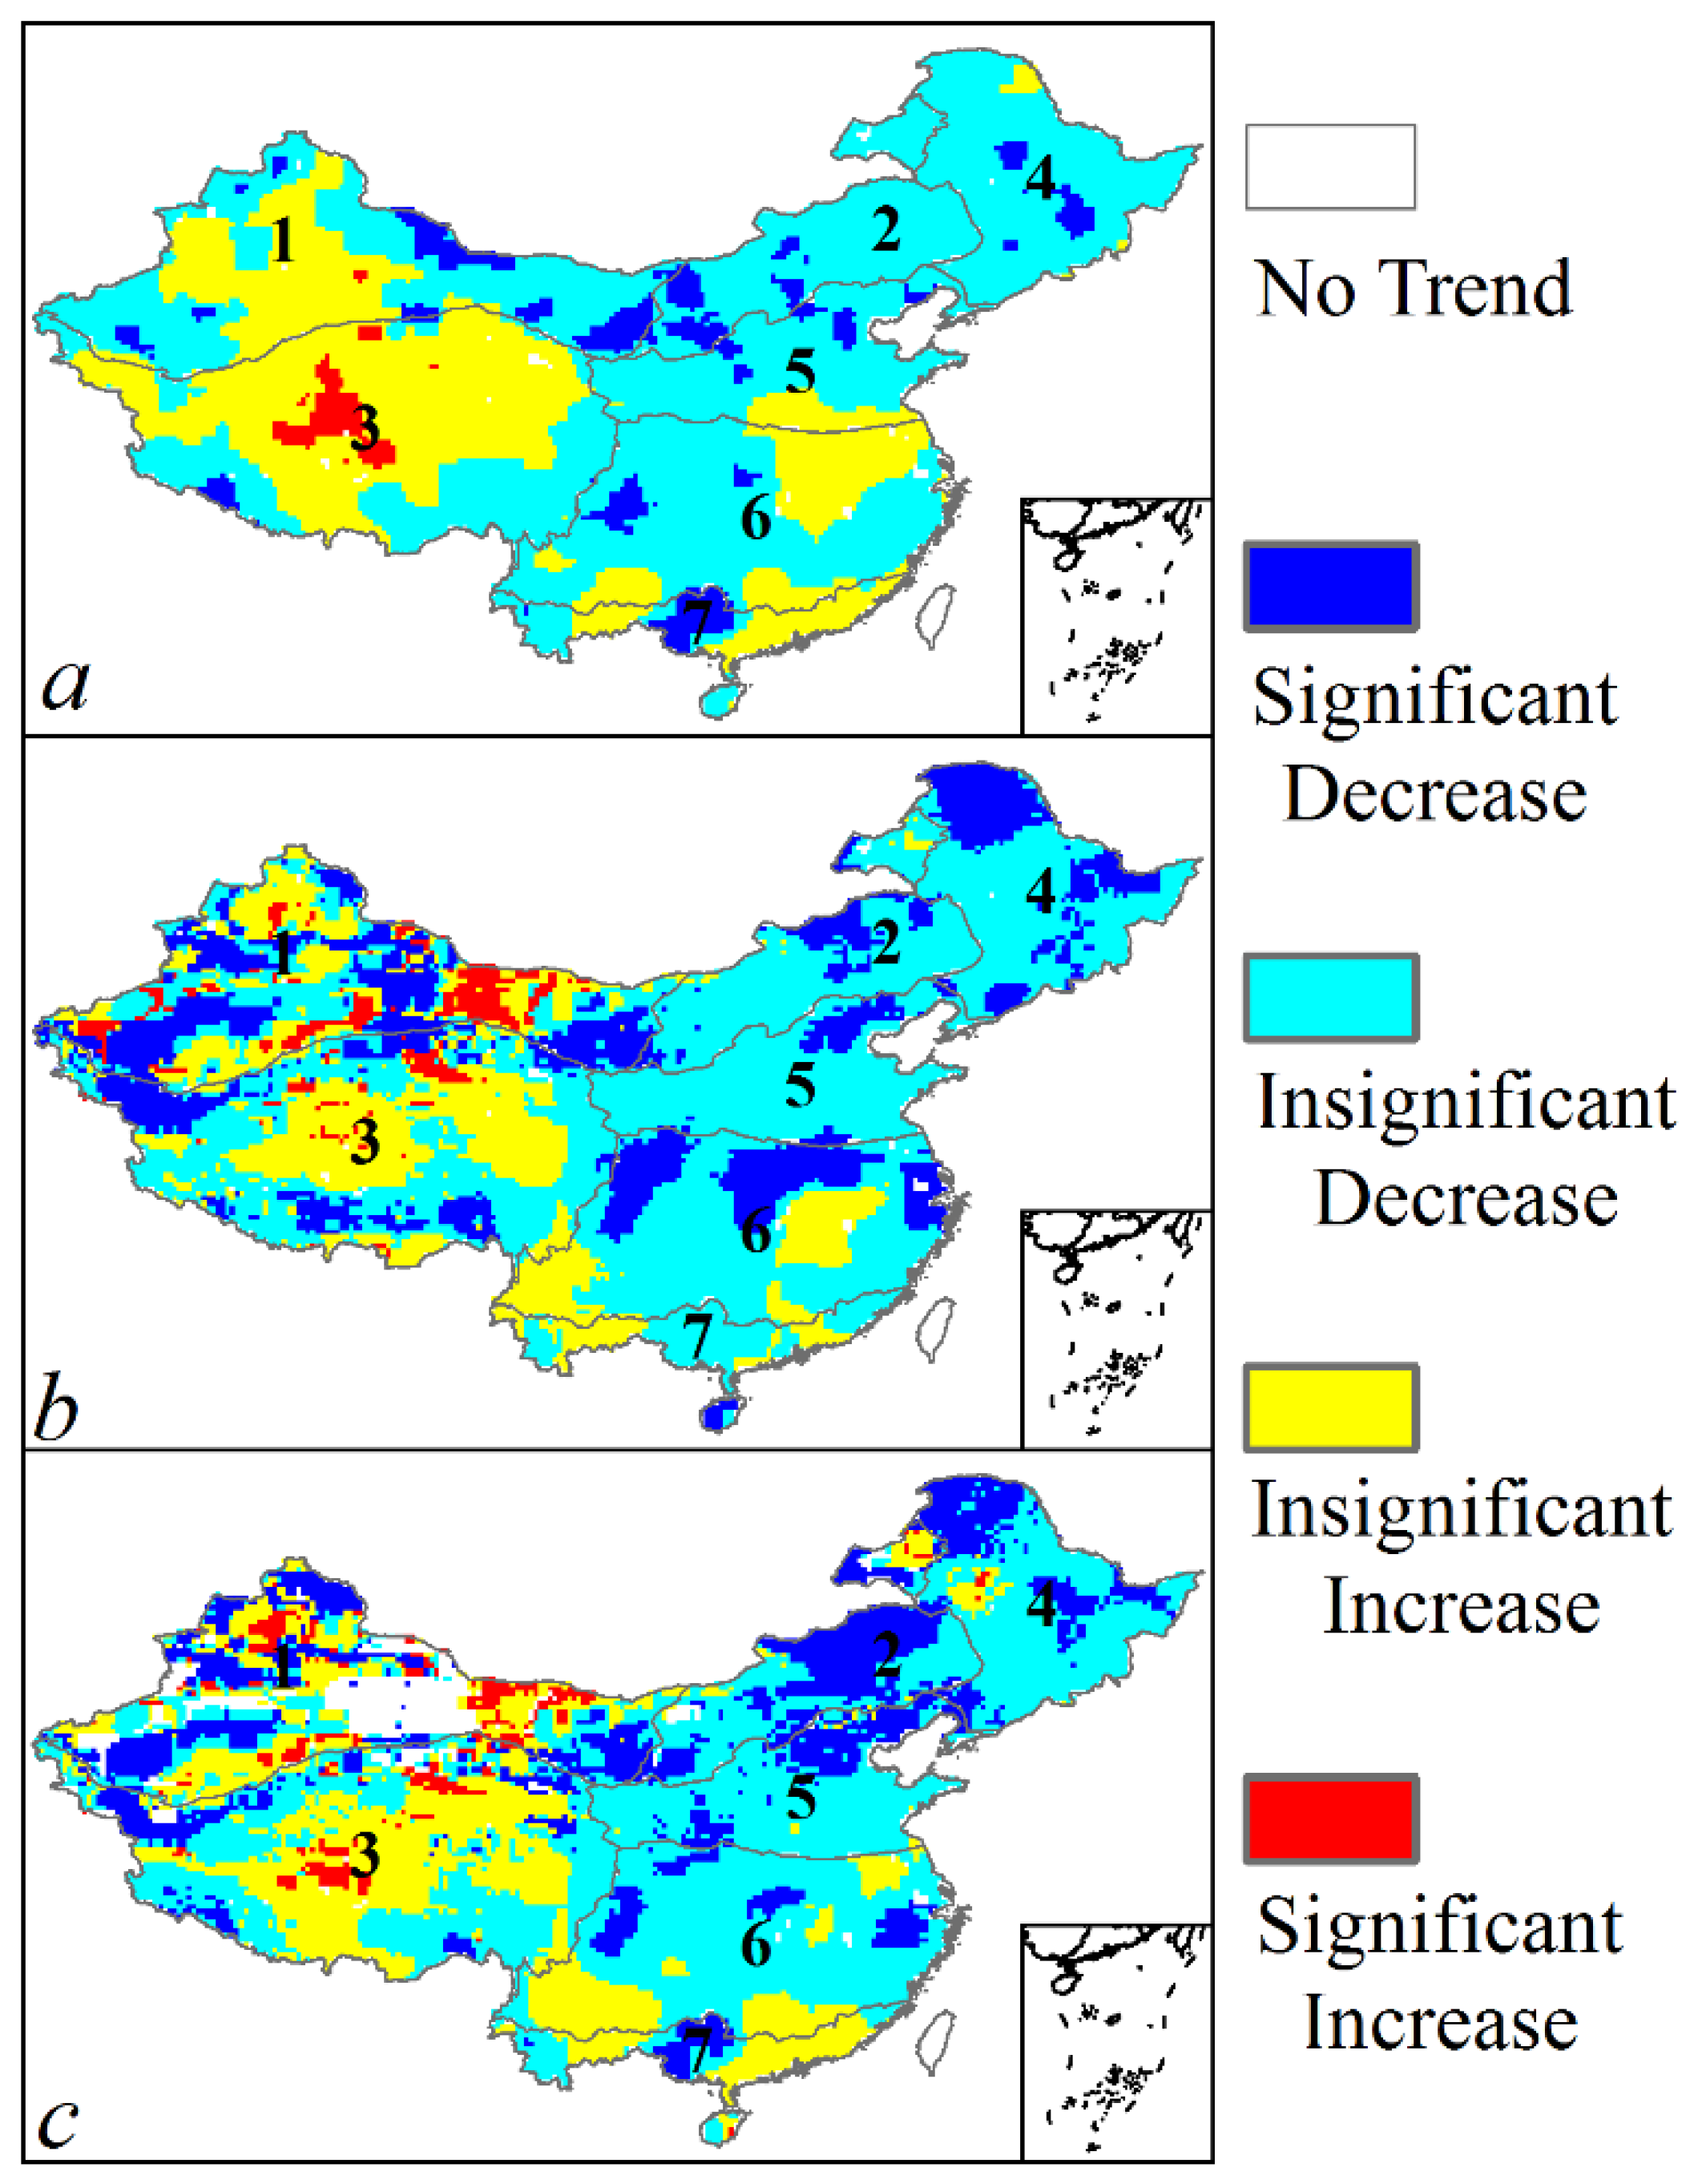
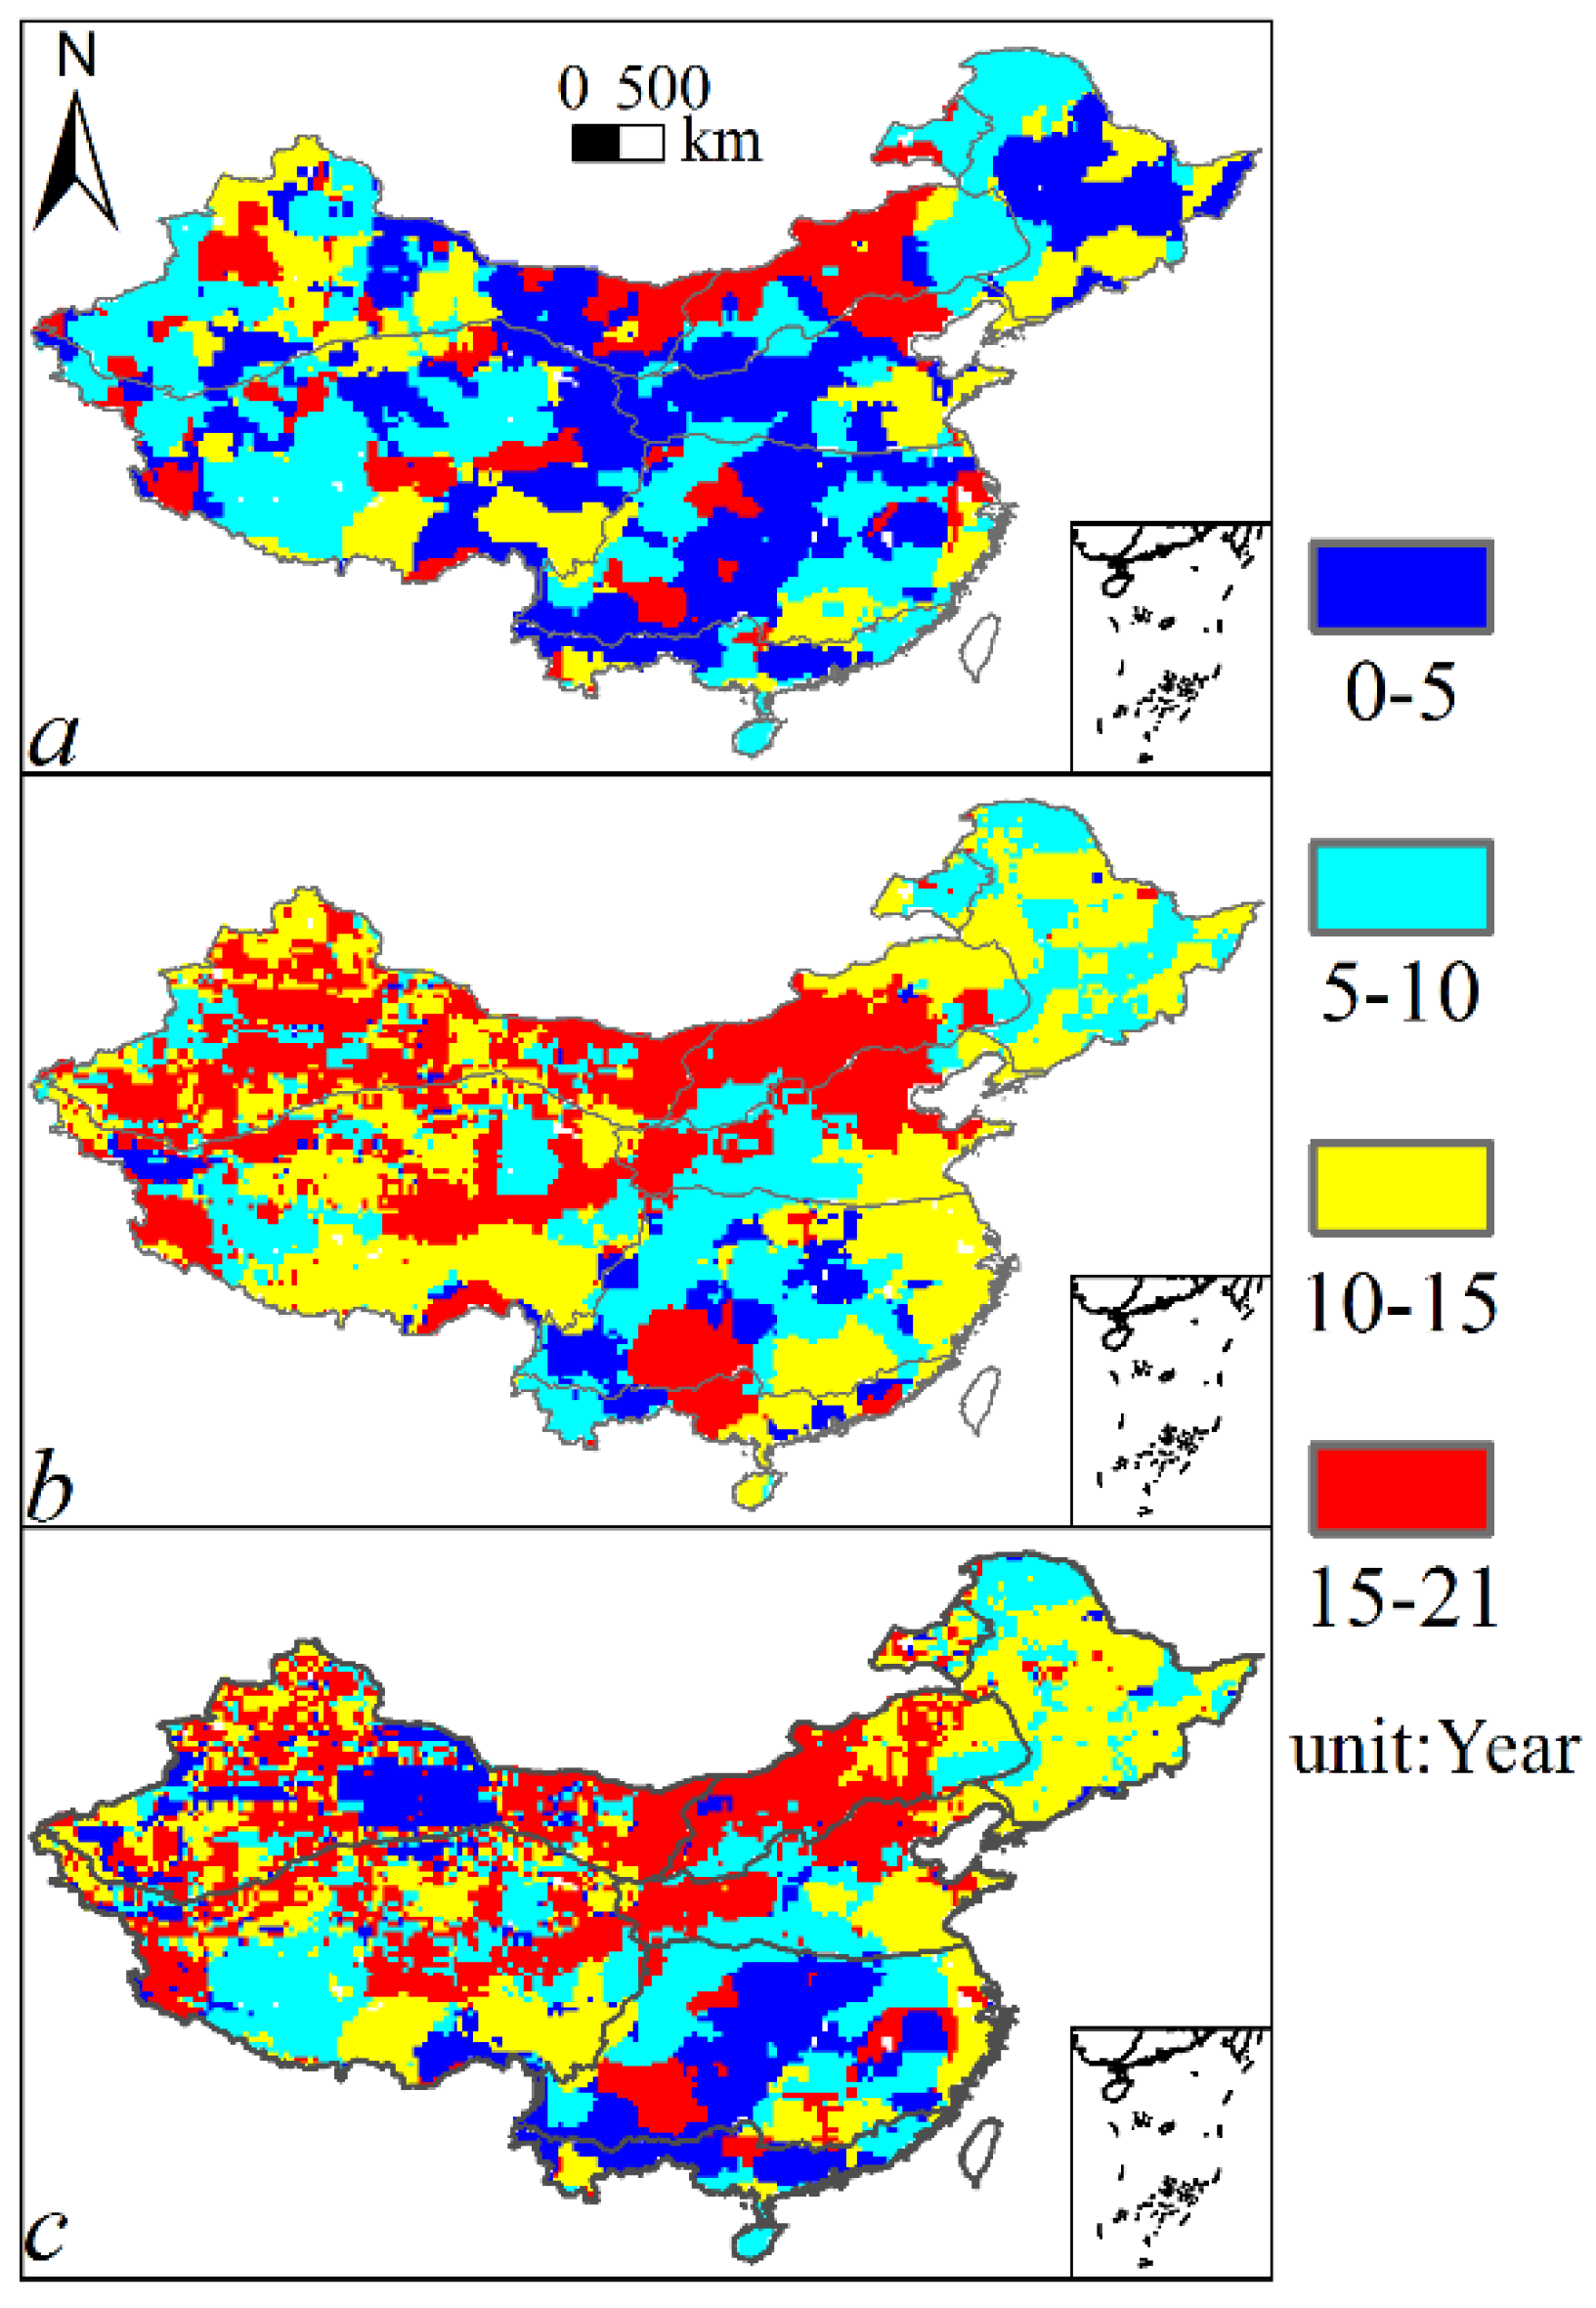
3.2.2. The Trends
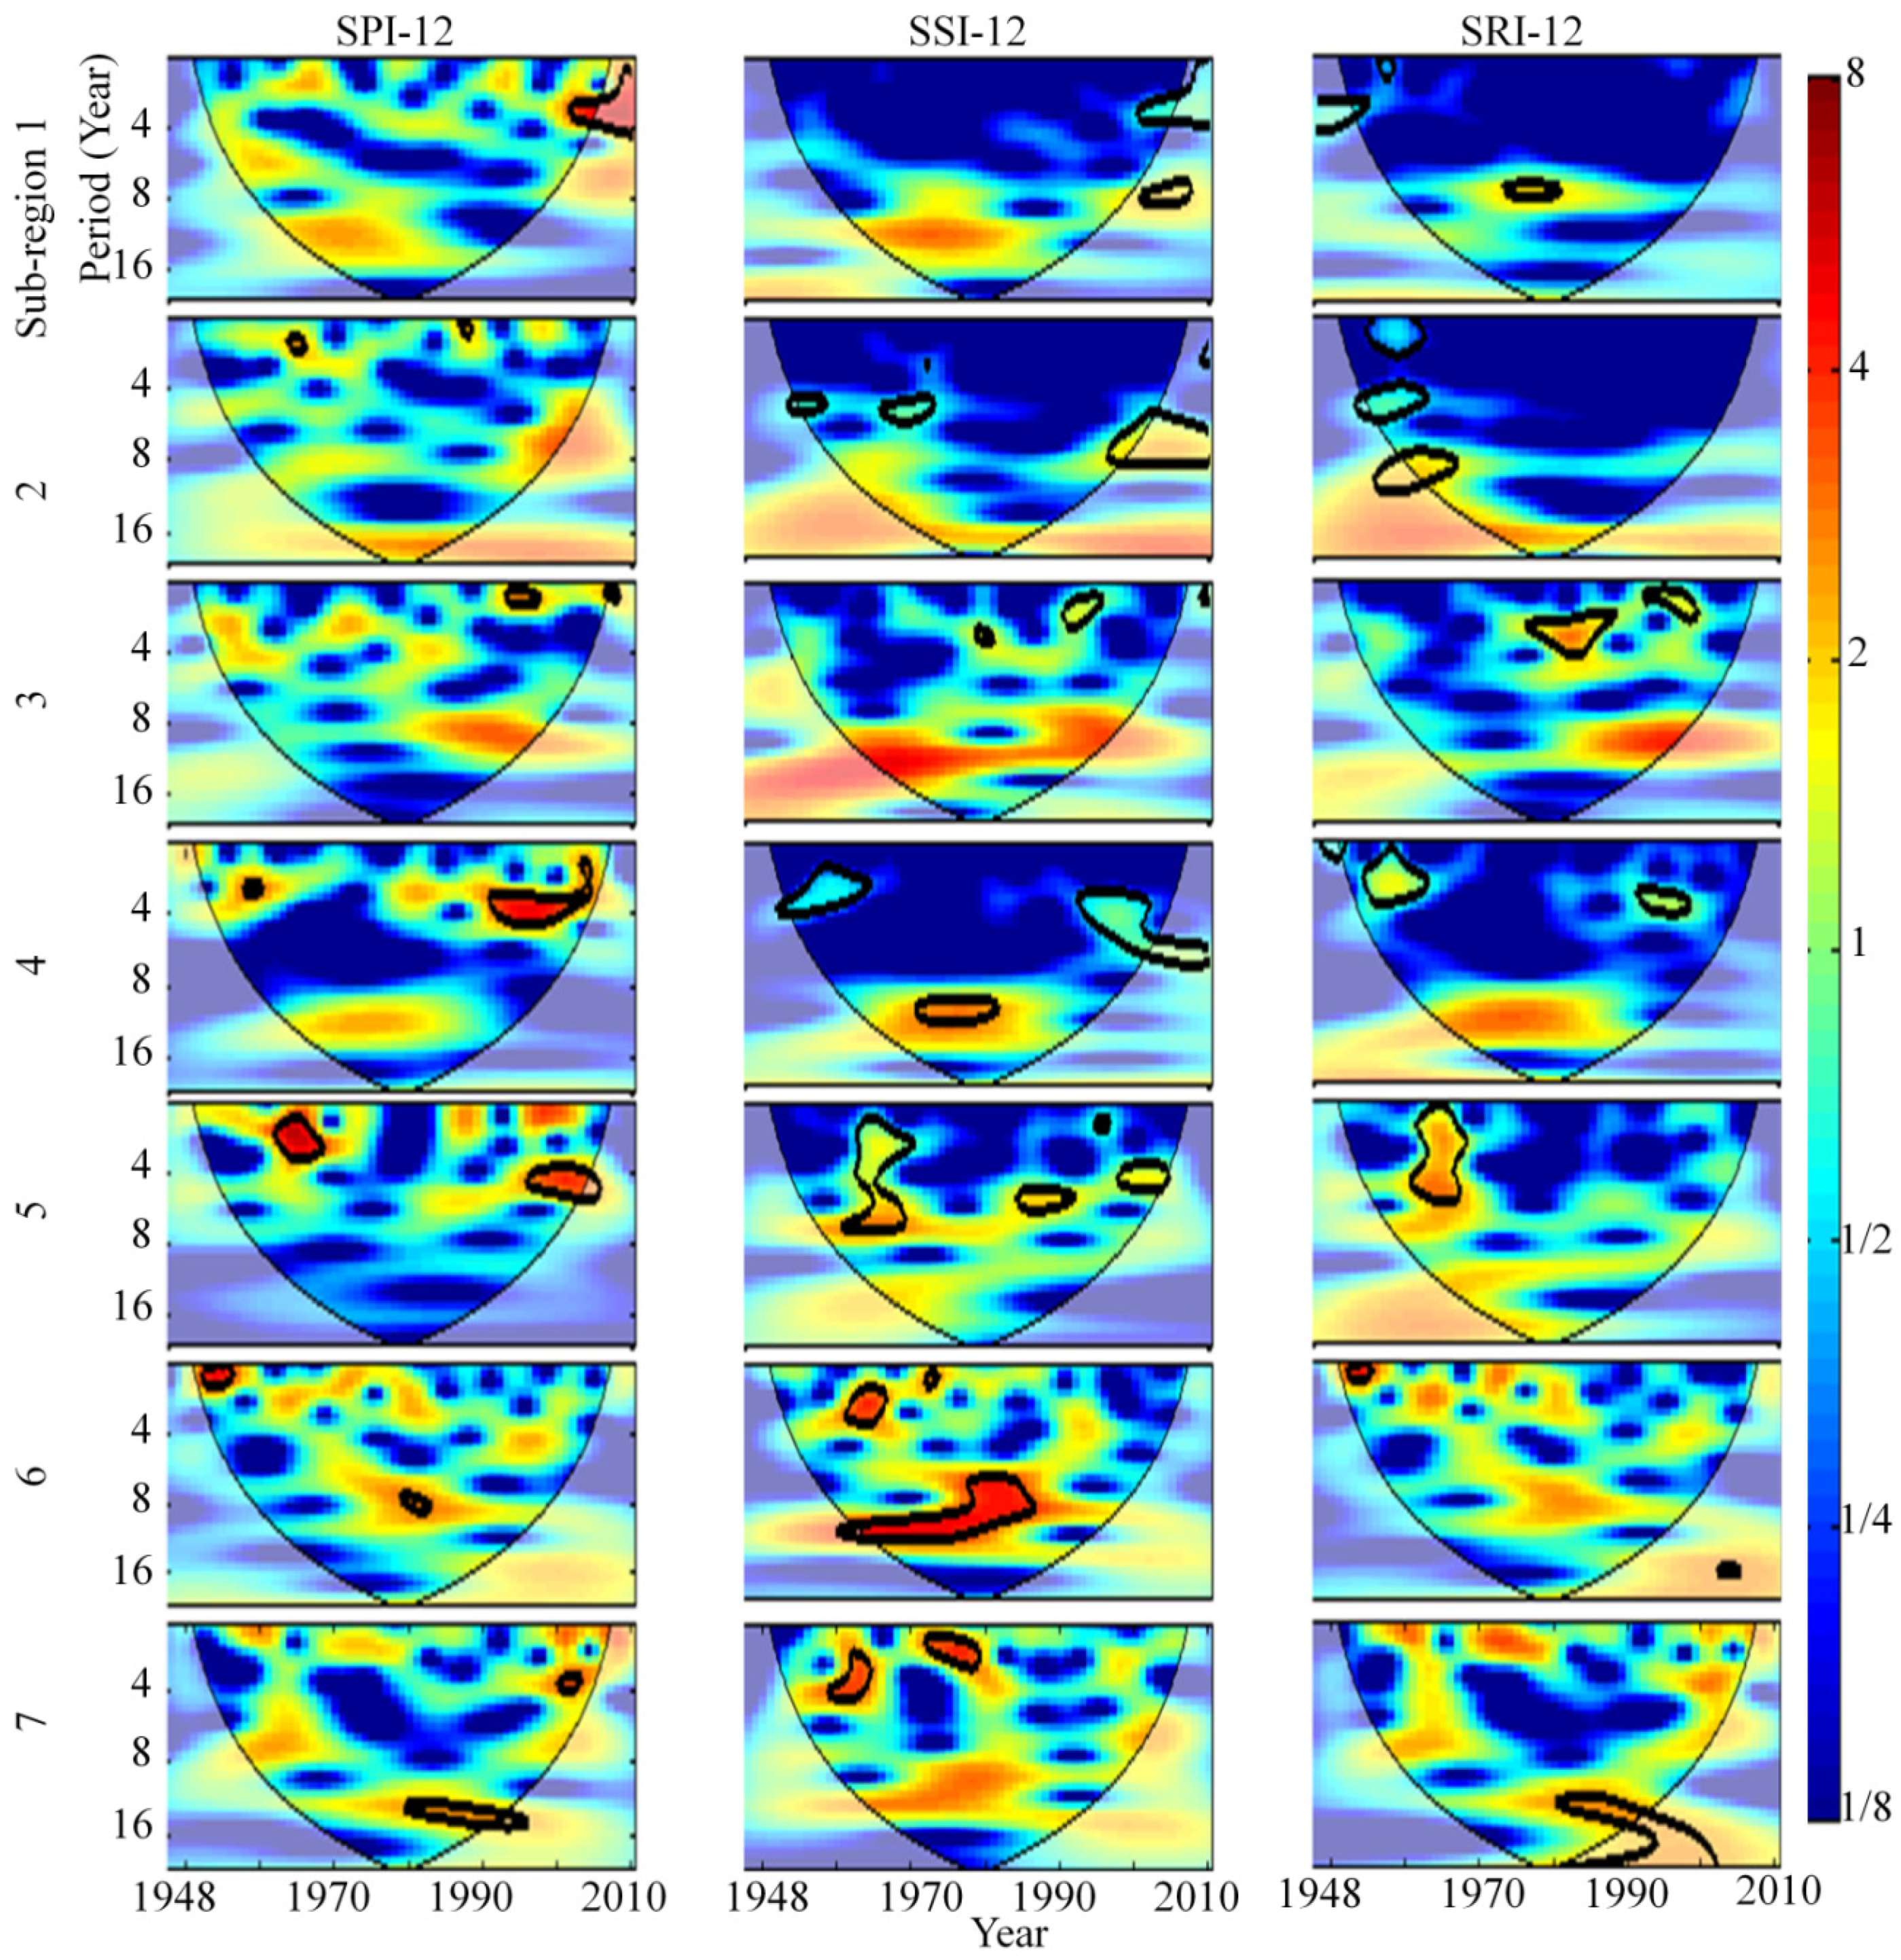
3.2.3. The Periods
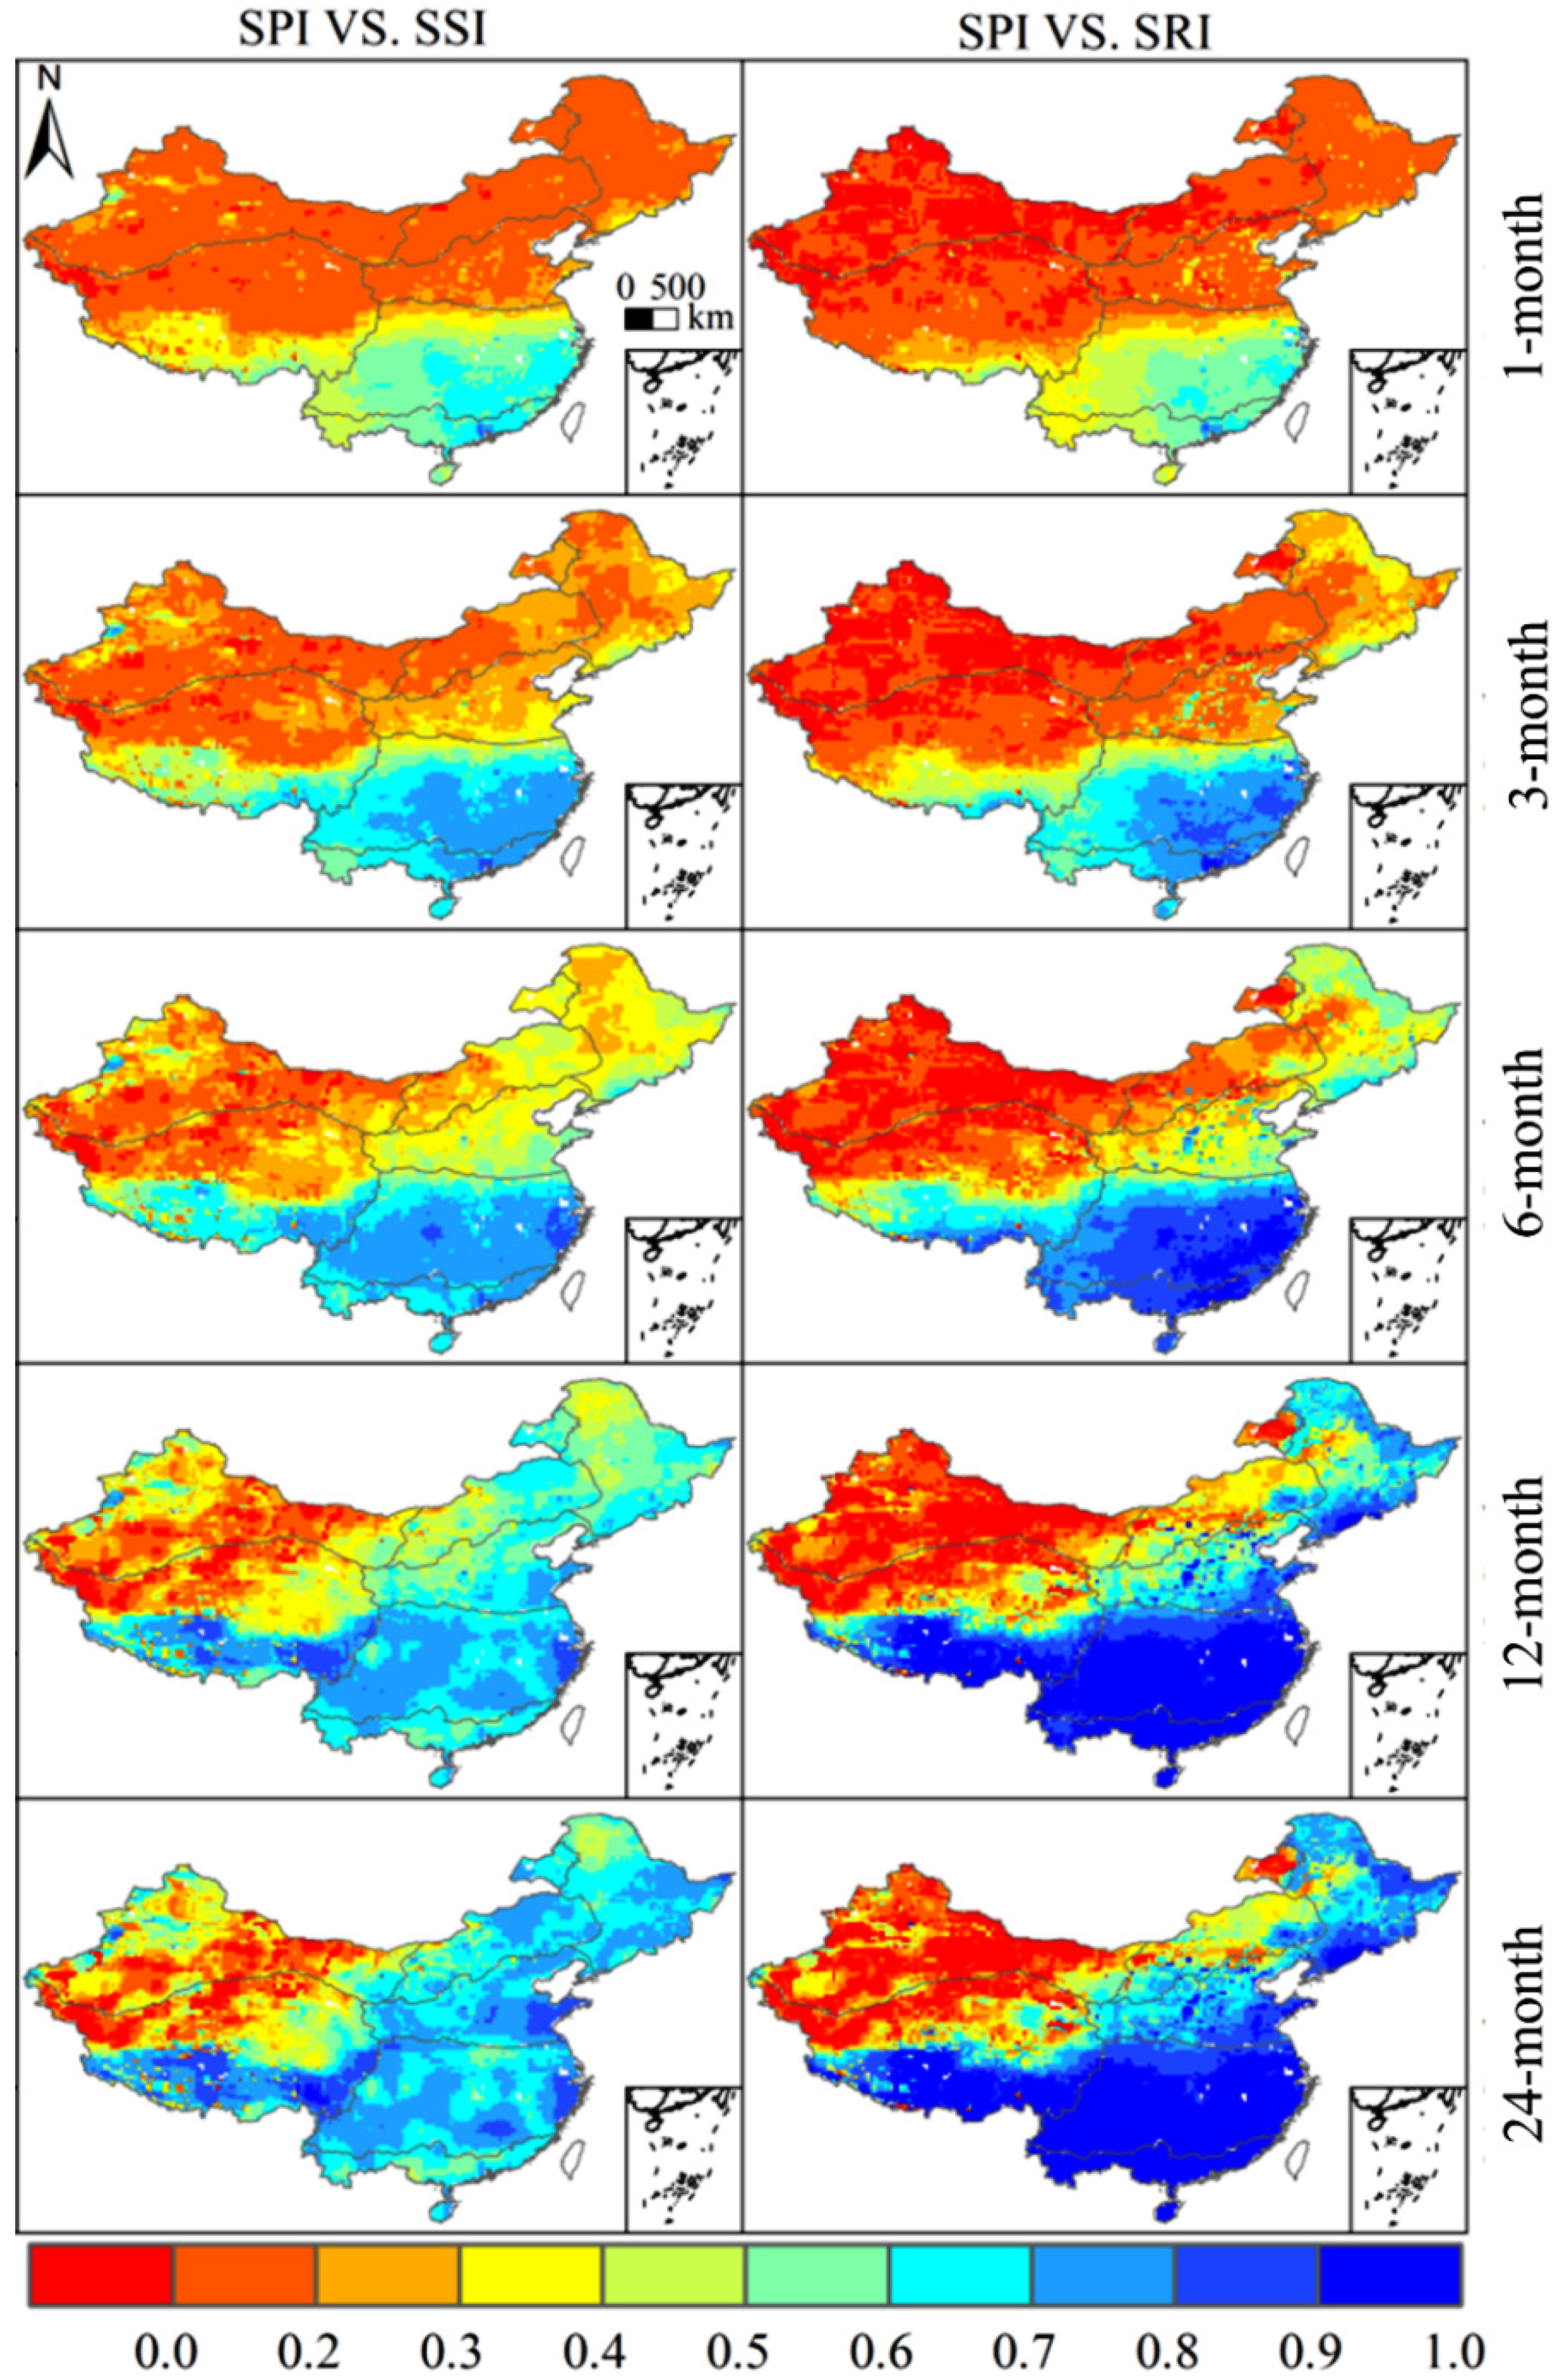
3.3. The Associations between SPI and SSI/SRI
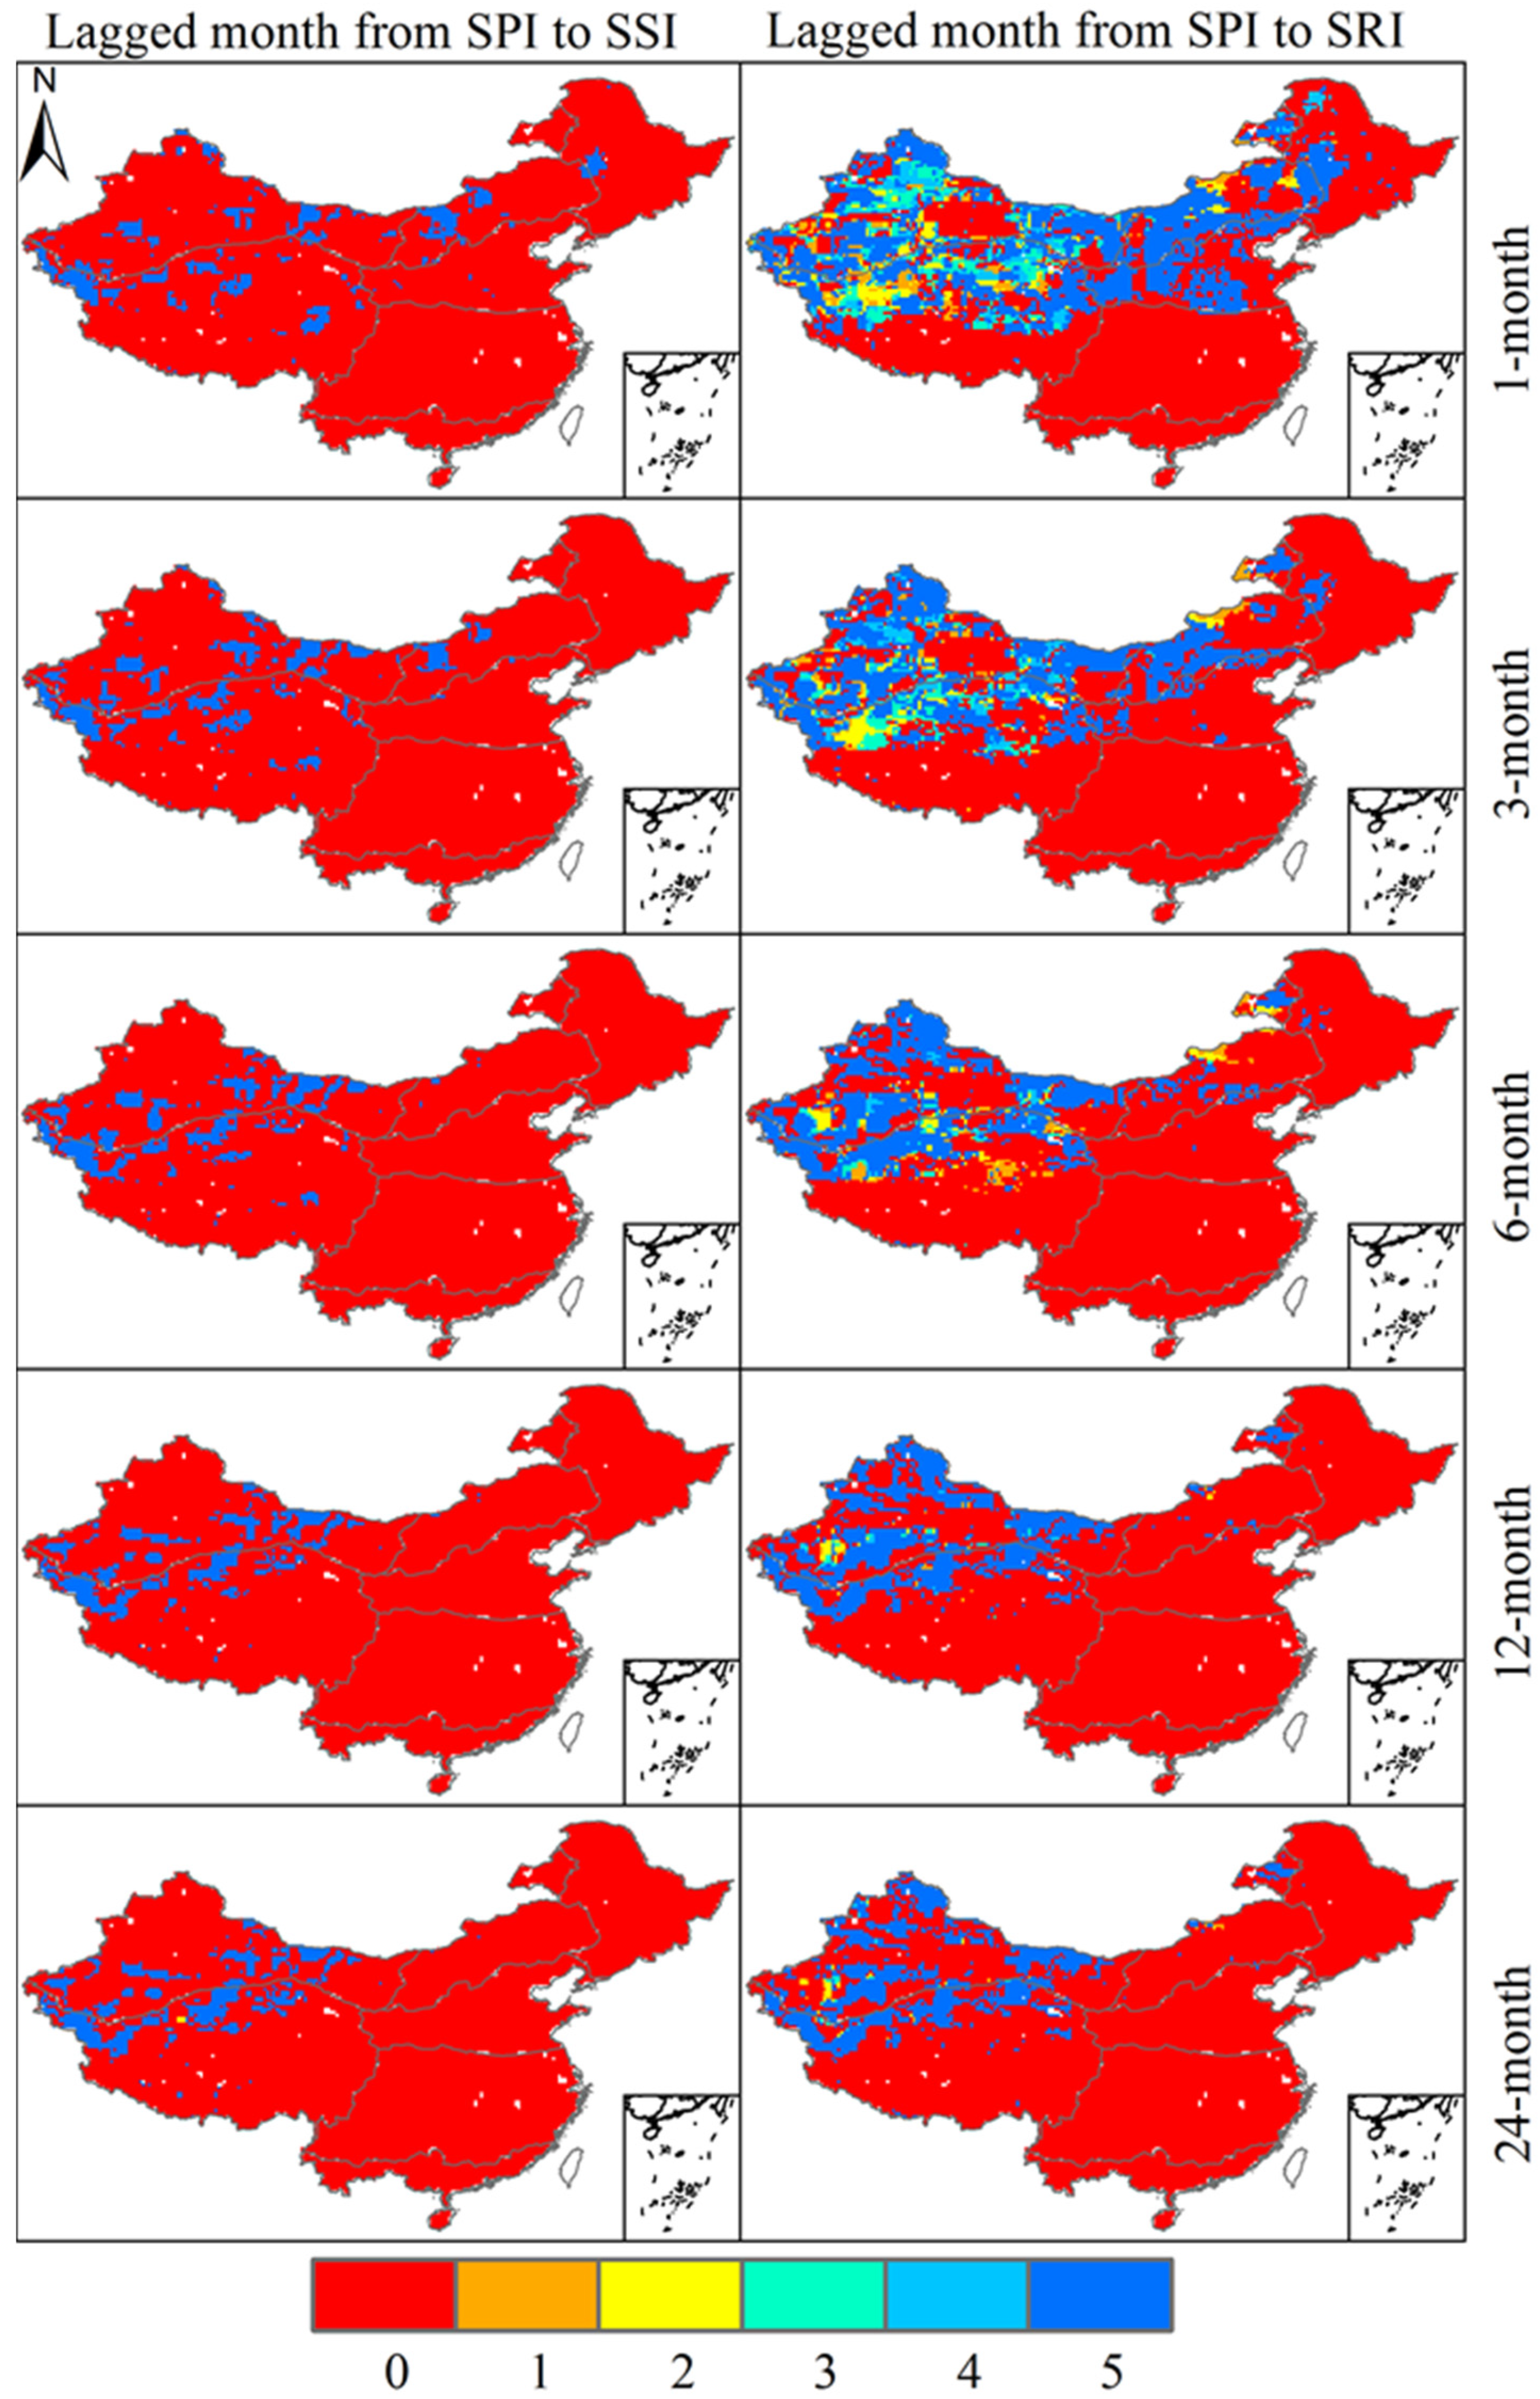
3.4. The Spatial Pattern of Lagged Months at Different Timescales
4. Discussion
5. Conclusions
Author Contributions
Funding
Conflicts of Interest
Abbreviations
Appendix A

| Variable | R2 | RMSE | AIC | |||||||
|---|---|---|---|---|---|---|---|---|---|---|
| Max | Min | Mean | Max | Min | Mean | Max | Min | Mean | ||
| PPT | Gamma | 1.00 | 0.79 | 0.98 | 0.159 | 0.005 | 0.046 | −2776 | −8038 | −4819 |
| GEV | 1.00 | 0.57 | 0.97 | 0.360 | 0.008 | 0.052 | −1538 | −7352 | −4673 | |
| Pareto | 1.00 | 0.70 | 0.97 | 0.177 | 0.007 | 0.057 | −2614 | −7407 | −4466 | |
| Gumbel | 0.99 | 0.63 | 0.83 | 0.204 | 0.027 | 0.125 | −2396 | −5466 | −3176 | |
| LN2 | 1.00 | 0.63 | 0.97 | 0.188 | 0.010 | 0.053 | −2523 | −6934 | −4562 | |
| LN3 | 1.00 | 0.51 | 0.96 | 0.236 | 0.006 | 0.053 | −2177 | −7836 | −4687 | |
| Norm | 1.00 | 0.67 | 0.88 | 0.178 | 0.018 | 0.101 | −2604 | −6074 | −3547 | |
| P3 | 1.00 | 0.72 | 0.94 | 0.192 | 0.004 | 0.068 | −2492 | −8189 | −4293 | |
| Poiss | 0.98 | 0.65 | 0.78 | 0.337 | 0.069 | 0.268 | −1641 | −4030 | −2025 | |
| Weibull | - | - | - | - | - | - | - | - | - | |
| SWS | Gamma | 1.00 | 0.44 | 0.98 | 0.223 | 0.005 | 0.041 | −2262 | −8010 | −5074 |
| GEV | 1.00 | 0.84 | 0.99 | 0.162 | 0.004 | 0.027 | −2745 | −8344 | −5679 | |
| Pareto | - | - | - | - | - | - | - | - | - | |
| Gumbel | 1.00 | 0.58 | 0.96 | 0.206 | 0.010 | 0.062 | −2379 | −6911 | −4368 | |
| LN2 | 1.00 | 0.44 | 0.98 | 0.223 | 0.005 | 0.041 | −2260 | −8063 | −5078 | |
| LN3 | 1.00 | 0.44 | 0.98 | 0.223 | 0.005 | 0.041 | −2260 | −8063 | −5076 | |
| Norm | 1.00 | 0.45 | 0.98 | 0.222 | 0.005 | 0.042 | −2267 | −8079 | −5039 | |
| P3 | 1.00 | 0.87 | 0.99 | 0.136 | 0.005 | 0.030 | −3016 | −8090 | −5611 | |
| Poiss | 1.00 | 0.42 | 0.94 | 0.273 | 0.010 | 0.134 | −1959 | −7013 | −3201 | |
| Weibull | 1.00 | 0.58 | 0.96 | 0.208 | 0.007 | 0.056 | −2367 | −7505 | −4540 | |
| BGR | Gamma | 1.00 | 0.04 | 0.93 | 0.297 | 0.007 | 0.080 | −1830 | −7445 | −4019 |
| GEV | 1.00 | 0.04 | 0.92 | 0.524 | 0.005 | 0.102 | −971 | −7887 | −4020 | |
| Pareto | 1.00 | 0.04 | 0.92 | 0.520 | 0.007 | 0.088 | −988 | −7516 | −3943 | |
| Gumbel | 1.00 | 0.03 | 0.68 | 0.289 | 0.015 | 0.167 | −1871 | −6335 | −2812 | |
| LN2 | 1.00 | 0.04 | 0.91 | 0.286 | 0.006 | 0.081 | −1889 | −7681 | −4071 | |
| LN3 | - | - | - | - | - | - | - | - | - | |
| Norm | 1.00 | 0.04 | 0.76 | 0.286 | 0.012 | 0.141 | −1889 | −6648 | −3077 | |
| P3 | 1.00 | 0.04 | 0.87 | 0.533 | 0.005 | 0.127 | −945 | −7925 | −3436 | |
| Poiss | - | - | - | - | - | - | - | - | - | |
| Weibull | 1.00 | 0.04 | 0.93 | 0.284 | 0.008 | 0.076 | −1899 | −7336 | −4112 | |

References
- EU. Addressing the Challenge of Water Scarcity and Droughts in the European Union, Communication from the Commission to the European Parlement and the Council; European Commission, DG Environment: Brussels, Belgium, 2007. [Google Scholar]
- Dracup, J.A.; Lee, K.S.; Paulson, E.G. On the definition of droughts. Water Resour. Res. 1980, 16, 297–302. [Google Scholar] [CrossRef]
- Wilhite, D.A.; Svoboda, M.D. Drought Early Warning Systems in the Context of Drought Preparedness and Mitigation. Early Warning Systems for Drought Preparedness and Drought Management 2000, 1–21. Available online: https://www.preventionweb.net/publications/view/1882 (accessed on 2 March 2020).
- Yao, N.; Li, L.; Feng, P.; Liu, D.L.; Liu, D.L.; Liu, Y.; Jiang, K.; Hu, X.; Li, Y. Projections of drought characteristics in China based on a standardized precipitation and evapotranspiration index and multiple GCMs. Sci. Total Environ. 2020, 704, 135245. [Google Scholar] [CrossRef] [PubMed]
- Mathbout, S.; Lopez-Bustins, J.A.; Martin-Vide, J.; Bech, J.; Rodrigo, F.S. Spatial and temporal analysis of drought variability at several time scales in Syria during 1961–2012. Atmos. Res. 2018, 200, 153–168. [Google Scholar] [CrossRef]
- Mishra, A.K.; Singh, V.P. A review of drought concepts. J. Hydrol. 2010, 391, 202–216. [Google Scholar] [CrossRef]
- Rathore, M. State Level Analysis of Drought Policies and Impacts in Rajasthan, India; International Water Management Institute (IWMI): Colombo, Sri Lanka, 2004; Volume 93. [Google Scholar]
- Rhee, J.; Im, J.; Carbone, G.J. Monitoring agricultural drought for arid and humid regions using multi-sensor remote sensing data. Remote. Sens. Environ. 2010, 114, 2875–2887. [Google Scholar] [CrossRef]
- Wang, W.; Ertsen, M.W.; Svoboda, M.D.; Hafeez, M. Propagation of drought: From meteorological drought to agricultural and hydrological drought. Adv. Meteorol. 2016, 2016, 6547209. [Google Scholar] [CrossRef]
- Huang, S.; Li, P.; Huang, Q.; Leng, G.; Hou, B.; Ma, L. The propagation from meteorological to hydrological drought and its potential influence factors. J. Hydrol. 2017, 547, 184–195. [Google Scholar] [CrossRef]
- Li, S.; Yao, Z.; Liu, Z.; Wang, R.; Liu, M.; Adam, J.C. The spatio-temporal characteristics of drought across Tibet, China: Derived from meteorological and agricultural drought indexes. Theor. Appl. Clim. 2019, 137, 2409–2424. [Google Scholar] [CrossRef]
- Ștefan, S.; Ghioca, M.; Rimbu, N.; Boroneant, C. Study of meteorological and hydrological drought in southern Romania from observational data. Int. J. Clim. 2004, 24, 871–881. [Google Scholar] [CrossRef]
- Wu, J.; Chen, X.; Yao, H.; Gao, L.; Chen, Y.; Liu, M. Non-linear relationship of hydrological drought responding to meteorological drought and impact of a large reservoir. J. Hydrol. 2017, 551, 495–507. [Google Scholar] [CrossRef]
- Zargar, A.; Sadiq, R.; Naser, B.; Khan, F.I. A review of drought indices. Environ. Rev. 2011, 19, 333–349. [Google Scholar] [CrossRef]
- Gidey, E.; Dikinya, O.; Sebego, R.; Segosebe, E.; Zenebe, A. Using drought indices to model the statistical relationships between meteorological and agricultural drought in Raya and its environs, Northern Ethiopia. Earth Syst. Environ. 2018, 2, 265–279. [Google Scholar] [CrossRef]
- Ezzine, H.; Bouziane, A.; Ouazar, D. Seasonal comparisons of meteorological and agricultural drought indices in Morocco using open short time-series data. Int. J. Appl. Earth Obs. Geoinf. 2014, 26, 36–48. [Google Scholar] [CrossRef]
- Vicente-Serrano, S.M.; Beguería, S.; López-Moreno, J.I. A multiscalar drought index sensitive to global warming: The standardized precipitation evapotranspiration index. J. Clim. 2010, 23, 1696–1718. [Google Scholar] [CrossRef] [Green Version]
- Wu, J.; Miao, C.; Zheng, H.; Duan, Q.; Lei, X.; Li, H. Meteorological and hydrological drought on the Loess Plateau, China: Evolutionary characteristics, impact, and propagation. J. Geophys. Res. Atmos. 2018, 123, 11–569. [Google Scholar] [CrossRef]
- Hisdal, H.; Tallaksen, L.M. Estimation of regional meteorological and hydrological drought characteristics: A case study for Denmark. J. Hydrol. 2003, 281, 230–247. [Google Scholar] [CrossRef]
- Obled, C.; Creutin, J.D. Some developments in the use of empirical orthogonal functions for mapping meteorological fields. J. Clim. Appl. Meteorol. 1986, 25, 1189–1204. [Google Scholar] [CrossRef]
- Wang, D.; Hejazi, M.; Cai, X.; Valocchi, A.J. Climate change impact on meteorological, agricultural, and hydrological drought in central Illinois. Water Resour. Res. 2011, 47, 1995–2021. [Google Scholar] [CrossRef] [Green Version]
- Duan, K.; Mei, Y. Comparison of meteorological, hydrological and agricultural drought responses to climate change and uncertainty assessment. Water Resour. Manag. 2014, 28, 5039–5054. [Google Scholar] [CrossRef]
- Vicente-Serrano, S.M. Differences in spatial patterns of drought on different time scales: An analysis of the Iberian Peninsula. Water Resour. Manag. 2006, 20, 37–60. [Google Scholar] [CrossRef]
- Pasho, E.; Camarero, J.J.; De Luis, M.; Vicente-Serrano, S.M. Impacts of drought at different time scales on forest growth across a wide climatic gradient in North-Eastern Spain. Agric. For. Meteorol. 2011, 151, 1800–1811. [Google Scholar] [CrossRef]
- Xu, H.; Wang, X.-P.; Zhao, C.-Y.; Yang, X. Diverse responses of vegetation growth to meteorological drought across climate zones and land biomes in northern China from 1981 to 2014. Agric. For. Meteorol. 2018, 262, 1–13. [Google Scholar] [CrossRef]
- Yao, N.; Li, Y.; Li, N.; Yang, D.; Ayantobo, O.O. Bias correction of precipitation data and its effects on aridity and drought assessment in china over 1961–2015. Sci. Total Environ. 2018, 639, 1015–1027. [Google Scholar] [CrossRef] [PubMed]
- Zhao, S. A new scheme for comprehensive physical regionalization in China. Acta Geogr. Sin. 1983, 38, 1–10. (In Chinese) [Google Scholar]
- Global Land Data Assimilation System. Available online: https://disc.gsfc.nasa.gov/datasets?Keywords=GLDAS/ (accessed on 15 July 2019).
- Kumar, S.; Peters-Lidard, C.; Tian, Y.; Houser, P.; Geiger, J.; Olden, S.; Lighty, L.; Eastman, J.; Doty, B.; Dirmeyer, P. Land information system: An interoperable framework for high resolution land surface modeling. Environ. Model. Softw. 2006, 21, 1402–1415. [Google Scholar] [CrossRef]
- Rodell, M.; Houser, P.R.; Jambor, U.; Gottschalck, J.; Mitchell, K.; Meng, C.-J.; Arsenault, K.; Cosgrove, B.; Radakovich, J.; Bosilovich, M.; et al. The global Land Data Assimilation System. Bull. Am. Meteorol. Soc. 2004, 85, 381–394. [Google Scholar] [CrossRef] [Green Version]
- Niu, G.-Y.; Yang, Z.-L.; Dickinson, R.E.; Gulden, L.E.; Su, H. Development of a simple groundwater model for use in climate models and evaluation with Gravity Recovery and Climate Experiment data. J. Geophys. Res. Space Phys. 2007, 112. [Google Scholar] [CrossRef]
- Syed, T.H.; Famiglietti, J.S.; Rodell, M.; Chen, J.; Wilson, C.R. Analysis of terrestrial water storage changes from GRACE and GLDAS. Water Resour. Res. 2008, 44, 472–486. [Google Scholar] [CrossRef]
- Yang, T.; Wang, C.; Yu, Z.; Xu, F. Characterization of spatio-temporal patterns for various GRACE- and GLDAS-born estimates for changes of global terrestrial water storage. Glob. Planet. Chang. 2013, 109, 30–37. [Google Scholar] [CrossRef]
- Lv, M.; Ma, Z.; Yuan, X.; Lv, M.; Li, M.; Zheng, Z. Water budget closure based on GRACE measurements and reconstructed evapotranspiration using GLDAS and water use data for two large densely-populated mid-latitude basins. J. Hydrol. 2017, 547, 585–599. [Google Scholar] [CrossRef]
- Google Earth Engine. Available online: https://earthengine.google.com/ (accessed on 15 July 2019).
- Li, L.; Yao, N.; Liu, D.L.; Song, S.; Lin, H.; Chen, X.; Liu, D.L. Historical and future projected frequency of extreme precipitation indicators using the optimized cumulative distribution functions in China. J. Hydrol. 2019, 579, 124170. [Google Scholar] [CrossRef]
- Leng, G.; Tang, Q.; Rayburg, S. Climate change impacts on meteorological, agricultural and hydrological droughts in China. Glob. Planet. Chang. 2015, 126, 23–34. [Google Scholar] [CrossRef]
- Zarch, M.A.A.; Sivakumar, B.; Sharma, A. Droughts in a warming climate: A global assessment of Standardized precipitation index (SPI) and Reconnaissance drought index (RDI). J. Hydrol. 2015, 526, 183–195. [Google Scholar] [CrossRef]
- Ayantobo, O.O.; Li, Y.; Song, S. Copula-based trivariate drought frequency analysis approach in seven climatic sub-regions of mainland China over 1961–2013. Theor. Appl. Climatol. 2019, 137, 2217–2237. [Google Scholar] [CrossRef]
- Mckee, T.; Doesken, N.; Kleist, J. The relationship of drought frequency and duration to time scales. In Proceedings of the 8th Conference on Applied Climatology, Anaheim, CA, USA, 17–22 January 1993; American Meteorological Society: Boston, MA, USA, 1993; pp. 179–183. [Google Scholar]
- Lloyd-Hughes, B.; Saunders, M.A. A drought climatology for Europe. Int. J. Clim. 2002, 22, 1571–1592. [Google Scholar] [CrossRef]
- Yao, N.; Feng, H.; Lei, T.; Peng, L. Drought evolution, severity and trends in mainland China over 1961–2013. Sci. Total Environ. 2018, 616–617, 73–89. [Google Scholar] [CrossRef] [PubMed]
- Vicente-Serrano, S.M.; López-Moreno, J.I.; Beguería, S.; Lorenzo-Lacruz, J.; Azorin-Molina, C.; Morán-Tejeda, E. Accurate computation of a Streamflow Drought Index. J. Hydrol. Eng. 2012, 17, 318–332. [Google Scholar] [CrossRef] [Green Version]
- Hao, Z.; AghaKouchak, A.; Nakhjiri, N.; Farahmand, A. Global integrated drought monitoring and prediction system. Sci. Data 2014, 1, 140001. [Google Scholar] [CrossRef] [PubMed]
- Shukla, S.; Wood, A.W. Use of a standardized runoff index for characterizing hydrologic drought. Geophys. Res. Lett. 2008, 35, 02405. [Google Scholar] [CrossRef] [Green Version]
- Ding, Y. Chinese Meteorological Disasters Pandect; China Meteorological Press: Beijing, China, 2008. (In Chinese) [Google Scholar]
- Kendall, M.G. Rank Correlation Methods; Griffin: London, UK, 1975. [Google Scholar]
- Mann, H.B. Nonparametric tests against trend. Econometrica 1945, 13, 245–259. [Google Scholar] [CrossRef]
- Hamed, K.H.; Rao, A.R. A modified Mann-Kendall trend test for autocorrelated data. J. Hydrol. 1998, 204, 182–196. [Google Scholar] [CrossRef]
- Liu, D.L.; Horton, R.; Ren, T.; Chen, C. Prediction of annual reference evapotranspiration using climatic data. Agric. Water Manag. 2010, 97, 300–308. [Google Scholar] [CrossRef]
- Topaloğlu, F. Regional trend detection of Turkish river flows. Hydrol. Res. 2006, 37, 165–182. [Google Scholar] [CrossRef]
- Liu, D.L.; Yao, N.; Chau, H.W. Influences of removing linear and nonlinear trends from climatic variables on temporal variations of annual reference crop evapotranspiration in Xinjiang, China. Sci. Total Environ. 2017, 592, 680–692. [Google Scholar] [CrossRef] [PubMed] [Green Version]
- Shiru, M.S.; Shahid, S.; Chung, E.S.; Alias, N. Changing characteristics of meteorological droughts in Nigeria during 1901–2010. Atmos. Res. 2019, 223, 60–73. [Google Scholar] [CrossRef]
- Whitcher, B.; Guttorp, P.; Percival, D.B. Wavelet analysis of covariance with application to atmospheric time series. J. Geophys. Res. Space Phys. 2000, 105, 14941–14962. [Google Scholar] [CrossRef] [Green Version]
- Biswas, A.; Si, B.C. Application of continuous wavelet transform in examining soil spatial variation: A review. Math. Geol. 2011, 43, 379–396. [Google Scholar] [CrossRef]
- Li, L.; Yao, N.; Li, Y.; Liu, D.L.; Wang, B.; Ayantobo, O.O. Future projections of extreme temperature events in different sub-regions of China. Atmos. Res. 2019, 217, 150–164. [Google Scholar] [CrossRef]
- Biswas, A. Scale–location specific soil spatial variability: A comparison of continuous wavelet transform and Hilbert–Huang transform. Catena 2018, 160, 24–31. [Google Scholar] [CrossRef]
- Ren, J.; Liu, H.; Yin, Y.; He, S. Drivers of greening trend across vertically distributed biomes in temperate arid Asia. Geophys. Res. Lett. 2007, 34, 07707. [Google Scholar] [CrossRef]
- Xu, G.; Zhang, H.; Chen, B.; Zhang, H.; Innes, J.; Wang, G.; Yan, J.; Zheng, Y.; Zhu, Z.; Myneni, R.B. Changes in vegetation growth dynamics and relations with climate over China’s landmass from 1982 to 2011. Remote Sens. 2014, 6, 3263–3283. [Google Scholar] [CrossRef] [Green Version]
- Wen, Z.; Wu, S.; Chen, J.; Lü, M. NDVI indicated long-term interannual changes in vegetation activities and their responses to climatic and anthropogenic factors in the Three Gorges Reservoir Region, China. Sci. Total Environ. 2017, 574, 947–959. [Google Scholar] [CrossRef] [PubMed]
- Zhang, Y.J.; Wang, C.Y.; Zhang, J.Q. Analysis of the spatial and temporal characteristics of drought in the north china plain based on standardized precipitation evapotranspiration index. Acta Ecol. Sin. 2015, 35, 7098–7107. (In Chinese) [Google Scholar]
- Ma, Z. Interannual characteristics of the surface hydrological variables over the arid and semi-arid areas of northern China. Glob. Planet. Chang. 2003, 37, 189–200. [Google Scholar] [CrossRef]
- Zhang, J.; Mu, Q.; Huang, J. Assessing the remotely sensed Drought Severity Index for agricultural drought monitoring and impact analysis in North China. Ecol. Indic. 2016, 63, 296–309. [Google Scholar] [CrossRef]
- Xu, K.; Yang, D.; Xu, X.; Lei, H. Copula based drought frequency analysis considering the spatio-temporal variability in Southwest China. J. Hydrol. 2015, 527, 630–640. [Google Scholar] [CrossRef]
- Sun, G.; Li, Z.; Feng, J. Relationship between atmospheric low-frequency oscillation and two severe drought events in southwest china. Plateau Meteorol. 2014, 33, 1562–1567. (In Chinese) [Google Scholar]
- Klamt, A.-M.; Hu, K.; Huang, L.; Chen, X.; Liu, X.; Chen, G. An extreme drought event homogenises the diatom composition of two shallow lakes in southwest China. Ecol. Indic. 2020, 108, 105662. [Google Scholar] [CrossRef]
- Vu, M.T.; Raghavan, V.S.; Liong, S.-Y. Ensemble climate projection for hydro-meteorological drought over a river basin in Central Highland, Vietnam. KSCE J. Civ. Eng. 2015, 19, 427–433. [Google Scholar] [CrossRef]
- Wilhite, D.A.; Glantz, M.H. Understanding: The drought phenomenon: The role of definitions. Water Int. 1985, 10, 111–120. [Google Scholar] [CrossRef] [Green Version]
- Sun, Z.; Zhu, X.; Pan, Y.; Zhang, J.; Liu, X. Drought evaluation using the GRACE terrestrial water storage deficit over the Yangtze River Basin, China. Sci. Total Environ. 2018, 634, 727–738. [Google Scholar] [CrossRef] [PubMed]
- Lai, C.; Zhong, R.; Wang, Z.; Wu, X.; Chen, X.; Wang, P.; Lian, Y. Monitoring hydrological drought using long-term satellite-based precipitation data. Sci. Total Environ. 2019, 649, 1198–1208. [Google Scholar] [CrossRef] [PubMed]
- Ma’Rufah, U.; Hidayat, R.; Prasasti, I. Analysis of relationship between meteorological and agricultural drought using standardized precipitation index and vegetation health index. IOP Conf. Ser. Earth Environ. Sci. 2017, 54, 12008. [Google Scholar] [CrossRef]
- Jiang, Y.; Zhang, X.; Yang, L.; He, C. Analysis and comparison of spatial and temporal patterns of meteorological and hydrological drought indices in the upper reach of the Heihe river watershed, northwest china. Resour. Sci. 2014, 36, 1842–1851. (In Chinese) [Google Scholar]
- Li, Y.; He, J.; Li, X. Evolution analysis of meteorological and hydrological drought in Yunnan Red River Basin based on SPEI and SDI index. Prog. Geogr. 2016, 35, 758–767. (In Chinese) [Google Scholar]
- Fu, B. On the calculation of evaporation from land surface in mountainous areas. Sci. Meteorol. Sin. 1996, 5, 24–30. (In Chinese) [Google Scholar]
- Ma, Q.; Li, Y.; Feng, H.; Yu, Q.; Zou, Y.; Liu, F.; Pulatov, B. Performance evaluation and correction of precipitation data using the 20-year IMERG and TMPA precipitation products in diverse subregions of China. Atmos. Res. 2020, in press. [Google Scholar] [CrossRef]
| Precipitation | Soil Water Storage | Baseflow-Groundwater Runoff | |
|---|---|---|---|
| Gamma | 4124 | 367 | 4584 |
| GEV | 1489 | 8454 | 3140 |
| Gumbel | 1203 | 460 | 773 |
| LN2 | 12 | 983 | 1830 |
| LN3 | 2596 | 271 | 0 |
| Normal | 2026 | 1211 | 510 |
| P-III | 102 | 2574 | 1280 |
| Poiss | 582 | 95 | 0 |
| Weibull | 0 | 787 | 1589 |
| Pareto | 3068 | 0 | 848 |
| SPI/SSI/SRI | Drought Severity Level |
|---|---|
| −0.5 ≤ SPI/SSI/SRI < 0.5 | Normal |
| −1.0 ≤ SPI/SSI/SRI < −0.5 | Mild drought |
| −1.5 ≤ SPI/SSI/SRI < −1.0 | Moderate drought |
| −2.0 ≤ SPI/SSI/SRI < −1.5 | Severe drought |
| SPI/SSI/SRI < −2.0 | Extreme drought |
| Sub-Region Variable | 1 | 2 | 3 | 4 | 5 | 6 | 7 |
|---|---|---|---|---|---|---|---|
| PPT (mm) | 103.4 ± 8.4 | 294.2 ± 41.5 | 400.2 ± 22.7 | 529.0 ± 49.6 | 539.0 ± 65.7 | 1176.3 ± 88.0 | 1468.5 ± 134.8 |
| SWS (mm) | 311.3 ± 2.2 | 361.2 ± 24.9 | 461.8 ± 3.8 | 526.3 ± 40.7 | 490.9 ± 26.5 | 686.8 ± 8.6 | 649.6 ± 10.4 |
| BGR (mm) | 1.2 ± 0.1 | 7.6 ± 5.1 | 100.9 ± 17.0 | 44.2 ± 27.3 | 51.3 ± 28.1 | 461.3 ± 77.4 | 637.9 ± 113.2 |
| Timescale (Month) | Drought Index | Sub-Region | |||||||
|---|---|---|---|---|---|---|---|---|---|
| 1 | 2 | 3 | 4 | 5 | 6 | 7 | MC | ||
| 1 | SPI~SSI | 0.12 | 0.11 | 0.19 | 0.14 | 0.17 | 0.51 | 0.56 | 0.26 |
| SPI~SRI | 0.00 | 0.04 | 0.10 | 0.12 | 0.09 | 0.44 | 0.50 | 0.18 | |
| 3 | SPI~SSI | 0.15 | 0.19 | 0.27 | 0.24 | 0.27 | 0.65 | 0.67 | 0.35 |
| SPI~SRI | 0.00 | 0.09 | 0.19 | 0.27 | 0.21 | 0.66 | 0.71 | 0.30 | |
| 6 | SPI~SSI | 0.19 | 0.33 | 0.35 | 0.36 | 0.41 | 0.71 | 0.69 | 0.43 |
| SPI~SRI | 0.02 | 0.19 | 0.31 | 0.42 | 0.39 | 0.80 | 0.86 | 0.43 | |
| 12 | SPI~SSI | 0.25 | 0.54 | 0.42 | 0.55 | 0.60 | 0.71 | 0.64 | 0.53 |
| SPI~SRI | 0.07 | 0.36 | 0.45 | 0.64 | 0.64 | 0.91 | 0.94 | 0.57 | |
| 24 | SPI~SSI | 0.29 | 0.65 | 0.46 | 0.65 | 0.72 | 0.71 | 0.64 | 0.59 |
| SPI~SRI | 0.12 | 0.45 | 0.50 | 0.72 | 0.73 | 0.93 | 0.96 | 0.63 | |
| Timescale (Month) | Drought Index | Lag Time (Month) | |||||
|---|---|---|---|---|---|---|---|
| 0 | 1 | 2 | 3 | 4 | 5 | ||
| 1 | SPI~SSI | 2408 | 0 | 0 | 0 | 0 | 0 |
| SPI~SRI | 1474 | 0 | 0 | 0 | 0 | 0 | |
| 3 | SPI~SSI | 3958 | 85 | 0 | 0 | 0 | 0 |
| SPI~SRI | 3600 | 87 | 0 | 0 | 0 | 0 | |
| 6 | SPI~SSI | 5141 | 3325 | 546 | 7 | 0 | 0 |
| SPI~SRI | 5464 | 3823 | 875 | 0 | 0 | 0 | |
| 12 | SPI~SSI | 8868 | 7326 | 5388 | 2888 | 1082 | 283 |
| SPI~SRI | 8296 | 7665 | 7057 | 6256 | 4812 | 1862 | |
| 24 | SPI~SSI | 10,371 | 9937 | 9323 | 8505 | 7499 | 6307 |
| SPI~SRI | 9214 | 9024 | 8795 | 8480 | 8012 | 7579 | |
Publisher’s Note: MDPI stays neutral with regard to jurisdictional claims in published maps and institutional affiliations. |
© 2020 by the authors. Licensee MDPI, Basel, Switzerland. This article is an open access article distributed under the terms and conditions of the Creative Commons Attribution (CC BY) license (http://creativecommons.org/licenses/by/4.0/).
Share and Cite
Yao, N.; Zhao, H.; Li, Y.; Biswas, A.; Feng, H.; Liu, F.; Pulatov, B. National-Scale Variation and Propagation Characteristics of Meteorological, Agricultural, and Hydrological Droughts in China. Remote Sens. 2020, 12, 3407. https://doi.org/10.3390/rs12203407
Yao N, Zhao H, Li Y, Biswas A, Feng H, Liu F, Pulatov B. National-Scale Variation and Propagation Characteristics of Meteorological, Agricultural, and Hydrological Droughts in China. Remote Sensing. 2020; 12(20):3407. https://doi.org/10.3390/rs12203407
Chicago/Turabian StyleYao, Ning, Huichao Zhao, Yi Li, Asim Biswas, Hao Feng, Fenggui Liu, and Bakhtiyor Pulatov. 2020. "National-Scale Variation and Propagation Characteristics of Meteorological, Agricultural, and Hydrological Droughts in China" Remote Sensing 12, no. 20: 3407. https://doi.org/10.3390/rs12203407
APA StyleYao, N., Zhao, H., Li, Y., Biswas, A., Feng, H., Liu, F., & Pulatov, B. (2020). National-Scale Variation and Propagation Characteristics of Meteorological, Agricultural, and Hydrological Droughts in China. Remote Sensing, 12(20), 3407. https://doi.org/10.3390/rs12203407