Article

Mapping Ratoon Rice Planting Area in Central China Using Sentinel-2 Time Stacks and the Phenology-Based Algorithm

1
Macro Agriculture Research Institute, Huazhong Agricultural University, Wuhan 430070, China
2
School of Resources and Environment, Huazhong Agricultural University, Wuhan 430070, China
3
School of Hydropower and Information Engineering, Huazhong University of Science and Technology, Wuhan 430074, China
*
Author to whom correspondence should be addressed.
Remote Sens. 2020, 12(20), 3400; https://doi.org/10.3390/rs12203400
Submission received: 15 September 2020 / Revised: 9 October 2020 / Accepted: 13 October 2020 / Published: 16 October 2020
(This article belongs to the Special Issue Remote Sensing for Crop Mapping)

Abstract

:
Mapping rice cropping systems is important for grain yield prediction and food security assessments. Both single- and double-season rice are the dominant rice systems in central China. However, because of increasing labor shortages and high costs, there has been a gradual decline in double-season rice. Ratoon rice (RR) has been proposed as an alternative system that balances the productivity, cost, and labor requirements of rice cultivation. RR has been expanding in central China, encouraged by the improved cultivars, machinery, and favorable policies. However, to our knowledge, the distribution of RR has not been mapped with remote sensing techniques. This study developed a phenology-based algorithm to map RR at a 10 m resolution in Hubei Province, Central China, using dense time stacks of Sentinel-2 images (cloud cover <80%) in 2018. The key in differentiating RR from the other rice cropping systems is through the timing of maturity. We proposed to use two contrast vegetation indices to identify RR fields. The newly-developed yellowness index (YI) calculated with the reflectance of blue, green, and red bands was used to detect the ripening phase, and the enhanced vegetation index (EVI) was used to detect the green-up of the second-season crop to eliminate the misclassification caused by stubbles left in the field. The RR map demonstrated that RR was mainly distributed in the low alluvial plains of central and southern Hubei Province. The total planting area of RR in 2018 was 2225.4 km2, accounting for 10.03% of the total area of paddy rice fields. The overall accuracy of RR, non-RR rice fields, and non-rice land cover types was 0.76. The adjusted overall accuracy for RR and non-RR was 0.91, indicating that the proposed YI and the phenology-based algorithm could accurately identify RR fields from the paddy rice fields.

Graphical Abstract

1. Introduction

Rice (Oryza sativa) cropping systems are of great importance for global food security [1]. China is the largest rice-producing country, accounting for 28% of global rice production [2]. Middle- and double-season rice are the dominant rice systems in central China [3]. However, intensive cropping systems result in adverse impacts on the environment [4] as well as in higher production costs. During recent decades, double-season rice systems in central China have progressively shifted into single-season rice mainly due to high costs and an increase in labor shortages [5]. Hence, there is a growing interest in identifying an alternative rice system that can increase the productivity while reducing the environmental impact and the labor cost of existing cultivation practices.
Ratooning is a management option in rice systems that allows for rice regrowth leading to a second or ratoon crop harvest following that of the main crop [6]. Compared to a double-season rice system, the ratoon rice (RR) system does not require the additional labor for transplanting a second rice crop. Ratoon crop yield can be as high as 50% of that produced from the main crop [7]. The yield of RR is generally higher than single-season rice and lower than double-season rice [5]. Worldwide, ratooning may help adapt rice production to climate uncertainty [8]. RR is currently practiced in many countries including China, India, Japan, Philippines, Puerto Rico, Brazil, Thailand, and the U.S., but only in limited areas [9,10]. In China, RR has been traditionally practiced widely since the 1950s. In recent years, RR planted area increased rapidly in central China, taking advantage of the development of new rice cultivars with high ratooning ability, the advancements in crop and water management, and mechanical harvesting techniques [5]. Because of the increasing planted area of RR and the need to balance agricultural labor costs and food security, the sustainable and effective management of rice production in central China requires accurate mapping of the RR planted area. Given the fragmented crop fields in central China, remote sensing provides the most practical and cost-effective way to map RR in this region.
Many efforts have been made to map the extent or area of rice paddy fields using different remotely sensed data including optical and microwave remote sensing images [11,12,13,14,15] and various algorithms (e.g., supervised classifiers, unsupervised classifiers, and knowledge-based approaches) [16,17,18,19]. A thorough review of regional to global paddy rice mapping methods was provided by Dong and Xiao [20]. As rice spends a portion of its phenological cycle submerged in water, most remote sensing methods map it by extracting the flooded paddy area during the initial growth stages of rice. Xiao et al. [21] found that the flooding and transplanting signals can be extracted based on the relationship between the normalized difference vegetation index (NDVI) or the enhanced vegetation index (EVI) and the land surface water index (LSWI), in which the LSWI values are temporarily greater than NDVI or EVI values during these phases. This phenology-based method has been widely used to map paddy rice at regional and national scales [12,22,23]. Improvements have been made to adapt the original method to different study areas and increase the accuracy of paddy rice mapping [20,24].
Due to the complexity of the rice cropping system in the Southeast Asia, a few studies have focused on differentiating the single-, double-, and triple-season rice in this region with various methods. Rice paddy fields in the Mekong River Delta were mapped by adapting the phenology-based method and using Landsat time stacks by Kontgis et al. [24]. They differentiated between single-, double-, and triple-season rice paddies by counting the peaks in EVI trajectories. In Guan et al. [25]’s study, rice cropping systems in Vietnam were mapped based on the similarity between the NDVI time series of every pixel and the standard NDVI time series of different rice cropping systems. The single- and double-season rice in Hanoi, Vietnam were mapped using a Random Forest Algorithm and a time series of Sentinel-1 SAR imagery by Lasko et al. [26]. The rice intensity in the Senegal River Valley was analyzed using the PhenoRice algorithm and MODIS time series by Busetto et al. [15].
The current methods for mapping rice cropping systems mainly used the flooding signals, the peaks of EVI/NDVI, or the similarities between the reference times series of EVI/NDVI and those of the targets. However, these methods are not suitable for mapping RR fields. The challenge of differentiating the RR from the other rice cropping system is that the rice stubble left after the harvest of the main crop may minimize the flooding signal of the second crop in the remotely sensed images. In addition, the NDVI and EVI time series of RR may resemble those of double-season rice, both of which have two phenological cycles. RR would be easily classified as double-season rice with current methods developed for mapping rice cropping systems.
The phenology of RR is slightly different from the other rice systems. Its ripening stage starts later than that of the early-season rice and earlier than that of the middle-season rice [5]. We hypothesized that the spectral characteristics of rice at the ripening phase can be used to differentiate RR from the other rice systems. Therefore, the objective of this study was to develop a phenology-based algorithm to map the RR planted area in Hubei Province, Central China in 2018. The novelty of this phenology-based algorithm was to identify RR fields with two contrasting vegetation indices: the newly-developed yellowness index (YI) to detect the ripening phase and the EVI to detect the green-up of the second-season crop. Since the crop fields in central China are highly fragmented, we used Sentinel-2A and 2B time stacks at a 10-m spatial resolution to obtain a detailed and accurate map of an RR planted area.

2. Materials and Methods

2.1. Study Area

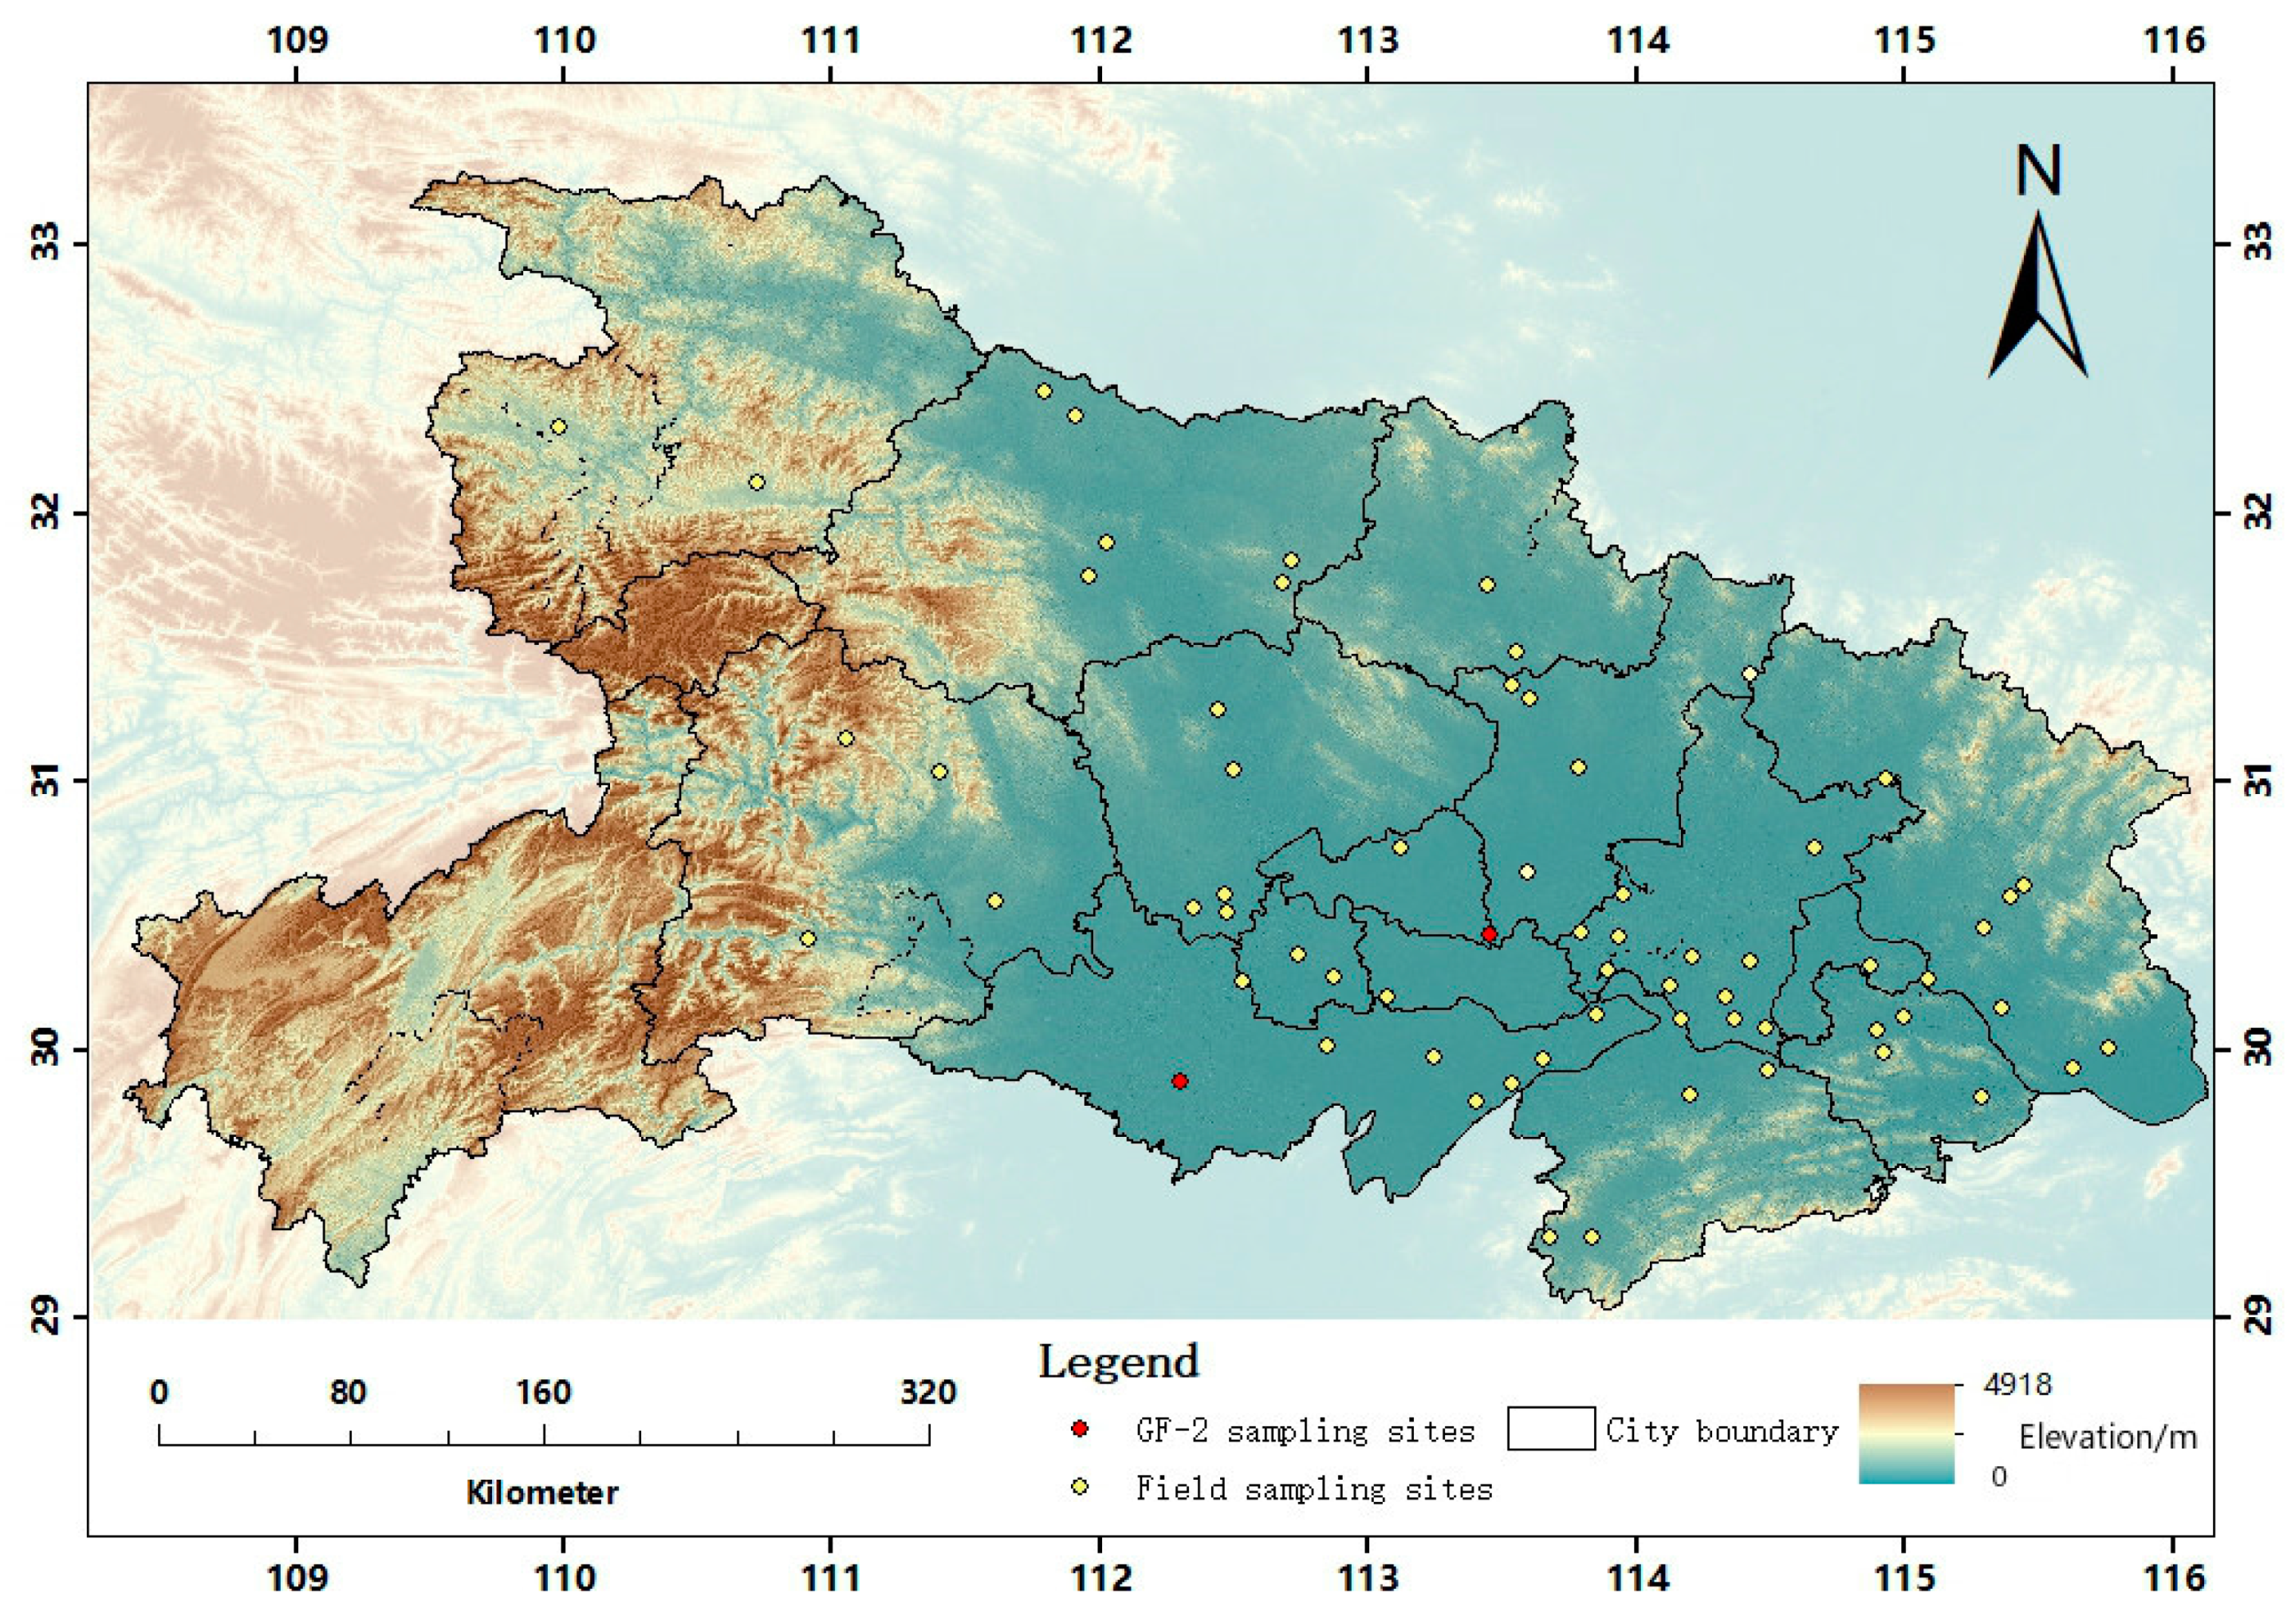
This study was conducted in Hubei Province, Central China, covering 185,900 km2 (Figure 1). The Jianghan Plain takes up most of central and southern Hubei, while western Hubei is more mountainous. Hubei has a humid subtropical climate, with precipitation following a monsoon pattern. In 2018, the mean temperature was 17.1 °C and the mean precipitation was 1119 mm [27].
Hubei is one of the most important rice producing provinces in China, with a total annual rice production of 17 Mt, representing approximately 8% of the total national rice production [28]. A gradual transition from middle- and double-season rice to RR has occurred in Hubei [29]. With the increasing shortage of labor and the improved RR cultivars and management strategies, additional planting areas of middle- and double-season rice are expected to be converted to RR.

2.2. Data

2.2.1. Sentinel-2 Data and Preprocessing

We used all available Level 1 scenes of the 2018 growing season (March to November) with cloud cover of less than 80% in order to capture the flooding signals of the complex rice cropping systems in the study area. The preprocessing involved the default atmospheric and topographic correction using Sen2Cor in the Sentinel-2 toolbox in SNAP (vers.6.0, ESA, 2016). This study used bands 2, 3, 4, 8, and 11. The central wavelength, bandwidths, and spatial resolutions of these bands are shown in Table 1. Band 11 was resampled to 10-m resolution, using the cubic convolution method. Cloud-cover and cloud-shadow pixels were identified as those pixels with blue reflectance higher than 0.25 [18].
In addition to the reflectance data, we calculated the EVI and the LSWI with the following equations and spectral bands:
EVI = 2.5 × B 8 B 4 B 8 + 6 × B 4 7.5 × B 2 + 1
LSWI = B 11 B 8 B 11 + B 8
where B4, B8, and B11 are the surface reflectance of Band 4, Band 8, and Band 11 in the Sentinel-2A and 2B sensors.
To remove the small fluctuations in the EVI times series, we used the improved Savitzky–Golay filter developed by Chen et al. [30]. Since the LSWI is sensitive to the change in vegetation water and soil moisture [31], the LSWI time series was not smoothed in this study.

2.2.2. Reference Data

Reference data of RR, non-RR paddy rice, and non-rice land cover types were obtained from field surveys and high-resolution satellite images. We visited 60 villages and collected ground truths data with a portable GPS (Garmin MTK 6735, Garmin Ltd., Switzerland) and an unmanned aerial vehicle (Mavic Pro, SZ DJI Technology Co., Ltd., Shenzhen, China) during the growing season of 2018 and 2019. Additionally, we visually identified non-RR paddy rice samples and non-rice land cover samples from two villages in GF-2 multispectral images. We collected 984 reference data, including 355 RR samples, 412 non-RR paddy rice samples, and 217 non-rice land cover types. Figure 1 shows the spatial distribution of the 60 villages in total where reference data were collected in the study area.

2.2.3. FROM-GLC10

FROM-GLC10 is the 10-m resolution global land cover map based on 2017 Sentinel-2 data [32]. The dataset includes ten land cover types, namely cropland, forest, grassland, shrubland, wetland, water, tundra, impervious surface, barren, and snow/ice. The overall accuracy of the global land cover map is 72.76%. We downloaded FROM-GLC10 of the study area from http://data.ess.tsinghua.edu.cn and the cropland in Hubei province derived was used to screen the paddy rice field pixels.

2.2.4. Digital Elevation Model (DEM)

DEM data (GDEMDEM) with a spatial resolution of 30 m was downloaded from Geospatial Data Cloud (http://www.gscloud.cn/search). The 30-m DEM data was resampled to 10 m using the nearest neighbor resampling method. Slope was calculated based on the 10-m DEM data in ArcGIS10.2 (Environmental Systems Research Institute, Inc., Red Lands, CA, USA).

2.2.5. Rice Planting Area from Rural Statistical Yearbook

Hubei Rural Statistical Yearbook publishes annual reports on the planting areas of the main crops in each city. The statistical yearbook that reports the rice planting area in 2018 was downloaded from https://navi.cnki.net/knavi/Yearbook.html. The rice planting area of 17 prefectural-level cities was used to validate the rice planting area derived from this study at the city level.

2.3. Methods

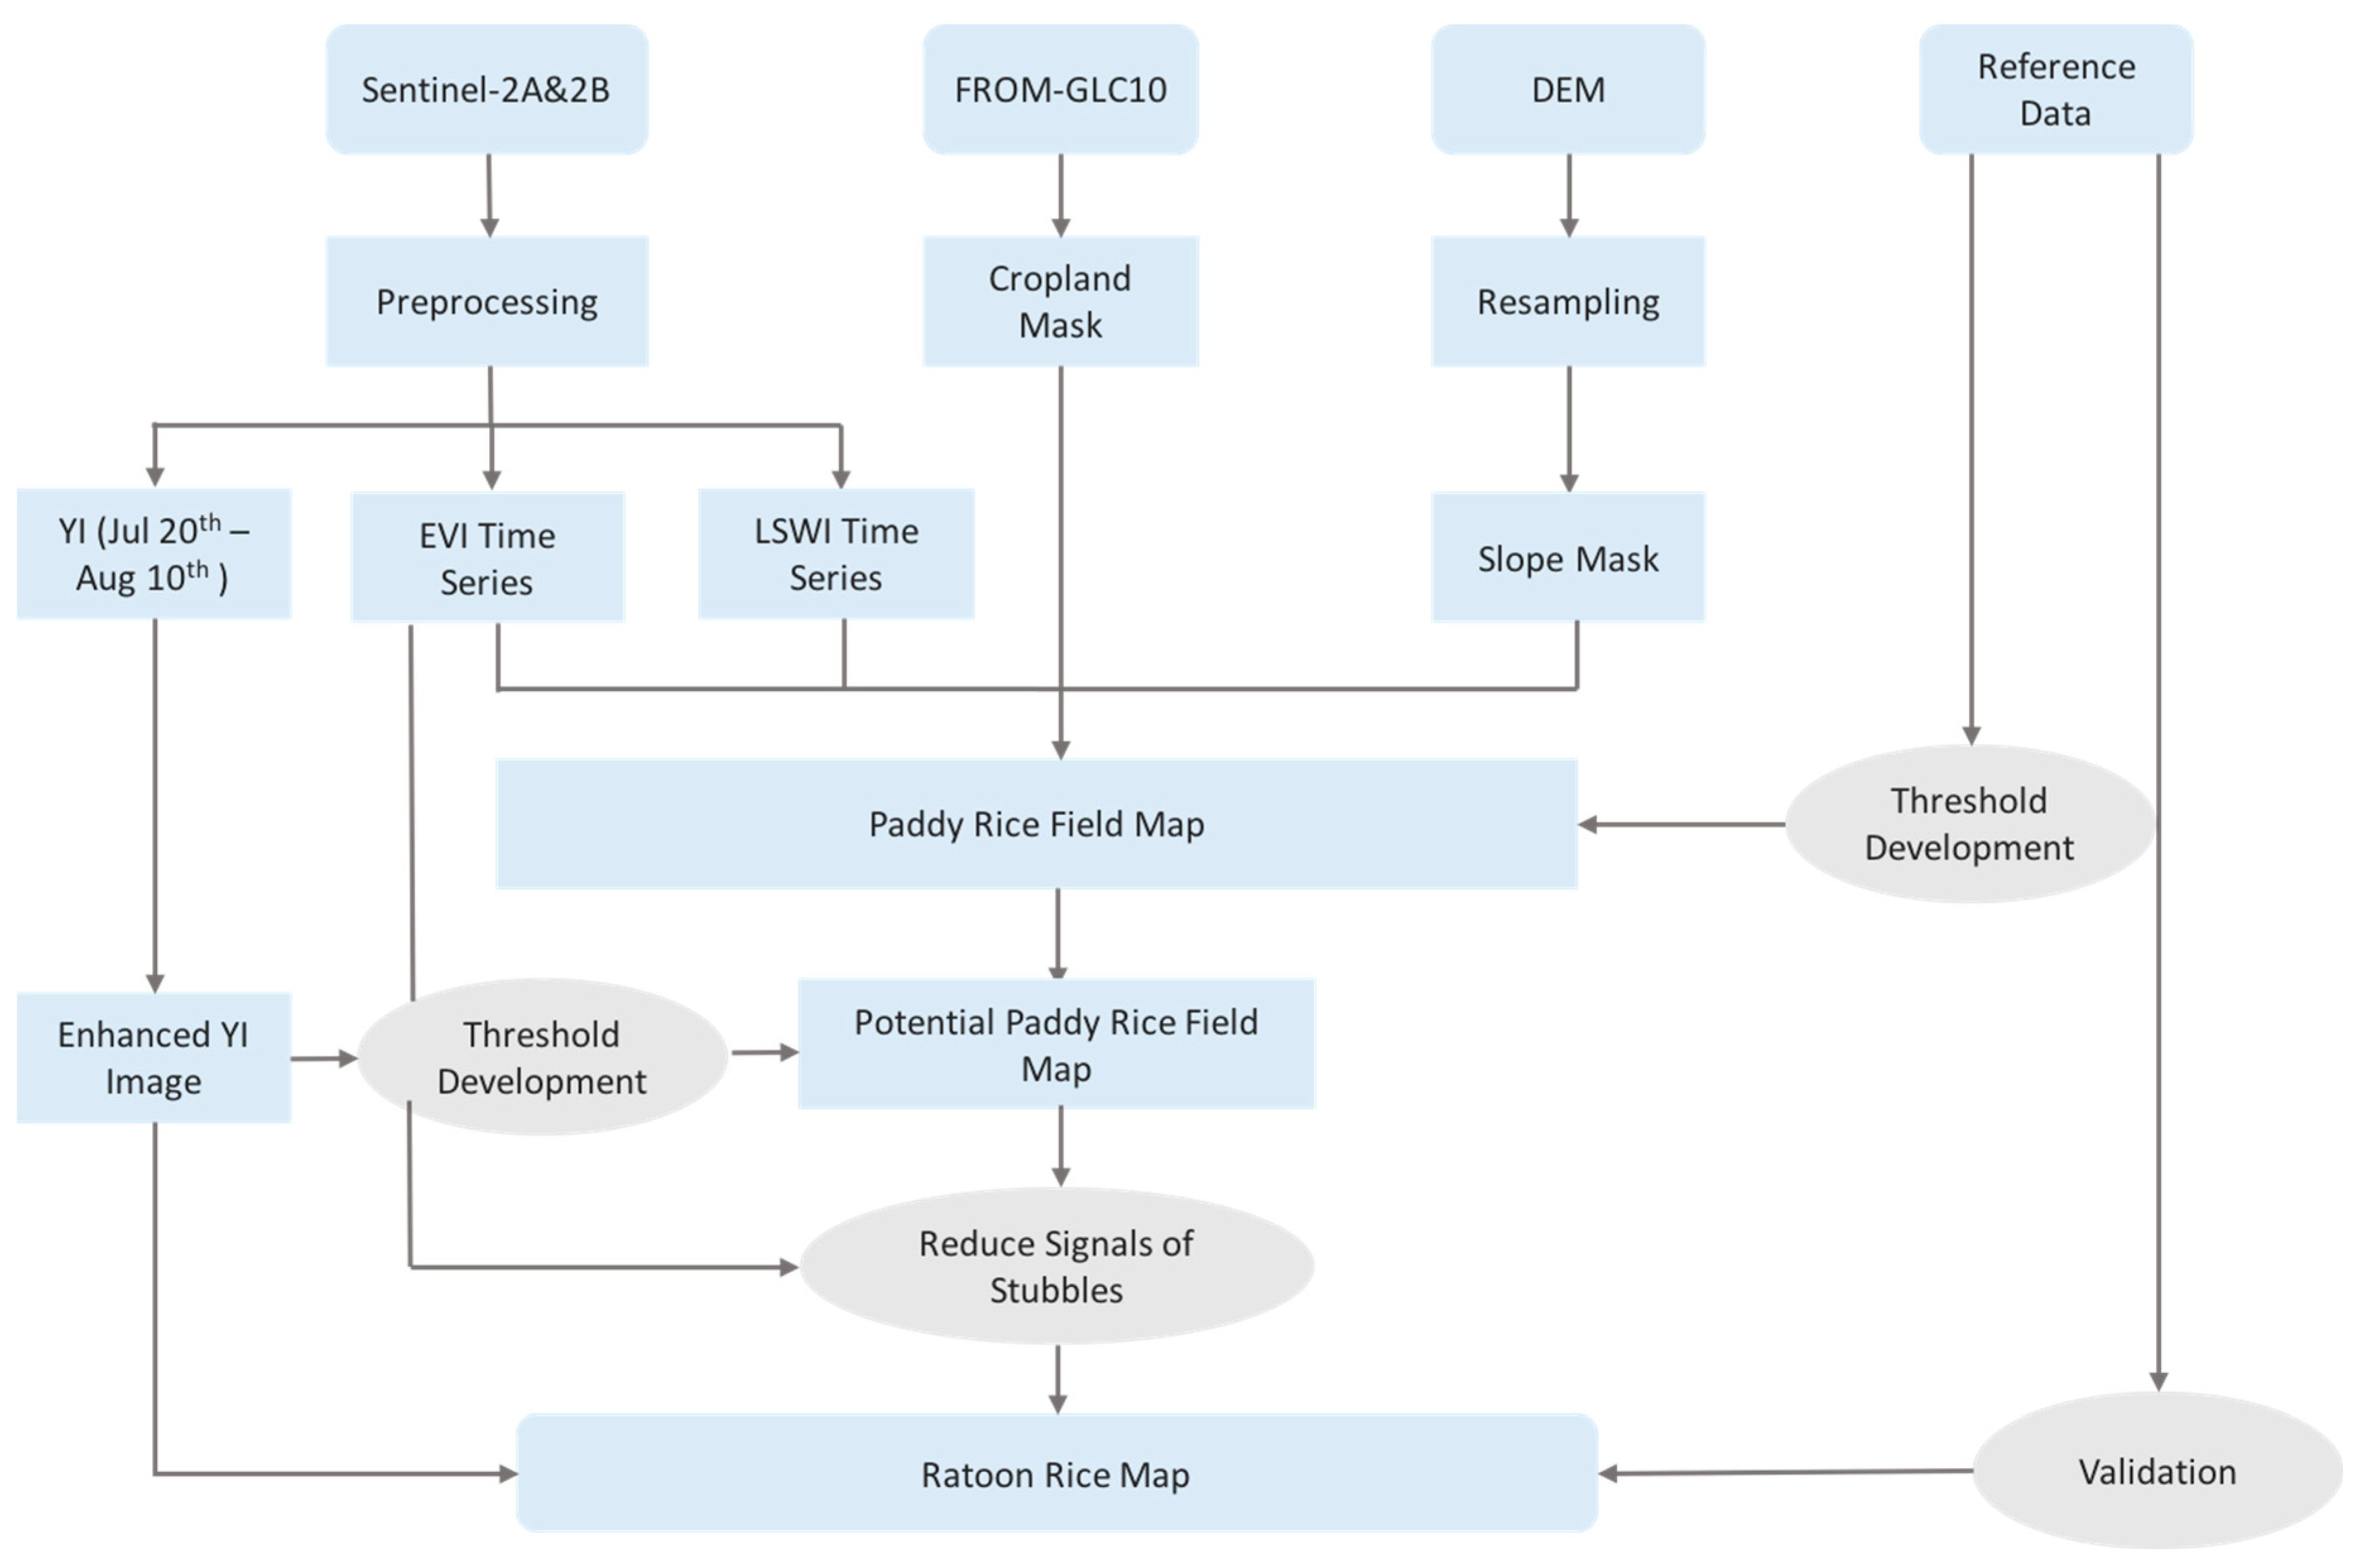
The RR planning area was mapped based on the paddy rice field map, which was generated by detecting the flooding signal of cropland during the growing season. RR was identified based on the differences in the timing of ripening phase from that of the middle- and double-season rice system in the study area. We proposed a YI to capture the ripening signal. The EVI values after the ripening period were used to remove the confusing pixels that had stubbles from the early-season rice left in the field. The accuracy of the RR map was evaluated with the reference data. An overview of the workflow is given in Figure 2.

2.3.1. Mapping Paddy Rice Field

Rice has three distinct growing phases, including the sowing-transplanting phase, the growing phase, and the after-harvest phase [33]. Each phase has a distinct spectral signature that can be explored for mapping paddy rice with remote sensing techniques. Especially, during the sowing-transplanting phase, paddy rice fields are flooded and canopies are open. In this study, the phenology-based method proposed by Xiao et al. [21] was adopted to map paddy rice fields and the difference between the EVI and the LSWI (EVI-LSWI) was calculated for each scene to detect the flooding signal of paddy rice fields. The phenology-based method detects flooding and transplanting signals of paddy rice using the criteria LSWI > EVI or LSWI > NDVI. The study area has early-, middle-, and late-season rice systems. Rice is transplanted no earlier than mid-March and no later than mid-August. Thus, a pixel was identified as a potential paddy rice field as long as the value of (EVI–LSWI) was smaller than 0 at any point from March 15th to August 15th.
There are many small ponds in the agricultural fields in the central and southern Hubei Province. These ponds are mainly used to grow aquatic plants or for fish farming. The ponds that grow aquatic plants exhibit a flooding signal before aquatic plants thrive, and their EVI variations are thus similar to those of paddy rice. Comparing the time series of the EVI and the LSWI of ponds that grow aquatic plants and the paddy rice fields, we found that the EVI over the ponds increased sharply in June and reached higher EVI values than over paddy rice fields. The average June EVI values of the pond samples were calculated and used as the threshold to differentiate the paddy rice fields from ponds.
Moreover, as the paddy rice is mainly planted in the plain area due to flooding requirements during the transplanting stage, land with a slope higher than 7° was excluded from this study. The threshold to define the sloping land was derived from the slope of the 95% quantile of the ground paddy rice samples.
Therefore, a pixel was classified as the paddy rice field only if these four conditions were met:
{ C R O P = = 1 S L O P E < 7 ° E V I i L S W I i < 0 E V I J u n e ¯ < 0.75
where CROP == 1 means the pixel is identified as cropland in FROM-GLC10, SLOPE is the slope calculated based on the 10-m DEM data, EVIi and LSWIi are the EVI and LSWI values on any day during the study period, and E V I J u n e ¯ is the average of the EVI values in June.

2.3.2. Mapping RR

As rice matures, its canopy turns ‘golden’ and the reflectance of the green and red bands increases. To capture the maturity signal of RR and differentiate RR from the middle- and double-season rice systems, we proposed the YI calculated as the contrast between blue light and the combination of red and green light:
YI = B 3 + B 4 B 2
where B2, B3, and B4 are the surface reflectance of Band 2, Band 3, and Band 4 in the Sentinel-2A and 2B sensors.
Since the timing of maturity may vary across the study area, usually between July 20th and August 10th, we firstly calculated the mean YI (YImean) during July 20th to August 10th for each pixel. To enhance the contrast between the mature RR and the non-RR, the Otsu’s method was employed to classify the new dataset into two types [34]. The pixels with the higher YImean were considered to be potential RR pixels, and they were assigned with the maximal YI (YImax) during July 20th to August 10th. The pixels with the lower YImean were assigned with the minimal YI (YImin) during July 20th–August 10th. Thus, a new dataset with the enhanced YI values was composed.
Based on this new dataset, pixels with YI values higher than the threshold (ThMI) were identified as potential RR. The ThMI was determined based on the YImax of the 50% samples randomly selected from the RR reference data:
  T h M I = Y I m a x ¯ 2 Y I s t d
where Y I m a x ¯ is the average YImax of RR samples and YIstd is the standard deviation of the YI in the RR samples.
However, in the study area, stubbles of the early-season rice were usually left in the field, and their spectra confused with those of the mature RR. Therefore, pixels identified as potential RR fields also needed to meet the criterion that the maximum EVI (EVImax) after one month of the ripening phase of RR, namely from August 11th to September 11th, had to be higher than a threshold (ThEVI). The ThEVI was determined based on the EVImax of 50 % of samples randomly selected from the RR reference data:
  T h E V I = E V I m a x ¯ 2 E V I s t d
where E V I m a x ¯ is the average of EVImax, and EVIstd is the standard deviation of the EVImax of RR samples during August 11th and September 11th.
Moreover, to differentiate the RR from the double-season rice, the (EVI–LSWI) should be higher than 0 during the period from July 20th to August 10th, because late-season rice was usually transplanted in the field and thus had a flooding signal while the RR was maturing.

2.3.3. Validation

The rice planting area extracted from the Hubei Rural Statistical Yearbook was used to validate the rice planting area at the city level. Unfortunately, the Hubei Rural Statistical Yearbook does not provide the statistics of RR planting area. A confusion matrix, the overall accuracy, and the Kappa coefficient based on the ground reference data were calculated to evaluate the accuracy of the RR map.

3. Results

3.1. Phenological Characteristics of RR

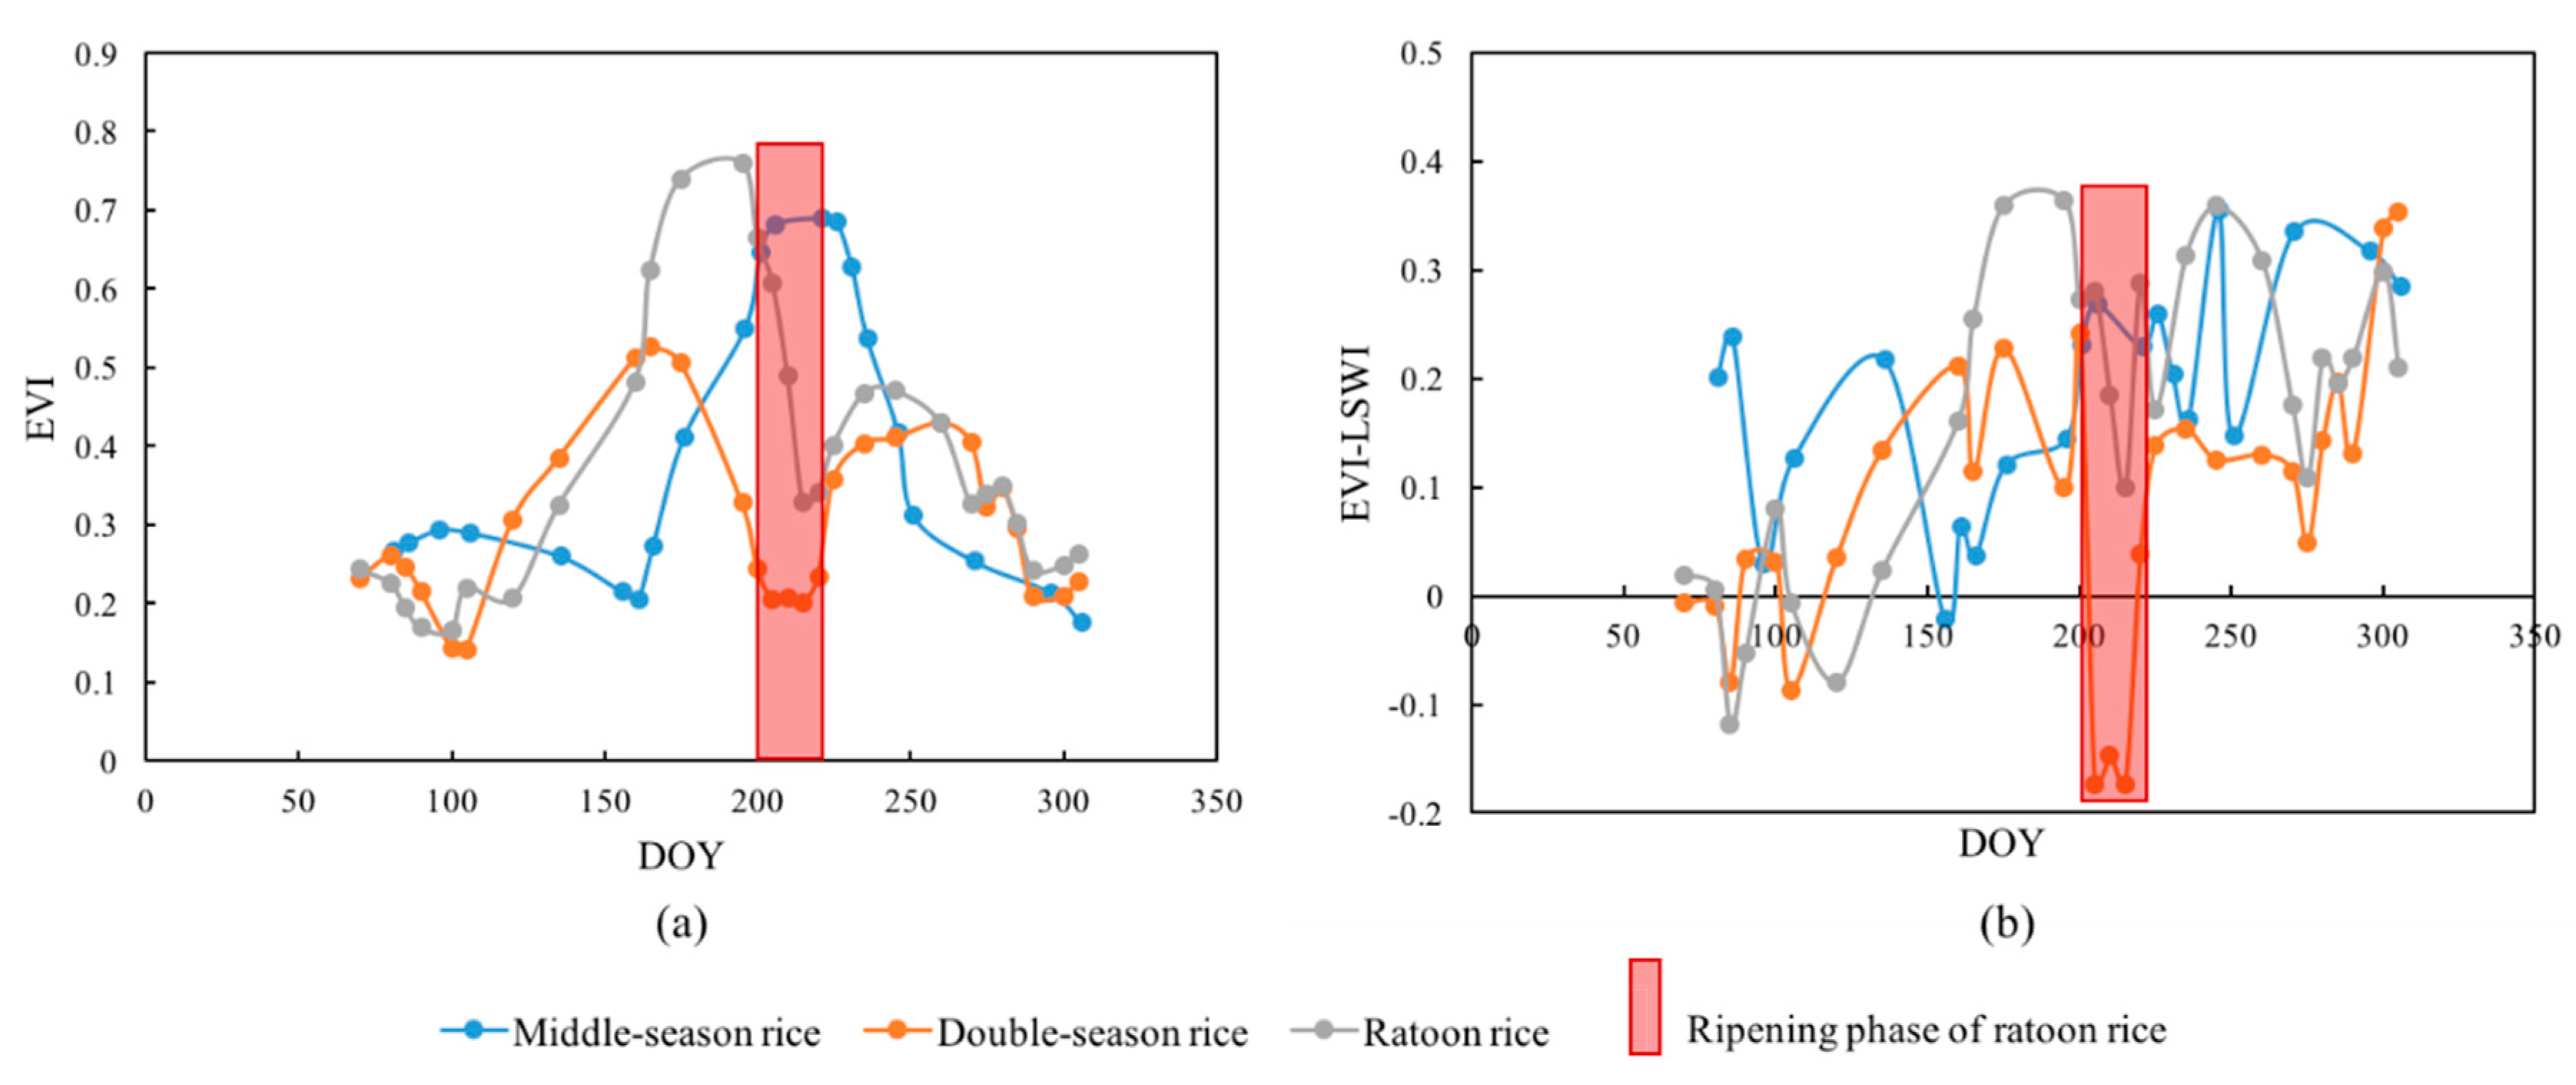
The time series of the smoothed EVI of middle-season rice, double-season rice, and RR showed that the ripening phase of RR provided a good opportunity to differentiate RR from the other rice systems. RR and middle-season rice can be easily differentiated in this window as middle-season rice was ‘green’ while RR was ‘yellow’. Both RR and double-season rice had two peaks in the time series of the EVI, but the early-season rice reached the peak earlier than RR and also matured earlier than RR (Figure 3a). While RR was maturing, early-season rice was harvested and late-season rice was transplanted in the field. Thus, in the ripening phase of RR, the (EVI–LSWI) was smaller than 0 over double season rice (Figure 3b).

3.2. Identification of RR

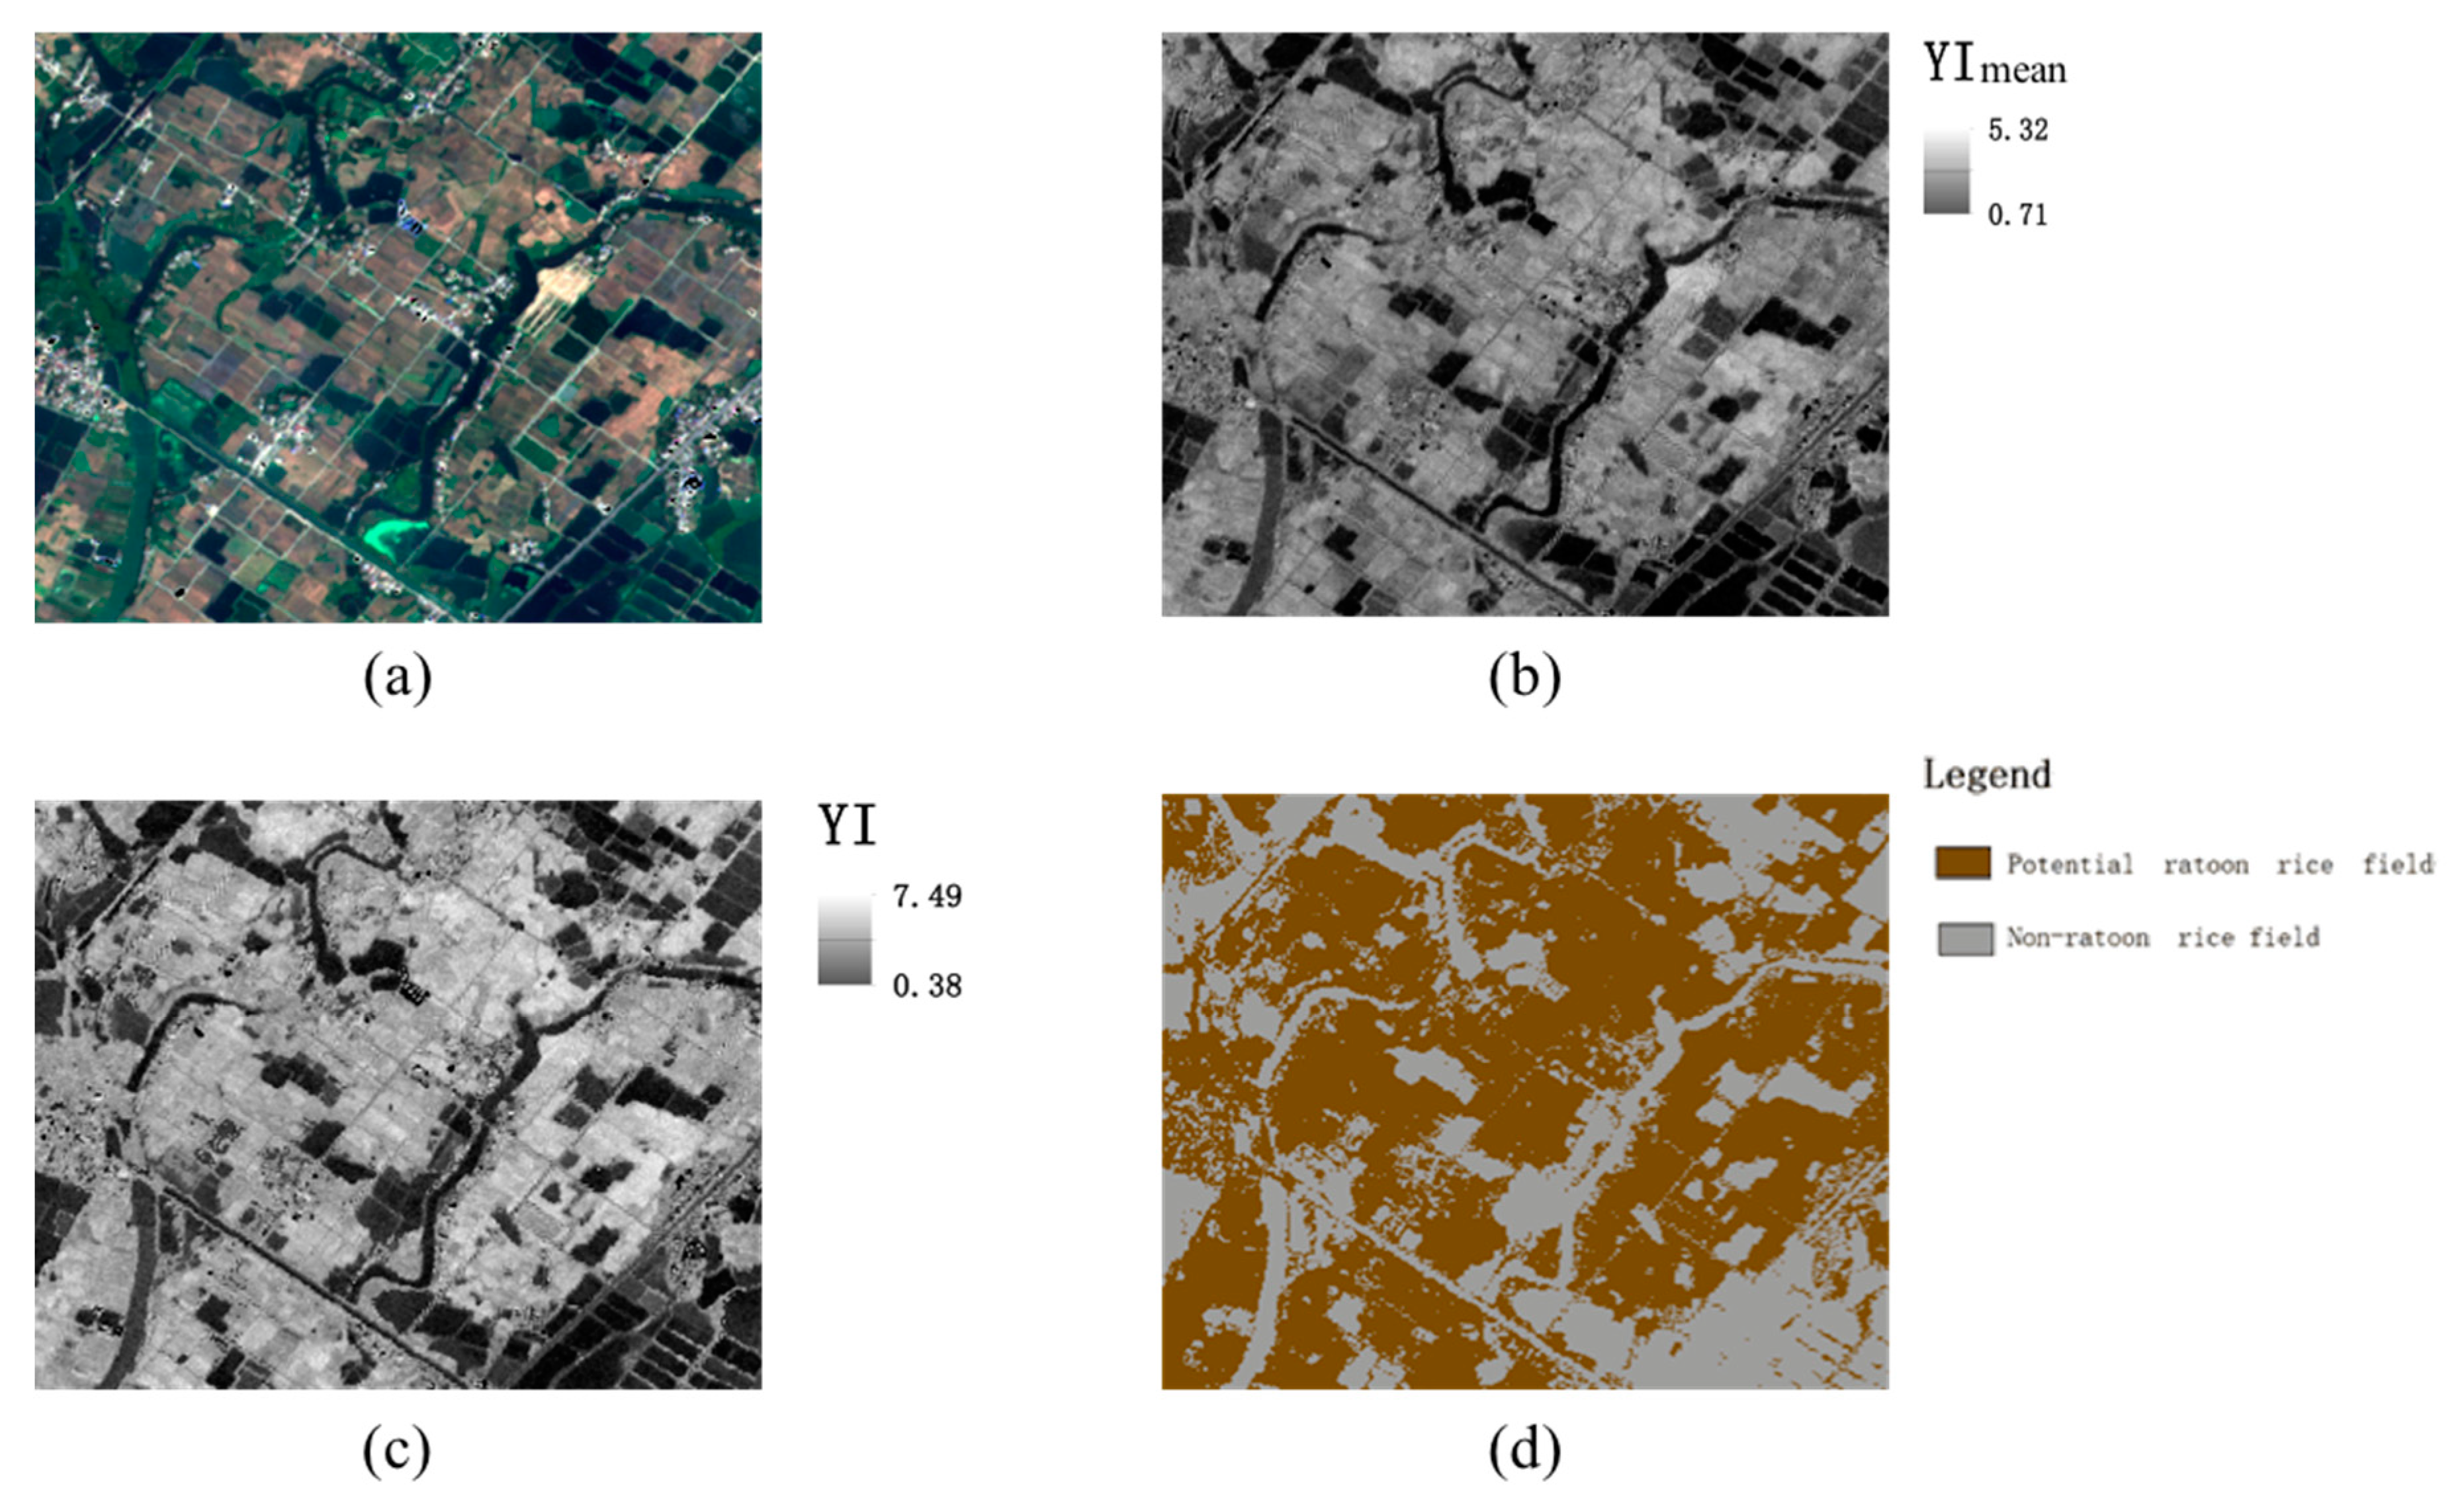
The key in differentiating RR from other rice cropping systems is its different timing of maturity. To capture the maturity signal, we proposed a YI and composited the enhanced YI image to identify the potential RR. Figure 4 shows an example of a true-color Sentinel-2A image of a cropland dominated by RR fields, its YI mean image, the enhanced YI image, and the segmentation of the potential RR fields. From the visual inspection, the YI mean showed the degree of yellowness of the fields, while the enhanced YI image increased the contrast between the mature RR and the other rice systems or crops. However, potential RR fields still had miss-classified pixels mainly due to the stubbles left in the field after the harvest of the early-season rice. The increase of the EVI after the maturity was a requirement to determine the RR fields.

3.3. RR Map and Accuracy Assessment

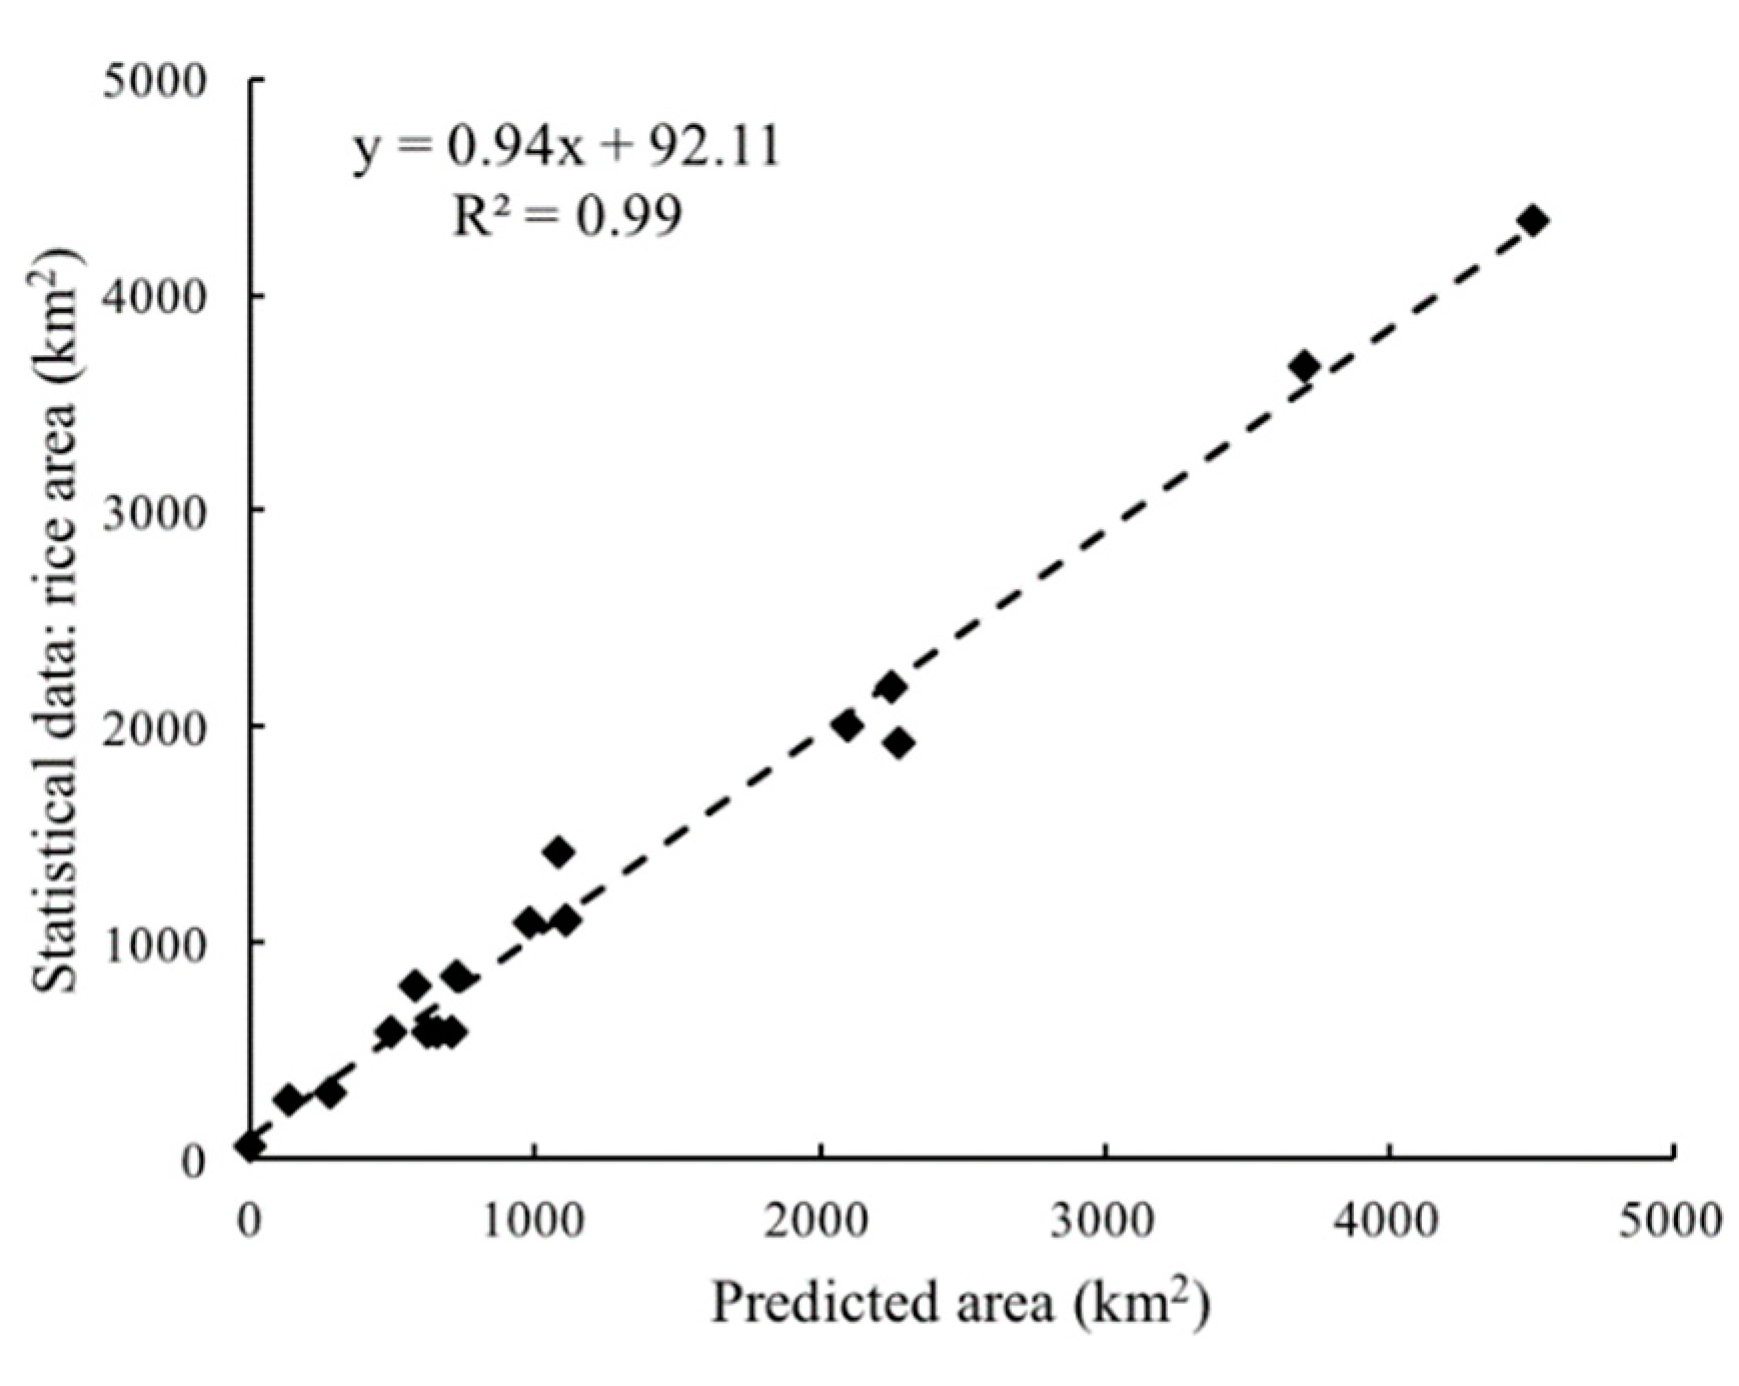
The paddy rice field map was validated with both the statistical data at the city level and the reference data collected in the field. Figure 5 illustrates that the predicted rice planting area of 17 prefectural-level cities was close to the rice planting area extracted from the Hubei Rural Statistical Yearbook. The total area of the paddy rice fields predicted in this study was 22,196.20 km2, slightly lower than the area from the statistical data (22,372.21 km2), mainly because sloping crop pixels were excluded in this study. The overall accuracy of paddy rice fields based on the field data was 0.76.
Table 2 demonstrates the confusion matrix of RR, non-RR rice systems, and non-rice land cover types based on the reference data collected in the field. The RR category had a producer’s accuracy of 0.95 and user’s accuracy of 0.76. The accuracy was mainly influenced by the misclassification of non-RR rice systems as non-rice land cover types. If the accuracy was adjusted to the identification of RR from the correctly classified paddy rice fields, the overall accuracy increased to 0.91.
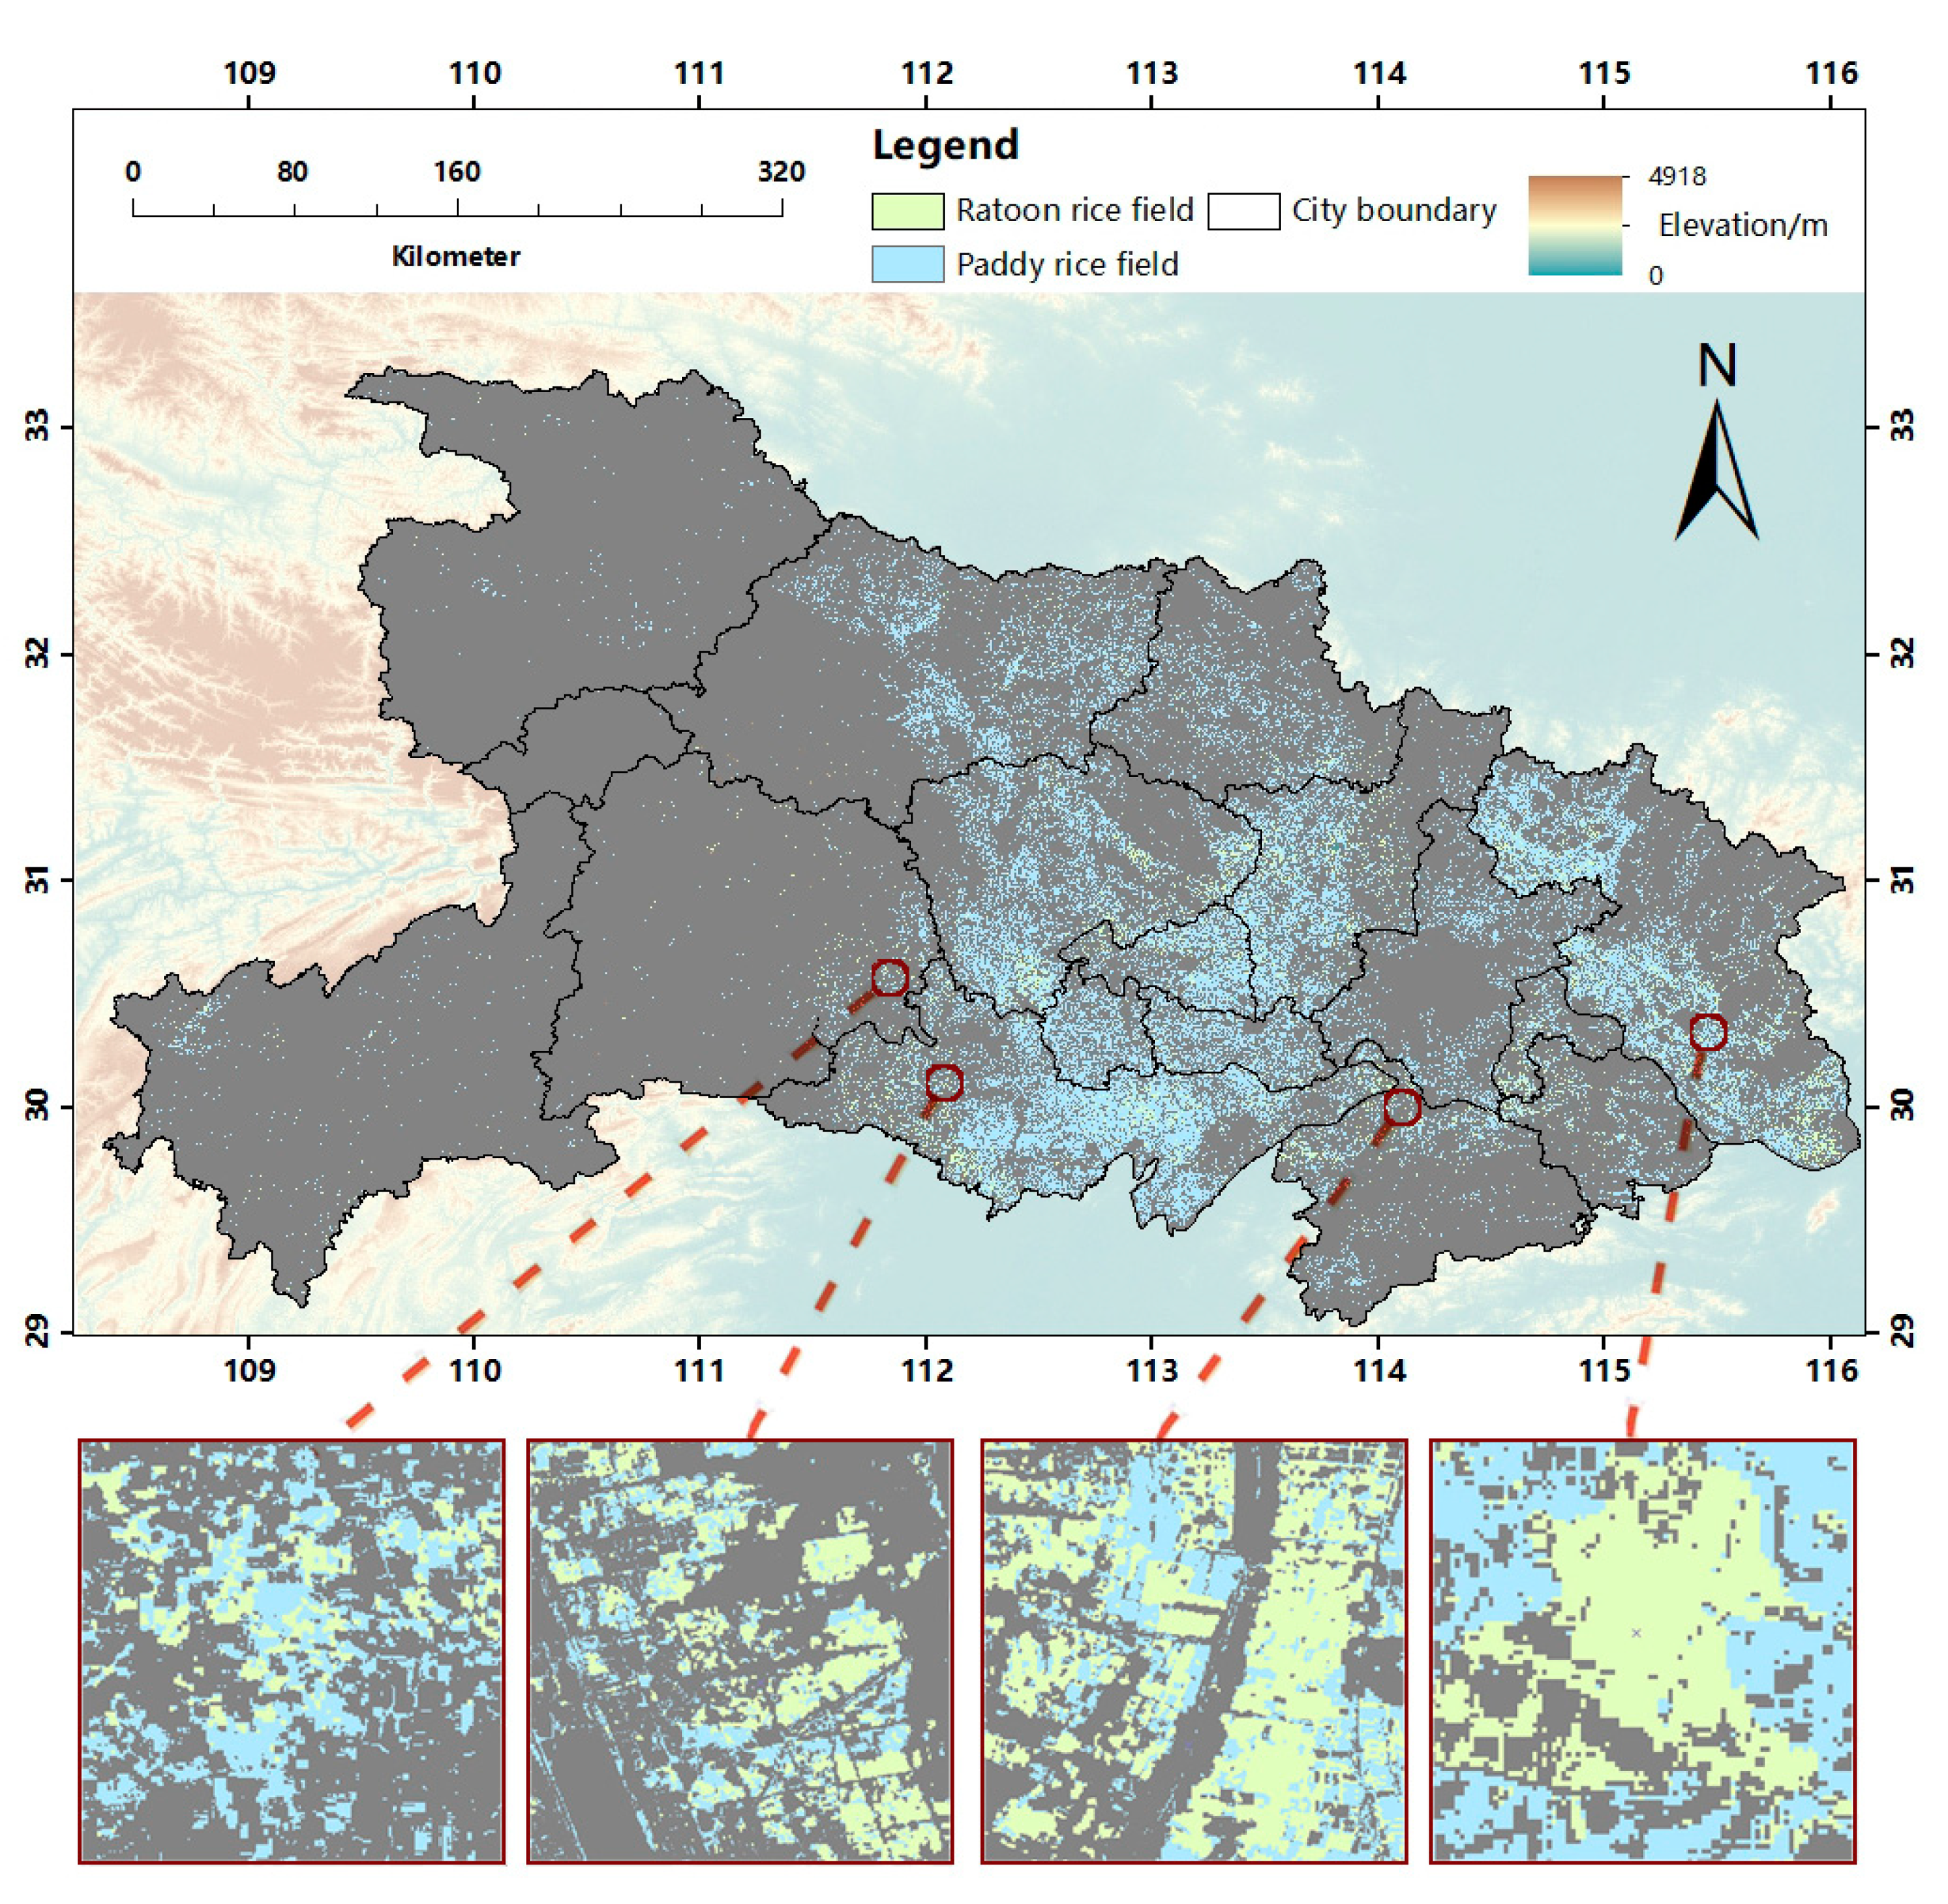
The RR and paddy rice field map illustrated that rice was the major summer crop in Hubei Province (Figure 6), and RR was mainly distributed in the low alluvial plain in central and southern Hubei Province. The total planting area of RR in 2018 was 2225.4 km2, accounting for 10.03% of the total area of paddy rice fields.

4. Discussion

4.1. Advantages of the Dense Time Stacks of Sentinel-2 Images

This study indicated the feasibility and reliability of identifying RR from the other rice systems in the plain areas using all available Sentinel-2 images (clouds cover <80%). The high spatial and temporal resolution of Sentinel-2 enabled the capture of important phenological information to identify RR in fragmented croplands. As the key in differentiating RR from the non-RR rice systems was the timing of its maturity, the data availability during the period July 20th–August 10th had a great impact on the accuracy of the RR map. Luckily, in 2018 at least three images were available within this window in most of the paddy rice planting areas. An alternative to improve the data availability is to incorporate Landsat 8 images. Efforts have been made to successfully map crops or crop intensity by integrating Sentinel-2 and Landsat images [31,35]. However, due to the different spectral bands and spatial resolution of these sensors, the methods to integrate Sentinel-2 and Landsat images and the applications of the integrated data to mapping rice systems still need further investigations.

4.2. Identification of RR Using the YI

To our knowledge, this is the first study to map RR. As RR is a rice cropping system, we compared our study to previous studies regarding the methods and the accuracy of classification of rice cropping systems. Previous studies identified different rice cropping systems either using the number of EVI/NDVI peaks [24,36,37] or the similarities in NDVI/EVI time series between the reference and the target [13,25]. Due to the frequent cloud cover in remotely sensed images in the rice planting areas, the classification accuracy derived from these methods were dependent on the smoothing of NDVI/EVI time series [36,37]. Instead of using one index (NDVI/EVI) to identify rice cropping systems, this study highlights the advantages of using two contrasting indices. The proposed YI was used to detect the ripening phase for identifying potential RR fields, and the EVI was used to detect the green-up of the second season of RR for eliminating the false signals from the stubbles left in the field. The applications of two indices for the detection of different phenological phases may provide inspirations in decreasing the misclassifications in rice cropping systems, which are caused by missing observations during the significant phenological phase (e.g., the heading phase).
The proposed YI was calculated with reflectance of the blue, green, and red bands. The values in the blue band have been known to be sensitive to the unstable weather conditions [38]. In this study, having performed the atmospheric correction of the data, we did not see a substantial influence of the variability in the blue band on the identification of the RR, possibly because the blue band was used only during a very short period (July 20th–August 10th). As the middle and lower reaches of Yangzi River has multiple rice systems, the proposed YI could also be combined with a greenness index, such as EVI, to map middle-, early-, and late-season rice planting area.
The overall accuracy for identifying RR, non-RR rice systems, and non-rice land cover types in this study was 0.76, comparable to previous studies of rice cropping systems. Rice cropping systems in Mekong Delta, Vietnam were mapped using Moderate Resolution Imaging Spectroradiometer (MODIS) data by Son et al. [37], and they achieved the overall accuracy of 80.6% for 2006 and 85.5% for 2012. Kontgis et al. [24]’s study achieved the overall accuracies of 71% and 69% for the circa 2000 and circa 2010 maps of rice cropping systems in the Mekon River Delta, Vietnam, using dense time stacks of Landsat data. In Guan et al. [25]’s study, rice cropping systems were mapped in Vietnam using an NDVI-based time series similarity measurement, with the R2 between their results and the statistical data of 0.809.

4.3. Sources of Errors in the RR Map in Hubei Province

There were two types of misclassifications of RR: (1) RR misclassified as the non-RR rice systems and (2) RR misclassified as the non-rice land cover types. The overall accuracy of the RR map given that the paddy rice fields were correctly identified was 0.91, much higher than the overall accuracy including both RR and non-RR rice fields. This implied that the failure to identify RR was mainly due to the misclassification of paddy rice fields in the first place. As pointed out by previous studies that mapped rice with a phenology-based method, the lack of data during the transplanting period causes the flooding signal in the time series of remotely sensed images to be missed [18,20,24,25]. Mixed pixels of paddy rice fields and non-rice fields (roads, trees, and vegetable fields) may also cause the flooding signal to be missed. Additionally, the irrigation or flooding events in non-rice land cover types also affect the classification results. Although our algorithm includes a rule to reduce the confusion from ponds of aquatic plants, some of the ponds were still classified as the paddy rice fields because of their similar temporal properties of EVI.
If the paddy rice fields were correctly classified, the misclassification of RR was mainly due to the variable transplanting timing across the province. Differences in weather conditions between north and south and between the mountain and the plain led to the variations in seedling transplantation timing across Hubei province. Late transplanting of the early-season rice may result in an overlap of the maturity timing with that of RR. The stubbles from the early-season rice were generally left in the fields, and if the late-season rice were not planted due to the labor shortages, the weeds thrived in late August and resulted in an EVI peak. Therefore, fields with the early- and double-season rice were easily misclassified as RR when they presented similar phenologies in the remotely sensed data.

5. Conclusions

This study developed a phenology-based algorithm to map RR at a 10-m resolution in Hubei Province, Central China, using dense time stacks of Sentinel-2 images (cloud cover<80%) in 2018. The novelty of this phenology-based algorithm was to identify RR with two contrasting indices, which included the newly-developed YI to detect the ripening phase and the EVI to detect the green-up of the second-season crop. The total planting area of RR in 2018 was 2225.4 km2, accounting for 10.03% of the total area of paddy rice fields. The overall accuracy including the RR, non-RR rice fields, and non-rice land cover types was 0.76. The adjusted overall accuracy for RR and non-RR was 0.91. The algorithm proposed by this study provided accurate and up-to-date maps of RR fields, which may facilitate the prediction of grain yield and the evaluation of the environmental impact of rice production. Furthermore, monitoring the shift from non-RR fields to RR fields could be of interest for agricultural policy-making and the socio-economic impacts assessment.

Author Contributions

Conceptualization, S.L.; Formal Analysis, Y.C.; Investigation, Y.C. and Y.M., X.K., and X.Z.; Data Curation, X.K., X.Z., and D.Z.; Writing-Original Draft Preparation, S.L.; Visualization, Y.M. All authors have read and agreed to the published version of the manuscript.

Funding

This research was funded by the Fundamental Research Funds for the Central Universities (Program No. 2662018YJ018).

Acknowledgments

The authors are thankful for the valuable suggestions given by Shaobing Peng from College of Plant Science and Technology at Huazhong Agricultural University. This research was supported by the Fundamental Research Funds for the Central Universities (Program No. 2662018YJ018).

Conflicts of Interest

The authors declare no conflict of interest.

References

  1. Sandhu, N.; Kumar, A. Bridging the Rice Yield Gaps under Drought: QTLs, Genes, and their Use in Breeding Programs. Agronomy 2017, 7, 27. [Google Scholar] [CrossRef]
  2. Food and Agriculture Organization of the United Nations (FAO). Available online: http://www.fao.org/faostat/en/#data/QC (accessed on 11 June 2019).
  3. Nie, L.; Peng, S. Rice production in China. In Rice Production Worldwide; Chauhan, B., Jabran, K., Mahajan, G., Eds.; Springer: Cham, Switzerland, 2017; pp. 33–52. [Google Scholar]
  4. Garnett, T.; Appleby, M.C.; Balmford, A.; Bateman, I.J.; Benton, T.G.; Bloomer, P.; Burlingame, B.; Dawkins, M.; Dolan, L.; Fraser, D.; et al. Sustainable Intensification in Agriculture: Premises and Policies. Science 2013, 341, 33–43. [Google Scholar] [CrossRef]
  5. Yuan, S.; Cassman, K.G.; Huang, J.; Peng, S.; Grassini, P. Can ratoon cropping improve resource use efficiencies and profitability of rice in central China? Field Crops Res. 2019, 234, 66–72. [Google Scholar] [CrossRef]
  6. Jones, D.B. Rice Ratoon Response to Main Crop Harvest Cutting Height. Agron. J. 1993, 85, 1139–1142. [Google Scholar] [CrossRef]
  7. Harrell, D.L.; Bond, J.A.; Blanche, S. Evaluation of main-crop stubble height on ratoon rice growth and development. Field Crops Res. 2009, 114, 386–403. [Google Scholar] [CrossRef]
  8. Ziska, L.H.; Fleisher, D.H.; Linscombe, S. Ratooning as an adaptive management tool for climatic change in rice systems along a north-south transect in the southern Mississippi valley. Agric. For. Meteorol. 2018, 263, 409–416. [Google Scholar] [CrossRef]
  9. Santos, A.B.; Fageria, N.K.; Prabhu, A.S. Rice Ratooning Management Practices for Higher Yields. Commun. Soil Sci. Plant Anal. 2003, 34, 5–6. [Google Scholar] [CrossRef]
  10. Negalur, R.B.; Yadahalli, G.S.; Chittapur, B.M.; Guruprasad, G.S.; Narappa, G. Ratoon Rice: A Climate and Resource Smart Technology. Int. J. Curr. Microbiol. Appl. Sci. 2017, 6, 1638–1653. [Google Scholar] [CrossRef]
  11. Xiao, X.; Boles, S.; Liu, J.; Zhuang, D.; Frolking, S.; Li, C.; A Salas, W.; Moore, B. Mapping paddy rice agriculture in southern China using multi-temporal MODIS images. Remote Sens. Environ. 2005, 94, 480–492. [Google Scholar] [CrossRef]
  12. Xiao, X.; Boles, S.; Frolking, S.; Li, C.; Babu, J.Y.; A Salas, W.; Moore, B. Mapping paddy rice agriculture in South and Southeast Asia using multi-temporal MODIS images. Remote Sens. Environ. 2006, 100, 95–113. [Google Scholar] [CrossRef]
  13. Gumma, M.K.; Nelson, A.; Thenkabail, P.; Singh, A.N. Mapping rice areas of South Asia using MODIS multitemporal data. J. Appl. Remote Sens. 2011, 5, 053547. [Google Scholar] [CrossRef] [Green Version]
  14. Lopez-Sanchez, J.M.; Cloude, S.R.; Ballester-Berman, J.D. Rice Phenology Monitoring by Means of SAR Polarimetry at X-Band. IEEE Trans. Geosci. Remote Sens. 2012, 50, 2695–2700. [Google Scholar] [CrossRef]
  15. Busetto, L.; Zwart, S.J.; Boschetti, M. “Analysing spatial–temporal changes in rice cultivation practices in the Senegal River Valley using MODIS time-series and the PhenoRice algorithm. Int. J. Appl. Earth Obs. Geoinf. 2019, 75, 15–28. [Google Scholar] [CrossRef]
  16. Nguyen, T.T.H.; De Bie, C.A.J.M.; Ali, A.; Smaling, E.M.A.; Chu, T.H. Mapping the irrigated rice cropping patterns of the Mekong delta, Vietnam, through hyper-temporal SPOT NDVI image analysis. Int. J. Remote Sens. 2012, 33, 415–434. [Google Scholar] [CrossRef]
  17. Dong, J.; Xiao, X.; Kou, W.; Qin, Y.; Zhang, G.; Li, L.; Jin, C.; Zhou, Y.; Wang, J.; Biradar, C.; et al. Tracking the dynamics of paddy rice planting area in 1986–2010 through time series Landsat images and phenology-based algorithms. Remote Sens. Environ. 2015, 160, 99–113. [Google Scholar] [CrossRef]
  18. Sakamoto, T.; Sprague, D.S.; Okamoto, K.; Ishitsuka, N. Semi-automatic classification method for mapping the rice-planted areas of Japan using multi-temporal Landsat images. Remote Sens. Appl. Soc. Environ. 2018, 10, 7–17. [Google Scholar] [CrossRef]
  19. Zhang, H.; Kang, J.; Xu, X.; Zhang, L. Accessing the temporal and spectral features in crop type mapping using multi-temporal Sentinel-2 imagery: A case study of Yi’an County, Heilongjiang province, China. Comput. Electron. Agric. 2020, 176, 105618. [Google Scholar] [CrossRef]
  20. Dong, J.; Xiao, X. Evolution of regional to global paddy rice mapping methods: A review. ISPRS J. Photogramm. Remote Sens. 2016, 119, 214–227. [Google Scholar] [CrossRef] [Green Version]
  21. Xiao, X.; Boles, S.; Frolking, S.; A Salas, W.; Moore, B.; Li, C.; He, L.; Zhao, R. Observation of flooding and rice transplanting of paddy rice fields at the site to landscape scales in China using VEGETATION sensor data. Int. J. Remote Sens. 2002, 23, 3009–3022. [Google Scholar] [CrossRef]
  22. Sakamoto, T.; Van Phung, C.; Kotera, A.; Nguyen, K.D.; Yokozawa, M. Analysis of rapid expansion of inland aquaculture and triple rice-cropping areas in a coastal area of the Vietnamese Mekong Delta using MODIS time-series imagery. Landsc. Urban Plan. 2009, 92, 34–46. [Google Scholar] [CrossRef]
  23. Zhang, G.; Xiao, X.; Biradar, C.; Dong, J.; Qin, Y.; Menarguez, M.A.; Zhou, Y.; Zhang, Y.; Jin, C.; Wang, J.; et al. Spatiotemporal patterns of paddy rice croplands in China and India from 2000 to 2015. Sci. Total Environ. 2017, 579, 82–92. [Google Scholar] [CrossRef] [PubMed]
  24. Kontgis, C.; Schneider, A.; Ozdogan, M. Mapping rice paddy extent and intensification in the Vietnamese Mekong River Delta with dense time stacks of Landsat data. Remote Sens. 2015, 169, 255–269. [Google Scholar] [CrossRef]
  25. Guan, X.; Huang, C.; Liu, G.; Meng, X.; Liu, Q. Mapping Rice Cropping Systems in Vietnam Using an NDVI-Based Time-Series Similarity Measurement Based on DTW Distance. Remote Sens. 2016, 8, 19. [Google Scholar] [CrossRef] [Green Version]
  26. Lasko, K.; Vadrevu, P.K.; Tran, V.T.; Justice, C.O. Mapping Double and Single Crop Paddy Rice with Sentinel-1A at Varying Spatial Scales and Polarizations in Hanoi, Vietnam. IEEE J. Sel. Top. Appl. Earth Obs. Remote Sens. 2018, 11, 498–512. [Google Scholar] [CrossRef]
  27. Hubei Province Climate Change Bulletin. 2019. Available online: http://hb.cma.gov.cn/xxgk_29519/tjsj_29533/201907/t20190705_770665.html (accessed on 15 July 2019).
  28. National Data, Crop Planting Area. National Bureau of Statistics of China (NBSC). Available online: http://data.stats.gov.cn/easyquery.htm?cn=C01 (accessed on 19 November 2019).
  29. Xu, F.; Xiong, H.; Zhang, L.; Zhu, Y.; Jiang, P.; Guo, X.; Liu, M. Progress in research of yield formation of ratooning rice and its high-yielding key regulation technologies. Sci. Agric. Sin. 2015, 48, 1702–1717. [Google Scholar]
  30. Chen, J.; Jönsson, P.; Tamura, M.; Gu, Z.; Matsushita, B.; Eklundh, L. A simple method for reconstructing a high-quality NDVI time-series data set based on the Savitzky–Golay filter. Remote Sens. Environ. 2004, 91, 3–4. [Google Scholar] [CrossRef]
  31. Wang, J.; Zou, Z.; Liu, L.; Wu, X.; Qin, Y.; Steiner, J.L.; Dong, J. Mapping sugarcane plantation dynamics in Guangxi, China, by time series Sentinel-1, Sentinel-2 and Landsat images. Remote Sens. Environ. 2020, 247, 111951. [Google Scholar] [CrossRef]
  32. Gong, P.; Liu, H.; Zhang, M.; Li, C.; Wang, J.; Saarinen, N.; Clinton, N.; Ji, L.; Li, W.; Bai, Y.; et al. Stable classification with limited sample: Transferring a 30-m resolution sample set collected in 2015 to mapping 10-m resolution global land cover in 2017. Sci. Bull. 2019, 64, 370–373. [Google Scholar] [CrossRef] [Green Version]
  33. Le Toan, T.; Ribbes, F.; Wang, L.; Floury, N.; Ding, K. Rice crop mapping and monitoring using ERS-1 data based on experiment and modeling results. IEEE Trans. Geosci. Remote Sens. 1997, 35, 41–56. [Google Scholar] [CrossRef]
  34. Otsu, N. A Threshold Selection Method from Gray-Level Histograms. IEEE Trans. Syst. Man Cybern. 1979, 9, 62–66. [Google Scholar] [CrossRef] [Green Version]
  35. Liu, L.; Xiao, X.; Qin, Y.; Wang, J.; Xu, X.; Hu, Y.; Qiao, Z. Mapping cropping intensity in China using time series Landsat and Sentinel-2 images and Google Earth Engin. Remote Sens. Environ. 2020, 239, 111624. [Google Scholar] [CrossRef]
  36. Sakamoto, T.; Van Nguyen, N.; Ohno, H.; Ishitsuka, N.; Yokozawa, M. Spatio–temporal distribution of rice phenology and cropping systems in the Mekong Delta with special reference to the seasonal water flow of the Mekong and Bassac rivers. Remote Sens. Environ. 2006, 100, 1–16. [Google Scholar] [CrossRef]
  37. Son, N.T.; Chen, C.F.; Chen, C.R.; Duc, H.N.; Chang, L.Y. A Phenology-Based Classification of Time-Series MODIS Data for Rice Crop Monitoring in Mekong Delta, Vietnam. Remote Sens. 2013, 6, 135–156. [Google Scholar] [CrossRef] [Green Version]
  38. Julitta, T.; Cremonese, E.; Migliavacca, M.; Colombo, R.; Galvagno, M.; Siniscalco, C.; Rossini, M.; Fava, F.; Cogliati, S.; Di Cella, U.M.; et al. Using digital camera images to analyse snowmelt and phenology of a subalpine grassland. Agric. For. Meteorol. 2014, 198–199, 116–125. [Google Scholar] [CrossRef]
Publisher’s Note: MDPI stays neutral with regard to jurisdictional claims in published maps and institusional affiliations.
Figure 1. Study area and location of sampling sites.
Remotesensing 12 03400 g001
Figure 2. Workflow diagram illustrating the process of mapping ratoon rice.
Remotesensing 12 03400 g002
Figure 3. Time series of enhanced vegetation index (EVI) (a) and EVI–land surface water index (LSWI) (a) of middle-season rice, double-season rice, and ratoon rice.
Remotesensing 12 03400 g003
Figure 4. Images of a subset of cropland dominated by ratoon rice fields, including the true-color Sentinel-2A image (a), the YI mean image (b), the enhanced YI image (c), and the segmentation of potential RR fields (d).
Remotesensing 12 03400 g004
Figure 5. Predicted rice planting area of 17 prefecture-level cities compared against the rice area from the Hubei Rural Statistical Yearbook.
Remotesensing 12 03400 g005
Figure 6. Map of ratoon rice (RR) fields and non-RR paddy rice fields of Hubei Province.
Remotesensing 12 03400 g006
Table 1. Information of the Sentinel-2A and -2B bands used in this study.
Sentinel-2 BandsSentinel-2ASentinel-2BSpatial
Central BandwidthCentral BandwidthResolution
Wavelength (nm)(nm)Wavelength (nm)(nm)(m)
Band 2—Blue492.466492.16610
Band 3—Green559.836559.03610
Band 4—Red664.631664.93110
Band 8—NIR832.8106832.910610
Band 11—SWIR1613.7911610.49420
Table 2. Confusion matrix of ratoon rice (RR), non-RR rice systems, and non-rice land cover types based on the reference data.
RRNon-RR Rice SystemsNon-rice Land Cover User’s Affccuracy
RR27148360.76
Non-RR rice systems7307980.75
Non-rice land cover 8401690.79
Producer’s accuracy0.950.780.56
Overall accuracy = 0.76. Kappa coefficient = 0.65.