Gridded Satellite Sounding Retrievals in Operational Weather Forecasting: Product Description and Emerging Applications

 , , , ,
Abstract

1. Introduction
2. Materials and Methods
2.1. Datasets: NUCAPS Satellite Soundings
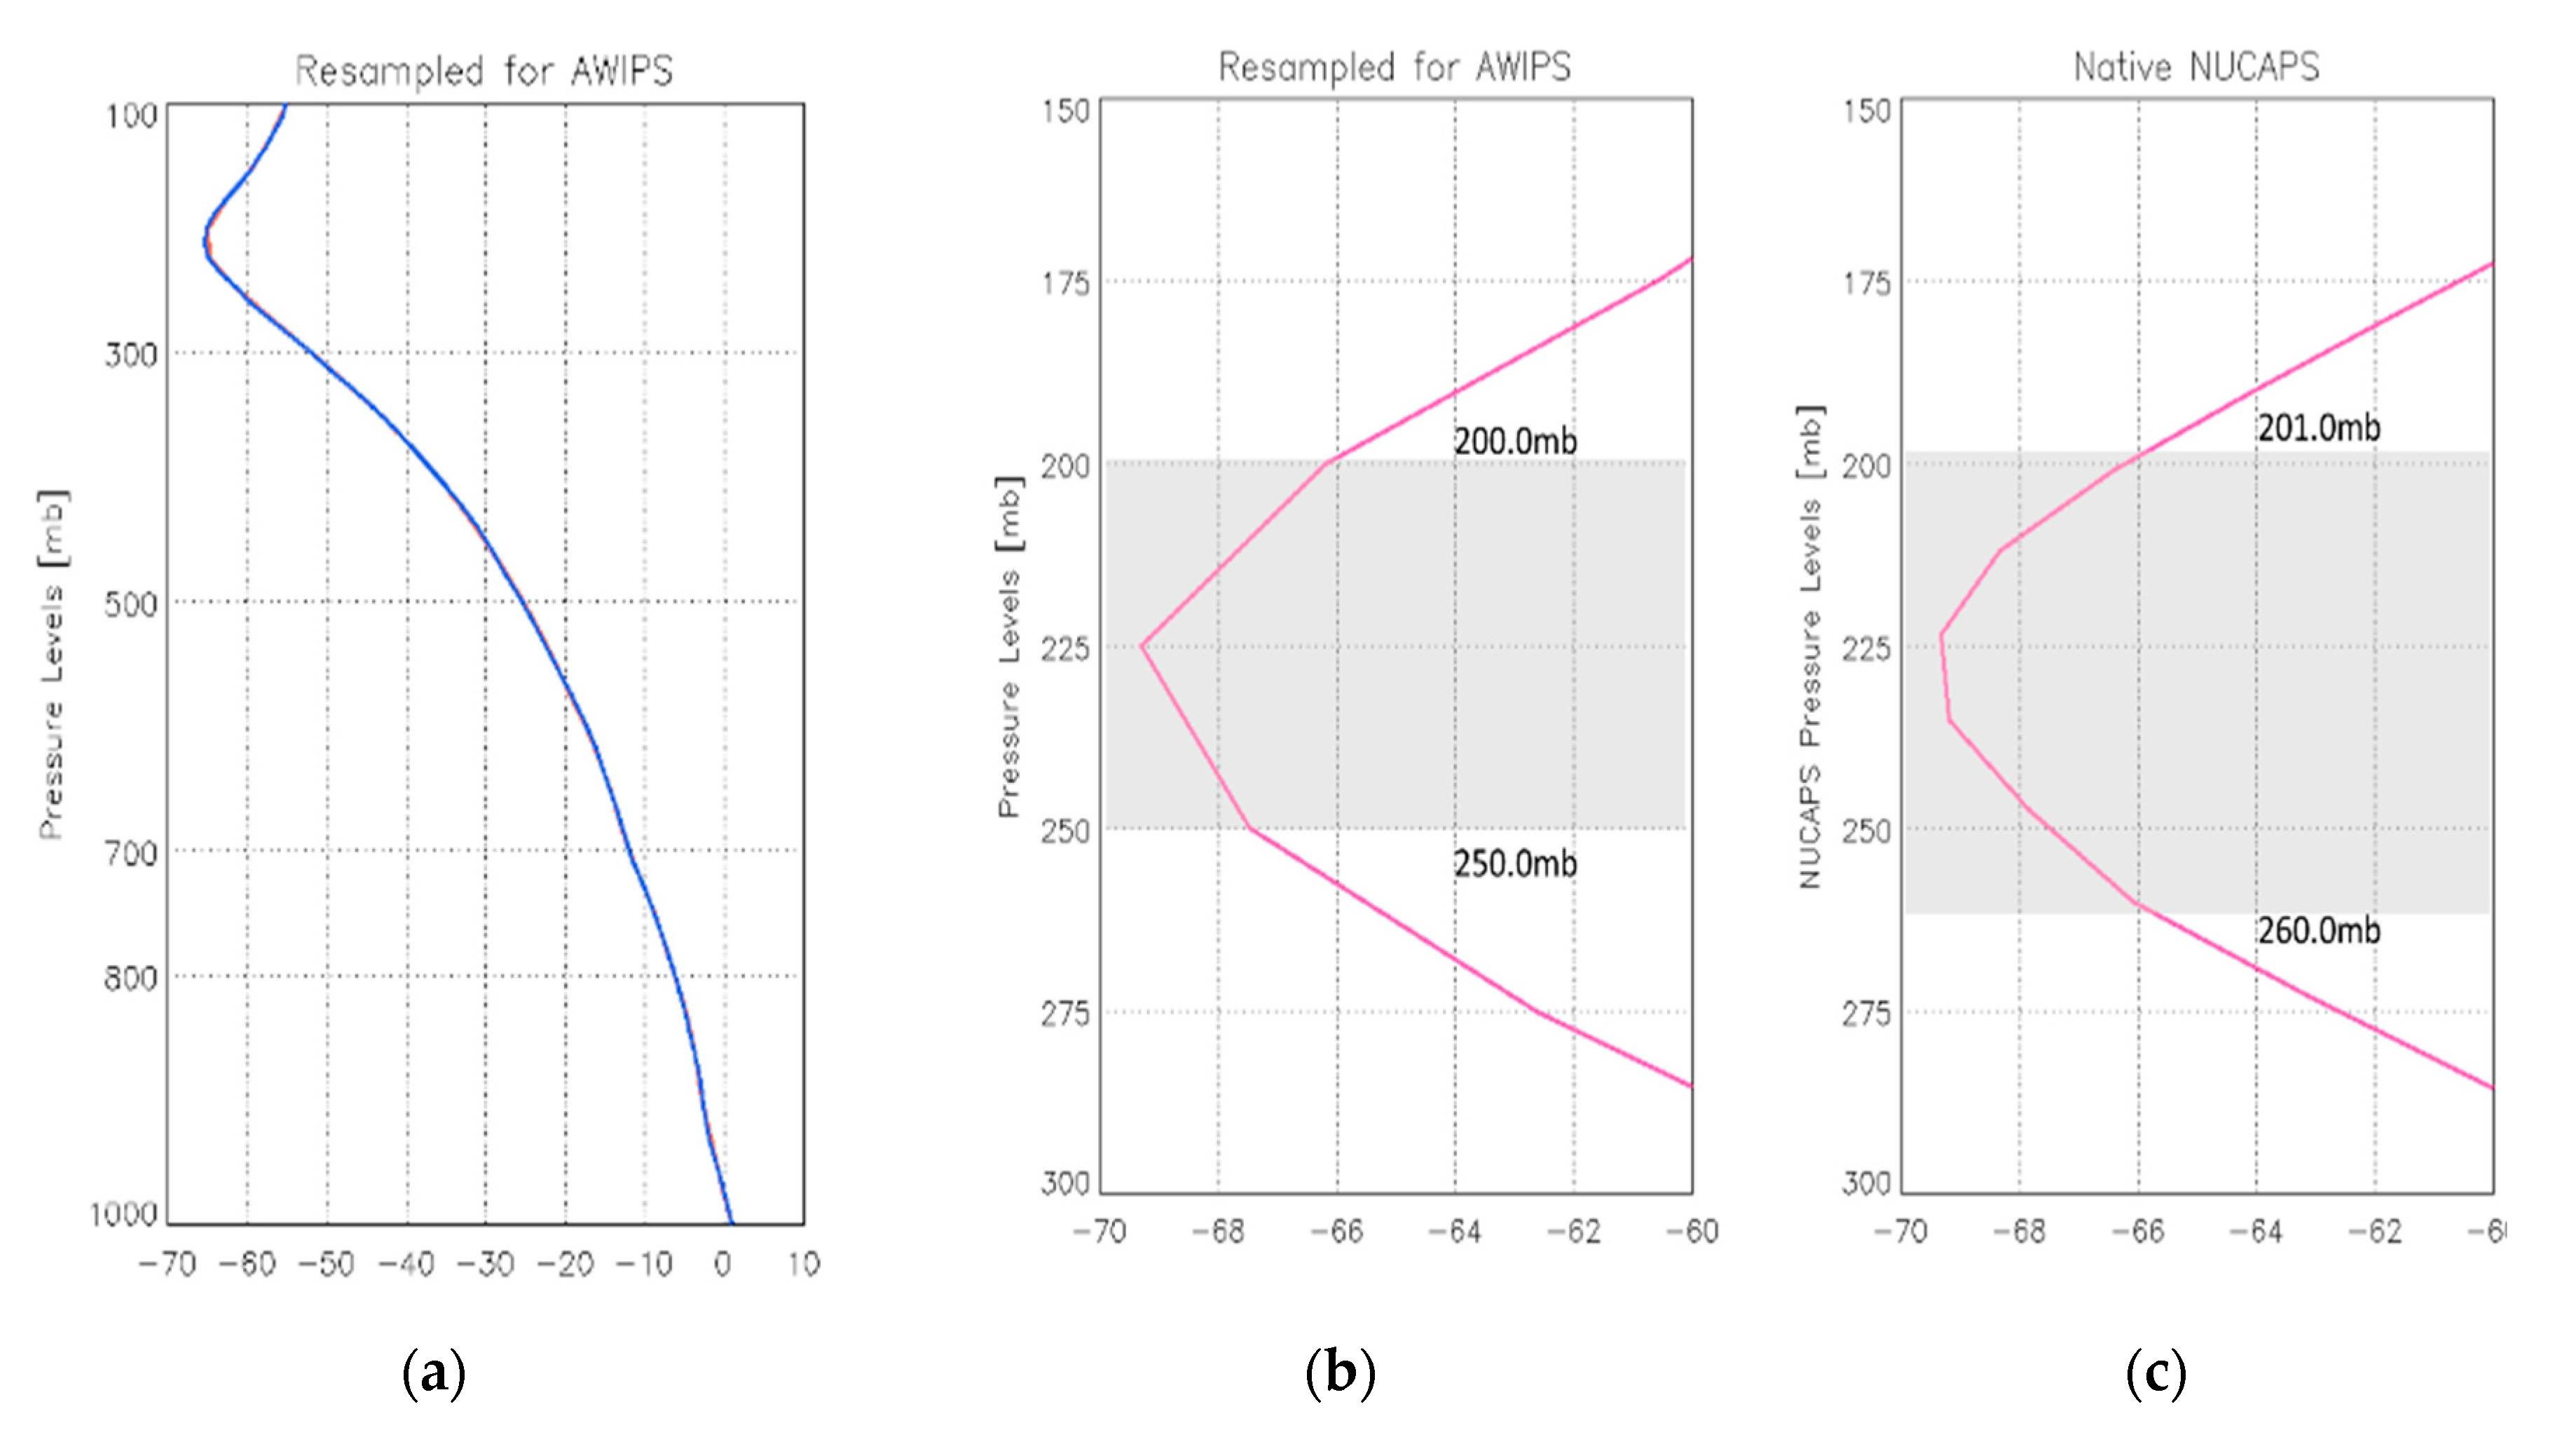
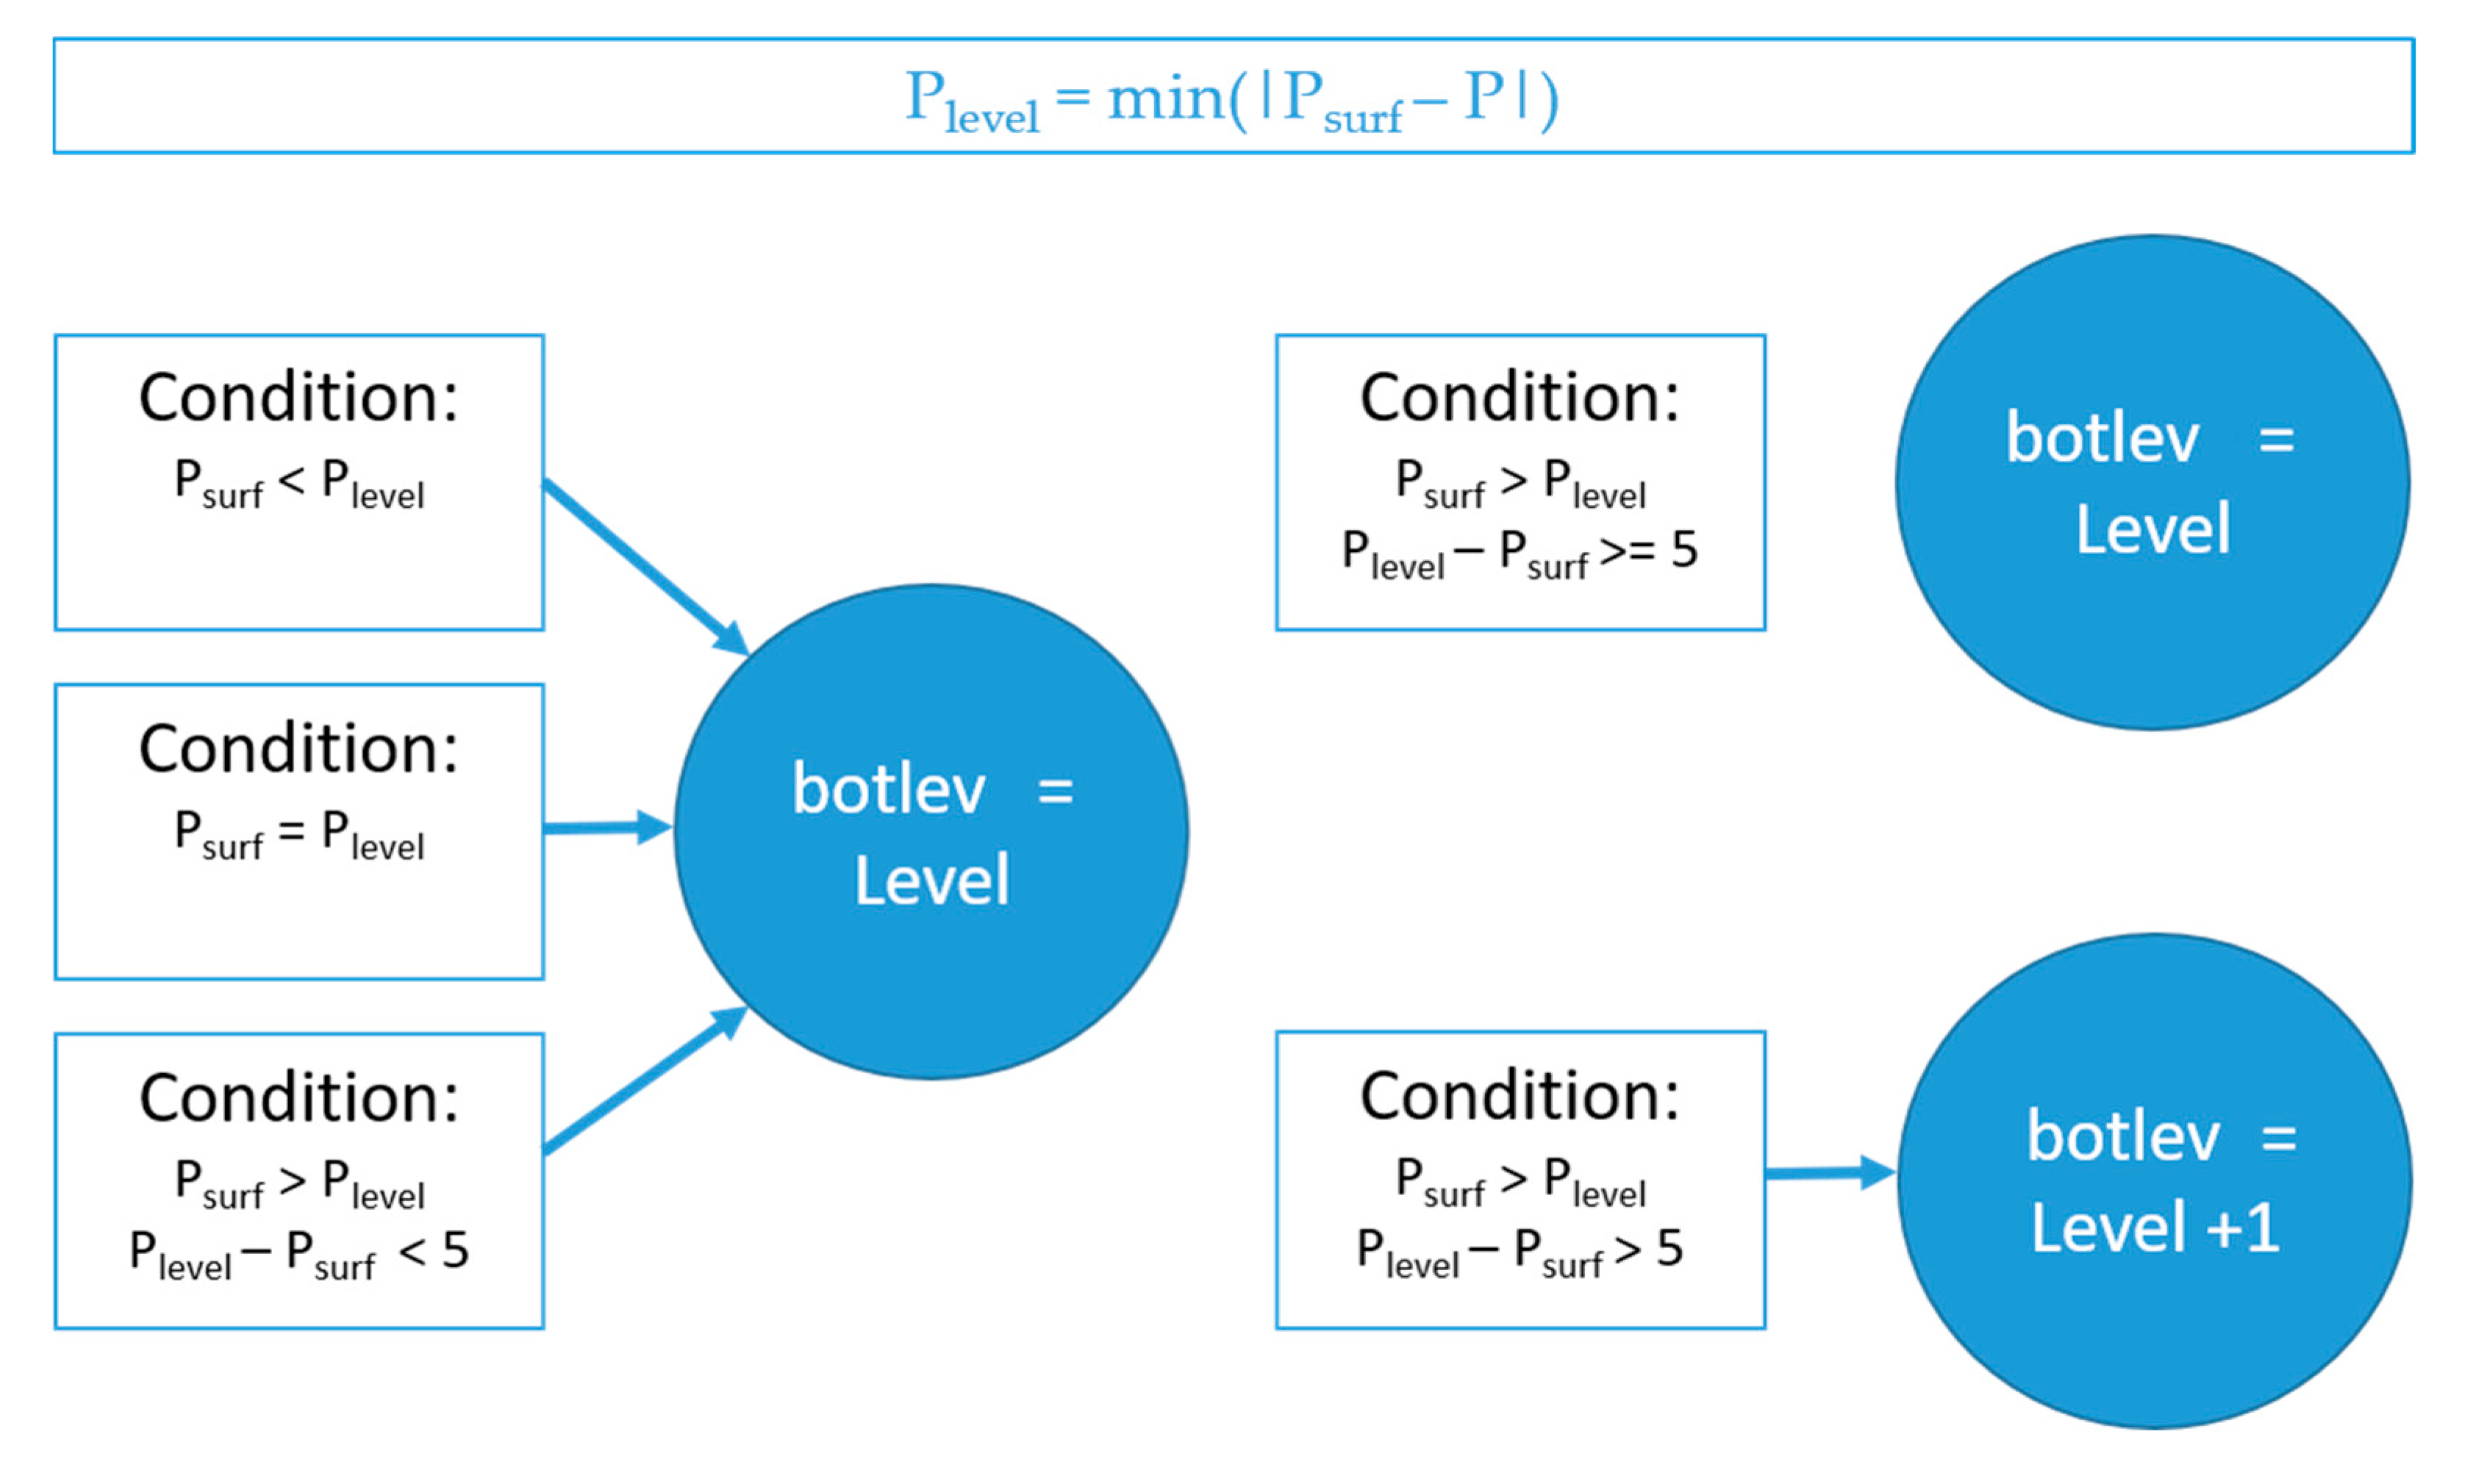
2.2. Methods: Gridded NUCAPS Product Design
2.3. Methods: Gridded NUCAPS-Derived Fields
2.3.1. Lapse Rate
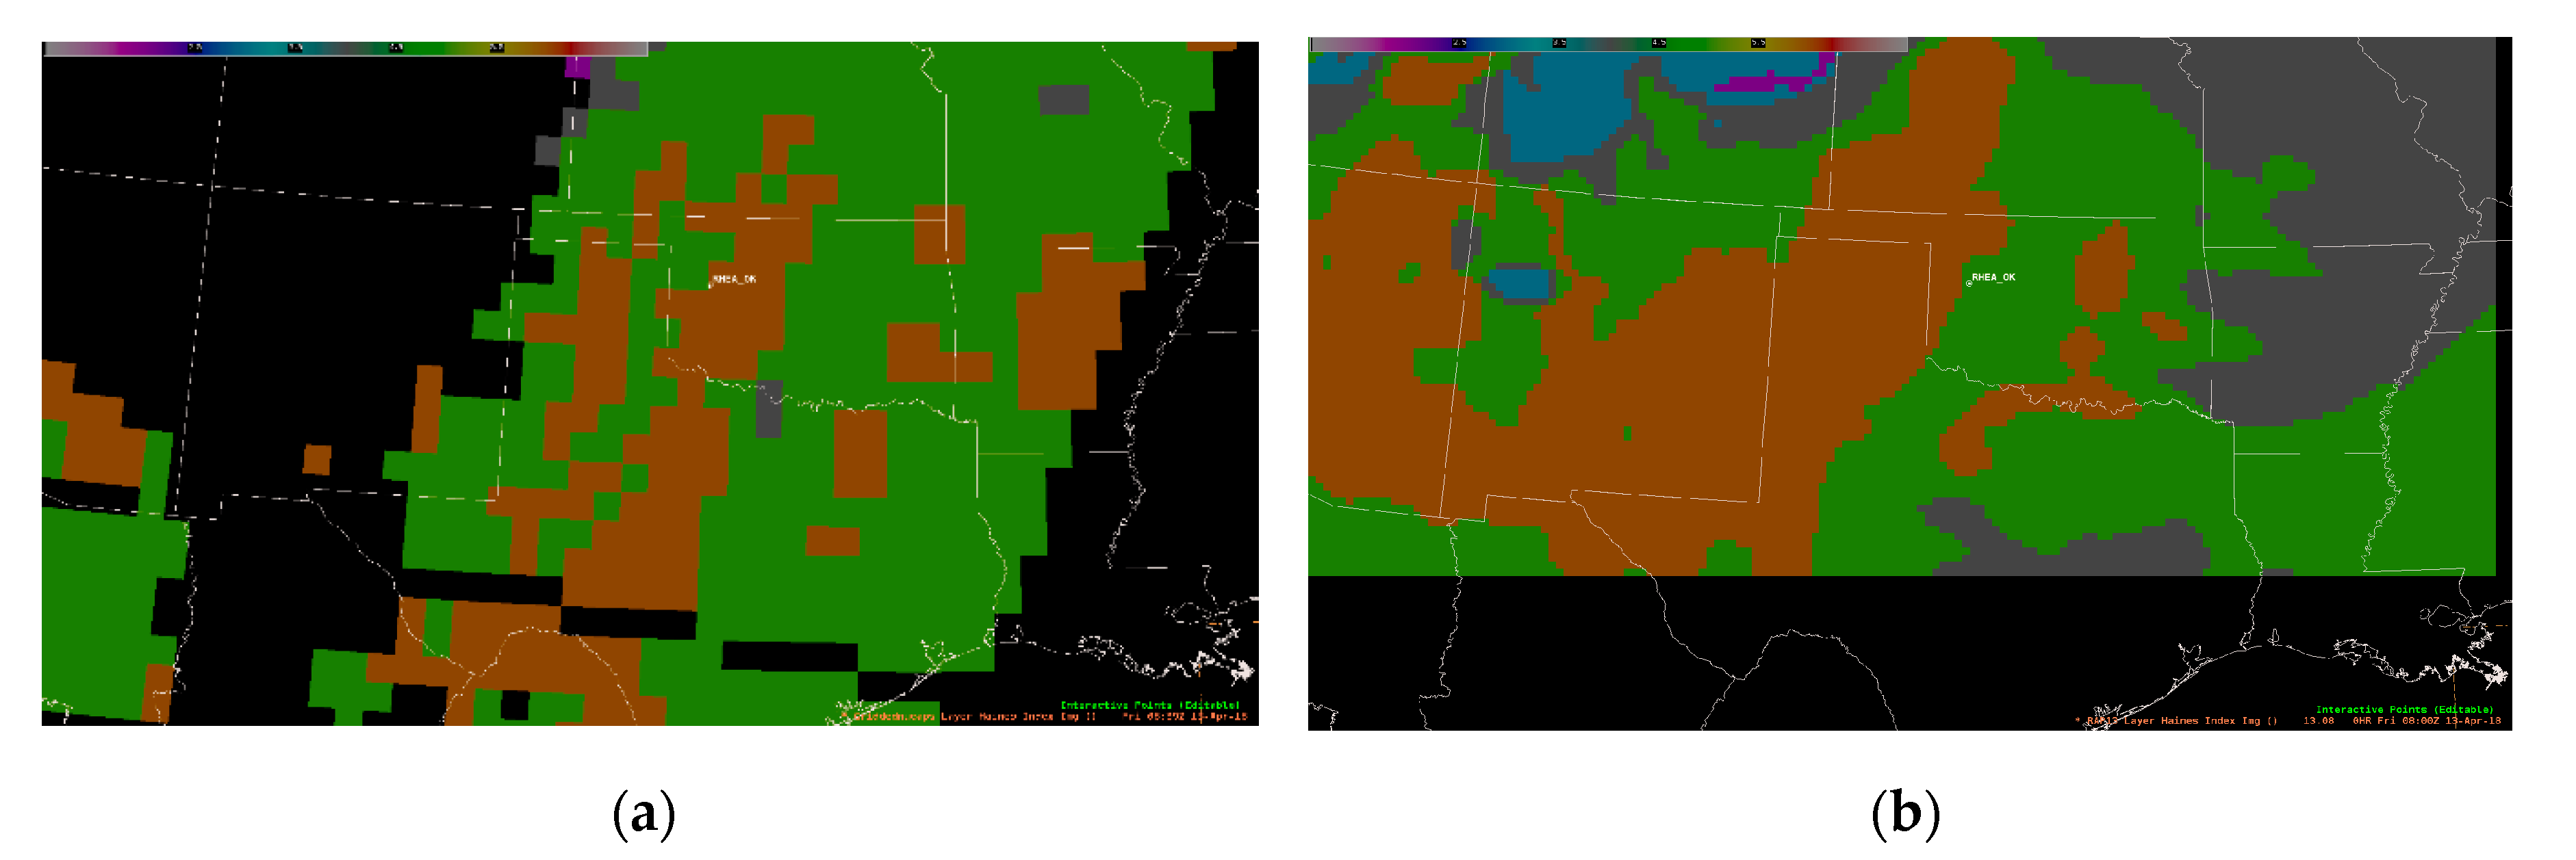
2.3.2. Haines Index
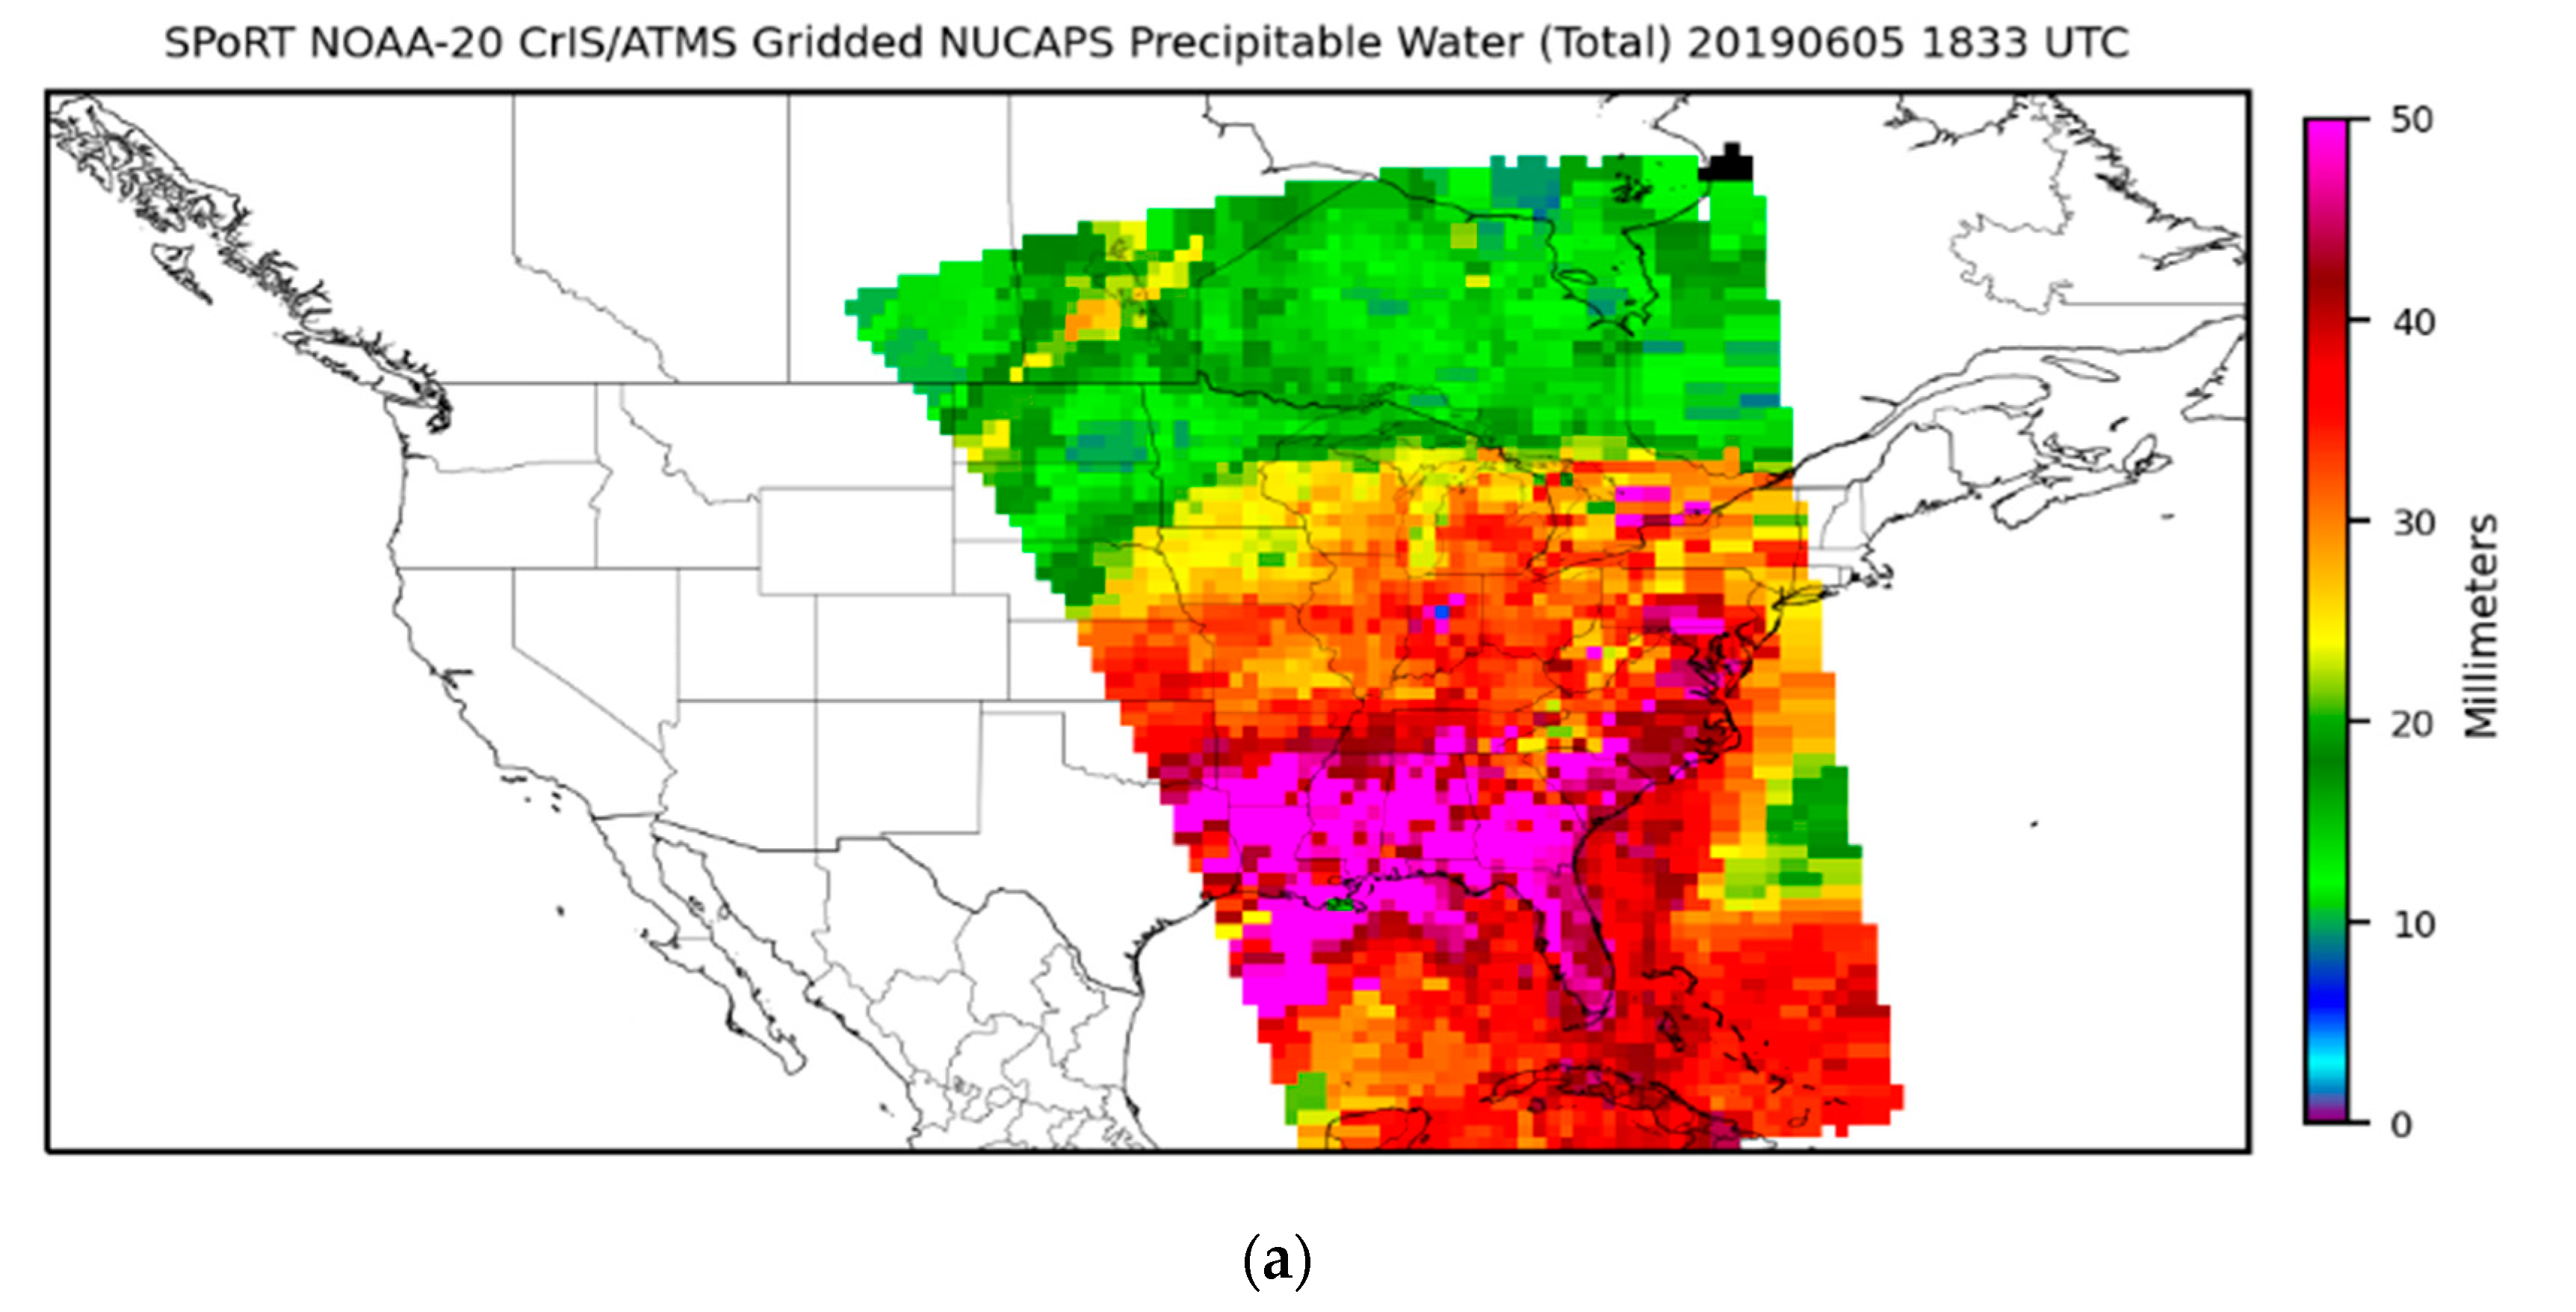
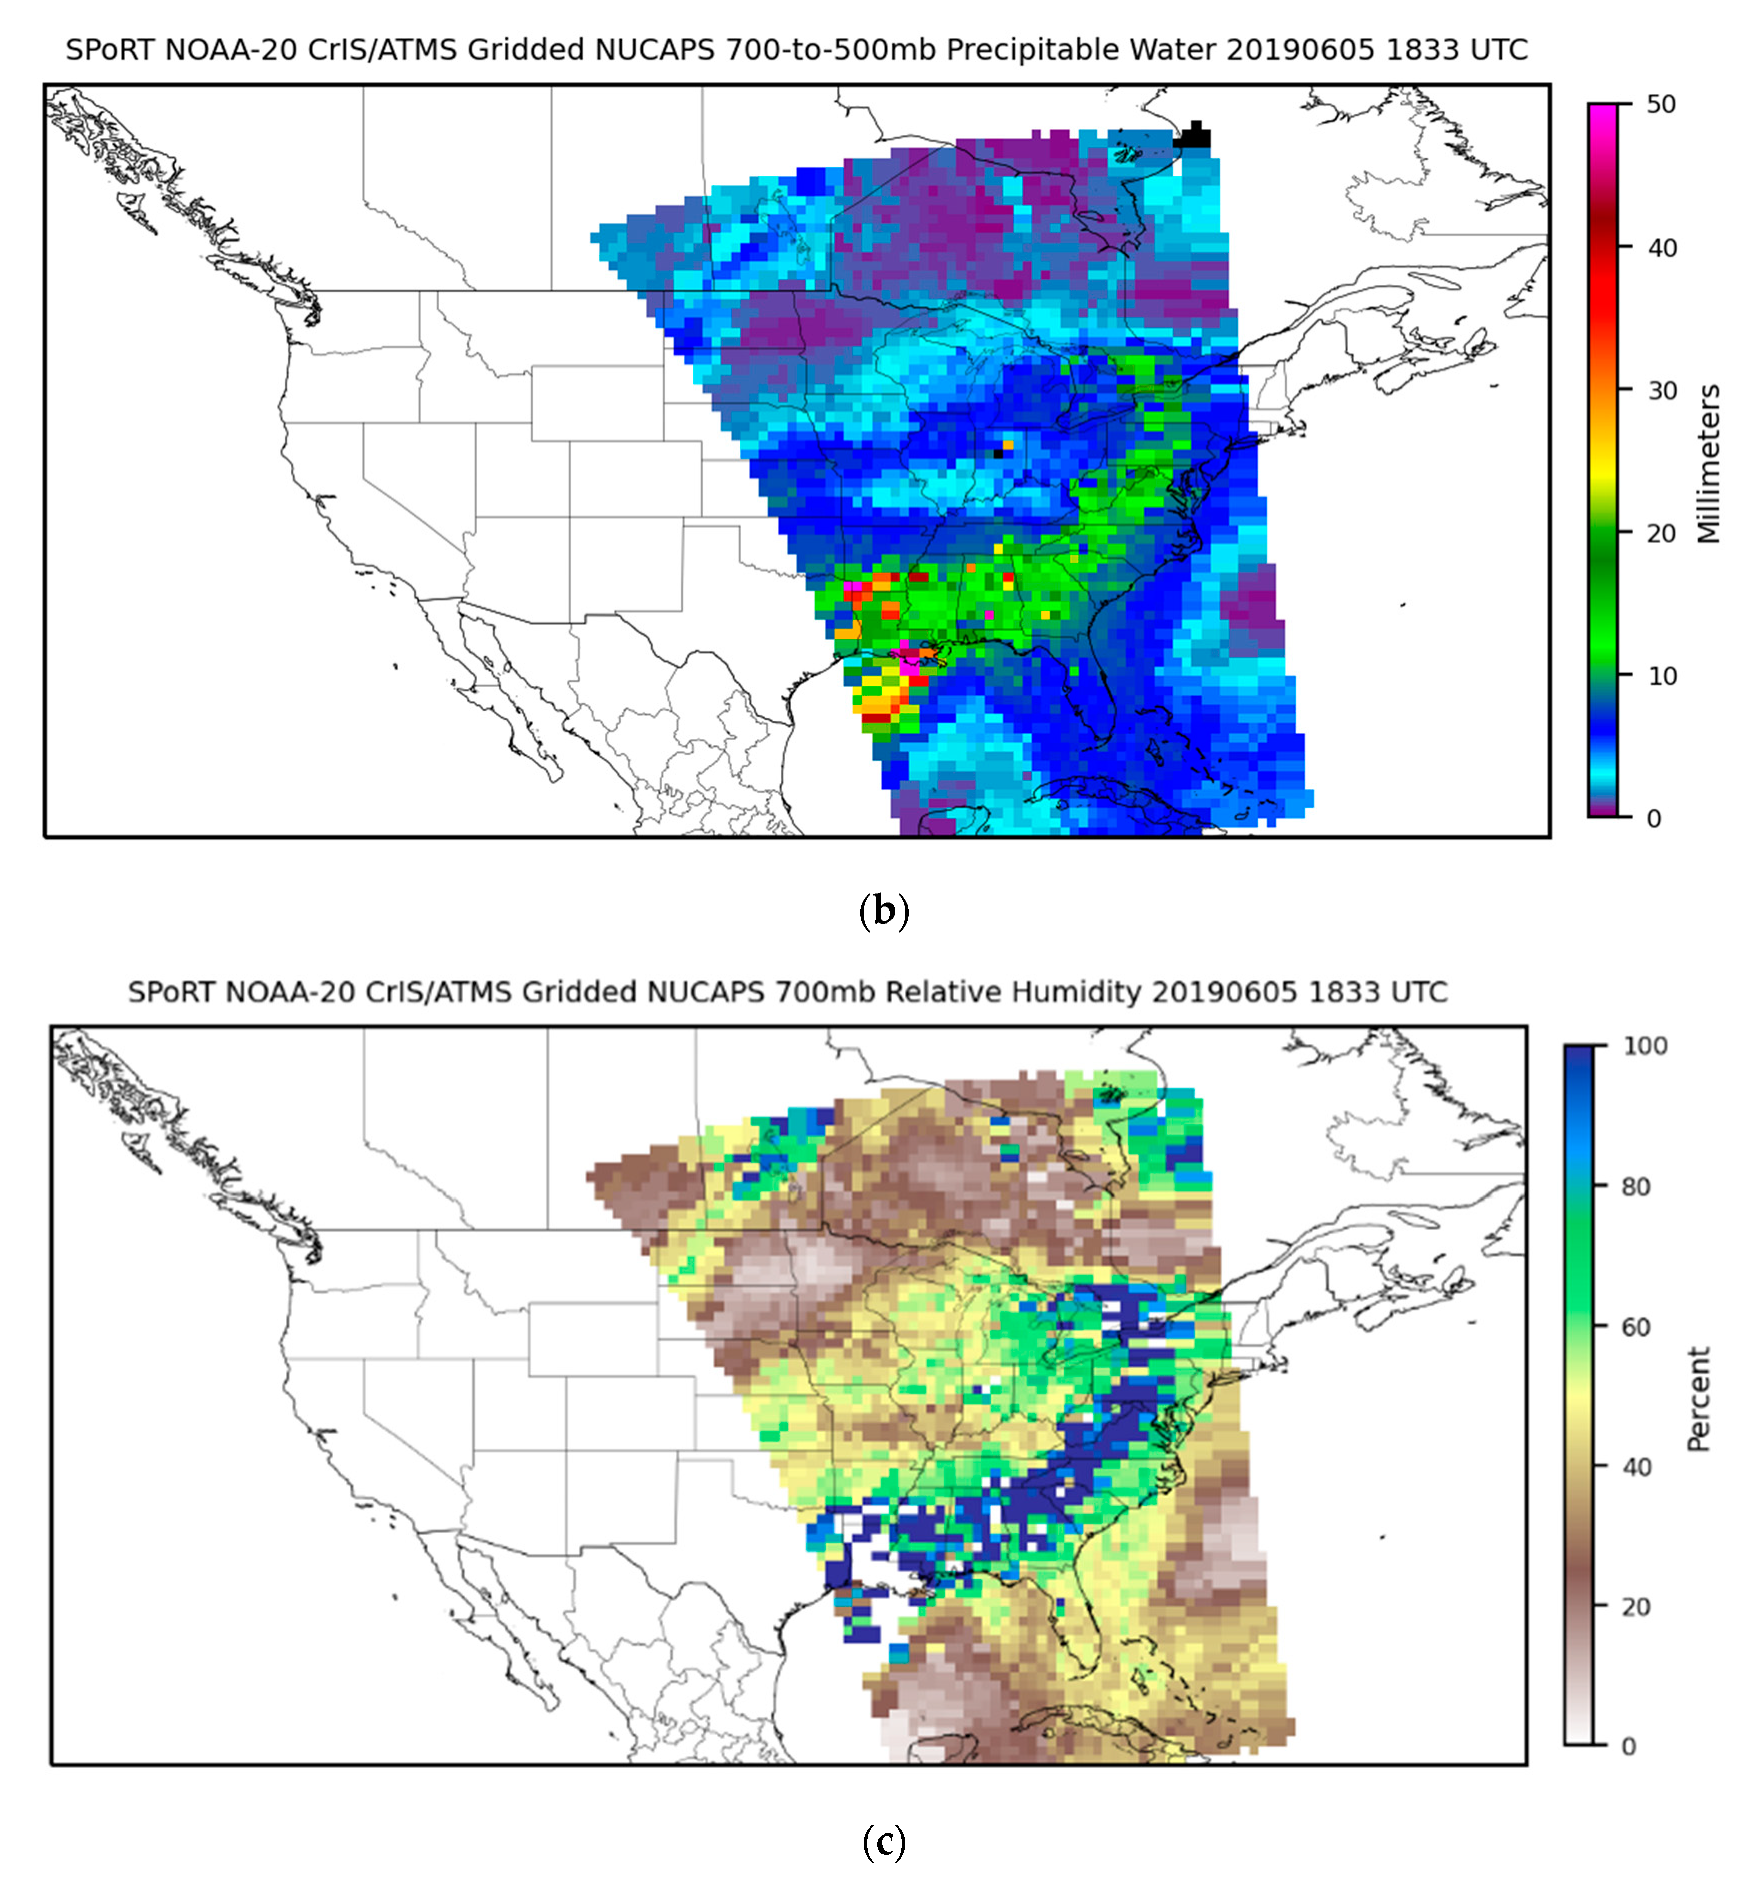
2.3.3. Precipitable Water
2.3.4. Ozone-Derived Products
3. Results
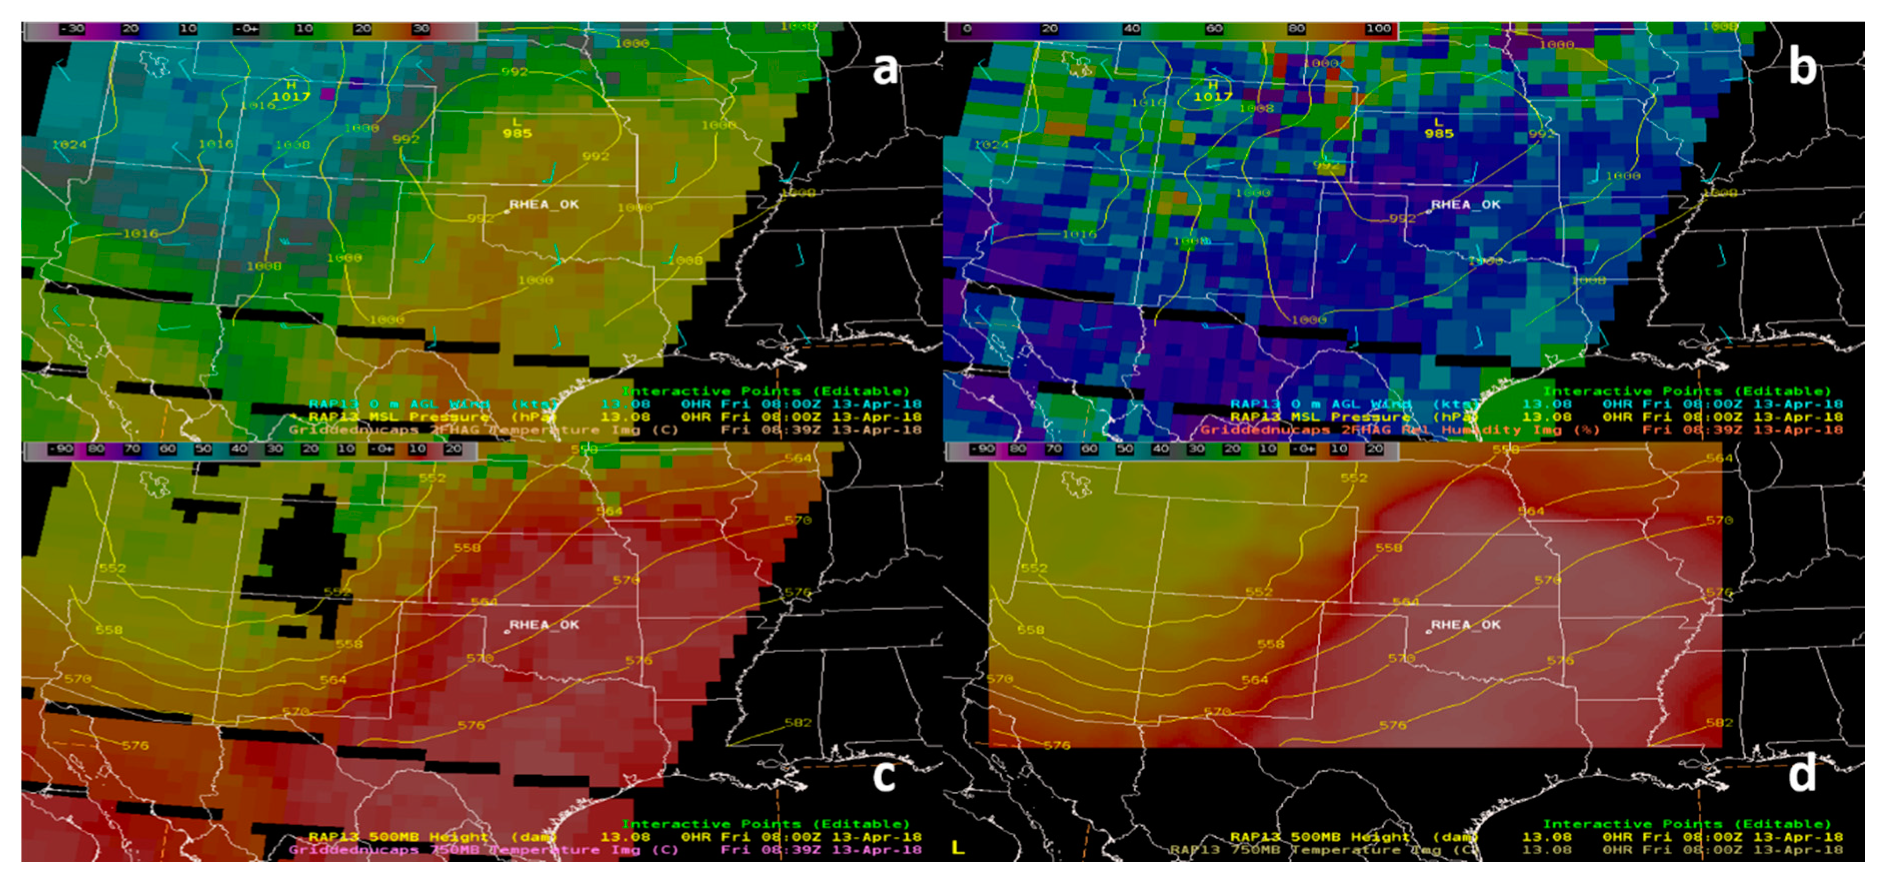
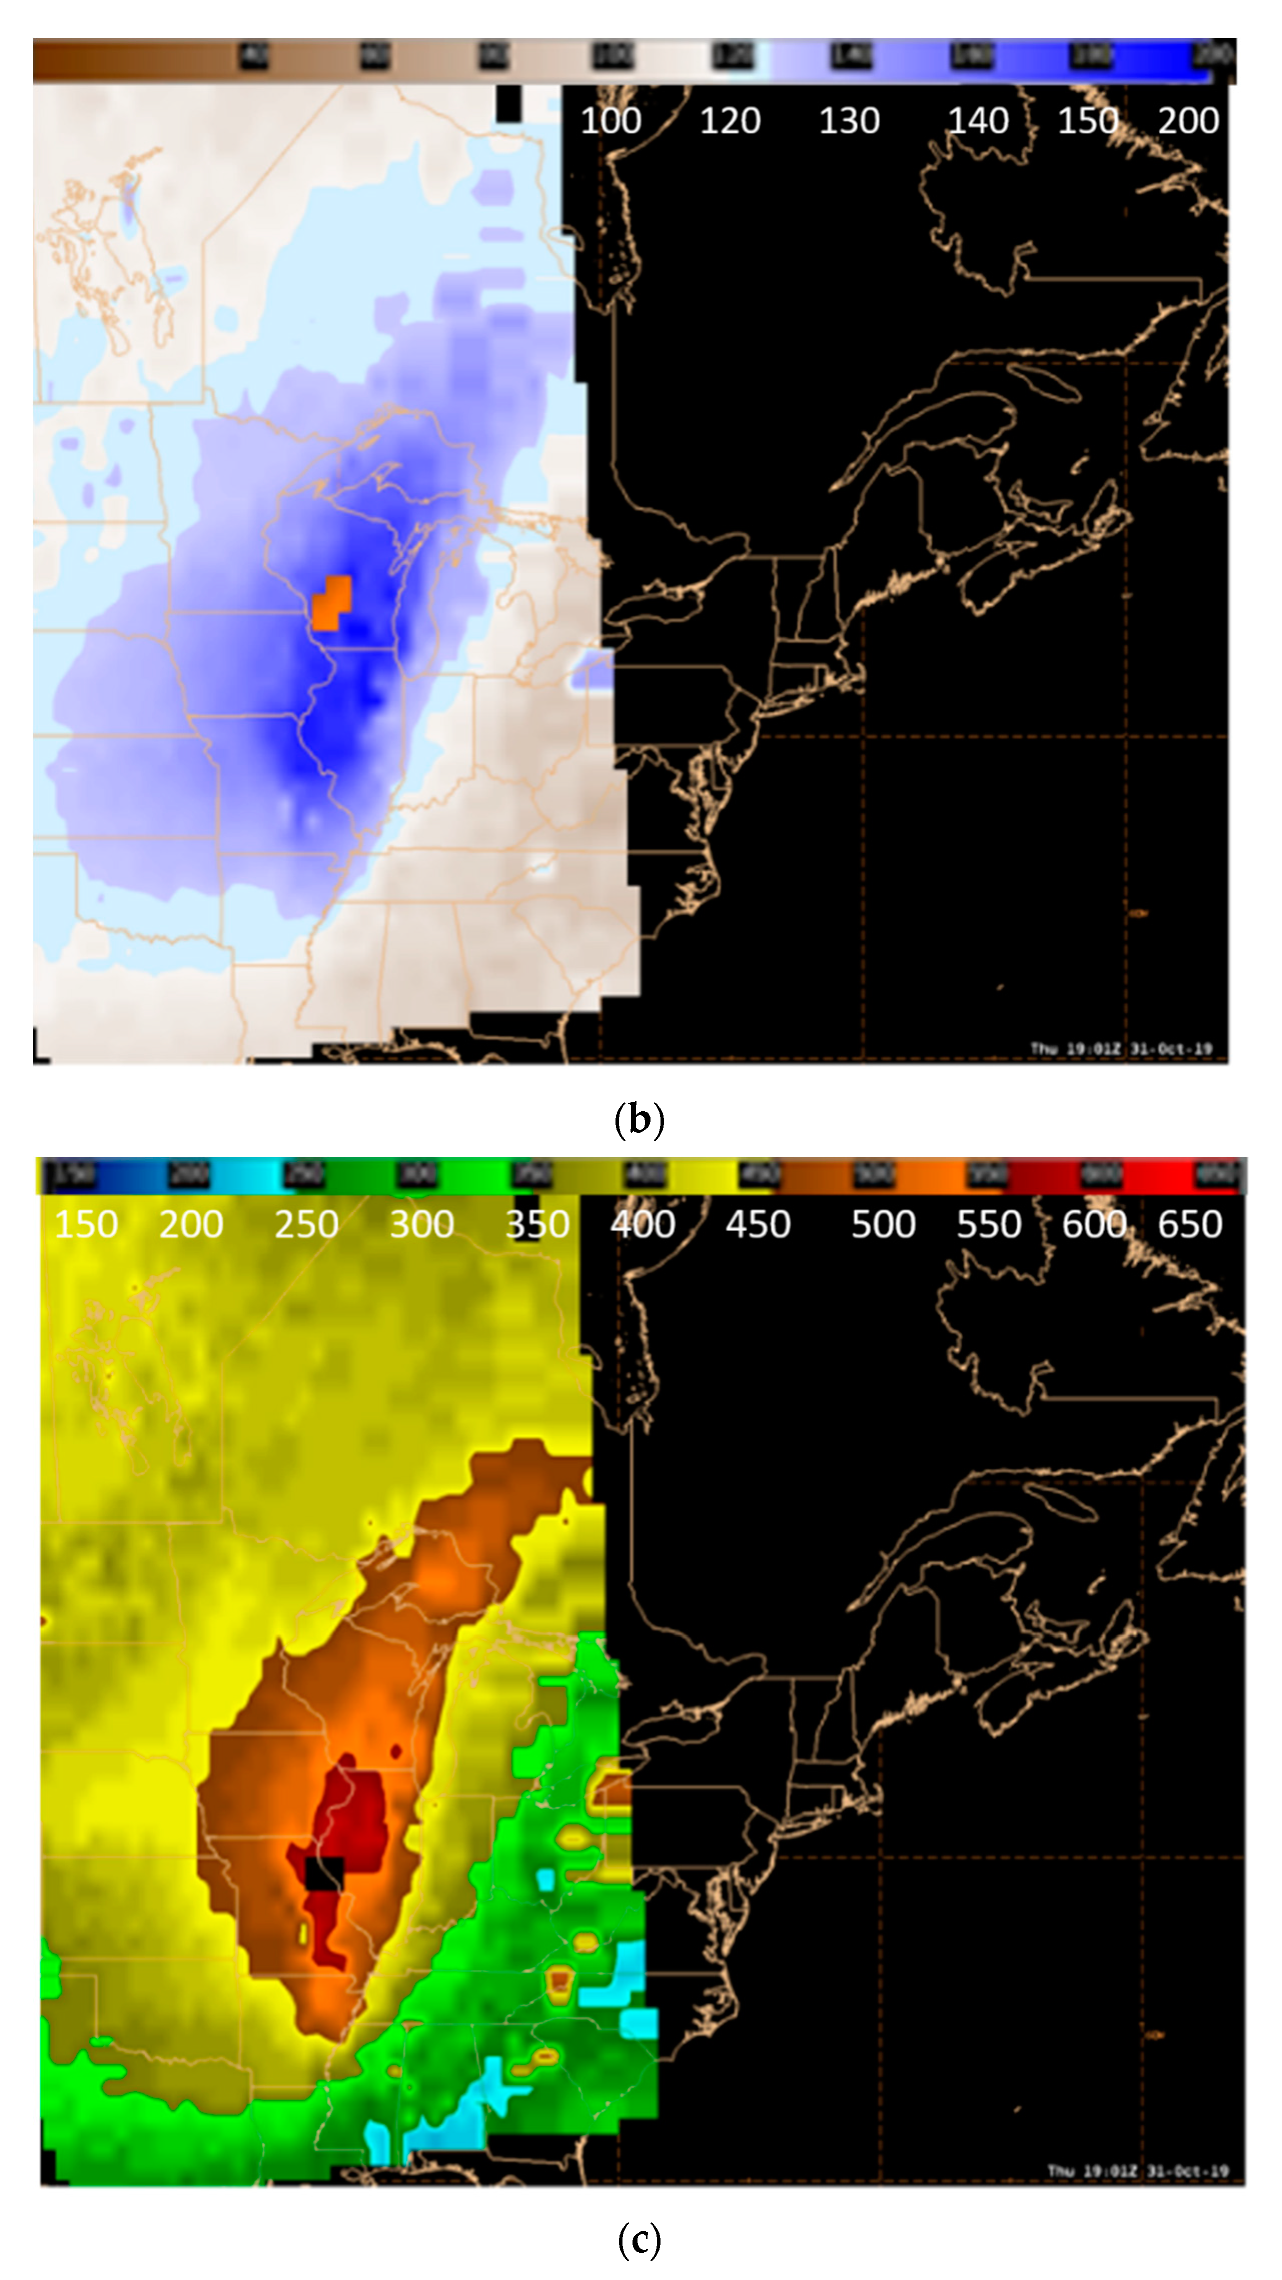
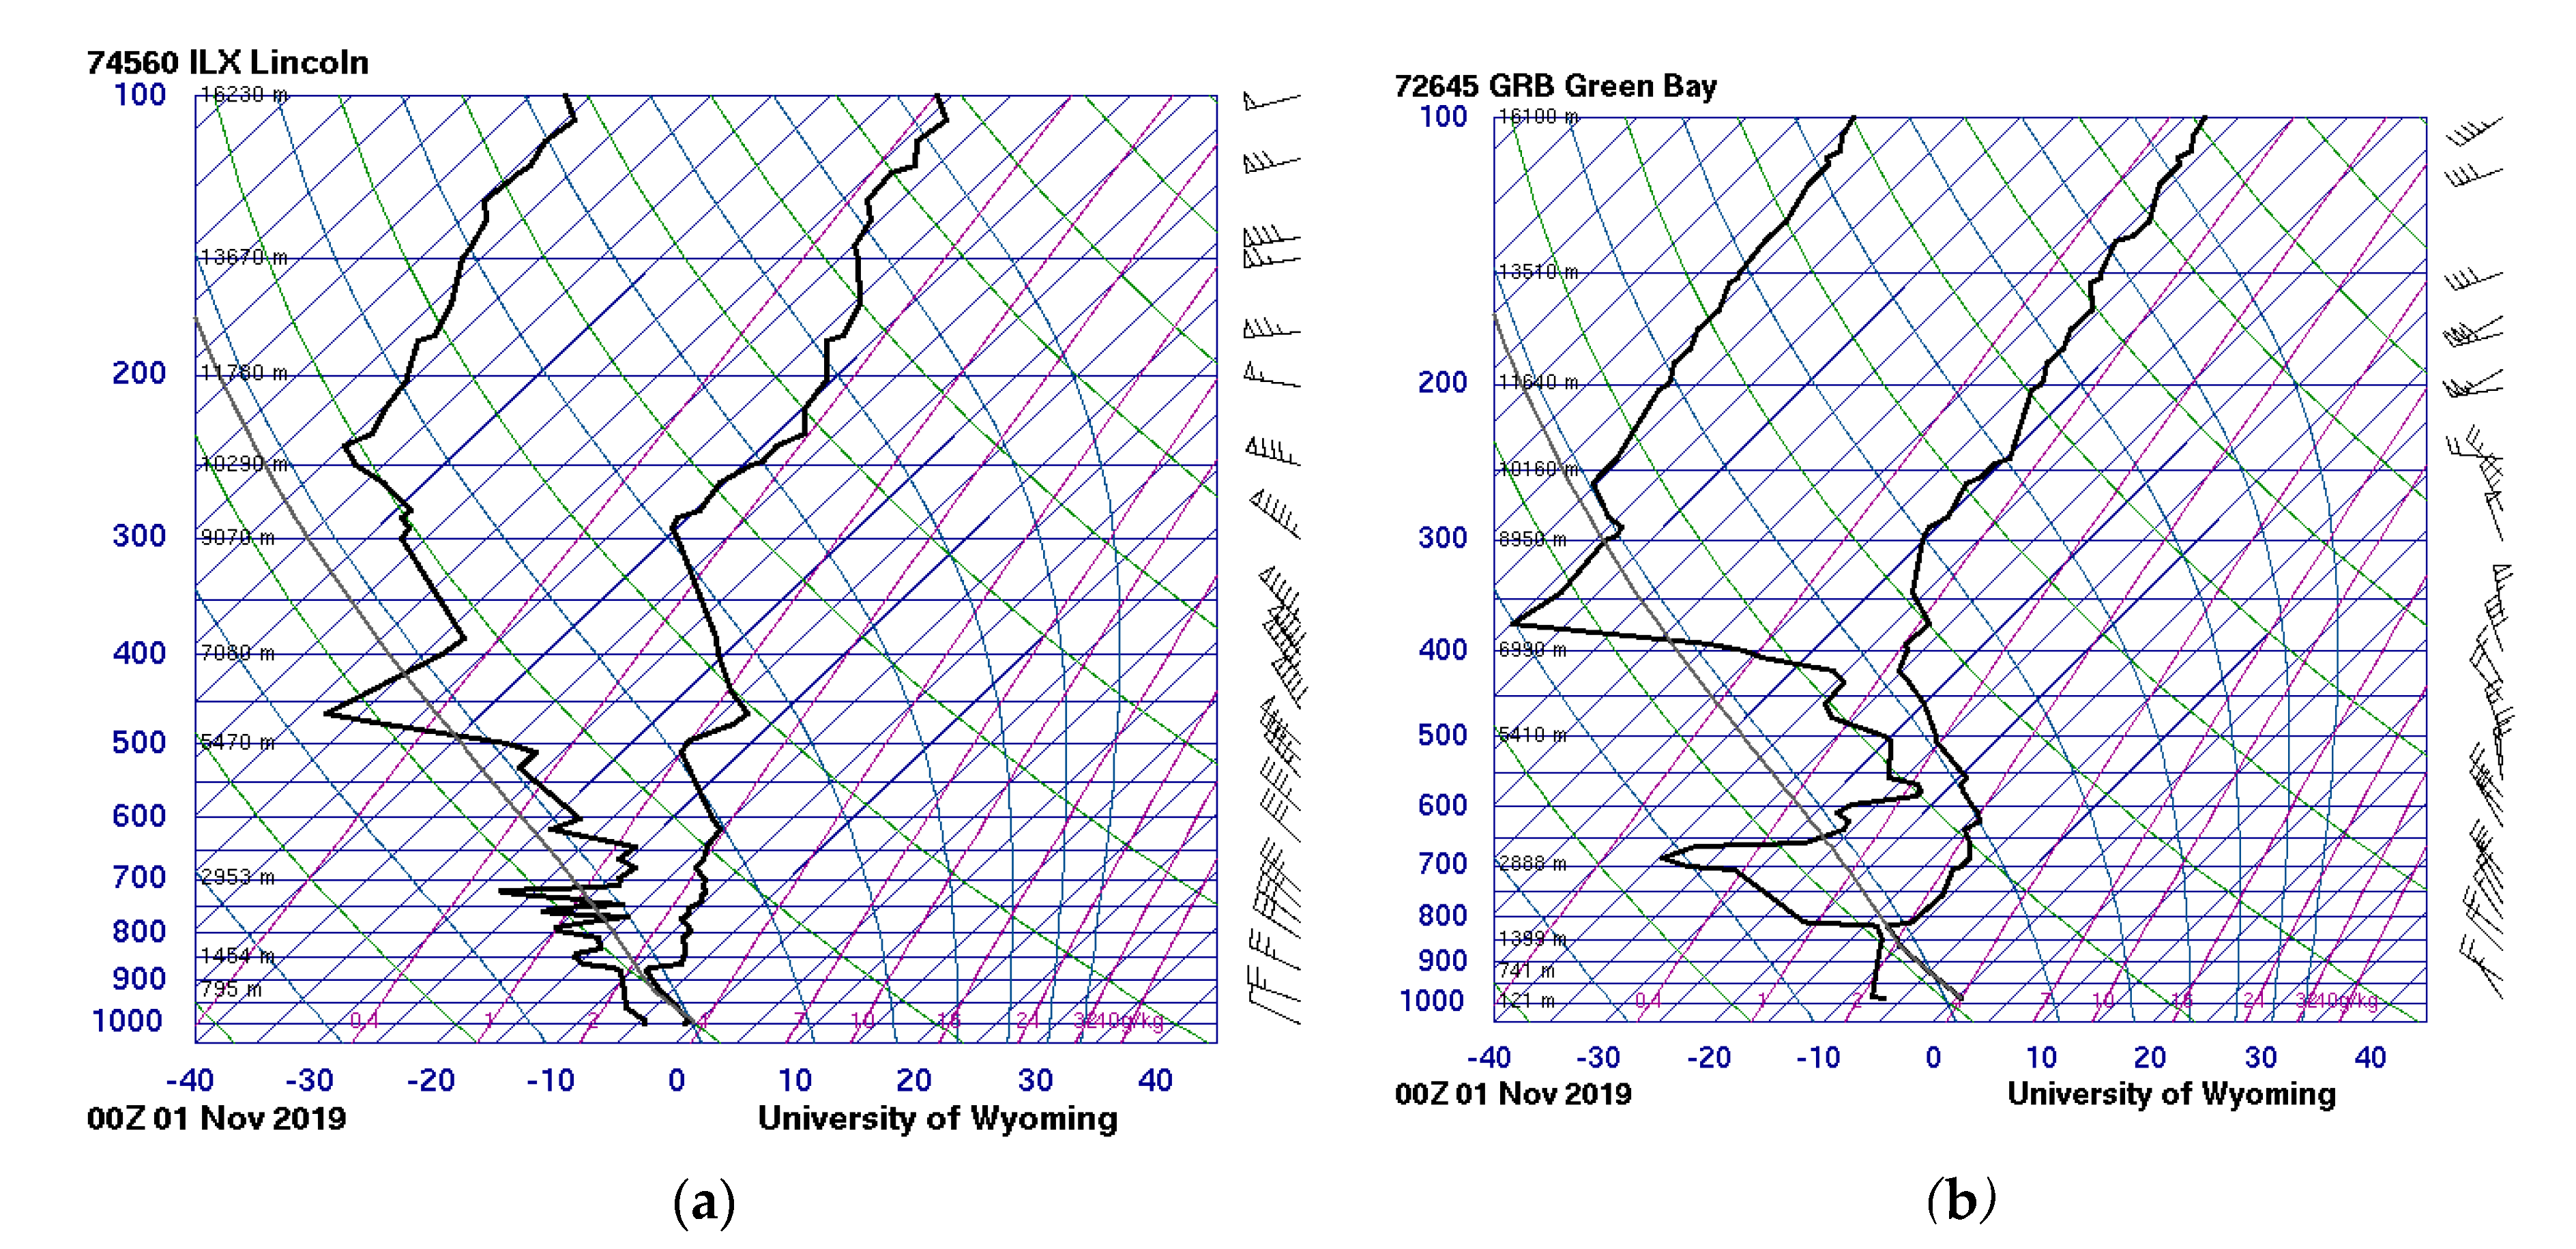
3.1. Surveilling the Pre-Convective Environment
3.2. Fire Weather Analysis
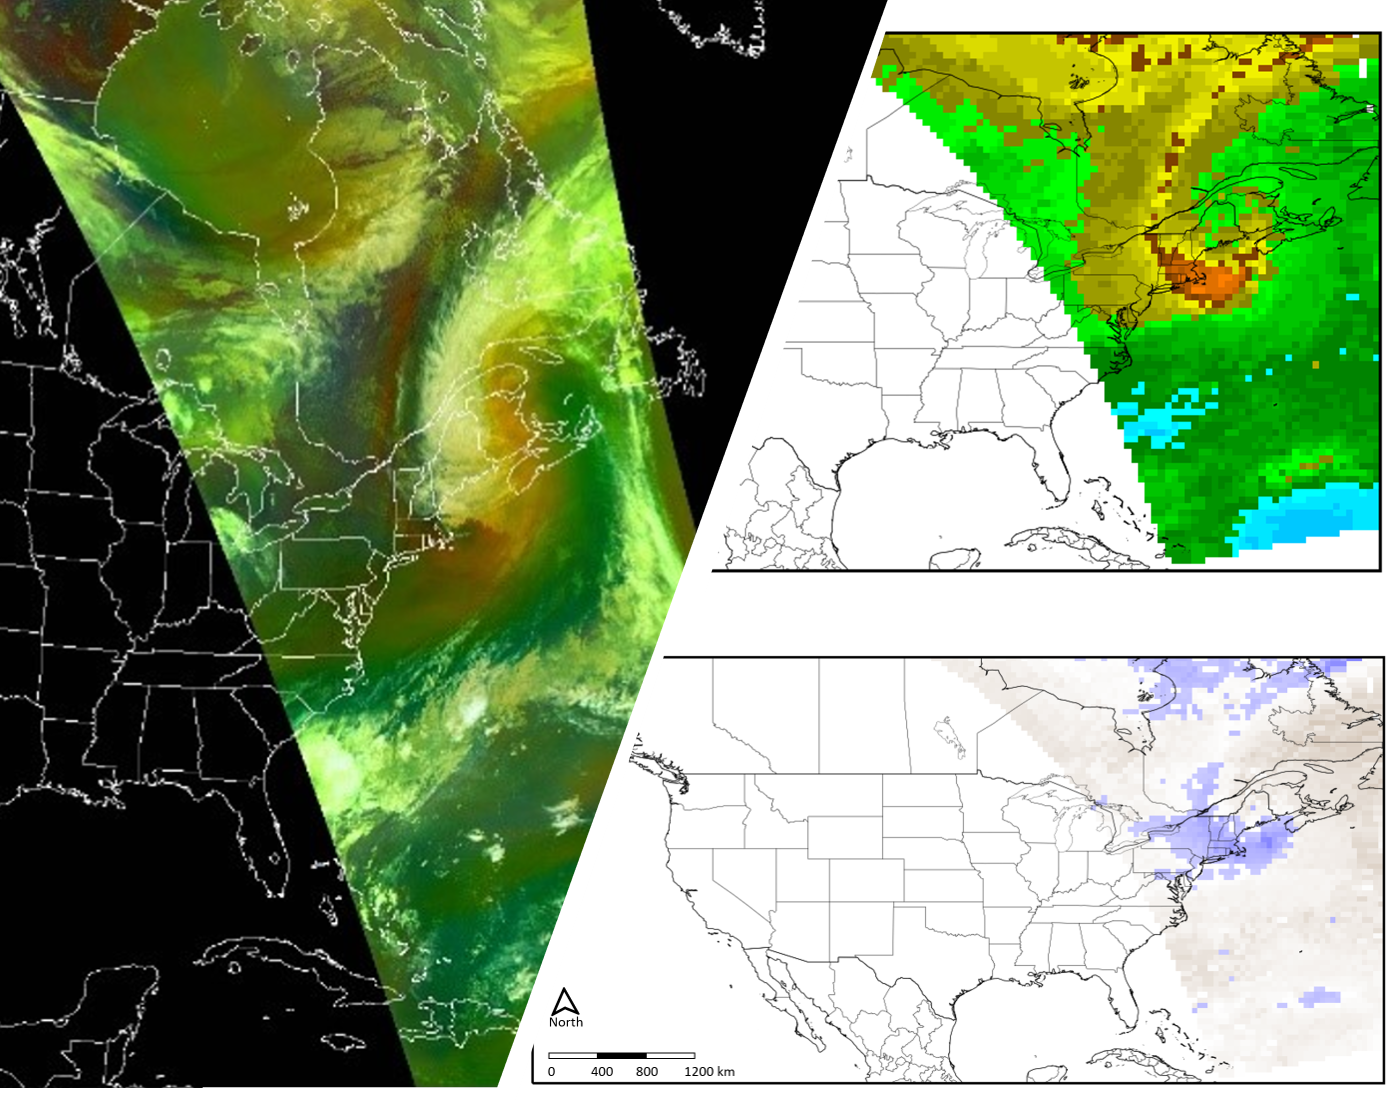
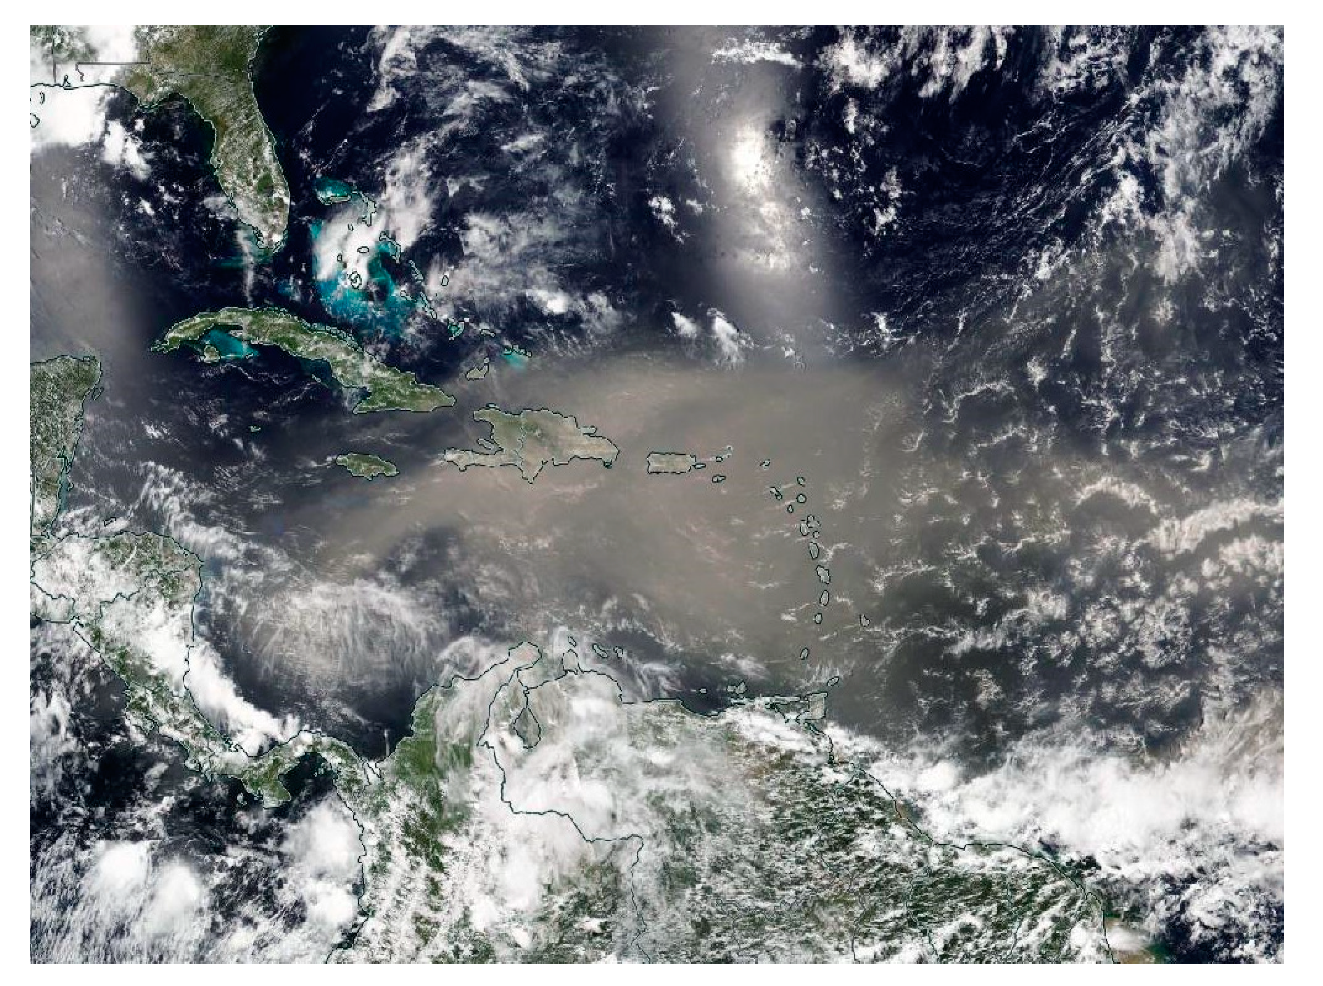
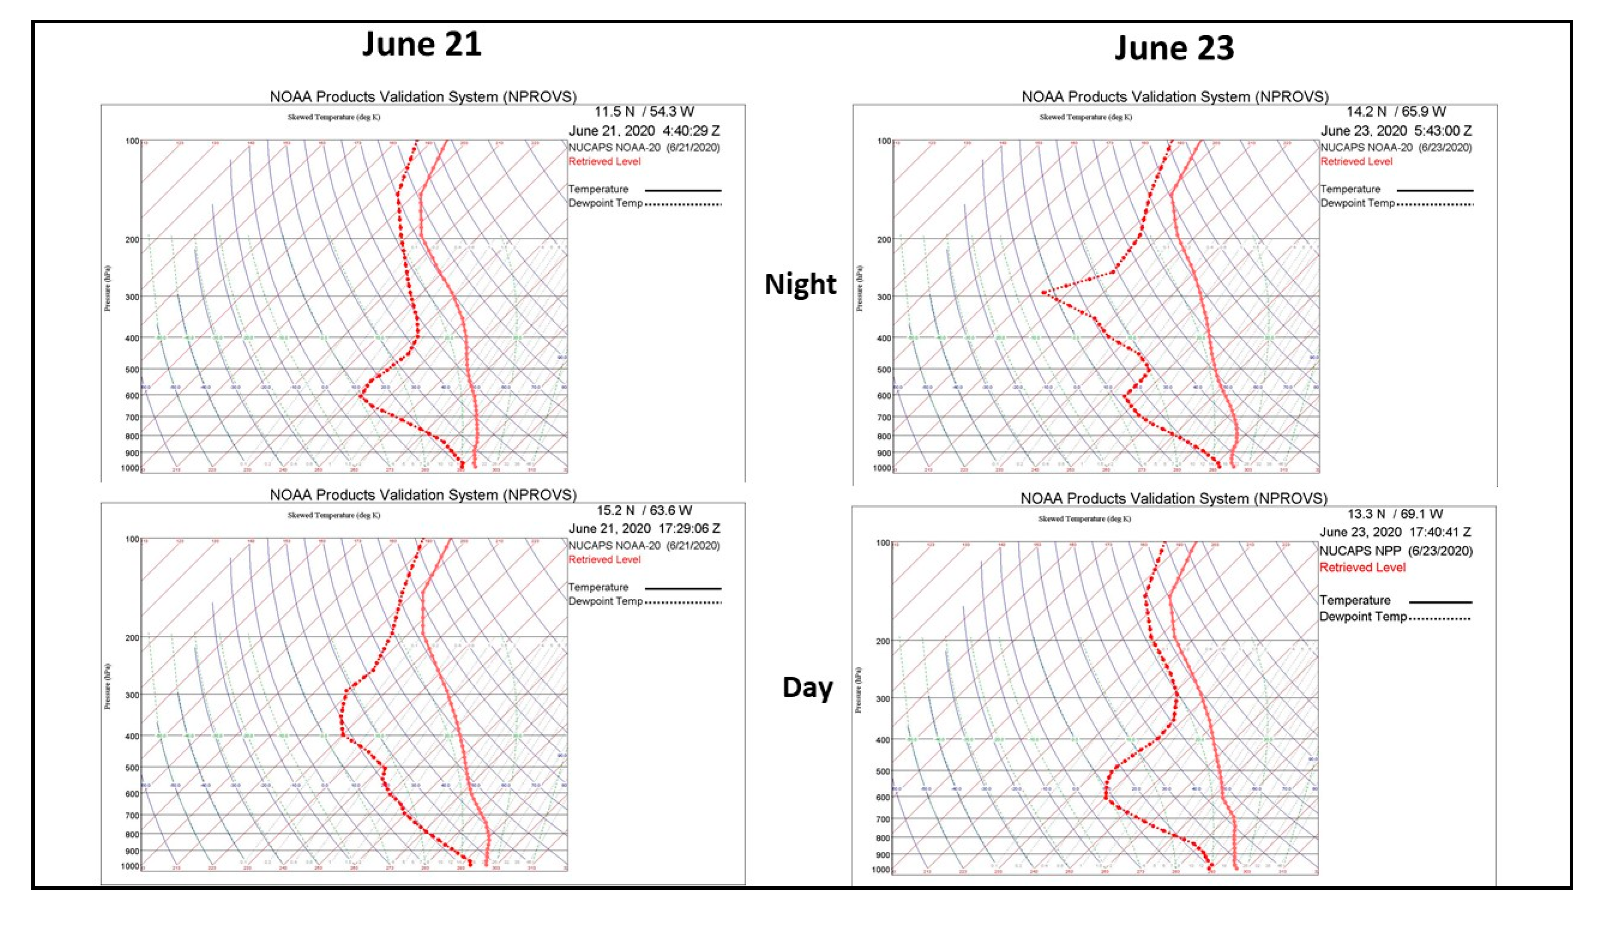
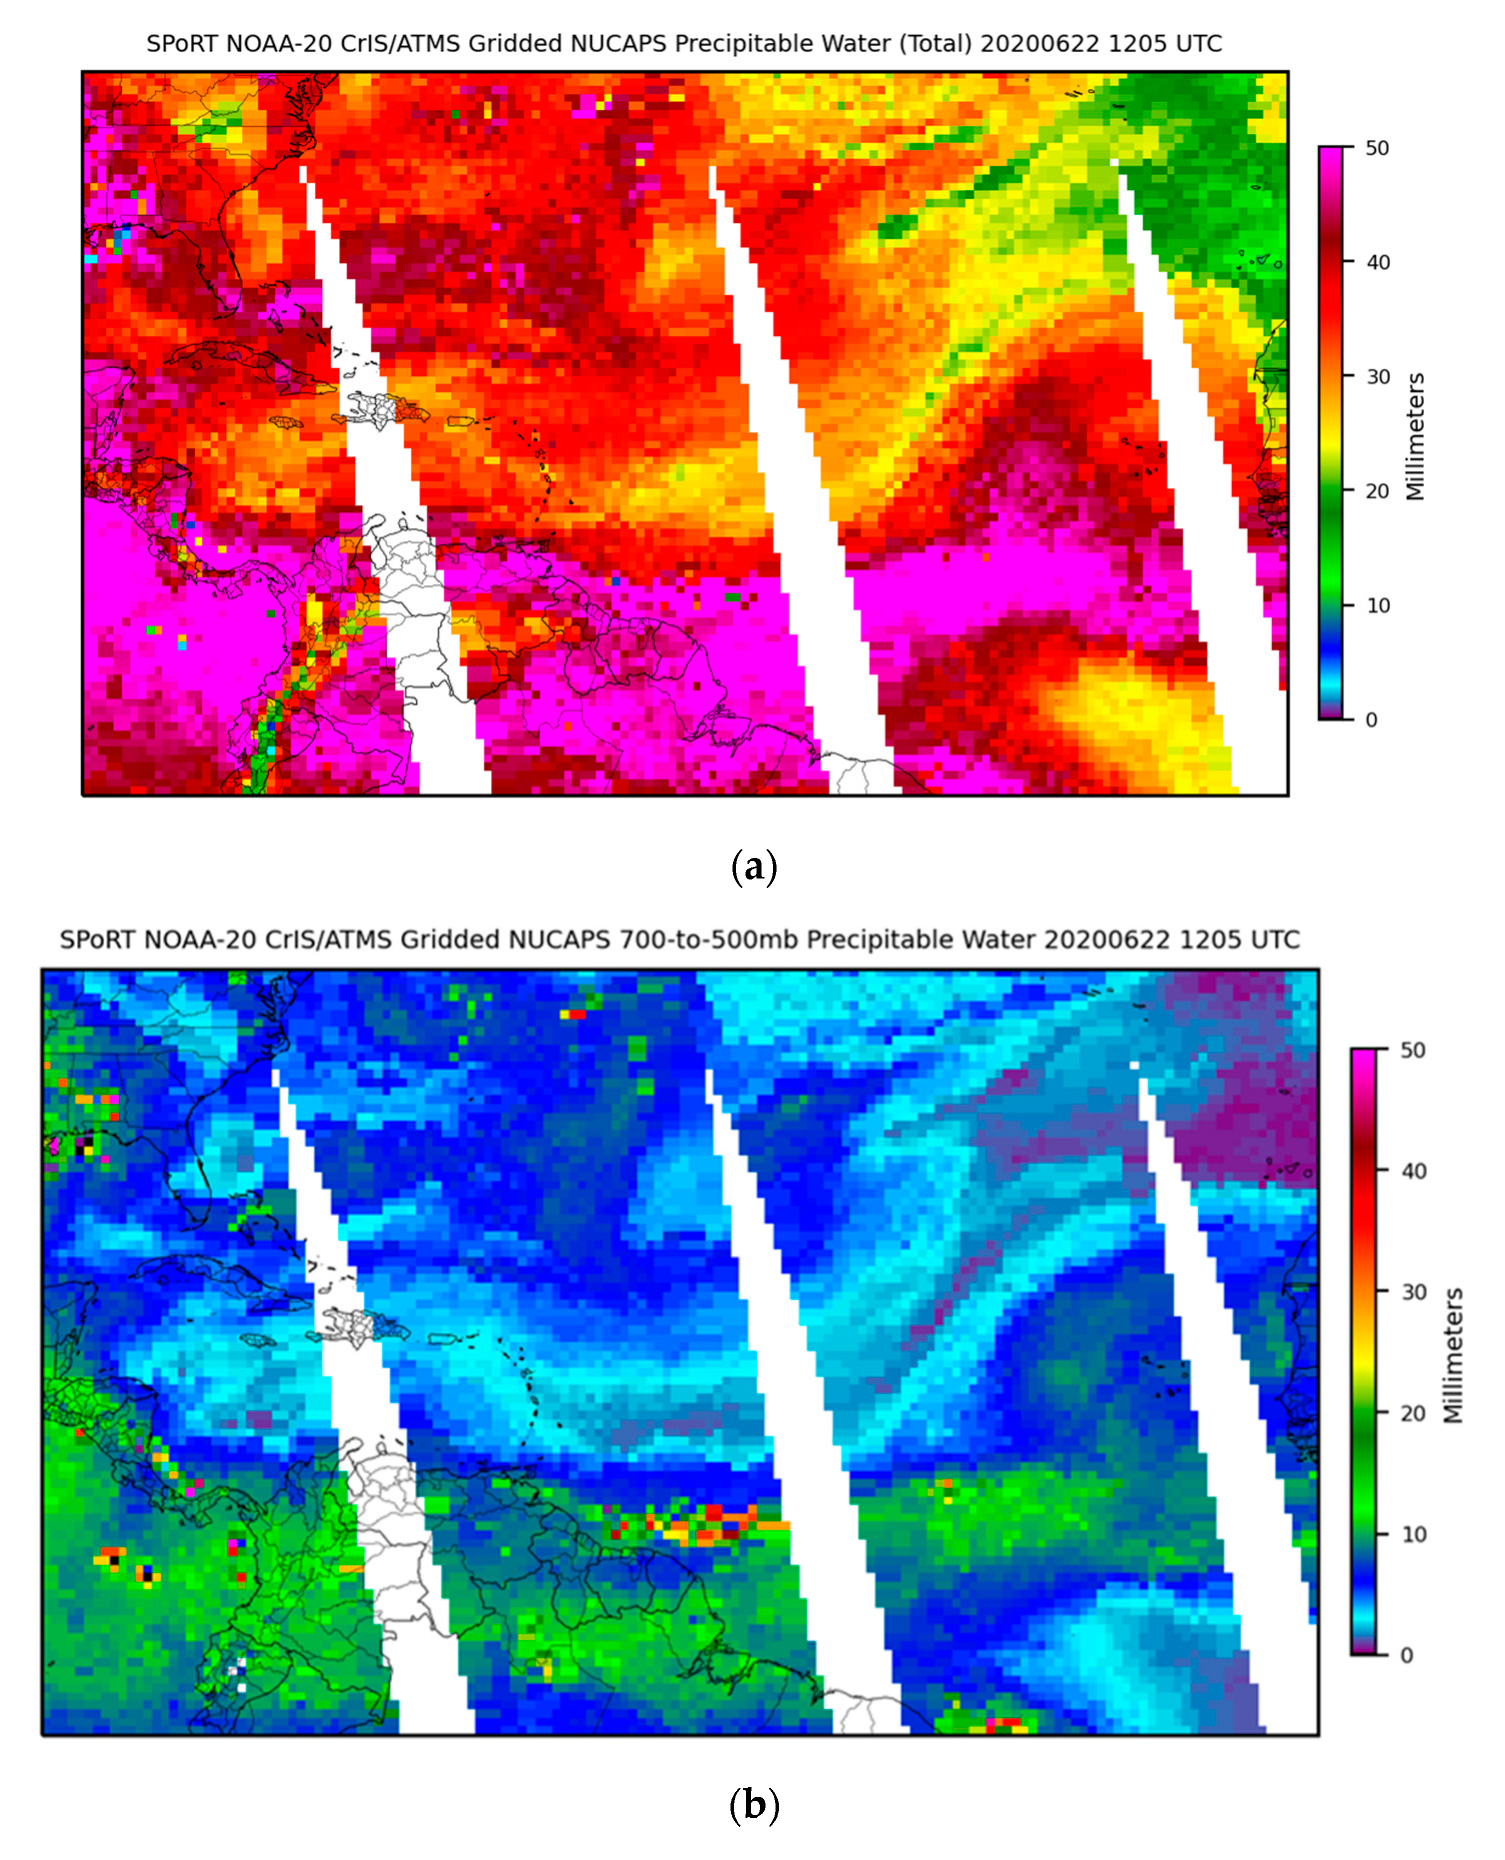
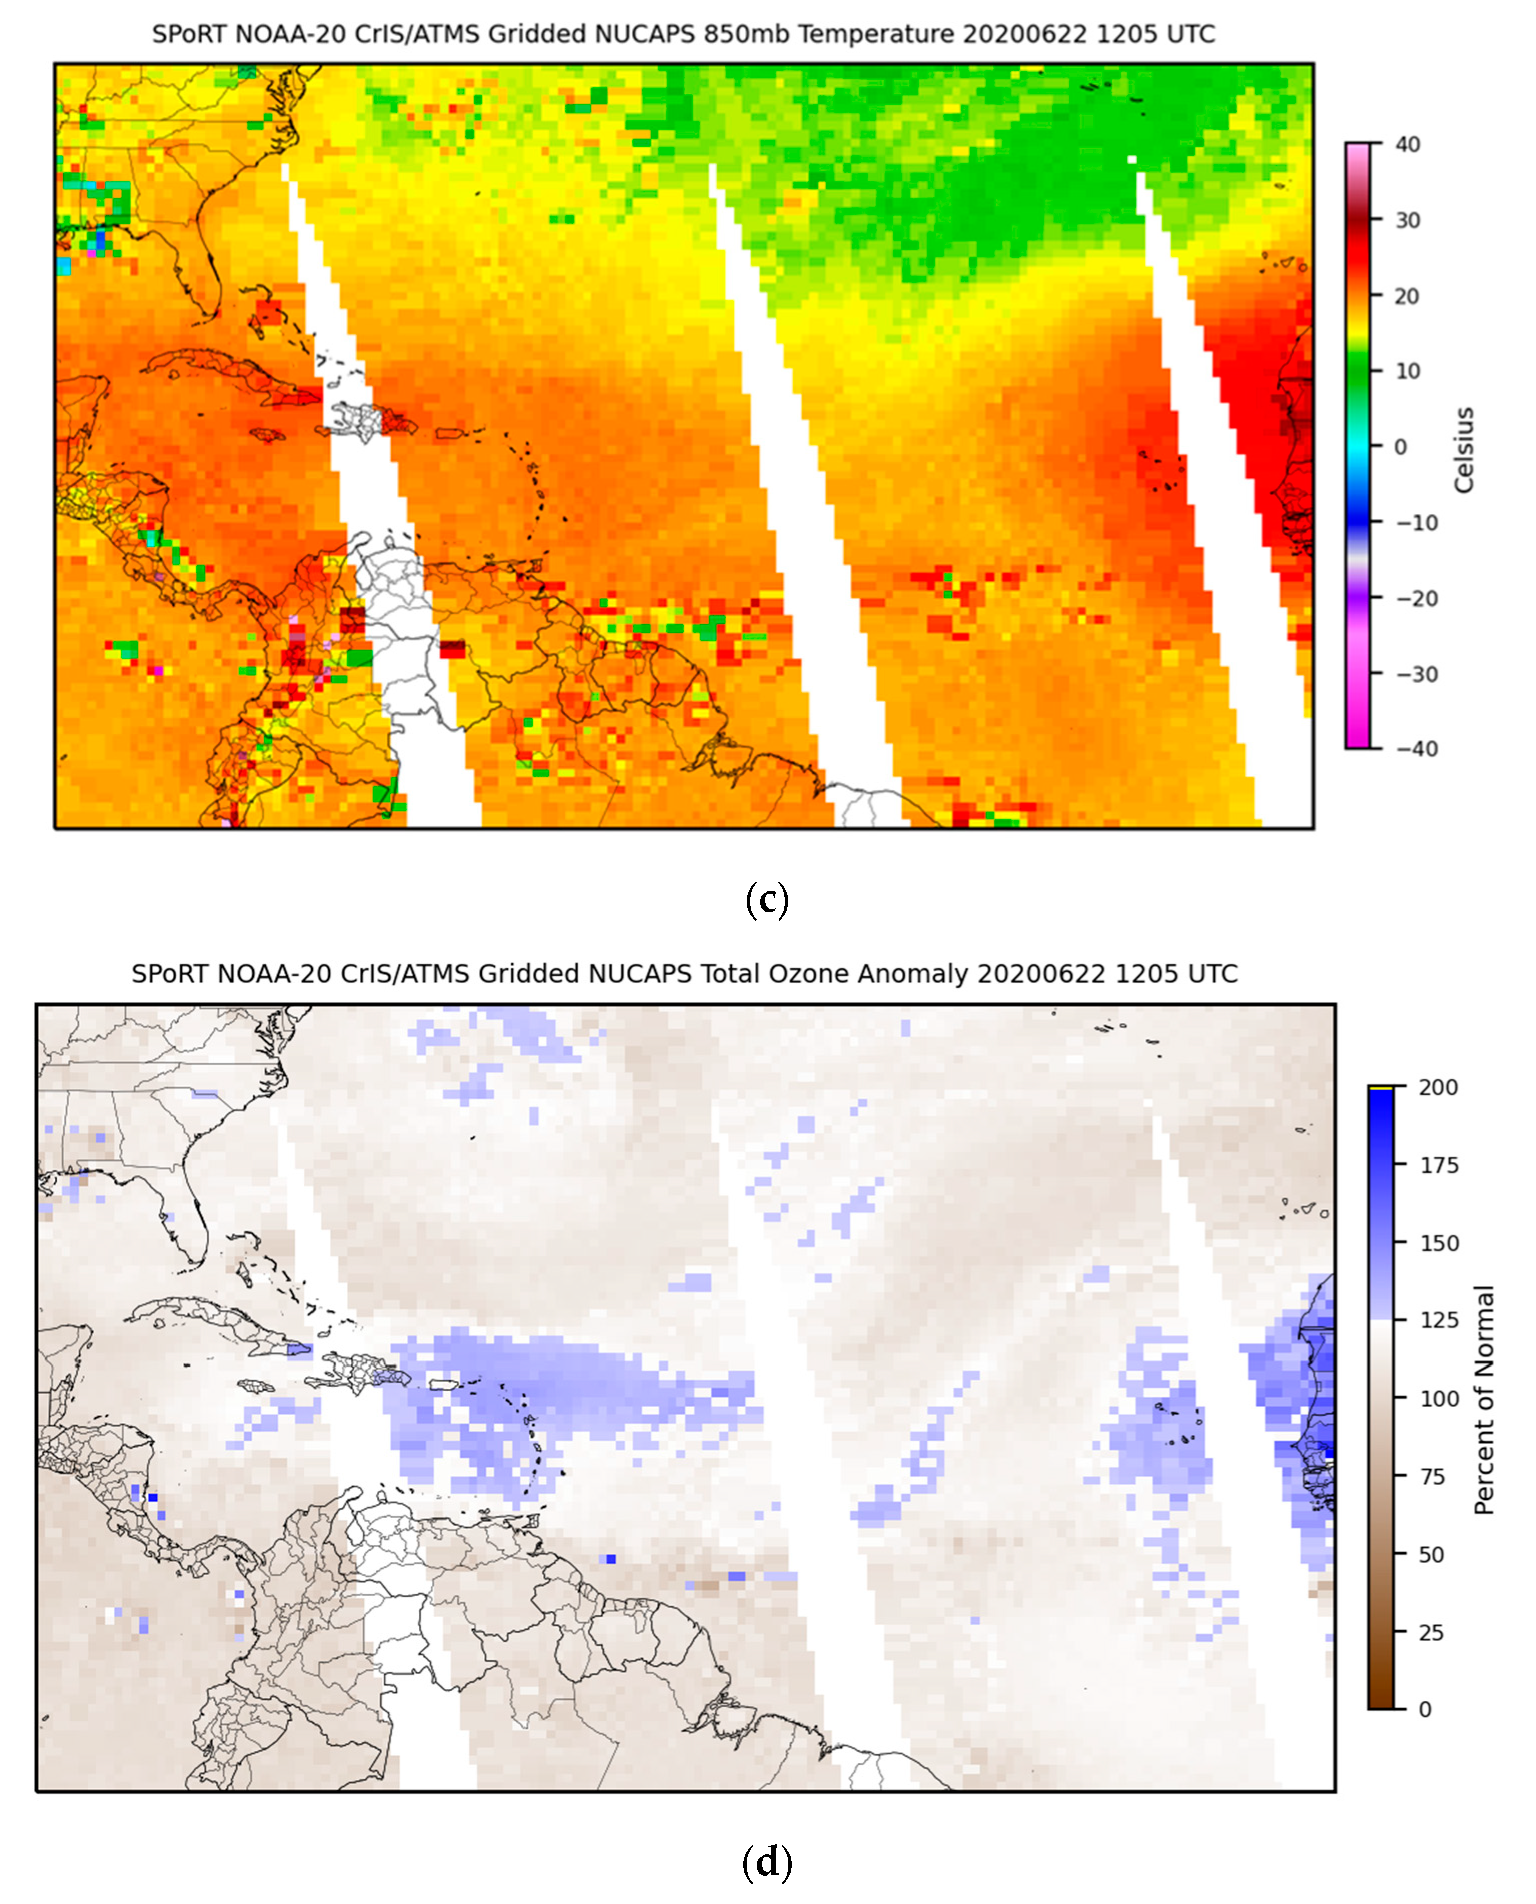
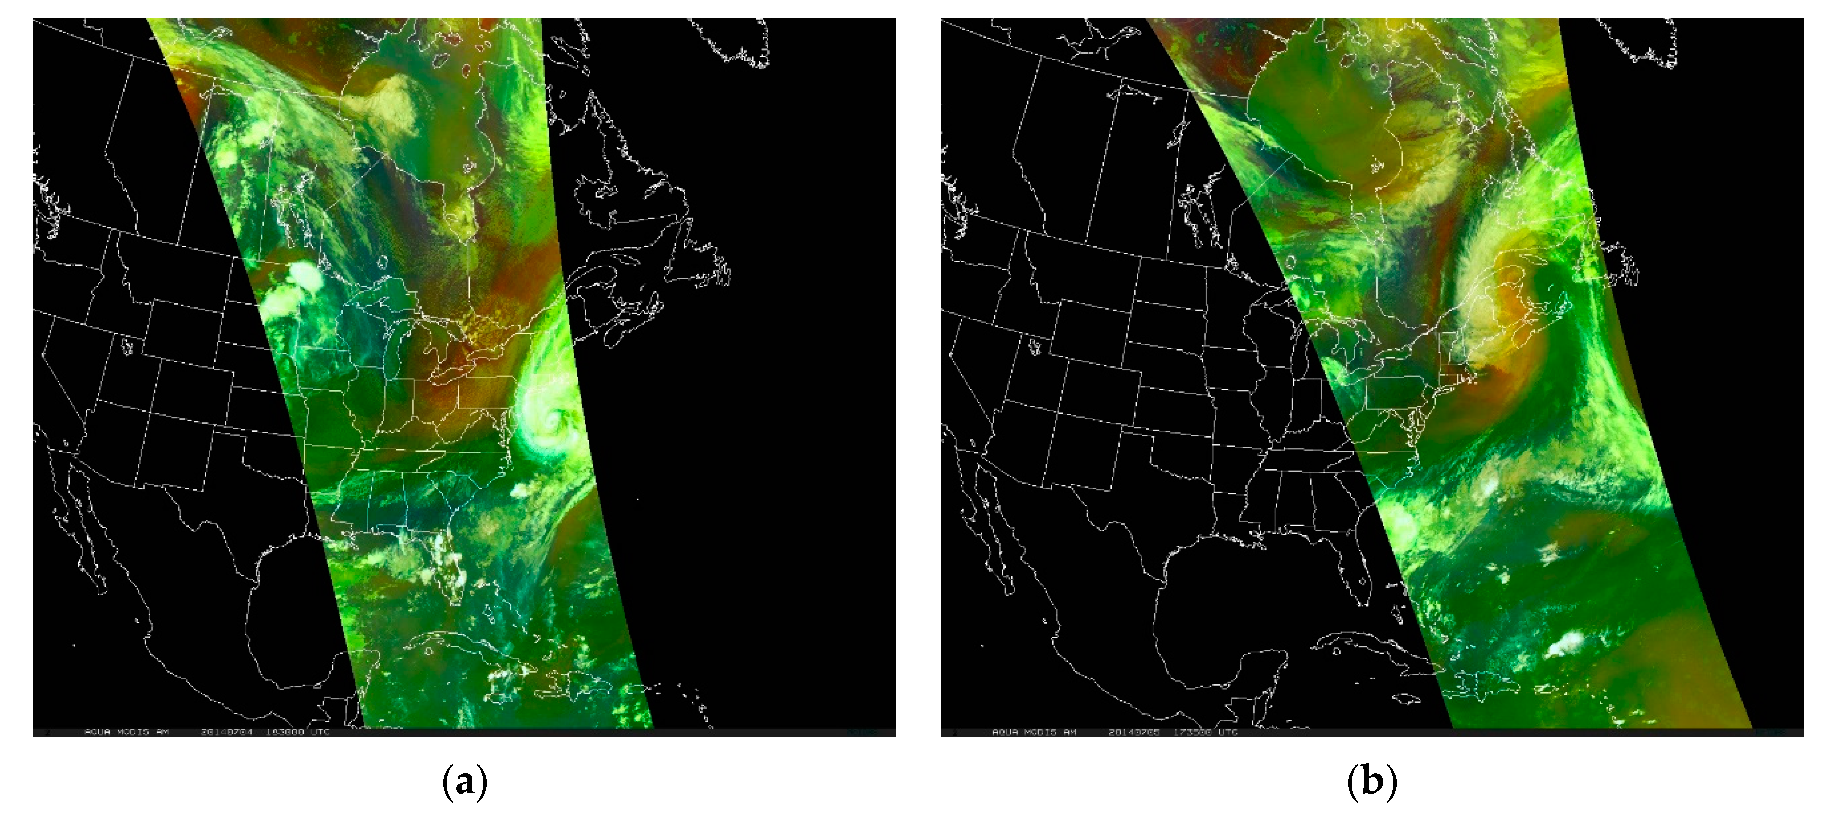
3.3. Monitoring the Saharan Air Layer
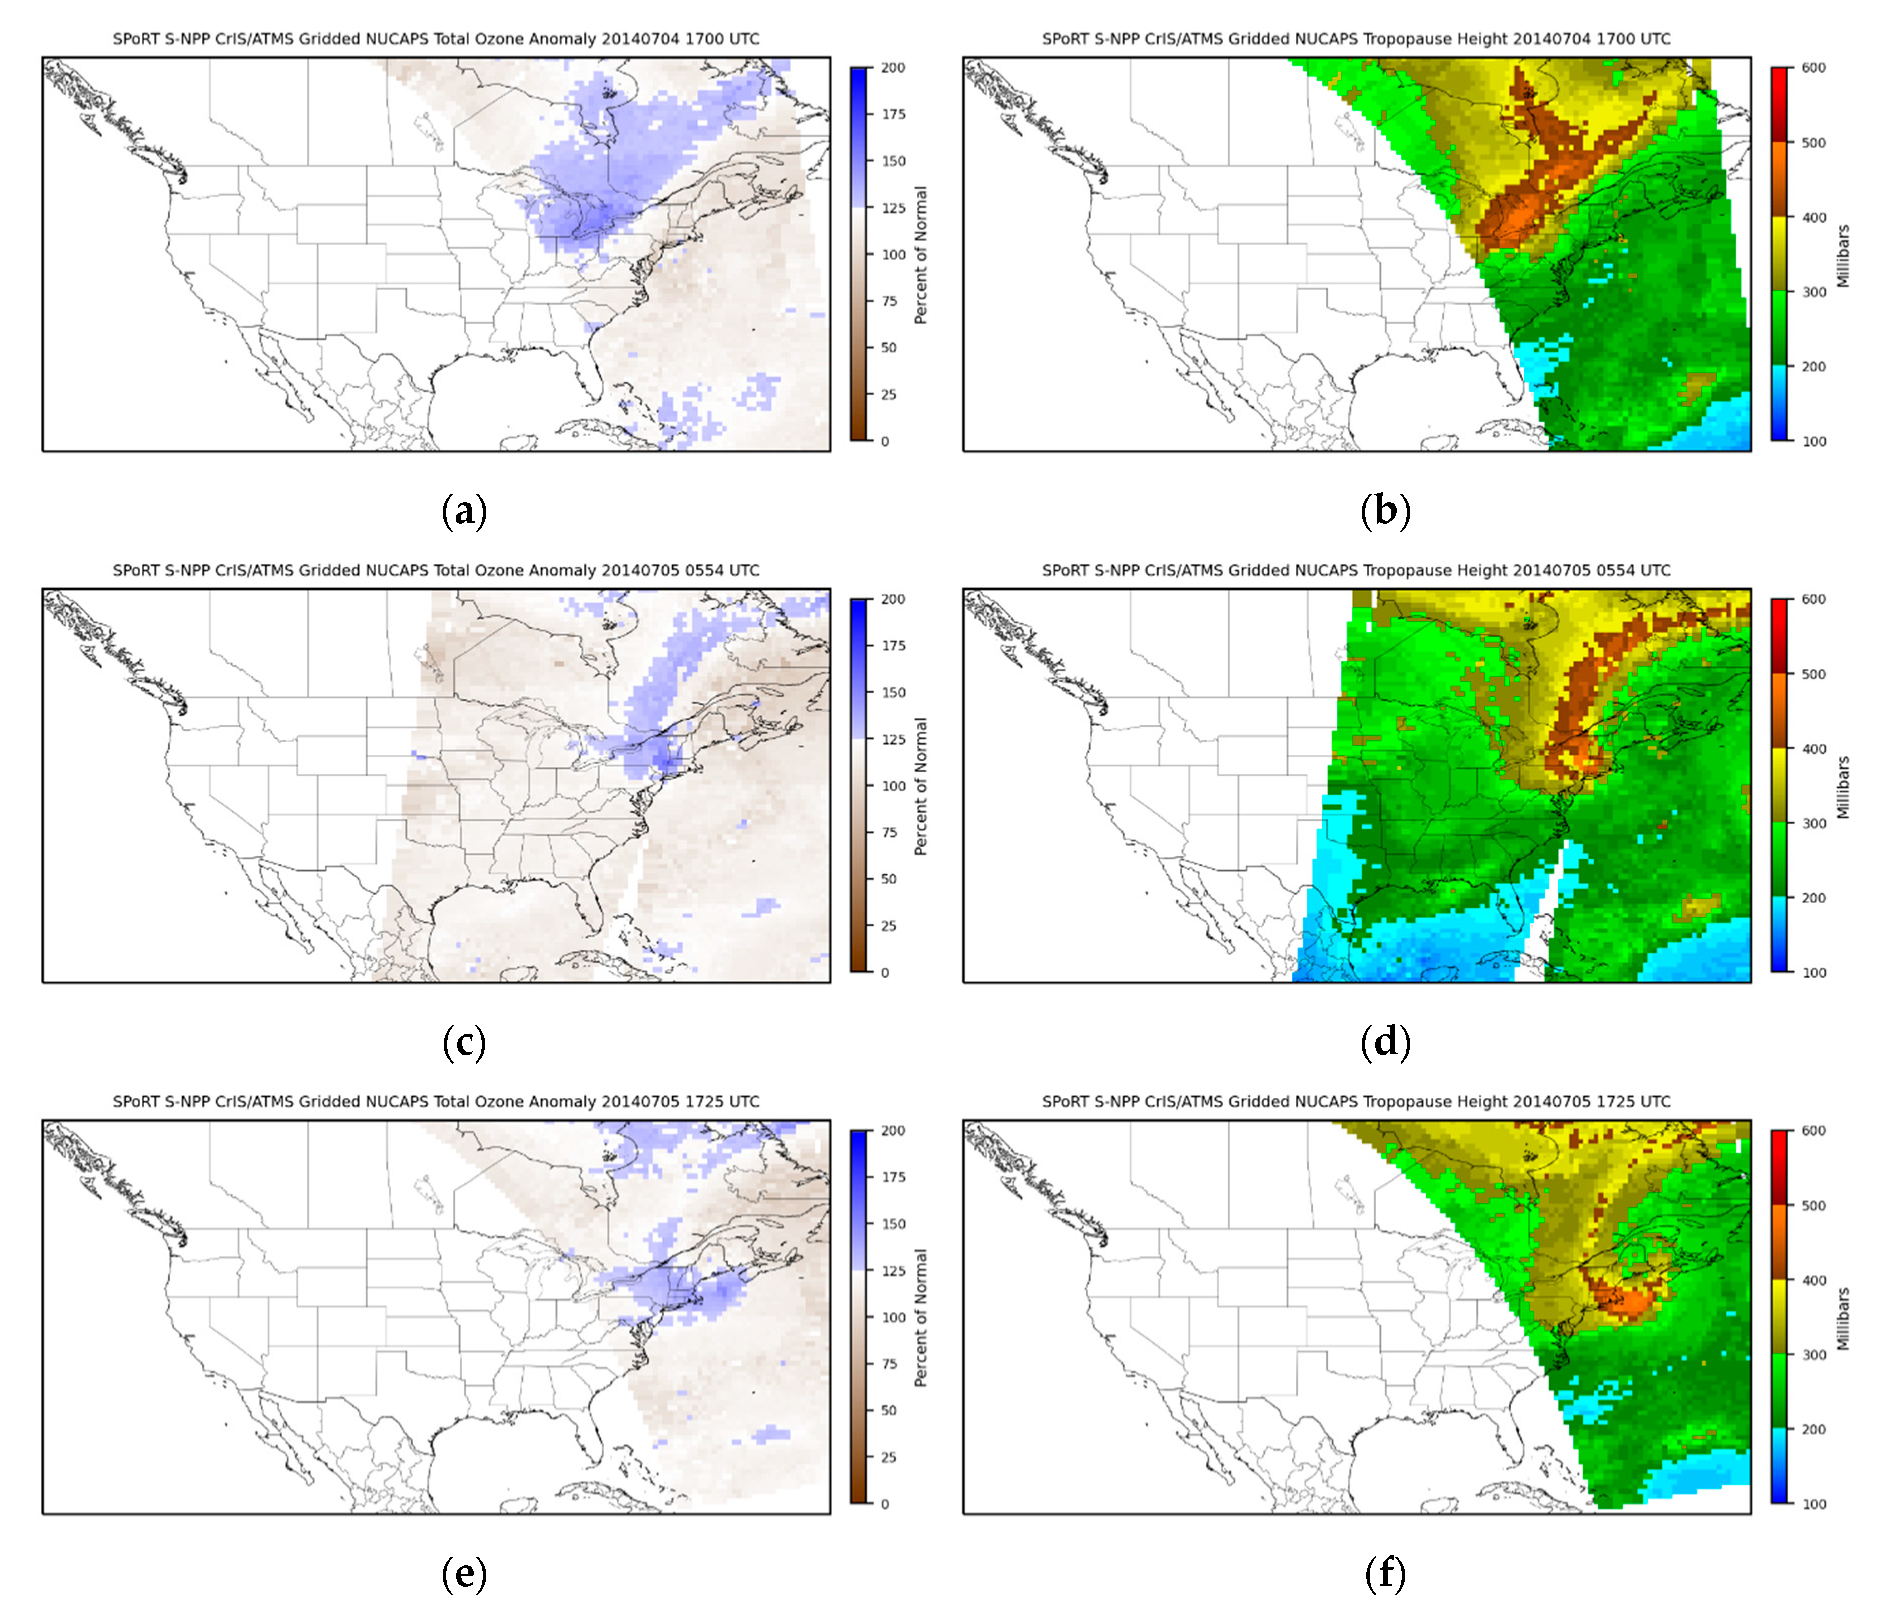
3.4. Identifying Stratospheric Air Influence and Tropopause Folding
4. Discussion
5. Conclusions
Author Contributions
Funding
Acknowledgments
Conflicts of Interest
References
- Jedlovec, G. Transitioning Research Satellite Data to the Operational Weather Community: The SPoRT Paradigm [Organization Profiles]. IEEE Geosci. Remote Sens. Mag. 2013, 1, 62–66. [Google Scholar] [CrossRef]
- Nalli, N.R.; Gambacorta, A.; Liu, Q.; Barnet, C.D.; Tan, C.; Iturbide-Sanchez, F.; Reale, T.; Sun, B.; Wilson, M.; Borg, L.; et al. Validation of Atmospheric Profile Retrievals From the SNPP NOAA-Unique Combined Atmospheric Processing System. Part 1: Temperature and Moisture. IEEE Trans. Geosci. Remote Sens. 2018, 56, 180–190. [Google Scholar] [CrossRef]
- Nalli, N.R.; Gambacorta, A.; Liu, Q.; Tan, C.; Iturbide-Sanchez, F.; Barnet, C.D.; Joseph, E.; Morris, V.R.; Oyola, M.; Smith, J.W. Validation of Atmospheric Profile Retrievals from the SNPP NOAA-Unique Combined Atmospheric Processing System. Part 2: Ozone. IEEE Trans. Geosci. Remote Sens. 2018, 56, 598–607. [Google Scholar] [CrossRef]
- Gambacorta, A.; Barnet, C.D. Methodology and Information Content of the NOAA NESDIS Operational Channel Selection for the Cross-Track Infrared Sounder (CrIS). IEEE Trans. Geosci. Remote Sens. 2013, 51, 3207–3216. [Google Scholar] [CrossRef]
- Weisz, E.; Smith, N.; Smith, W.L. The Use of Hyperspectral Sounding Information To Monitor Atmospheric Tendencies Leading to Severe Local Storms: HYPERSPECTRAL SOUNDERS TO MONITOR STORMS. Earth Space Sci. 2015, 2, 369–377. [Google Scholar] [CrossRef]
- Iturbide-Sanchez, F.; da Silva, S.R.S.; Liu, Q.; Pryor, K.L.; Pettey, M.E.; Nalli, N.R. Toward the Operational Weather Forecasting Application of Atmospheric Stability Products Derived From NUCAPS CrIS/ATMS Soundings. IEEE Trans. Geosci. Remote Sens. 2018, 56, 4522–4545. [Google Scholar] [CrossRef]
- Susskind, J.; Barnet, C.D.; Blaisdell, J.M. Retrieval of Atmospheric and Surface Parameters from AIRS/AMSU/HSB data in the Presence of Clouds. IEEE TGRS 2003, 41, 390–409. [Google Scholar] [CrossRef]
- Wheeler, A.; Smith, N.; Gambacorta, A.; Barnet, C.D. Evaluation of NUCAPS Products in AWIPS-II: Results from the 2017 HWT. In Proceedings of the 98th American Meteorological Society Annual Meeting, Austin, TX, USA, 7–11 January 2018. [Google Scholar]
- Smith, N.; White, K.D.; Berndt, E.B.; Zavodsky, B.T.; Wheeler, A.; Bowlan, M.A.; Barnet, C.D. NUCAPS in AWIPS–Rethinking Information Compression and Distribution for Fast Decision Making. In Proceedings of the 98th American Meteorological Society Annual Meeting, Austin, TX, USA, 7–11 January 2018. [Google Scholar]
- Ackerman, S.A.; Platnick, S.; Bhartia, P.K.; Duncan, B.; L’Ecuyer, T.; Heidinger, A.; Skofronick-Jackson, G.; Loeb, N.; Schmit, T.; Smith, N. Satellites See the World’s Atmosphere. Meteorol. Monogr. 2018, 59, 4.1–4.53. [Google Scholar] [CrossRef]
- Esmaili, R.B.; Smith, N.; Berndt, E.B.; Dostalek, J.F.; Kahn, B.H.; White, K.; Barnet, C.D.; Sjoberg, W.; Goldberg, M. Adapting Satellite Soundings for Operational Forecasting within the Hazardous Weather Testbed. Remote Sens. 2020, 12, 886. [Google Scholar] [CrossRef]
- Smith, N.; Berndt, E.B.; Barnet, C.D.; Goldberg, M.D. Why operational meteorologists need more satellite soundings. In Proceedings of the 99th American Meteorological Society Annual Meeting, Phoenix, AZ, USA, 6–10 January 2019. [Google Scholar]
- Weaver, G.; Smith, N.; Berndt, E.B.; White, K.D.; Dostalek, J.F.; Zavodsky, B.T. Addressing the Cold Air Aloft Aviation Challenge with Satellite Sounding Observations. J. Oper. Meteorol. 2019, 138–152. [Google Scholar] [CrossRef]
- Zavodsky, B.T.; Smith, N.; Dostalek, J.F.; Stevens, E.; Nelson, K.; Weisz, E.; Berndt, E.B.; Line, W.; Barnet, C.D.; Gambacorta, A.; et al. Development and Evaluation of a Gridded CrIS/ATMS Visualization for Operational Forecasting. In Proceedings of the 2016 AGU Fall Meeting, San Francisco, CA, USA, 12–16 December 2016. IN31A–1734. [Google Scholar]
- Berndt, E.B.; Smith, N.; White, K.D.; Zavodsky, B.T. Development and Application of Gridded NUCAPS for Operational Forecasting Challenges. In Proceedings of the JPSS Science Seminar Series, Lantham, MD, USA, 23 October 2017. [Google Scholar]
- Berndt, E.B. The Evolution of Gridded NUCAPS: Transition of Research to Operations. In Proceedings of the 99th American Meteorological Society Annual Meeting, Phoenix, AZ, USA, 6–10 January 2019. [Google Scholar]
- Berndt, E.B.; Smith, N.; Burks, J.; White, K.D.; Allen, R.E. The Evolution of Gridded NUCAPS: Transition of Research to Operations. In Proceedings of the 2019 Joint Satellite Conference, Boston, MA, USA, 28 September–4 October 2019. [Google Scholar]
- Ralph, F.M.; Intrieri, J.; Andra, D.; Atlas, R.; Boukabara, S.; Bright, D.; Davidson, P.; Entwistle, B.; Gaynor, J.; Goodman, S.; et al. The Emergence of Weather-Related Test Beds Linking Research and Forecasting Operations. Bull. Am. Meteorol. Soc. 2013, 94, 1187–1211. [Google Scholar] [CrossRef]
- Zavodsky, B.; Molthan, A.; Folmer, M. Multispectral Imagery for Detecting Stratospheric Air Intrusions Associated with Mid-Latitude Cyclones. J. Oper. Meteorol. 2013, 1, 71–83. [Google Scholar] [CrossRef]
- Berndt, E.; Folmer, M. Utility of CrIS/ATMS Profiles to Diagnose Extratropical Transition. Results Phys. 2018, 8, 184–185. [Google Scholar] [CrossRef]
- Berndt, E.B.; Zavodsky, B.T.; Folmer, M.J. Development and Application of Atmospheric Infrared Sounder Ozone Retrieval Products for Operational Meteorology. IEEE Trans. Geosci. Remote Sens. 2016, 54, 958–967. [Google Scholar] [CrossRef]
- Rodgers, C.D. Inverse Methods for Atmospheric Sounding: Theory and Practice; Series on Atmospheric, Oceanic and Planetary Physics—Vol. 2; World Scientific Publishing Co.: Singapore, 2000; pp. 1–243. ISBN 978-981-02-2740-1. [Google Scholar]
- Irion, F.W.; Kahn, B.H.; Schreier, M.M.; Fetzer, E.J.; Fishbein, E.; Fu, D.; Kalmus, P.; Wilson, R.C.; Wong, S.; Yue, Q. Single-Footprint Retrievals of Temperature, Water Vapor and Cloud Properties from AIRS. Atmos. Meas. Tech. 2018, 11, 971–995. [Google Scholar] [CrossRef]
- Smith, N.; Barnet, C.D. CLIMCAPS Observing Capability for Temperature, Moisture and Trace Gases from AIRS/AMSU and CrIS/ATMS. Atmos. Meas. Tech. Discuss. 2020. [Google Scholar] [CrossRef]
- Rosenkranz, P.W. Retrieval of Temperature and Moisture Profiles from AMSU-A and AMSU-B Measurements. IEEE Trans. Geosci. Remote Sens. 2001, 39, 2429–2435. [Google Scholar] [CrossRef]
- Fu, D.; Bowman, K.W.; Worden, H.M.; Natraj, V.; Worden, J.R.; Yu, S.; Veefkind, P.; Aben, I.; Landgraf, J.; Strow, L.; et al. High-Resolution Tropospheric Carbon Monoxide Profiles Retrieved from CrIS and TROPOMI. Atmos. Meas. Tech. 2016, 9, 2567–2579. [Google Scholar] [CrossRef]
- Bowman, K.W.; Rodgers, C.D.; Kulawik, S.S.; Worden, J.; Sarkissian, E.; Osterman, G.; Steck, T.; Lou, M.; Eldering, A.; Shephard, M.; et al. Tropospheric Emission Spectrometer: Retrieval Method And Error Analysis. IEEE Trans. Geosci. Remote Sens. 2006, 44, 1297–1307. [Google Scholar] [CrossRef]
- Goldberg, D.G.; Qu, Y.; McMillim, L.M.; Wolf, W.; Zhou, L.; Divakarla, G. AIRS Near-Real-Time Products and Algorithms in Support of Operational Numerical Weather Prediction. IEEE TGRS 2003, 41, 379–389. [Google Scholar] [CrossRef]
- Smith, W.L.; Weisz, E.; Kireev, S.V.; Zhou, D.K.; Li, Z.; Borbas, E.E. Dual-Regression Retrieval Algorithm for Real-Time Processing of Satellite Ultraspectral Radiances. JAMC 2012, 51, 1455–1476. [Google Scholar] [CrossRef]
- Weisz, E.; Huang, H.L.; Li, J.; Borbas, E.E.; Baggett, K.; Thapliyal, P.; Guan, L. International MODIS and AIRS Processing Package: AIRS Products And Applications. J. Appl. Remote Sens. 2007, 1. [Google Scholar] [CrossRef]
- Weisz, E.; Smith, W.L.; Smith, N. Advances in Simultaneous Atmospheric Profile and Cloud Parameter Regression Based Retrieval from High-Spectral Resolution Radiance Measurements. J. Geophys. Res. Atmos. 2013, 118, 6433–6443. [Google Scholar] [CrossRef]
- Milstein, A.B.; Blackwell, W.J. Neural Network Temperature and Moisture Retrieval Algorithm Validation for AIRS/AMSU and CrIS/ATMS: NEURAL NETWORK T AND Q VALIDATION. J. Geophys. Res. Atmos. 2016, 121, 1414–1430. [Google Scholar] [CrossRef]
- Blackwell, W.J.; Milstein, A.B. A Neural Network Retrieval Technique for High-Resolution Profiling of Cloudy Atmospheres. IEEE J. Sel. Top. Appl. Earth Obs. Remote Sens. 2014, 7, 1260–1270. [Google Scholar] [CrossRef]
- Chahine, M.T. Remote Sensing of Cloud Parameters. J. Atmos. Sci. 1982, 39, 159–170. [Google Scholar] [CrossRef]
- Rosenkranz, P.W.; Barnet, C.D. Microwave Radiative Transfer Model Validation. J. Geophys. Res. 2006, 111. [Google Scholar] [CrossRef]
- Rosenkranz, P.W. Rapid Radiative Transfer Model for AMSU/HSB Channels. IEEE Trans. Geosci. Remote Sens. 2003, 41, 362–368. [Google Scholar] [CrossRef]
- Haines, D.A. A Lower Atmospheric Severity Index for Wildland Fire. Natl. Weather Dig. 1988, 13, 23–27. [Google Scholar]
- Werth, P.; Ochoa, R. The Evaluation of Idaho Wildfire Growth Using the Haines Index. Wea. Forecast. 1993, 8, 223–234. [Google Scholar] [CrossRef]
- Ziemke, J.R.; Chandra, S.; Labow, G.J.; Bhartia, P.K.; Froidevaux, L.; Witte, J.C. A Global Climatology of Tropospheric and Stratospheric Ozone Derived from Aura OMI and MLS Measurements. Atmos. Chem. Phys. 2011, 11, 9237–9251. [Google Scholar] [CrossRef]
- Van Haver, P.; De Muer, D.; Beekmann, M.; Mancier, C. Climatology of Tropopause Folds At Midlatitudes. Geophys. Res. Lett. 1996, 23, 1033–1036. [Google Scholar] [CrossRef]
- Thouret, V.; Cammas, J.-P.; Sauvage, B.; Athier, G.; Zbinden, R.; Nédélec, P.; Simon, P.; Karcher, F. Tropopause Referenced Ozone Climatology and Inter-Annual Variability (1994–2003) from the MOZAIC programme. Atmos. Chem. Phys. 2006, 6, 1033–1051. [Google Scholar] [CrossRef]
- HWT Blog. ILX Upper-Air Sounding Comparison to NUCAPS and Modified NUCAPS. The Satellite Proving Ground at the Hazardous Weather Testbed 2019. Available online: http://goesrhwt.blogspot.com/2019/06/ilx-upper-air-sounding-comparison-to.html (accessed on 19 July 2020).
- HWT Blog. Springfield Illinois Storms. Spring Experiments and Beyond 2019. Available online: https://inside.nssl.noaa.gov/ewp/2019/06/05/springfield-illinois-storms/ (accessed on 17 July 2020).
- Storm Prediction Center Storm Prediction Center Storm Reports. Available online: https://www.spc.noaa.gov/climo/reports/190605_rpts.html (accessed on 19 July 2020).
- Dostalek, J.F.; Haynes, J.; Lindsey, D. NUCAPS Boundary Layer Modifications in Pre-convective Environments: Development of a Timely and More Accurate Product to Assist Forecasters in Making Severe Weather Forecasts. In 2019 JPSS Science Digest; NOAA NASA Joint Polar Satellite System Program: Greenbelt, MD, USA, 2019. [Google Scholar]
- Smith, N.; Esmaili, R.B.; Barnet, C.D.; Frost, G.J.; McKeen, S.A.; Trainer, M.K.; Francoeur, C. Monitoring atmospheric composition and long-range smoke transport with NUCAPS Satellite Soundings in Field Campaigns and Operations. In Proceedings of the 100th American Meteorological Society Annual Meeting, Boston, MA, USA, 12–16 January 2020. [Google Scholar]
- Fuell, K. Introduction to NUCAPS Products for Fire Weather Potential. Available online: https://nasasporttraining.wordpress.com/2020/03/10/introduction-to-nucaps-products-for-fire-weather-potential/ (accessed on 27 July 2020).
- Lindley, T.T.; Bowers, B.R.; Murdoch, G.P.; Smith, B.R.; Gitro, C.M. Fire-effective Low-level Thermal Ridges on the Southern Great Plains. J. Oper. Meteorol. 2017, 5, 146–160. [Google Scholar] [CrossRef]
- National Interagency Coordination Center Wildland Fire Summary and Statistics Annual Report 2018. Available online: https://www.predictiveservices.nifc.gov/intelligence/2018_statssumm/intro_summary18.pdf (accessed on 1 October 2020).
- Prospero, J.M.; Carlson, T.N. Vertical and Areal Distribution of Saharan dust Over the Western Equatorial North Atlantic Ocean. J. Geophys. Res. 1972, 77, 5255–5265. [Google Scholar] [CrossRef]
- Kuciauskas, A.P.; Xian, P.; Hyer, E.J.; Oyola, M.I.; Campbell, J.R. Supporting Weather Forecasters in Predicting and Monitoring Saharan Air Layer Dust Events as They Impact the Greater Caribbean. Bull. Am. Meteorol. Soc. 2018, 99, 259–268. [Google Scholar] [CrossRef]
- Carlson, T.N. The Saharan Elevated Mixed Layer and its Aerosol Optical Depth. TOASCJ 2016, 10, 26–38. [Google Scholar] [CrossRef]
- Dunion, J.P.; Marron, C.S. A Reexamination of the Jordan Mean Tropical Sounding Based on Awareness of the Saharan Air Layer: Results from 2002. J. Clim. 2008, 21, 5242–5253. [Google Scholar] [CrossRef]
- Kuciauskas, A.; Esmaili, R.B.; Reale, T.; Nalli, N.R. Using NUCAPS to Observe the Thermodynamic Structure of Strong Saharan Air Layer Outbreaks about its Source within the Deserts of Northeast Africa. In Proceedings of the 16th Annual Symposium on New Generation Operational Environmental Satellite Systems Session 11A How JPSS and GOES-R Coupled Resources Improve Forecasting, Boston, MA, USA, 12–16 January 2020; p. 4. [Google Scholar]
- Dunion, J.P.; Velden, C.S. The Impact of the Saharan Air Layer on Atlantic Tropical Cyclone Activity. Bull. Am. Meteorol. Soc. 2004, 85, 353–366. [Google Scholar] [CrossRef]
- Lara, M. Heterogeneity of Childhood Asthma Among Hispanic Children: Puerto Rican Children Bear a Disproportionate Burden. Pediatrics 2006, 117, 43–53. [Google Scholar] [CrossRef]
- Jenkins, G.S.; Robjhon, M.L.; Smith, J.W.; Clark, J.; Mendes, L. The influence of the SAL and Lightning on Tropospheric Ozone Variability Over the Northern Tropical Atlantic: Results from Cape Verde during 2010. Geophys. Res. Lett. 2012, 39, 2012GL053532. [Google Scholar] [CrossRef]
- Jenkins, G.S.; Robjhon, M.L.; Demoz, B.; Stockwell, W.R.; Ndiaye, S.A.; Drame, M.S.; Gueye, M.; Smith, J.W.; Luna-Cruz, Y.; Clark, J.; et al. Multi-Site Tropospheric Ozone Measurements Across the North Tropical Atlantic during the summer of 2010. Atmos. Environ. 2013, 70, 131–148. [Google Scholar] [CrossRef]
- Grasso, L.; Bikos, D.; Torres, J.; Dostalek, J.F.; Wu, T.-C.; Forsythe, J.; Cronk, H.; Seaman, C.; Miller, S.; Berndt, E.B.; et al. Satellite Imagery and Products of the 16–17 February 2020 Saharan Air Layer Dust Event over the Eastern Atlantic: Impacts of Water Vapor on Dust Detection and Morphology. Atmos. Meas. Tech. 2020, 1–33, in review. [Google Scholar] [CrossRef]
- Reiter, E.R.; Nania, A. Jet-Stream Structure and Clear-Air Turbulence (CAT). J. Appl. Meteorol. 1964, 3, 247–260. [Google Scholar] [CrossRef]
- Shapiro, M.A. Turbulent Mixing within Tropopause Folds as a Mechanism for the Exchange of Chemical Constituents between the Stratosphere and Troposphere. J. Atmos. Sci. 1980, 37, 994–1004. [Google Scholar] [CrossRef]
- Danielsen, E.F. Stratospheric-Tropospheric Exchange Based on Radioactivity, Ozone and Potential Vorticity. J. Atmos. Sci. 1968, 25, 502–518. [Google Scholar] [CrossRef]
- Fuell, K.; LeRoy, A. Gridded NUCAPS Daily Applications of Satellite Soundings. Available online: https://nasasporttraining.wordpress.com/2020/08/25/gridded-nucaps-daily-applications-of-satellite-soundings/ (accessed on 27 August 2020).
- University of Wyoming College of Engineering Department of Atmospheric Science Upper Air Sounding Archive. Available online: http://weather.uwyo.edu/upperair/sounding.html (accessed on 19 July 2020).
- EUMETSAT. User Services Division. Best-Practices for RGB Compositing Multi-Spectral Imagery. Available online: http://oiswww.eumetsat.int/~idds/html/doc/best_practices.pdf (accessed on 19 July 2020).
- EUMETSAT. Airmass RGB. Available online: http://oiswww.eumetsat.int/~idds/html/doc/airmass_interpretation.pdf (accessed on 19 July 2020).
- Lensky, I.M.; Rosenfeld, D. Clouds-Aerosols-Precipitation Satellite Analysis Tool (CAPSAT). Atmos. Chem. Phys. 2008, 8, 6739–6753. [Google Scholar] [CrossRef]
- Berg, R. National Hurricane Center Tropical Cyclone Report Hurricane Arthur (AL012014). Available online: https://www.nhc.noaa.gov/data/tcr/AL012014_Arthur.pdf (accessed on 19 July 2020).
- Berndt, E.B. JPSS Satellite Products for Extratropical Transition. Available online: https://nasasporttraining.wordpress.com/2016/07/21/jpss-satellite-products-for-extratropical-transition/ (accessed on 20 August 2020).
- Lindstrom, S. CIMSS Satellite Blog. Can You Use NUCAPS Soundings to Determine the Rain/Snow Line? Available online: https://cimss.ssec.wisc.edu/satellite-blog/archives/35383 (accessed on 15 June 2020).
- Duran, P.; Duran, E. The Wide World of SPoRT. SPoRT Provides Forecasts of Hurricane Isaias’ Landfall to NOAA’s Hurricane Research Division. Available online: https://nasasport.wordpress.com/2020/08/13/sport-provides-forecasts-of-hurricane-isaias-landfall-to-noaas-hurricane-research-division/ (accessed on 14 August 2020).
- Lindstrom, S. CIMSS Satellite Blog. Dry Air in the southwest Atlantic. Available online: https://cimss.ssec.wisc.edu/satellite-blog/archives/37767 (accessed on 30 July 2020).
- Duran, E. The Wide World of SPoRT. Exploring Daily Changes in Tropical Cyclone Temperature and Moisture using NUCAPS Satellite Soundings. Available online: https://nasasport.wordpress.com/2020/08/20/exploring-daily-changes-in-tropical-cyclone-temperature-and-moisture-using-nucaps-satellite-soundings/ (accessed on 21 August 2020).
- Blackwell, W.J.; Braun, S.; Bennartz, R.; Velden, C.; DeMaria, M.; Atlas, R.; Dunion, J.; Marks, F.; Rogers, R.; Annane, B.; et al. An overview of the TROPICS NASA Earth Venture Mission. Q. J. R. Meteorol. Soc. 2018, 144, 16–26. [Google Scholar] [CrossRef]
- Kalmus, P.; Kahn, B.H.; Freeman, S.W.; van den Heever, S.C. Trajectory-Enhanced AIRS Observations of Environmental Factors Driving Severe Convective Storms. Mon. Wea. Rev. 2019, 147, 1633–1653. [Google Scholar] [CrossRef]


© 2020 by the authors. Licensee MDPI, Basel, Switzerland. This article is an open access article distributed under the terms and conditions of the Creative Commons Attribution (CC BY) license (http://creativecommons.org/licenses/by/4.0/).
Share and Cite
Berndt, E.; Smith, N.; Burks, J.; White, K.; Esmaili, R.; Kuciauskas, A.; Duran, E.; Allen, R.; LaFontaine, F.; Szkodzinski, J. Gridded Satellite Sounding Retrievals in Operational Weather Forecasting: Product Description and Emerging Applications. Remote Sens. 2020, 12, 3311. https://doi.org/10.3390/rs12203311
Berndt E, Smith N, Burks J, White K, Esmaili R, Kuciauskas A, Duran E, Allen R, LaFontaine F, Szkodzinski J. Gridded Satellite Sounding Retrievals in Operational Weather Forecasting: Product Description and Emerging Applications. Remote Sensing. 2020; 12(20):3311. https://doi.org/10.3390/rs12203311
Chicago/Turabian StyleBerndt, Emily, Nadia Smith, Jason Burks, Kris White, Rebekah Esmaili, Arunas Kuciauskas, Erika Duran, Roger Allen, Frank LaFontaine, and Jeff Szkodzinski. 2020. "Gridded Satellite Sounding Retrievals in Operational Weather Forecasting: Product Description and Emerging Applications" Remote Sensing 12, no. 20: 3311. https://doi.org/10.3390/rs12203311
APA StyleBerndt, E., Smith, N., Burks, J., White, K., Esmaili, R., Kuciauskas, A., Duran, E., Allen, R., LaFontaine, F., & Szkodzinski, J. (2020). Gridded Satellite Sounding Retrievals in Operational Weather Forecasting: Product Description and Emerging Applications. Remote Sensing, 12(20), 3311. https://doi.org/10.3390/rs12203311