1. Introduction
Unmanned Aircraft Systems (UASs) have been recognized as a valuable new resource in practically all emergency services. According to [
1], “up to 2017, at least 59 individuals have been rescued by drones from life-threatening conditions in 18 separate incidents around the globe”. In Croatia, besides the army and police, emergency services such as firefighters and the Croatian Mountain Rescue Service (CMRS) make intensive use of UASs. CMRS is a leader in the use of this technology in emergency situations. They have been using UAS technology intensively for the last six years [
2]. At first, Unmanned Aerial Vehicles (UAV) were used for a terrain scouting and fast searching of areas of interest. Within a short time, this technology has been fully adopted and is now used intensively in all phases of SAR missions and on all types of terrain. In 2018, CMRS established a special UAS department. A new internal training and licensing program for UAS pilots has been developed and authorized by regulatory authorities. Forty-nine CRMS pilots successfully finished the program and have become licensed pilots. Currently, CMRS in total operates 40 UASs. By August 2020 alone, CMRS had detected and thereby rescued five people using drones.
The use of UASs, despite its evident advantages, has opened additional requirements. Besides the licensed pilots, the CMRS team also needs experienced personnel to process the information collected by the UAS. This primarily refers to the image processing acquired by UASs with a goal either of detecting lost persons or of finding some trace that may be helpful for the mission. How demanding this task is can be shown by the example of the search mission for the Pole Lukasz Dariusz, who became lost on 31 July 2020 on the mountain Biokovo. The SAR mission lasted for intensive 10 days, unfortunately without success. Over 340 rescuers and 6 drones were engaged in it. In the search procedure, drones take pictures of the terrain every 4 s, and within one flight they generate approximately 300 high-resolution images. More than 2000 images are generated per search day. The images are uploaded to the Cloud and analyzed by the CMSR personnel, namely people in the base, at home, and in the field. It is important to note that the processing of the aerial images of the Mediterranean karst landscape is very demanding due to the colors and shadows, as well as the number of different objects. The target objects are relatively small and often camouflaged within the environment, making detection a challenging and demanding task. Complexities of the images are shown in
Figure 1. Empirically, it has been determined that the person who analyzes images needs 5 to 45 s to process a single image, depending on the complexity of the composition. These numbers indicate that image analyses require many personnel as well as a relatively long processing time, and both present a considerable problem.
Regarding this issue, a research group from the University of Split, Faculty of Electrical Engineering, Mechanical Engineering and Naval Architecture (FESB), Croatia, has been intensively working on the development of image processing algorithms for person detection in the aerial images taken from drones in the Mediterranean karst landscape for the SAR missions. More than 10 years ago, a mean-shift-based algorithm was developed and implemented [
3]. This algorithm achieved a satisfactory level of detection and, by suggesting potential suspect locations in images, significantly simplified and sped up the visual inspection process. The drawback of this approach was its relatively long processing time as well as the relatively significant number of false detections that were counterproductive to the visual inspection process. In the next step, to overcome these disadvantages, we developed a completely new algorithm based on a visual attention algorithm that detects the salient or most prominent segments in the image [
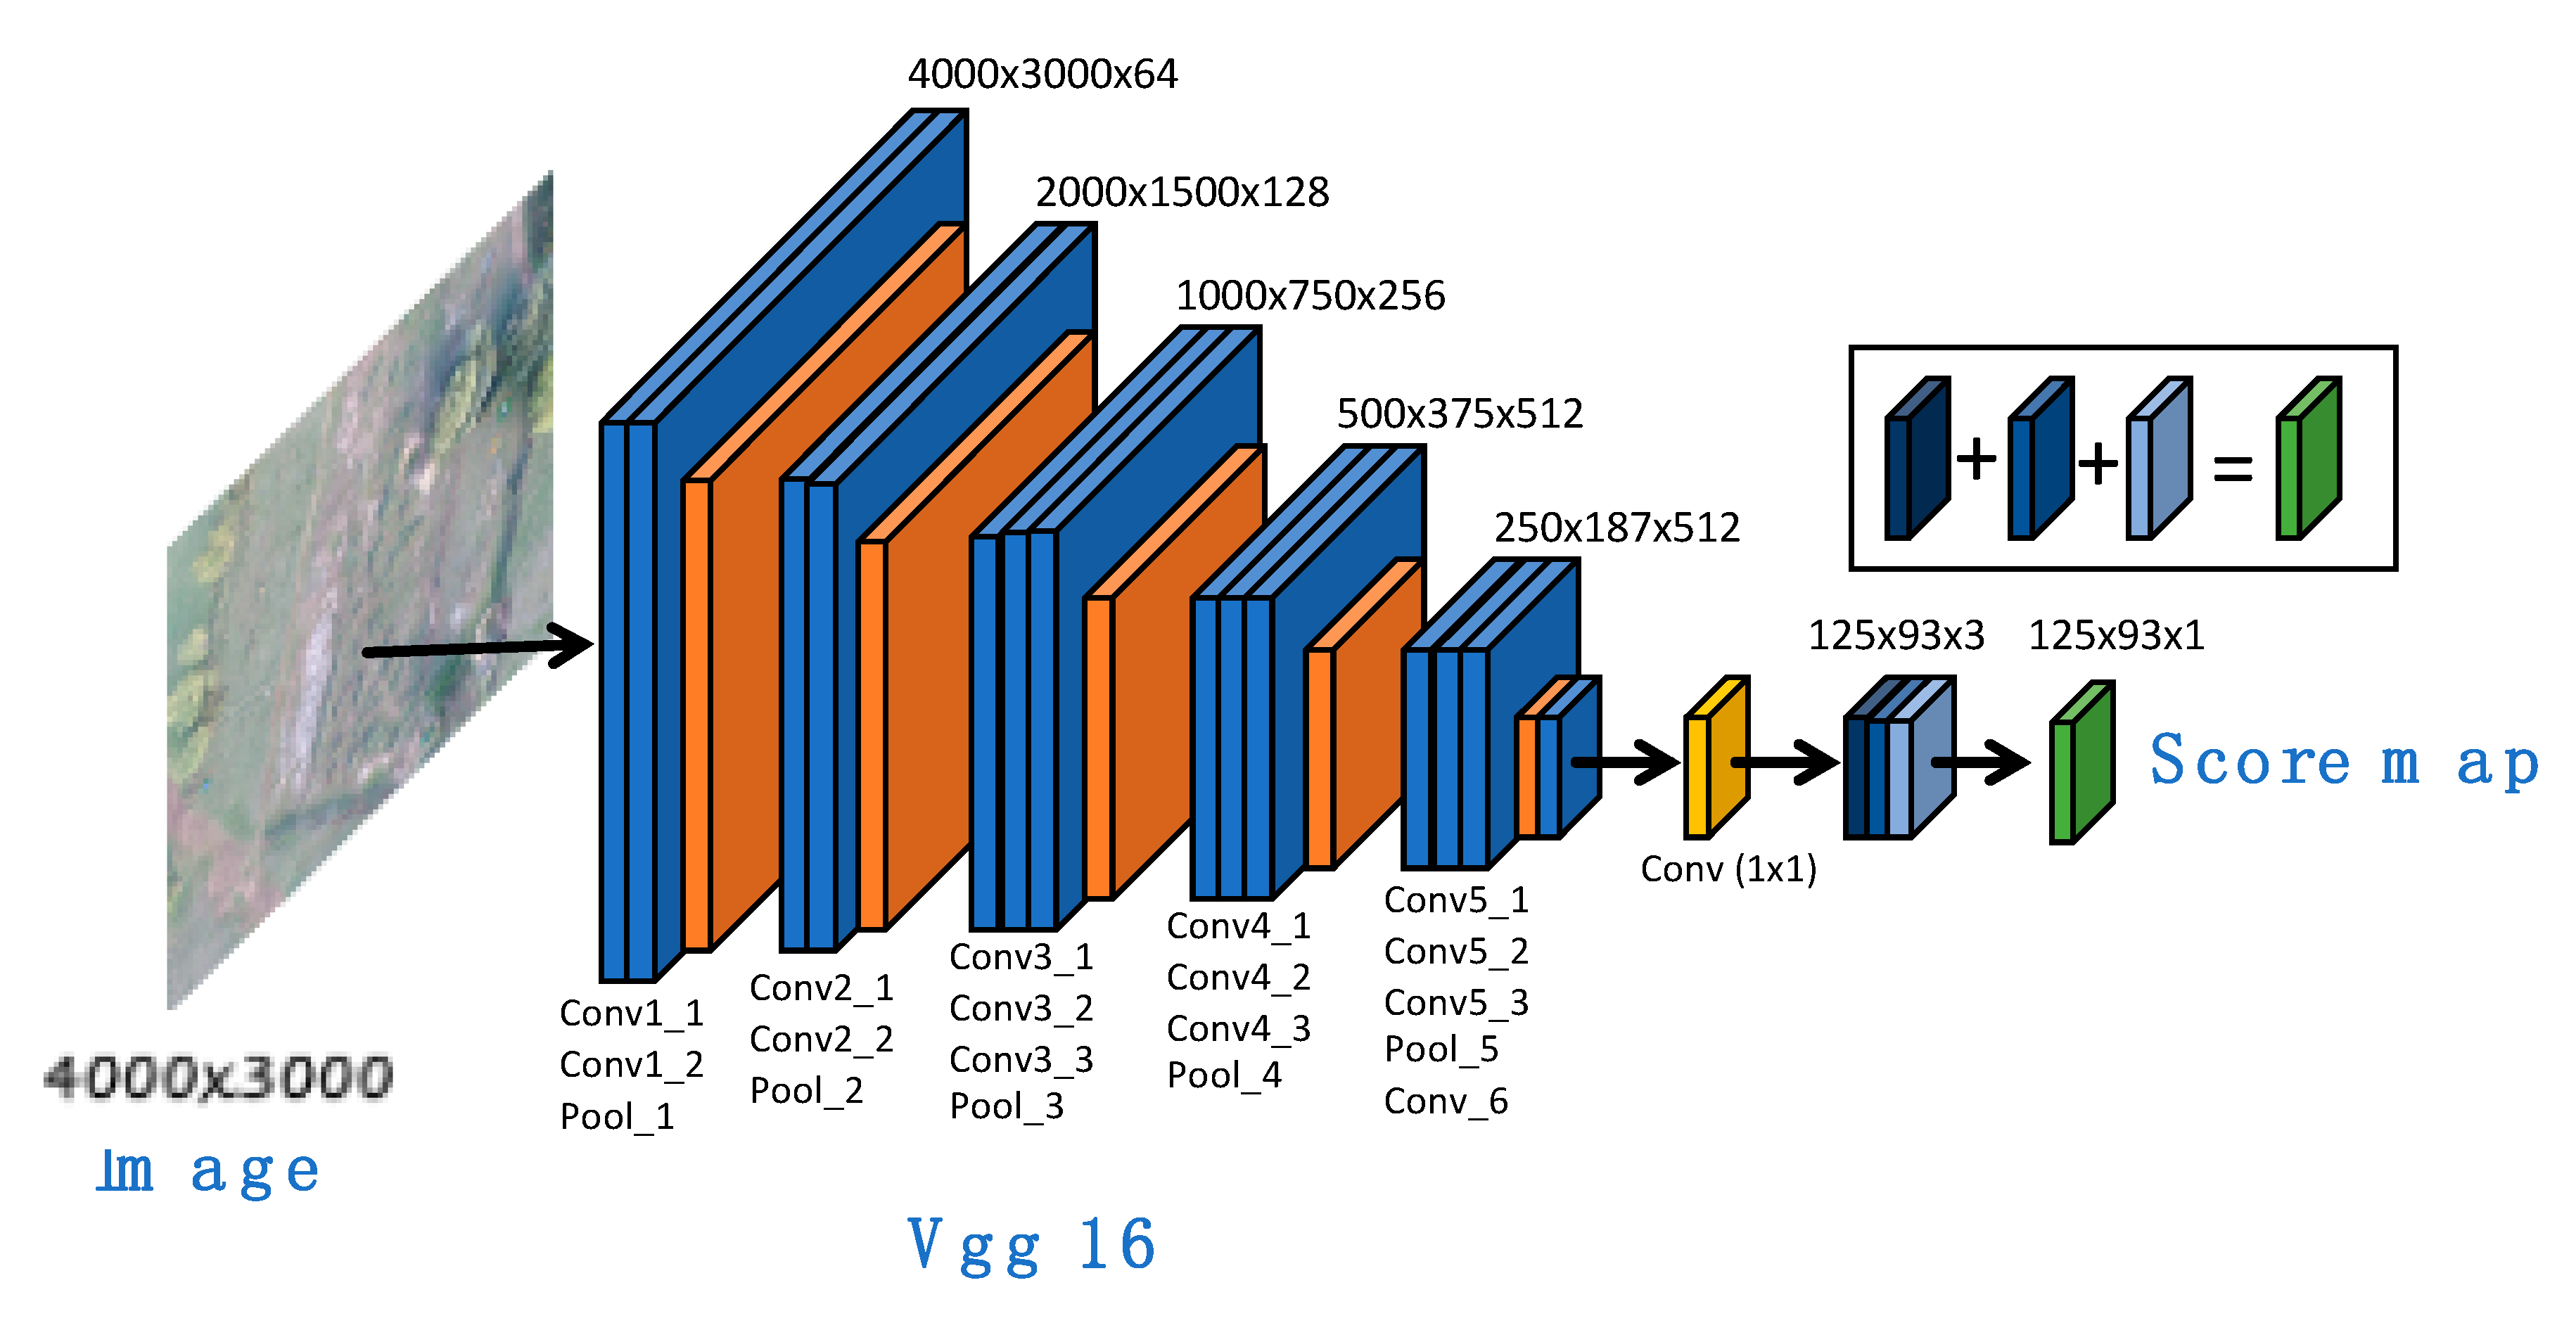
4]. The detected segments are afterwards processed/classified by fine-tuned convolutional neural networks (CNNs) to select the regions most likely to contain a person. We established a special database called HERIDAL for CNN training and testing purposes. The HERIDAL database contains over 68,750 image patches of people in wilderness viewed from an aerial perspective, as well as 500 labelled, full-size 4000 × 3000-pixel real-world images which all contain at least one person for testing purposes. In parallel at that time, we were working on the solution to this problem with the state-of-the-art Faster R-CNN algorithm [
5]. Although Faster R-CNN has shown excellent results in many complex computer vision detection problems, it expressed the problem of detecting smaller objects, which has been the subject of numerous scientific studies [
6,
7,
8]. Faster R-CNN has been trained on full-size images from the HERIDAL database. A comparison of the developed methods was made on the HERIDAL image database, and the following results were obtained [
4]: the mean-shift algorithm achieved 74.7% recall and 18.7% precision, Faster R-CNN 85.0% recall and 58.1% precision, while saliency + CNN 88.9% recall and 34.8% precision. Due to the great complexity of the images, in which it is difficult even for an experienced SAR operator to detect a person in the image, it could be concluded that the obtained results are extraordinary. This indicates that the proposed algorithms have great potential to be successfully applied within the SAR missions.
Despite the excellent results achieved by these algorithms, it is important to evaluate how effective they are in actual SAR missions; therefore, it is necessary to compare the efficiency of the proposed algorithms and the SAR operator. In actual SAR missions, the operator analyzes hundreds of images. With time, the operator’s attention decreases and the probability of oversight increases. This is not a problem for the algorithm. On the other hand, an experienced operator will probably spot a lost person or a potential clue in a new environment for which the algorithm may not be adequately trained. It is also important to keep in mind that the operator needs up to a half-minute to process the image, while the algorithm does so in less than a second. Furthermore, distributed processing across multiple GPUs makes mission processing time negligible. The importance of time in SAR missions does not need to be especially emphasized. Therefore, to evaluate the effectiveness of this technology in SAR missions, we have conducted additional research.
Based on the experience of CMSR, statistics of previous SAR missions, as well as statistics collected and published by the SAR services of other countries [
9], simulations of real situations encountered in SAR missions were designed. Typical terrains where SAR missions are conducted were defined, as well as clothes worn by people who have been lost, poses and places in which such people could be found, or where they could be hidden. All persons simulating lost persons were marked by a GPS locator for subsequent position labelling. The search mission simulation was performed with typical flight settings, a flight altitude Above Ground Level (AGL) of 50 m, and an image overlap of 40%. It was also considered that the simulations be carried out when certain weather conditions are met (very sunny, cloudy, etc.) as well as at certain times of the day (morning, noon, early evening). From the numerous simulations of SAR missions, the ones that best illustrate real situations were selected and added to the HERIDAL image database. Selected missions were processed by developed algorithms with the goal of further statistical evaluation, i.e., recall and precision calculation. It is important to highlight that, in real SAR missions, a large number of images contain no person on them. Those missions processed by the specially developed algorithm based on CNN with labelled region proposals, as well as non-processed missions, were added to the HERIDAL image database.
The final goal of this research is to estimate and compare the reliability as well as the efficiency of detecting a lost person by SAR staff and by the developed image-processing/artificial-intelligence algorithm. The remainder of the paper is organized as follows.
Section 2 provides a brief review of the relevant literature.
Section 3 describes the theoretical basis, particularities, and the procedure of SAR mission implementation. This is the basis for planning mission simulations to be used in the research. The algorithms used for person detection are presented in
Section 4.
Section 5 presents the experiment and the results of the study as well as discussion regarding the detection recall and precision between the expert and the proposed algorithms. This paper ends with the conclusions and proposals for further research.
2. Related Work
Person detection from an aerial perspective is a very complex computer vision task due to the wide range of possible object appearances caused by different poses, clothing color, lighting, and background [
10]. For years, researchers have developed different approaches that can identify objects [
11,
12,
13]. Standard object detection involves relatively large objects with sharp edges and corners. In UAV imagery, the objects are small, and we face image instability because the platform is moving. All these issues make this task very difficult. The standard approach for person detection generally addresses large object sizes within an image together with texture and shape information. One of the approaches that has been proposed is bimodal systems. A bimodal system is composed of thermal and optical images taken from UAVs to improve detection rate. Anna Gaszczak and Breckon [
14] used both thermal and visible imagery to develop a real-time person and vehicle detection system by fusing the two image sources. Rudol and Doherty [
15] also used thermal and visible imagery to find persons in different poses on the ground in video sequences. The first step is to identify high-temperature regions corresponding to human body silhouettes. After detection of corresponding regions, they analyze the visible spectrum using a cascade of boosted classifiers working with Haar-like features. In [
16] the authors proposed a real-time model for the detection swimmers in open water using unsupervised learning. Detecting humans from aerial images in [
17] was managed by pyramidal feature extraction of SSD for human detection and action recognition, while in [
18] the authors proposed a model for human detection based on color and depth data.
Transfer learning is a powerful machine learning technique that enables us to reuse an already trained neural network on our own dataset. This technique is particularly useful in situations where we do not have enough data; for example, remote sense images are a kind of data that are complicated to collect. In the literature there were attempts to overcome this problem by using transfer learning. The authors in [
19] proposed a model for semantic segmentation of remotely sensed images. The main problem was a lack of real-world images, so they used domain specific transfer learning. First, they trained the proposed model on a large dataset and then they used that model and re-trained it on a smaller dataset. The authors reported great performances of this technique. In [
20] transfer learning was used to accelerate the classification of remote sensing data. The authors reported that using transfer learning on larger and generic natural images datasets can outperform using transfer learning on small remotely sensed datasets. In [
21] the authors used transfer learning in a region-based CNN called a Double Multi-scale Feature Pyramid Network (DMFPN) where they used inherent multi-scale pyramidal features and combined them with low-resolution features and high-resolution features using transfer learning. The authors in [
22] proposed a deep neural network model for the classification of SAR images that does not require a large labeled dataset by using transfer learning. As we can see from previous papers, transfer learning has shown great potential in overcoming a lack of data for training deep learning models and represents a step towards strong machine learning. Mediterranean regions are characterized by very hot summers, and since the search missions are during the summer period, thermal cameras are not suitable for this kind of problem. In the previous study, throughout the IPSAR project, we used optical cameras for image acquisition. In one paper [
3], a method based primarily on the mean-shift segmentation algorithm was proposed. After segmentation is tuned for small segments, the heuristic rules approach is used, for example, using the sizes of segments and clusters to make decisions. The mean-shift algorithm was selected primarily because it had demonstrated good results regarding stability and segmentation quality. The algorithm is divided into two-stage mean-shift segmentation in order to reduce the high computational requirements and the quadratic computational complexity of the algorithm. This approach resulted in only a minor loss of accuracy. In [
23], the authors used the aforementioned detection model to conduct performance comparisons of the system on compressive-sensing-reconstructed images and original images, focusing primarily on image quality and information exchange. In [
24], the authors tried different approaches, applying and analyzing various salient detection algorithms to detect lost persons. In [
4], the authors proposed a two-stage algorithm approach based on salient detection and convolution neural networks. This approach showed promising results, but the false alarm rate was reported as an issue.
Labelled-image databases are usually used for the training and testing of deep neural networks and were also applied in our research. The research community has recognized the importance of the impact of the label errors (label noise) in training datasets on the model accuracy and have introduced works attempting to understand noisy training labels [
25].
In [
26], the authors aimed to obtain a better understanding of the similarities and differences in overt classification behavior—and thus, very likely, computation—between Deep Neural Networks (DNN) and human vision.
Our research addressed a completely different problem: the influence of the algorithm on the decision of the expert as well as the comparison of algorithm and expert accuracy. Such research has been conducted especially in bioinformatics as well as in medicine in computer-aided diagnostics.
In [
27], the authors used CNNs trained with a low number of Epifluorescence Microscopy (EFM) images representing biofilms of different bacterial compositions and compared the performance of CNNs versus human experts in correctly classifying new images. Obtained results indicated that neural networks achieved an accuracy of 92.8% compared to 51.5% by human experts.
In [
28], the authors compared the diagnostic performance of an artificial intelligence deep learning system with that of expert neuro-ophthalmologists in classifying optic disc appearance. They first trained and validated the CNN on 14,341 ocular fundus photographs from 19 international centers. The experiment was conducted on 800 new fundus photographs. The results of the CNN classification were compared with those of two expert neuro-ophthalmologists who independently reviewed the same randomly presented images without clinical information. The experiment showed that this deep CNN system’s performance at classifying optic disc abnormalities was at least as good as that of the experts. Similar research is presented in this paper with the significant difference that here it was necessary to design and carry out simulation of the missions on which the research will be conducted. The number of respondents is also much higher than in similar research, and thus the reliability of the experiment is better.
3. Design and Realization of Test Missions
The quality of this research significantly depends on the quality of the simulated missions on which measurements and result comparisons are carried out. Therefore, it is necessary to plan, conduct, and record test missions that are as close as possible to typical actual search missions. In this sense, as a first step, it is necessary to carry out analyses of the real missions in the Republic of Croatia as well as all around the world. This includes knowledge of the procedures and activities within the search mission as well as knowledge of the particularities related to the missing person. It is particularly important that the set of test missions contains as many realistic scenes as possible within the karst terrain with dense low vegetation, bushes, piles of stones, fissures, and sinkholes and also that it be conducted at the appropriate time of day with appropriate weather conditions and illumination. The simulated missing person must wear typical clothes, be set in an appropriate pose, and be placed within that terrain as realistically as is in real missions.
3.1. Characteristics of the Missing Person
Similar analyses were performed during the design of the HERIDAL image database. These data and analyses were extended to include the data needed to plan SAR mission simulations. The required data could be collected from statistics of the Croatian SAR team as well as from the literature. The book [
9] represents the starting point of SAR theory, in which the author analyzed and interpreted data obtained from the International Search and Rescue Incident Database (ISRID), which contains 50,692 SAR cases. Accordingly, subject types can be classified by age, mental status, and activity into a dozen broad categories like children (various age groups), older demented people, irrational, mentally challenged, and despondent people, hunters, hikers, and climbers.
Each category is characterized by specific behavior patterns that can manifest when a person is lost and that can help predict the missing person’s potential location and pose in the environment. Children frequently become lost because they are exploring or adventuring, take shortcuts, or are involved in fantasy play. When lost, they use a trail/road-following strategy or may hide intentionally because they are scared, sometimes simply sulking, but also to avoid punishment. Unfortunately, they are often dressed in clothes that fit well with the colors of the environment (green, brown, dark blue, or white) which makes them difficult to spot. They also have a much smaller projection and footprint in images compared to adults. Therefore, it usually very difficult to distinguish them from natural artefacts, especially in low lighting as well as in high-contrast conditions.
Older people are usually found near a road or path where they become stuck in a bush. They often become tired and seek shelter, most often from the sun in summer and from rain and wind in winter. Demented people usually want to return to the locations where they were in their youth, the hamlets where they lived, the meadows where they kept cattle, or the forests where they collected wood. Like all older people, they often become tired or scared and seek shelter or just become stuck in a bush. They are commonly dressed in dark colors (black or gray), and therefore when they are sitting or lying in shadow, it is very hard to detect them.
Climbers and mountaineers are the categories that are most often the subject of searches in our areas. They often travel considerable distances to ascend prominent peaks or to climb rocks. The biggest risks for these two categories are an underestimation of the terrain difficulty and the time required to complete the climb, as well as weather conditions (especially during summer). It is not uncommon for them to be completely unequipped. Overstrain, trauma, and injuries from falls are very frequent. Experienced hikers are dressed in brightly colored clothing and therefore easy to detect. Unfortunately, many amateurs are dressed in white clothes, which makes them difficult to spot on rocky terrain or in camouflage clothing, which makes them difficult to detect on bushy terrain. They often experience accidents and severe trauma, in which they remain immobile in various lying or sitting positions. Hunters behave similarly to mountaineers. The most common reason they need help is an injury, fall, or gunshot wound. Unfortunately, they are usually dressed in camouflage equipment, which makes them difficult to detect in aerial images.
Statistics data about the location where certain types of missing persons have been found are shown in
Table 1.
3.2. SAR Mission Procedure
The activities of SAR teams are carried out according to strictly defined procedures. These procedures regulate aspects such as the size of the search team, its operational readiness and equipment, their location within the terrain, and how the terrain will be searched.
After receiving a call for help, the regional CRMS headquarters collect initial data regarding the missing person and the area of disappearance. The degree of urgency is determined based on various criteria. Priority is given to children and the elderly, as well as persons suffering from some diseases. Poor weather conditions, demanding terrain or environment, and a higher number of missing or injured persons contribute to an increase in the urgency of the reaction.
When the call is evaluated to require intervention, it is forwarded to the local CMSR team, which gathers members to conduct the search. A search manager is appointed, and the location of the base camp where all participants will be gathered is determined. Choosing a camp site is very important because it must be close to the search area, possibly with good mobile signal coverage and relatively isolated from visitors. The base camp is built around command vehicles that have the necessary ICT equipment. Improvised command vehicles are commonly used at first until a real one arrives.
In the meantime, detailed information about the subject is collected. Information such as gender, age, description of physiognomy, various interests, hobbies, time and the place of last sighting, appearance and description of clothing, health, and mental condition are just some of the valuable pieces of information that can help searchers to categorize a lost person into certain categories. Separate interviews are conducted with family members, friends, acquaintances, and people who last saw the missing person.
After the base camp is established, in accordance with the characteristics of the terrain and the lost person type, the area around the point where the lost person was last seen (Point Last Seen; PLS) is searched. The goal is to find the missing person as soon as possible or, if this is not the case, to find traces that would direct further search. UASs are regularly used in this initial phase of the search mission.
While the initial search of the terrain around the PLS point is being carried out, the search manager prepares a search plan. The area around the PLS is divided into zones according to terrain characteristics as well as the probability that a lost person could be found in it (
Figure 2). Available SAR resources, personnel, dogs, and UASs are allocated to each zone. Their task is to search a zone and report results to the search manager.
For the area to be searched by the UAS, a flight plan is made using the appropriate mission planner software, while sometimes the drone is operated manually. The drone pilot monitors a video from the drone to detect a missing person or some trace. In parallel, high-resolution terrain images are taken for post-processing. After the drone completes the mission, these images are either inspected on-site at the base camp or sent over the mobile network to the Cloud, where they are processed by CMRS members. In both cases, there are drawbacks. In the SAR base camp, the operators do not have adequate equipment (large monitors, powerful computers), and they are usually not trained enough because they are local members. Of course, their tiredness should be also considered. A high-bandwidth mobile network is often not available at search locations, which is why the upload of high-resolution images to the Cloud is almost impossible from the base camp.
If the search achieves no result, then the zones that may not have been searched with a high degree of reliability due to terrain characteristics are detected and searched again but much more carefully. A new zoning that covers a wider area also must be constructed. The SAR mission procedure is presented in the flowchart in
Figure 3.
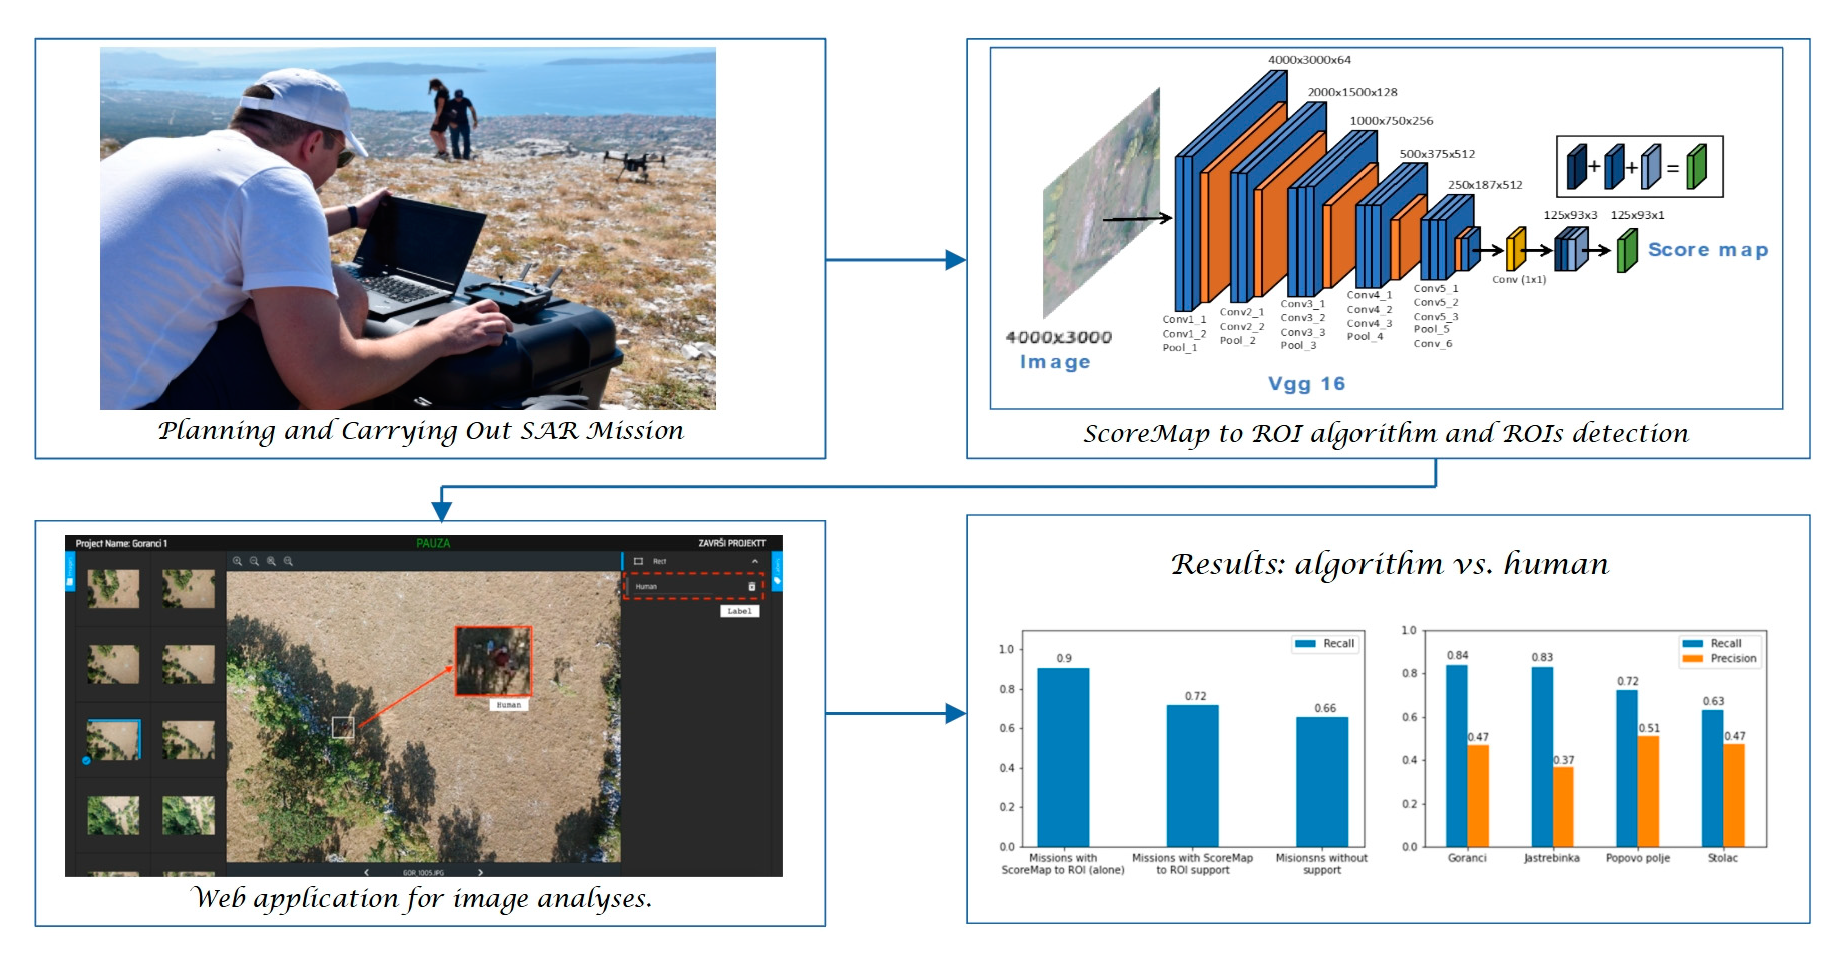
3.3. Planning and Carrying Out SAR Mission Simulations
According to previous considerations, the research team at FESB has prepared and recorded a total of 36 SAR mission simulations. In the preparation phase of each simulation, the subject type and his or her pose was selected, the terrain was carefully analyzed, and accordingly, the locations where the missing persons were to be placed were selected. Depending on the selected location, weather conditions, and time of the day, the appropriate missing-person’s clothing was chosen. Once the person was placed in the selected location, the search phase began. Using the flight planning software UgCS (
https://www.ugcs.com/), the search area, flight parameters (drone altitude and speed), and points at which the shooting were to be performed were defined. These settings were uploaded to the drone that conducted the search mission. We were using DJI Phantom 3 Pro and MAVIC PRO drones. After the search was done, the images were reviewed on-site to determine their quality as well as the quality of the simulation. If necessary, modifications to the search scenario were made or a completely new scenario was generated, and the mission was resumed. Usually, four to five mission simulations were made at each location. Afterward, those that best suited the actual search mission were selected and added to the HERIDAL image database.
The preparation as well as the carrying out of the search mission are presented in
Figure 4.
Among all the performed missions, only four were selected for this experiment. They are from the Herzegovinian region at locations where, according to the experience of the local SAR service, rescue missions are very common.
Table 2 presents their basic information: number of persons, number of images with persons, number images without persons, the total number of images, and weight of the mission. The selected missions were from the areas of Stolac, Goranci, Jastrebinka, and Popovo polje. In the mission Goranci, the total number of persons was five within five different images. In missions Popovo polje and Stolac, one image contained more than one person. The total amount of images per mission ranged from 47 to 54 images. The number of persons per mission ranged from 5 to 11. Missions were also categorized according to terrain structure. The weight of the Stolac mission is “hard” because of the non-uniform terrain structure with rocks, low vegetation, and shadows. Pictures from the Jastrebinka and Popovo polje are mostly a uniform type of terrain with relatively dense vegetation, so the weight of these missions is “medium–hard”.
6. Discussion
An analysis of the results and discussions are presented in this section.
The results obtained by the developed ScoreMap to ROI algorithm are the basis for further analyses. They are presented in
Table 3. The recall of the algorithm was about 90%. Although the algorithm managed to detect almost all the people, it generated many false alarms. The best results were achieved on the Goranci and Jastrebinka missions, where the recall was 100%. A slightly worse result was achieved on the Popovo polje mission, where only one person was not detected. False negative examples are presented in
Figure 11, indicating how difficult it is in some situations to detect people in aerial images. A person from
Figure 11a is in occlusion, and only parts of his clothing and arms are clearly visible. In
Figure 11b, a person is dressed in grey clothes and black pants and it is very difficult to distinguish him or her from the environment, while in
Figure 11c, the person is also in occlusion.
False positive examples presented in
Figure 12 show how it is difficult or sometimes even impossible to distinguish objects within an image. In
Figure 12a,c, the algorithm, due to the shadow, made a wrong conclusion. In
Figure 12b, stone and a blue plastic bag create an object that is almost impossible to distinguish from a human.
It follows the analysis and the discussion of the results obtained by the experiment presented in the previous chapter. This is the main contribution of this paper.
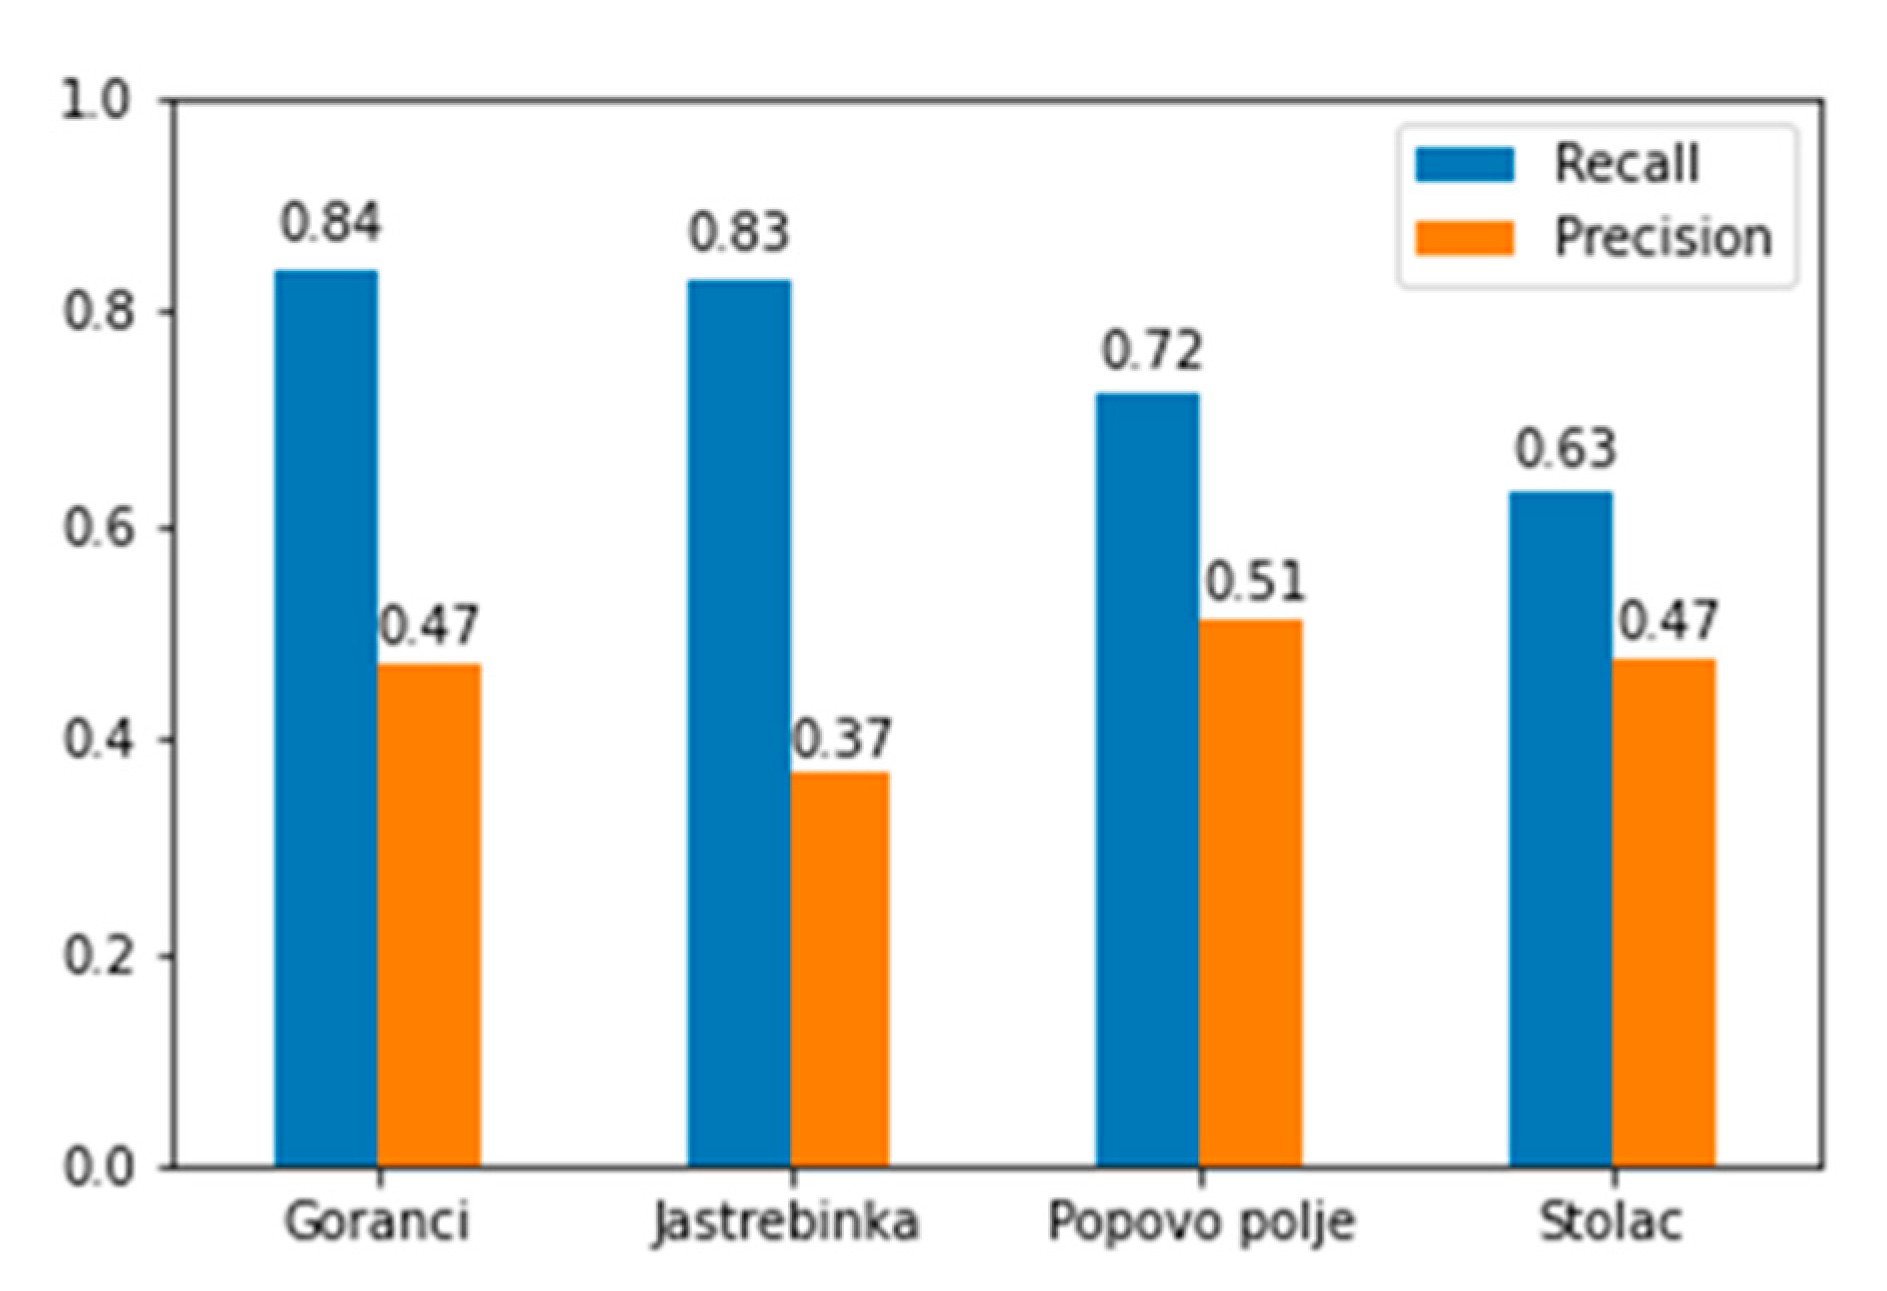
According to the
Figure 13, the best recall was achieved on the missions of Goranci (84%) and Jastrebinka (83%). In the Popovo polje and Stolac missions, participants achieved a slightly worse recall. The recall in Popovo polje was 72% and 63% in Stolac. Participants achieved the worst recall on the Stolac mission as did the ScoreMap to ROI algorithm, which is to be expected since the experts assessed this mission as very difficult, as shown in
Table 2. In general, the detection results are consistent with the complexity of the missions given in
Table 2.
We have participants who achieved a very high recall of 100% in a relatively short time of inspection. On the other hand, some of the participants spent a lot of time on inspection, and they achieved a quite poor recall of less the 20%. With these results, we cannot confirm the fact that participants will have better recall if they spend more time on the inspection. These results are expected and indicate that the reliability of the detection is strongly influenced by the experience of the observer.
Analysis of
Figure 14 shows that the best recall, 76%, was achieved on the Stolac missions. These results were not expected, as the experts assessed this mission to be very hard due to the structure of the terrain. This is contrary to the detection results of the same missions with the support of ScoreMap to ROI algorithm, where the worst recall was achieved. This result may be explained by the fact that people mostly focused on the ScoreMap to ROI proposals and did not focus enough on other parts of the image.
In the missions without support, the worst recall, 54%, was on the Popovo polje mission. In general, the detection results were not quite consistent with the complexity of the missions estimated in
Table 2. As in the previous case, it is not possible to relate the relationship between the time spent on image inspection and the recall of detection, and the same conclusion holds.
According to the
Figure 15, the participants achieved slightly better recall in missions with the ScoreMap to ROI support compared to missions without support, as presented in
Figure 12. Recall in missions with the ScoreMap to ROI support was 72%, and in missions without support, it was 66%. The average precision in missions with the ScoreMap to ROI support was 46%, and in missions without support, it was 53%. Participants made fewer mistakes if they performed the inspection without support, but they had a worse recall, which in this application is more important.
From
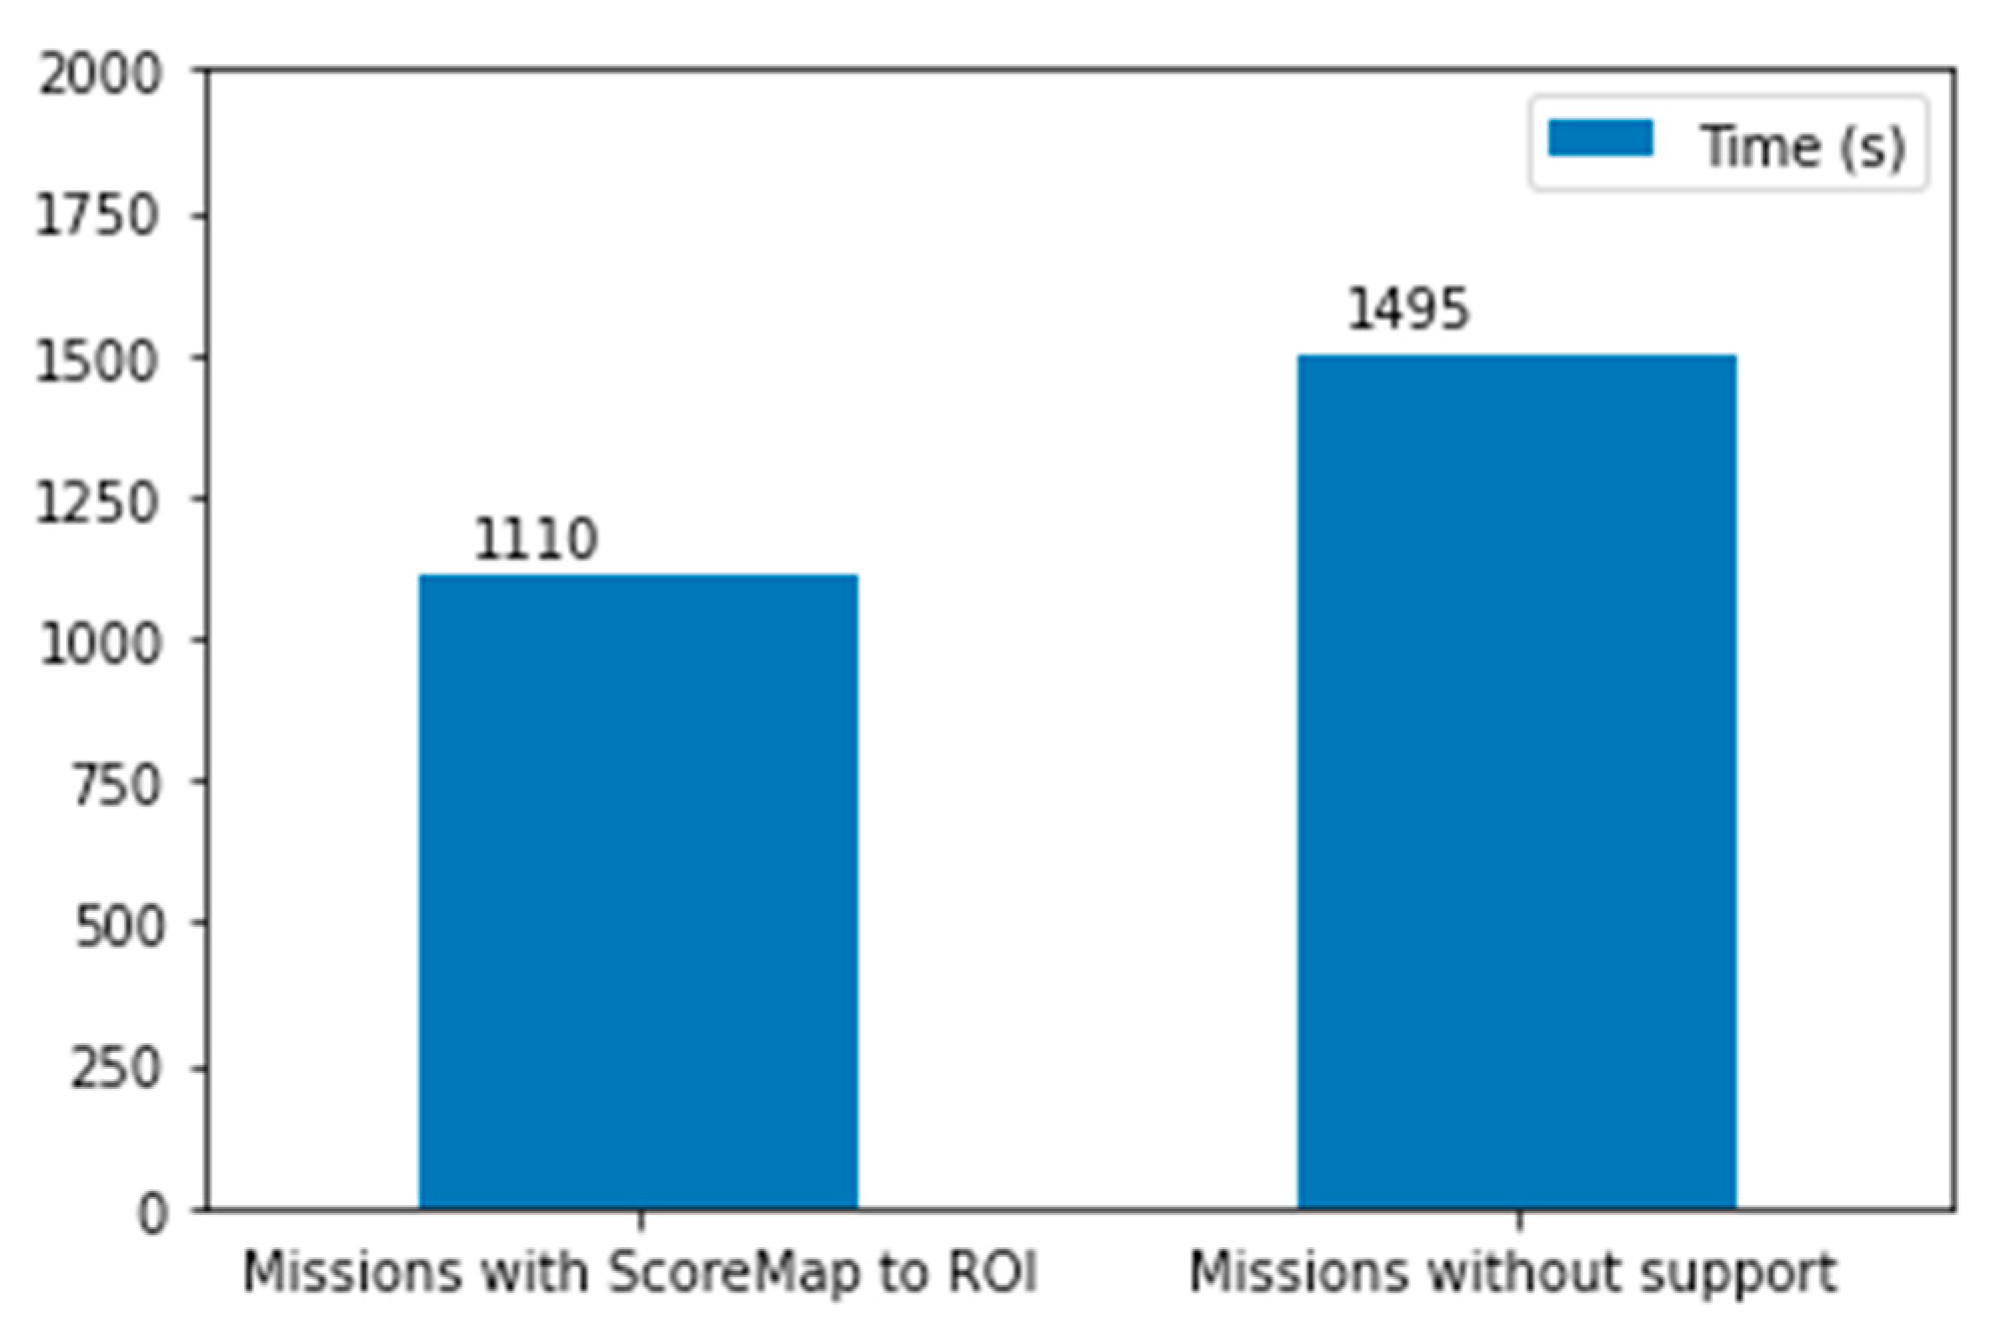
Figure 16 we can conclude that users with the Score Maps to ROI performed the inspection much faster. The average inspection time for ScoreMap to ROI missions was 1110 s, and for missions without support it was 1495 s. Inspection time was about 30% faster in the missions with the ScoreMap to ROI support. Two conclusions could be drawn. One is that due to the already pre-processed images, their analysis is carried out faster, which is positive. On the other hand, the downside is that apparently the participants conducted the analysis with less attention and in some cases superficially.
Analysis of
Figure 17 shows that the best recall achieved by the ScoreMap to ROI algorithm was 90%, while the recall achieved with the ScoreMap to ROI support was much worse, 72%. This indicates that the algorithm can recognize very difficult cases, which could be easily overlooked by a less experienced observer. This is a confirmation that in real SAR missions, where images are often analyzed by less experienced searchers, mainly volunteers, the proposed algorithm could significantly contribute to the reliability of detection. Participants analyzing the missions without support achieved the worst recall of only 66%. This is a verification that the algorithm contributes a lot to the detection of people in aerial images.
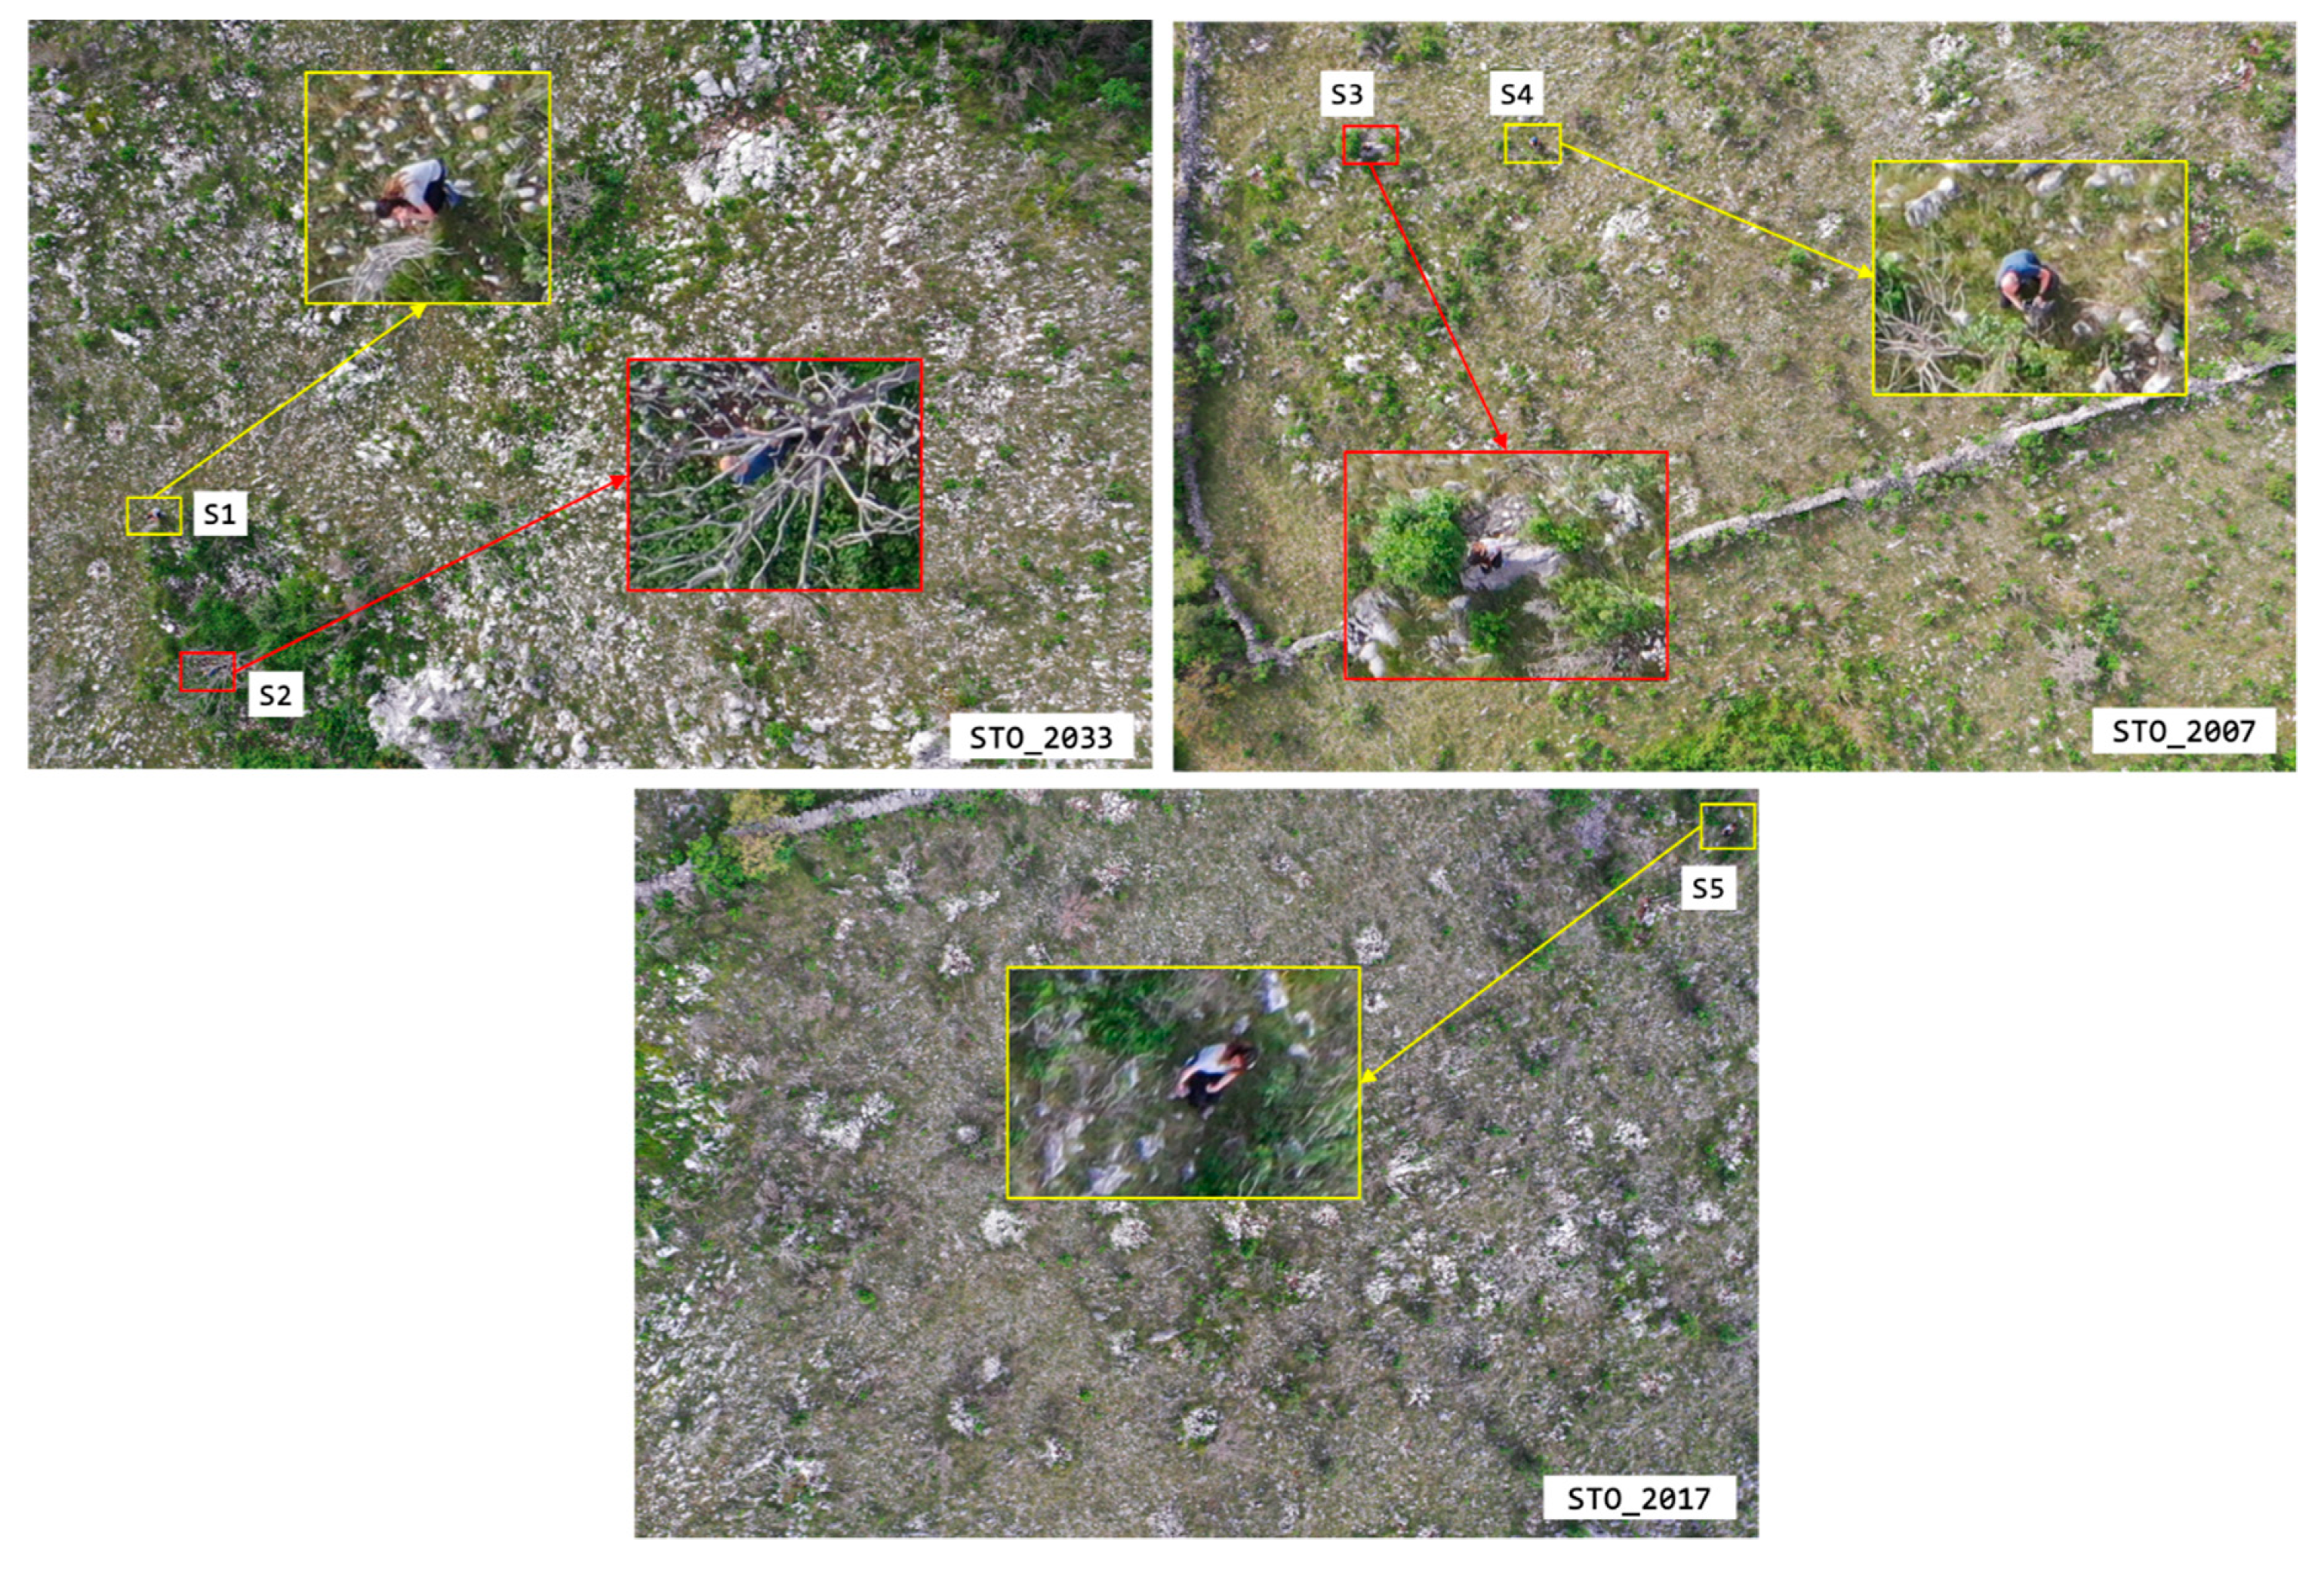
However, the fact that the participants did not recognize particular labelled persons in the picture requires additional analysis. Therefore, the labelled images with the lowest recall, presented in
Figure 18, were additionally carefully examined. The ScoreMap to ROI algorithm did not detect person S2 in the image STO_2033 as well as person S3 in the image STO_2007, labelled in red color, while the others S1, S4 and S5, labelled in yellow color, were detected by the algorithm. As expected, the worst recall was achieved in the images with the ScoreMap to ROI support where the persons were not detected by the algorithm. Moreover, these persons had a much worse recall compared to those without the ScoreMap to ROI support. The results are presented in
Figure 19. For example, the recall of the person S2 was only 19%, while inspection of the same image without the ScoreMap to ROI support was 44%. This could be explained by the fact that people are most focused on the algorithm proposals and do not pay enough attention to the rest of the image. This image contains two humans, S1 and S2. The human S1 was recognized by the ScoreMap to ROI algorithm and therefore has much better recall.
Furthermore, the results obtained for person S5 in the image STO_2017 are very interesting. This person had a very low recall in the mission with the ScoreMap to ROI support of 50%, although it was detected by the algorithm. The explanation is that the person is at the very edge of the image. If the participant is not concentrated enough, the label could be easily omitted. In addition, it is natural during the analyses to be focused on the center of the image. On the other hand, in missions without the ScoreMap to ROI support, participants are more concentrated and analyze the image in more detail. This is verified by the data regarding the average time spent on image analysis. The participants spent up to three times as much time analyzing those images without the ScoreMap to ROI support.
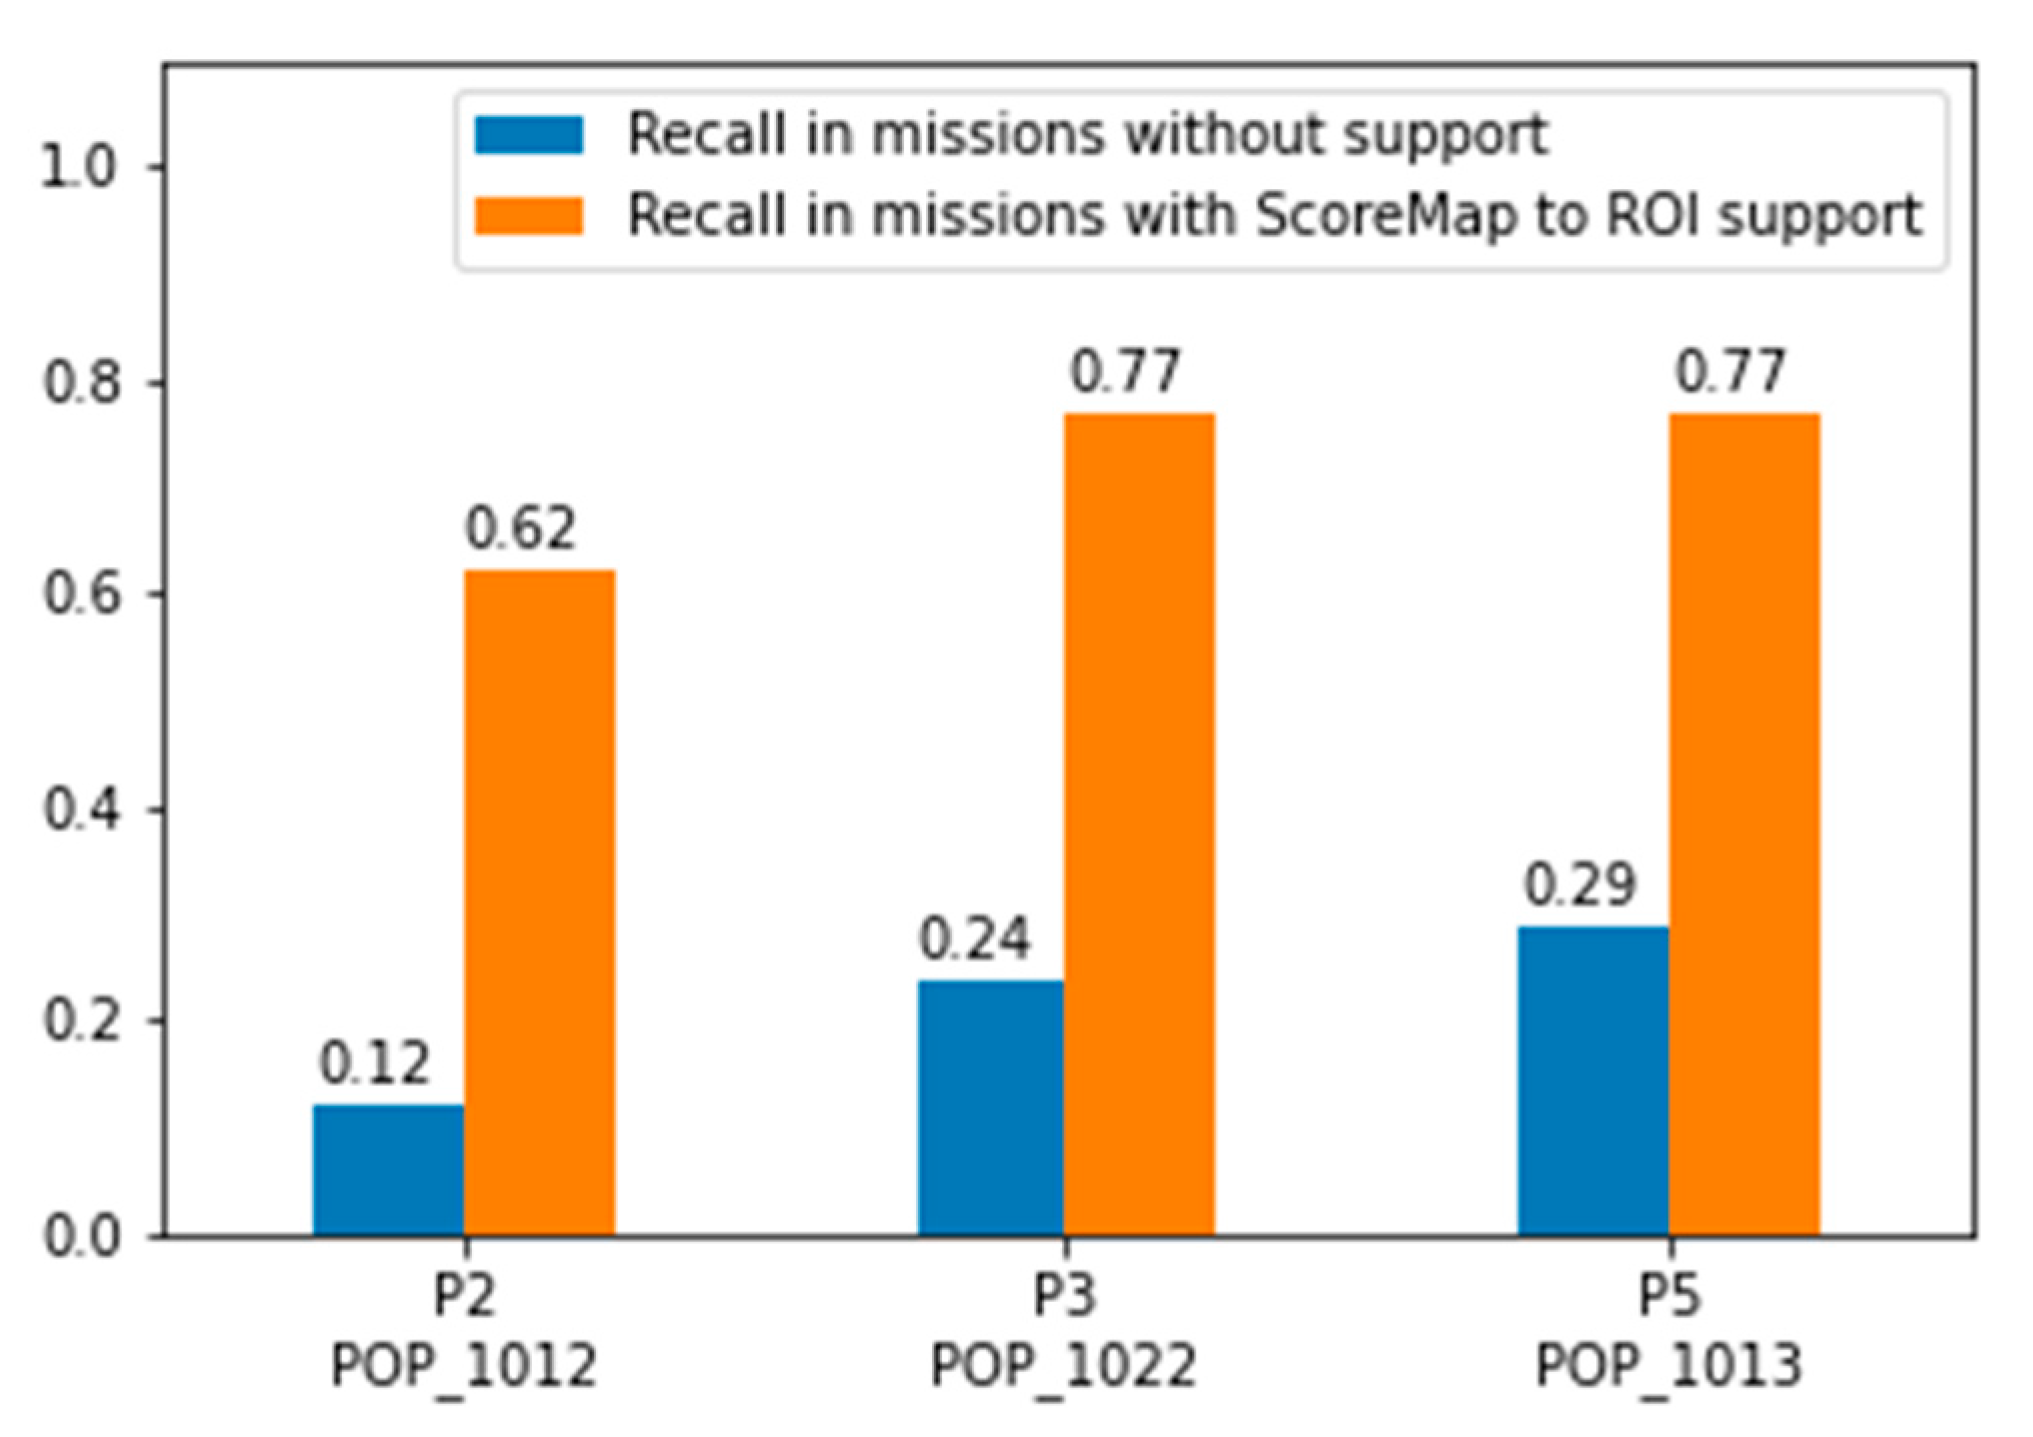
Regarding images presented in
Figure 20, it is important to emphasize that the ScoreMap to ROI algorithm successfully detected the persons in all of the images. It is interesting to comment that the person P2 in image POP_1012 had the worst recall of only 12%, but in other images the recall was not much better. For the algorithm, person detection in these examples is not a problem, since all of them are in the open field and in the poses for which the algorithm has been trained. On the other hand, for the person who analyzes these images, this is a difficult visual inspection task because the people in these pictures are wearing black or white clothes and in some way blend with the environment, so it is very difficult to distinguish them from shadows or stones. This provides more evidence of how useful such an algorithm could be in SAR missions. Moreover, the recall in all these images analyzed with the ScoreMap to ROI support is relatively low. Additional analysis of these results shows that, for the images where two persons are present and labelled, the person who analyzes these images often detects only one person. This could be also explained by the lack of concentration as well as the wrong assumption that only one person is present in the image. This is also an explanation for
Figure 13, where the participants did not detect all the labelled persons.
Figure 22, as expected, shows a large difference in the quality of detection achieved by the qualified SAR experts compared to the average SAR member. Furthermore, although image processing and artificial intelligence algorithms increase accuracy and reduce detection time, these analyses indicate that it is very important to work on the education of SAR members who analyze these images.
Finally, this research has shown that the application of image processing algorithms and artificial intelligence for human detection on aerial images taken in SAR missions achieves better results compared to the average SAR searcher, thus increasing the likelihood of finding a missing person.
7. Conclusions
This paper addressed the problem of comparing the accuracy of human detection in aerial images taken by UASs in SAR missions between an algorithm based on deep neural networks and an SAR expert. For the purpose of the research, test search missions were planned in accordance with the experiences and statistics of the CMRS service as well as the data available in the world literature. Thirty-six test missions were recorded and added to the already-existing HERIDAL image database, where over 68,750 image patches of people in wilderness viewed from an aerial perspective, as well as 500 labelled, full-size 4000 × 3000-pixel real-world images that all contain at least one person are stored. All planned, completed, and recorded missions were processed by a specially developed image-processing algorithm based on deep CNN, named ScoreMap to ROI. The algorithm is described in this paper. A web application has been developed with which experts can analyze recorded missions. Four missions were offered for analysis, two of which were processed and labelled with the ScoreMap to ROI algorithm, while the other two were unmarked. Forty-nine experts analyzed proposed missions, and all data regarding processing were stored in the database. Analyses of the obtained results were performed, and they indicate that the ScoreMap to ROI algorithm achieves better recall compared to the average observer. An observer who processed already-labelled missions using the algorithm also achieved better recall and precision compared to an observer who processed the missions that were the same but unlabeled. This experiment proved the effectiveness of image processing algorithms as support to SAR missions.
In future research, the focus will be on the modification and implementation of the developed algorithm on edge devices in real time. In this way, the processing will be performed on a UAV, and parts of the image detected as regions of interest can be transmitted in real time to the operator for inspection. This would significantly increase search efficiency.


