1. Introduction
Over the past decade, earthquakes have occurred frequently in the world, resulting in great loss of human life and property. Among the typical characteristics of seismic damage information, building damage is regarded as the most important sign of an earthquake disaster. Thus, the accurate acquisition of damage information of earthquake-damaged buildings right after an earthquake can provide technical support and a basis for decision-making for post-earthquake rescue and command and post-disaster reconstruction [
1].
The traditional means of obtaining seismic disaster information is field investigation. Although this method is very reliable in terms of acquiring information, it has disadvantages in some aspects, such as heavy workload, low efficiency, and a lack of timeliness. With the rapid development of remote sensing technology, technical methods based on remote sensing data have become important in accurately understanding natural disasters and promptly conducting disaster assessment [
2,
3]. Earth observation from space, characterized by not being limited by time and geography, wide coverage, accuracy, and objectiveness, has the advantages of complete, all-weather dynamic monitoring [
4]. Moreover, high-resolution remote sensing data can reflect the details of surface features. The rapid development of remote sensing and information technology provides rich data sources for accurate and rapid post-earthquake disaster assessment, thereby enabling in-depth research on disaster prevention and mitigation [
5].
A conventional remote sensing device can obtain only a single perspective of image features and plane geometry information of objects on the earth’s surface through nadiral imaging. However, the obtained information is limited by the imaging conditions; the device is unable to obtain damage information of buildings and crack information of building walls at night [
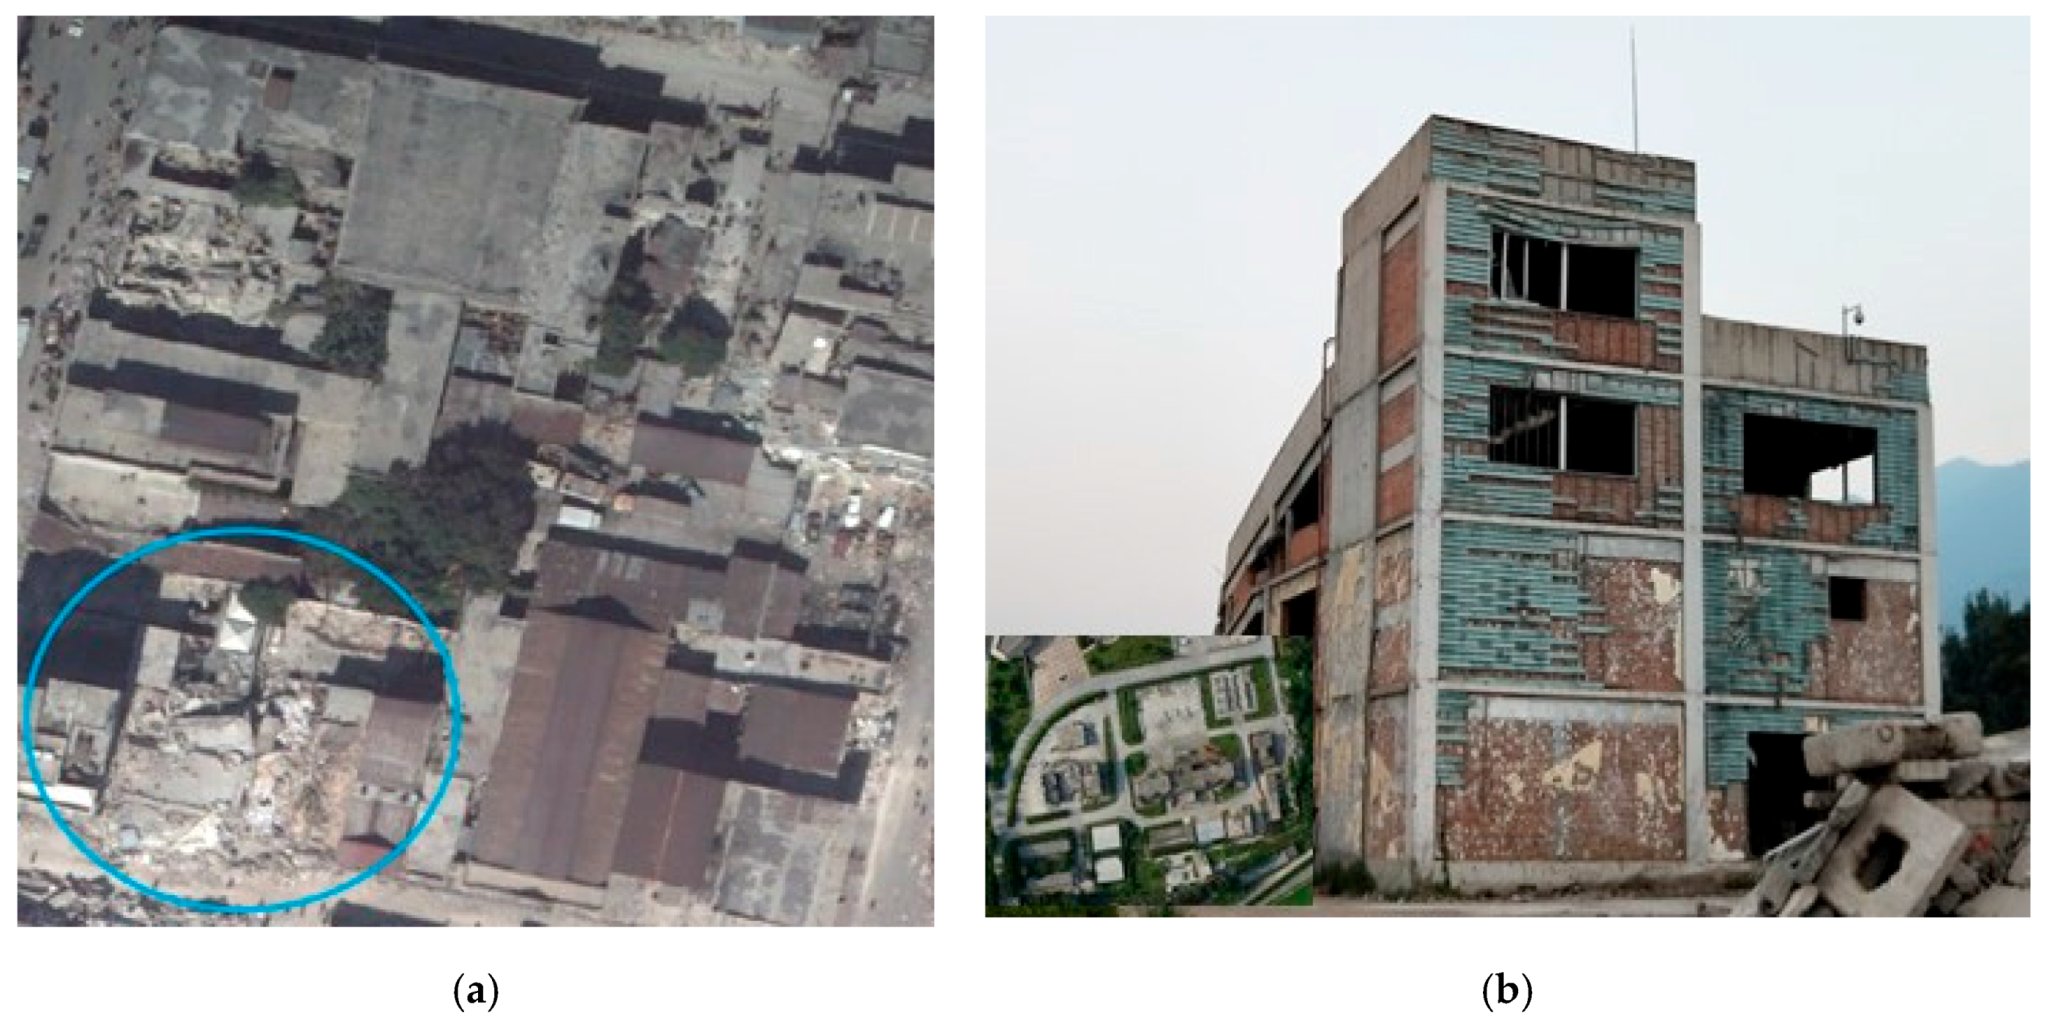
6]. As shown in
Figure 1a, severely damaged buildings with large cracks appear intact or only slightly damaged in a nadiral remote sensing image. As shown in the ground photo of
Figure 1b, a seriously damaged and oblique building appears intact in the nadiral remote sensing image. Failure to extract the building facade and 3D information prevents timely emergency rescue due to the lack of reference information. Furthermore, the lack of quick emergency response capability at night makes it difficult to accurately assess structural damage to buildings.
With the development of multiple platforms for remote sensing and improvements in image resolution, in addition to the large amounts of data and artificial intelligence, cloud computing, and other cutting-edge technologies, the recognition of ground objects based on remote sensing images has made great progress. Accordingly, the combined application of remote sensing and improved technologies has become an important means for emergency response to earthquake-induced disasters and post-earthquake disaster assessment [
7,
8].
A low-altitude remote sensing system for unmanned aerial vehicles (UAVs) has extensive applications, oblique photography [
9,
10] has become highly integrated and lightweight, and ultramicro oblique technology has emerged as required by the times. Accordingly, here we establish a 3D model [
11,
12] conforming to the principles of human vision based on multi-perspective imaging of an ultramicro oblique photography system, which provides high-resolution structural and textural information of single buildings and residential areas for disaster relief teams [
13,
14]. By applying a combination of infrared thermal imaging technology [
15], the temperature field distribution on the external walls of buildings is determined by detecting the radiation energy on the surface of the walls to identify cracks and eliminate hidden dangers after the disaster.
A technical system is further established to identify the structural state of post-earthquake buildings (
Figure 2) by combining a 3D model of oblique photography with infrared thermal imaging data based on satellite and aerial remote sensing data. This system solves key technological issues ranging from the acquisition and processing of multi-source data to the rapid identification and measurement of the post-earthquake state of buildings, thereby providing technical support for emergency monitoring and evaluation of post-disaster building damage.
3. Methodology
3.1. Experimental Data and Design
Since traditional two-dimensional images cannot reflect structural damage information directly, it brings certain security risks to rescue efforts. Constructing a 3D model to provide a high-resolution structural and textural information will allow for a more comprehensive detection of the damage. At present, there are no effective systematic methods for detecting building cracks; most of them rely on manual observation, that is, visual search for wall cracks. However, this method is inefficient and not timely, which means great limitations in practical application, and it cannot directly observe walls with a complex surface structure. Based on single UAV 4K imaging, it can only qualitatively judge whether there are collapses or large cracks, but it cannot quantitatively evaluate the degree of damage to the building. To extract structural and wall crack information, a combination of ultramicro tilt images and infrared thermal images is used to carry out emergency monitoring and damage evaluation, and automatic integration of the damage information. This plays an important role in emergency rescue at night.
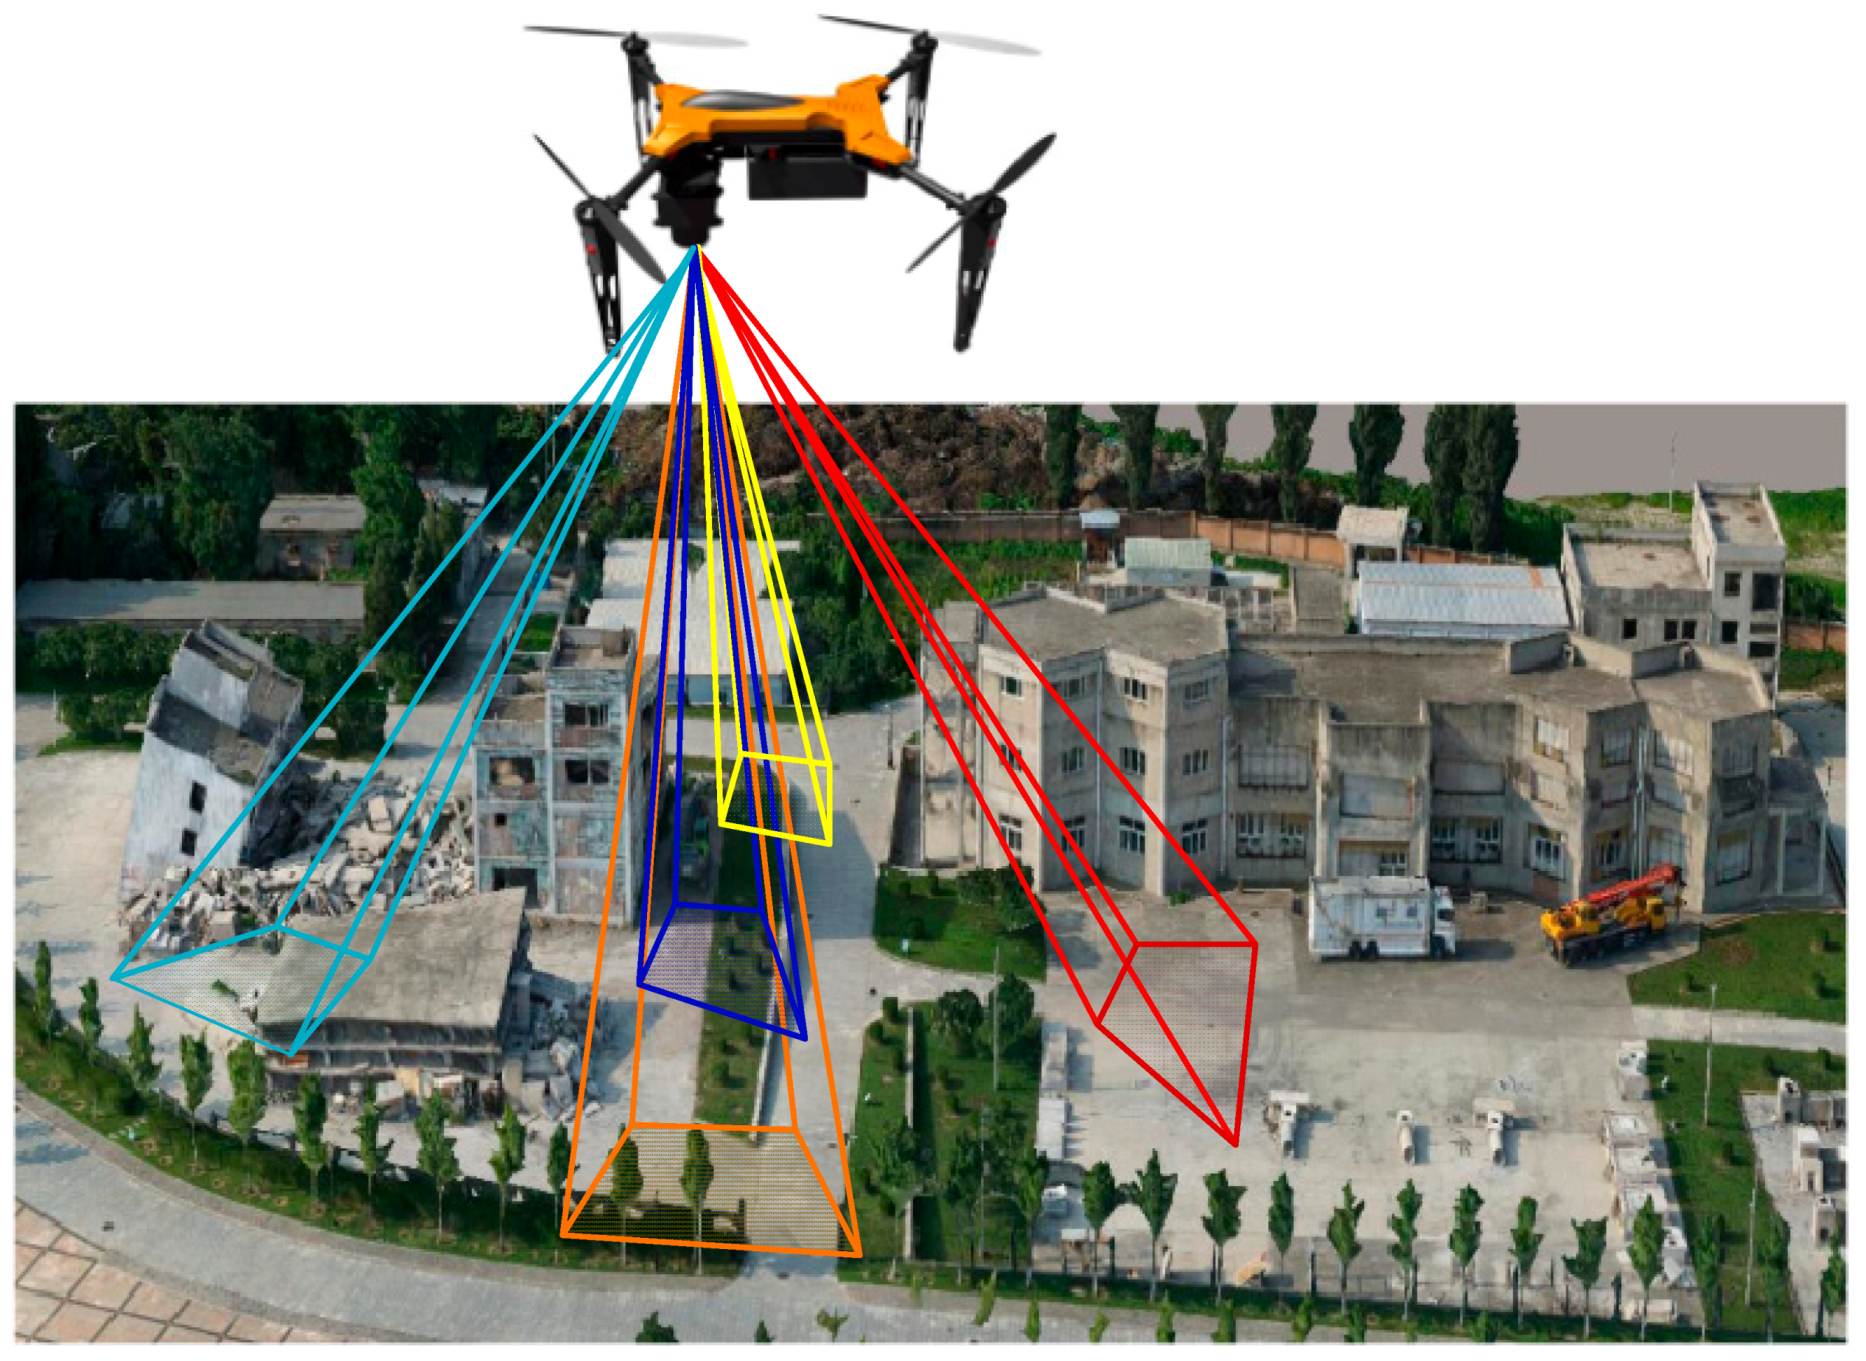
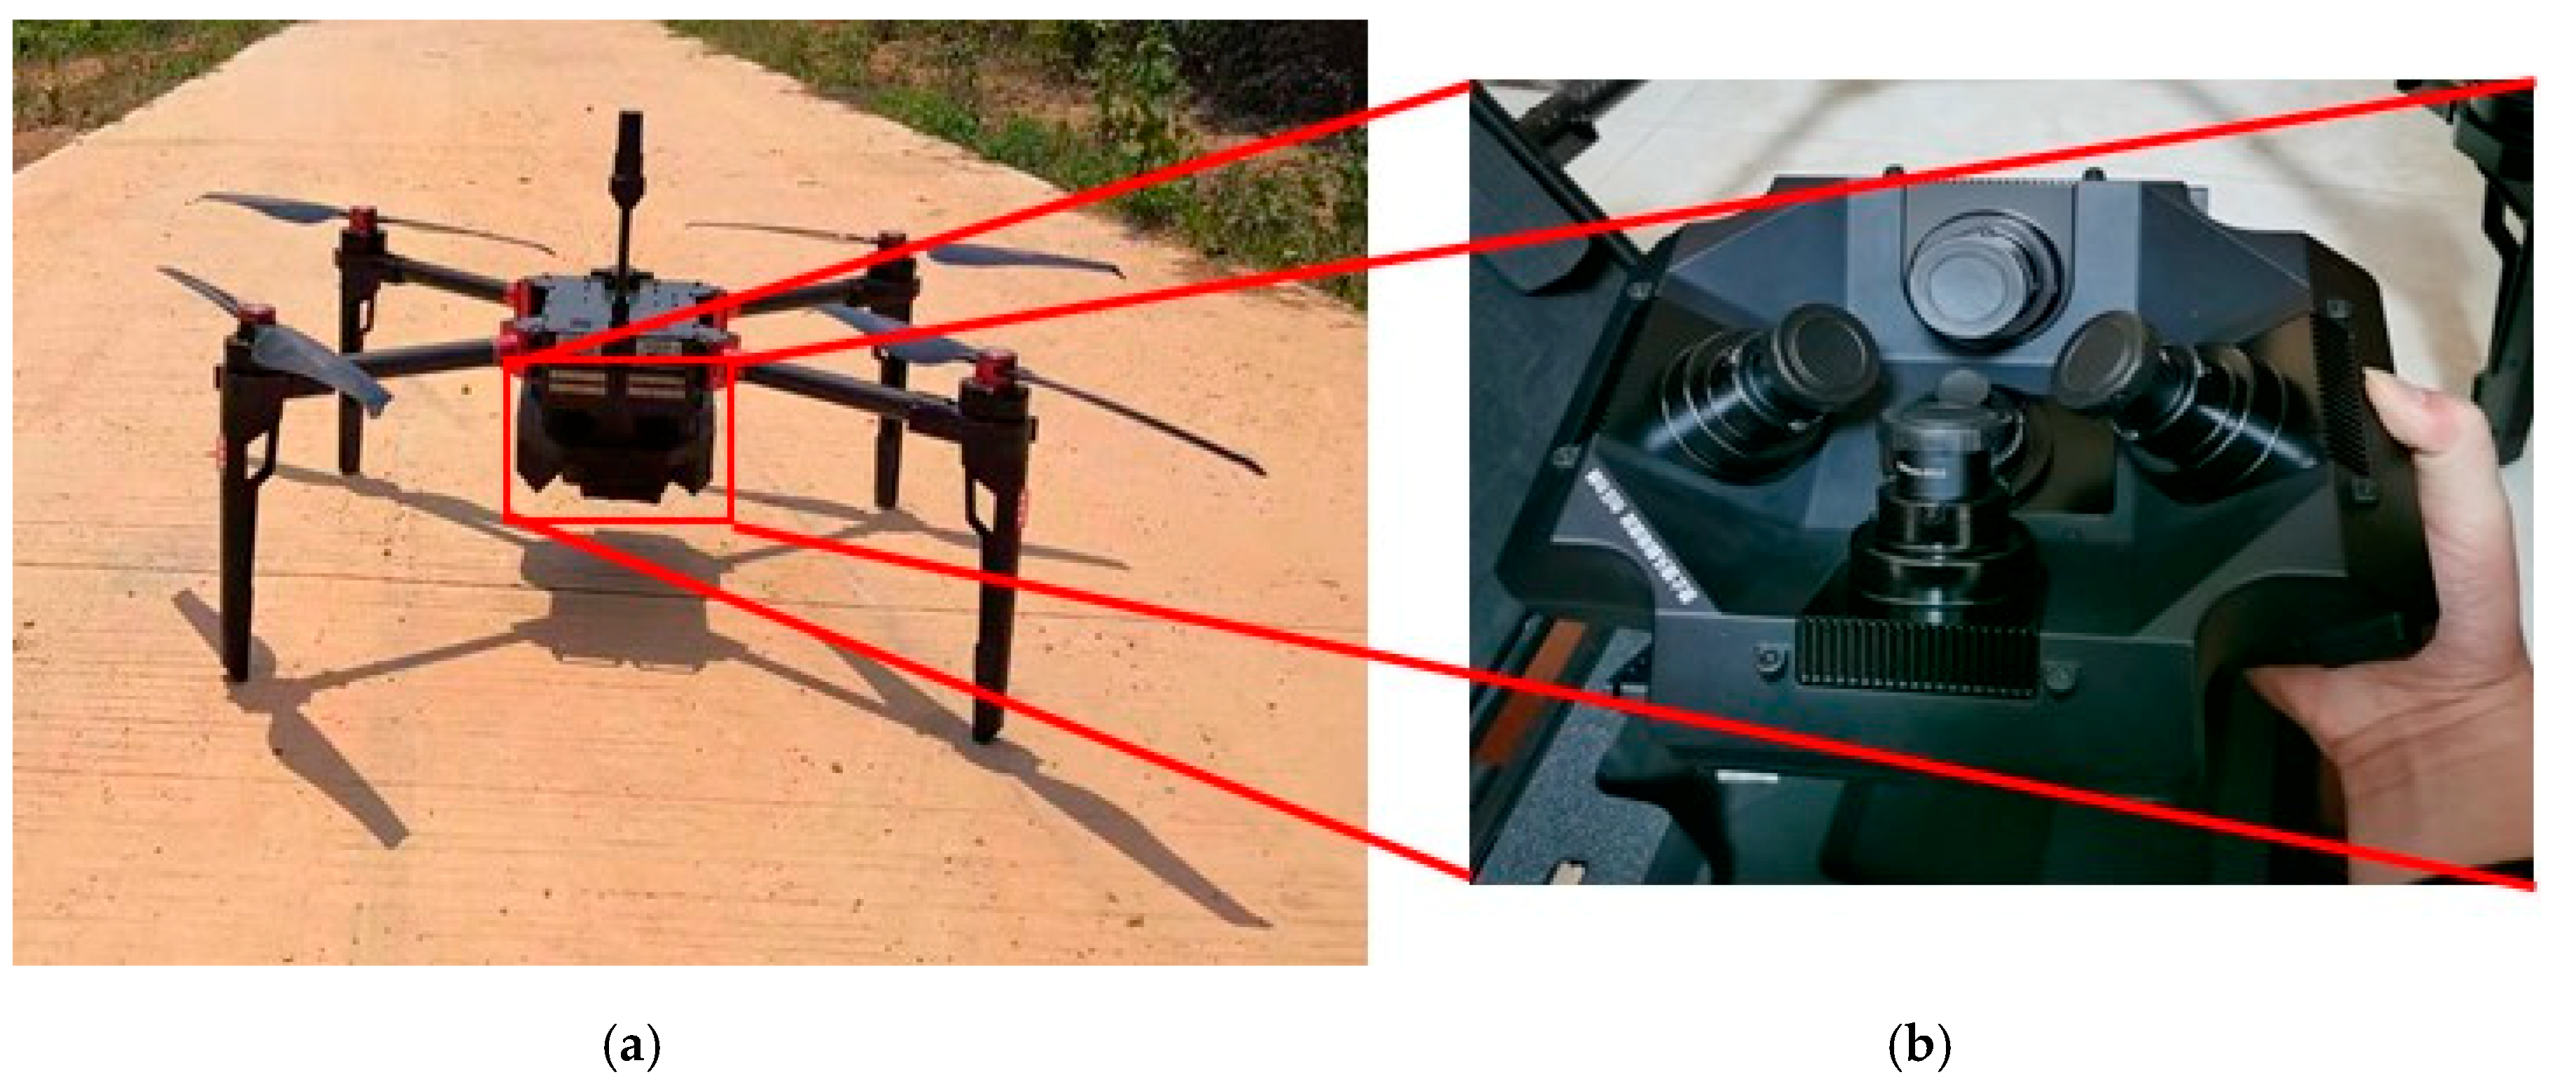
Damage information of a building structure and wall cracks was obtained from China’s National Earthquake Emergency Rescue Training Base. Experimental data were acquired using an ultramicro oblique platform for a multi-rotor UAV (
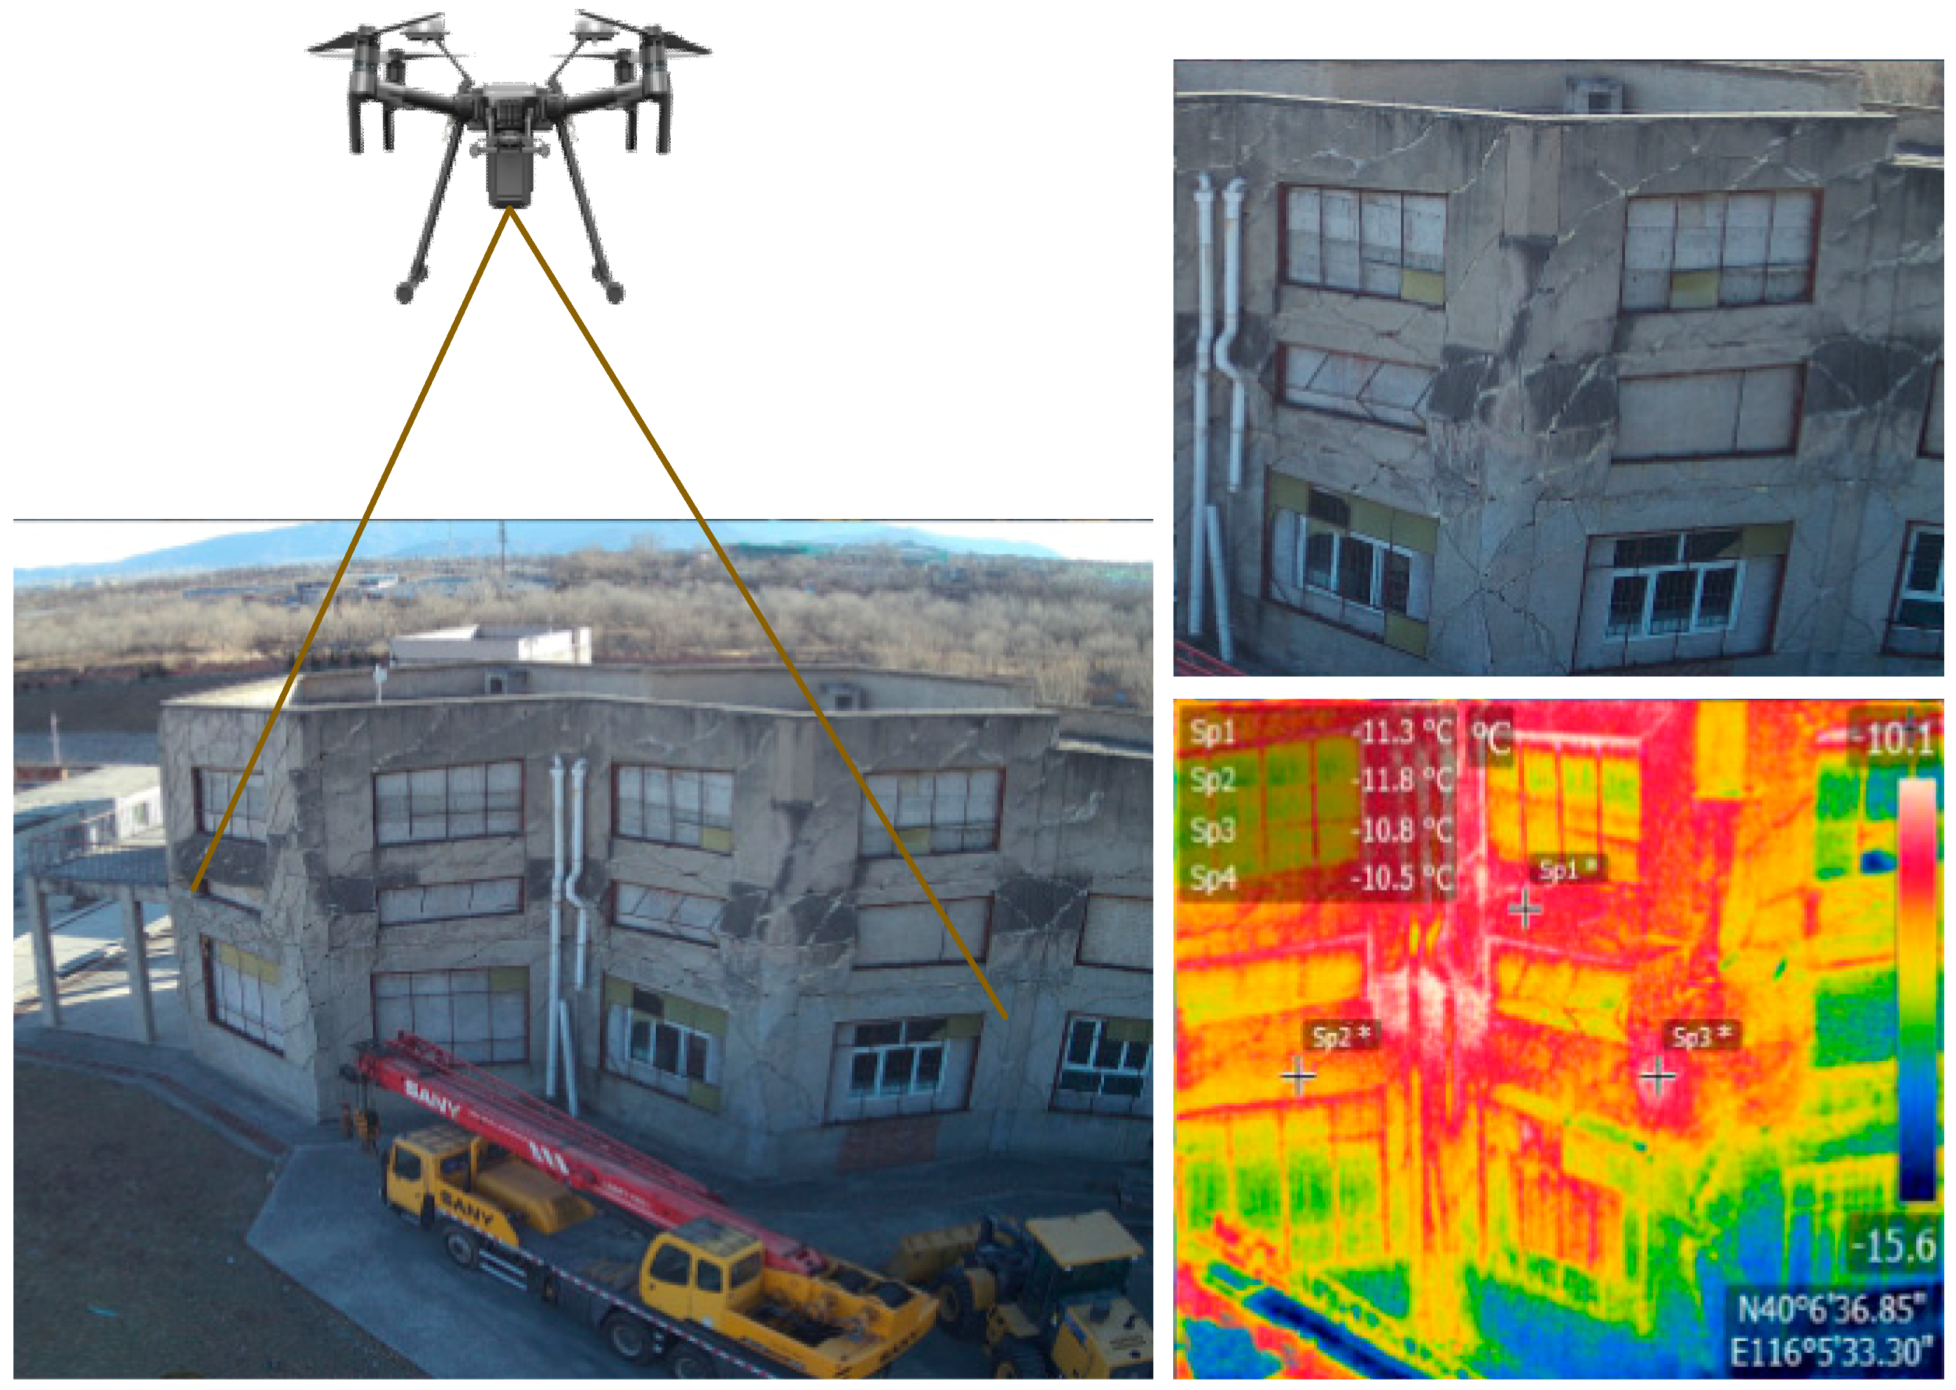
Figure 6) and a Zenmuse XT2 infrared thermal imager (
Table 1). The oblique image was obtained with a QingTing-5S digital aerial oblique camera with a spatial resolution of 0.12 m in four oblique views (looking forward, backward, left, and right) and a vertical view (
Table 2). The resolution of the image is 7140 × 5360 and the equivalent focal length is 28 mm/F2.4. The vertical camera is 80 mm in focal length and has a 40° oblique lens, with a GPS/IMU system providing the exterior orientation elements. Infrared thermal images were formed using a Zenmuse XT2 infrared thermal imager, which can use simultaneous dual-mode imaging with visible and thermal infrared light.
The QingTing-5S UAV used in this study was a 4-rotor flight platform, which is a highly portable, powerful aerial system for photogrammetry. The main structural components of the QingTing-5S are composed of a light carbon fiber, making it lightweight, but strong and stable. It weighs 3 kg, including airframe and batteries; the system core has ultra-high pixel and ultra-sensor technologies, and its operational efficiency is more than double that of similar aerial survey products. It can fly for up to 40 min. The flight route planning system can enable process automation and flow operations, and at the same time it can achieve real-time acquisition of video information; the operation is more intuitive, and the UAV can take off and land independently, with no take-off and landing site requirements, and can meet the 1:500 scale accuracy of aerial surveying.
Based on the feature points of the ultramicro oblique image, we took the collapsed buildings in an earthquake rescue base as an example. We performed 3D reconstruction of the data continuously shot at the same oblique view obtained from the UAV ultramicro oblique platform with an efficient and automatic 3D-modeling technology, Context software. This software does not rely on the original posture, but adapts to changes in the shooting angle and scale at any time. With the rapid construction of the 3D scene with accurate geographic location information, we can intuitively grasp the detailed features and facade structure of buildings in the target area, which can provide accurate spatial geographic information data for extracting disaster damage information, rapid feature recognition, and post-disaster rescue.
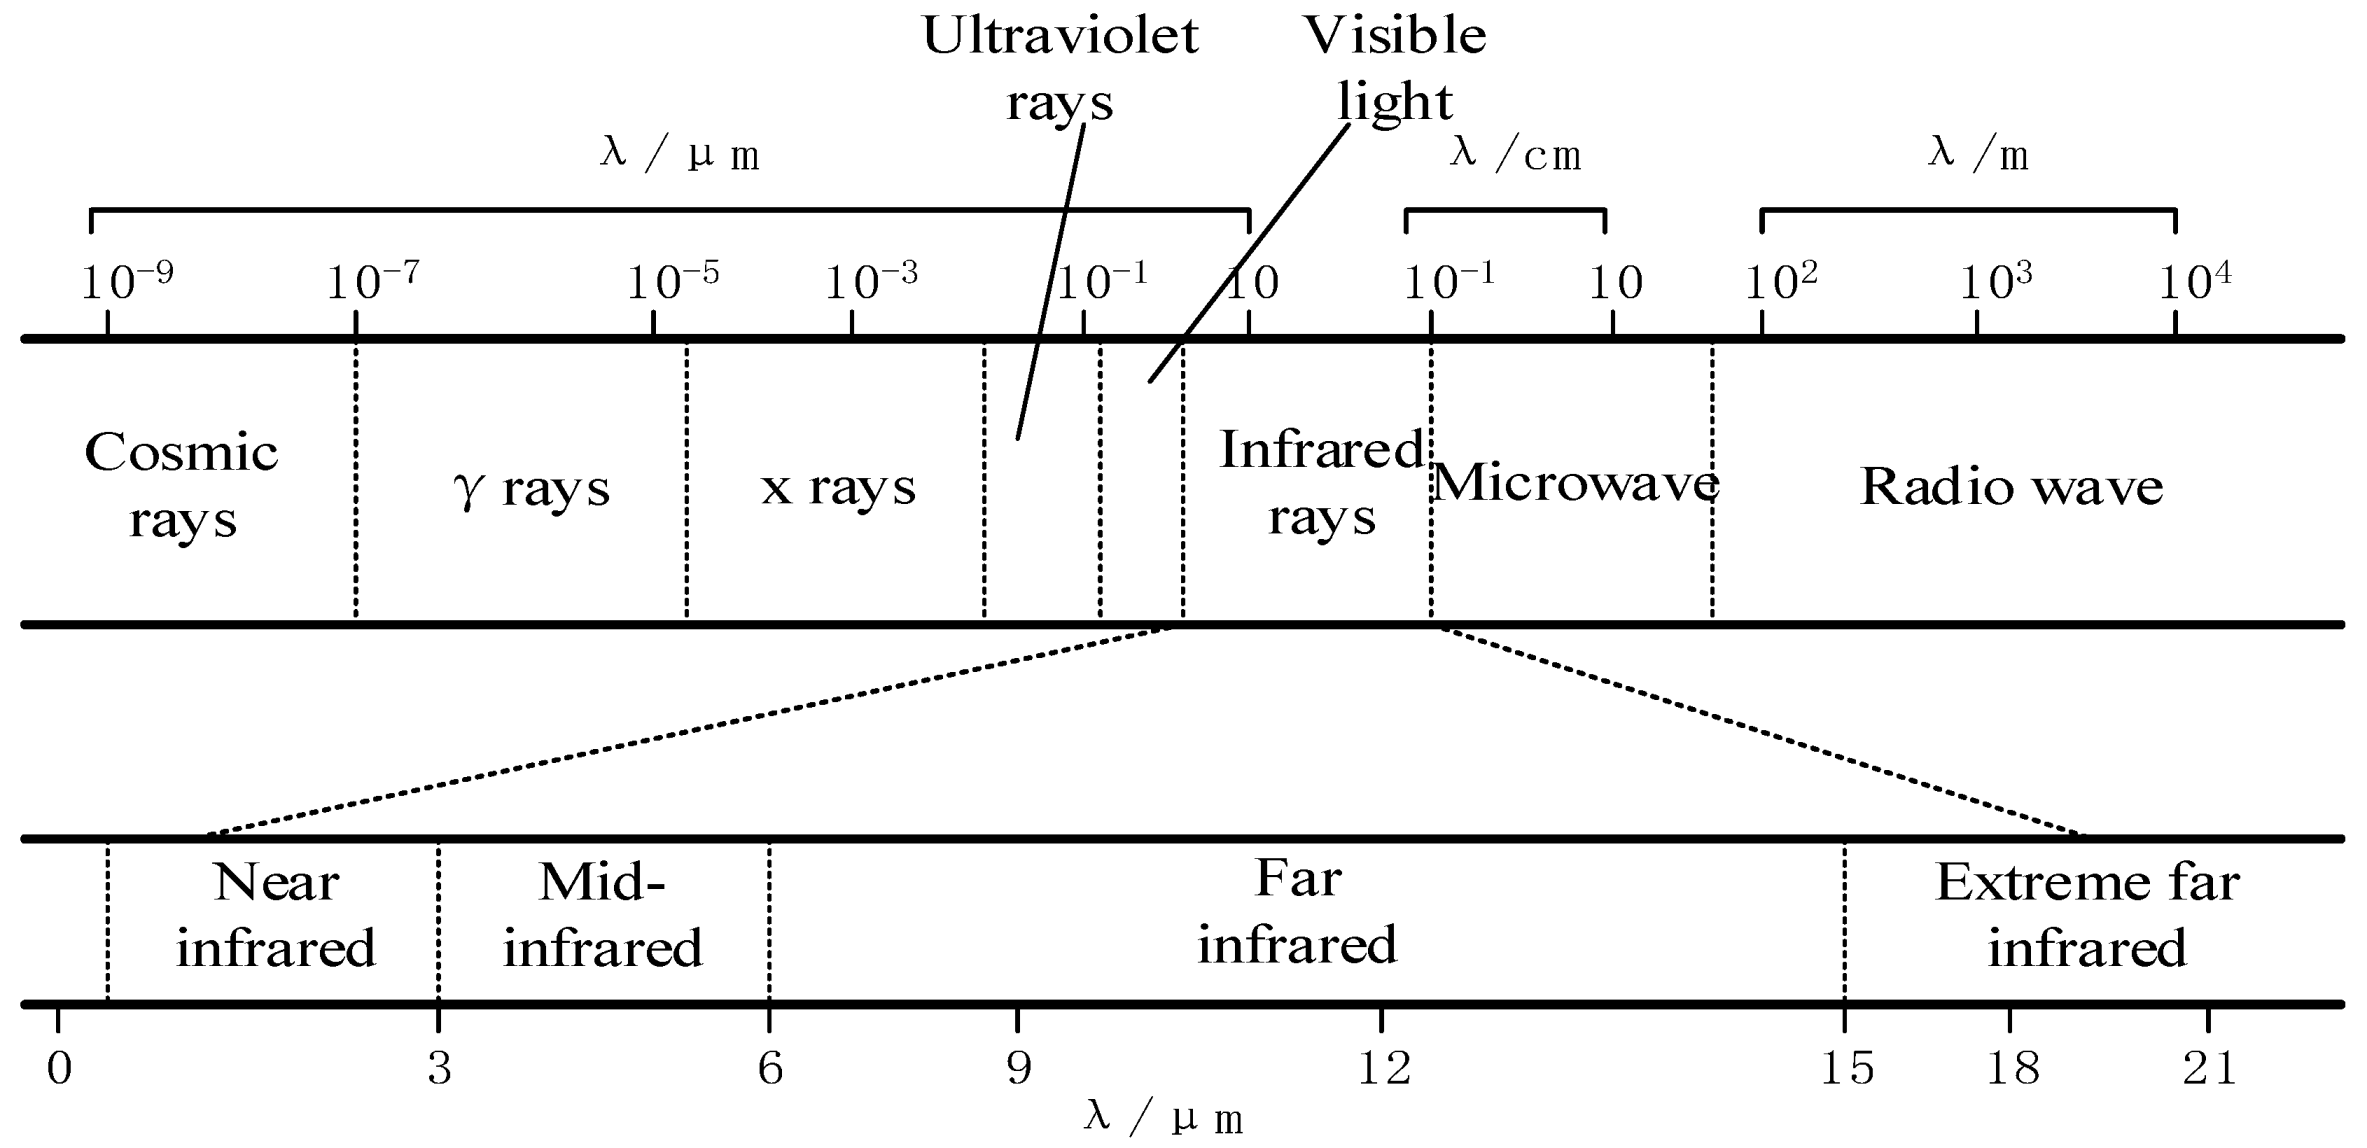
The thermal difference in buildings damaged by an earthquake greatly differs from that of unaffected buildings. In this study, infrared thermal imaging technology was adopted to determine the quantitative relationship between thermal infrared images and cracks in damaged buildings after a disaster. Infrared thermal temperature data (
Figure 7) show the electromagnetic waves radiated by the building surface detected by the thermal imager. According to the strength and wavelength of the electromagnetic wave, the temperature distribution on the external wall of the building is calculated and then transformed into an image to satisfy the requirements of human vision. The Zenmuse XT2 infrared thermal imager equipped with a high definition 4K color camera and a high-resolution radiation thermal imager enables a self-adaptive switch between the two devices. At the same time, FLIR multi-spectral dynamic imaging technology was adopted to imprint visible high-fidelity details on the thermal images, thus enhancing their quality and perspective.
3.2. Oblique 3D Modeling Method
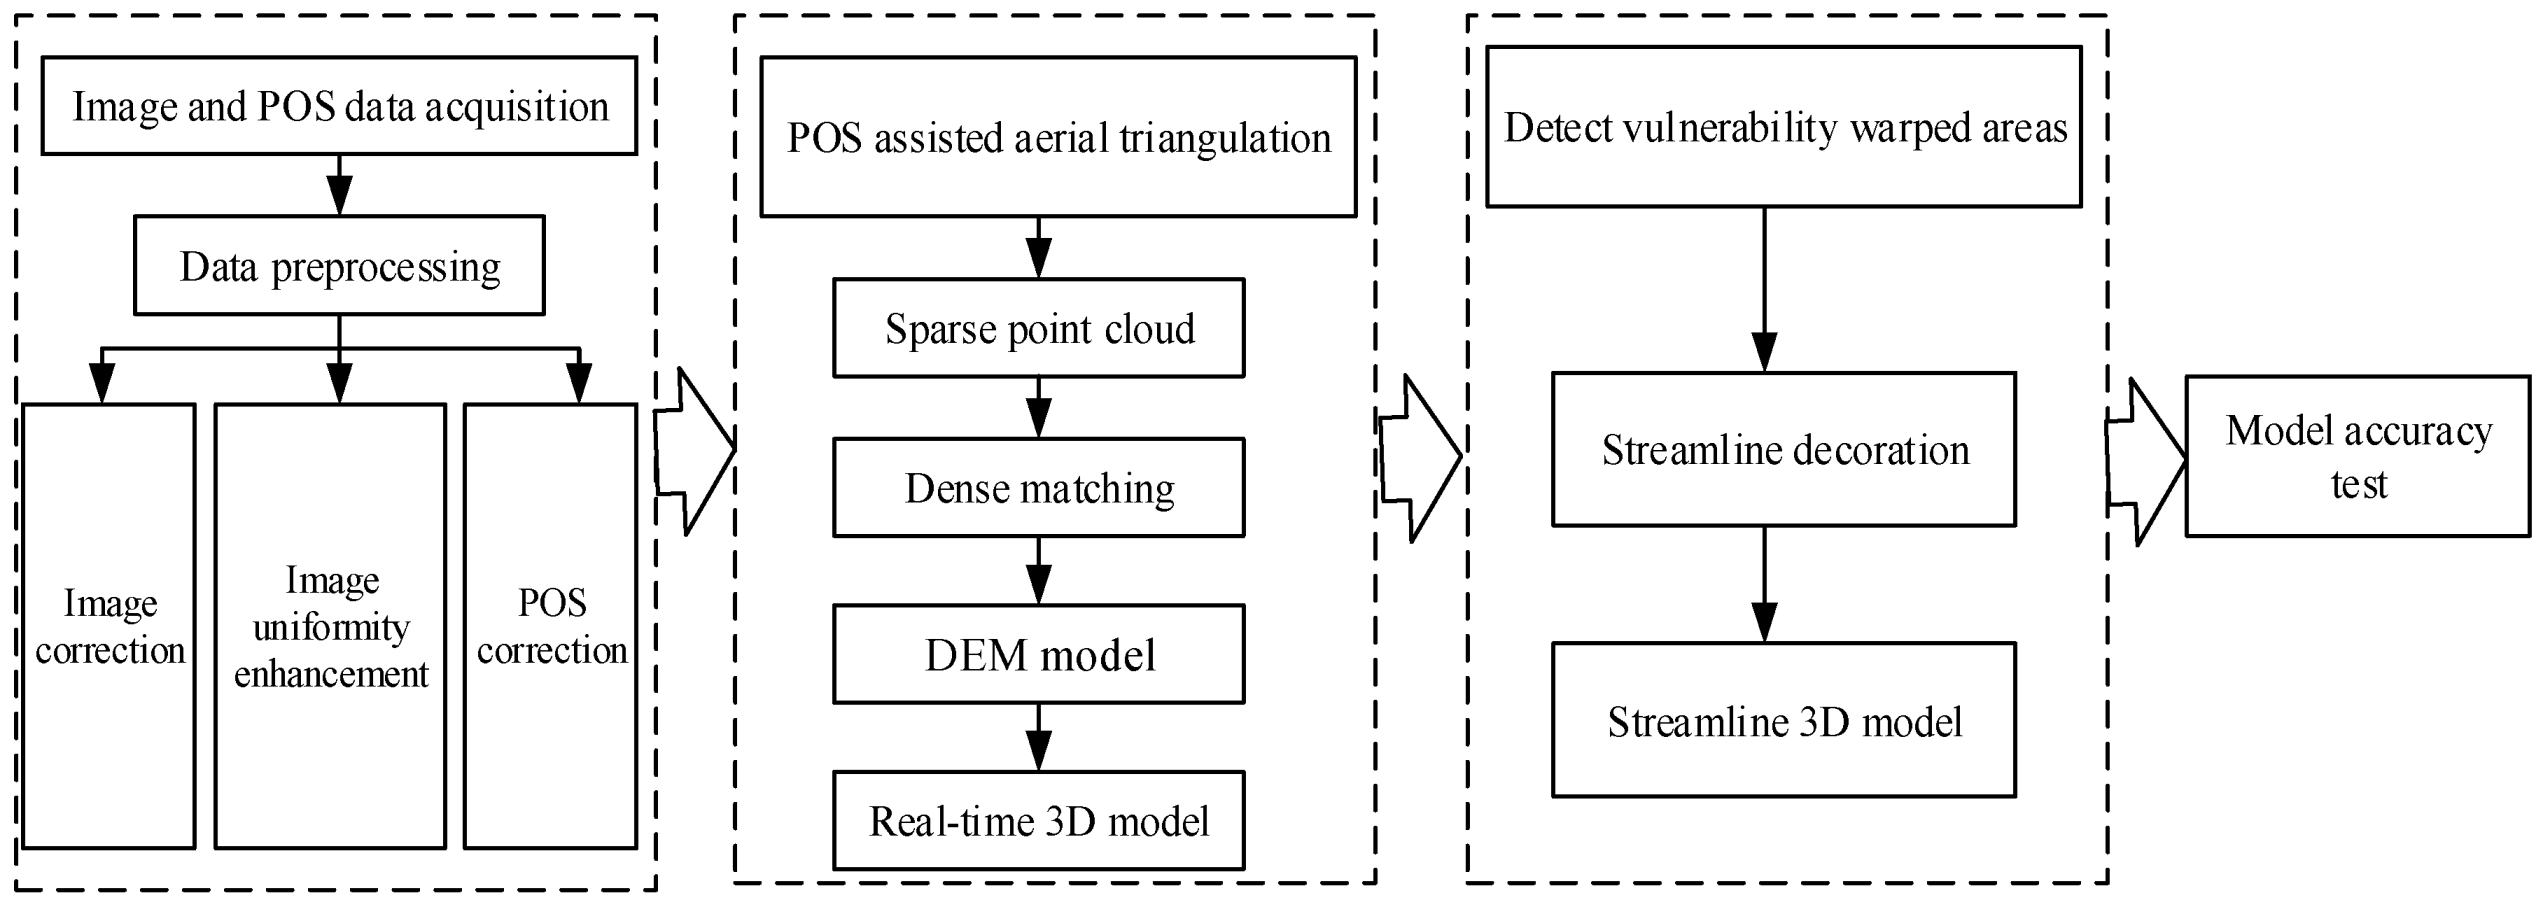
The oblique image 3D scene construction based on the ultramicro UAV platform primarily covers image distortion correction, feature point extraction, joint adjustment of regional networks, dense matching of multi-view images [
24,
30,
31], geometric correction, aerial triangulation, and texture mapping. We then acquired the three-dimensional scene of the building after the disaster, which clearly shows the structural information of the damage. The modeling process of the 3D scene is shown in
Figure 8.
In regards to the image preprocessing, a multi-view image acquired by the camera in the process of shooting had a geometric shape distortion in certain positions and orientations. After preprocessing, a mathematical model was established to eliminate the distortion error and thus achieve the purpose of denoising and enhancing the original image.
Aerial triangulation (also called aerotriangulation) [
24] is the key to UAV image processing. It aims to extract connection points and some ground control points through image matching, then transfers the relative coordinates of the image to the known ground coordinate system. As a result, the external orientation elements of each image and the ground coordinates of the encrypted points are obtained, and a sparse point cloud is finally generated.
The key calculation steps of position orientation system (POS) data-assisted aerial triangulation are as follows:
Step 1: Use the POS data as the initial value, and establish a collinear equation between the object coordinate system and the image point coordinate system. A collinear equation is defined as a mathematical relationship formula that expresses three points in a straight line: The object point, the image point, and the projection center (usually the lens center for a photo) (Equation (1)).
where
represent the coordinates of the image point;
represent the coordinates of the principal point of the image;
represent the object space coordinates of the image point corresponding to the object point;
represent the object space coordinates of the photograph center; and
represent the direction cosine of the rotation matrix.
Step 2: After the derivative transformation, the collinear equation is solved as Equation (2):
The coefficient can be calculated from the object space control points and the corresponding image points. There are 11 coefficients in Equation (2), so at least six control points are required for the solution. In order to facilitate the iterative calculation of adjustment, 17 control points are selected to participate in the calculation. Through multiple iterations, the external orientation elements of the image and the three-dimensional coordinate points of the points to be calculated are obtained.
In the feature-point extraction of an oblique image, the SIFT operator is used to conduct convolution computation against the scale variable Gaussian function and multi-view image, thus constructing the multi-scale space of the image. After acquiring the Gaussian pyramid image, a response value image of the Gaussian differential multi-scale space is obtained by subtracting the adjacent Gaussian scale image, and the position and scale of the image feature point are obtained. Finally, the feature point is further accurately positioned through surface fitting. The sparse space surface (seed patch) obtained by aerial triangulation is gradually spread to construct a dense point cloud. After obtaining a 3D dense point cloud, the texture is automatically mapped, and color fusion is processed for the stitching line in the 2D image. The vertical and side textures are obtained at the same time, and the fine side structure is reconstructed. With the side structure information, we can acquire a great deal of occluded and unavailable ground structure information, which effectively compensates for the lack of data in the ground image.
3.3. Infrared Thermal Imaging Data Analysis Method
The thermal data of building damage caused by earthquakes and other disasters differ from those of the internal structure of undamaged buildings. In this work, based on [
29,
30,
31], we attempted to determine the relationship between the thermal infrared spectra of cracks and other building damage post disasters and the damage degree of buildings, explore the spatial location and size of wall cracks and other damages, and analyze the damage degree of building walls [
32,
33,
34].
According to the theory of thermal radiation [
35], objects with a temperature above absolute zero −273 °C) always radiate infrared waves [
15]. These objects are called infrared radiation sources [
36]. The infrared radiation energy of an actual object can be expressed as follows:
where E is the radiation energy of the object, ε is its emissivity, σ is the Stephen–Boltzmann constant, and T is the physical temperature of the object surface. The infrared radiation energy of an object is proportional to its physical temperature. When minor changes occur in the surface temperature of the object, its infrared radiation energy also changes.
First, the digital number (DN) value of the thermal infrared image was converted to the physical temperature value. Then, the FLIR tools thermal infrared image processing module was used to analyze the temperature image. The fitting of the DN value and temperature value (T) was divided into two steps. First, 56 sample points on the original thermal infrared image were selected, and the radiant brightness and gray values of each sample point that appears are counted. The highest pixel value was used as the pixel value corresponding to the temperature value. The gray values of the image were counted and recorded, and the gray value set was obtained [
37]. The curve-fitting method was used in the MATLAB environment to fit the sample count and radiance value. The relation formula between the DN and temperature was obtained as follows:
or
Based on the above steps, the corresponding relationship between the DN and the temperature of the image can be determined within a certain temperature measuring range. The FLIR tools module was used to determine the temperature measuring range. Through interpolation, coloring, and denoising of the temperature image, we found that heat accumulation at the damaged part of the building with a high temperature formed a hot point area on the surface, which differed from the temperature distribution of the intact wall [
5,
18,
38]. Through quantitative analysis and mapping of the thermal infrared image of the wall, the spatial position and damage degree of wall cracks can be described.
4. Results
4.1. 3D-Scene Modeling and Building Structure Analysis Based on Ultramicro Oblique Image
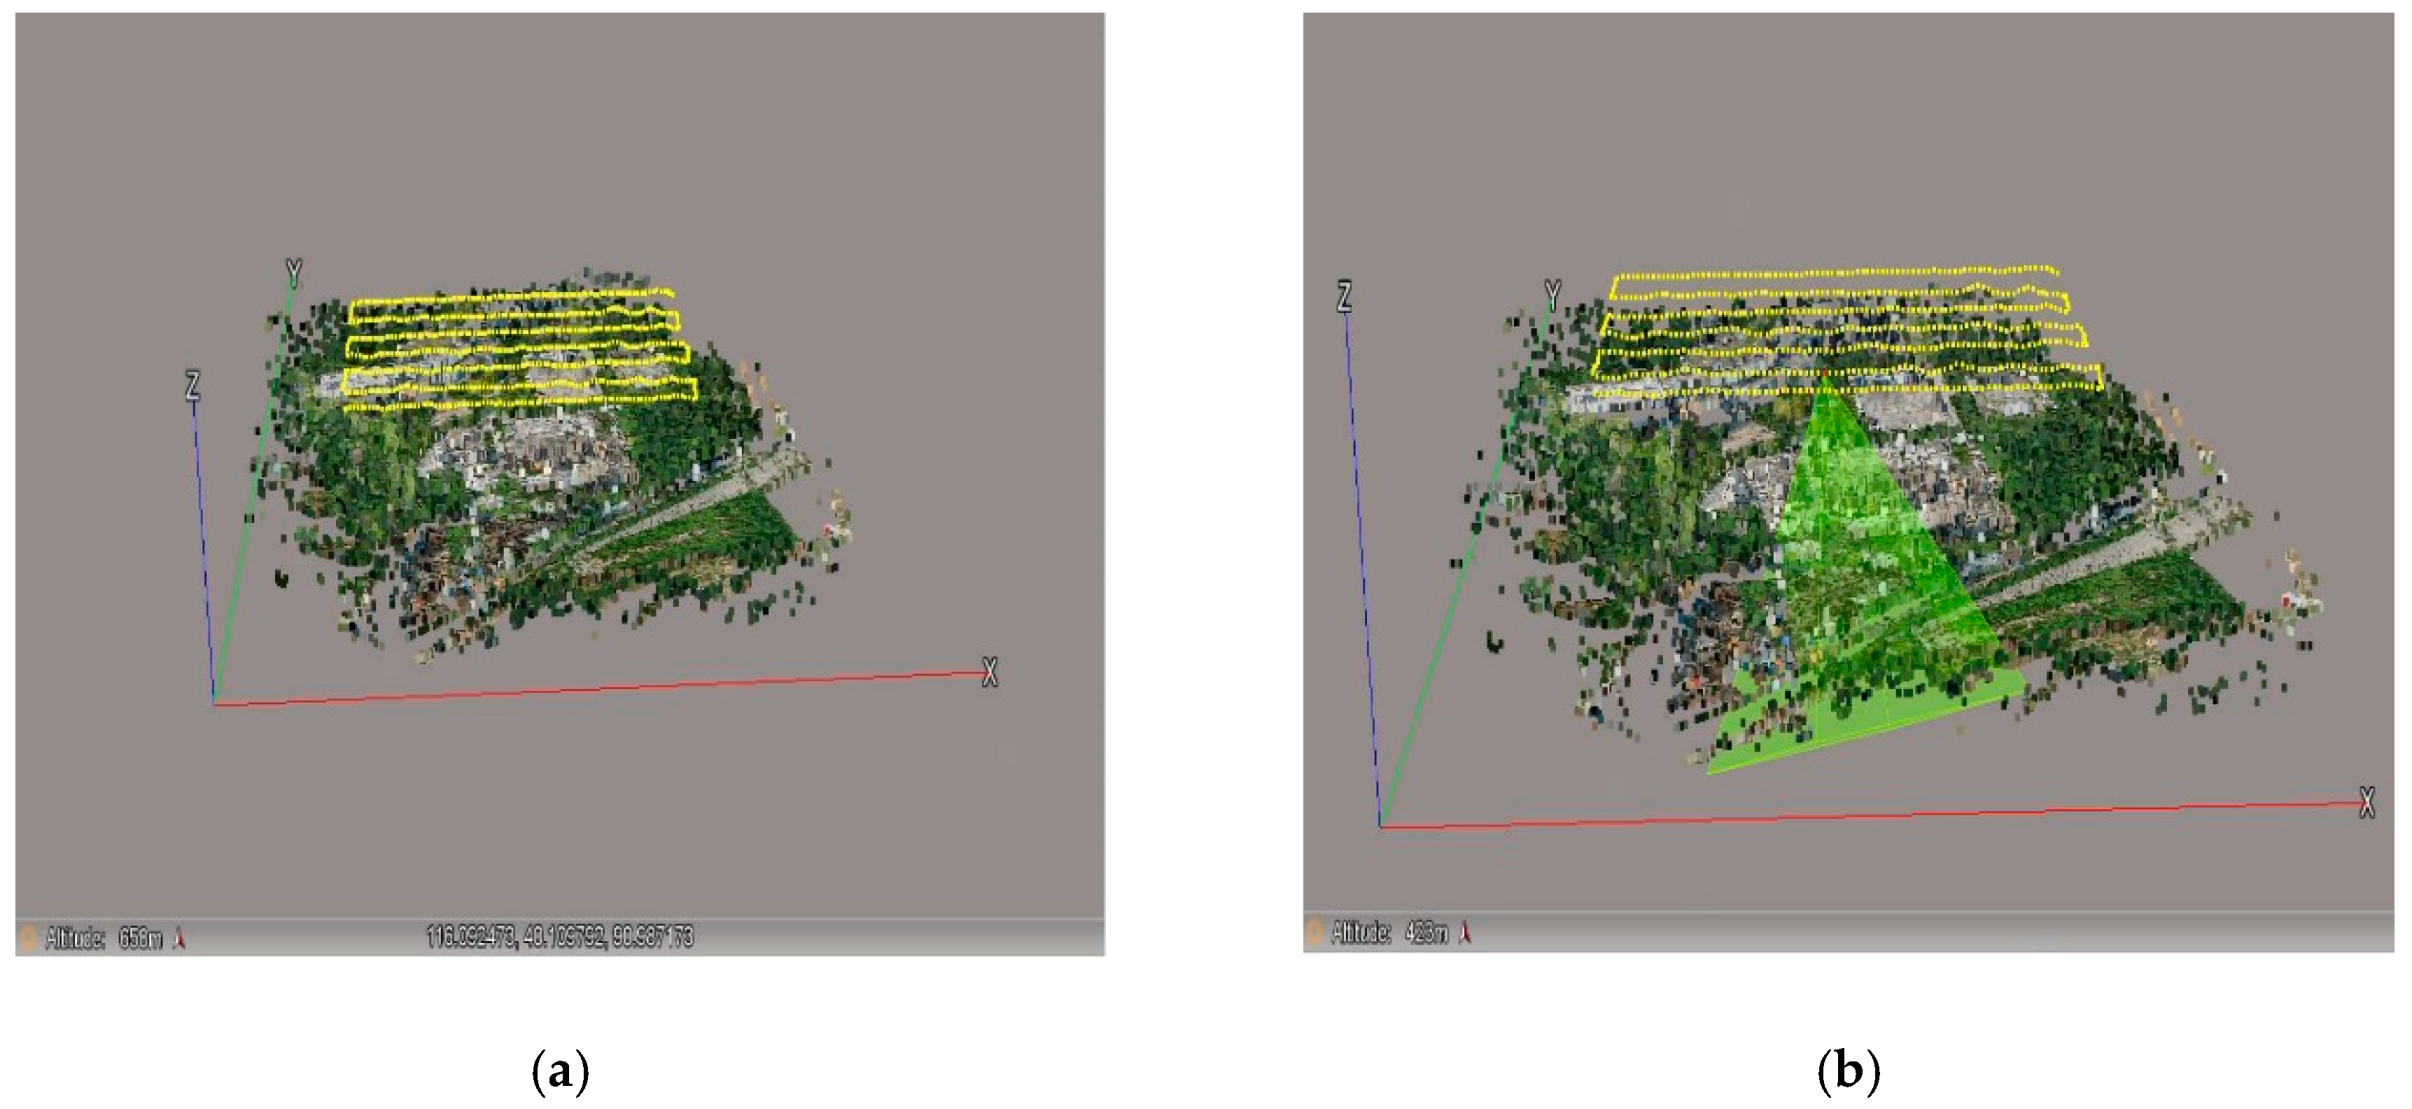
Since a traditional 2D orthophoto image can only be shot from a vertical angle, only the surface information of the building roof can be obtained. A quick assessment of the damage information of the structures surrounding buildings after a disaster is therefore difficult to obtain, leaving numerous hidden dangers. Oblique photography, equipped with multiple sensors on the same UAV flight platform, can be used for multi-angle stereo imaging, which is conducive to structural detection of post-disaster buildings, as it can truly reflect the actual collapse situations of buildings. It can greatly make up for the deficiency of 2D orthophotos. The original five views of oblique images are shown in
Figure 9. The UAV image acquired from multiple angles was used for photogrammetric 3D modeling and subsequent texture mapping.
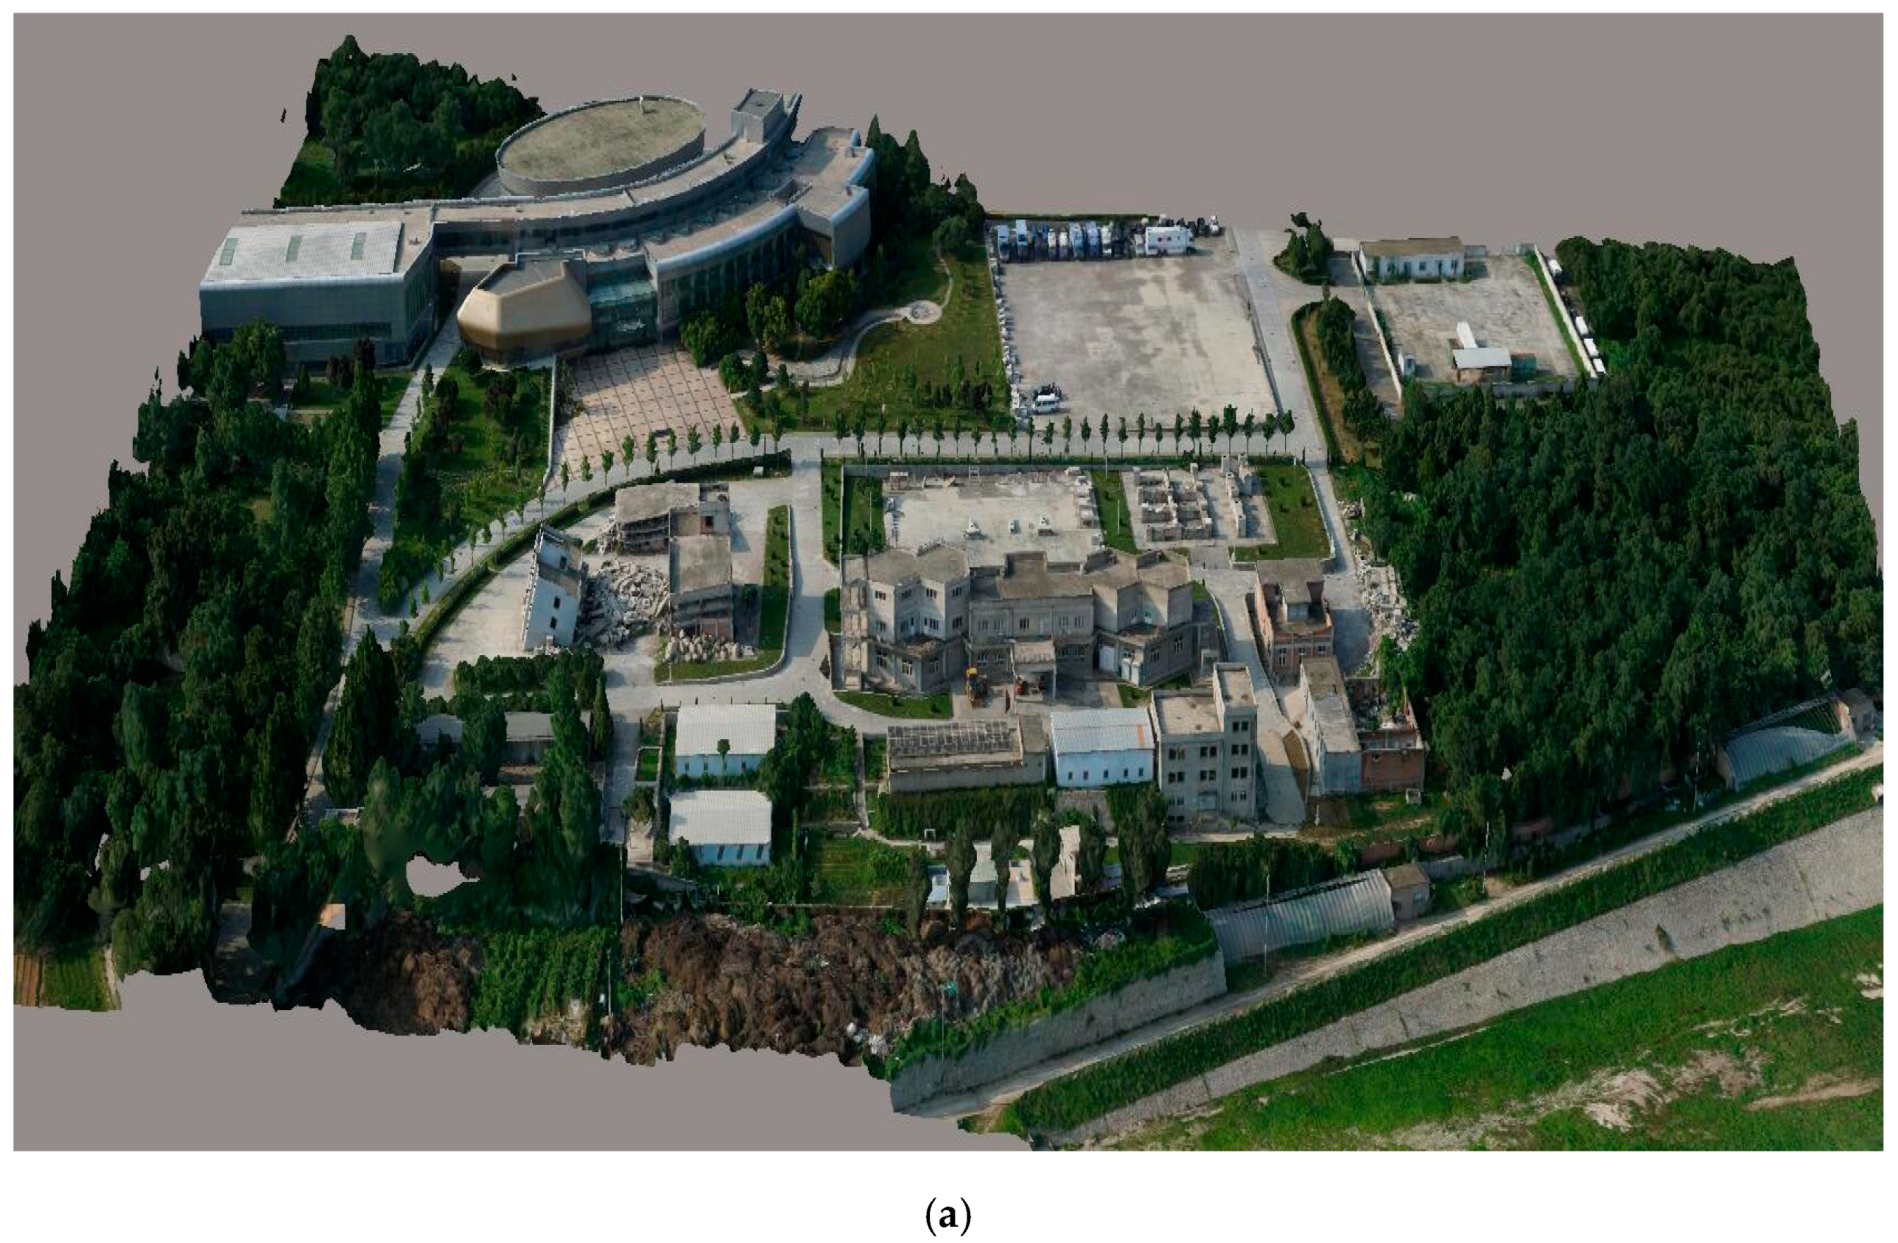
The whole and part of the 3D model of the ultramicro oblique image at the earthquake rescue base are shown in
Figure 10 and
Figure 11. From the global image of the 3D model of the collapsed building, the whole situation can be clearly observed. A large amount of ruins and debris formed because of the building collapse, showing a rough and disordered shape in the 3D texture characteristics and slightly changed color. Contrastingly, the undamaged buildings have a smooth texture, uniform density, and consistent color. UAV oblique photographs were taken of some damaged and collapsed buildings in the severely earthquake-affected area, and a 3D real-scene model was constructed. The UAV oblique photography can analyze the damage of the roof from the vertical perspective and the structural damage of buildings from the side perspective. Moreover, we can evaluate the damage degree of buildings based on the damage situation, thereby providing the necessary disaster information for post-disaster assessment.
The details of the damage and structural information can be seen from the local information of each view of the three-dimensional model, and the location and volume of the building can be clearly seen. The red circle in the figure shows the damaged part of the building. From the partial and detailed images, it can be found that there are different degrees of damage inside the building frame. If we rely on only traditional vertical orthophoto images, the interior area and details of damage to the building cannot be detected. The oblique photography technology has the unique advantage of visibility analysis between two or more points, which can effectively avoid obstruction of the line of sight and provide the necessary post-disaster scene information and fast and timely treatment and rescue.
From the local information of each perspective of the 3D model, we can see the damage details and structural information, as well as the location and volume of the collapsed building. The red circle in the figure represents the damaged part of the building. The local and detailed images also reveal different degrees of damage in the building frame. Through the visibility analysis of two or more points, we observe that the effective prevention of an occluded line-of-sight helps provide the necessary post-disaster site information along with a quick and timely post-disaster rescue.
The 3D model generated by modeling multiple angles of buildings shows rich details and textural information. From the 3D texture characteristics of damaged buildings (
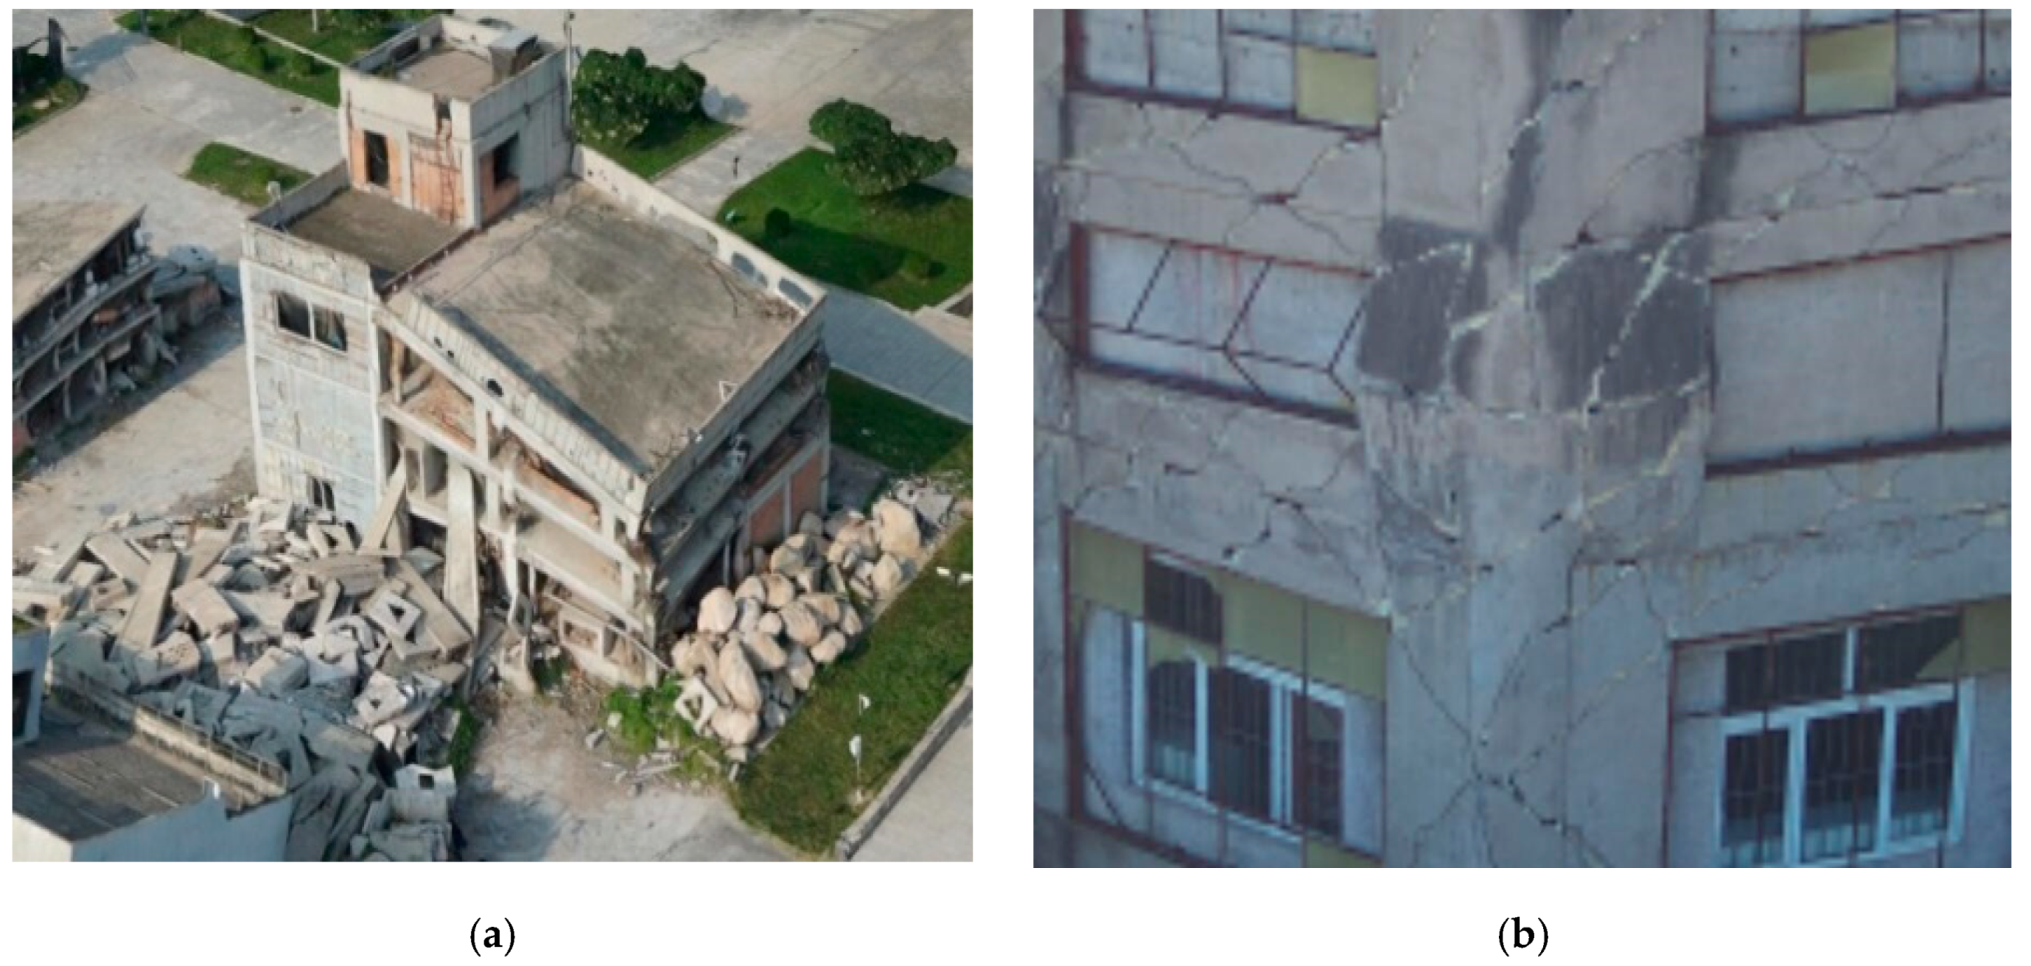
Figure 12), we find that the debris in the damaged part is strongly granular, which clearly differs from other intact ground objects. As with street trees and corners of buildings, we can clearly observe from the elevation drawing of the external wall that the texture of parts with cracks and falling objects is striped, along with some depressions and recessions. In the intact part of the building, the surface is smooth and flat, and the sides also show an even texture. The patch in the same area has relatively consistent brightness, without highlights or blackness. Currently, severely damaged buildings with huge cracks or tilting always show intact or slightly damaged exteriors. With the help of the 3D texture of oblique images, we find that differences in the texture roughness and morphology from many perspectives can help distinguish structural damage information.
4.2. Extraction of Building Structure Damage Information
Three directional images are selected from the 3D model, transforming the analysis of the 3D scene into an analysis of 2D plane images. The pixel-based information extraction method primarily uses the spectral characteristics of ground objects and does not consider the relationship of the context. In this work, we make progress by using the object-oriented approach, fully considering the spectrum, shape, texture, and proximity of neighboring pixels. The fractal net evolution approach (FNEA) multi-scale segmentation algorithm [
39,
40,
41] was adopted to segment the stereo scenes and images in three directions. A region-merging algorithm with minimum heterogeneity from top to bottom was used in the multi-scale segmentation. After many experiments, the segmentation scale parameters, shape factor, and compactness factor were adjusted, and then the best segmentation result was obtained (
Figure 13). The facade of the side and edge contour of the collapsed building’s structural details were clearly segmented, particularly in the boundary of the debris, which is clearly distinct when compared to the bare land road and other background objects. This lays a foundation for extracting damage information.
In this paper, oblique images with obvious seismic damage characteristics were divided into segmentation scales. The shape and compactness factor were set to 0.3 and 0.5, respectively, and the segmentation scale ranged from 20 to 90 (in intervals of 10). Through the image analysis after segmentation, it can be seen that when the scale is too small, the segmentation is too excessive, especially where the cracks and walls fall off; when the scale is too large and the segmentation effect is poor, the cracks are mixed with the external walls and are not well divided. Through the multi-scale segmentation test, 50 was chosen as the segmentation scale to better separate the damaged parts. The segmented block size is basically consistent with the original image, which ensures the integrity of the building and lays a foundation for further determination of damage information.
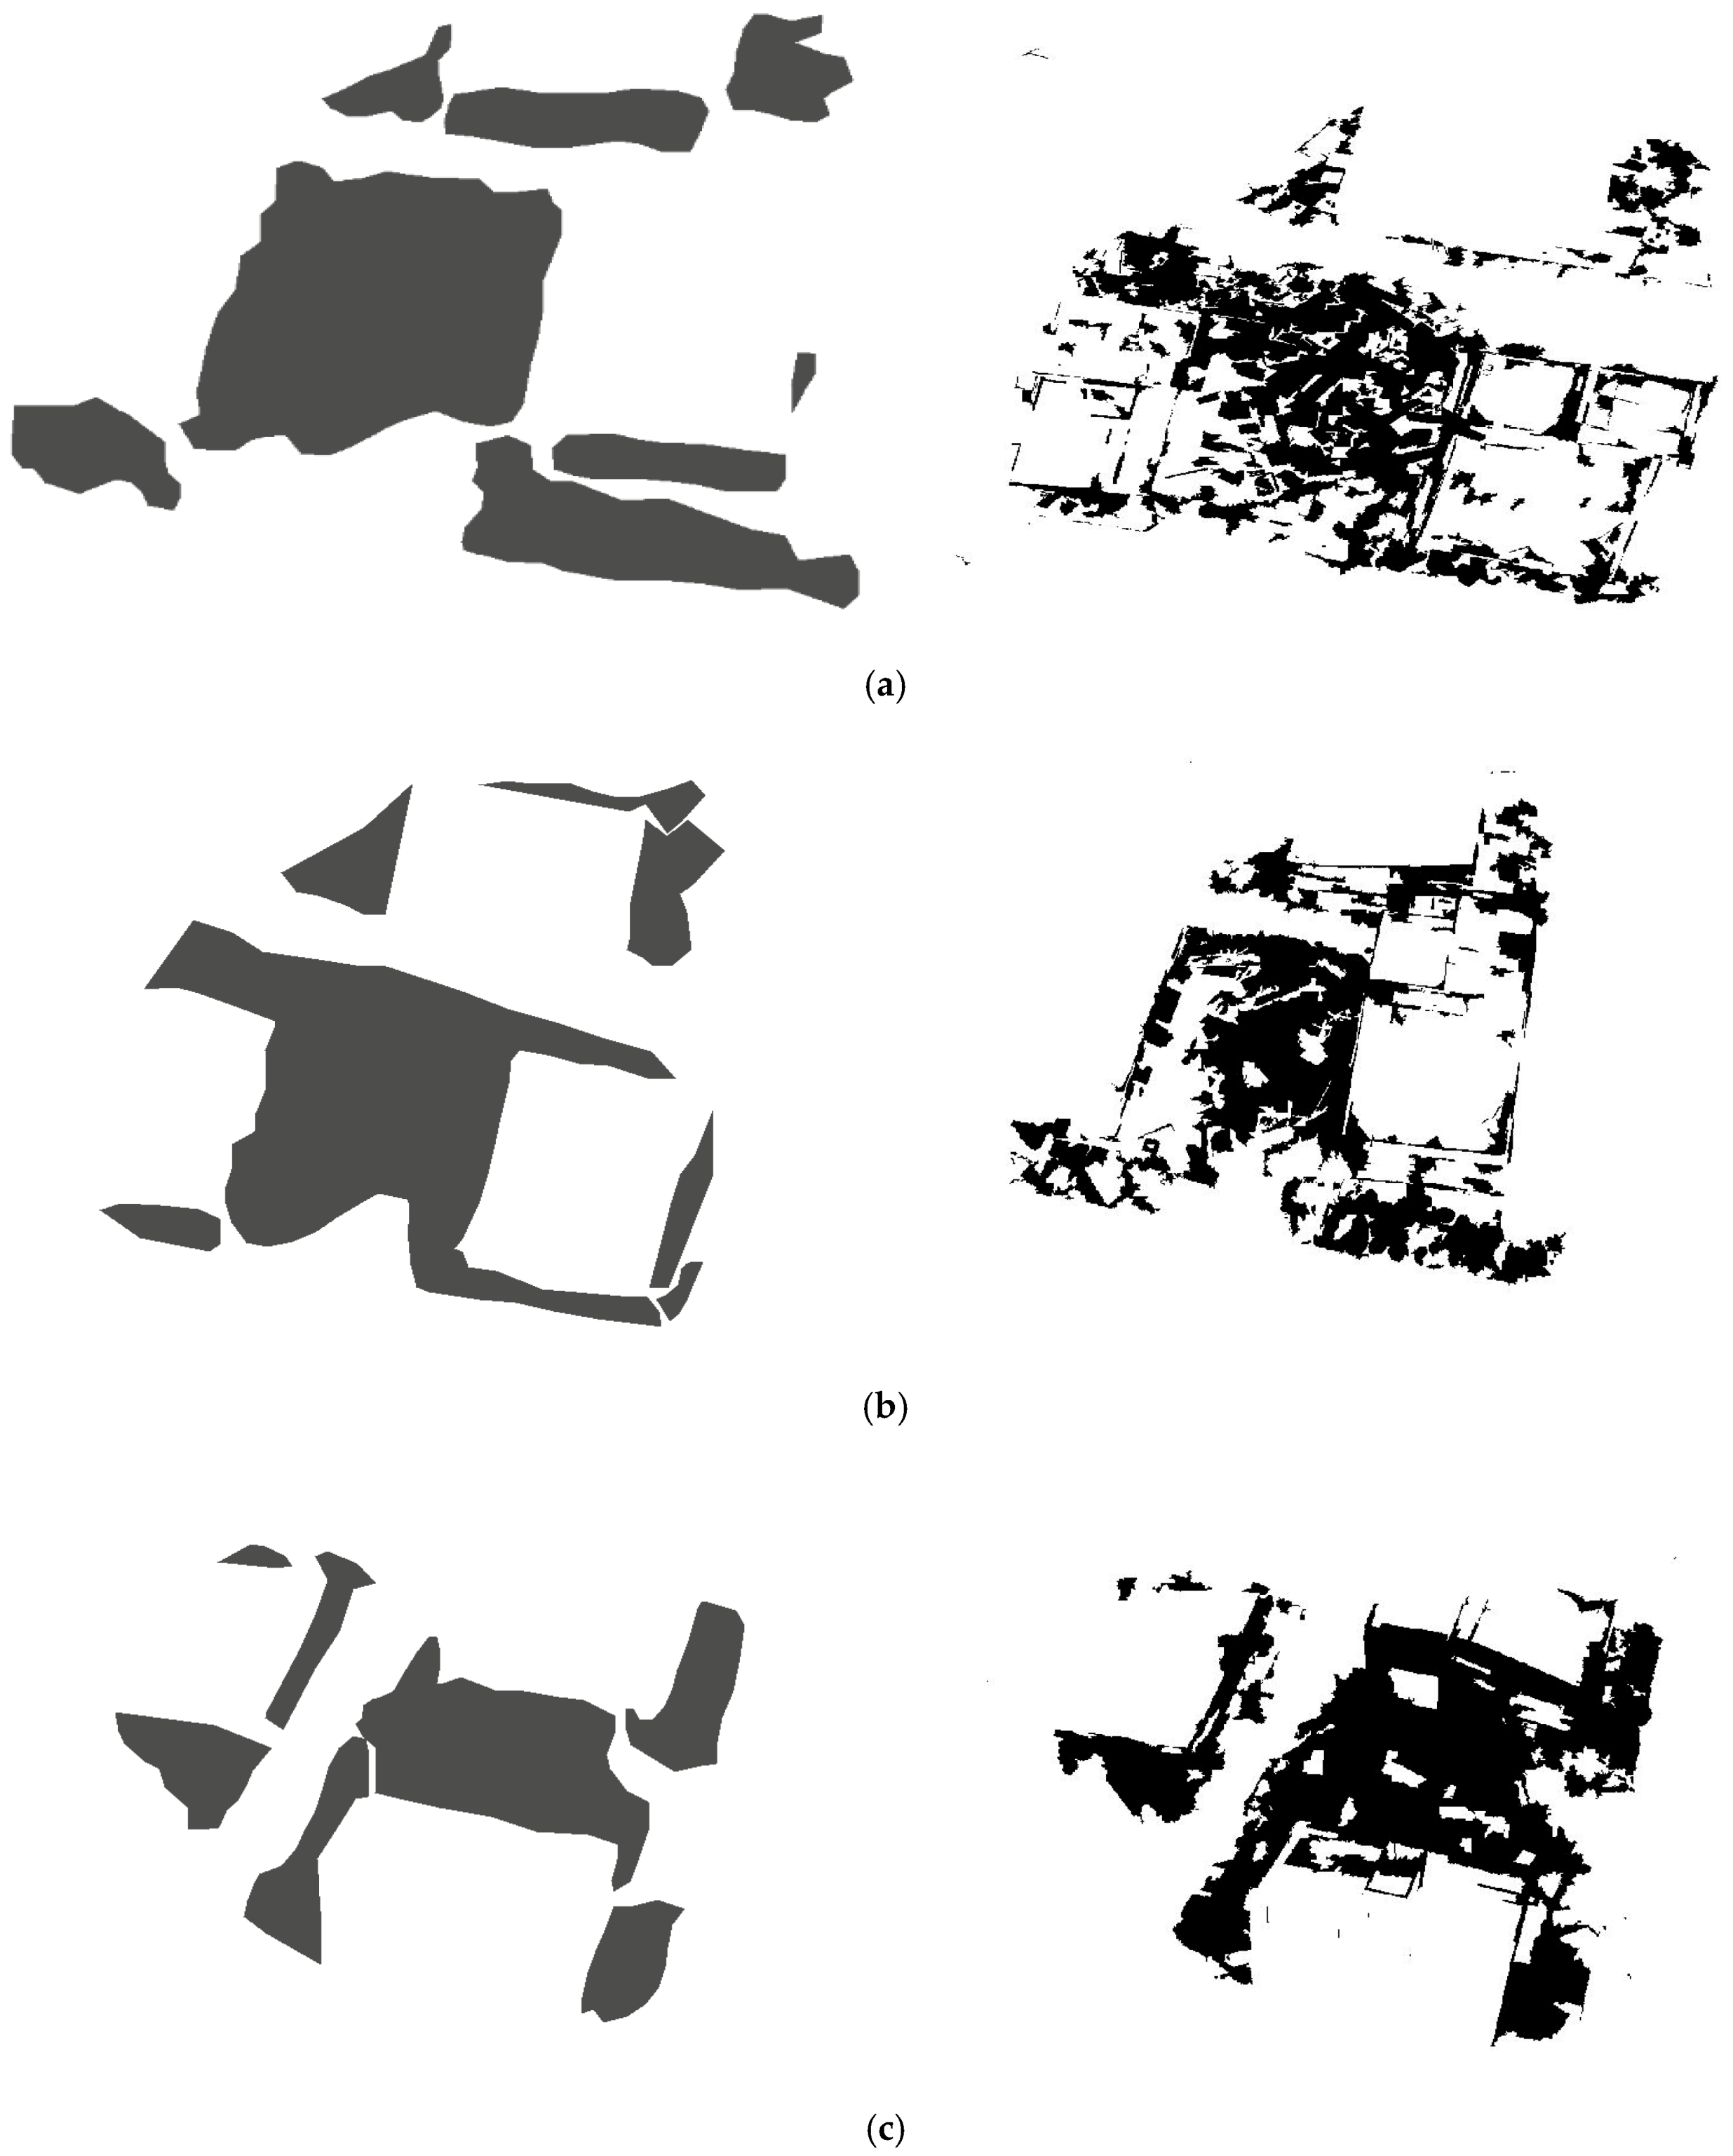
The spectrum, shape, texture, space, and other characteristics of buildings after a disaster drastically differ from those before the disaster. After homogeneous object blocks are formed by object-oriented multi-scale segmentation, the feature space is established by selecting the spectrum, texture, shape, and other characteristics of buildings. Information on the exterior wall and structural damage of concrete buildings is extracted through the membership classification method. Among them, the characteristic of vertical image extraction (
Figure 14a) is that Asmetry is more than 2.87, the characteristic of positive-backward image extraction (
Figure 14c) is that Entropy is more than 8, the characteristic of positive-forward image extraction (
Figure 14b) is that Max.diff is more than 0.26, and the shape index is more than 1.6. The extraction result of the structural information of the building facade is shown in
Figure 13.
The accuracy of the oblique image extraction result was assessed to help quantitatively evaluate the effect of building structure damage information extraction. A confusion matrix was obtained by calculating real pixels on the ground surface and the corresponding pixels in the classification results, which does not require vast prior knowledge in the field. In this work, the accuracy assessment was made for oblique image extraction results by using the confusion matrix. The four indices used were overall accuracy, kappa coefficient, producer accuracy, and user accuracy. As shown in the analysis in
Table 3, overall accuracy in three perspectives reached 80%, indicating that the information of damaged buildings can be accurately extracted from the side view. It shows that oblique images can effectively detect the damage of the side facade and quickly grasp the details of building structure damage during emergency rescue after the disaster.
4.3. Analysis of Wall Temperature Field of Infrared Thermal Images
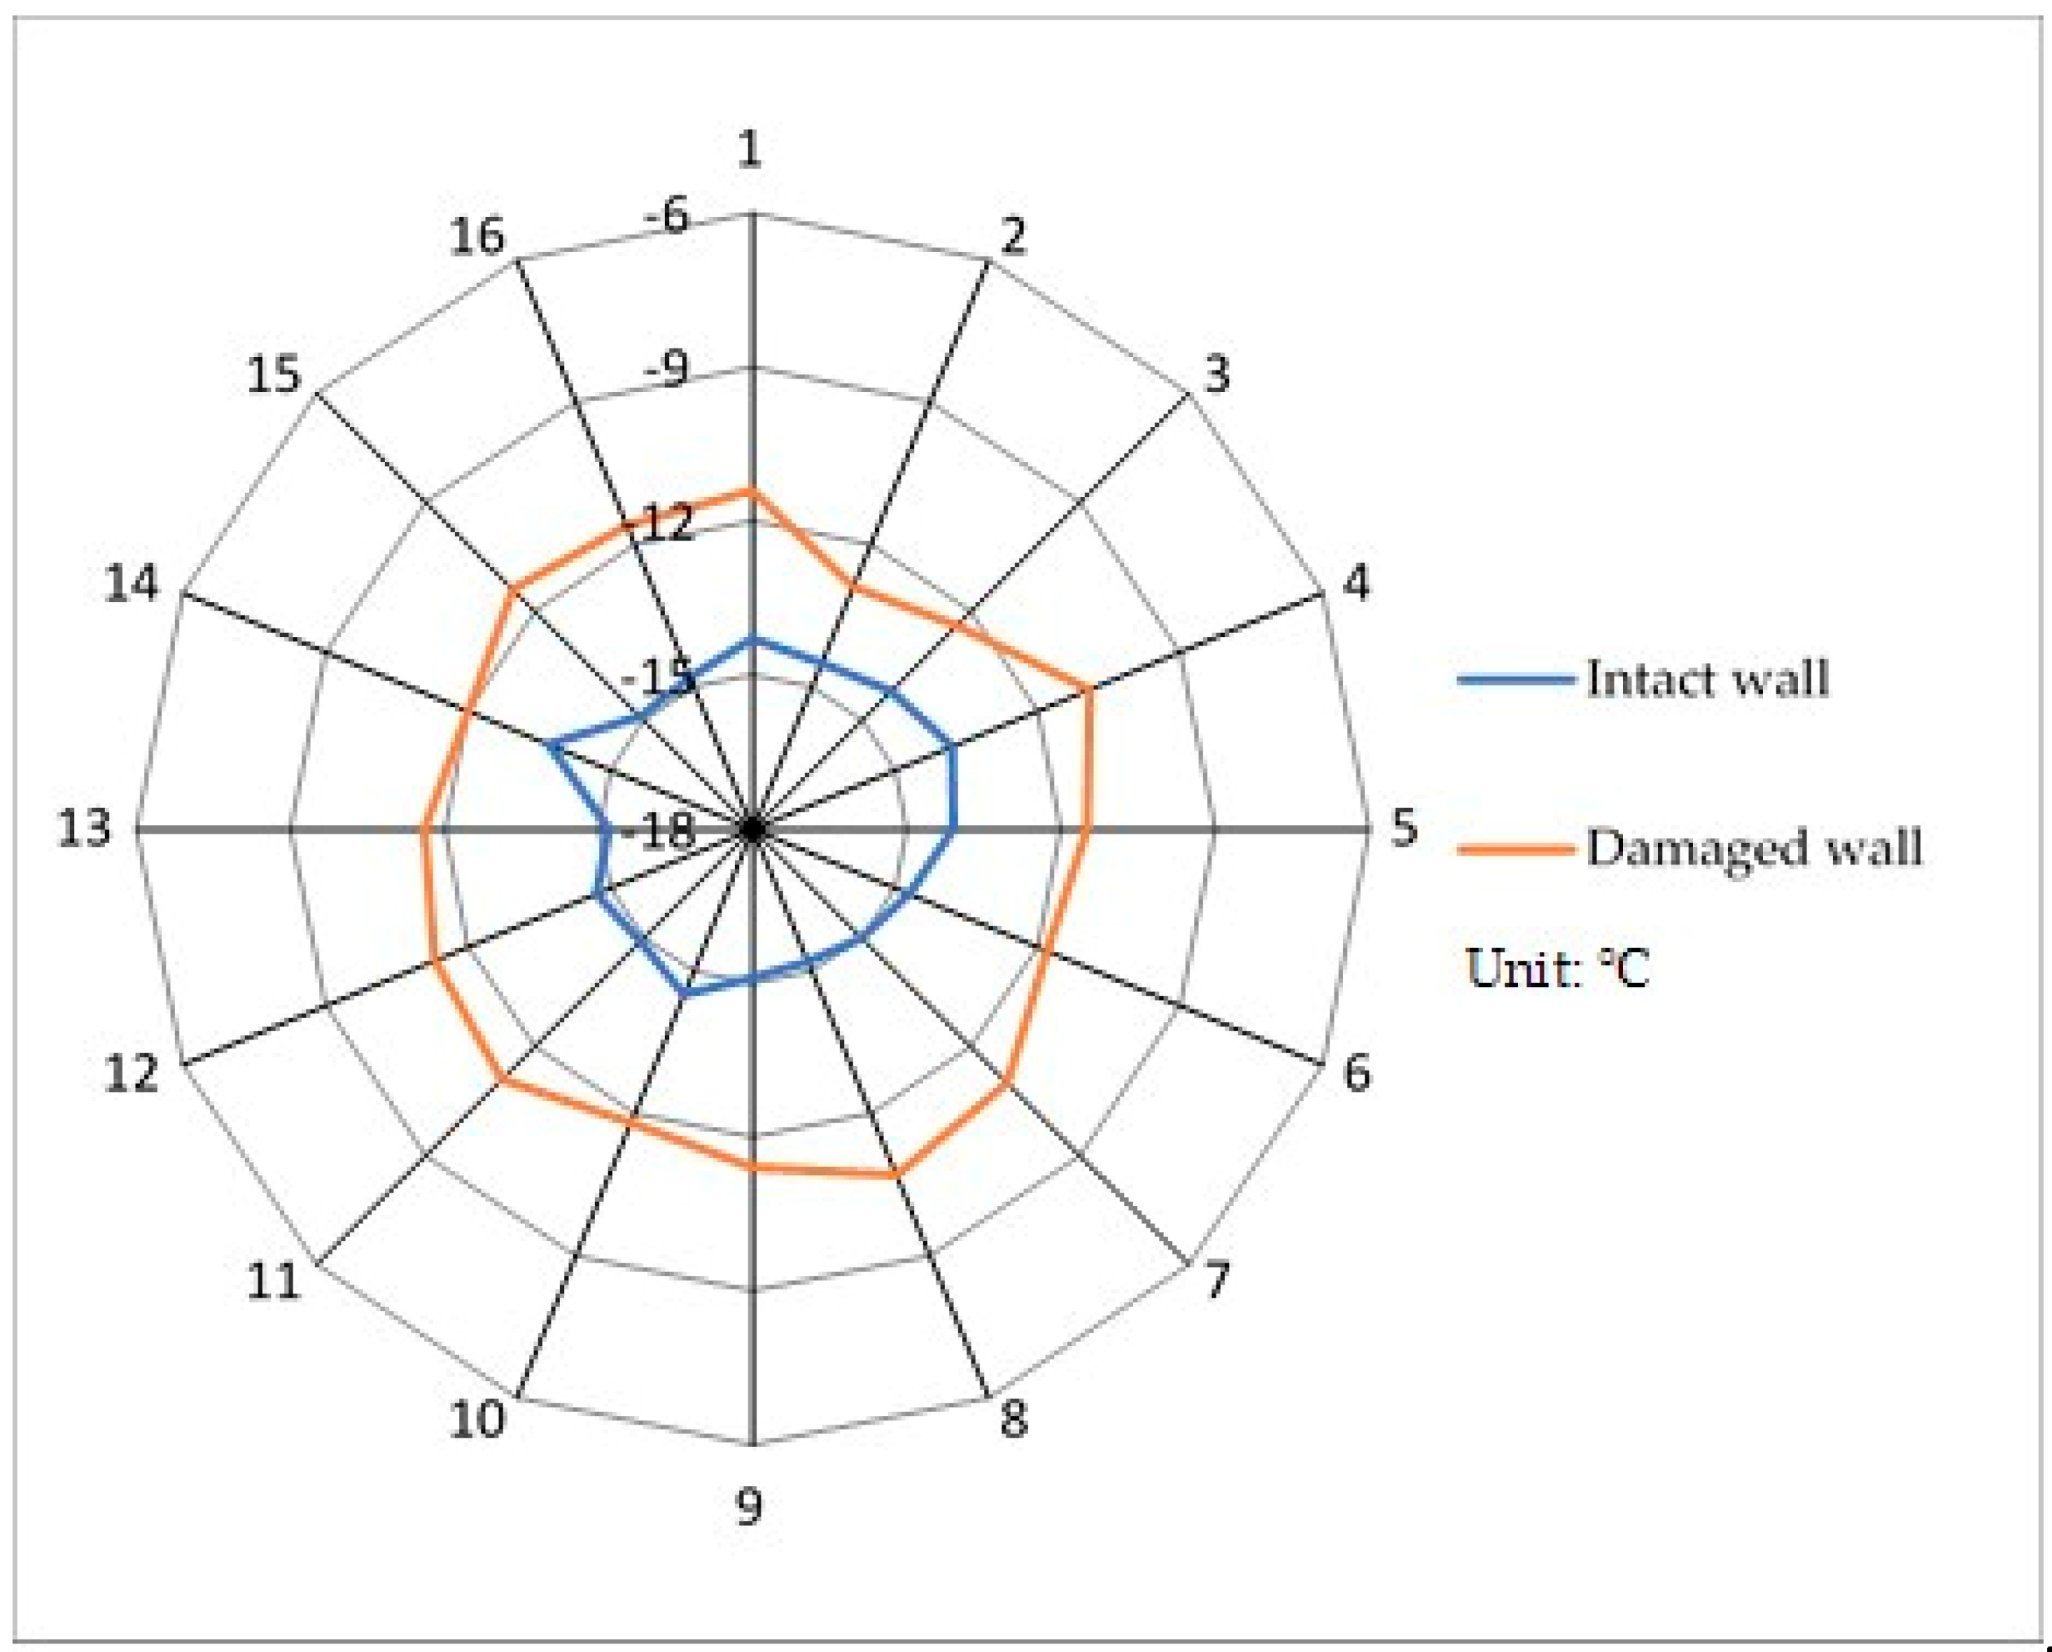
In detecting building walls through infrared imaging, a certain temperature difference exists between the wall and the background. This difference greatly reflects the integrity of the building wall. Accordingly, studying and analyzing the distribution characteristics of the temperature field of the wall and the temperature difference between the wall and the background is necessary. From the infrared thermal image of the wall, we sampled from intact and damaged walls. A total of 32 sample points were selected, 16 for each type. The data were collected in the winter in the western suburbs of Beijing, thus, the temperature in Celsius as shown in the table is relatively low. In the intact wall, the sampling points are SP1–SP16, and in the damaged wall, they are SP17–SP32. The sample data of the temperature field of the building wall are shown in
Table 4, and the temperature distribution radar map is in
Figure 15. We found from the temperature values of the sampling points that the temperature distribution of the intact wall obviously differed from that of the damaged wall. The temperature of the 16 sampling points of the intact wall was evenly distributed and fluctuated slightly. Compared with the intact wall, the temperature of the damaged wall after the disaster was slightly higher. The significant difference in temperature shows the feasibility of extracting cracks through infrared thermal imaging, which provides a theoretical basis for studying the temperature field of cracks in damaged walls.
After analyzing the temperature of sampling points through infrared thermal imaging, we found that the temperature of the points of the damaged wall significantly differed in the whole wall environment, given the uneven spatial distribution. This provides the physical significance and data basis for establishing the relationship between the thermal infrared spectra of building cracks and other damage after disasters and damaging situations.
4.4. Damaged Wall Crack Detection
To verify the reliability of infrared thermal imaging technology in the detection of wall damage after a disaster, we collected post-earthquake site photos of different types of building structures at the earthquake emergency rescue base (116.09° E, 40.27° N). After image preprocessing, the visible and thermal infrared images were analyzed. The thermal infrared images, which represent the details and characteristics of the building wall from different sides, were then superimposed on the visible images of the wall. As a supplement to visible images, thermal infrared images reveal the temperature characteristics of the building wall surface.
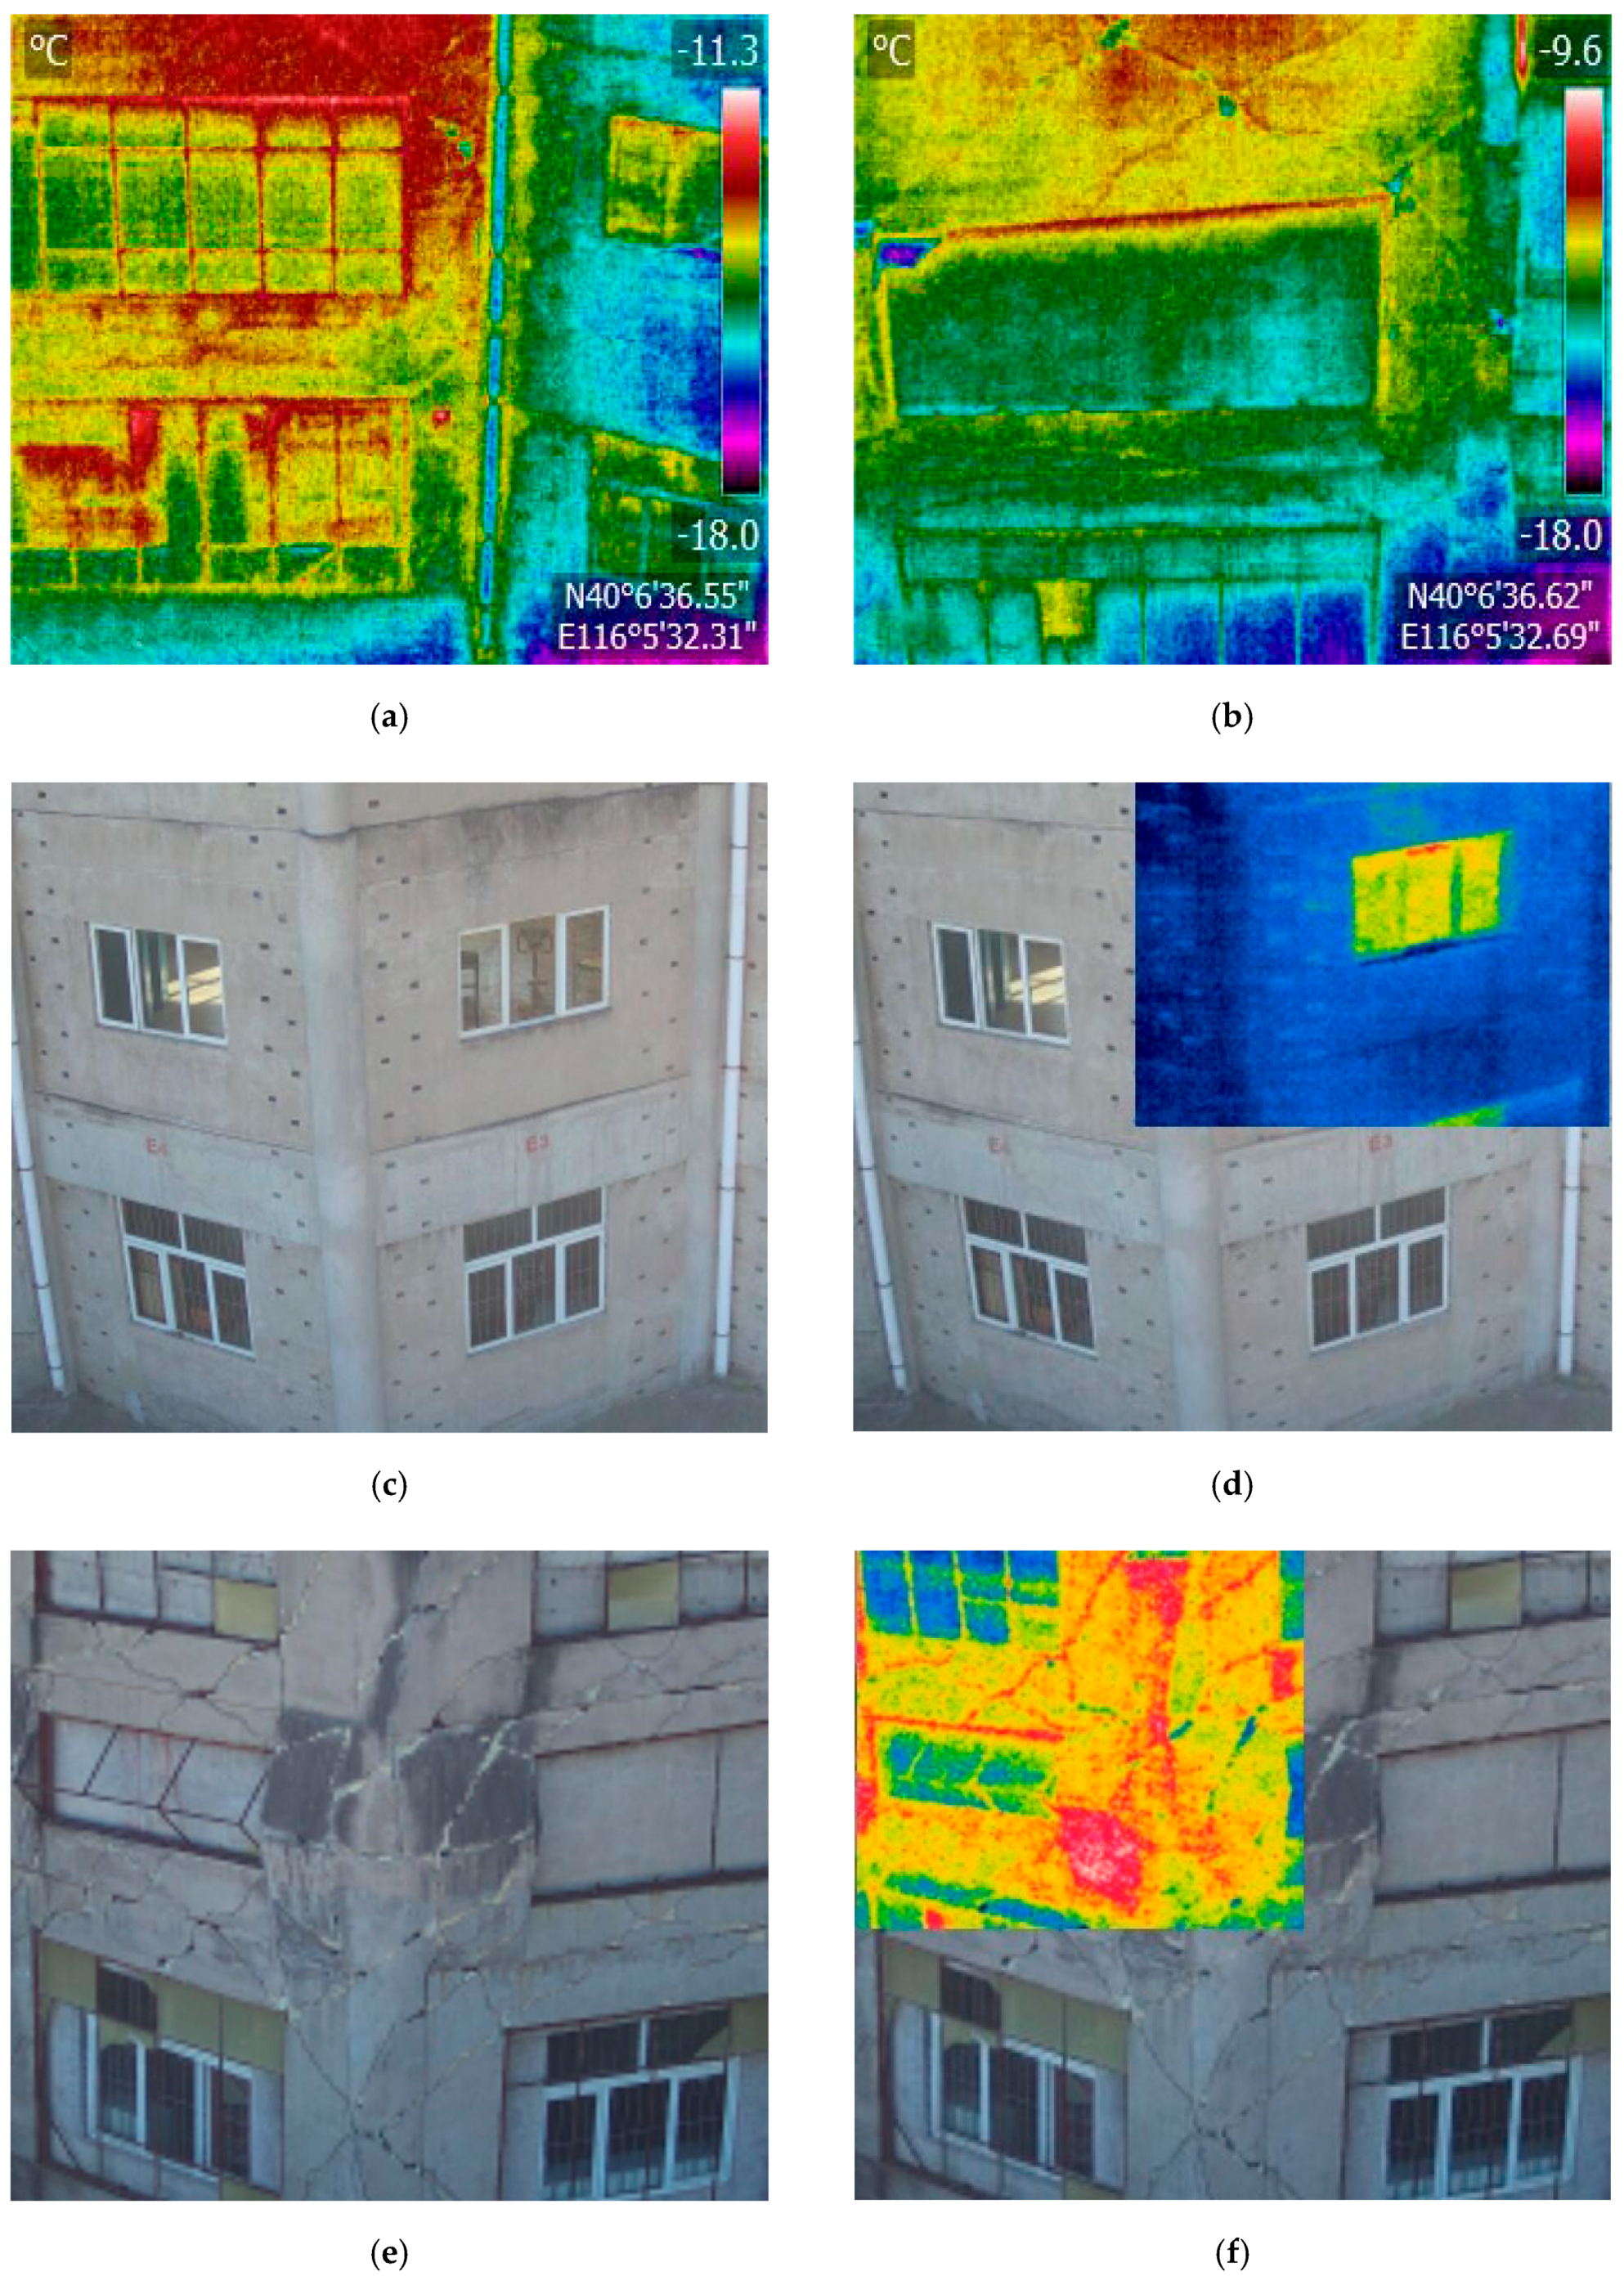
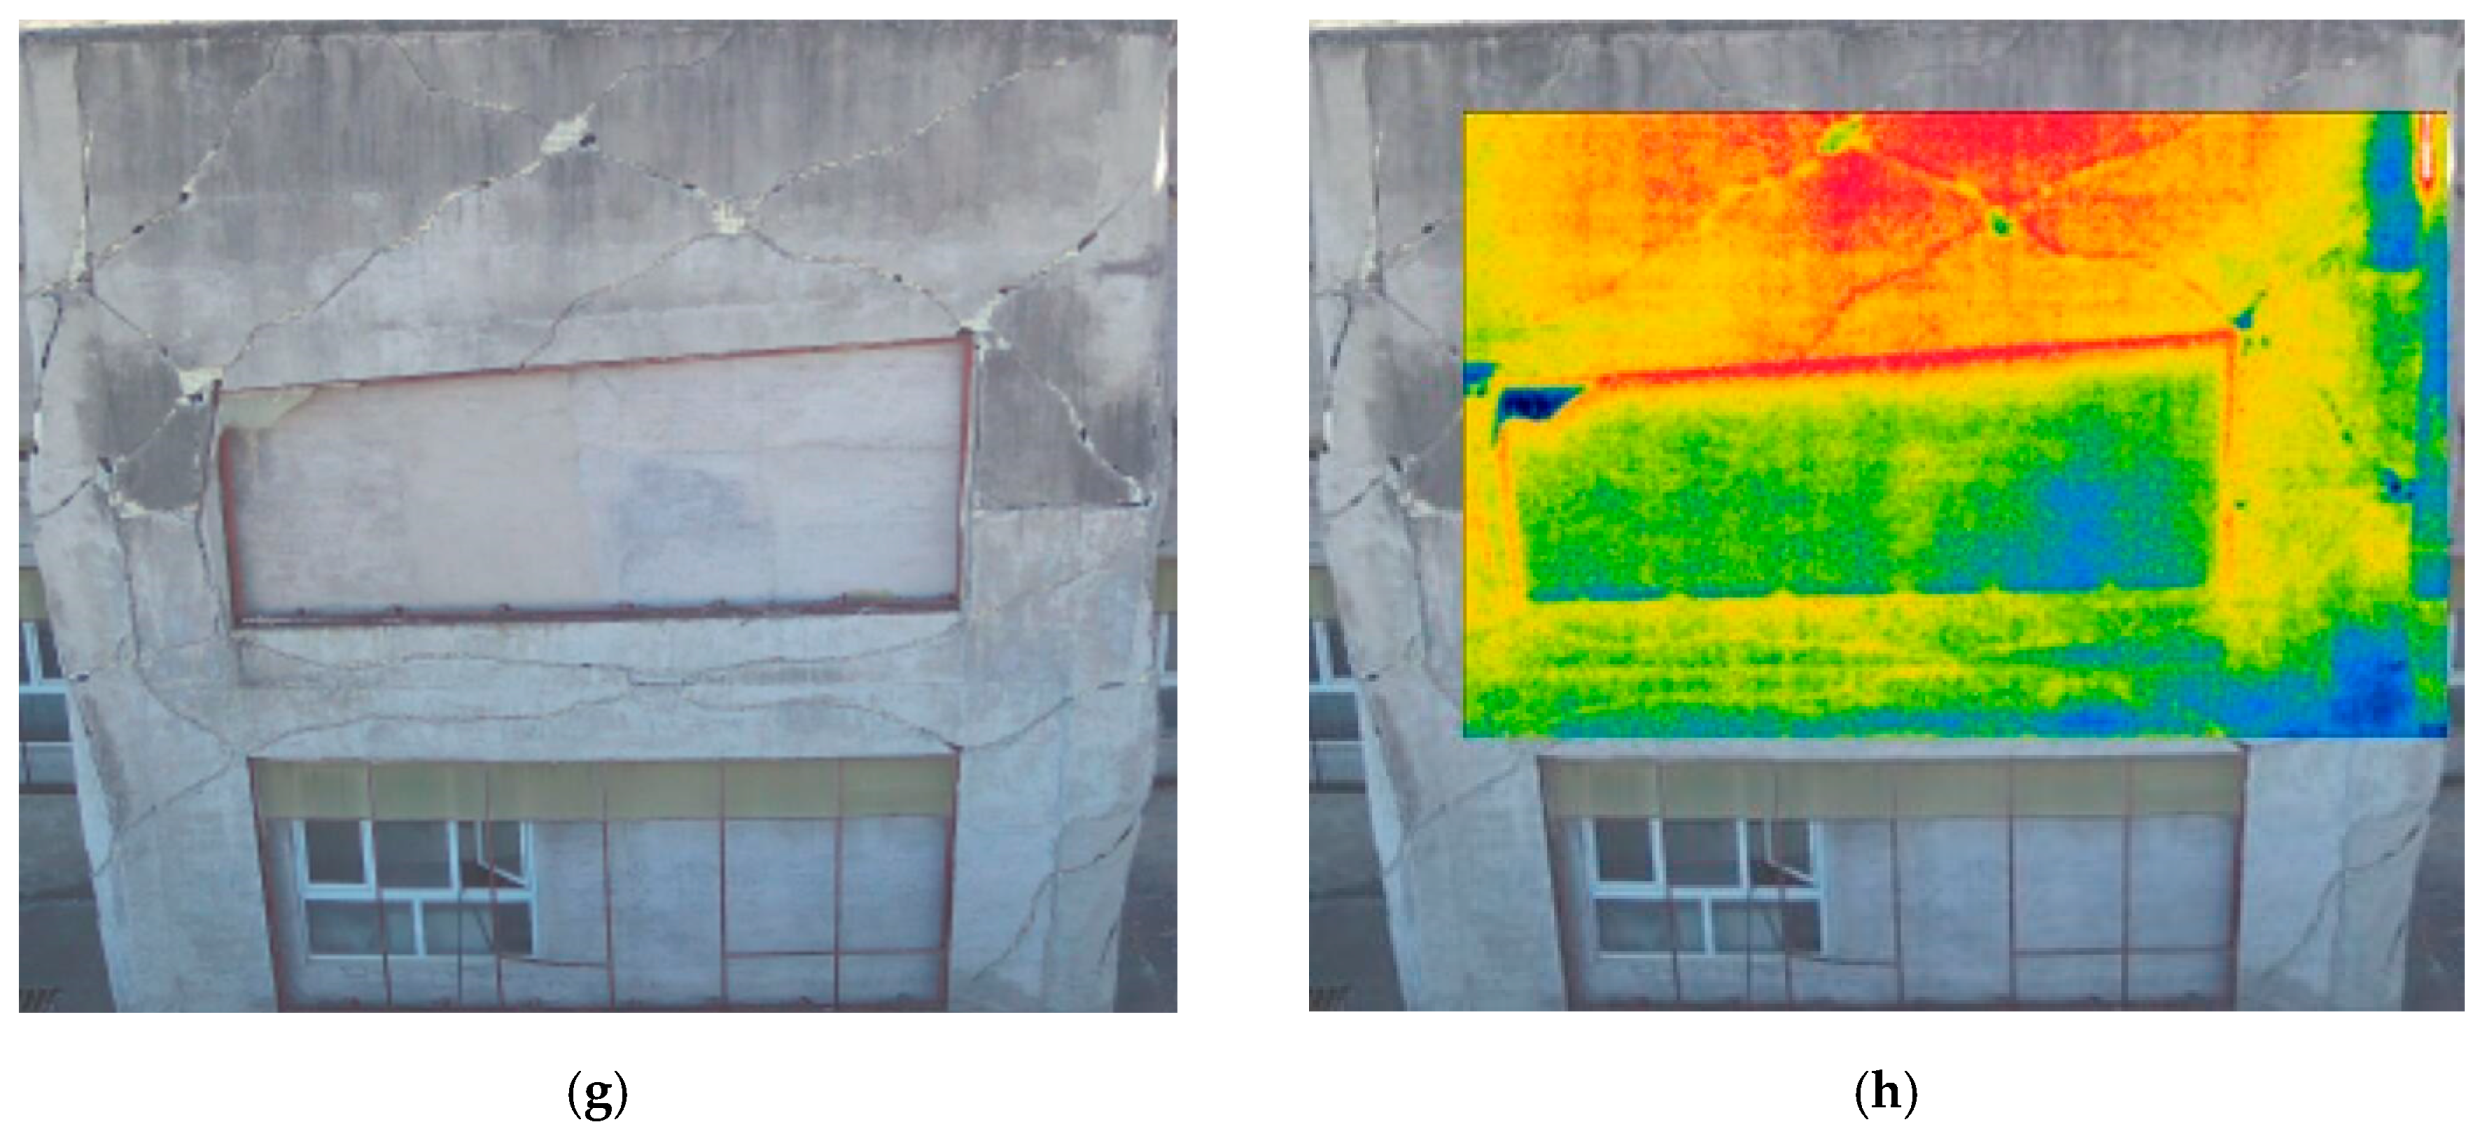
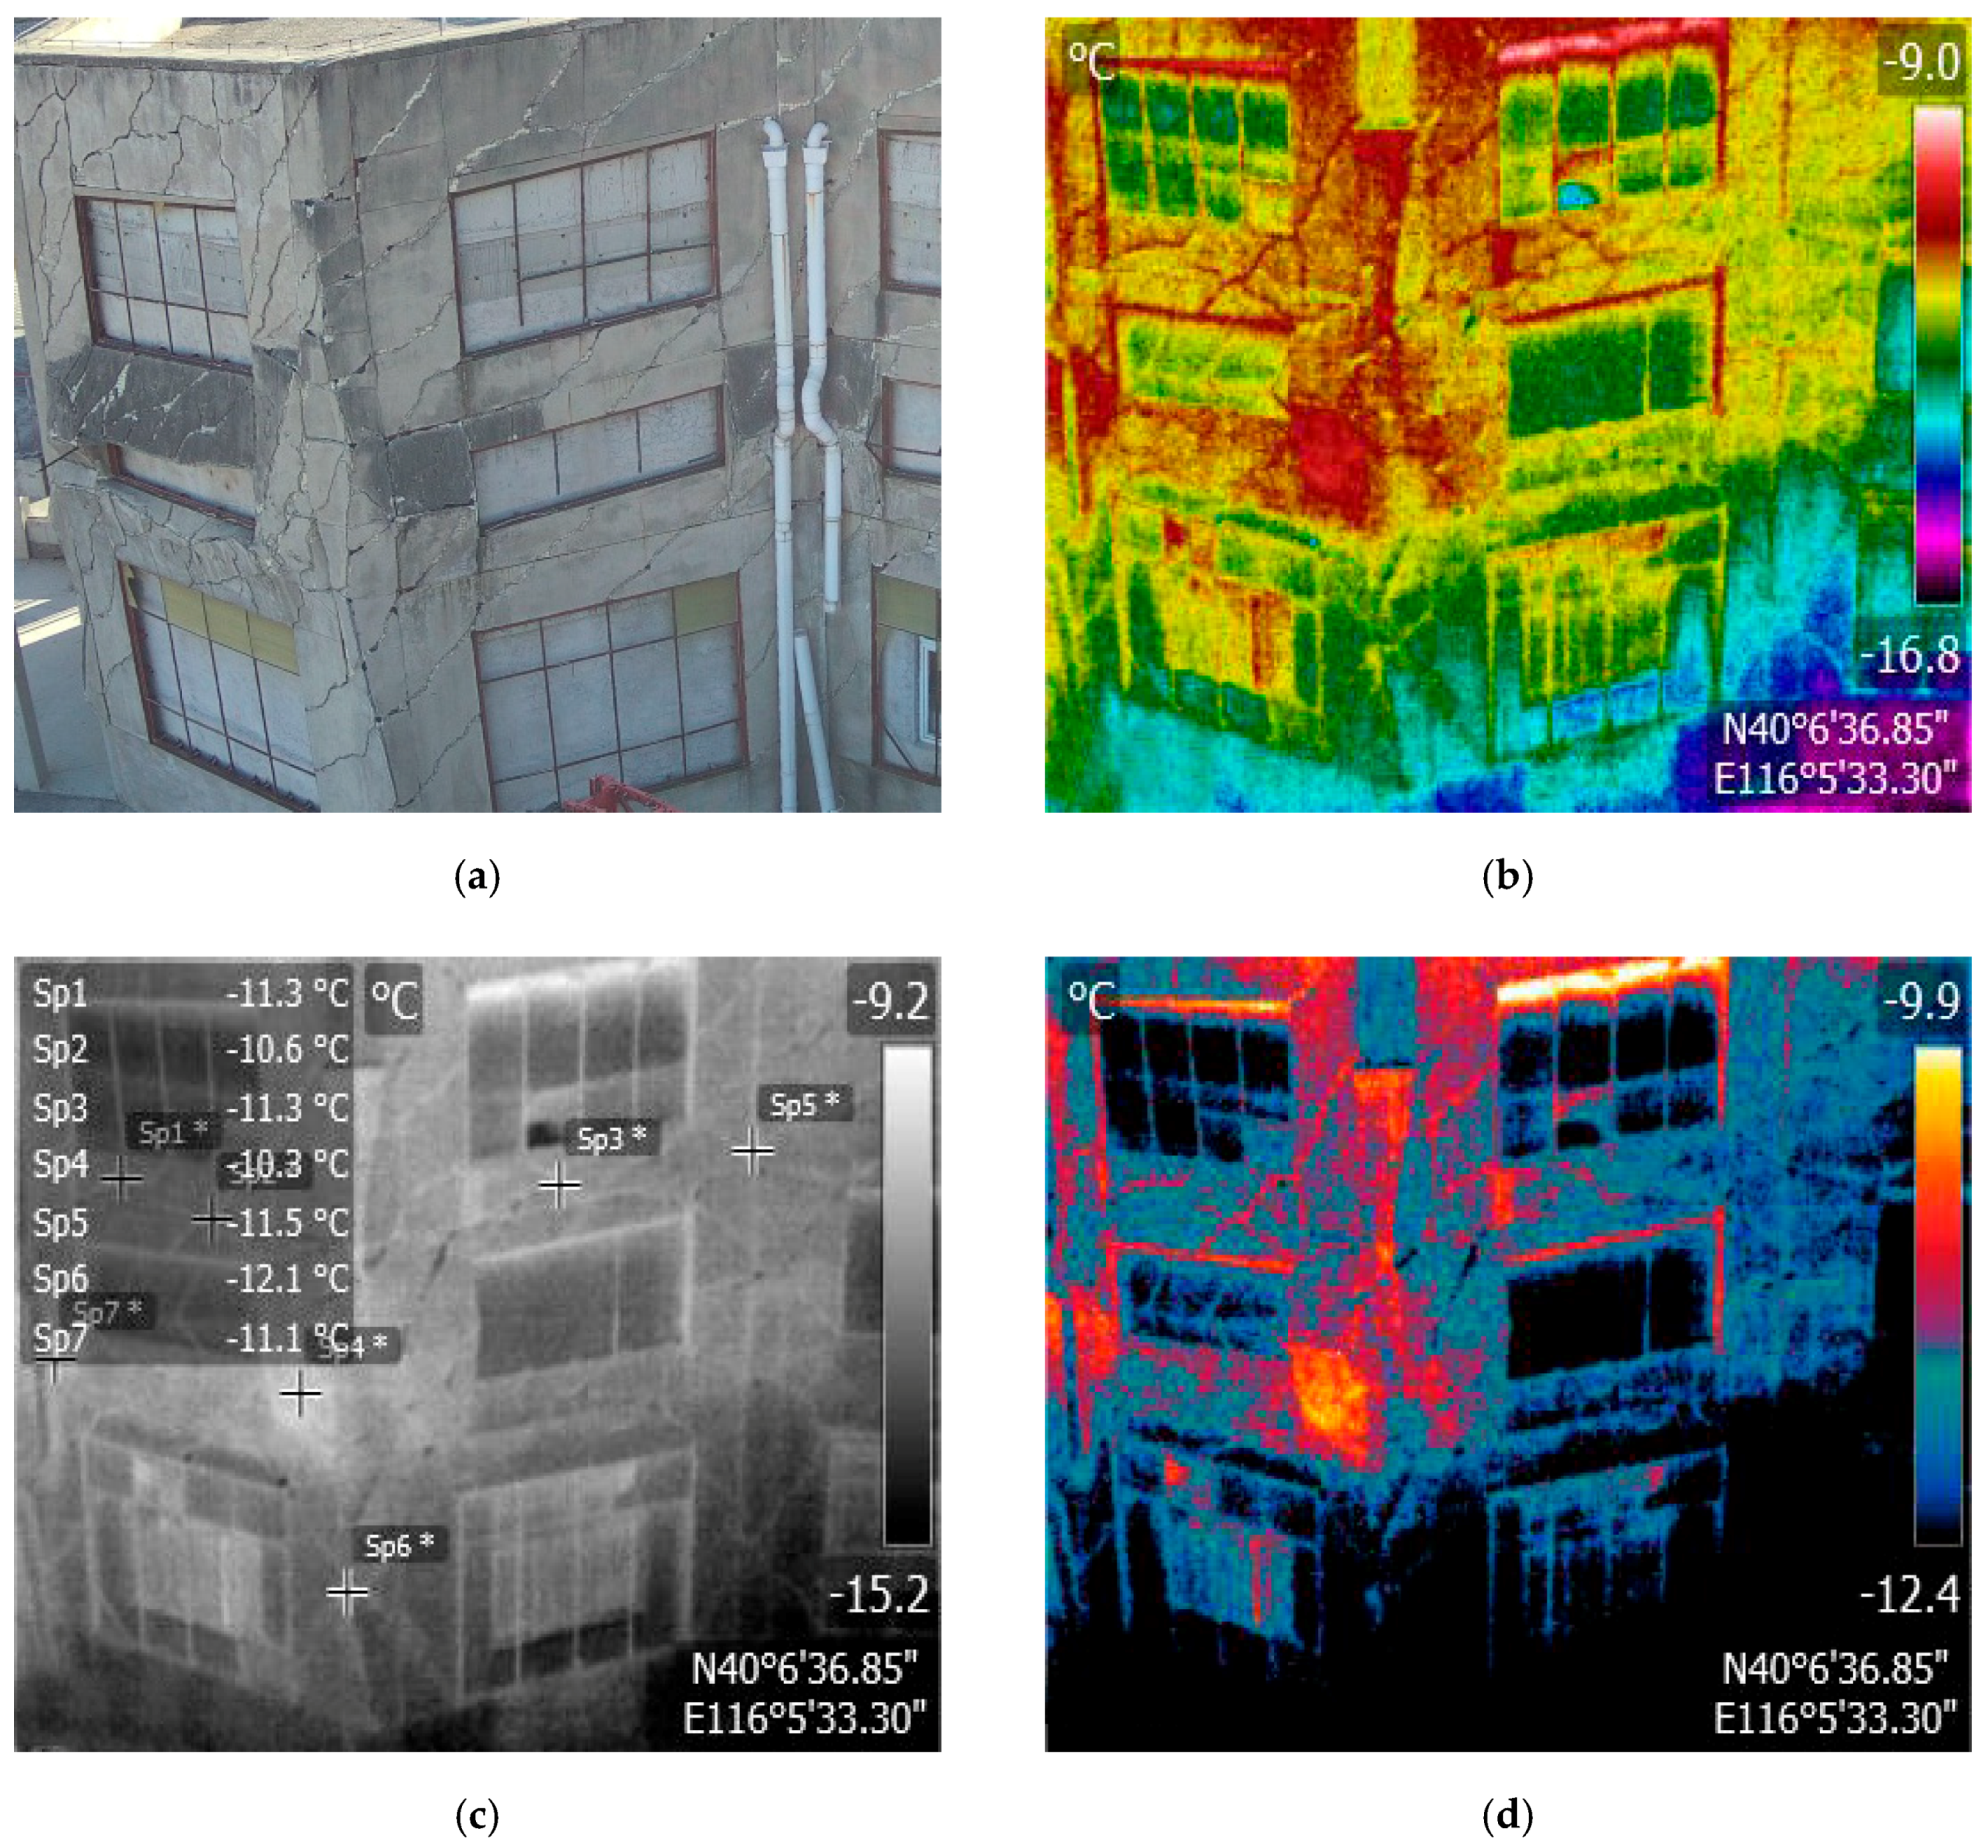
Figure 16 shows the typical thermal infrared spectra of different structural wall types after the earthquake and the performance characteristics of the thermal infrared and visible images. From the thermal infrared images in
Figure 16a,b, we observe that the temperature in the damaged area of walls and around the window significantly differs from that of the intact area. The damage is detected using the temperature differences.
Figure 16c–h show superimposed visible images of the building wall and thermal infrared visible light in the damaged area. In the intact wall area, the spatial distribution of temperature is relatively even, with a consistent color tone. For example, in the undamaged wall and window shown in
Figure 16c, the intact wall temperature image shows a blue distribution. The boundary of the window in the thermal image is well distinguished. In
Figure 16f,h, the wall cracks around the window are clearly shown by the thermal image; the wall radiates energy outward. The thermal infrared image shows characteristics of diffusivity, and the features of the wall have a certain degree of fuzziness.
Thermal infrared images reflect the temperature regime of a structure surface such as a building wall. Thus, as the surface of the damaged area on the wall enlarges, the difference in the surrounding temperature distribution will be increasingly obvious. Compared with conventional visible images, the greatest advantage of infrared thermal images is that building walls and other structures can be detected at night. When a disaster occurs at night, conventional visible sensors do not work. Currently, with the help of infrared thermal images, we can detect important building walls in severely damaged areas, grasp the damage degree, and guarantee timely emergency rescue for the safety of rescue workers’ lives.
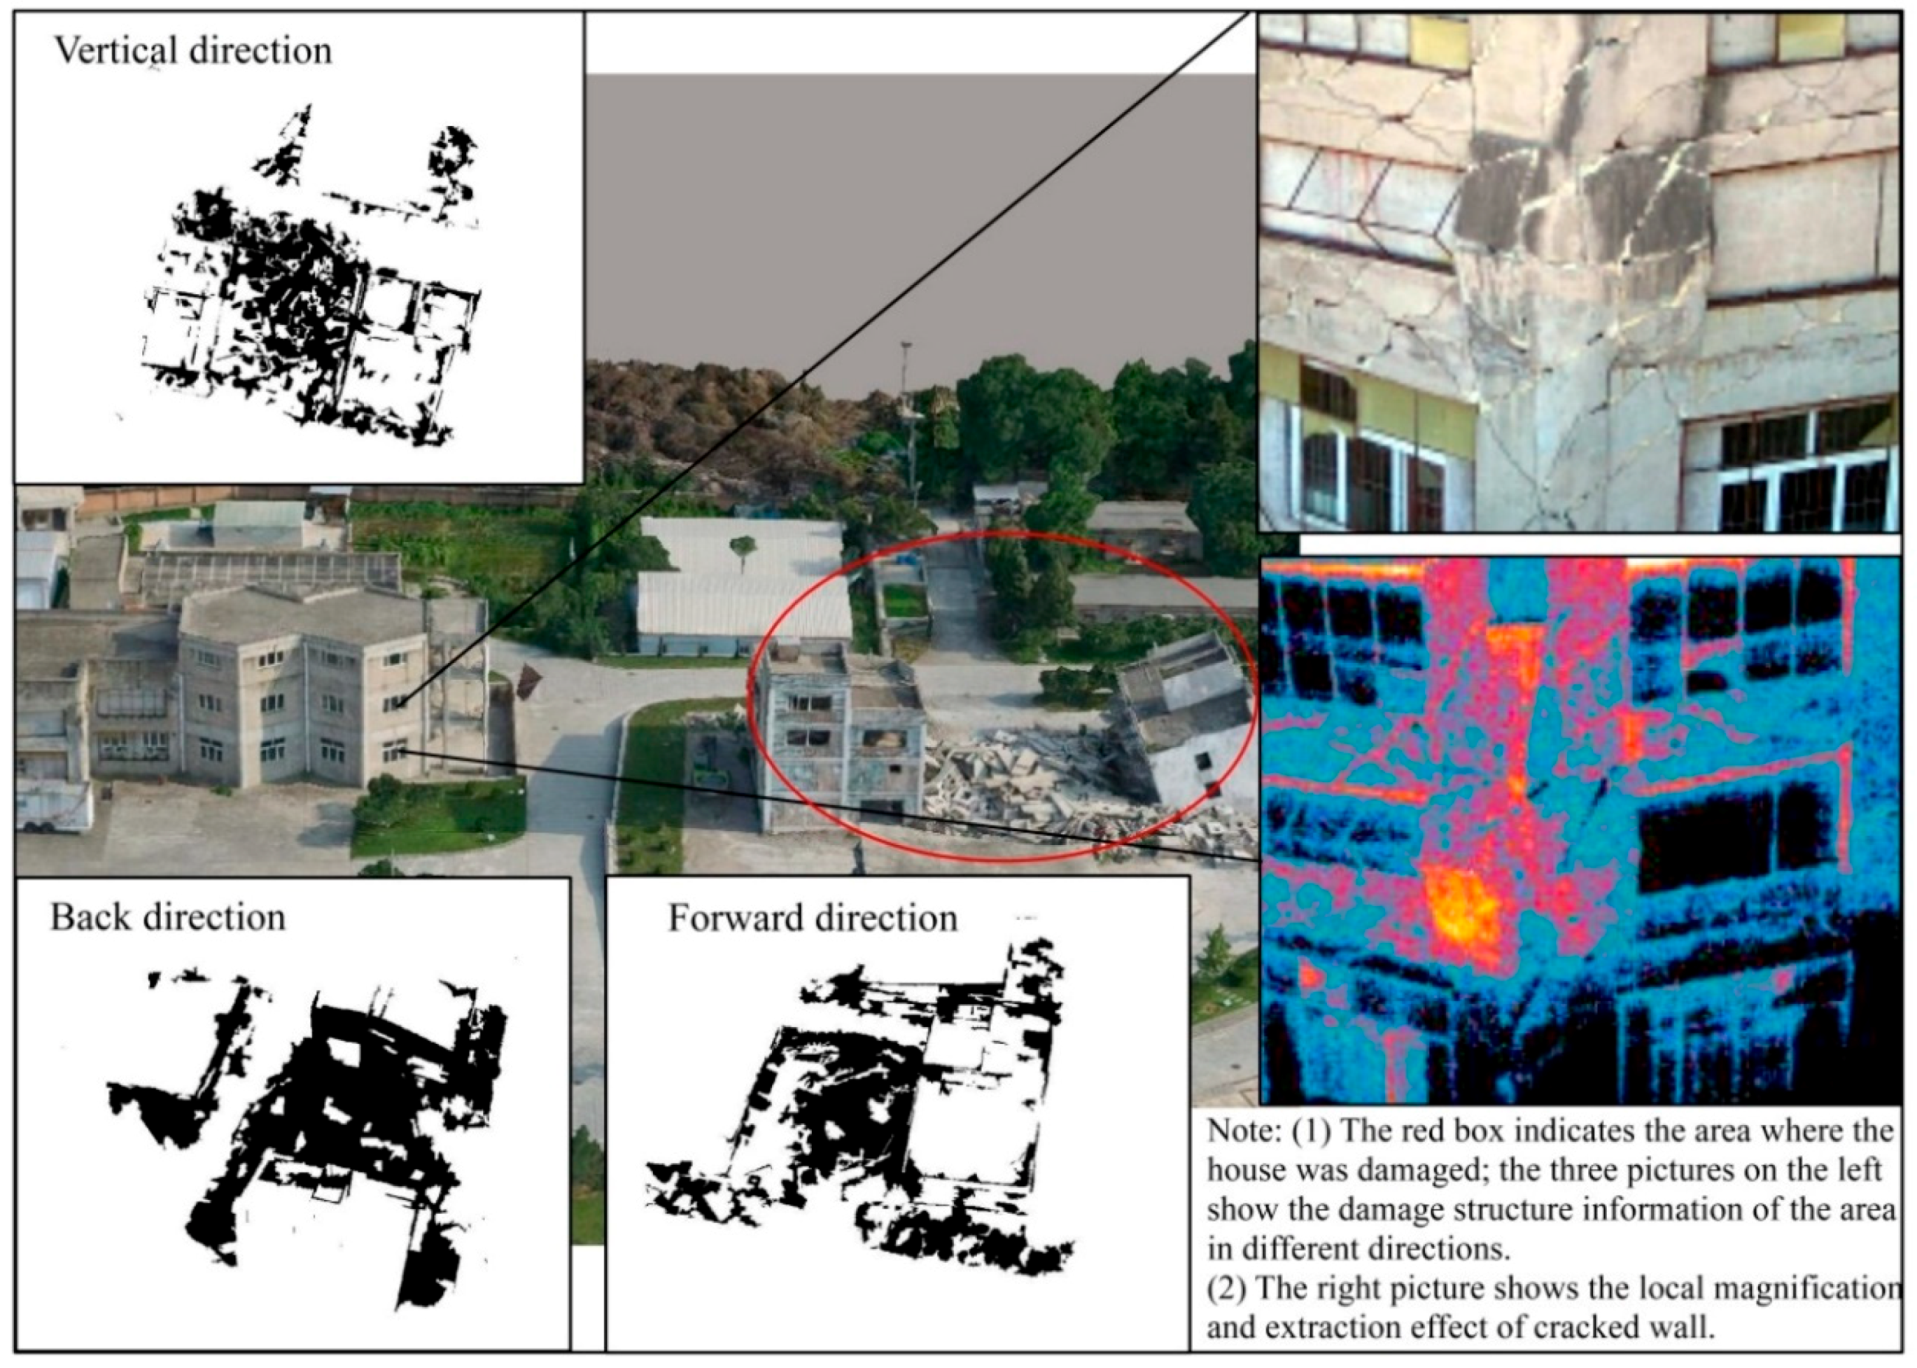
Through histogram equalization, spatial sharpening, and other preprocessing of visible and thermal infrared images, and through the combination of morphological processing methods such as open and closed operation of images, the interference of crack images is eliminated. Then, the thermal infrared image is converted into a grayscale image to place temperature marks of the locations of damaged cracks or fractures. Finally, the binary threshold is extracted according to the marked temperature value to obtain information of the damaged position on the wall. The extraction result is shown in
Figure 17d. The red areas represent cracks or fractures of the damaged wall. We can clearly observe from the temperature distribution that the temperature of the damaged area greatly differs from that of surrounding areas; it is slightly higher than that of the intact wall. Thin cracks, though they may be severely damaging, appear insignificant in the thermal image. In contrast, wide cracks appear significant in the thermal image, since the exchange between the energy inside and outside the wall is conducted through the cracks. The temperature difference of crack damage on the infrared image shows a certain relation with the depth of damage. As the damaged part is gradually aggravated by the slight damage, the significance of cracks in the image also gradually strengthens.
4.5. Integration of Damage Information Detection System for Earthquake-Damaged Buildings
Building damage detection is no longer a rough extraction of information through the use of traditional low- and medium-resolution images. Instead, high-precision hierarchical extraction of damage information is achieved based on high-resolution satellite or 3D oblique images. The damage feature used in damage detection is no longer the traditional 2D image feature; hierarchical extraction of damage information is achieved using the object-oriented method based on 3D structural features or even 2D–3D integrated features. The integration of building structure damage and wall crack information is shown in
Figure 18. The feature information is richer, and the analysis of and ability to discriminate objects in the scene are better. As a result, we can detect the internal structure and obtain wall crack information.
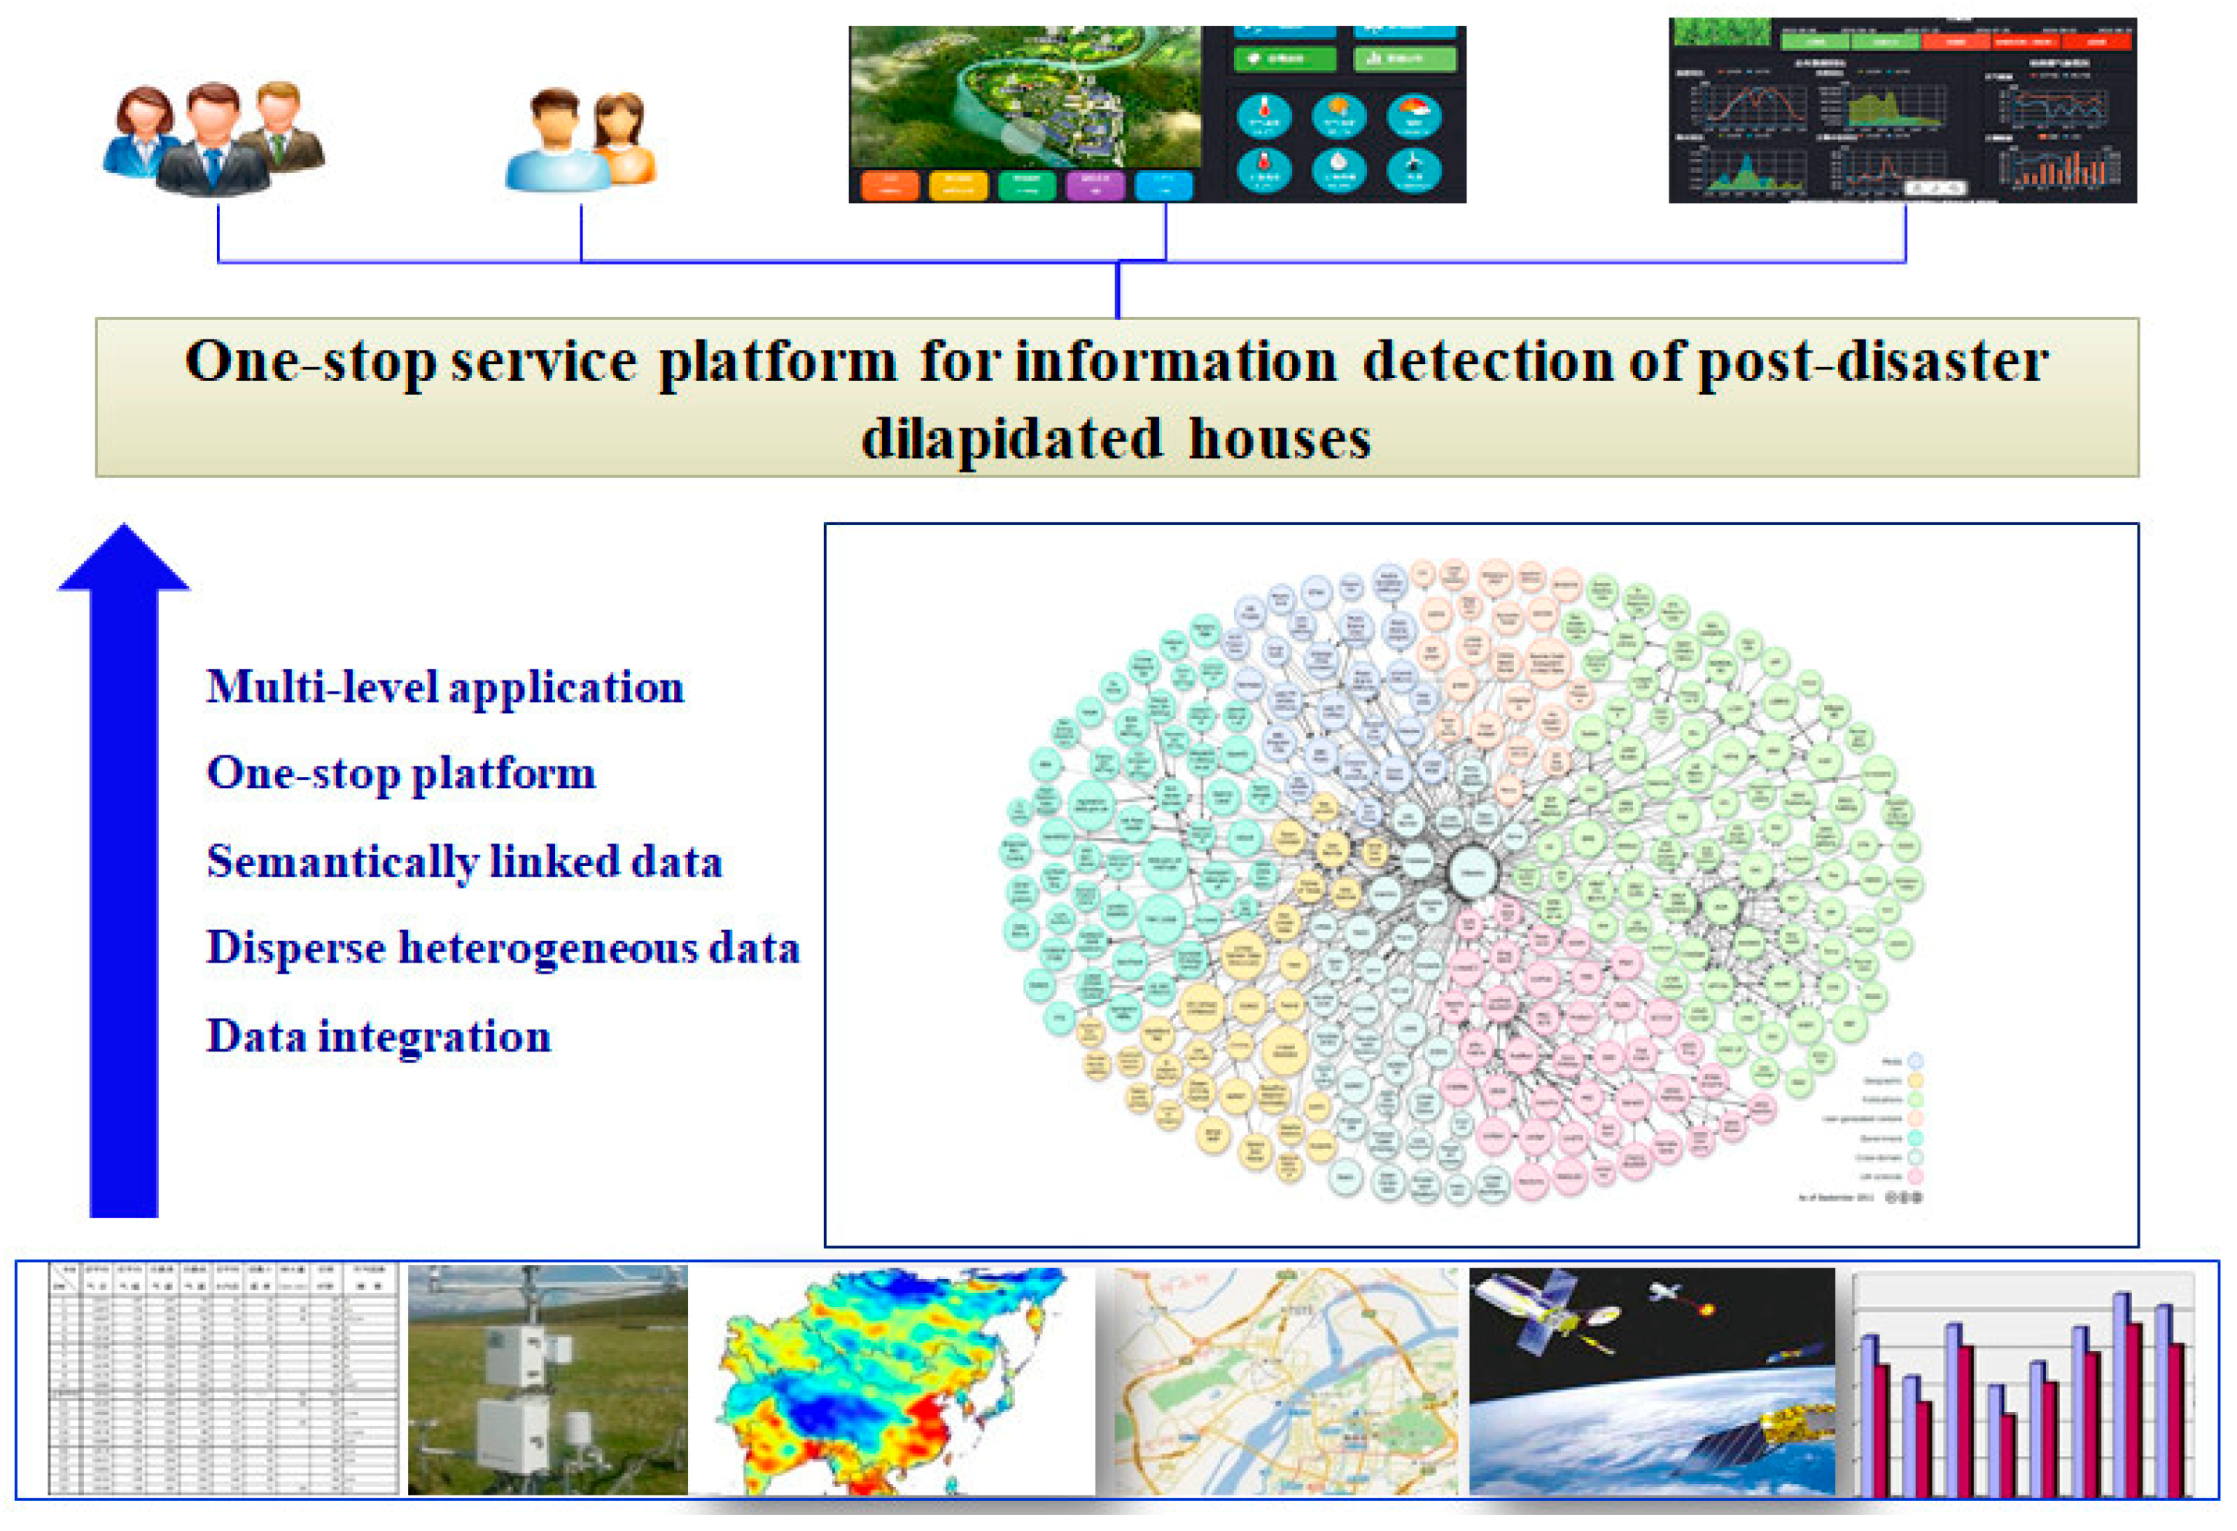
In order to integrate building damage information in a disaster field, we conducted secondary development by using mixed structured and modular programming technologies in this work. We developed a one-stop service platform for information of earthquake damaged buildings, which can run independently and be attached to the browser interface. This setup enables creative study of the spatial management of earthquake damaged buildings, analysis of dangerous situations by thermography, analysis and early warning of huge amounts of data, and other key technologies and methods. The aim is to realize the reliable and effective operation of a real-time dynamic supervision system of earthquake damaged buildings and improve the management and decision-making abilities of business departments. The comprehensive supervision system focuses on convenient, scientific, and dynamic management of earthquake-damaged buildings. By integrating single maps of damaged buildings, grid supervision, early warning, sensor monitoring, statistical analysis, and other functions, the supervision system provides an information-based means for managers to quickly grasp the condition of buildings in their jurisdiction. The overall technical architecture of the system is shown in
Figure 19, including the browser, WebGIS server, and database. The server provides remote sensing images to the browser, and the browser collects damage information and transmits the data to the database for storage. We integrated the extracted information on building damage and published it to the server. Users can freely access our website through the browser. Every record extracted is saved in the database. After a large amount of information of earthquake-damaged buildings is saved in the database, an asynchronous interaction with the server is achieved. This interaction is used to transfer the integrated information on the front end to the back-end database in real time. The collected information is used as input data for the crowdsourced evaluation model. Afterwards, users can perform a loss evaluation of building collapse on remote sensing images, which supports decision-making.
5. Discussion and Conclusions
This paper uses the combined method of ultramicro oblique and infrared thermal images to detect structural damage and external wall crack information of buildings after disasters. First, through the oblique photography technology, we construct 3D remote sensing images of complex scenes after the disaster and select three directional images from the constructed 3D model, thus transforming the analysis of the 3D scene into an analysis of 2D plane images, then extract the structural information of building facades with the object-oriented method and make an accuracy evaluation. Oblique photography can be used to extract the structural information of the post-disaster buildings from multiple angles, which has an unmatched advantage over traditional front-view remote sensing. Then, we analyze the temperature field of the wall in a non-contact manner based on infrared thermal images to find out the temperature distribution and differences in the target body such as breakage and cracks in the damaged part and the surrounding background objects. We use temperature value marking and mathematical morphology to quantitatively extract the crack area, in order to quickly detect the damaged part of the building. The extraction of building structure damage and wall surface crack information is conducive to a rapid emergency response rescue after a disaster.
A number of lessons are drawn from this exercise. First, the main advantage of using unmanned aerial vehicle (UAV) photogrammetry in a post-earthquake scenario is the ability to completely document the state of the damaged structures and infrastructures, ensuring the safety of all operators during data acquisition activities [
40]. Safety and accessibility in the area are crucial concerns after an earthquake and sometimes many areas may be inaccessible, but at the same time, it is necessary to collect data in order to monitor and evaluate the damage. Second, a rapid and accurate damage assessment is essential and crucial after disasters. In the past, mapping of disasters was generally time-consuming, and the results were only available long after the emergency response phase. Recent advances in technology make it possible, and post-disaster mapping in general has a lot to gain from the use of modern and innovative techniques such as the use of GIS-based technologies. As a result, an increasingly large number of applications are being developed for use after the occurrence of a disaster (mitigation, monitoring, and decision support) [
42]. There are several advantages of the UAV oblique photography and infrared thermal imaging. UAVs can quickly lock in the locations of disaster victims, reduce the security risk of night rescue, and discover wall cracks or fractures in a complex area. Compared with traditional remote sensing observations, the combined multi-platform data can better show the damage details and increase the reliability of evaluation. The heat-sensing capabilities of thermal imaging create valuable scene details in which damage and cracks stand out in contrast to the background because of the temperature differences across the objects in the scene.
The emergence of a high spatial resolution (HSR) remote sensing imagery with detailed texture and context information makes it possible to detect building damage based on only post-event data. It is difficult to ascertain the exact degree of damage to a building by using only post-event HSR data [
43], so various types of multi-source data have been used for damage detection. The technology of UAV oblique photography and infrared thermal imaging provides an important way to improve the evaluation of damaged buildings [
44]. With regard to earthquakes, UAV is a fast and cost effective way to provide ultra-high-resolution images of affected areas and conduct rapid post-earthquake field surveys. Spyridon [
10] adopted web GIS applications, UAV surveys, and digital postprocessing to extract data and information related to buildings in the affected area, and the integration of UAV and web GIS applications for rapid post-earthquake response can potentially be considered as a methodological framework. Galarreta [
45] addressed damage assessment based on overlapping multi-perspective very-high-resolution oblique images obtained with UAVs and created a methodology that supports the ambiguous classification of intermediate damage levels, aiming at producing comprehensive per-building damage scores. Yamazaki [
46] constructed a 3D model using the acquired images based on the structure-from-motion (SfM) technique and took an aerial video from UAVs to model the affected districts. The 3D models showed the details of damage in the districts. Tong [
47] presented an approach for detecting collapsed buildings in an earthquake based on 3D geometric changes. Most of these studies were aimed at testing, analyzing, and validating best practices for rapid and low-cost documentation of the damage state after a disaster and the response phase. This paper integrated UAV oblique photography and infrared thermal imaging to extract structural and detailed information, and the method fully utilized the advantages of 3D modeling.
It should be mentioned that the roof or façade damage does not linearly add to a given damage class, a limitation that is fundamental in remote sensing, where there is no assessment of internal structures. This implies uncertainty in the analysis that, especially for lower damage classes, cannot be overcome. The results proved the feasibility of using multi-source data for fine 3D modeling, and showed that this method has the advantages of fast modeling speed and high positional accuracy. To detect detailed information of buildings damaged by an earthquake, we introduce a method of detecting damages and cracks. We combine oblique and infrared thermal images to quantitatively evaluate the damage degree. Based on 3D modeling, oblique images provide a high-resolution structure and texture information of single buildings and residential areas in earthquake affected areas. Infrared thermal imaging can detect the temperature distribution on the surface of the exterior wall using radiation energy, thus detecting wall cracks or fractures. In particular, our method has the unique ability to be used for emergency rescue at night. Compared with traditional orthophoto remote sensing image observation, this method can better show the details of damage, solve practical problems, increase the reliability of research and judgment, and facilitate management and decision making.
By combining ultramicro oblique and infrared thermal images, we can detect the structure damage and crack information of a building’s exterior wall after an earthquake disaster. First, 3D remote sensing images of a complex post-disaster scene are constructed through oblique photography. Three directional images are selected from the constructed 3D model to transform the analysis of the 3D scene into an analysis of a 2D plane image. The building facade structure information is extracted using the object-oriented method, and accuracy evaluation is carried out. The oblique photography can extract the structural information of buildings after a disaster from many perspectives, which is an advantage that traditional positive look-down remote sensing cannot match. The wall’s temperature field is analyzed in a non-contact way based on infrared thermal images to clarify the temperature distribution characteristics of cracks in the damaged part of the building (target objects), surrounding objects (background), and the differences between them. The crack area is quantitatively extracted using the temperature mark and mathematical morphology to quickly detect the damaged part of the building. Extracting the structure damage and wall crack information is conducive to a quick response for post-disaster emergency rescue.
The details of the damage and structural information can be seen from the local information of each view of the three-dimensional model, and the location and volume of the building can be clearly seen. Severely damaged buildings with huge cracks or tilting always show intact or slightly damaged exteriors. With the help of the 3D texture of oblique images, we find that differences in the texture roughness and morphology in many perspectives can help distinguish the structural damage information. By fully considering the spectrum, shape, texture, and proximity of neighboring pixels, the object-oriented approach (FNEA multi-scale segmentation algorithm) was adopted to create image objects and optimize the scale parameters. In terms of analyzing the wall temperature field of infrared thermal images, the temperature values of sampling points in the figure show that the temperature distribution of the intact wall obviously differs from that of the damaged wall. The feature used in damage detection is no longer the traditional 2D imaging; hierarchical extraction of damage information is achieved using the object-oriented method based on 3D structural features or even integrated 2D–3D features.
