1. Introduction
Aerosols suspended in the atmosphere exert a direct effect on the global radiative balance and climate system [
1] and impact air quality as well as cloud and precipitation processes [
2,
3,
4,
5,
6]. These particles remain airborne for periods of days to weeks, vary greatly over regional scales, and do not mix uniformly through the atmosphere [
7]. Because aerosol patterns are changing due to human activity, societal practices, and climate change [
8,
9,
10], the Global Climate Observing System (GCOS) [
11] has set criteria for creating climate data records (CDRs) of aerosol. Satellite observations are necessary to provide the needed spatial and temporal coverage that meets the GCOS criteria to monitor and analyze the global aerosol system in its ever-changing entirety. Specifically, GCOS has set requirements for observing aerosol optical depth (AOD) that include required coverage (global), spatial resolution (10 km), temporal resolution (every four hours), accuracy (better than ±0.03 or 10%), minimal drift (<0.01 per decade), and length of time record (>30 years).
Individual modern sensors on polar-synchronous satellites nearly satisfy the GCOS requirements for global spatial coverage, spatial resolution, and accuracy and drift. For example, the coverage and spatial resolutions from MODIS (Terra and Aqua) are sufficient even if the temporal resolution is not. Advanced retrieval algorithms, such as those used for MODIS, derive AOD with uncertainty (±(0.03 + 10%) over ocean; ±(0.05 + 20%) over land) which approach the GCOS requirements. With the upgrade to Collection 6.1 and associated calibration improvements made to the level 1b input [
12], the drift appears to be near zero. One major requirement remains: in order to qualify as a CDR, the AOD measurements must be maintained for at least three decades.
No individual sensor/spacecraft has a lifespan long enough to meet the 30-year minimum requirement on its own. The first satellite measurements of AOD date to 1979 from Total Ozone Measurements (TOMS) [
13] and 1981 from the Advanced Very High-Resolution Radiometer (AVHRR) [
14]. Their long-term records are stitched together from more than a dozen total launches [
15]. Inconsistencies in sampling and calibration, along with the limited capabilities of the sensors, have been obstacles for creating an AOD record accurate enough to detect trends over time.
Since 2000 and 2002, MODIS on Terra and Aqua has provided orbital stability and advanced calibration that encourages a climatologically useful data record. However, with both Terra and Aqua scheduled to leave their current orbits in 2022, and to be fully shut down by 2025 or 2026 [
16], their maximum possible data record length is too short. An instrument of similar configuration, the Visible Infrared Imaging Radiometer Suite (VIIRS) will continue this multi-decadal record past the lifespans of MODIS Terra and Aqua. Like MODIS, VIIRS operates aboard polar-orbiting spacecraft and passively observes reflectances at many of the same visible and infrared wavelengths.
Two VIIRS instruments are currently in orbit, aboard Suomi-National Polar-orbiting Partnership (Suomi-NPP) and Joint Polar Satellite System-1 (JPSS-1: in operation as NOAA-20), respectively, and future launches are planned [
17]. The similarity of the VIIRS instrument to MODIS makes continuity from MODIS possible, and VIIRS instruments are planned to continue through 2038 [
18]. However, applying the same algorithm to a new sensor does not guarantee a continuous data record. As the comparison between the Terra and Aqua versions of the MODIS record shows [
12], even identical instruments will have differences in calibration and changes in performance over time. This is also true of other aerosol products using multiple copies of the same sensor and algorithm, although the differences are smaller than the differences across less similar products [
19,
20]. When instruments are not identical, the difficulty in maintaining continuity increases. VIIRS has similar capabilities to MODIS, but its spectral and spatial coverages are different. Sampling differences may cause the VIIRS aerosol record to deviate from the MODIS record. In order to ensure that any observed trends in the aerosol record are more than artifacts introduced by these instrument changes, the differences between the MODIS and VIIRS versions of an aerosol product must be carefully investigated.
Here we attempt to extend one of the original MODIS aerosol product records, called Dark Target (DT) [
21,
22], by porting the retrieval algorithm to VIIRS. The work here continues the work presented by Levy et al. [
23] that described the challenges involved in stitching a long-term aerosol record together from MODIS and VIIRS retrievals, yet established that such a record is possible. Those challenges included differences in wavelength band spectral responses requiring new gaseous and Rayleigh corrections, new lookup tables (LUTs), and new empirical parameterizations. Furthermore, differences were introduced by different spatial resolutions and by the absence of specific thermal infrared channels that changed the cloud masking and sampling in VIIRS from MODIS. However, these differences did not introduce systematic biases in the AOD product greater than the uncertainty in the retrievals themselves. The factor that did create a systematic bias greater than individual retrieval uncertainties was attributed to biases in calibration, although those biases were within specifications of the instrument characterization. The Levy et al. [
23] work made use of a preliminary VIIRS-specific DT algorithm that invoked shortcuts in order to obtain an early proof of concept. In the study presented here, a more mature and operationally-ready algorithm is analyzed.
In this paper, we first describe the VIIRS sensor and how this particular hardware configuration translates into potential differences in aerosol products between MODIS and VIIRS. In
Section 3 we describe the Dark Target aerosol algorithm and the necessary changes that were made to accommodate the VIIRS configuration.
Section 4 compares the resulting VIIRS DT retrievals to ground-based and space-borne AOD retrievals from the Aerosol Robotic Network (AERONET) and MODIS.
Section 5 describes the differences between MODIS and VIIRS AOD due to differences in sampling, resolution, calibration, and aerosol retrievability.
Section 6 discusses the conclusions of the study.
2. VIIRS Sensor Configuration and Implications for MODIS Aerosol Continuity
While the goal of the VIIRS Dark Target retrieval is continuity with the existing MODIS record, we cannot require identical results. Some changes are inevitable between the MODIS and VIIRS versions of the algorithm and data product because of inherent differences in each sensor’s configuration. These include the wavelength ranges of the bands the sensor observes, the native pixel resolutions for those bands, the effects of orbit and field of view on the observed imagery, and the independent characterization of each instrument that may introduce calibration offsets. The consequences of these differences range from minor software adaptation to significant disagreement between the resulting VIIRS and MODIS aerosol products. There is also the difference in MODIS and VIIRS sampling: the two sensors may not be observing the same aerosol scene at the same time. Nonetheless, the two products we might expect to have similar statistics.
For a full description of the MODIS and VIIRS sensors, identification of the attributes particularly important for aerosol retrieval and a side-by-side comparison of the sensors from an aerosol perspective, we refer to Levy et al. [
22,
23]. Here, we limit the discussion to an abbreviated identification of sensor differences directly resulting in differences in VIIRS and MODIS Dark Target aerosol products. VIIRS and MODIS sensors include slightly different wavelength bands in the visible and shortwave infrared parts of the spectrum. For MODIS, the Dark Target algorithm uses reflectances in bands centered at 0.44, 0.55, 0.65, 0.86, 1.24, 1.38, 1.63, and 2.11 μm; for VIIRS, the bands are centered at 0.49, 0.55, 0.67, 0.86, 1.24, 1.38, 1.61, and 2.25 μm (see Patadia et al. [
24]). Although aerosol optical depth (AOD) at 0.55 μm is the primary output of the Dark Target retrieval for both sensors, the LUTs used during the retrieval must be appropriate for the specific band and should account for the full spectral response of the sensor. Even small differences between the wavelength bands can lead to significant differences in the reflectance at the top of the atmosphere (TOA), due to spectrally varying contributions of the land surface, Rayleigh/molecular processes, and trace gas absorption.
As input for the MODIS retrieval, the standard MODIS cloud mask (MOD35_L2/MYD35_L2) [
23] uses a combination of visible and thermal infrared bands. Although the bulk of the DT aerosol-cloud mask is calculated internally as part of the DT algorithm, the MODIS DT retrieval is improved by including some of the results from the MODIS cloud mask. However, there are thermal infrared bands on MODIS that have no counterpart on VIIRS, leading to the so-called MODIS–VIIRS continuity cloud mask (CLDMSK_L2_VIIRS_SNPP) [
25,
26]. The change in the externally-derived cloud mask makes a small additional difference in the VIIRS DT retrieval, especially in the masking of cirrus and ice clouds.
The MODIS and VIIRS bands have different spatial resolutions. Of the 36 wavelength bands from MODIS, two are at a native pixel resolution of 0.25 km at nadir, five are at 0.5 km resolution, and the rest are at 1.0 km. Except for procedures such as cloud masking and ice/snow masking, the MODIS version of the Dark Target algorithm makes use of reflectance data either at native resolution or aggregated to 0.5 km. Of the 22 bands from VIIRS, three “image resolution” (I-bands) are at a resolution of 0.375 km and the remaining “moderate resolution” (M-bands) are at 0.75 km. In this version of the DT algorithm on VIIRS, we use only the 0.75 km M-bands. Another difference between the sensors is the line of detectors that receive input radiation from the scanning mirror. The MODIS along-track viewing path is 10 km at nadir, consisting of a detector array of 20 pixels at 0.5 km resolution. The VIIRS equivalent detector array views only 6 km, consisting of 8 pixels at the M-band resolution at 0.75 km. The DT MODIS algorithm organizes into 20 × 20 pixel retrieval boxes [
27] to match the sensor configuration and maintain detector consistency in each retrieval box along the entire MODIS path. The mature VIIRS DT algorithm analyzed here does the same for the VIIRS detector configuration, organizing into 8 × 8 retrieval boxes. Thus, the final product resolution is 10 km for MODIS and 6 km for VIIRS at nadir, but the total number of pixels used by each retrieval per box is different by almost an order of magnitude.
The field of view for VIIRS differs from MODIS in multiple respects. Not only is the observation view angle larger (e.g., ~60° for VIIRS versus 54° for MODIS), but the orbit is also higher. VIIRS aboard Suomi-NPP orbits at an altitude of 824 km, compared to 705 km for MODIS aboard both Terra and Aqua. Thus, the swath of the Earth’s surface observed during any given orbit is wider for VIIRS than for MODIS, and the target view angle (surface to satellite) reaches a sensor view zenith angle of ±70°, rather than the MODIS sensor view zenith angle of ±64°. The result is there are no gaps between the VIIRS swaths on successive orbits as there are for MODIS in the tropics. Despite this, the distortion of pixels at the edge of the swath, where the curvature of the Earth causes a bowtie effect of pixel stretching and oversampling, is less for VIIRS than for MODIS [
28]. Additionally, VIIRS corrects for oversampling by removing alternating rows of pixels as it reaches the edge of the swath. The VIIRS DT algorithm replaces these deleted rows with nearest neighbor pixels in order to retain the shape of the retrieved granule. These differences compound the MODIS/VIIRS differences in sampling created by the differences in spatial resolution. The two instruments may be viewing the same scene, but they resolve the scene very differently because of geometry, spatial resolution, and different approaches to handling the distortion to the Earth’s curvature.
3. VIIRS Dark Target Algorithm
For both MODIS and VIIRS, the principle of the DT retrieval is the same: the relatively bright signal of aerosol in visible and near-infrared channels is contrasted with a darker underlying surface, such as vegetation or open water, for an estimate of AOD. For surface types that do not offer sufficient contrast with aerosol at these wavelengths, such as desert and bare ground, the near-ultraviolet part of the spectrum may be more useful instead; this is the basis of the Deep Blue algorithm [
29]. For MODIS, the Deep Blue retrieval is available only over land, whereas the Dark Target algorithm retrieves over both land and ocean surfaces, but handles the two surfaces separately. Note that the Deep Blue product for Suomi-NPP VIIRS, which includes AOD retrieval over ocean, has already been released [
30].
3.1. The Generic Dark Target Algorithm
Although the DT aerosol algorithm has been described in detail previously [
12,
21,
22,
23,
31,
32] and online [
28], we provide an overview here. The DT aerosol algorithm is actually two independent algorithms: one is used to retrieve aerosol over oceans, and the other is used to retrieve aerosol over land. Over ocean, it is possible to model the surface reflectance explicitly, using the surface wind speed as ancillary data to help determine whitecaps, foam, and glitter (e.g., [
33,
34]). Over land, the surface reflectance relies on too many other factors to simulate directly, but for vegetation and dark surfaces it can be parameterized as a series of spectral ratios [
32,
35]. All versions of the DT algorithm require surface wind speed, ozone, and precipitable water as ancillary data; for both MODIS and VIIRS standard products, this data comes from the nearest six-hourly Global Data Assimilation Model (GDAS) re-analysis product [
36].
The algorithms begin by grouping a set of pixels into a virtual retrieval box and selecting pixels appropriate for retrieval. This involves a cascade of masking that identifies sun glint over ocean, bright or inappropriate surfaces over land, clouds and snow or ice, then eliminates these pixels from further processing [
27]. The surviving pixels in the retrieval box are sorted from darkest to brightest according to values in one wavelength (0.86 μm over ocean; 0.65 or 0.67 μm over land). From these pixels, a portion of the darkest (25% over ocean; 20% over land) and the brightest (25% over ocean; 50% over land) are eliminated, in order to reduce residual contamination from clouds, cloud shadows, glint, and other surface features. The reflectance values of the remaining pixels (surviving both the masking and the elimination of the extremes) are averaged to obtain a single set of spectral reflectances. These reflectances are then corrected for trace gaseous absorption (H
2O, O
3, CO
2, NH
3, etc.) in their spectral band [
24]. These final reflectances are presumed to be far enough from clouds, cloud shadows, and surface heterogeneities to be able to represent only the combination of dark surface, aerosol and molecular scatterings.
Radiative transfer (RT—the calculation of scattering and absorption through the atmosphere) is computationally expensive, so it is not practical to perform at each and every retrieval. Instead, we have performed RT for a subset of possible surface and atmospheric conditions for a range of viewing and solar geometries, and stored them as lookup tables (LUTs). The algorithm tries to match the satellite-measured reflectances to the pre-computed theoretical top-of-atmosphere (TOA) reflectances in the LUTs, optimizing for goodness-of-fit between the observed reflectances and the model estimate. The result is an estimate of the AOD value at 0.55 μm with an estimate of confidence, along with fine and coarse mode fractions and the Ångström exponent (AE). The last of these serves only as a diagnostic measurement in the land retrieval, but is reported as a physical quantity for the ocean retrieval. The retrieved AOD depends on the assumptions that define surface reflectance and the optical properties of the aerosol.
The goodness-of-fit, the number of pixels, and other criteria [
22] contribute to an overall quality-assurance confidence (QA) flag. The QA value ranges between zero and three, in which zero indicates no confidence in the retrieval and three indicates the highest confidence. Because ocean retrievals rely on fewer assumptions than land, the quality-filtered AOD products that will be used in many of the following analyses include retrievals of all non-zero quality flag categories for ocean AOD (e.g., QA ≥ 1), but only of the highest quality flag (QA = 3) category for land AOD. Quality-weighted AODs, as given in the MODIS level 3 gridded products, also exclude the lowest-quality AOD retrievals but find an average of the remaining AOD retrievals that is weighted by the QA flag: A retrieval from the highest quality flag category counts three times as much as a marginal retrieval (QA = 1) to the gridded average. Since the weighting is the same for land and ocean and the flags represent qualitative categories rather than a function of retrieval confidence, this has slightly different results than the quality-filtered average AOD. The protocol for determining QA flags is unchanged from the MODIS DT in the VIIRS DT algorithm.
The generic DT algorithm was developed for MODIS, but has been adapted for a variety of sensors including the enhanced MODIS Airborne Simulator (eMAS) [
37], the Advanced Himawari Imager (AHI) [
38], and the Advanced Baseline Imager (ABI) as well as for the VIIRS version discussed here. In each case, specific attributes of the sensor have required modifications to the algorithm.
3.2. Customizing the VIIRS Dark Target Algorithm
First, the DT algorithm for VIIRS must customize the masking and selection processes. As noted in
Section 2, the MODIS DT cloud masking relies, in part, on the standard MODIS cloud mask (MOD35_L2/MYD35_L2) [
25]. However, VIIRS has some missing thermal infrared channels, which led to the development of a degraded ‘continuity’ cloud mask that can be used on either MODIS or VIIRS. For our DT retrieval, we use the VIIRS version of the continuity cloud mask (CLDMSK_L2_VIIRS_SNPP) [
26]. This change should have minimal effect on the aerosol retrieval because the internal cloud masking procedure, based on spatial variability and the 1.38 μm cirrus band, identifies 98% of the DT cloudy pixels [
39,
40]. The masking of ocean glint, bright land surfaces, and snow and ice have been ported from MODIS to VIIRS unaltered. Because the thresholds on these spectral tests have not been specifically adapted to VIIRS, there may be some changes in sampling caused by the difference in spectral channels or spatial resolution. Thresholds that provided appropriate separation between a desirable pixel and an undesirable one based on MODIS bands may not provide that same fidelity of separation when applied to a similar, but not identical, VIIRS band.
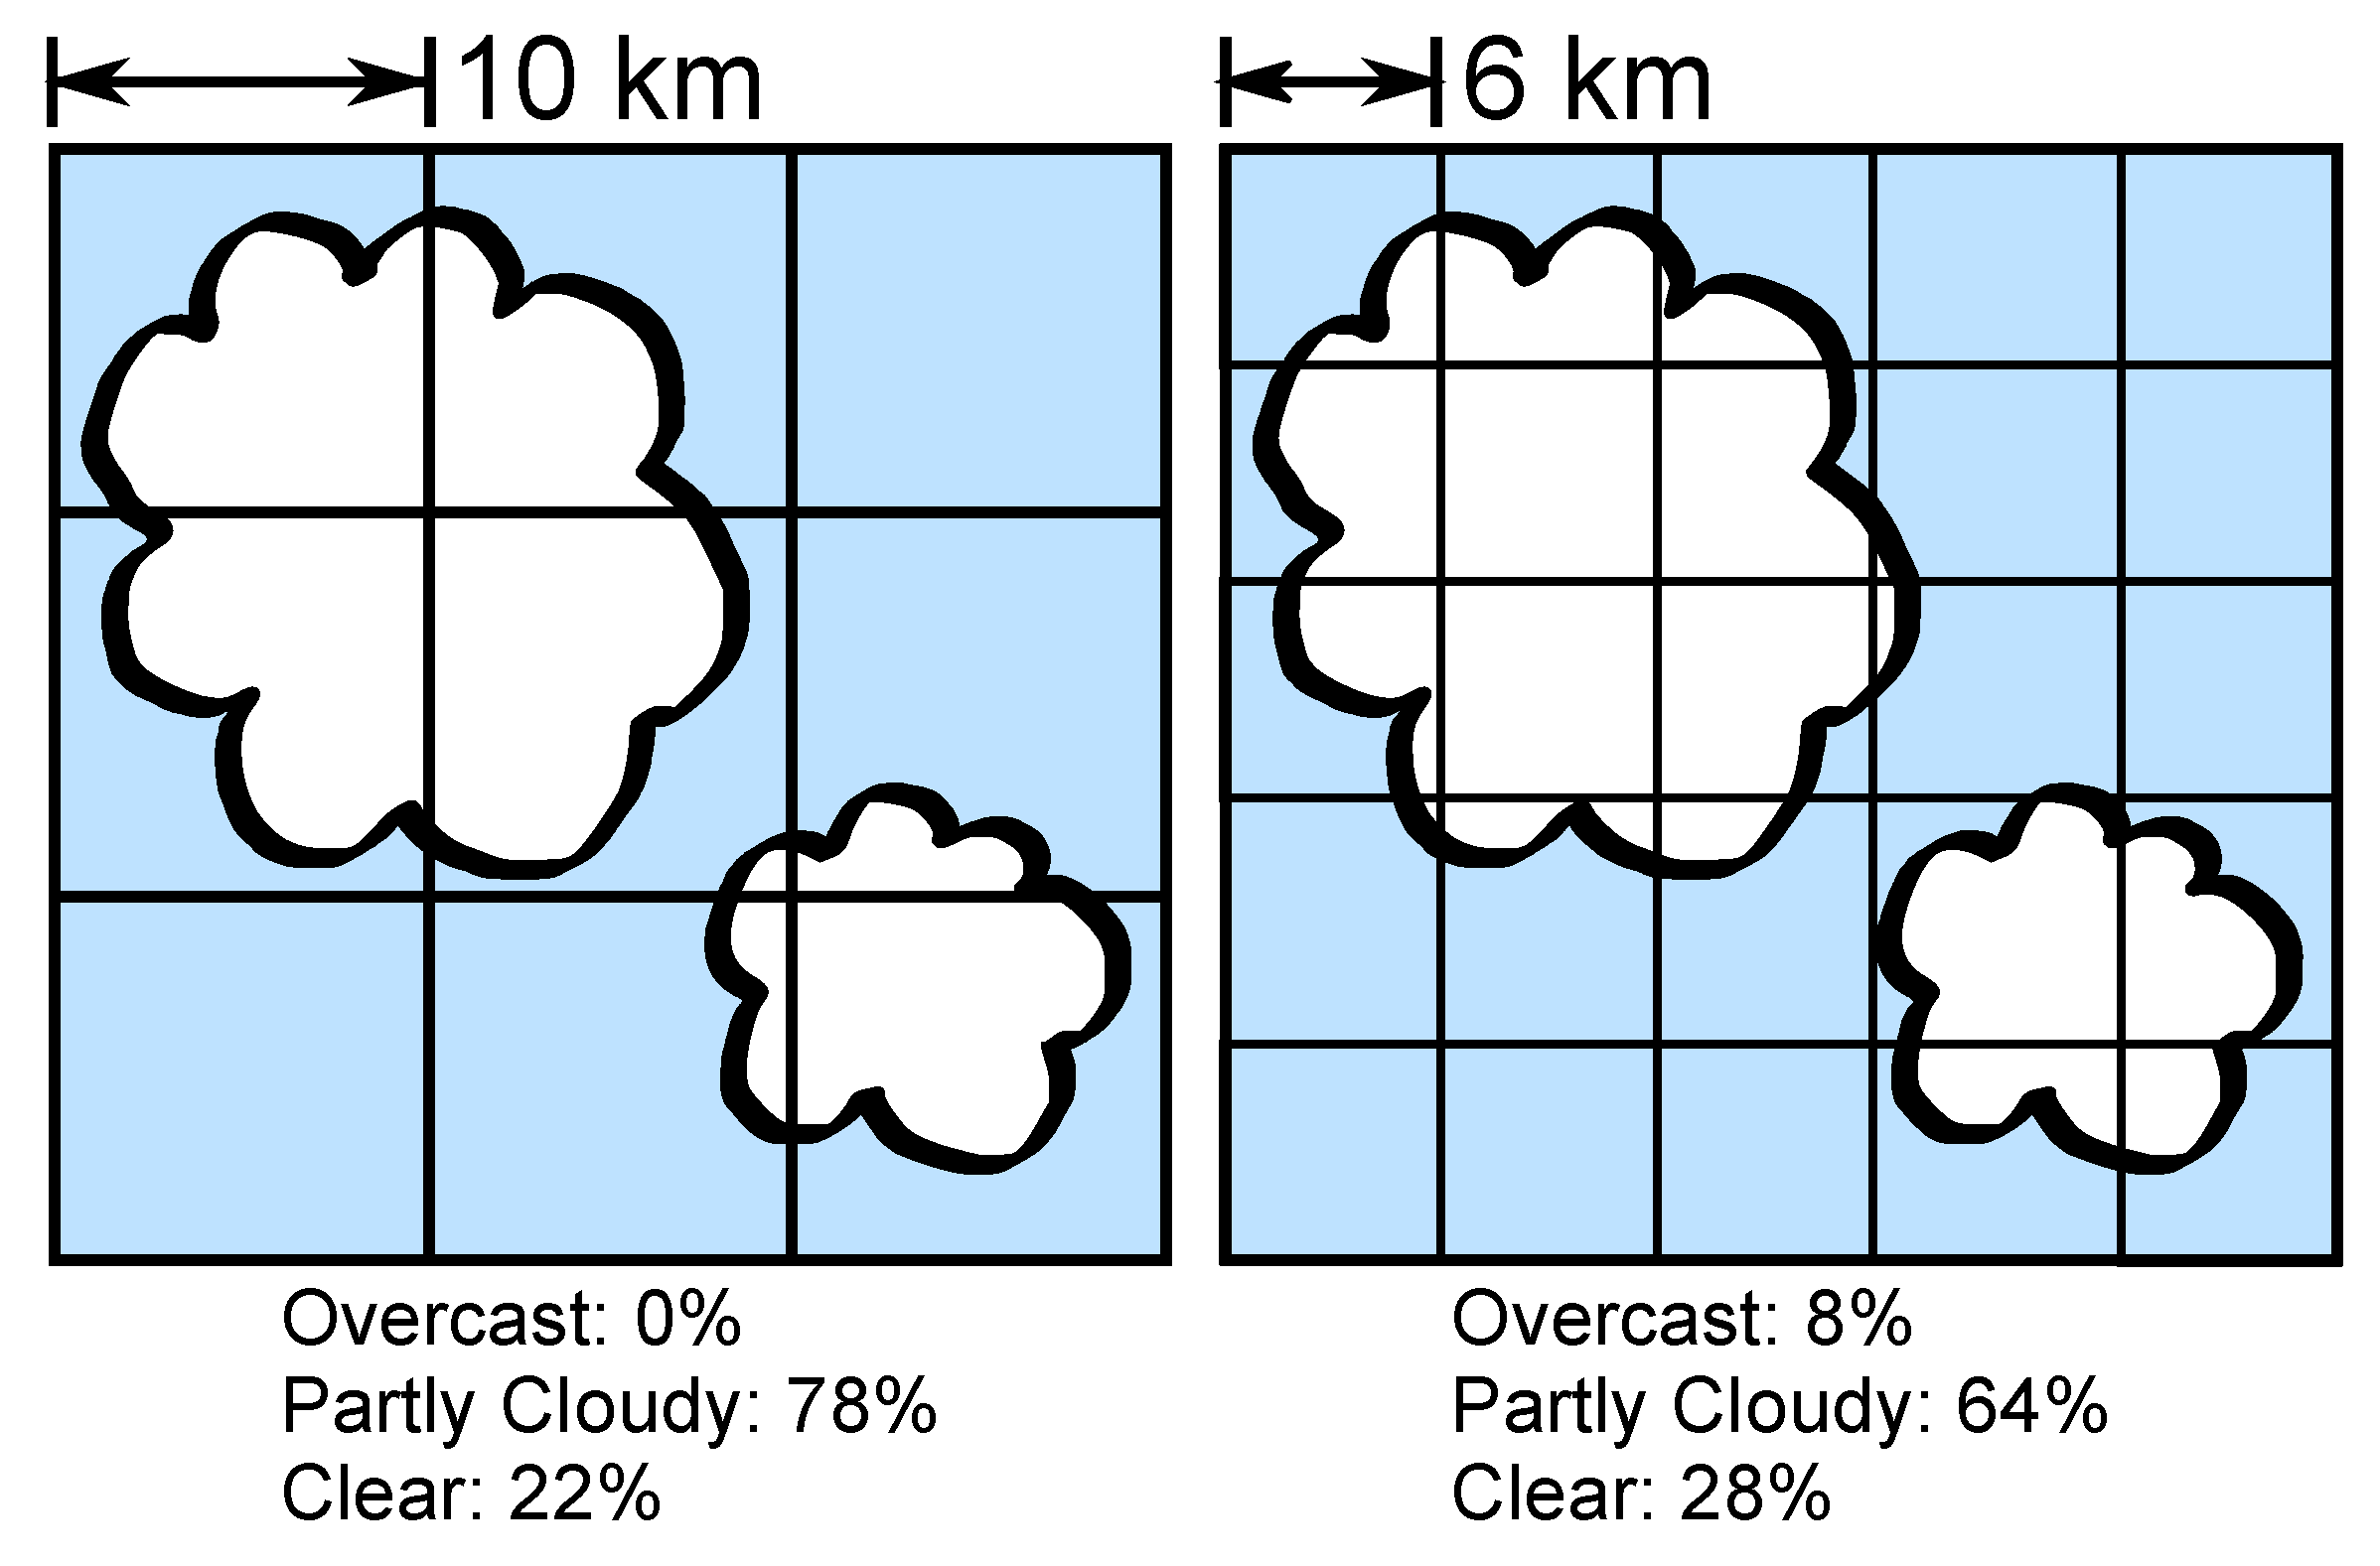
Because the VIIRS DT retrieval uses 8 × 8 boxes of pixels at 0.75 km nadir resolution, instead of 20 × 20 boxes at 0.5 km resolution for MODIS, the maximum number of available pixels is 64 rather than 400 (i.e., if none are removed by the above masking processes). The process of sorting and residual elimination over ocean (brightest 25% and darkest 25%) and land (brightest 50% and darkest 20%) leaves a VIIRS maximum of 32 surviving pixels over ocean and 19 pixels over land, compared to 200 and 120 pixels, respectively, for MODIS. For a valid retrieval, the DT algorithm requires 2.5% of the original 64 (VIIRS) or 400 (MODIS) pixels over ocean to survive masking and sorting, and 3.0% over land; that is two pixels over either ocean or land for VIIRS, but 10 pixels over ocean and 12 over land for MODIS.
There are consequences to the smaller (6 km versus 10 km) and less populated (factor of ~1/6 pixels) retrieval boxes. First, there are altogether fewer pixels to work with in each retrieval box and fewer pixels to eliminate. A marginal pixel that would be eliminated in the MODIS DT process might not be eliminated in the VIIRS DT process. These marginal pixels may introduce artifacts and biases, and otherwise degrade the quality of the final product. A similar situation was encountered in the MODIS DT 3 km algorithm, which used a retrieval box of 6 × 6 pixels at 0.5 km resolution, or a starting number of 36 pixels [
41,
42]. Second, because there are fewer pixels in each retrieval box and the percentage thresholds are rounded up, the two-pixel minimum for VIIRS is actually harder to reach than the 10- or 12-pixel minimum for MODIS, and fewer retrievals may result. Thus, the finer resolution product (6 km versus 10 km) of the VIIRS DT algorithm versus the MODIS DT algorithm may or may not result in more individual retrievals, as more retrieval boxes may fall beneath the required minimum number of pixels threshold. The bottom line is that pixel selection differences will result in different sampling patterns, and those different sampling patterns can affect the spatial distribution of the aerosol product, the magnitude of the retrieved AOD, the accuracy of the retrieval, and the assigned quality flag to the retrieval. These effects are discussed further in
Section 5.3.
Additional sources of differences between VIIRS and MODIS DT products are introduced with the construction of the LUT for the specific spectral response functions of the VIIRS sensors. To minimize these differences, the same radiative transfer codes are used to construct the VIIRS LUT as have been used for MODIS and other sensors. These codes are Ahmad and Fraser [
43] for ocean and a combination of Wiscombe [
44], Evans and Stephens [
45], and Dubovik et al. [
46] for land. The same geometrical, AOD, and wind speed nodes are used for VIIRS as they were for MODIS, and the aerosol models are also exactly the same. The steps for calculating TOA reflectances and accounting for shifted wavelengths of VIIRS are discussed in Levy et al. [
23] and Patadia et al. [
24].
The Ahmad and Fraser [
43] code includes the rough ocean surface as a function of wavelength, and no change was made for the VIIRS version of the DT algorithm. The underwater reflectance value (0.005) assumed for the VIIRS green channel (0.551 μm) is the same as for the MODIS band (0.554 μm). Over land, the radiative transfer codes require an estimate of surface reflectance, which is acquired by assuming specific surface reflectance ratios between different wavelengths. These surface reflectance ratios are empirically derived and must be recalculated for each sensor.
3.3. VIIRS Reflectances as Input
The first iteration of the algorithm (e.g., [
23]) was developed before there was a NASA level 1b product to use as input [
47]. In order to handle the NOAA formatting (85-second granules, with each wavelength band in a separate file), the University of Wisconsin developed the Intermediate File Format (IFF). That iteration of the IFF file aggregated the reflectances into 5-minute granules, included the georeferencing information, and stored them in HDF-4 format, thereby creating a structure similar to that of the MODIS files. Note that the IFF pixel resolution was produced at 0.75 km at nadir, the native VIIRS resolution. As we describe above, pixel resolution itself can affect the results of an AOD retrieval. The IFF version of VIIRS DT made it possible to port DT to VIIRS from MODIS with minimal adaptation of the retrieval code, but it was never intended to be operational. The most important difference between the VIIRS DT algorithm used in this study and the previous version shown in Levy et al. [
23] is that it no longer requires IFF input. The second is that it did not include the MODIS–VIIRS continuity cloud mask. The more mature version of the VIIRS DT algorithm uses level 1b inputs directly, leading to a nimbler version of the retrieval code and the first VIIRS DT operational product.
3.4. VIIRS Product Format
Changes in the division of the orbit into granules and the file format of the final data product have no effect on the retrieval, but may prove important for users accustomed to the MODIS version. Each MODIS level 2 file represents a five-minute section of imagery, which divides the 24-hour day into 288 granule files (note that only the daylight half of each orbit is retrievable by DT). VIIRS level 2 products use six-minute granules, so the same day is divided into 240. More importantly, VIIRS data products are saved in netCDF-4 format [
48], which is inter-compatible with HDF5, rather than the older HDF4 format that is used for MODIS (
Table 1). The upgrade makes the data more accessible to newer software applications, and it supports the grouping of datasets for clearer metadata. VIIRS DT organizes the level 2 file into two groups: one for geolocation datasets including surface coordinates and sun-sensor geometry, and one for geophysical datasets derived from the AOD retrieval. Aside from the group headings, the VIIRS data product makes few changes to the dataset names used for MODIS (see
Appendix A). One important exception is the Deep Blue aerosol retrieval and combined Dark Target/Deep Blue datasets. For MODIS, these are included in the same level 2 product file as the Dark Target products, but for VIIRS the Deep Blue retrieval is released independently under the AERDB product name [
49]. There is no combined Dark Target/Deep Blue AOD product for VIIRS at this time.
3.5. Near Real-Time and Aggregated Products
Like the standard MODIS retrieval, the standard VIIRS DT retrieval requires ancillary meteorological data in the form of re-analyses. However, since these are not immediately available when the satellite observations are taken, the standard aerosol retrieval is performed twelve or more hours after overpass. To encourage users who require retrievals much more quickly, there is parallel development of a near-real-time (NRT) product as AERDT_L2_VIIRS_SNPP_NRT. This NRT version will be using forecast meteorological fields, specifically the 12-h Global Forecasting System (GFS) forecast, in place of the GDAS analysis for precipitable water, ozone, and 10 m wind speeds. It also omits the cirrus tests taken from the continuity cloud mask (not yet available as an NRT product). The retrieval then proceeds as in the standard version. The Dark Target cloud masking process is slightly less strict without the continuity cloud mask input, and small differences can typically be found between the forecast and analysis meteorological values. These differences affect the resulting AOD values, which will be slightly less accurate than the standard product. Like other NRT products, VIIRS DT NRT granule files will be kept in the data archive for a limited number of days. The standard product should be used for quantitative analysis.
Although they are not in production yet, the VIIRS DT standard product will also include daily (AERDT_D3_VIIRS_SNPP) and monthly (AERDT_M3_VIIRS_SNPP) averaged data as level 3 products. These are analogous to the DT fields that are stored in the MxD08_D3 and MxD08_M3 products for MODIS [
50]. Aggregation is performed by a level 3 gridding tool called Yori [
51] and the format of the finished level 3 products will be in NetCDF-4 format. Note that unlike for MODIS, the Dark Target statistics fields will not be combined into a single file with other VIIRS atmospheric products, nor is there a “fixed” 1° × 1° resolution as there is for MODIS. Yori can provide gridded averages at any resolution. For the purposes of this analysis, however, daily and monthly averages have been conducted at that resolution using the MODIS logic, not the Yori software. Each daily average grid cell must contain at least six valid level 2 retrievals to be included, and each monthly average grid cell must have at least three days represented. As the level 3 product does for MODIS, we compute a combined land and ocean 0.55 μm AOD product using quality-filtering while providing AOD values by wavelength that are quality-weighted.
Note that there are almost three times as many potential retrieval boxes per 1° × 1° grid cell if the retrieval box is at 6 km rather than 10 km resolution. By using a minimum threshold of six retrievals per grid cell for both sensors, the VIIRS daily gridded average requires less than 2% success, whereas MODIS requires 5%. The consequences for level 3 sampling are discussed in
Section 5.
4. Results
The current version of the VIIRS DT product for Suomi-NPP, AERDT_L2_VIIRS_SNPP, includes all daylight granules covering the globe and spanning the entire VIIRS SNPP mission, from March 2012 to the present day. It will soon be available for public download at NASA LAADS DAAC [
52]. For the purposes of this study, 2015 is chosen as a test year because of the availability of both the version 3 AErosol RObotic NETwork (AERONET) product [
53] and the MODIS Aqua collection 6.1 (MYD04_L2) standard DT product; Aqua is chosen from the two MODIS instruments because its equatorial crossing time is approximately that of Suomi-NPP at 13:30 local time, although differences in spacecraft altitude and inclination give them different fields of view [
54].
4.1. Collocation with AERONET
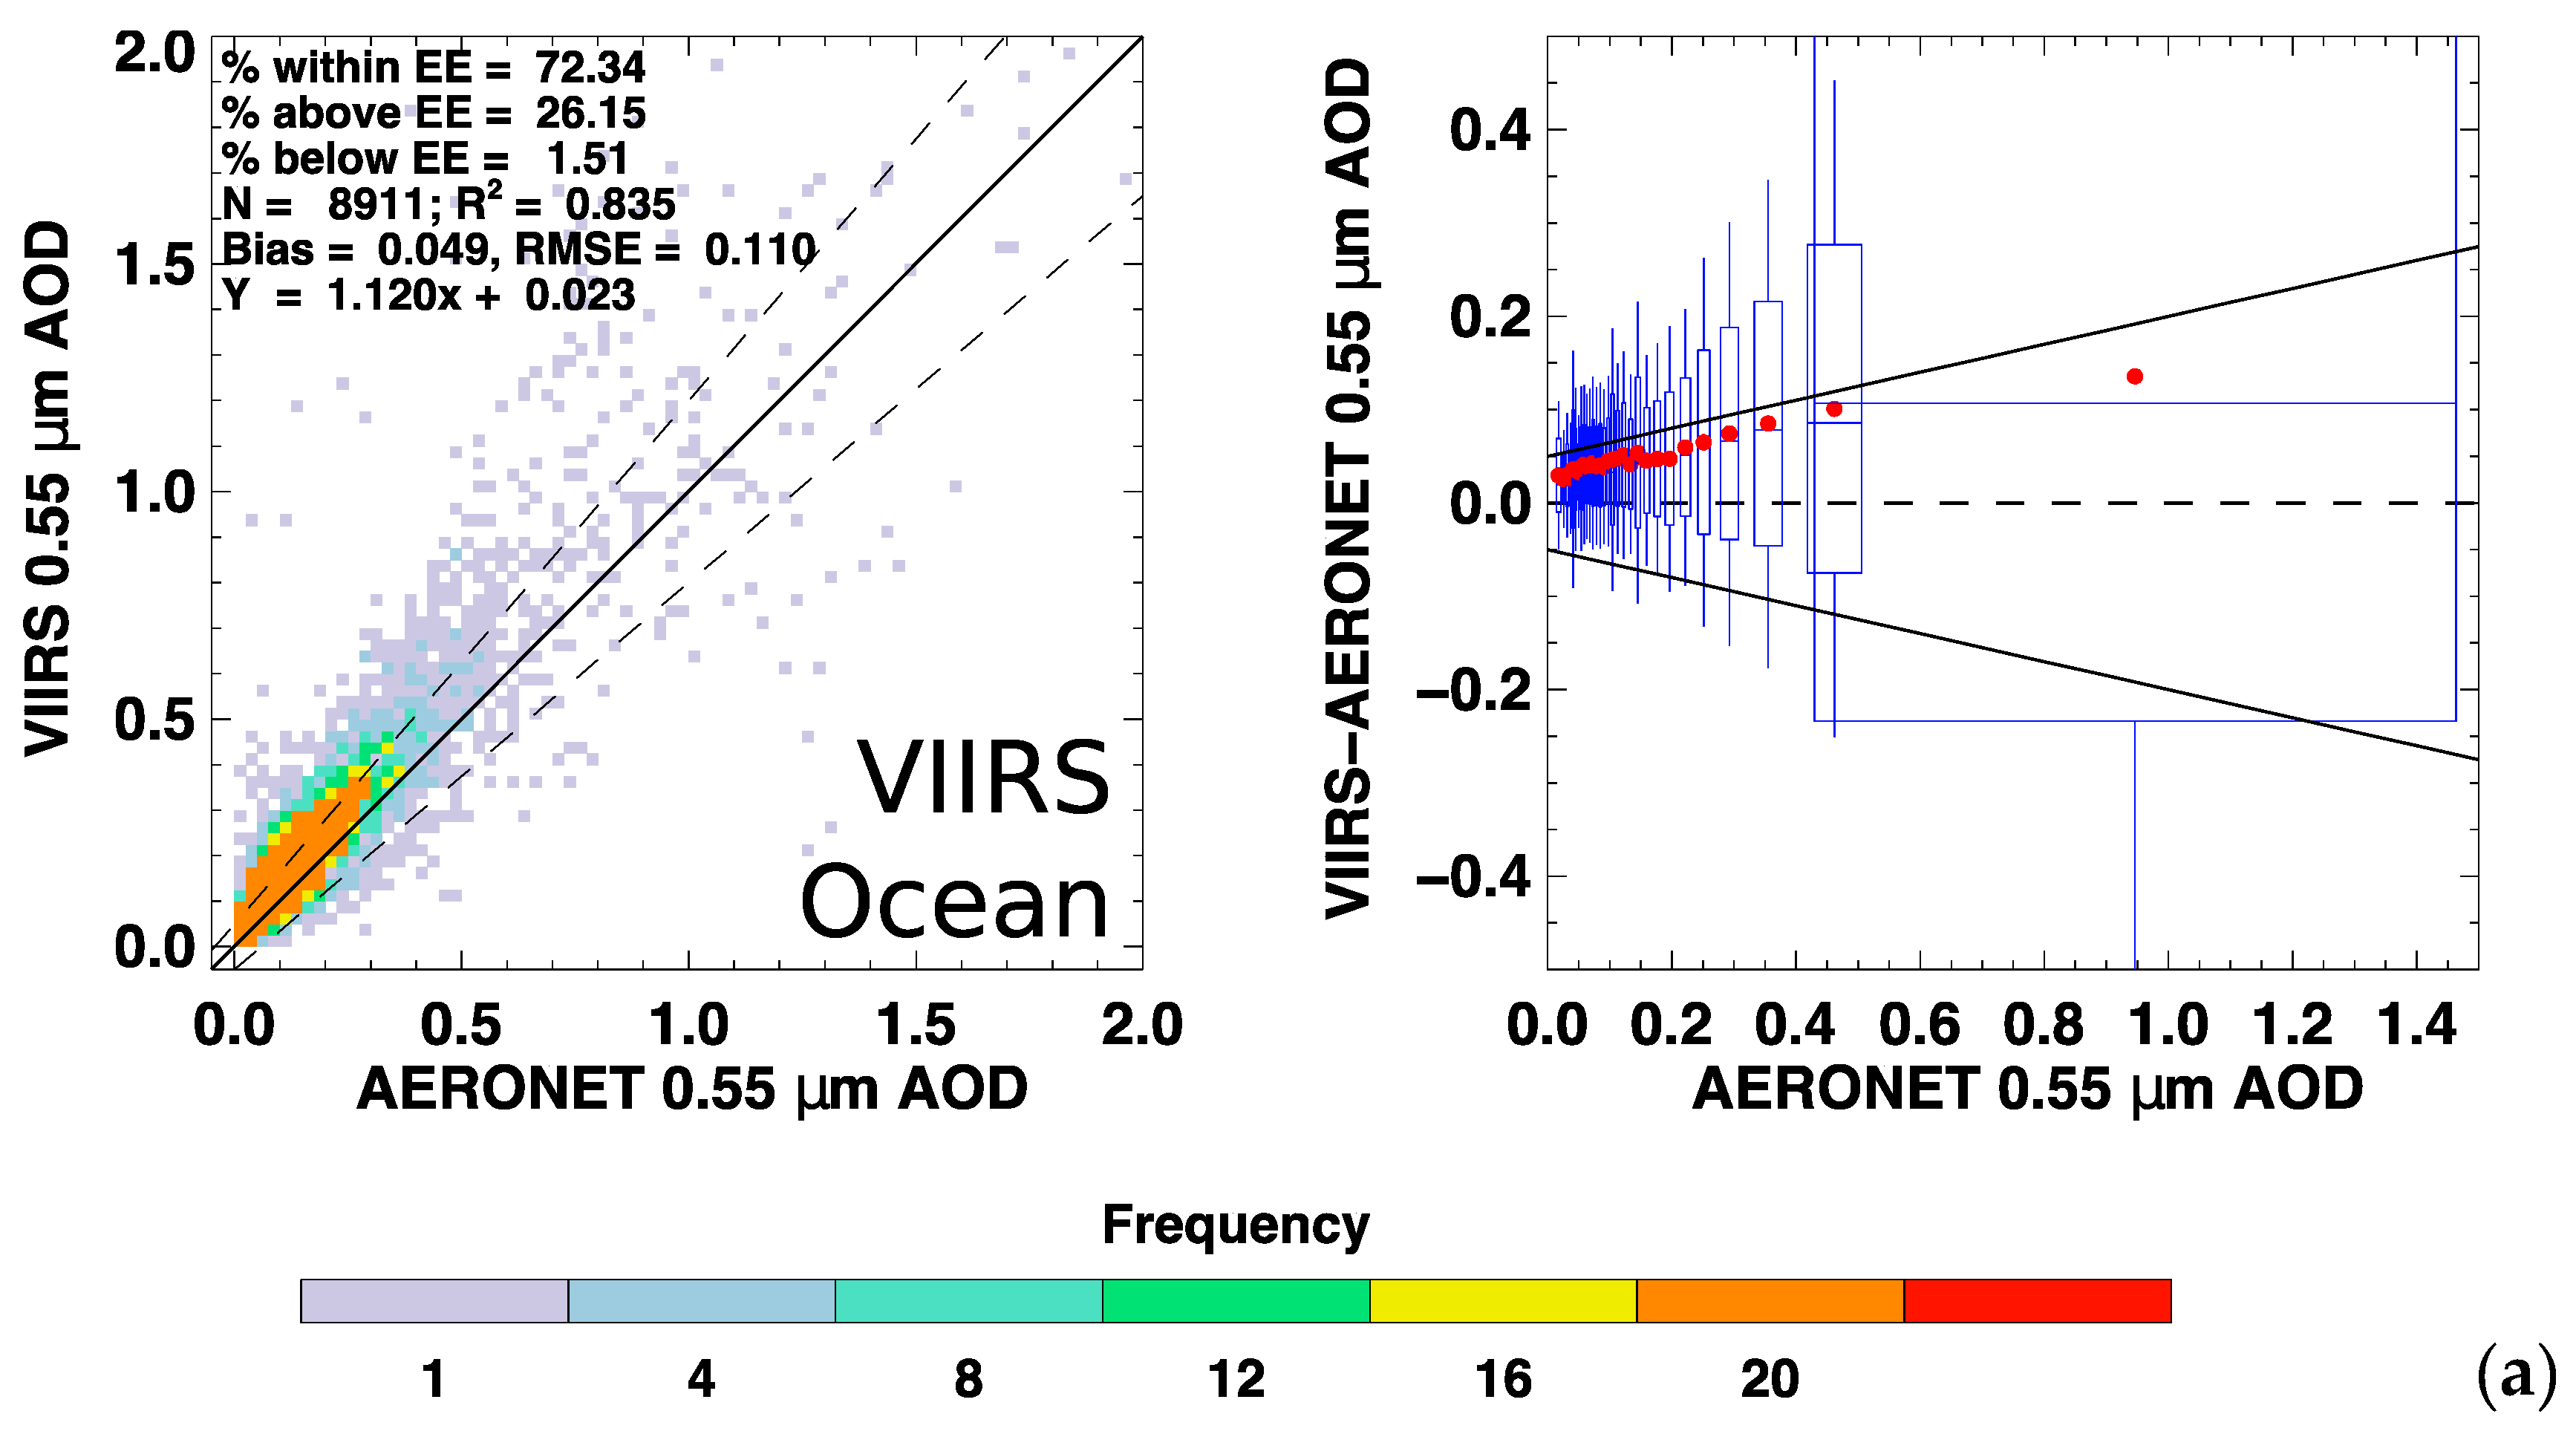
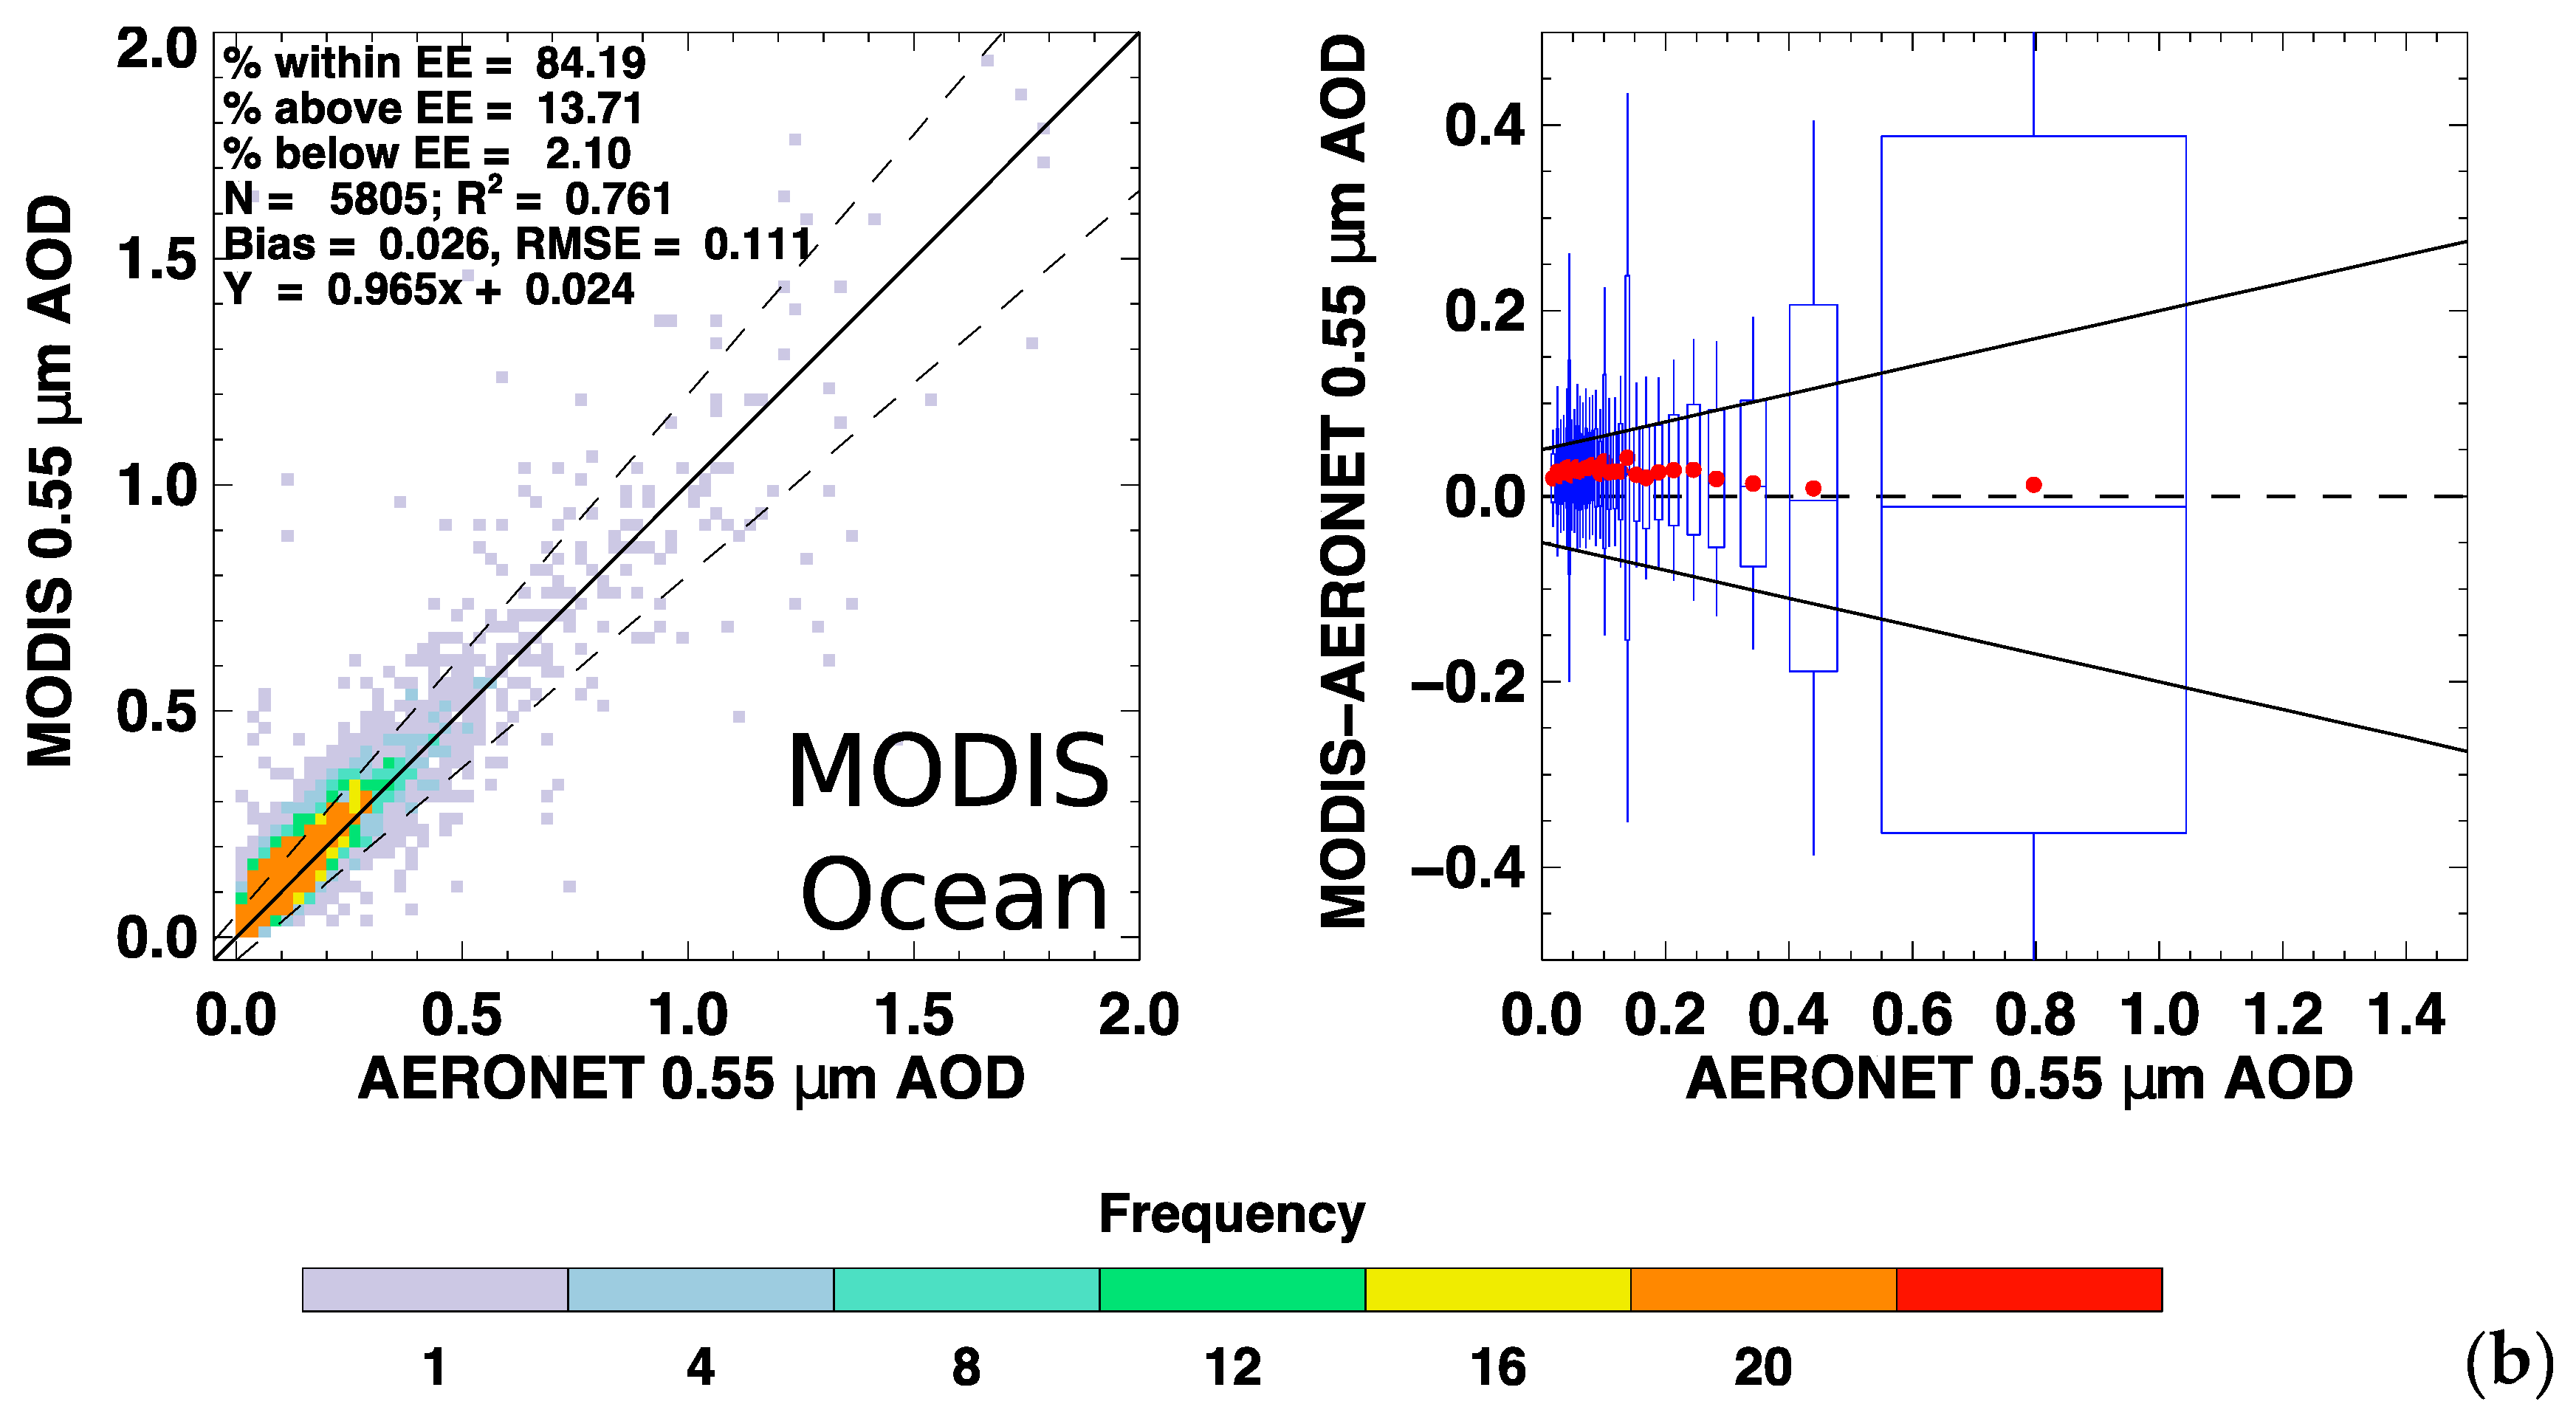
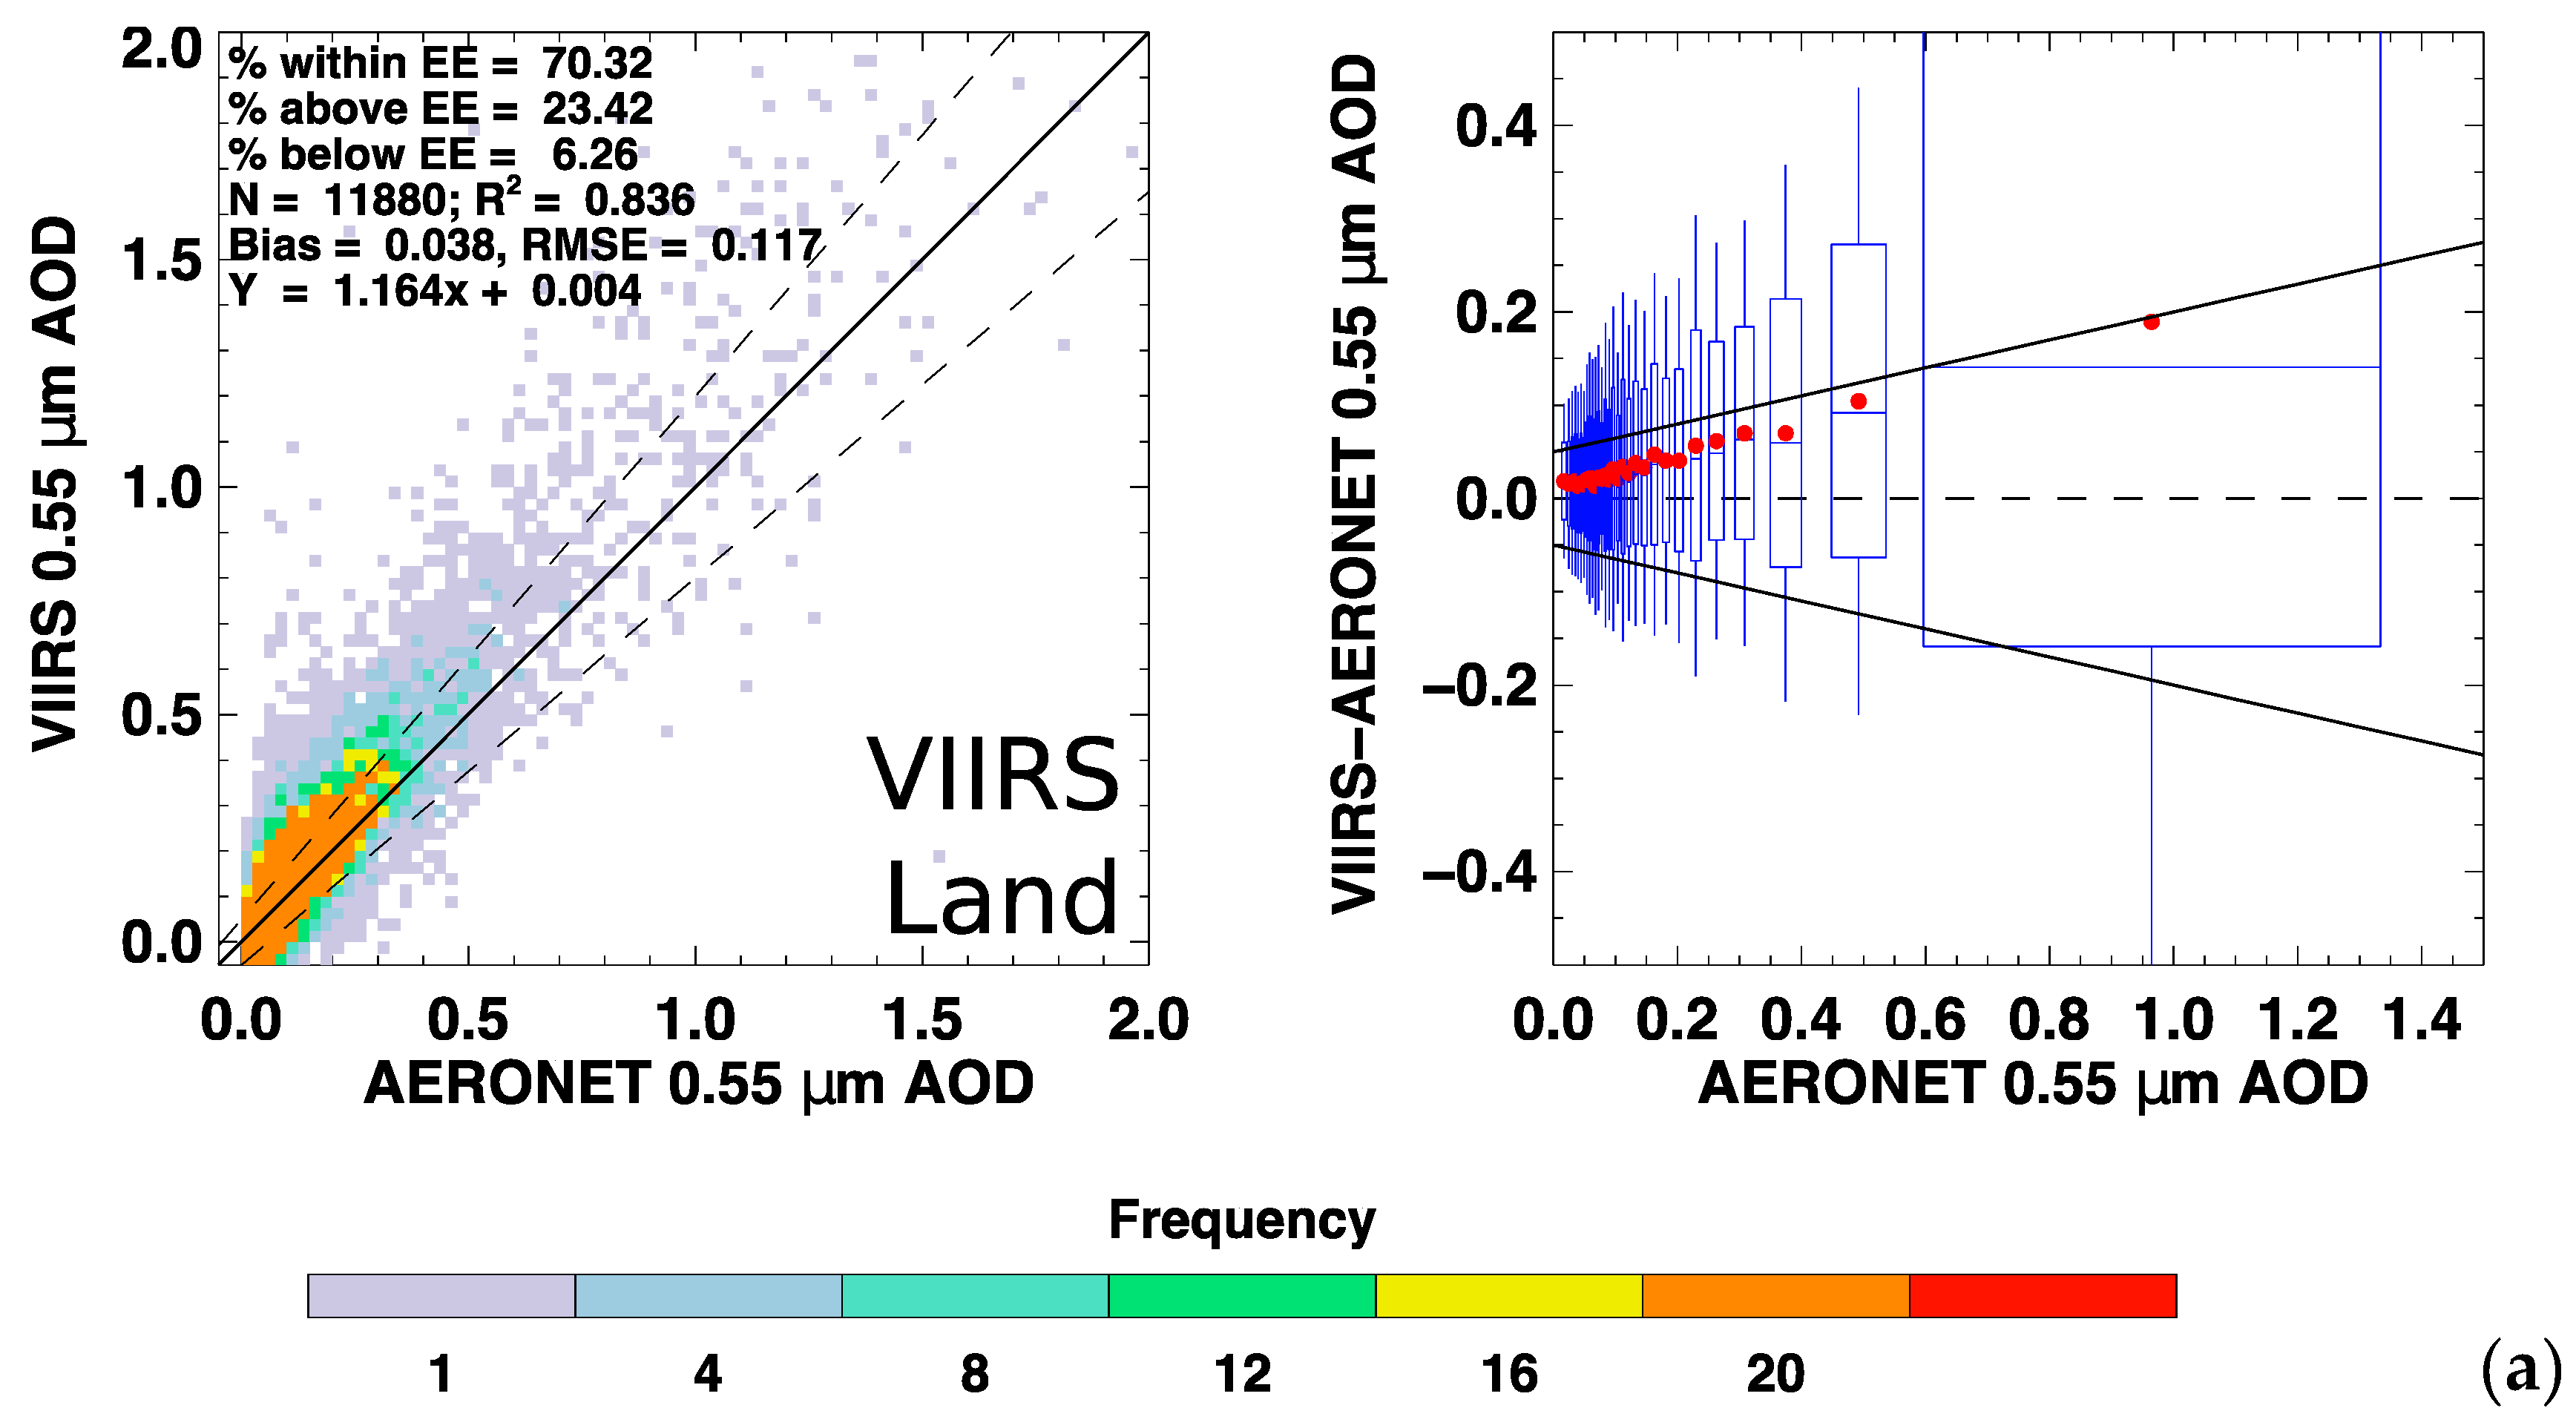
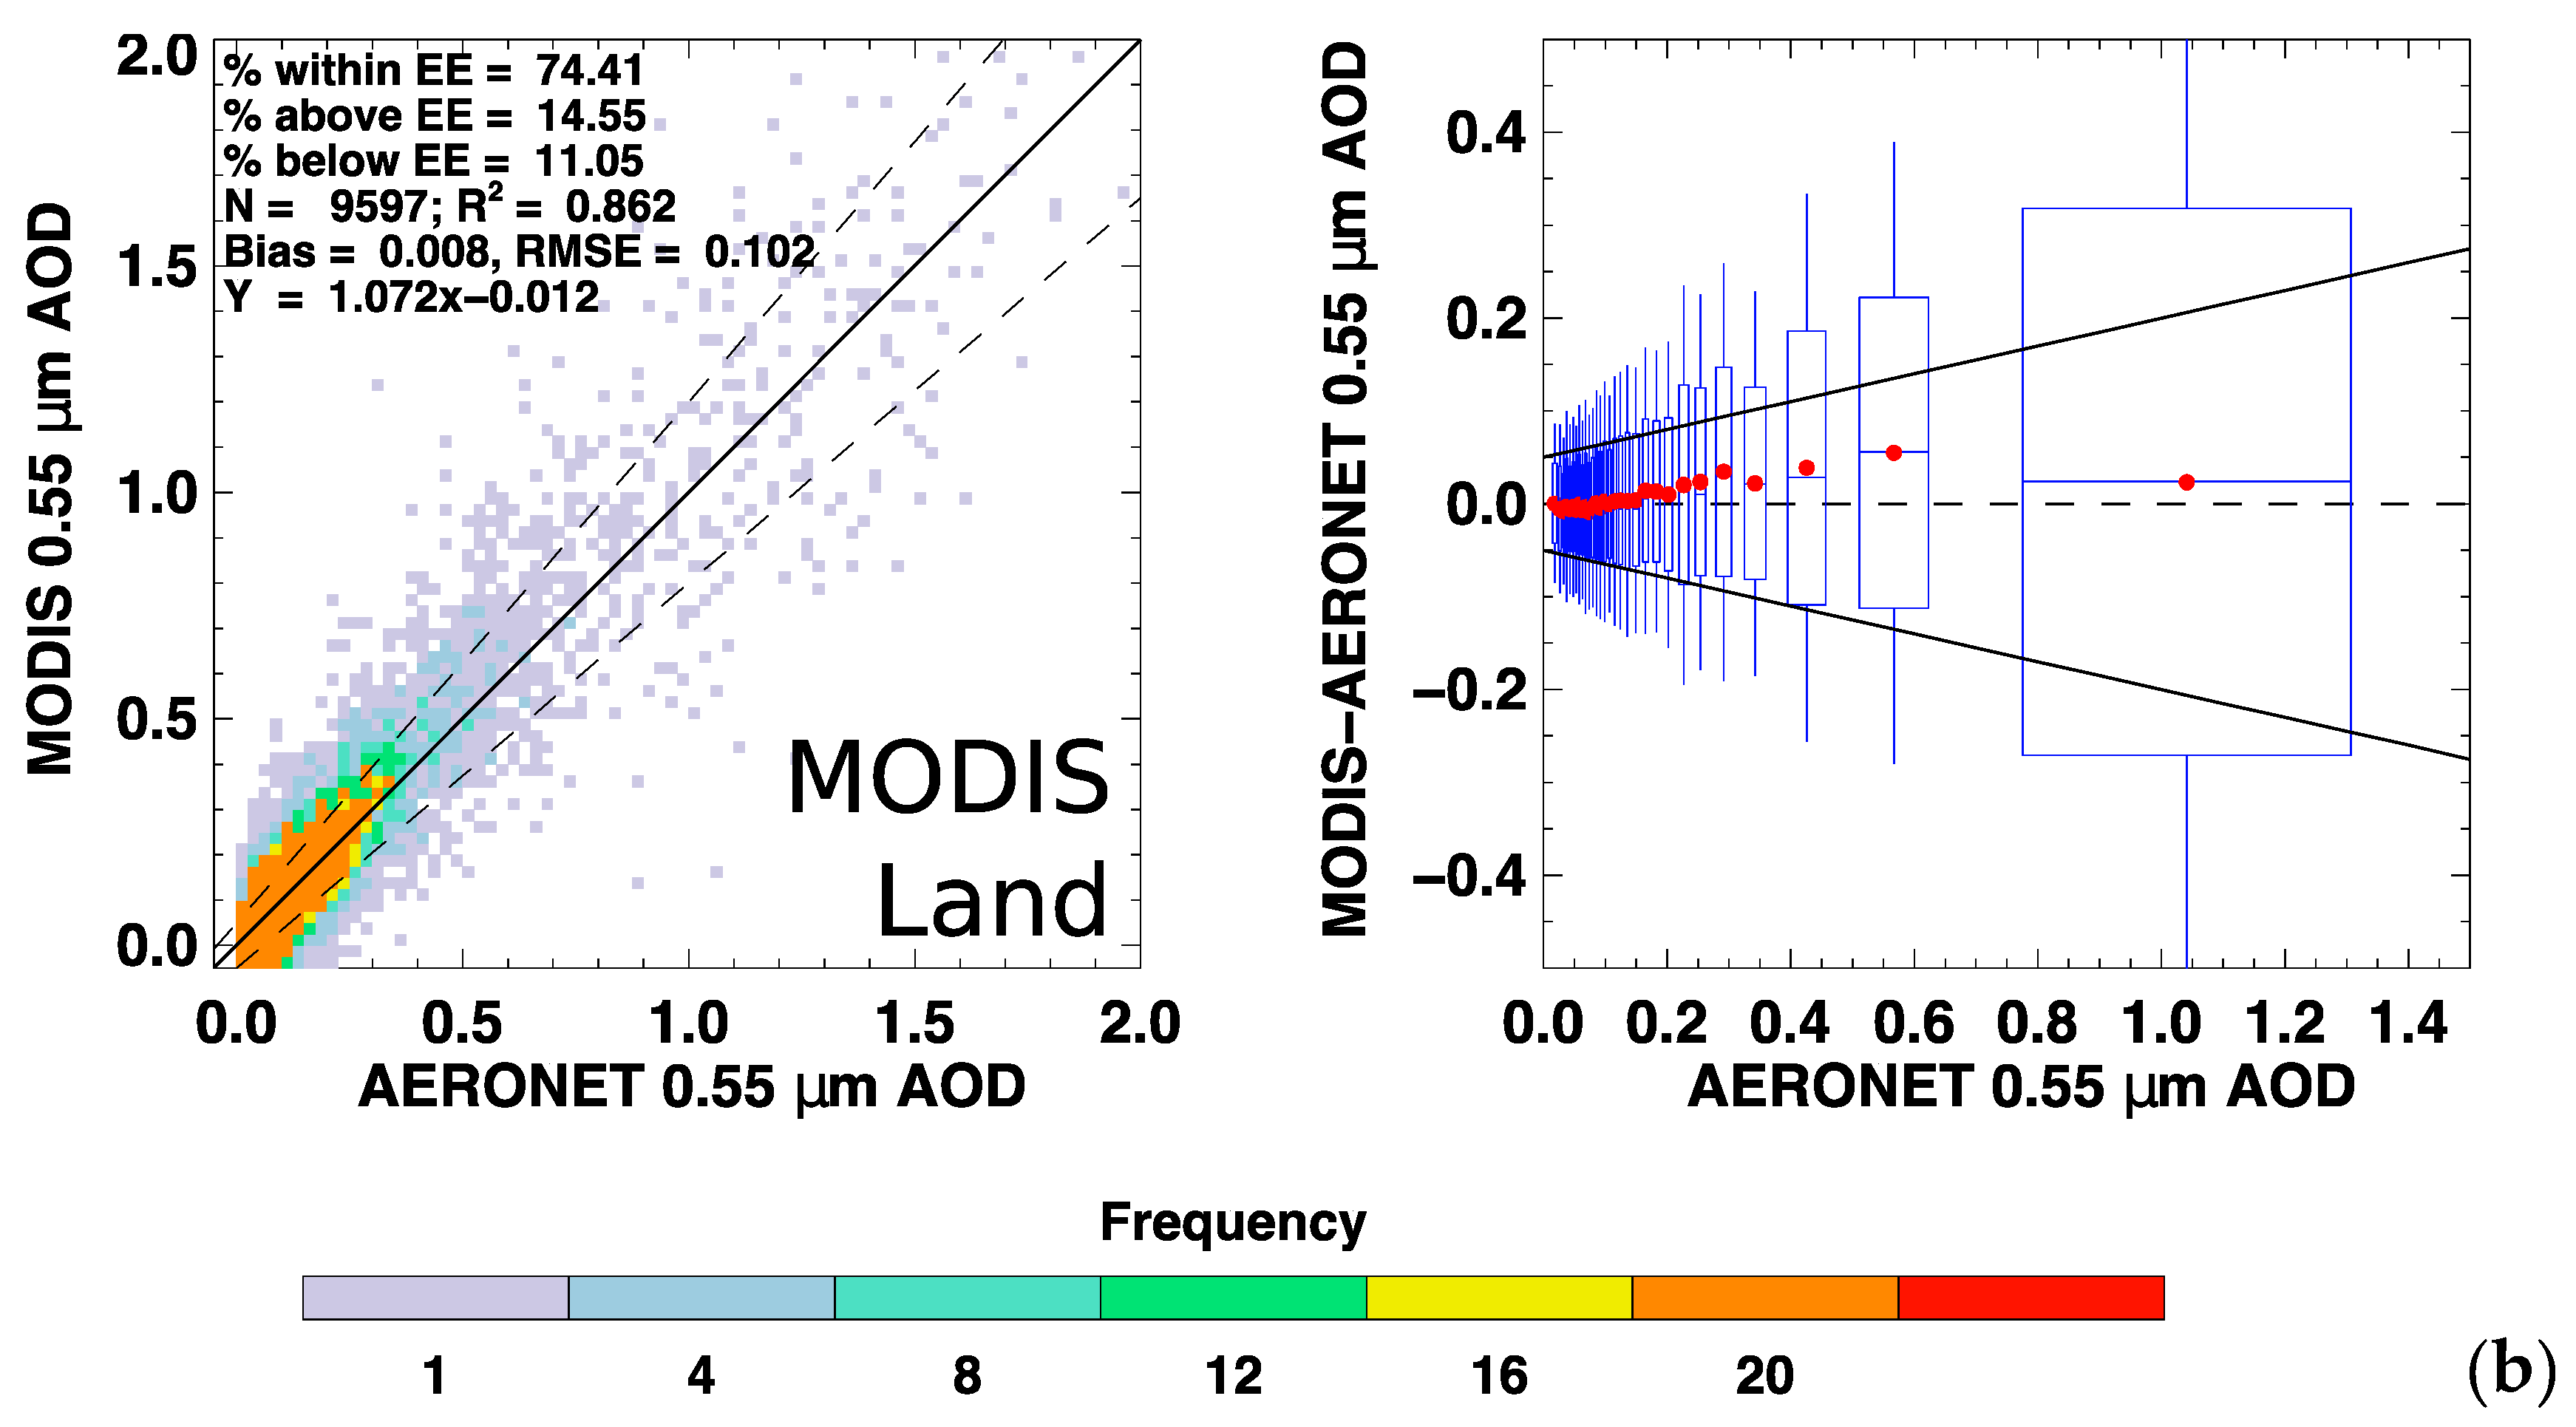
Satellite aerosol retrievals are commonly validated by comparison to ground-based sunphotometer or radiometer datasets such as AERONET, a network of sun/sky radiometers that measure AOD from the surface at sites distributed over the globe. Not only is it important to know whether the VIIRS DT product is in good agreement with AERONET AOD values (
Figure 1a and
Figure 2a), it is also useful to know how the comparison of VIIRS SNPP to AERONET differs from the equivalent comparison of MODIS Aqua to AERONET (
Figure 1b and
Figure 2b). The satellite retrievals are quality-filtered as described in the previous section, with quality flags of one to three for ocean AOD (
Figure 1) and only three for land (
Figure 2). In this study, following Shi et al. [
55], we assume that satellite retrievals taken within a 27.5 km radius and AERONET observations within ±30 min of overpass are considered collocated.
The analysis is done separately for land and ocean cases, with coastal retrievals excluded. We have removed certain AERONET sites from the analysis due to elevation. For “ocean” collocations above 300 m, i.e., mountainous islands, the AERONET AOD value is not representative of the total column from sea level; and for land collocations where the average elevation of the collocated satellite retrievals differs from that of the AERONET site by more than 300 m in either direction, complex topography may likewise affect the representativeness of the collocation. For both MODIS and VIIRS, we require at least 20% of the potential satellite retrievals within the 27.5 km circle to have valid data. Note that even so, there may be differences in collocation statistics between VIIRS and MODIS due to the number of retrievals per km2. A 27.5 km radius (~2400 km2) encompasses up to 66 AOD retrievals for VIIRS but only 24 for MODIS. This means that the minimum requirement for collocation at nadir is 13 retrievals for VIIRS, but only 5 for MODIS. At swath edges, where native pixel sizes (and therefore also DT retrieval boxes) are larger than at nadir, this may lead to requiring multiple retrievals for VIIRS but only one retrieval (800 km2 per retrieval, 20% of 3) for MODIS.
Based on our method of collocation, we find that the 0.55 μm AOD from VIIRS SNPP Dark Target does not compare as well to AERONET as does MODIS Aqua. Generally, VIIRS DT shows a higher bias than MODIS Aqua DT. This leads to a lower percentage of the VIIRS product within the expected error (EE) over both land and ocean (±(0.05 + 15%)), although in both cases the product still meets the minimum threshold of 66%. Yet, VIIRS has a higher correlation with AERONET than does MODIS Aqua over ocean. Based on this exercise, the MODIS Aqua AOD is likely closer to the truth than the VIIRS AOD, and the higher VIIRS values can be interpreted as a positive bias. Nonetheless, there is clearly a reasonable degree of skill in the VIIRS Dark Target retrieval. The reasons for this bias and some possible remedies are explored further in the following sections.
We point out that, although we compare over-ocean retrievals at AERONET sites, many of the AERONET sites are in fact on land (coastal or island). We might expect the satellite to show lower values if the land is a source of local aerosol, or higher values if a relatively elevated AERONET site misses aerosol at sea level. Future work will make use of shipborne measurements from the AERONET Maritime Aerosol Network [
56], which while having larger uncertainty than stable AERONET platforms, are still more representative of the open water.
4.2. Comparison with Global Gridded MODIS AOD at 0.55 μm
Due to issues of retrieval box size, collocation strategy, and spatial representativeness of both the AERONET and satellite datasets, comparison with AERONET does not tell the whole story. To provide more insight, we compare our gridded average VIIRS DT aerosol optical depth to the existing standard MODIS level 3 products. Note here that the comparison may suffer slightly from an algorithm mismatch. Collection 6.1 (C6.1) of the MODIS Dark Target retrieval introduced improvements to the spatial coverage of retrieved aerosol over urban surfaces [
57], the criteria for sampling over ocean, and minor diagnostic changes, all of which are further described in Levy et al. [
12]. These updates have yet to be applied to the VIIRS version of the algorithm, which corresponds more closely to the Collection 6 (C6) version of MODIS. However, the effect of these updates on global AOD results is ultimately much smaller than the upstream improvements to the MODIS C6.1 level 1b calibration and cloud masking. Therefore, the VIIRS gridded values are compared here to MODIS C6.1 instead of to C6. We calculate VIIRS level 3-like data using the same logic that was used to calculate the MODIS level 3 products, with quality-weighted and quality-filtered average datasets corresponding to those in the MODIS product and with the same sampling thresholds. Gridding logic is subject to change for an official VIIRS level 3 product when it is produced.
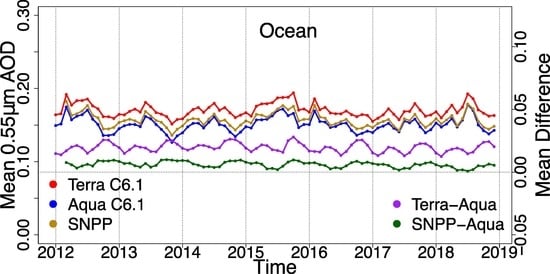
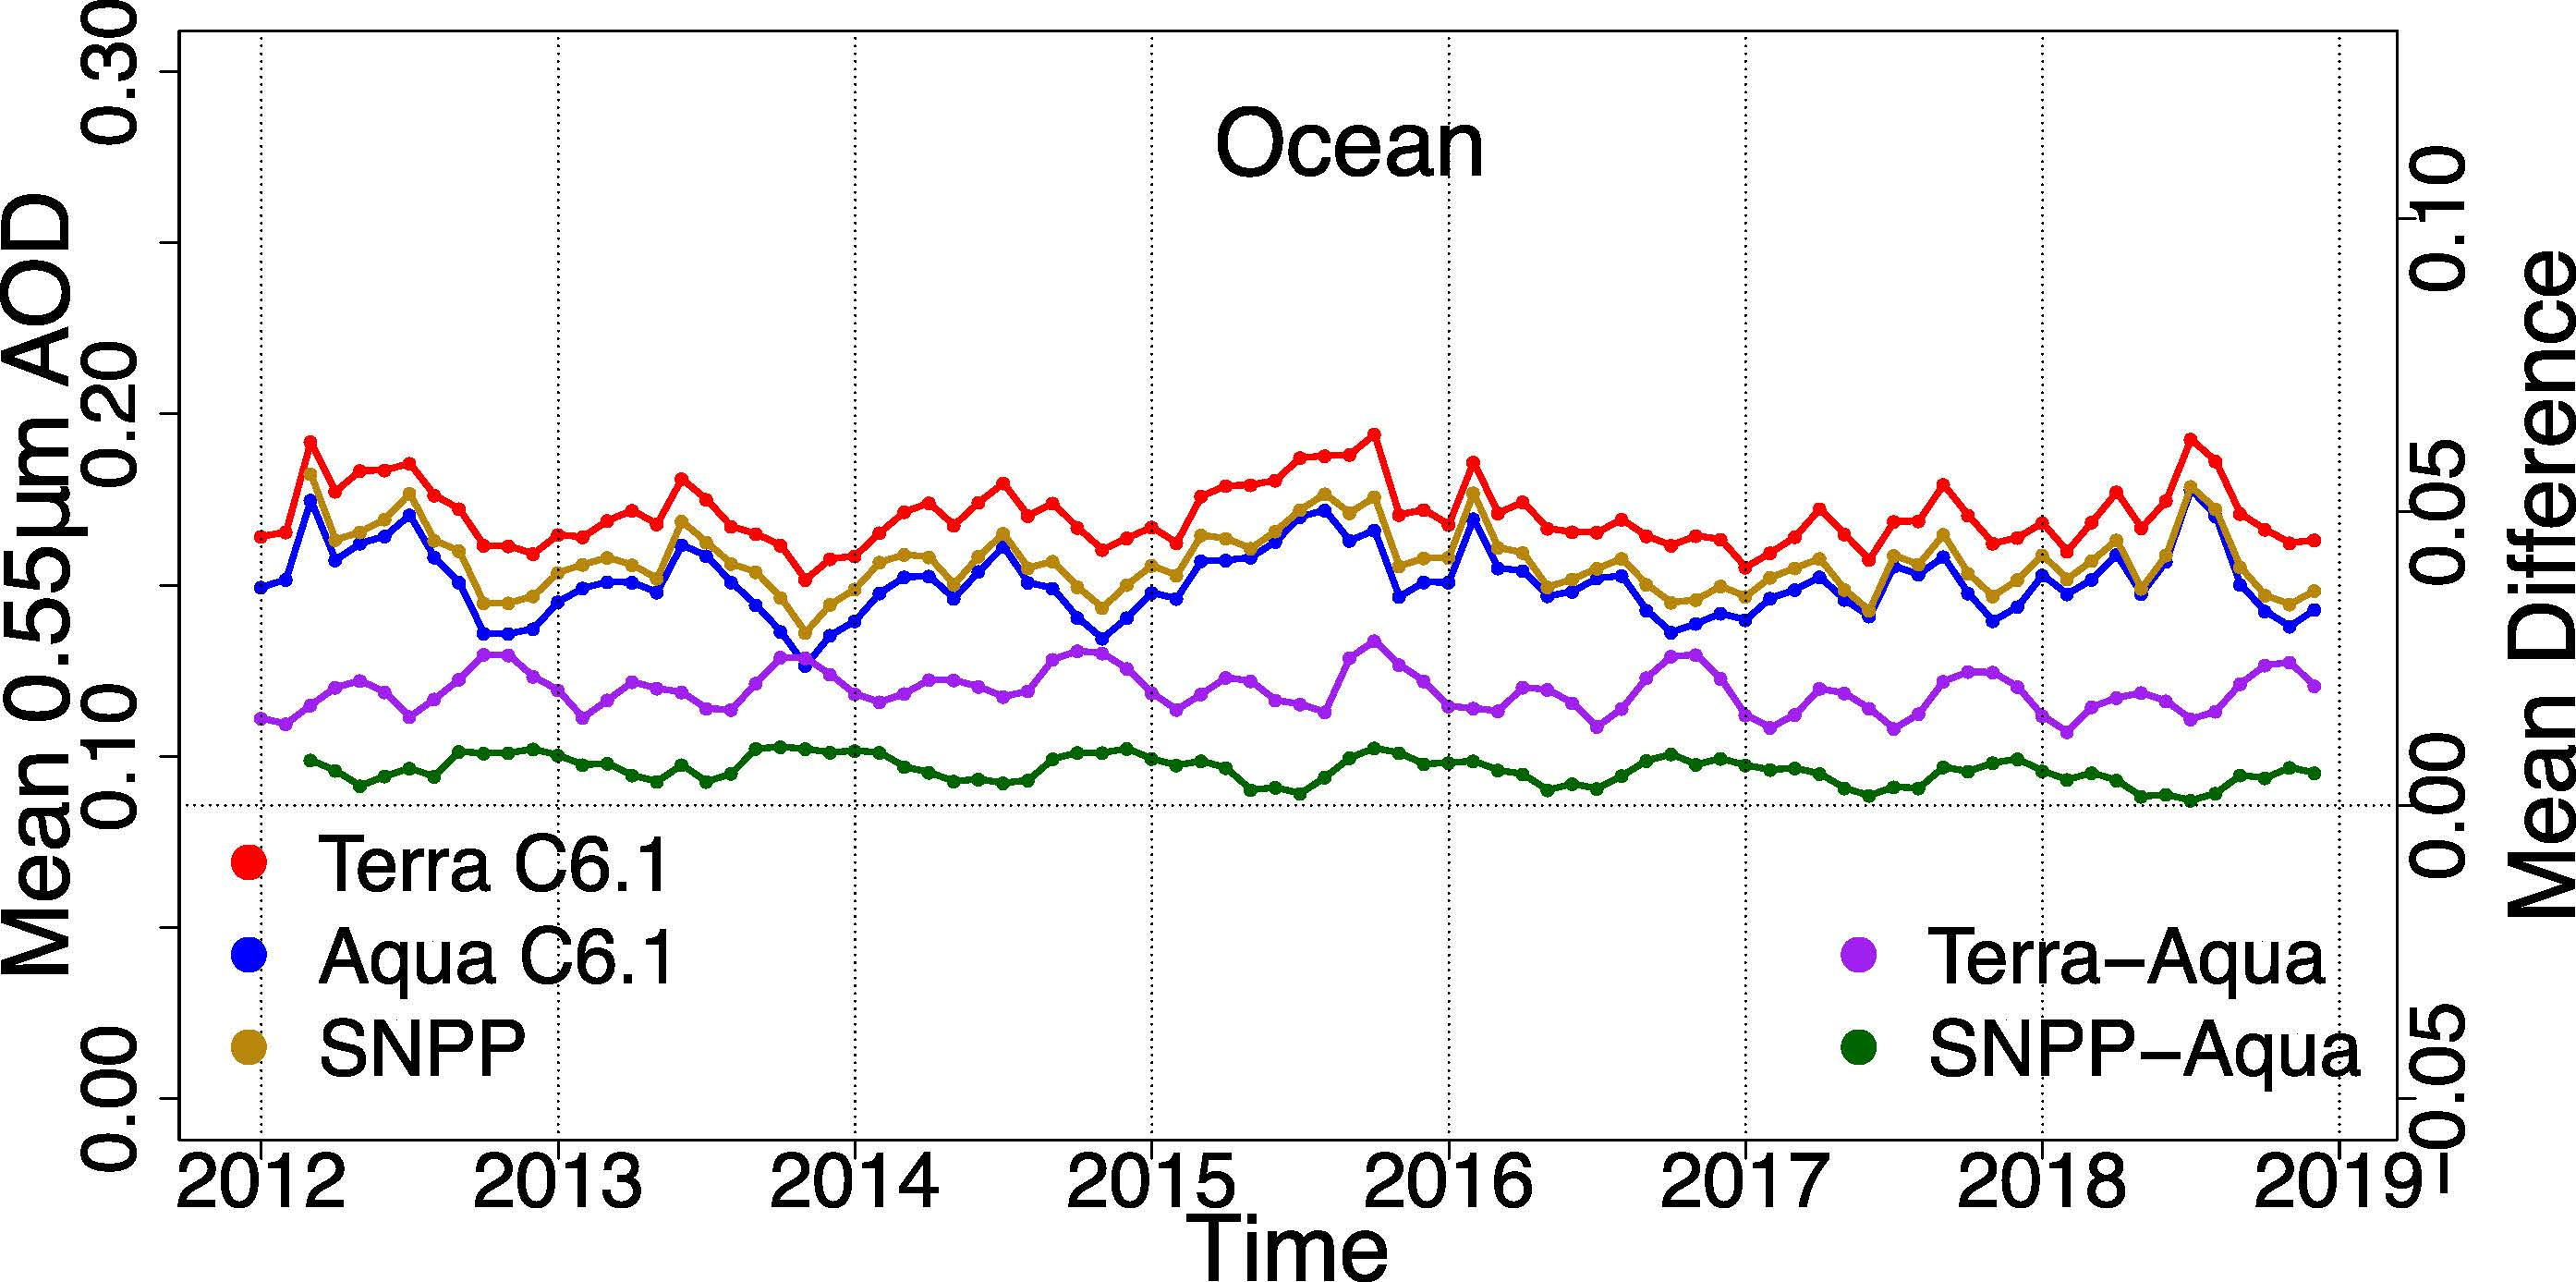
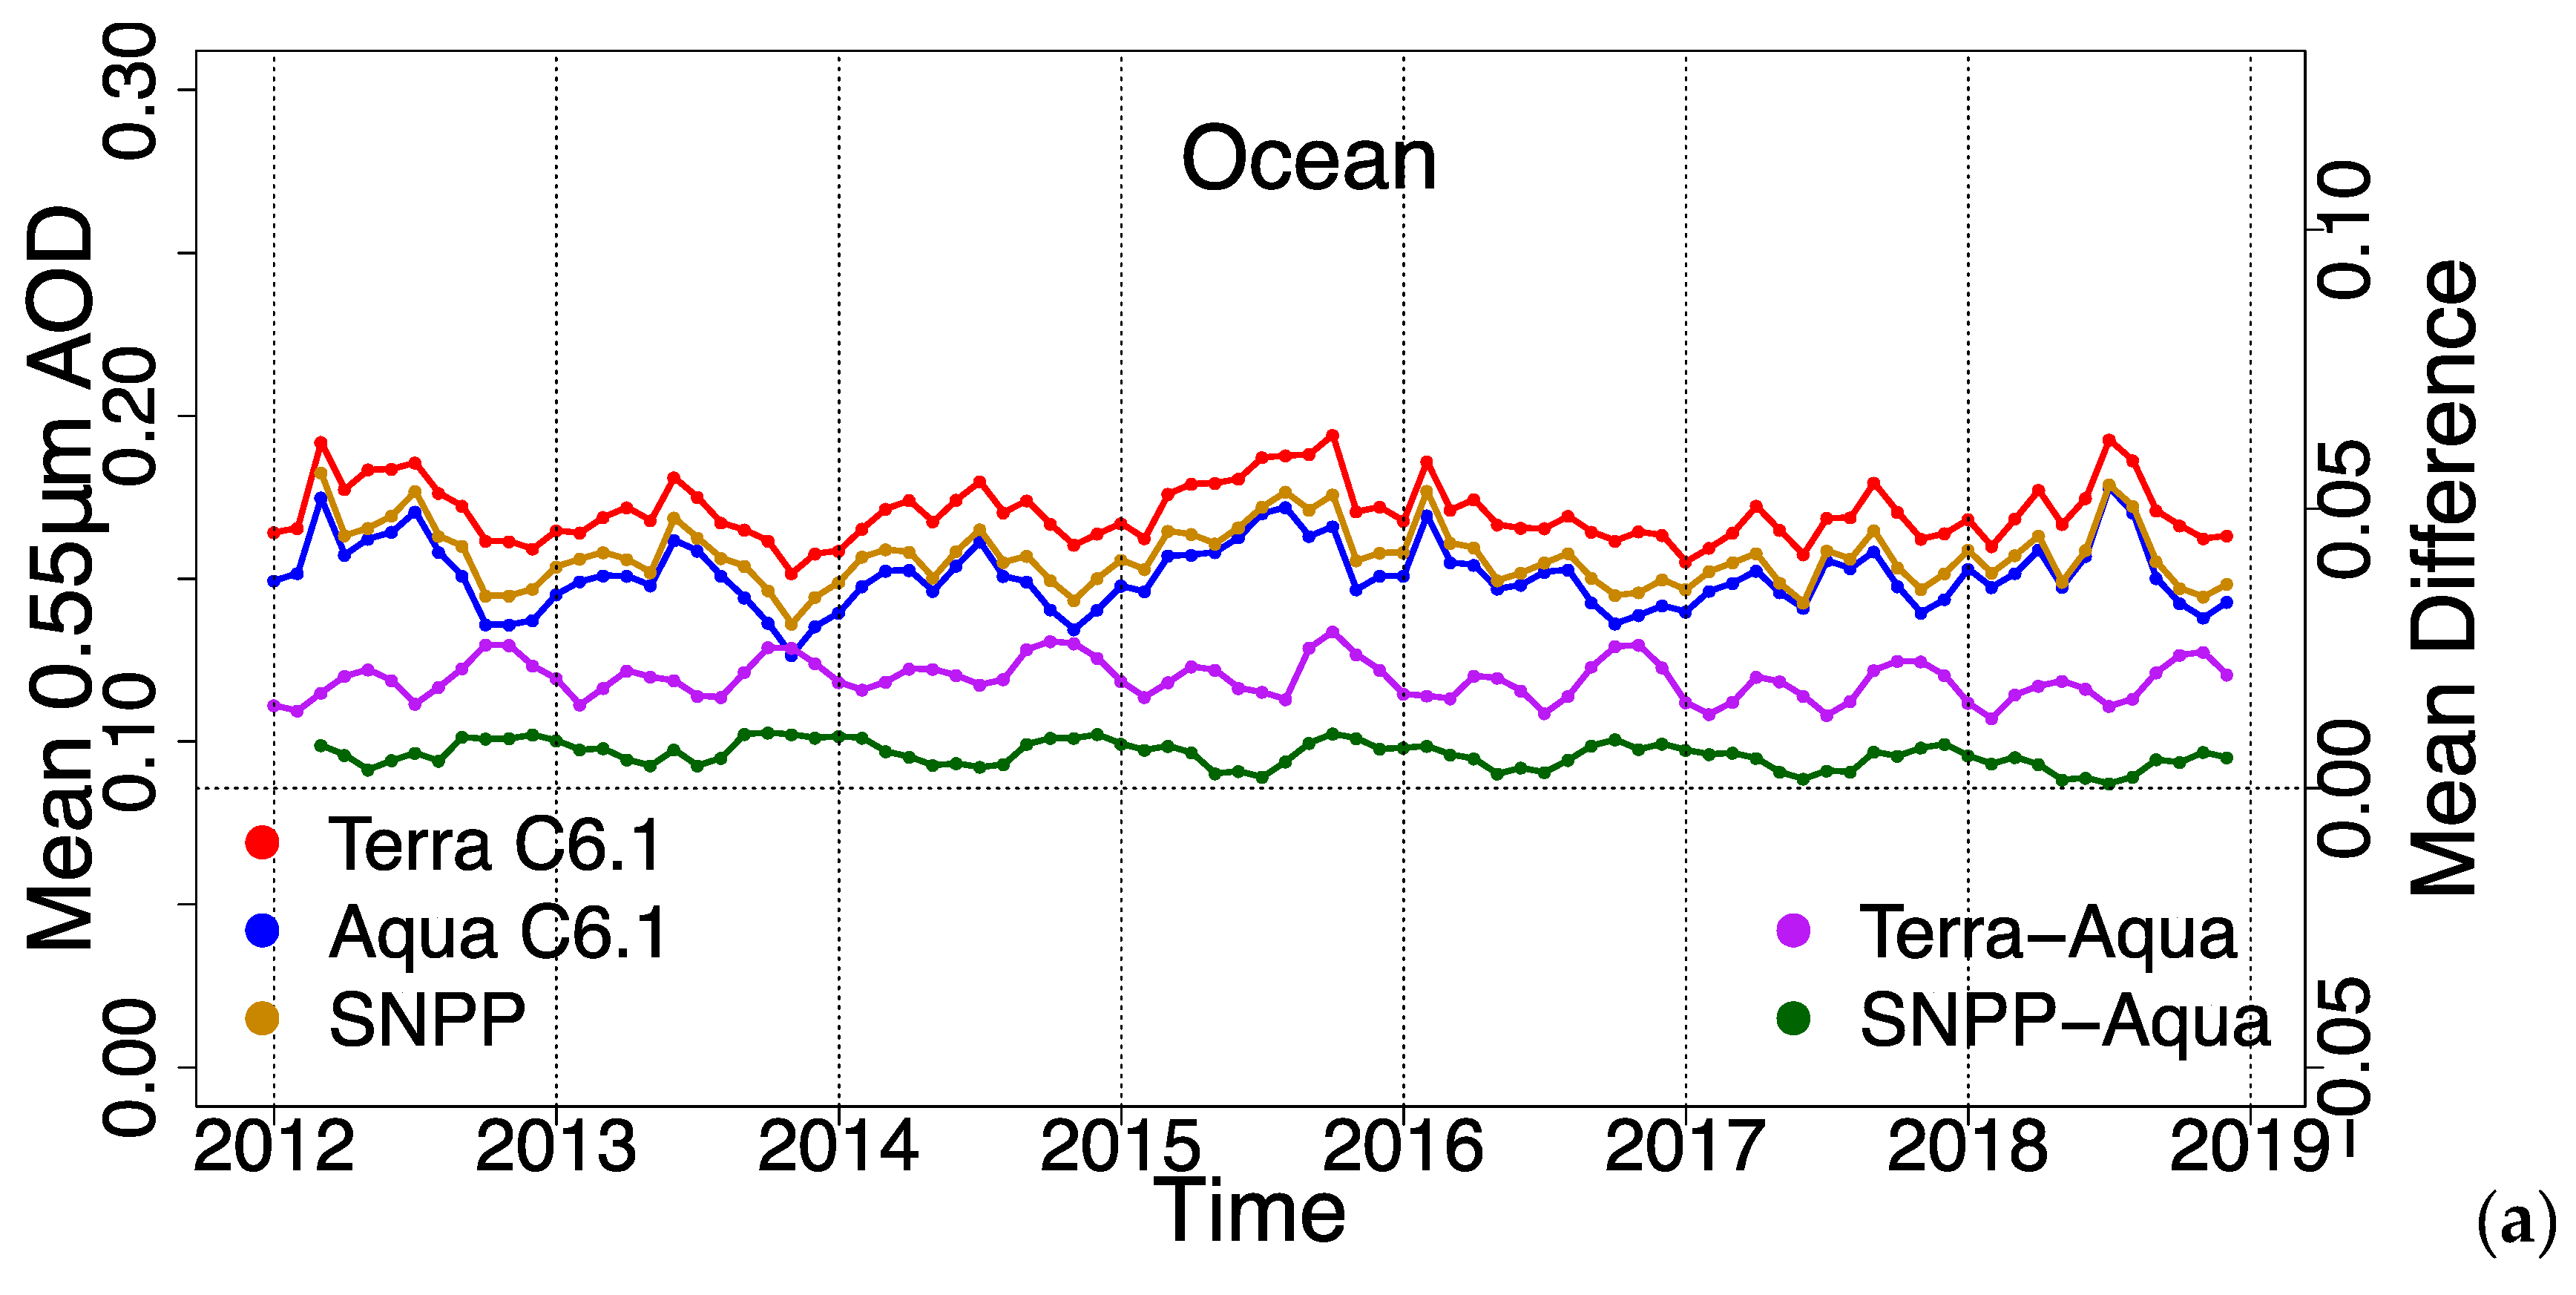
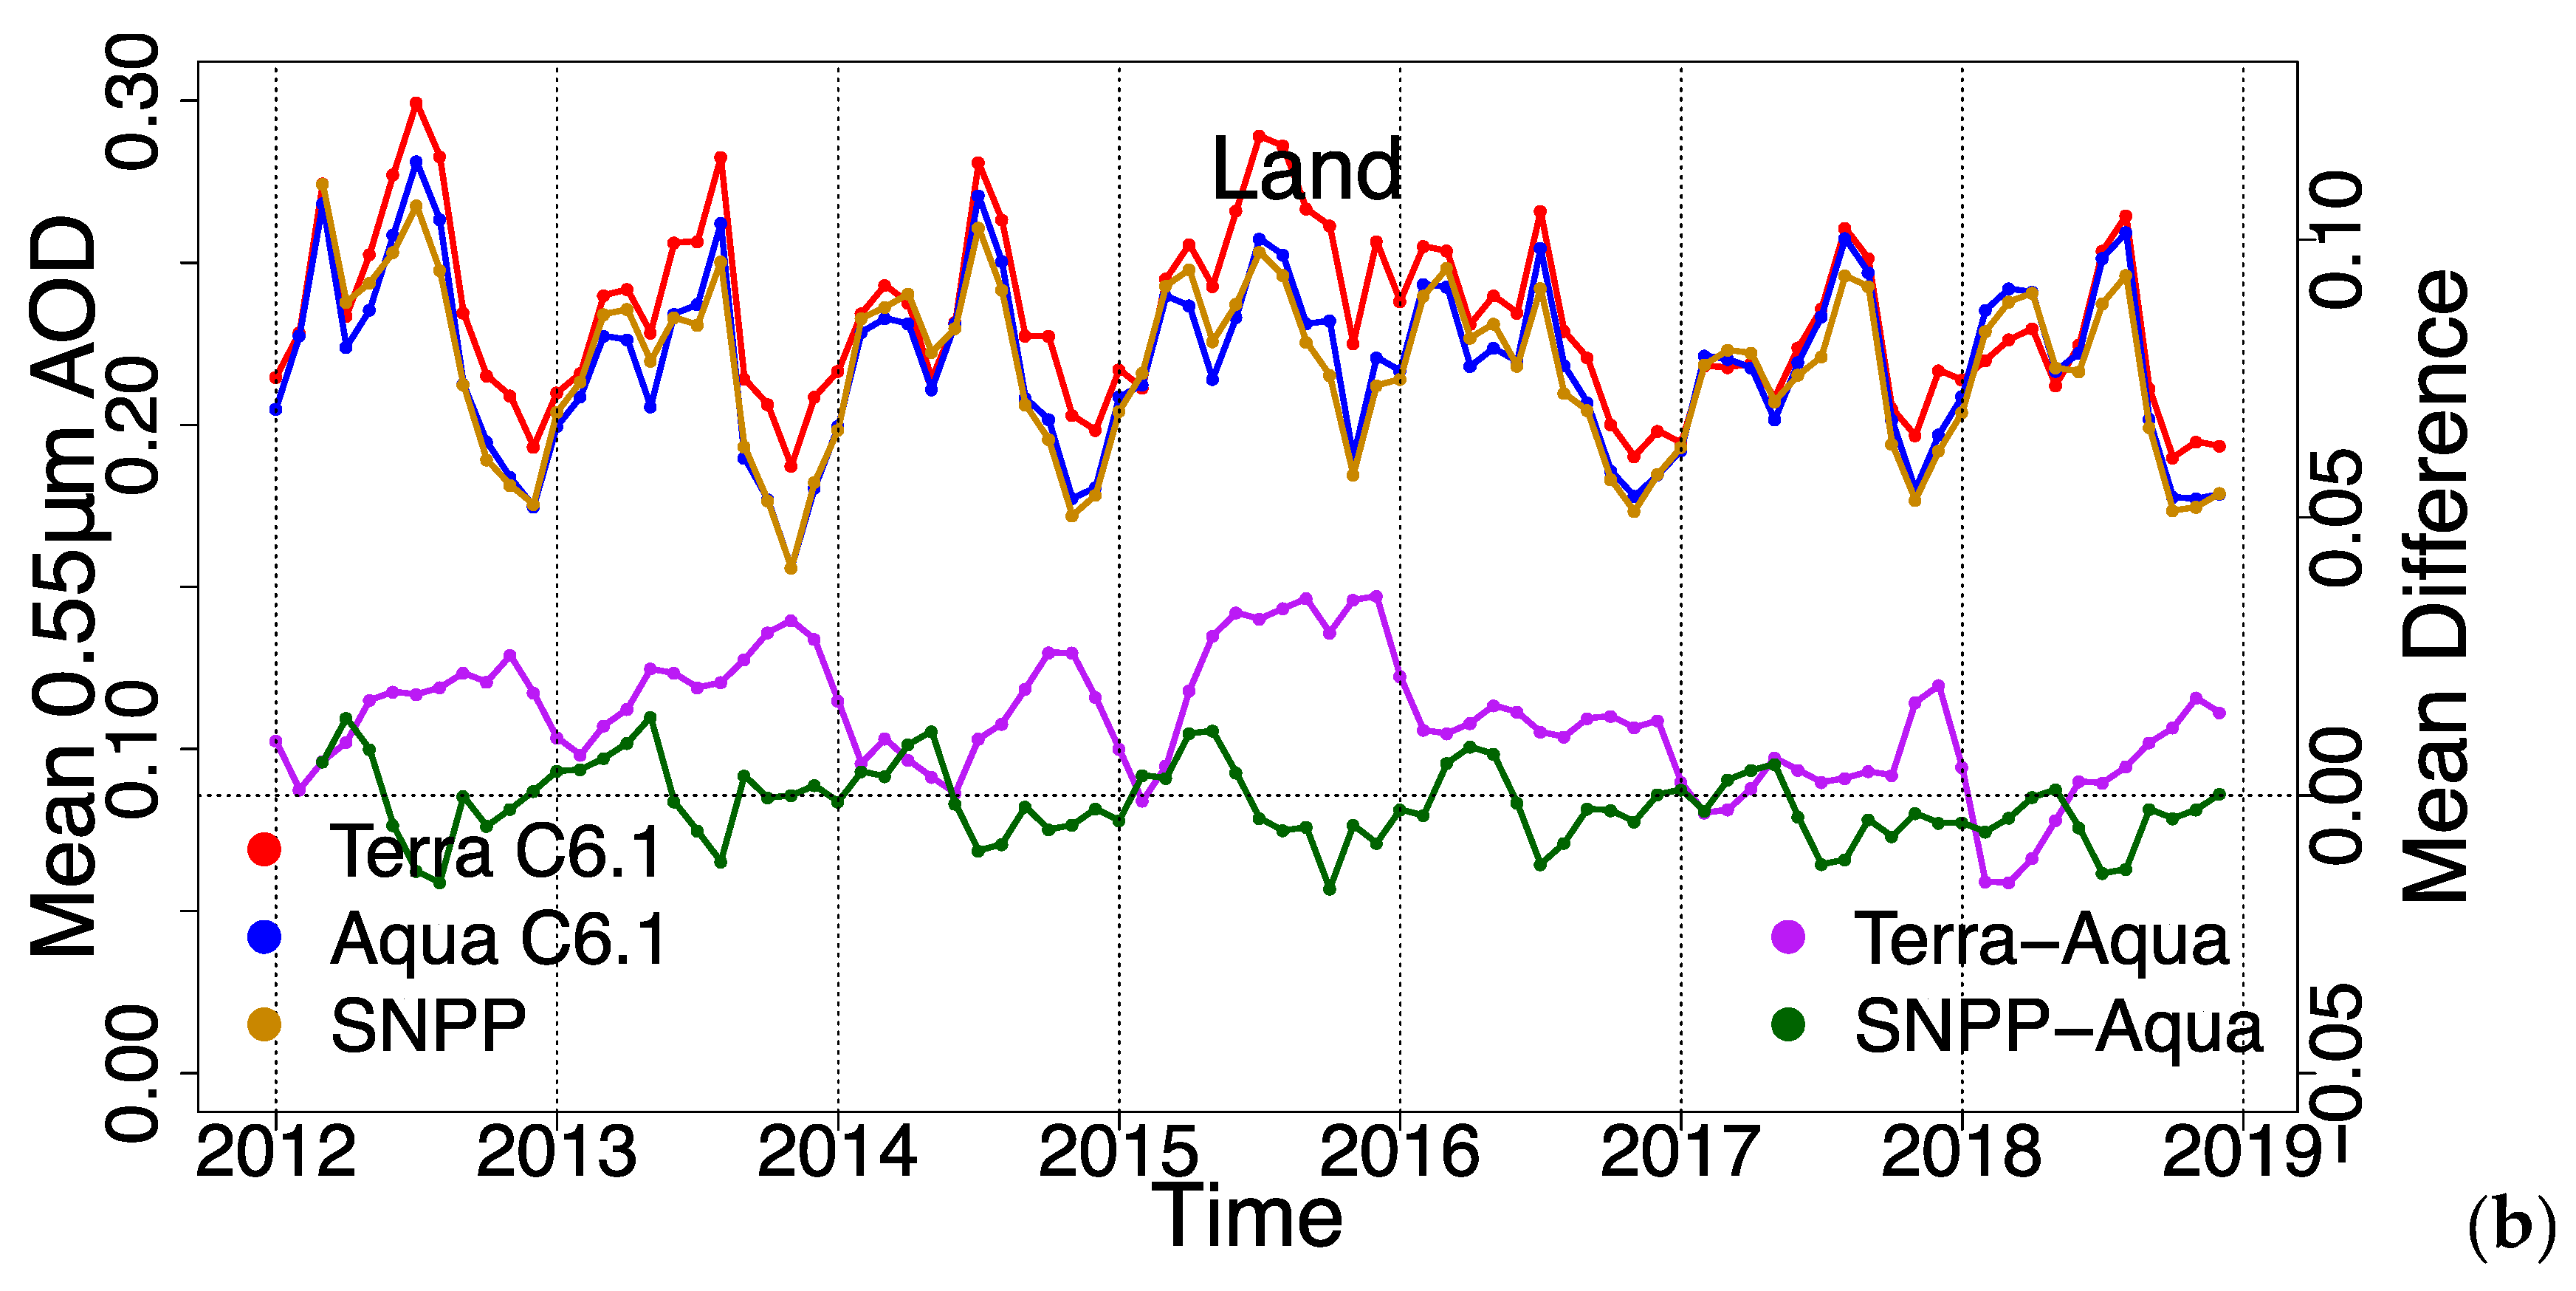
Here we use our global gridded data sets to calculate the area-weighted monthly global average 0.55 μm AOD for MODIS Terra, MODIS Aqua, and VIIRS SNPP, for global ocean and global land separately, using quality-weighted gridded AOD. These are plotted as time series in
Figure 3 (left Y-axis) and represent the period of time when all three sensors were operating. Additionally, we plot the differences (right Y-axis) between the VIIRS and MODIS-Aqua products as well as the MODIS-Terra versus Aqua for reference. Over ocean, VIIRS averages 0.006 higher than the MODIS Aqua AOD retrieval. This is smaller than the offset between MODIS Terra and MODIS Aqua (
Figure 3). The agreement between VIIRS and MODIS-Aqua degrades slightly in the austral summer, when the storm systems of the Southern Ocean are in daylight; this increases the ocean area available to the DT retrieval, but the cloud cover becomes an additional source of error. Nevertheless, the overall seasonal cycle is small. Over land, the offset in VIIRS Dark Target relative to MODIS Aqua is approximately −0.002. It becomes slightly positive each spring and reaches a maximum negative amplitude in late summer, a seasonal cycle that does not resemble the seasonal differences between MODIS Aqua and MODIS Terra.
The bias in VIIRS compared to MODIS Aqua is not constant over the global land and ocean surfaces. We can see this in global difference maps (
Figure 4). While the overall positive bias in AOD over ocean derives from a small but widespread bias, the difference between MODIS Aqua and VIIRS SNPP over land is more mixed, and there are important regional features for both land and ocean retrievals. Mean AOD values covering the entire globe or long periods of time can obscure some of the causes, starting with mismatched collocations. For MODIS to have an AOD value for a particular grid cell, it must contain enough valid data to meet minimum sampling thresholds:
At least six level 2 pixels to calculate each daily average.
At least three days in a month to calculate each monthly average.
At least three months in a year to calculate each annual average.
The same is true for VIIRS. However, the three days for MODIS do not have to be the same three days for VIIRS in order to compute the monthly mean, and the required three months also do not have to be the same for both instruments to calculate the annual average and the difference map in
Figure 4. Furthermore, any given location can only appear on the difference map if there are enough retrievals from
both MODIS and VIIRS in that grid location. On the other hand, a
global average value (e.g., per month in
Figure 3) is derived from averaging valid grids, and there is no requirement of collocation either for a single instrument or when computing the difference.
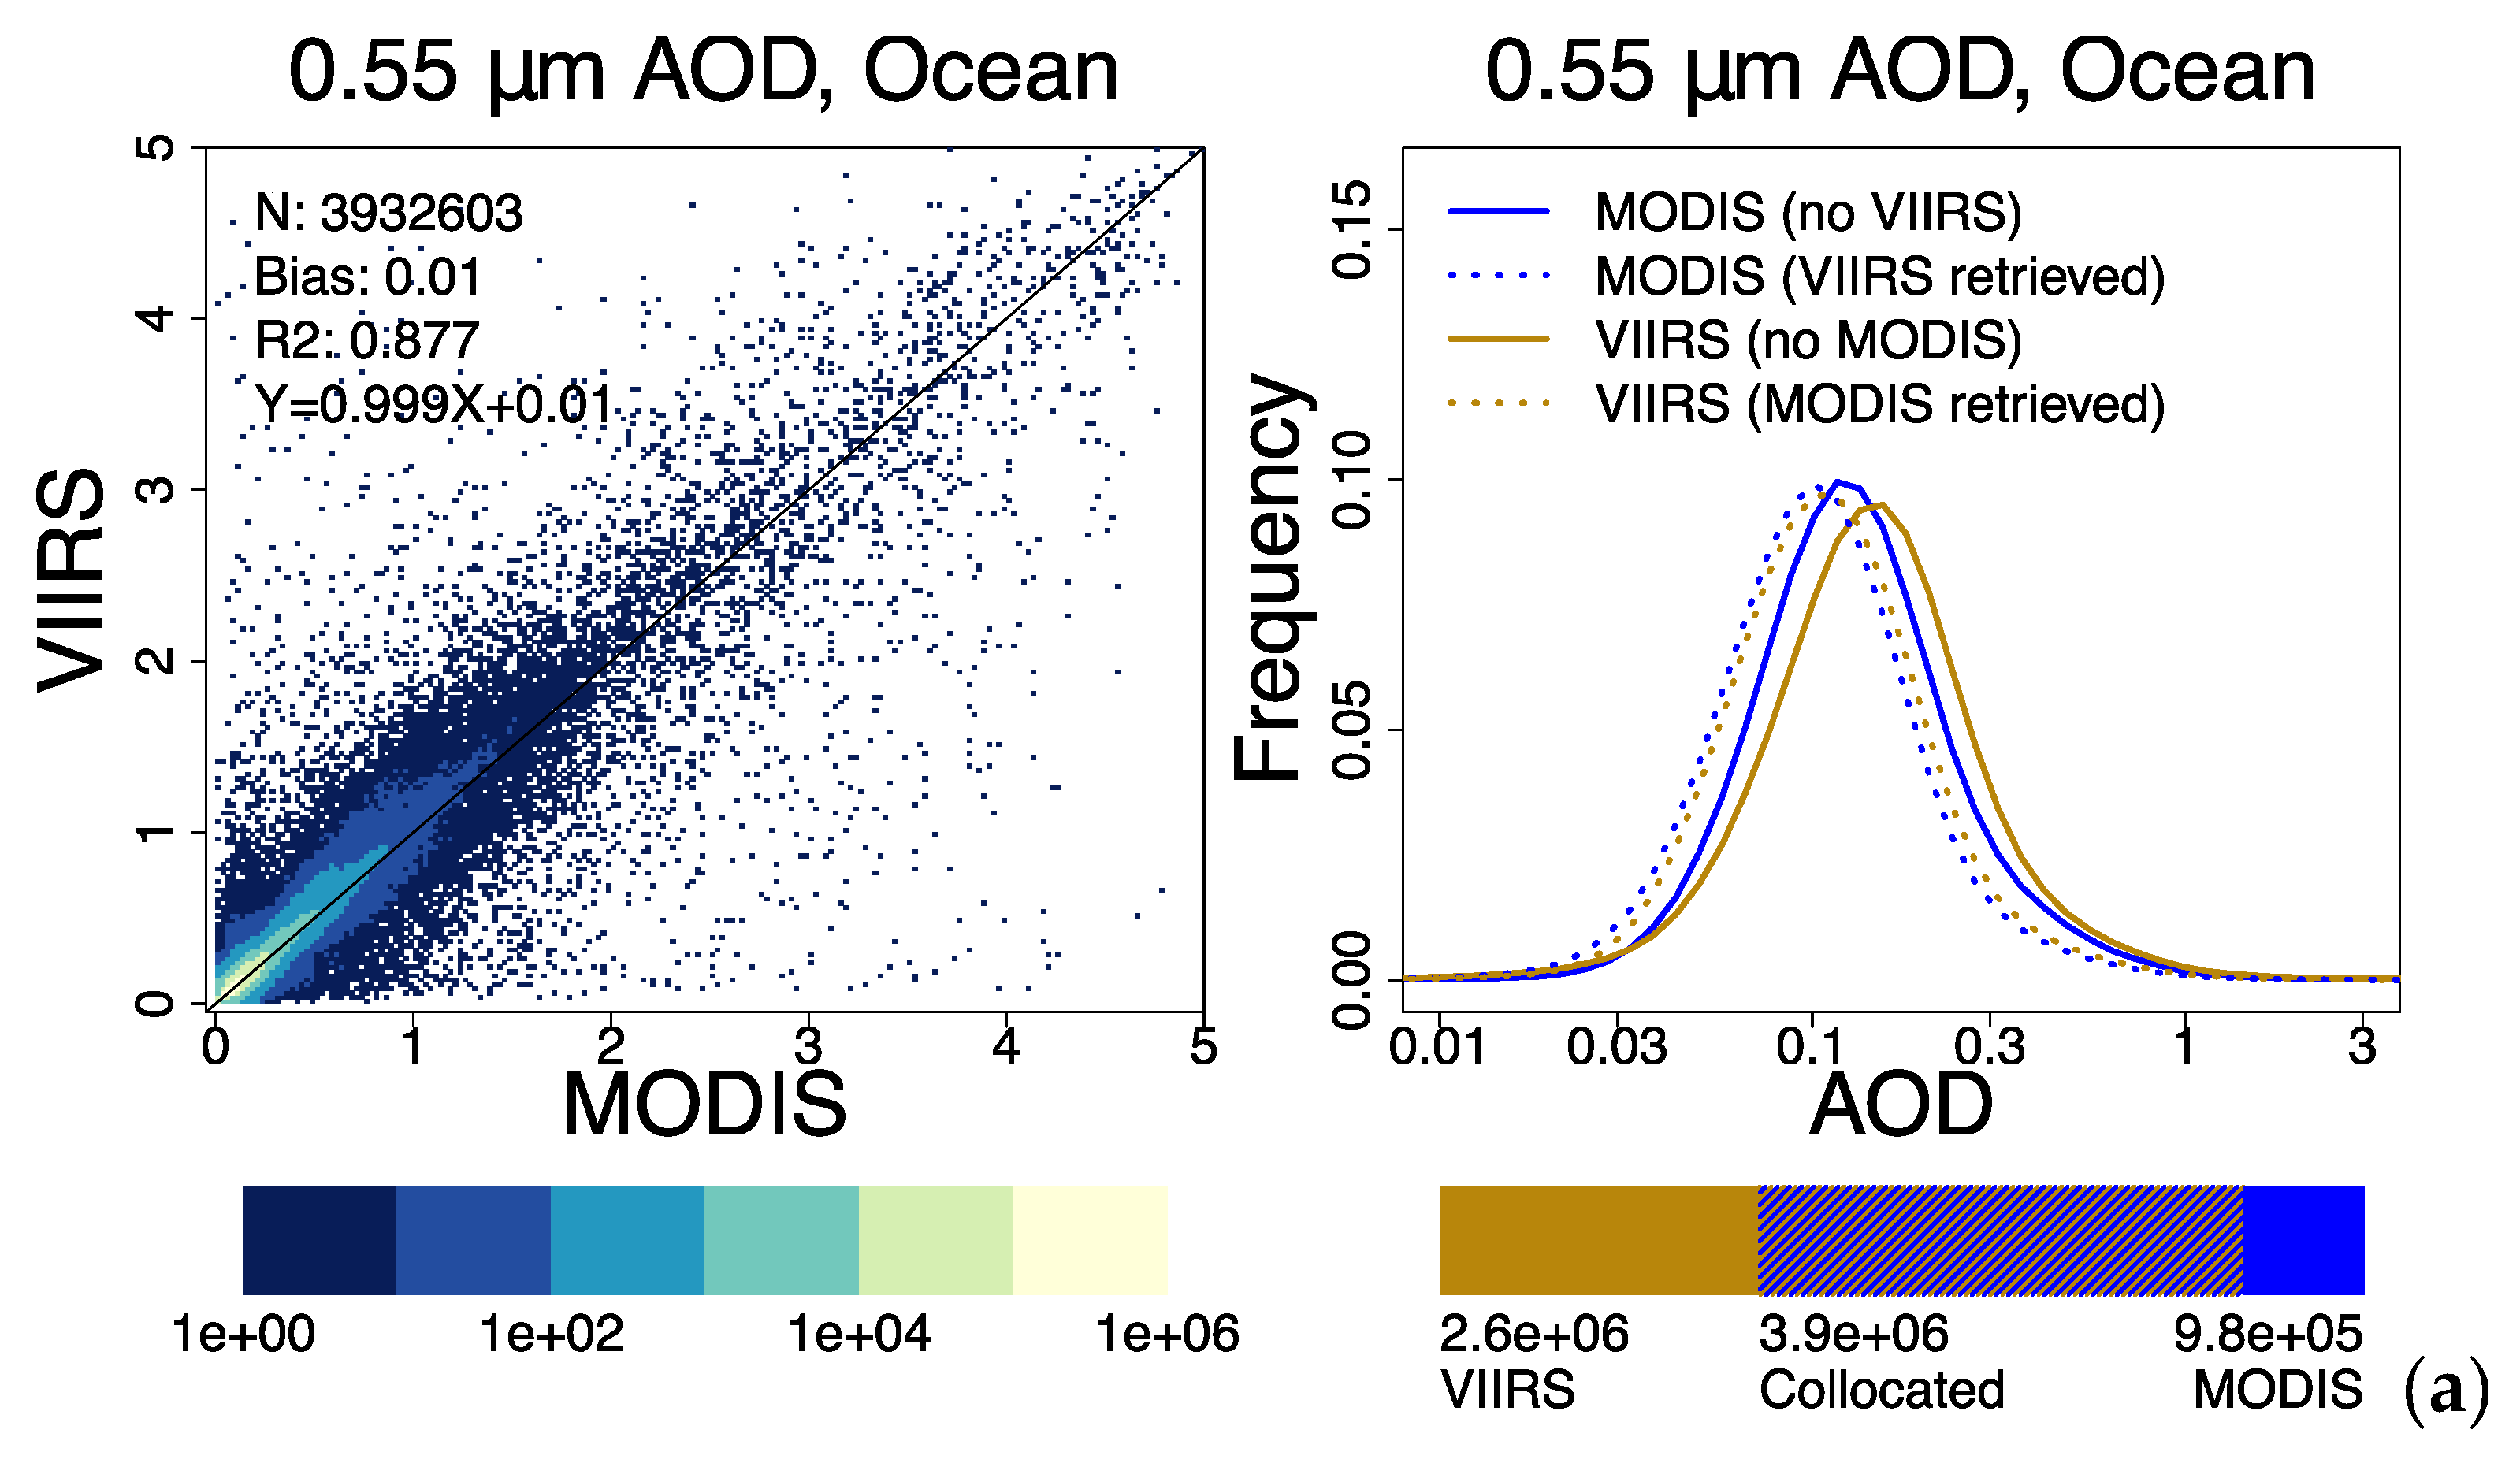
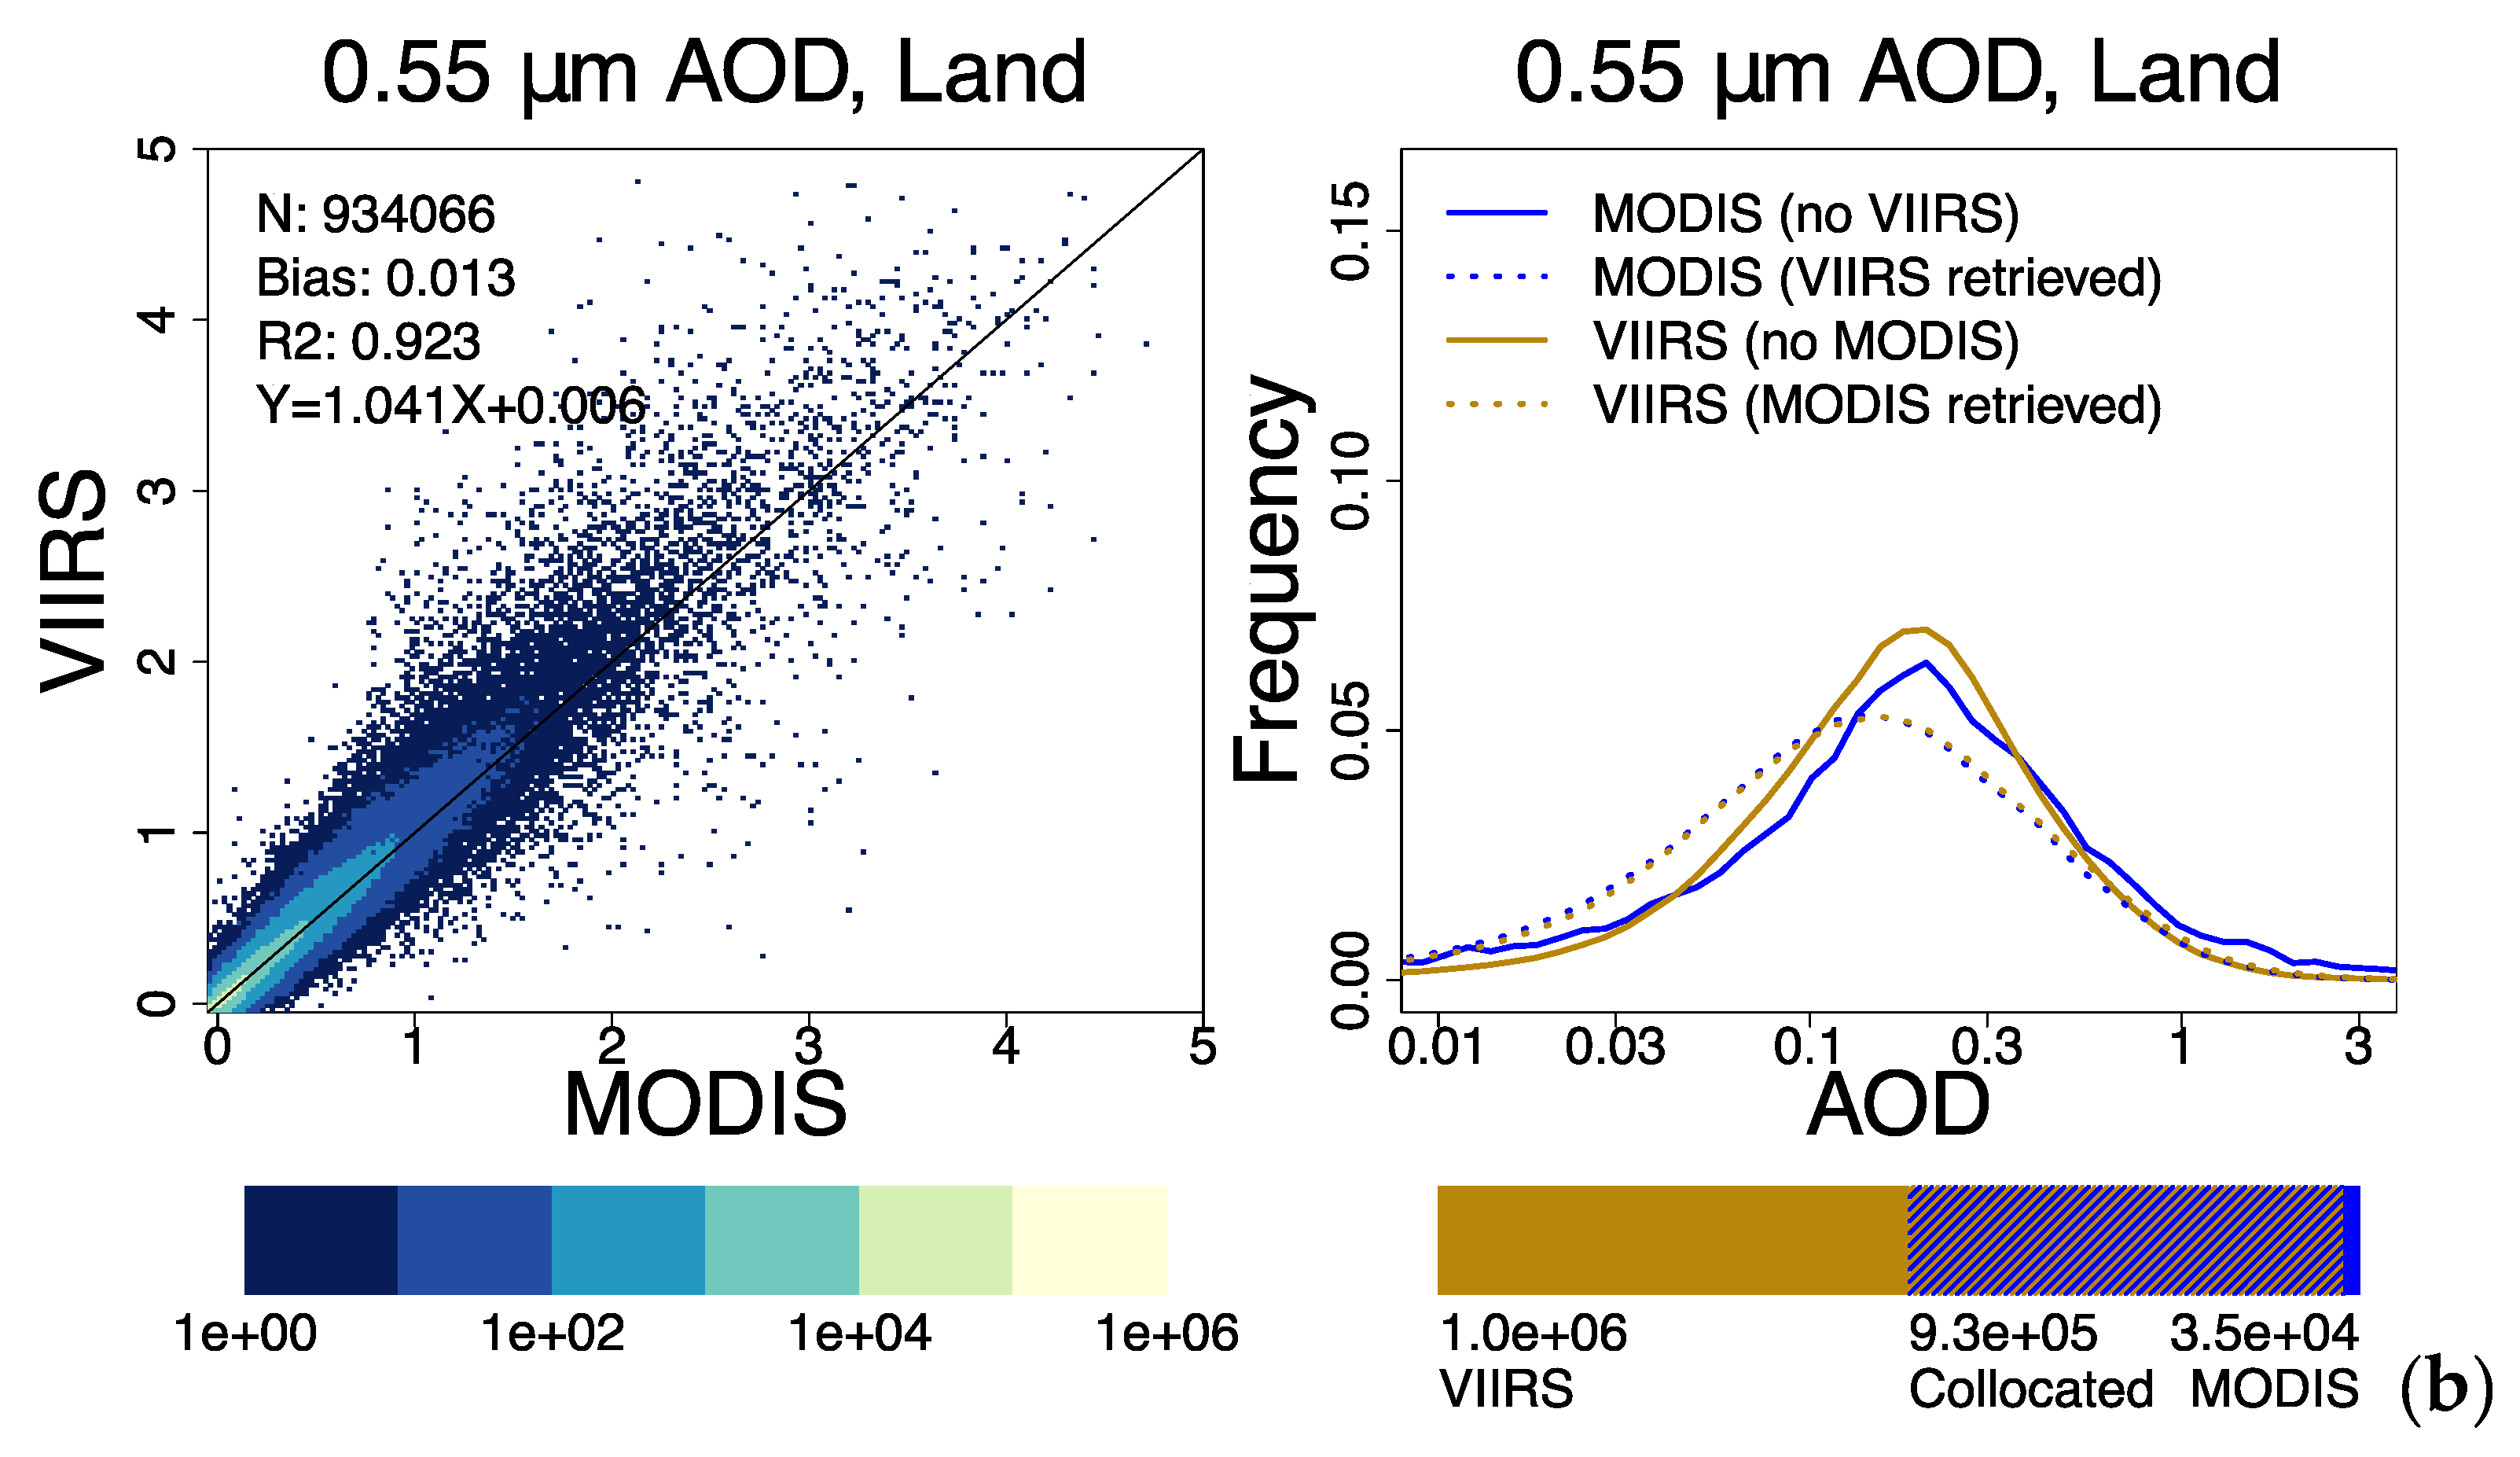
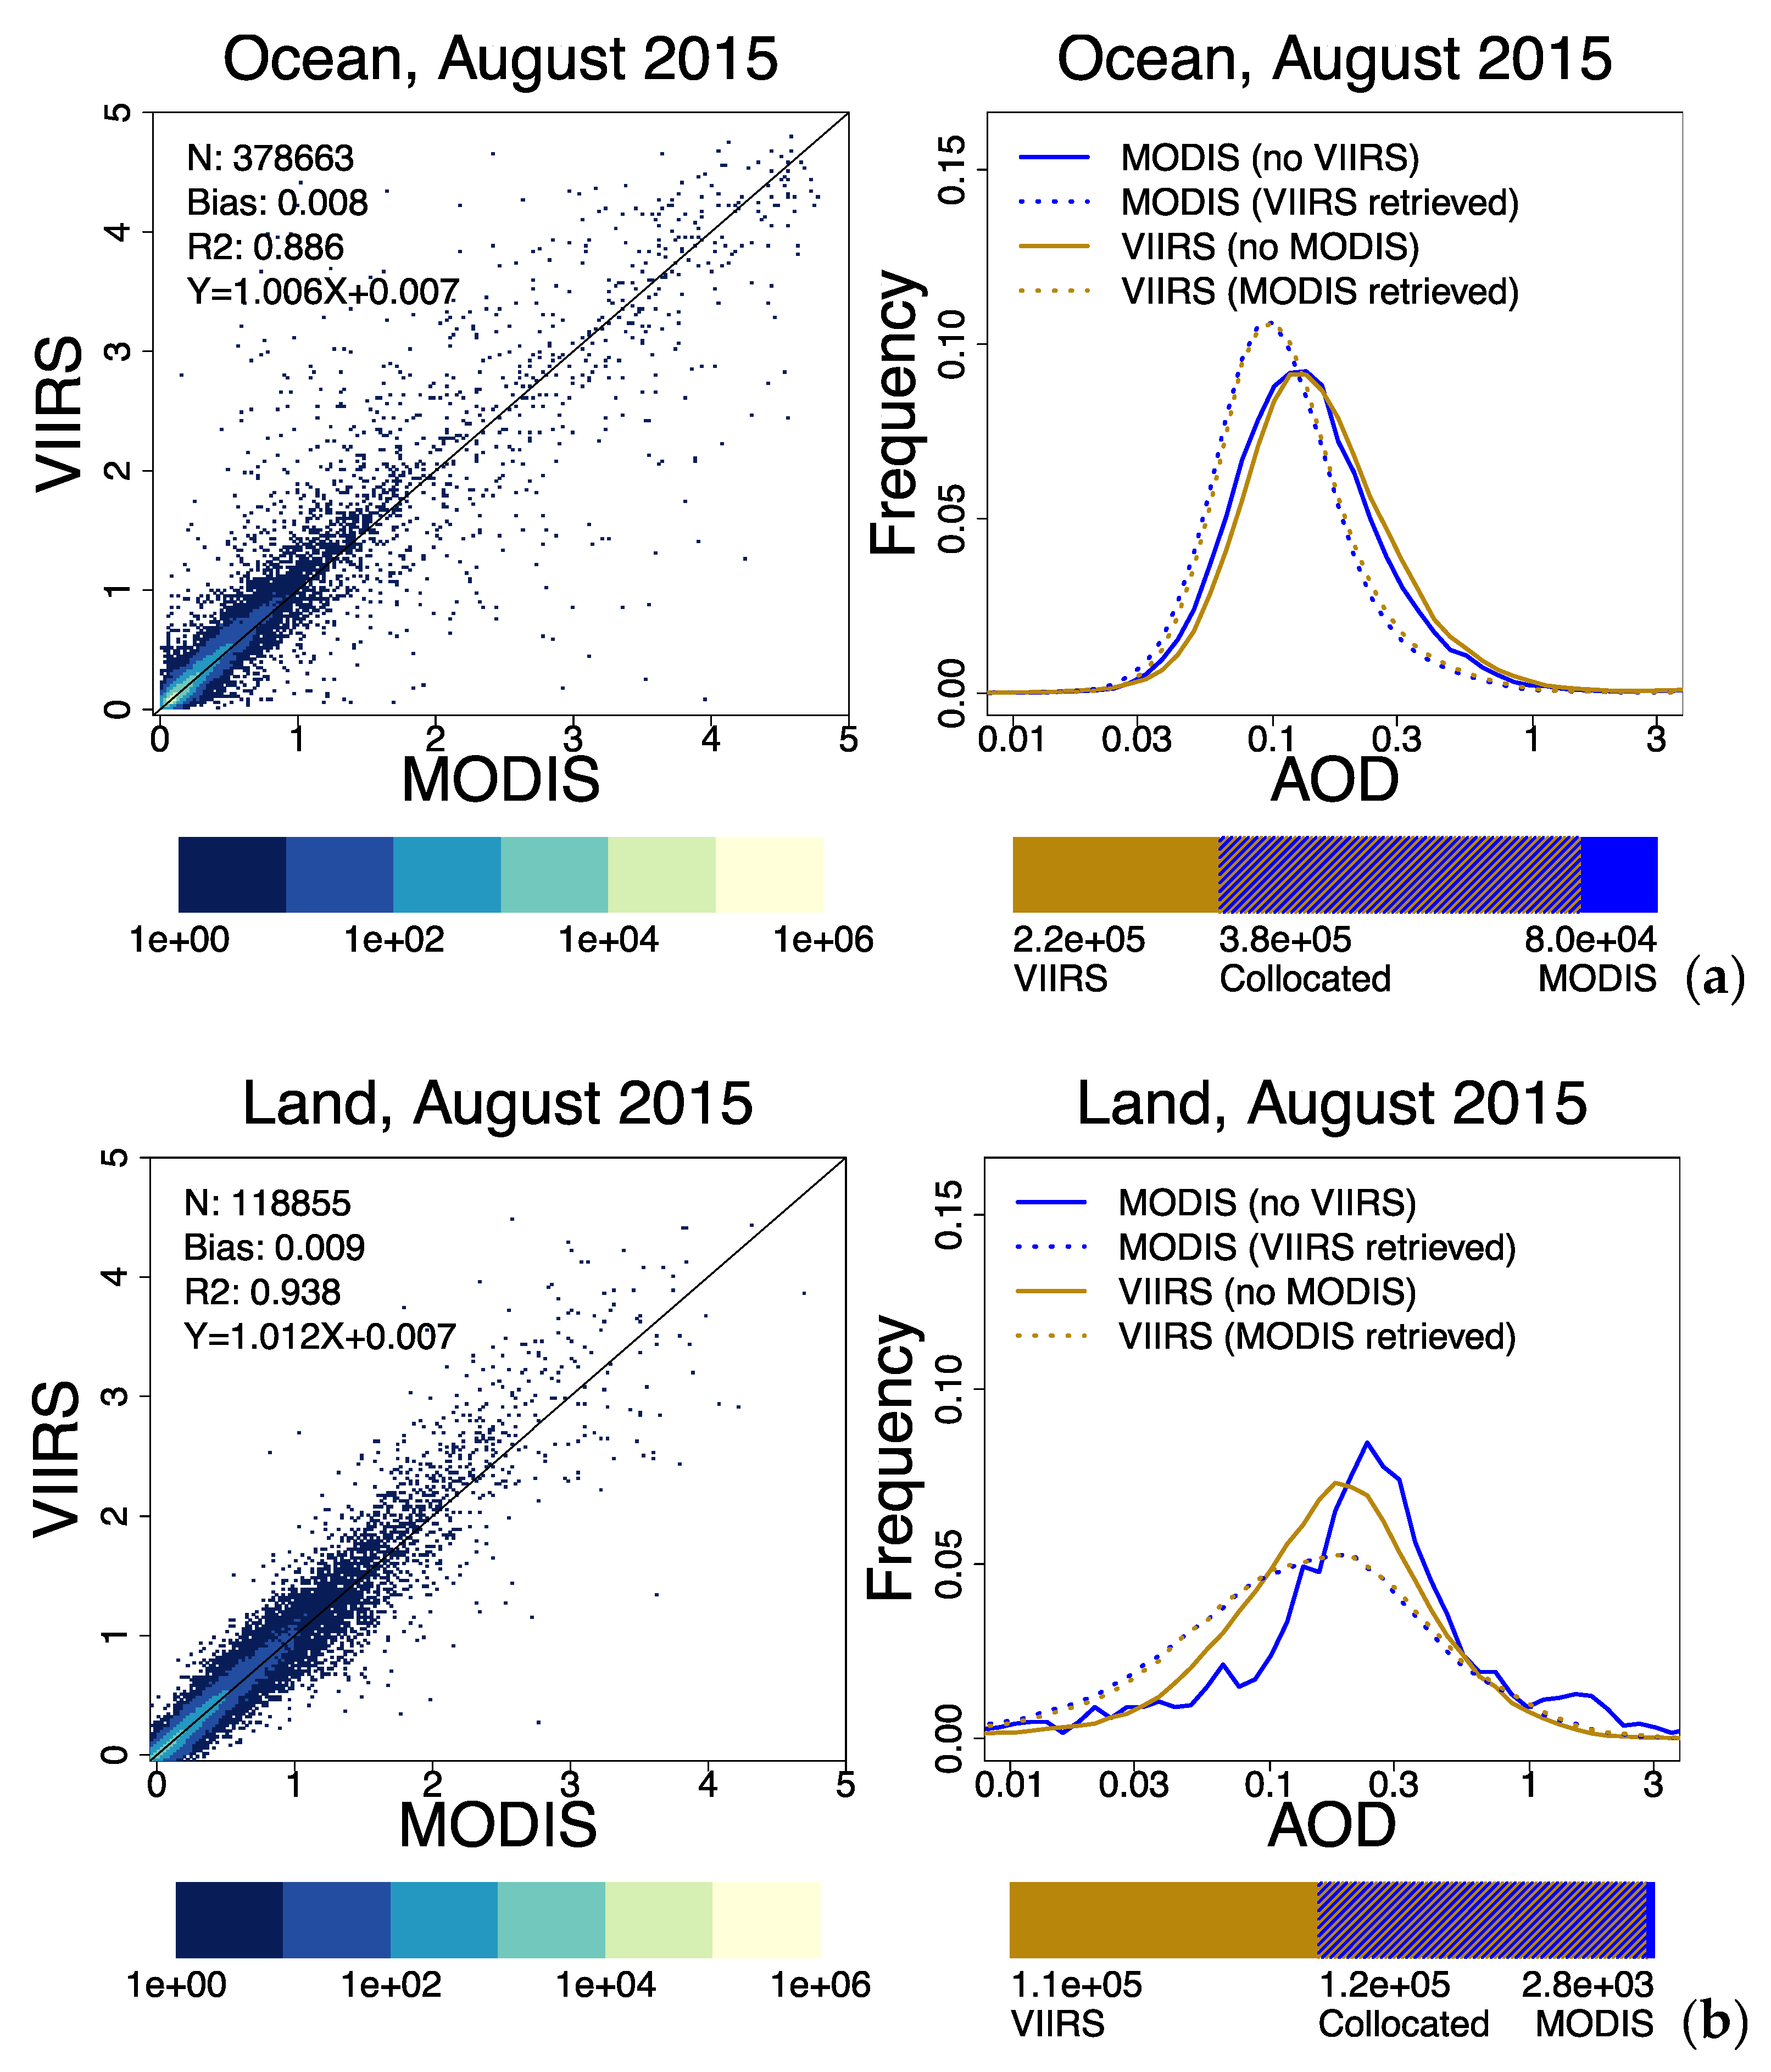
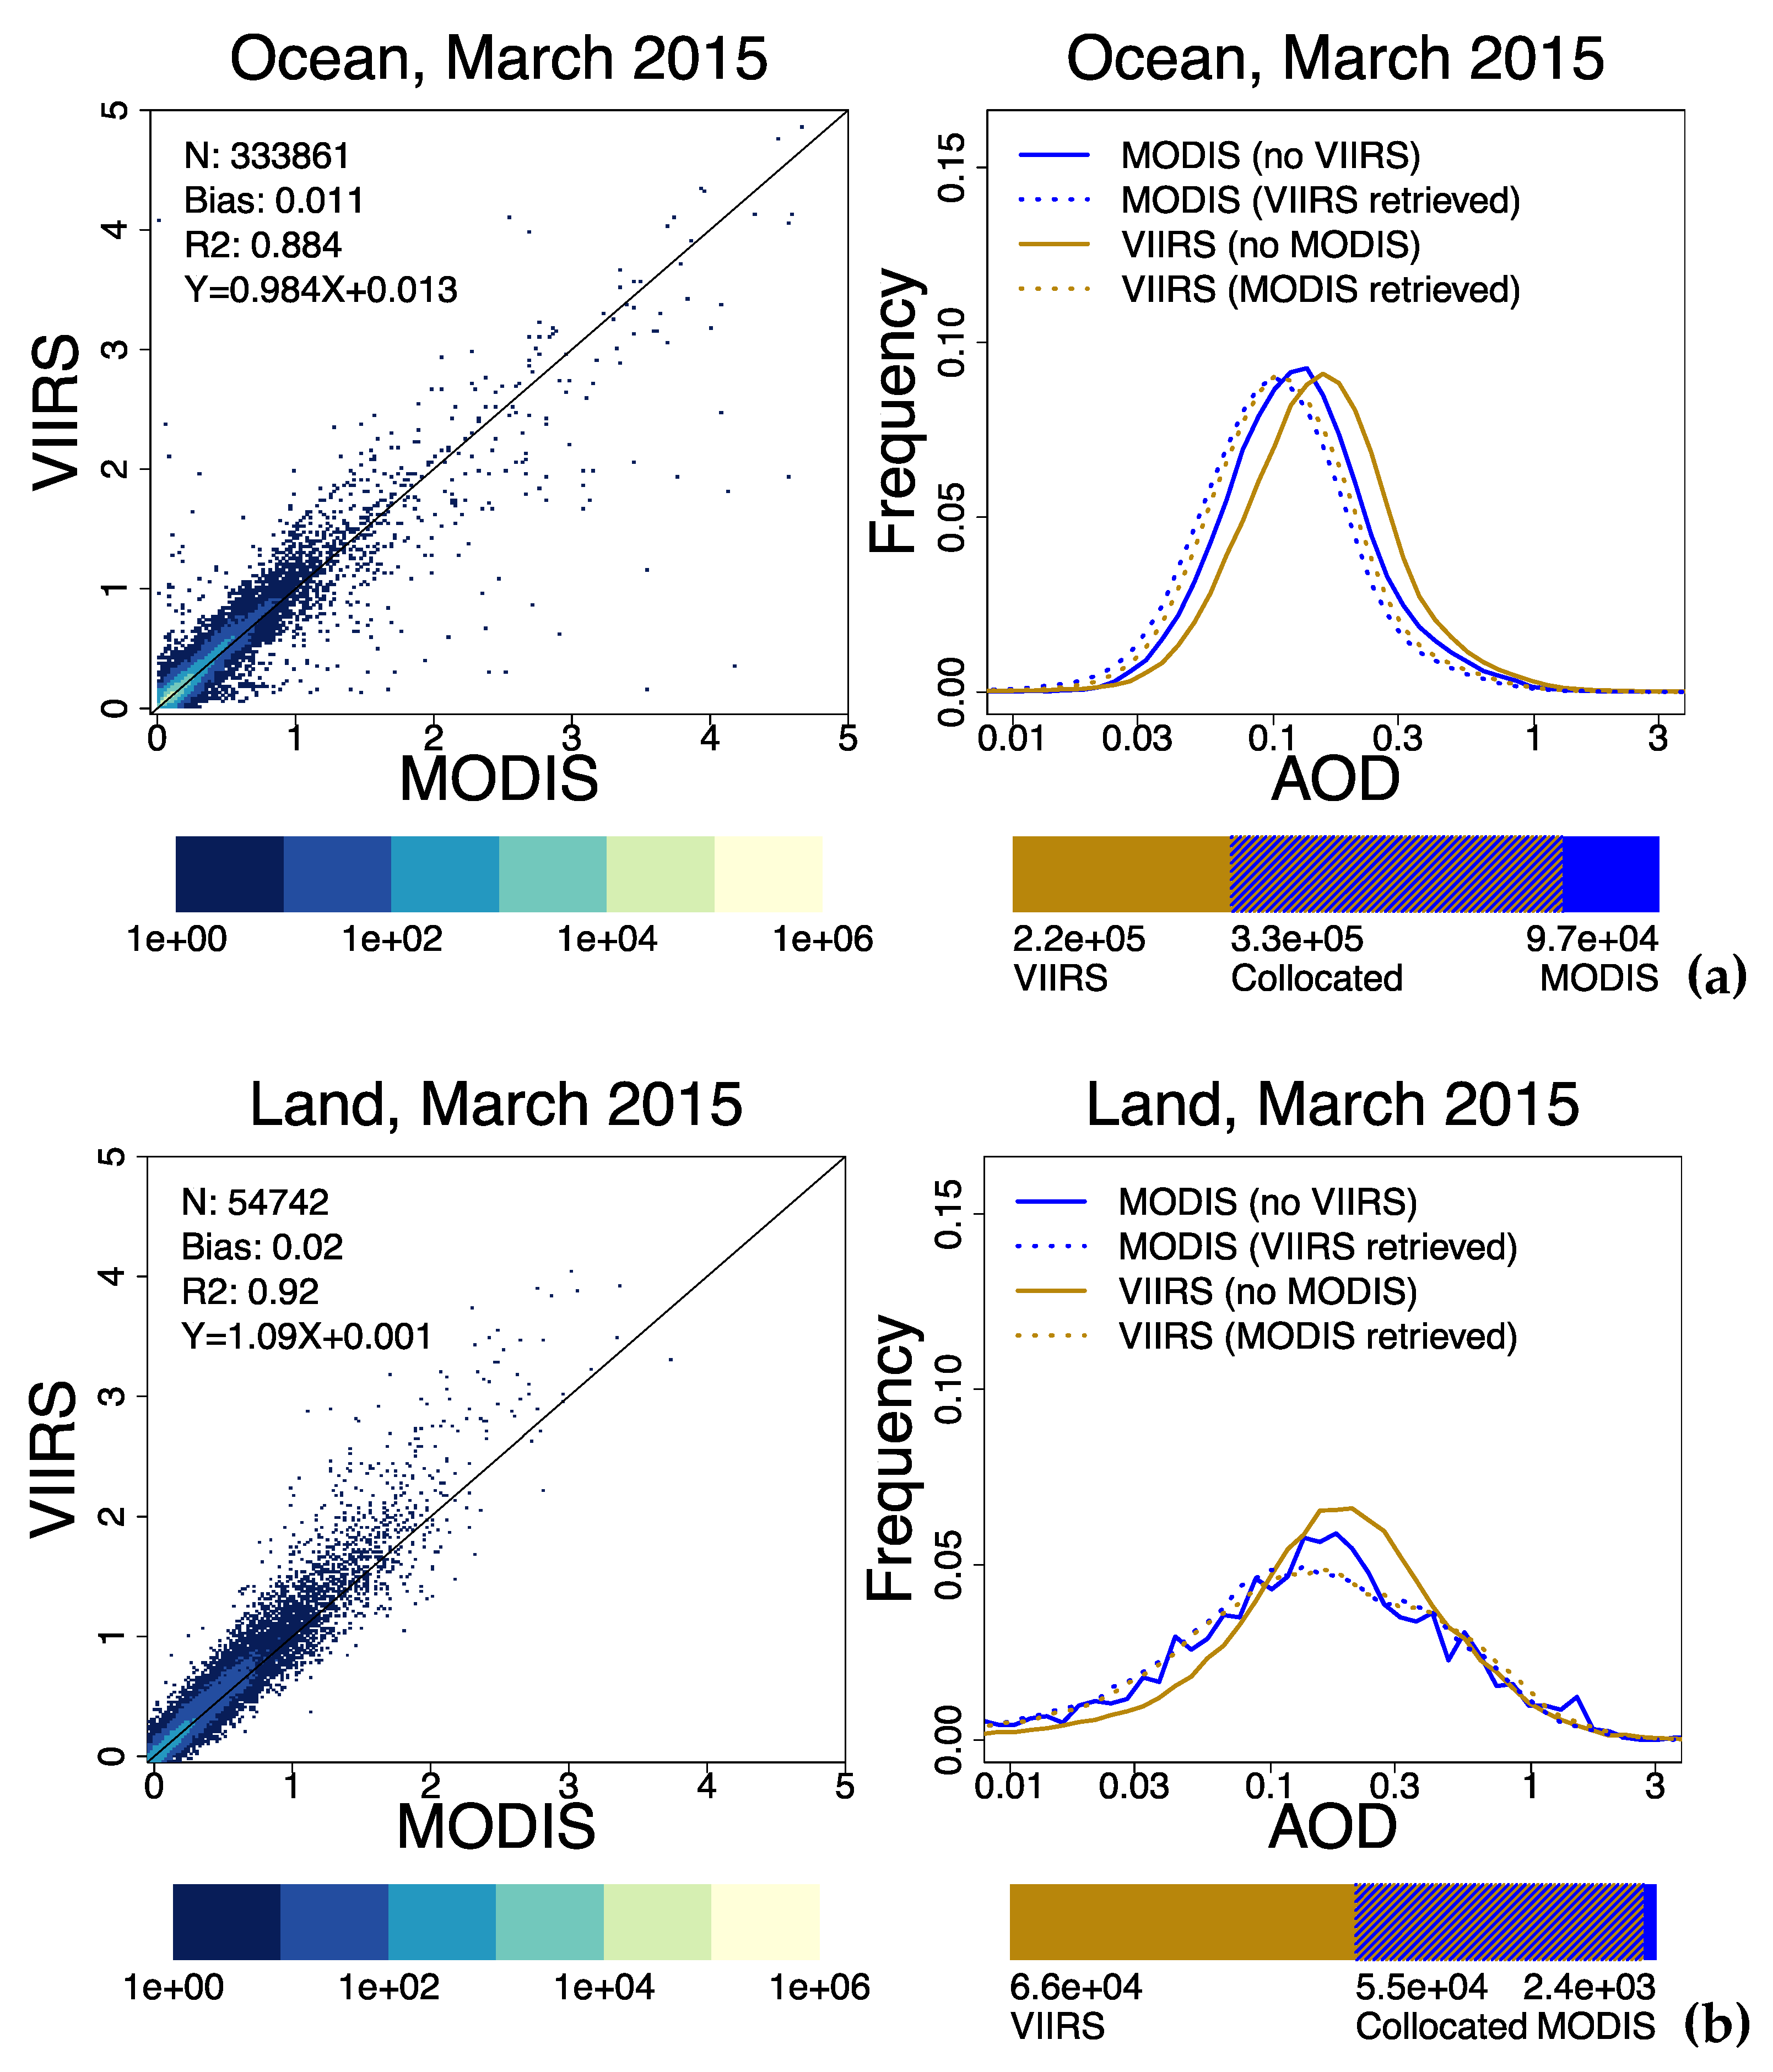
The daily gridded values from 2015 provide a more detailed view. We consider the series of 365 daily 1° × 1° maps with QA-filtered AOD separated into land and ocean values. Some coastal latitude-longitude pairs have valid AOD values for both land and ocean; in this case the land values are included in the gridded average over land, and the ocean values are included in the gridded average over ocean. Although VIIRS SNPP and MODIS Aqua observe most locations at about the same time of day, there are grid cells on any given day that contain level 2 retrievals from both MODIS and VIIRS, grid cells that contain retrievals only from MODIS, and grid cells that contain retrievals only from VIIRS. In
Figure 5, we examine these different sets. The left-hand panels show scatterplots of the first set, where MODIS and VIIRS have AOD values that are collocated in the same grid cell. The frequency distributions of their AOD values appear as the dotted lines in the right-hand panel of
Figure 5; for both land and ocean, the strong correlation in the scatterplot is echoed by distributions that nearly coincide. This means that where MODIS and VIIRS both “chose” to retrieve on a given day, their reported values are about the same: one is not biased relative to the other.
However, the collocated grid cells represent roughly half the total grid cells for which AOD values exist. The bar underneath each frequency distribution panel in
Figure 5 shows the proportion of collocated to non-collocated grid cells: over ocean there are 3.9 × 10
6 grid cells with both MODIS and VIIRS retrievals, but 9.8 × 10
5 grid cells that had MODIS without VIIRS, and 2.6 × 10
6 that had VIIRS without MODIS. Over land the numbers are 1.0 × 10
6, 3.5 × 10
4, and 9.3 × 10
5 grid cells, respectively. The non-collocated AOD values appear as solid lines in the frequency distribution. Over ocean, all four distributions are approximately log-normal, but the lone-sensor AOD values skew higher. This is not surprising, because if cloud cover or a bright surface scene caused one sensor not to retrieve AOD, the retrieval from the other sensor is likely impacted by the same cloud or surface. What is interesting is that VIIRS-only AOD skews higher than MODIS-only AOD over ocean, but that the opposite is true over land.
The proportion of AOD retrievals that cannot be collocated with the other sensor differs between MODIS and VIIRS; given the wider swath of the VIIRS observation, VIIRS covers more of the globe each day and retrieves AOD for a larger number of grid cells. Non-collocated grid cells therefore make up a larger percentage of the total AOD retrievals for VIIRS than for MODIS. Given the same grid cell counts from
Figure 5 over land, only 47% of grid cells with valid data have it for both sensors; nearly 51% have retrievals only from VIIRS, and the remaining 1.8% have retrievals only from MODIS. That is, 96% of the MODIS retrieved grid cells have collocated VIIRS, but only 48% of the VIIRS retrieved grid cells have collocated MODIS.
4.3. Monthly Average Comparisons between MODIS and VIIRS
Figure 3 shows that the VIIRS–MODIS offset has a seasonal cycle, especially over land. This likely reflects storm tracks and aerosol events, which may lead to large sources of disagreement on monthly or daily time scales. We highlight this using two separate months: August and March 2015.
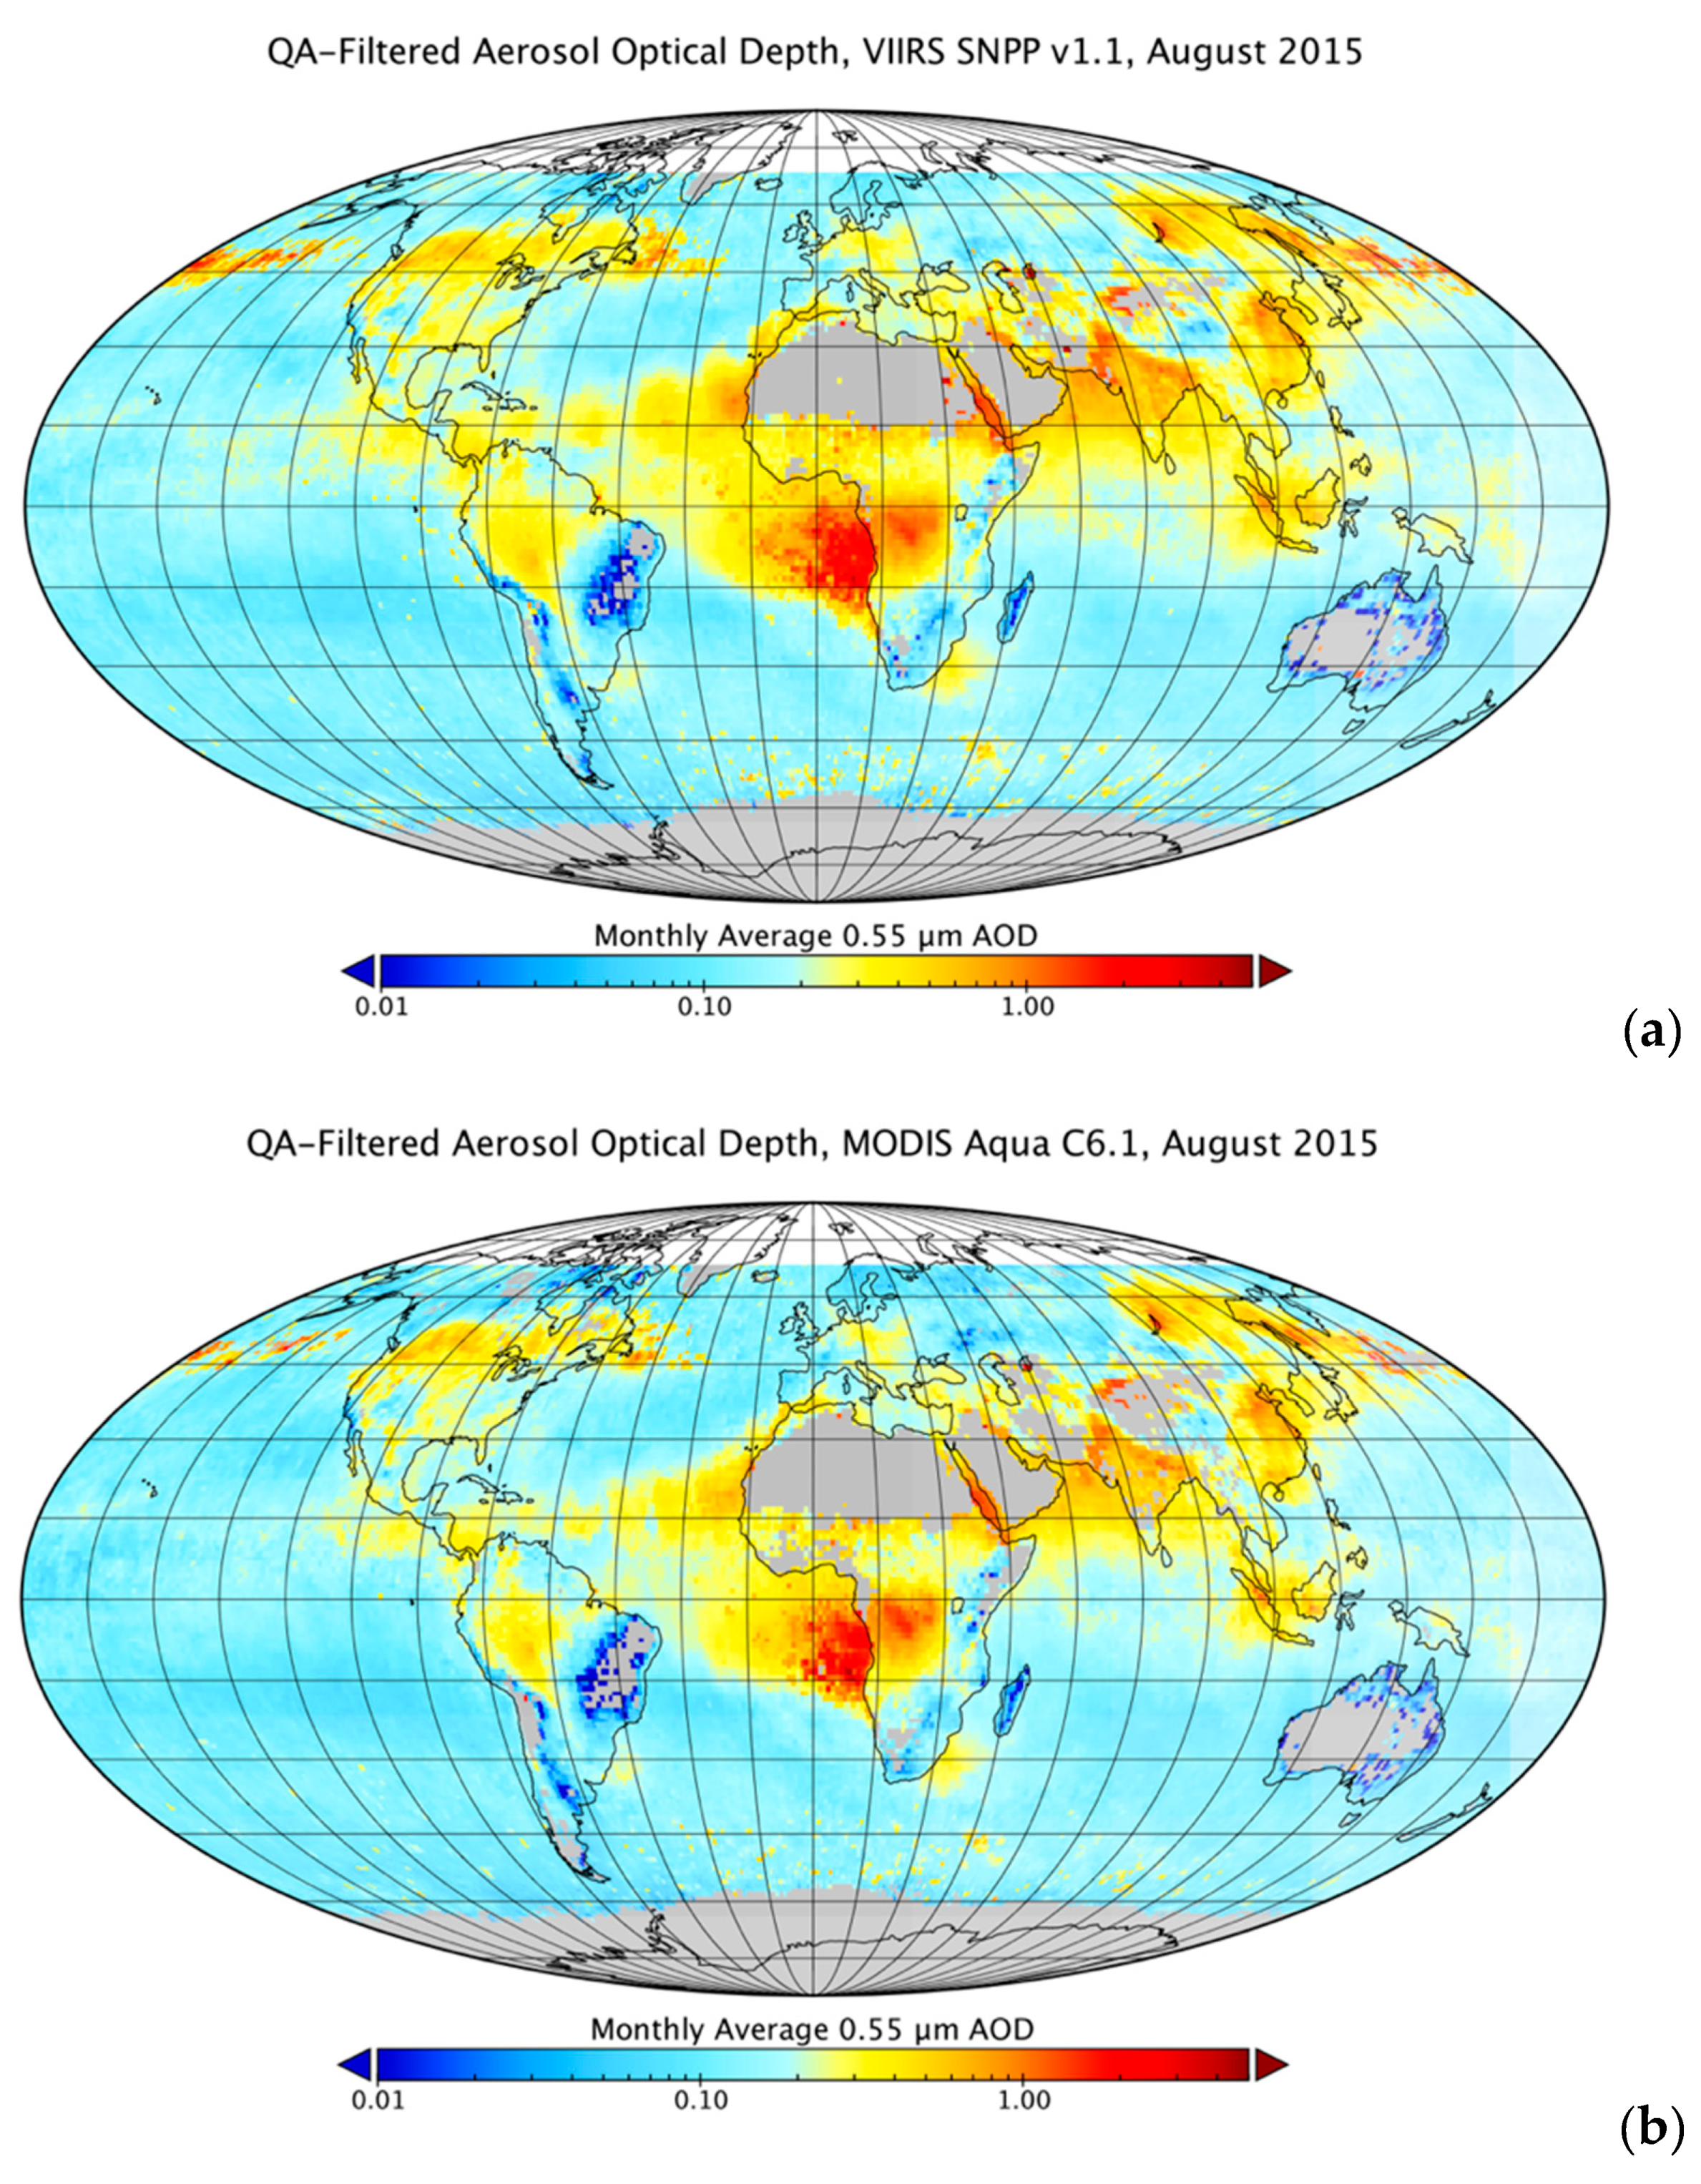
During the month of August 2015, both the MODIS and VIIRS versions of the Dark Target retrieval detect high aerosol loading in the same locations. Among them are the Congo Basin and off the west coast of Africa, the Indian subcontinent immediately south of the Himalayas, Siberia eastward from Lake Baikal, the warm conveyor belt region across the North Pacific, and southern Canada (
Figure 6).
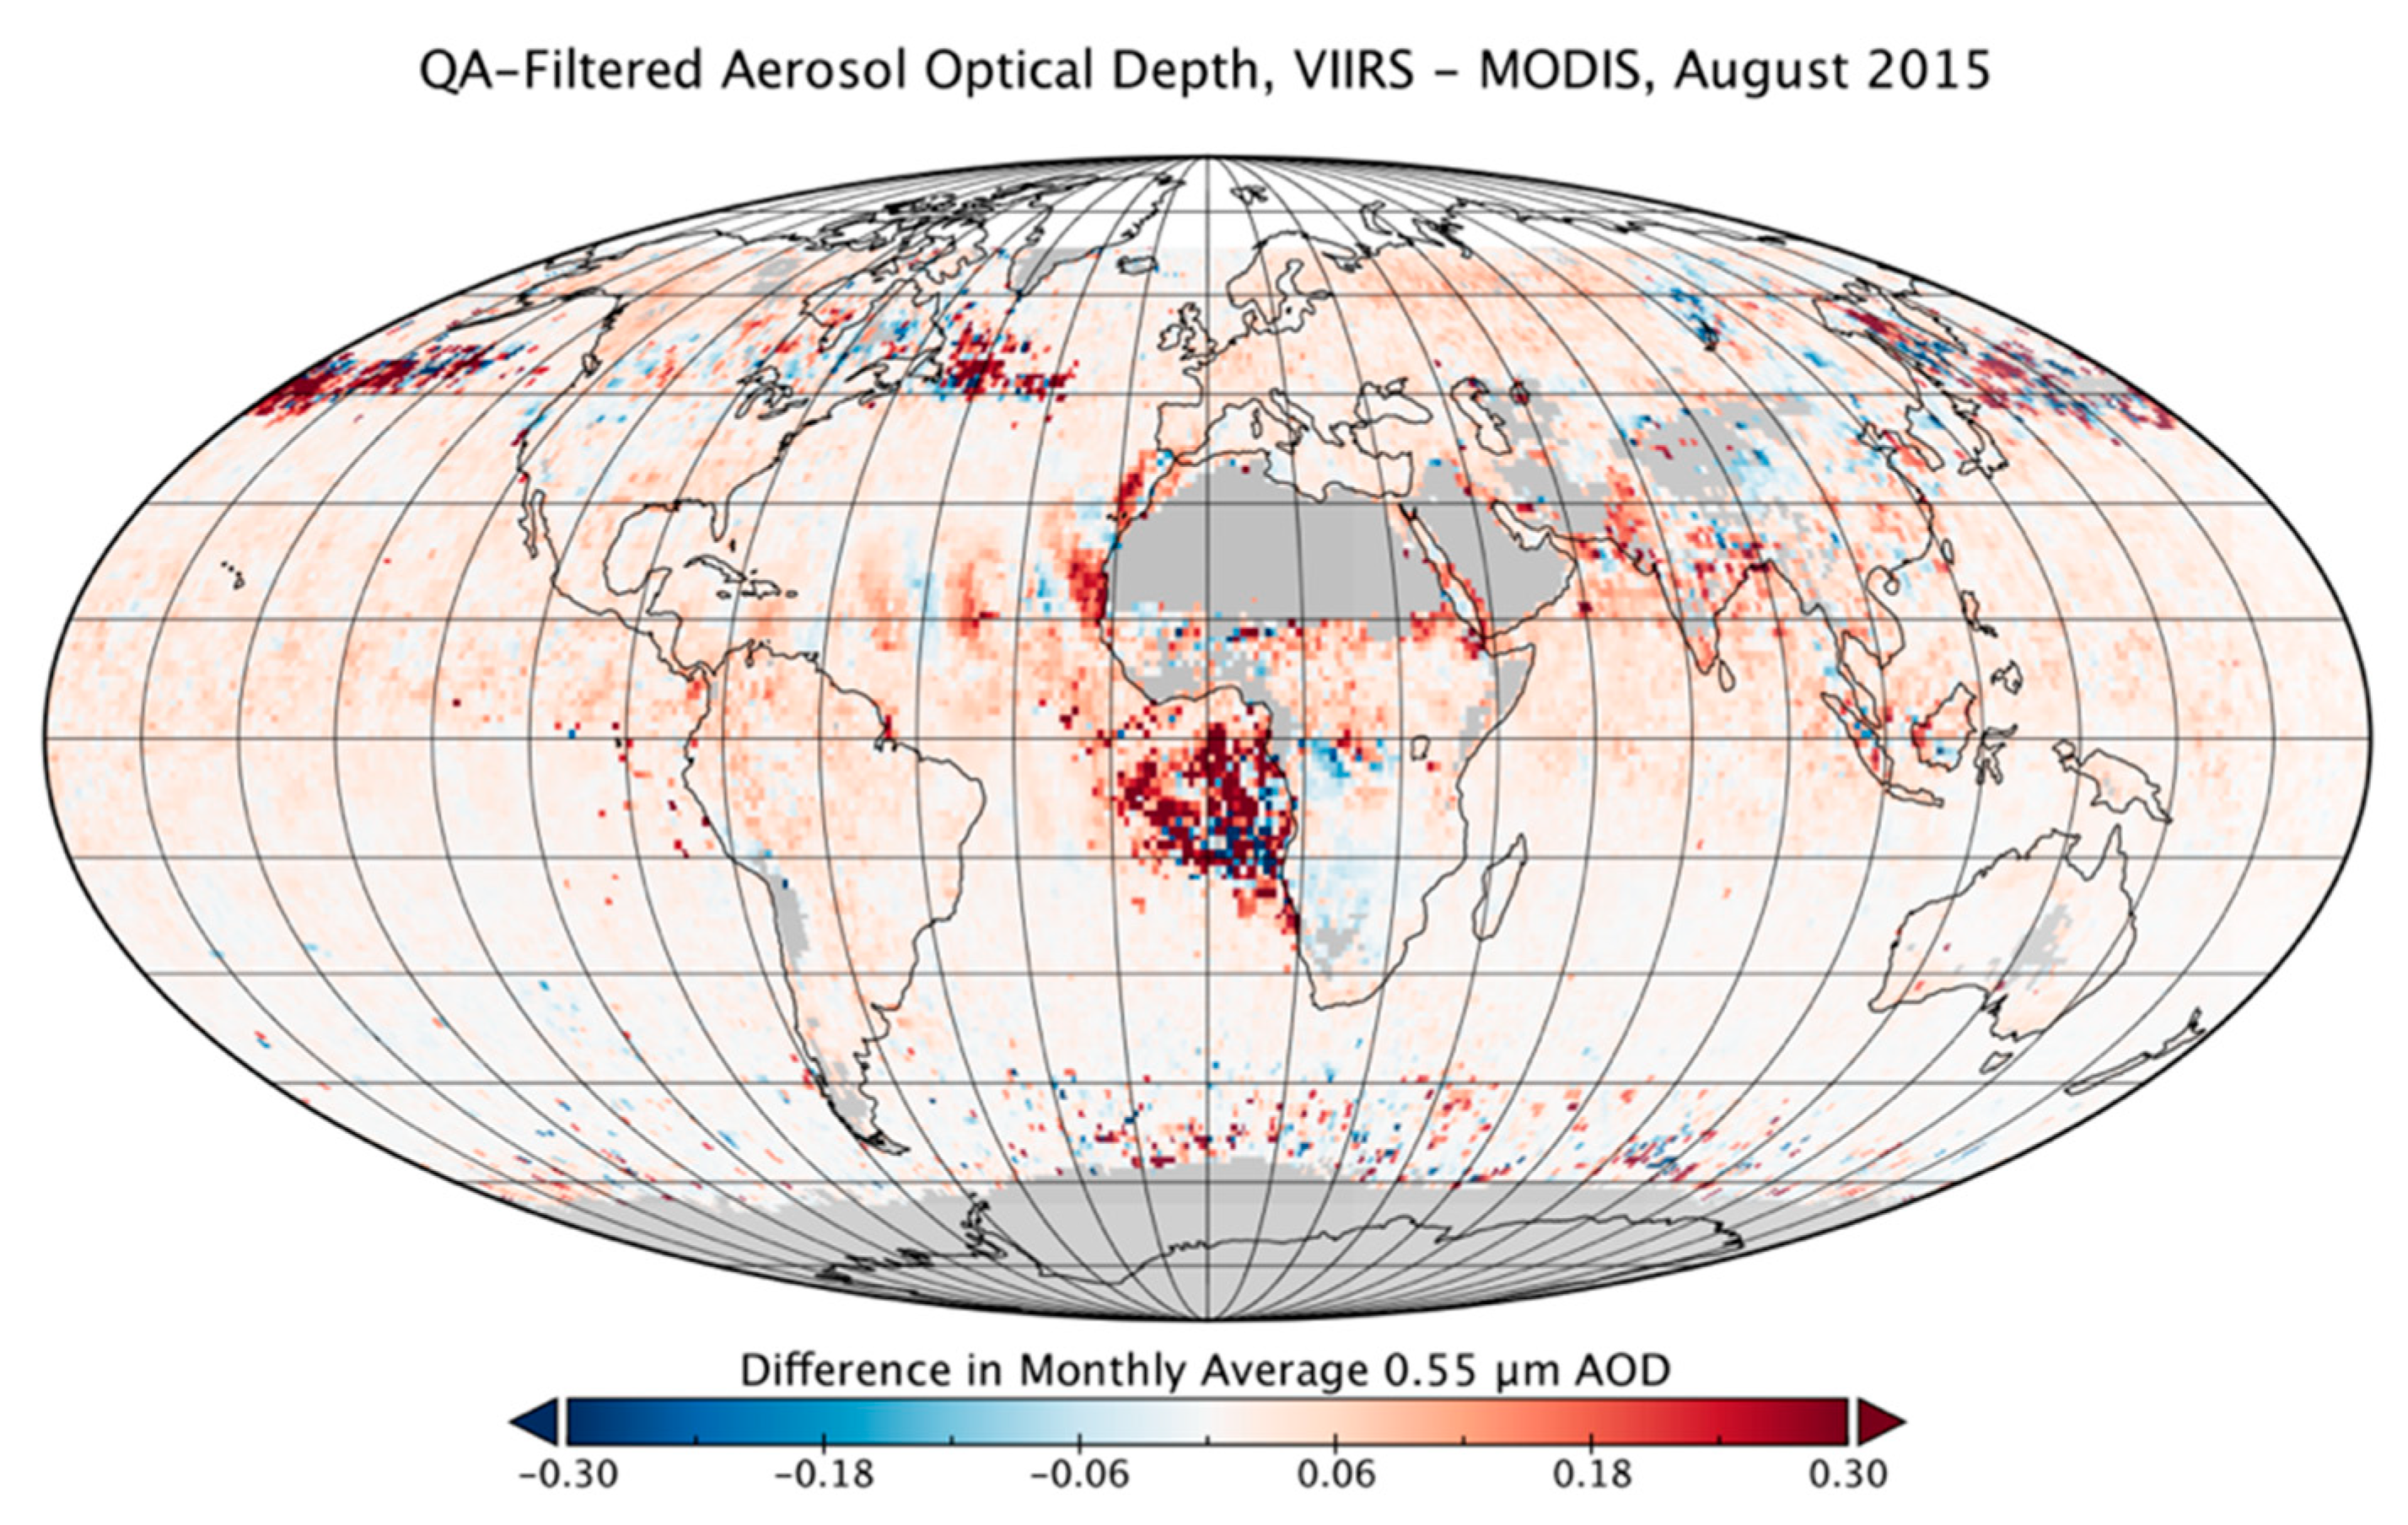
Given the same algorithm, retrievals from MODIS and VIIRS capture the same aerosol events in the same parts of the world. However, these areas of high AOD are also the largest sources of disagreement between the MODIS and VIIRS retrievals (
Figure 7). In areas with both high AOD and frequent cloud cover, especially over the ocean, different amounts of cloud contamination in the AOD retrieval boxes undoubtedly explains some of the disagreement.
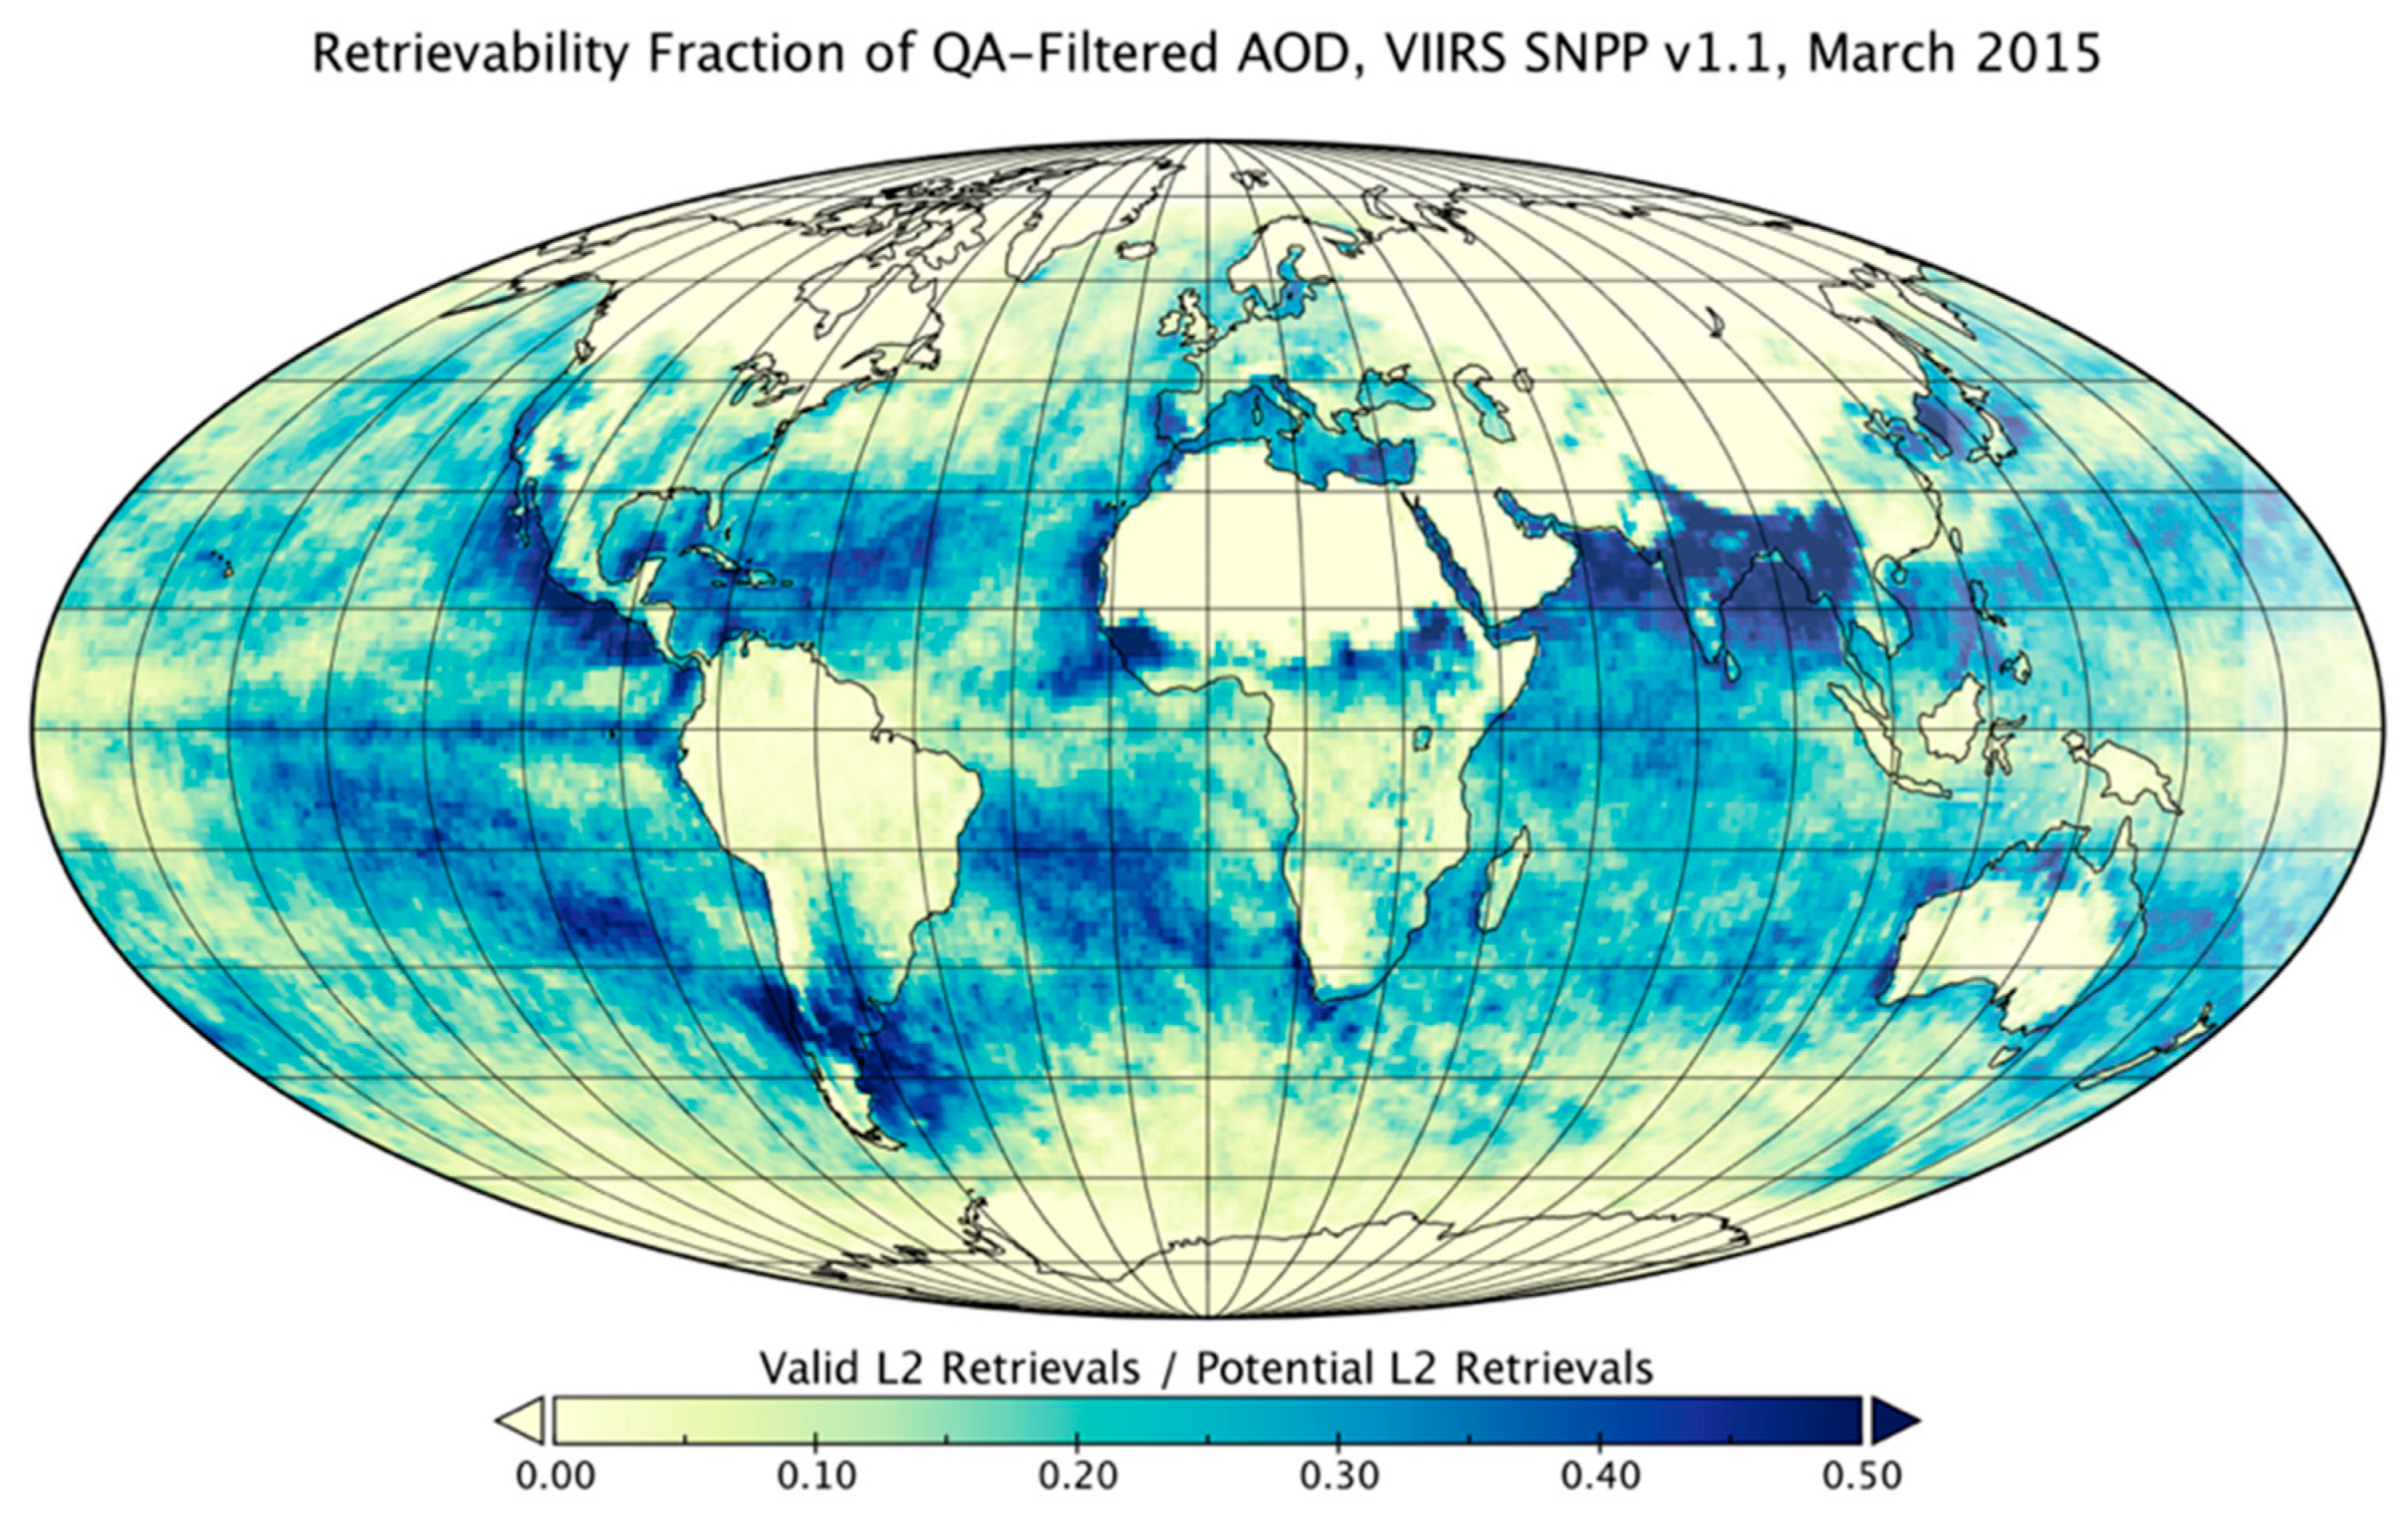
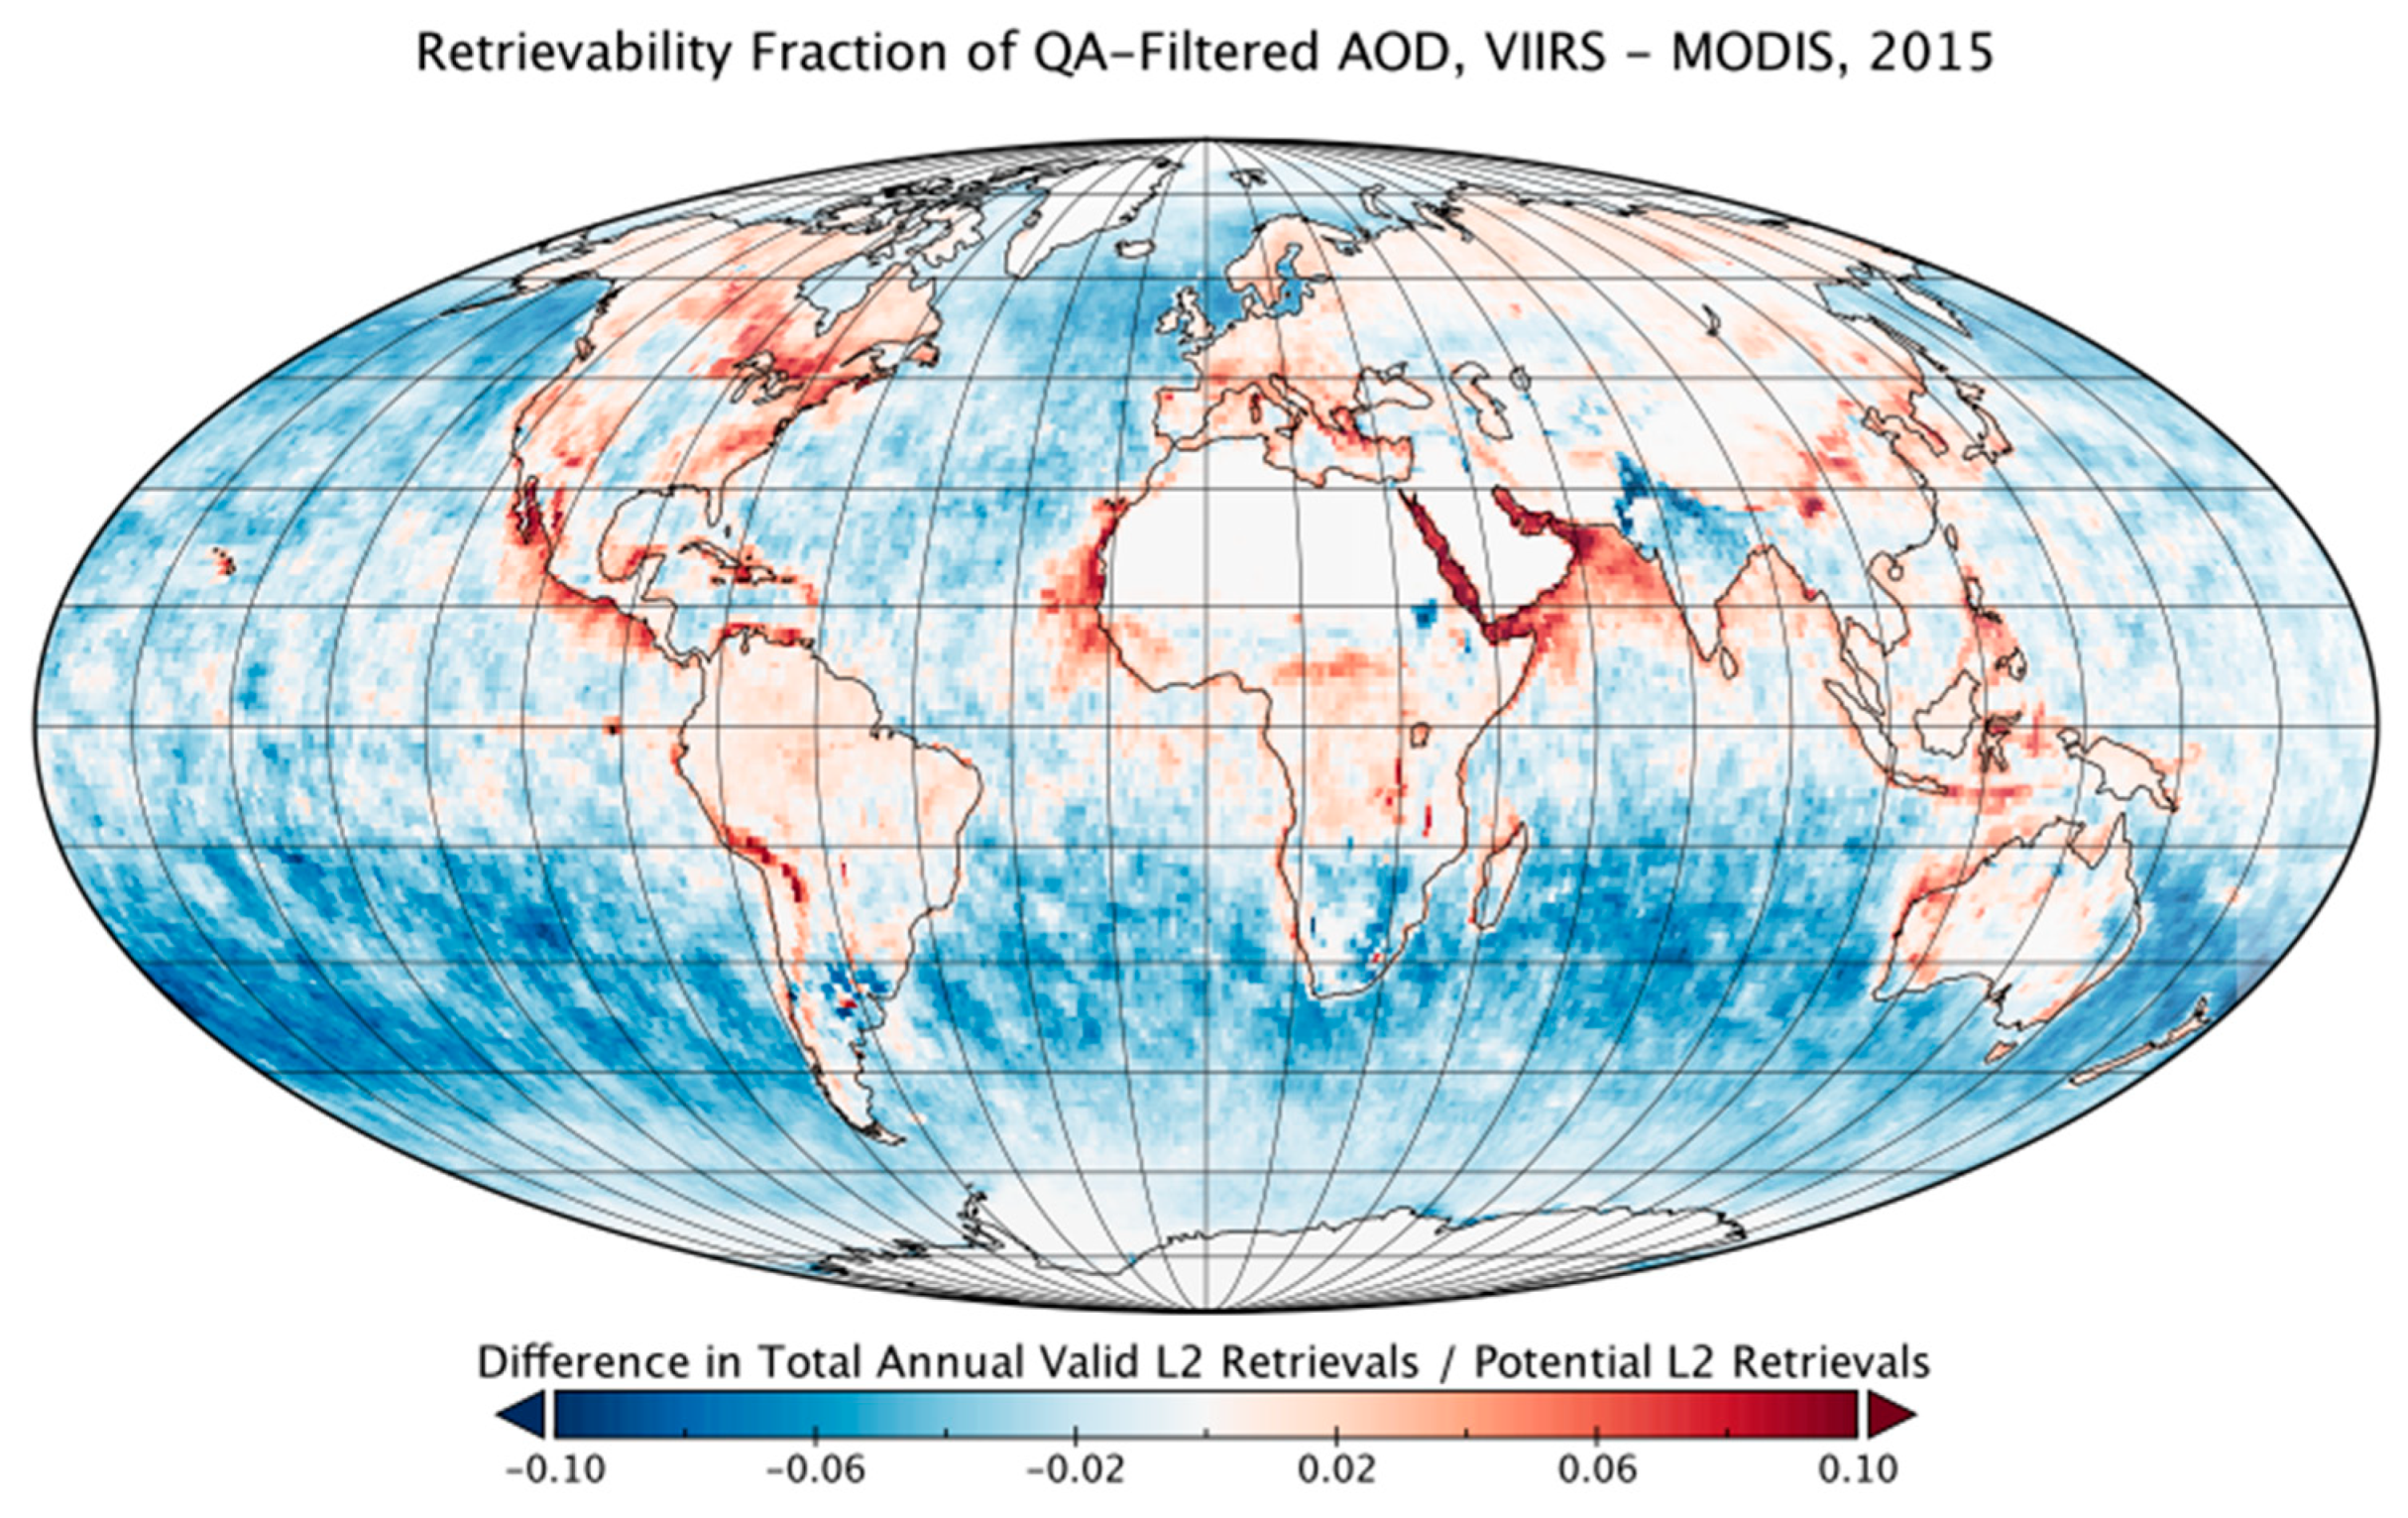
However, another important source of disagreement in cloudy areas is the difference in sampling. Because the Dark Target algorithm does not retrieve AOD for overcast clouds or bright surfaces, on average each grid cell of the one-degree level 3 product is only about 20 percent full of valid retrievals, i.e., about 80 percent of the level 2 retrieval boxes that fall within any given latitude–longitude pair are null data because the level 1b reflectances were unsuitable for retrieval there. Because the average cloud cover and surface brightness vary by location and over time, so does the fraction of MODIS or VIIRS pixels where the 0.55 μm AOD cannot be retrieved (
Figure 8). The retrievability, defined here as the number of level 2 retrievals with valid AOD values divided by the total number of possible level 2 retrievals in the instrument swath, affects the likelihood of collocation. Where the retrieval fraction is low for one or both sensors, the average gridded AOD is based on fewer level 2 retrievals, which makes it more likely that the few successful retrievals cannot be matched with a retrieval from the other sensor at the same place and time; these grid cells fall into the non-collocated sets shown in
Figure 5. Furthermore, collocated grid cells based on relatively few level 2 observations may not have observed exactly the same scene.
Where the retrievability approaches 1.0 for both sensors, optimal retrieval conditions are common (i.e., clear conditions over an appropriately dark surface, away from deserts or ocean glint) and there are more collocated retrievals between the two sensors. Factors other than inconsistent sampling, such as differences in calibration or land surface allocation, are responsible for any systematic differences under optimal retrieval conditions. Nearly all the negative bias in VIIRS over land in August 2015 is due to the less pronounced shift toward higher AODs in non-collocated retrievals as compared to the difference between collocated and non-collocated MODIS grid cells (
Figure 9), especially in the frequency of AOD values greater than one. Over ocean, where the VIIRS–MODIS offset shows less of a seasonal cycle (
Figure 3), the correlation and distribution of the daily grid cells for any single month is not significantly different from the statistics for the full year.
While there was an overall negative offset between VIIRS and MODIS over land in August (note that it appears mostly in the comparison between non-collocated observations that are counted in
Figure 3, but may be absent from
Figure 7), in March 2015 the offset shown in
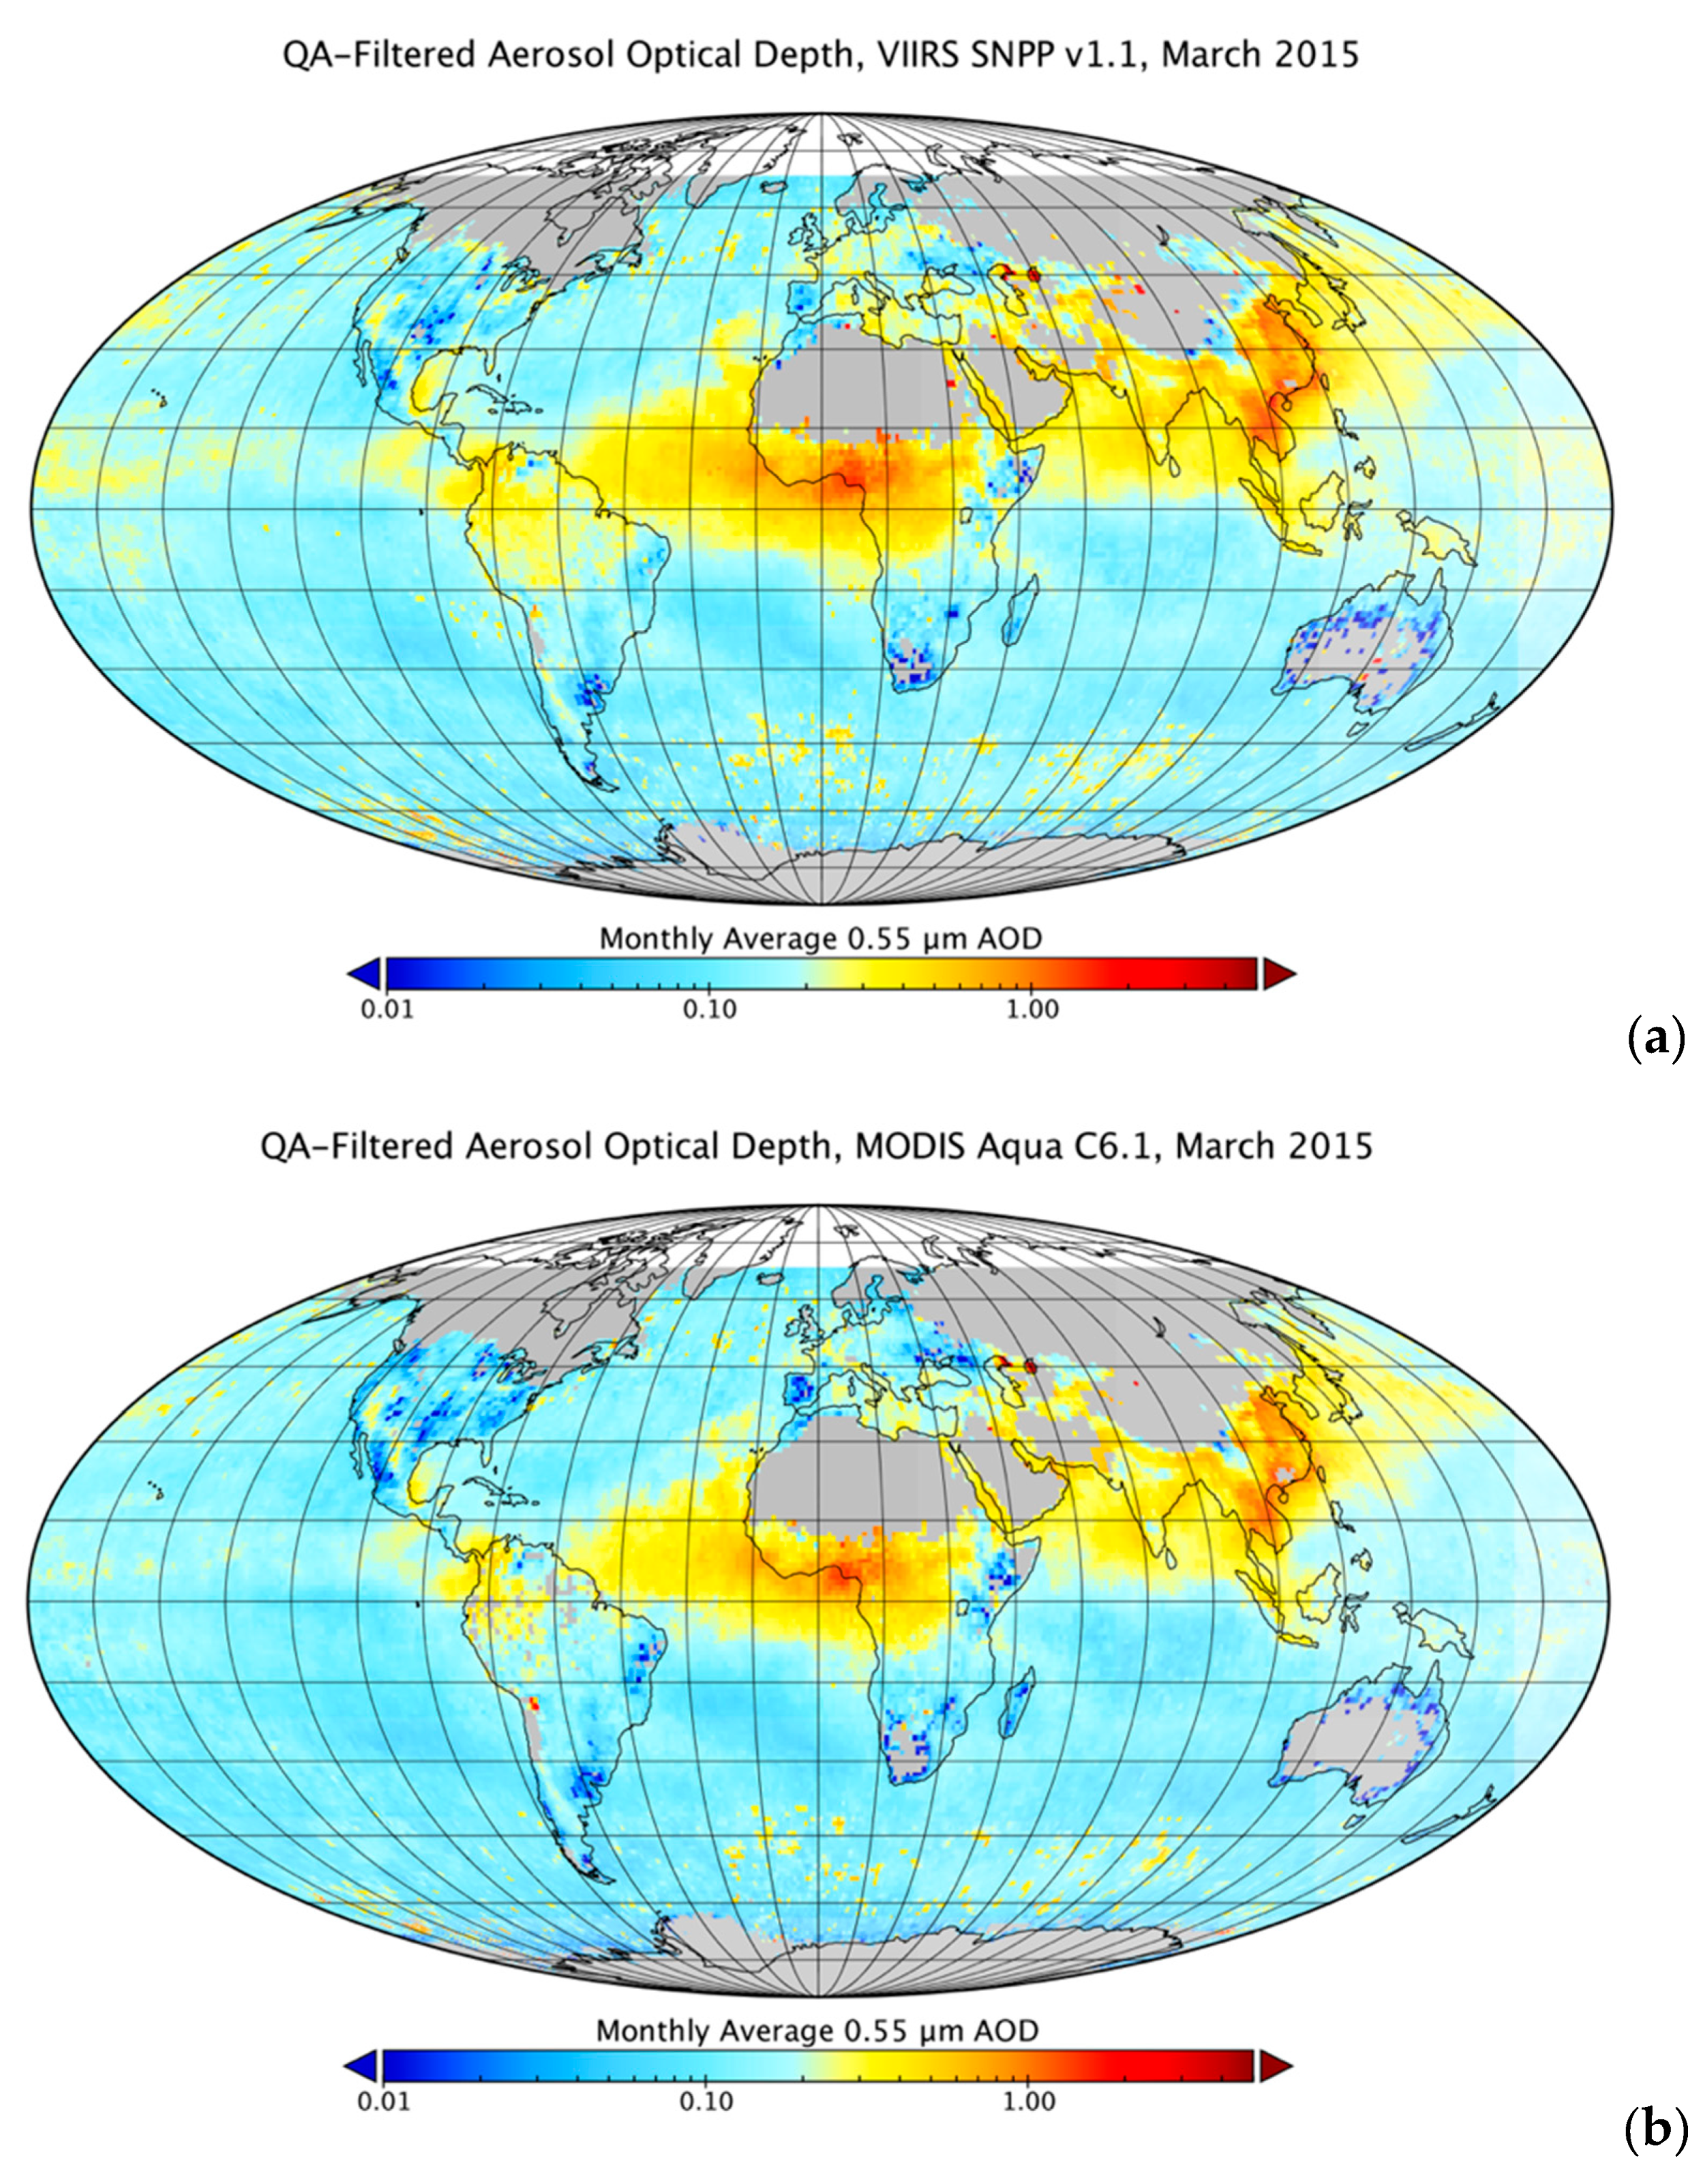
Figure 3 is greater than zero. AOD values are higher over Southeast Asia in March than they are in August, but the high aerosol loading over the high-latitude Northern Hemisphere and over sub-Saharan Africa is either not retrieved due to seasonal snow cover or has not yet begun (
Figure 10), and these were the regions that drove the negative offset in August.
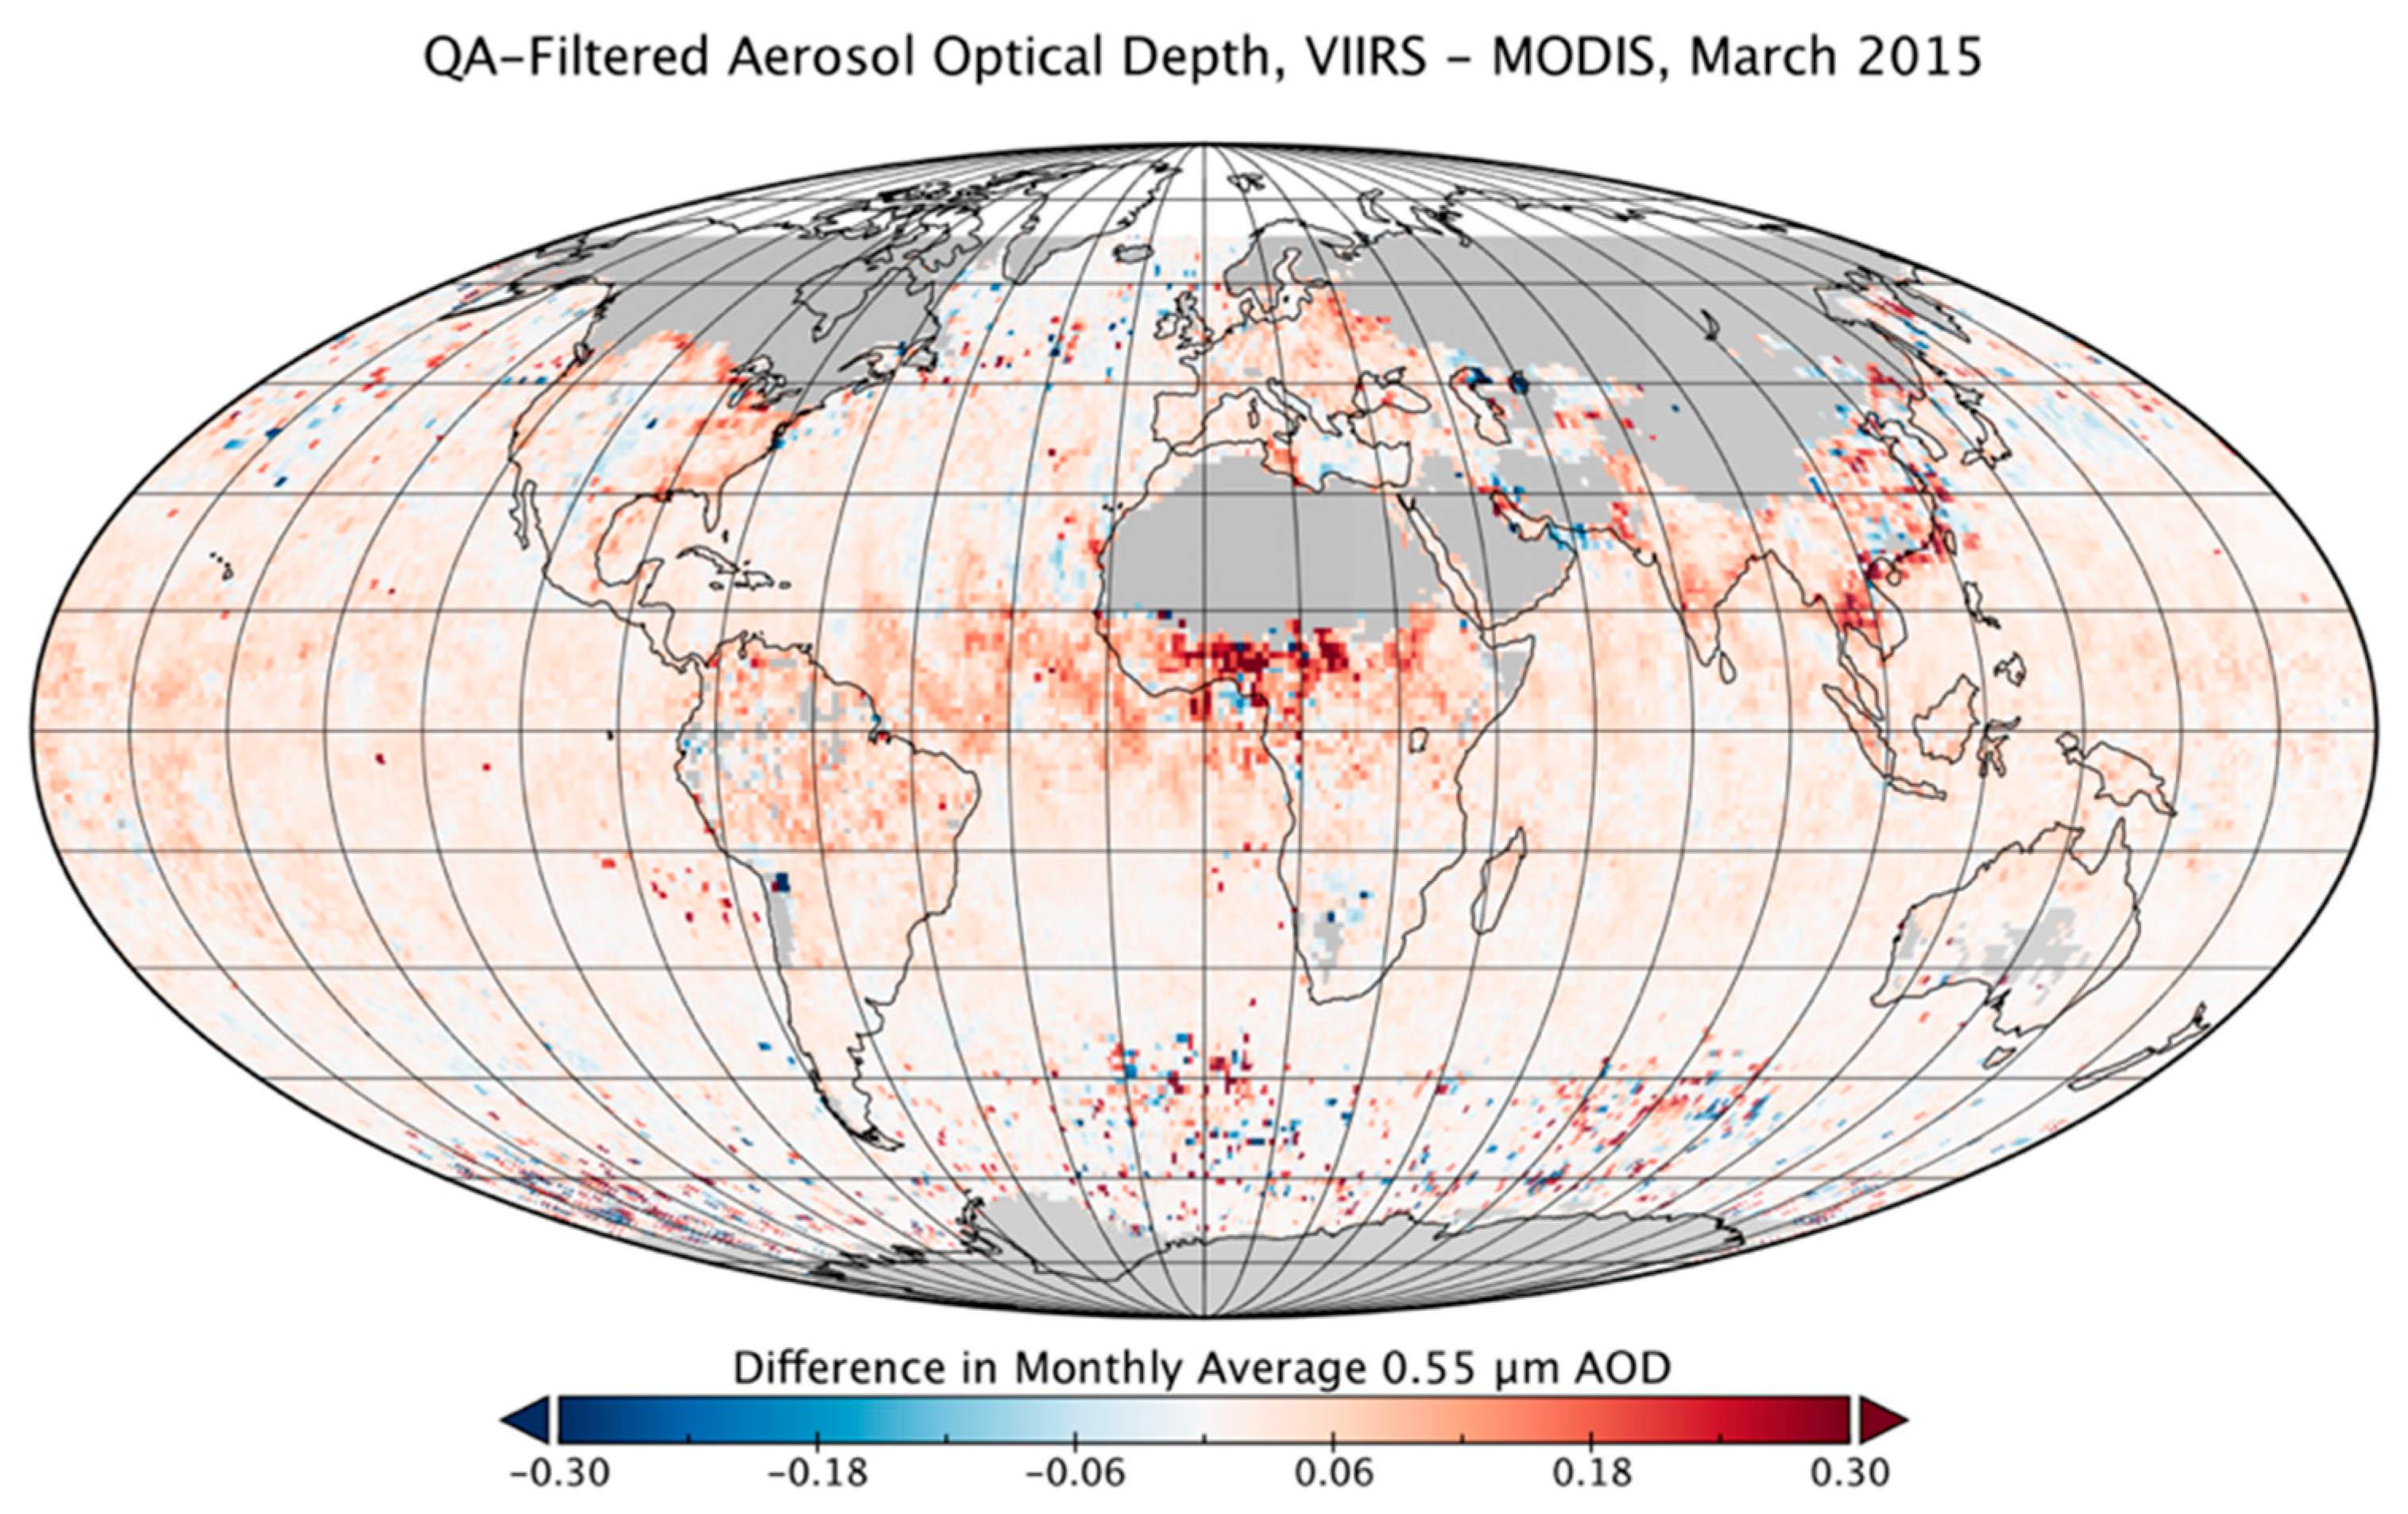
The difference map still shows the calibration-driven positive bias over ocean, but there are fewer large sources of regional disagreement (
Figure 11). As before, the areas of regional disagreement that do exist are usually also areas with low retrievability (
Figure 12), where there may not be much overlap between MODIS and VIIRS in the days that make up the monthly average.
Again, the comparison between daily average grid cells over ocean in March looks much the same as the annual average. Over land, however, the negative bias in the non-collocated VIIRS retrievals seen in August is replaced by a small positive bias in March similar to the year-round bias over ocean (
Figure 13). The size of the sample over land is much smaller than in August because of snow cover over much of the temperate and high-latitude northern hemisphere, which combines with desert regions to make much of the land surface too bright for Dark Target retrieval.
6. Conclusions
Because no single satellite instrument is capable of collecting AOD observations for the decades-long periods that climate studies require, we need to combine records from multiple spacecraft and even multiple sensors that have overlapping lifespans. MODIS and VIIRS are different instruments with similar enough capabilities that it makes sense to link their records, but the task of minimizing discontinuities in the climate record depends on many factors. The VIIRS DT retrieval is able to continue the existing MODIS DT record because it is as close to the original DT algorithm as the newer sensor allows, meaning that the only changes made to the algorithm are those that the differences between the MODIS and VIIRS instruments make necessary. At this point, we believe we have considered many of the differences between the two instruments, and are beginning to produce a routine DT product from VIIRS on Suomi-NPP. When evaluating the results, we have compared the VIIRS level 2 (AERDT_L2) products to AERONET, while deriving prototype L3 products to compare to those from MODIS Aqua (MYD08). The causes of disagreement are likely the same for both comparisons. We focused on the entire year 2015, as well as on two separate months (March and August). These are our findings separated into categories we have used throughout this paper.
6.1. Aerosol Products over Ocean
Over ocean, as compared to AERONET, the VIIRS level 2 product (AERDT_L2_VIIRS_SNPP) shows less overall skill than does MODIS Aqua (MYD04_L2). The percentage within EE is 72.34% compared to 84.19% for MODIS. Also, the positive bias between satellite sensor and AERONET is higher for VIIRS than for MODIS, 0.049 instead of 0.026. Even though it is less accurate, VIIRS validation statistics show sufficient skill to recommend the use of AERDT_L2_VIIRS_SNPP over ocean.
Determining how well the VIIRS product will continue the heritage MODIS product into the future at climate-relevant scales is equally important as establishing the product’s accuracy by comparing with AERONET. To do this we analyze the global level 3-like daily gridded averages, where for all of 2015 there were 6.6 × 10⁶ grid cells representing the union of retrieved 1° × 1° grids. We note:
There is an overall small positive bias in AOD over the oceans, which is overlaid by stronger regional biases in specific locations.
These locations correspond to areas with high cloud cover and consequently, very low AOD retrievability.
Furthermore, when VIIRS and MODIS are collocated (both instruments report a value in the same 1° × 1° grid cell at the same time), the reported AOD values are nearly identical between MODIS and VIIRS. Collocations represented 52% of the 6.6 × 10⁶ data base.
The remaining cases in which one sensor retrieves AOD but the other does not are skewed higher than the distribution of collocated AODs, but the 35% of cases in which VIIRS retrieves but MODIS does not are skewed higher than the 13% of cases in which MODIS retrieves but VIIRS does not.
Therefore, VIIRS retrieves overall higher AOD than MODIS, not because MODIS AOD is lower when MODIS retrieves alone, but because there are so many more situations where VIIRS retrieves without MODIS.
The relative distributions and percentage of collocated grid cells for the month of March is similar to the annual total.
For August, the relative percentages shift, and the difference between the non-collocated AOD distributions from each sensor are more similar to one another.
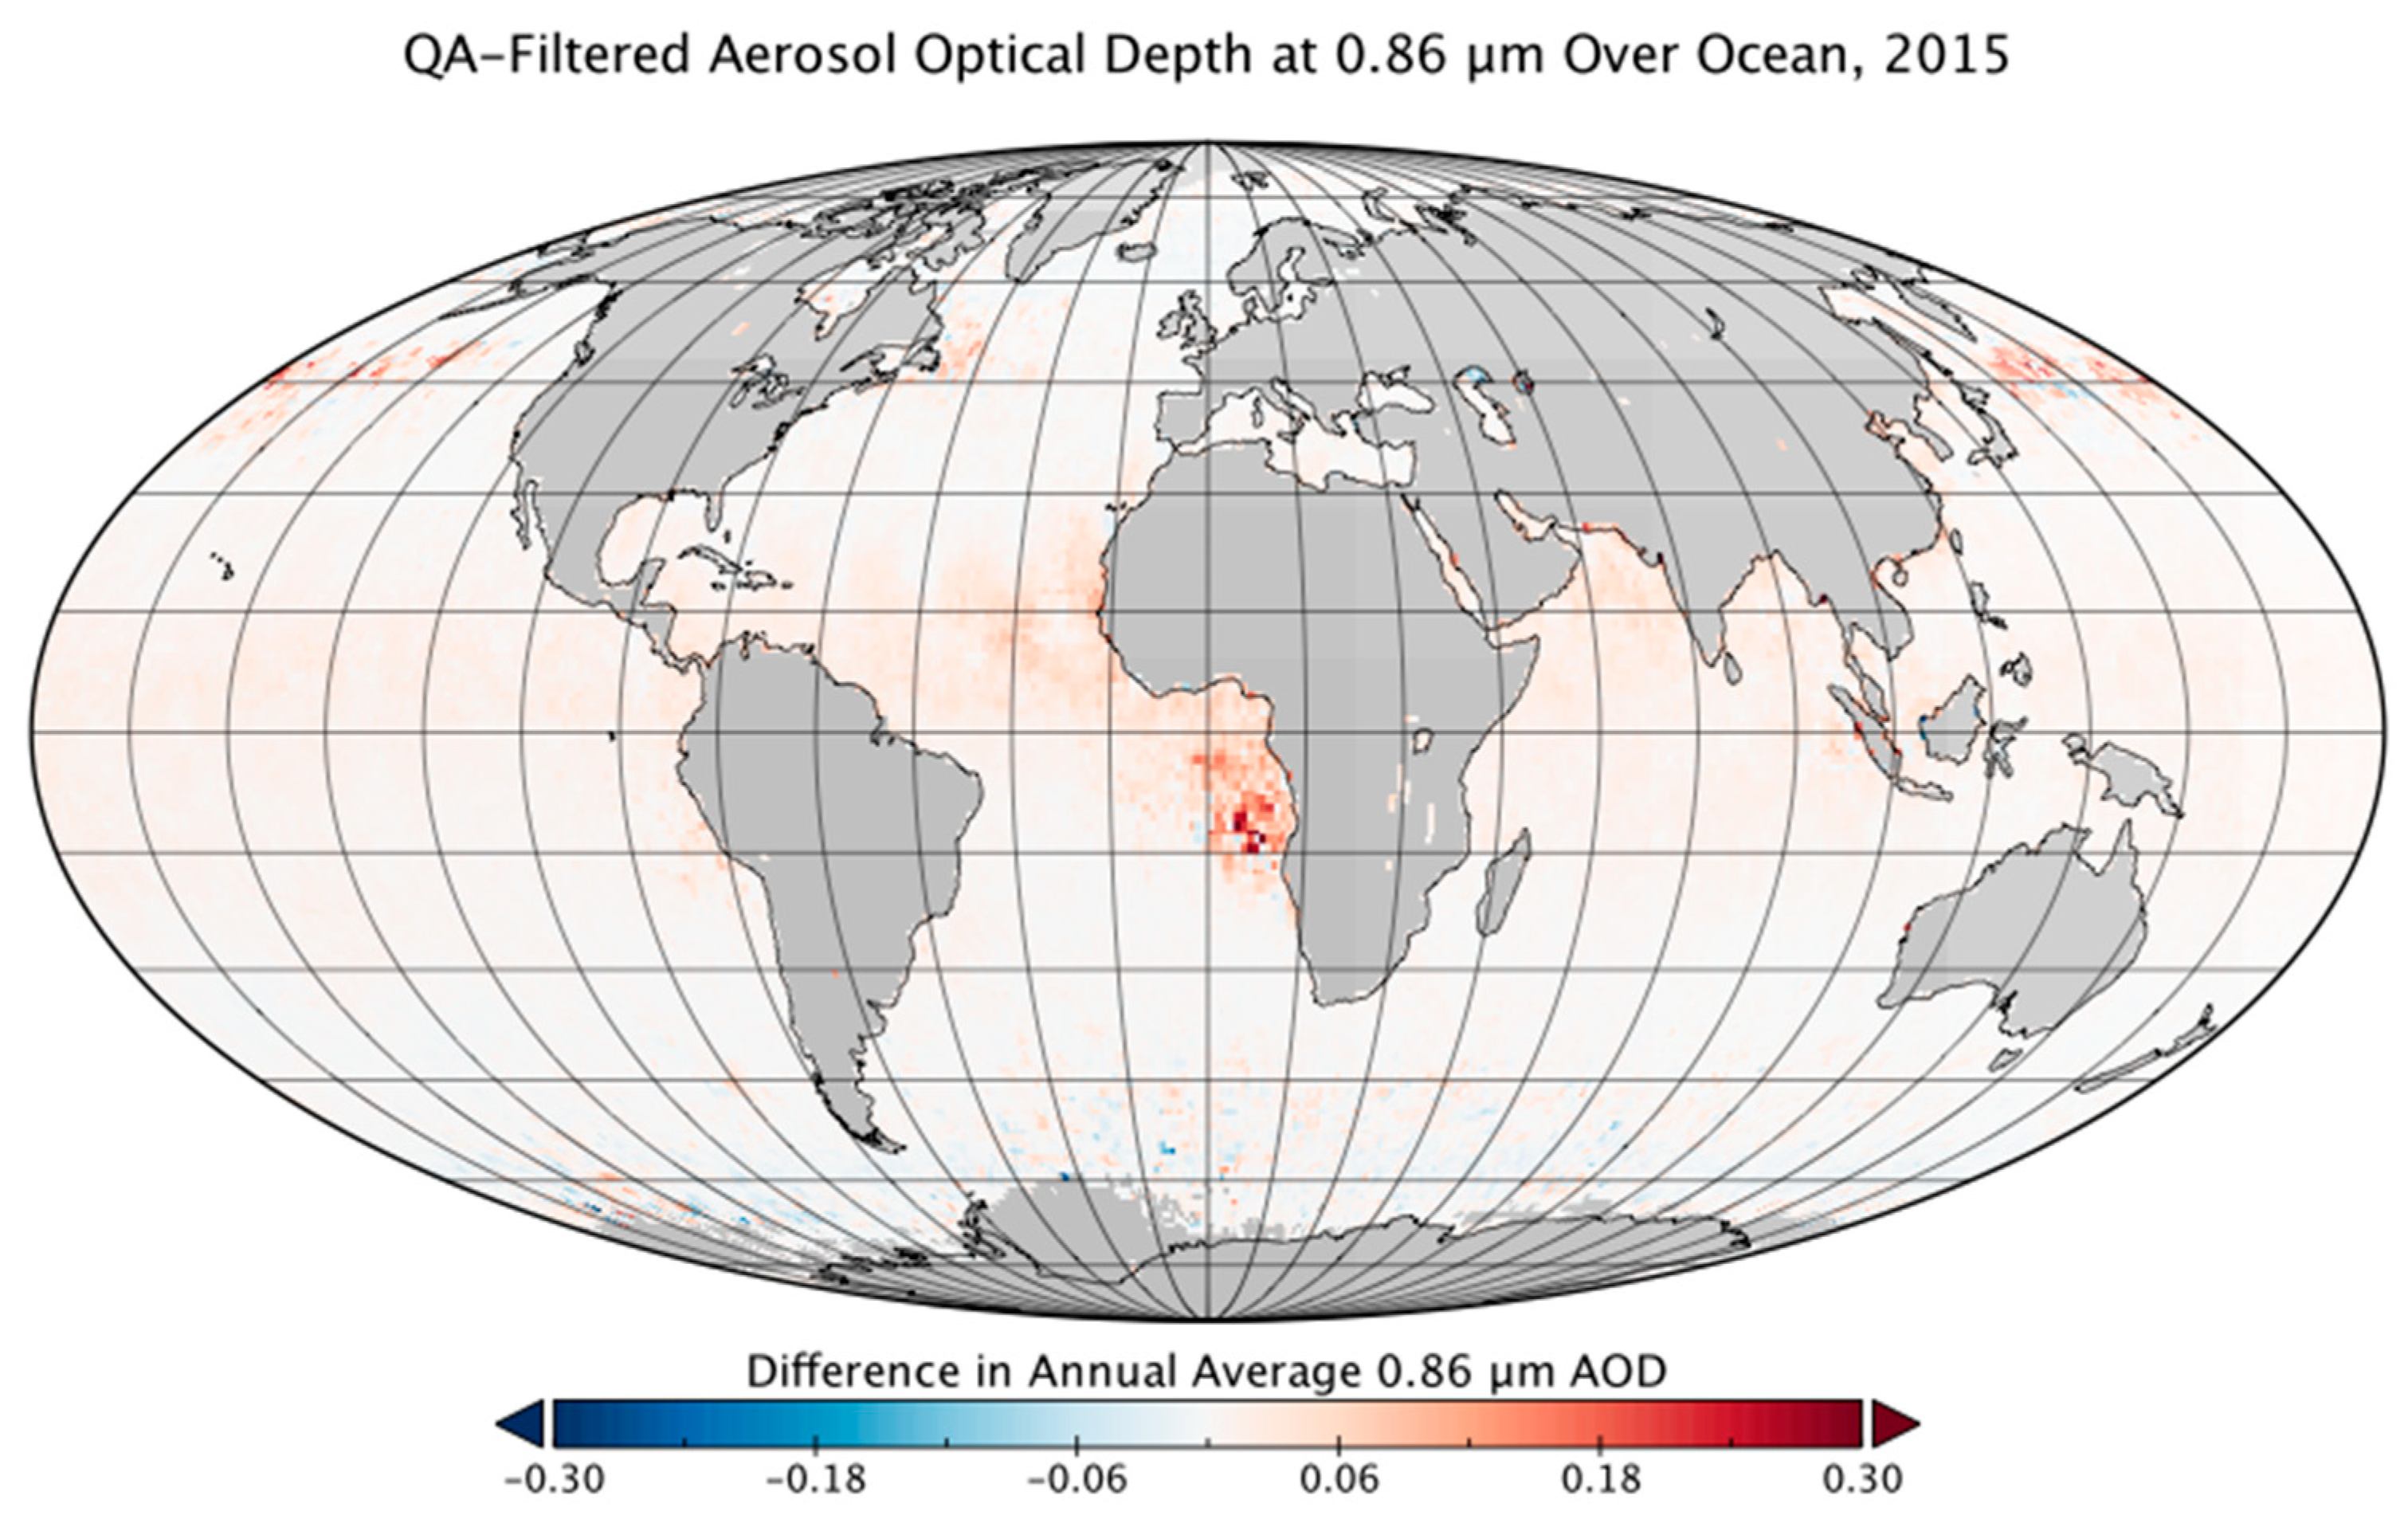
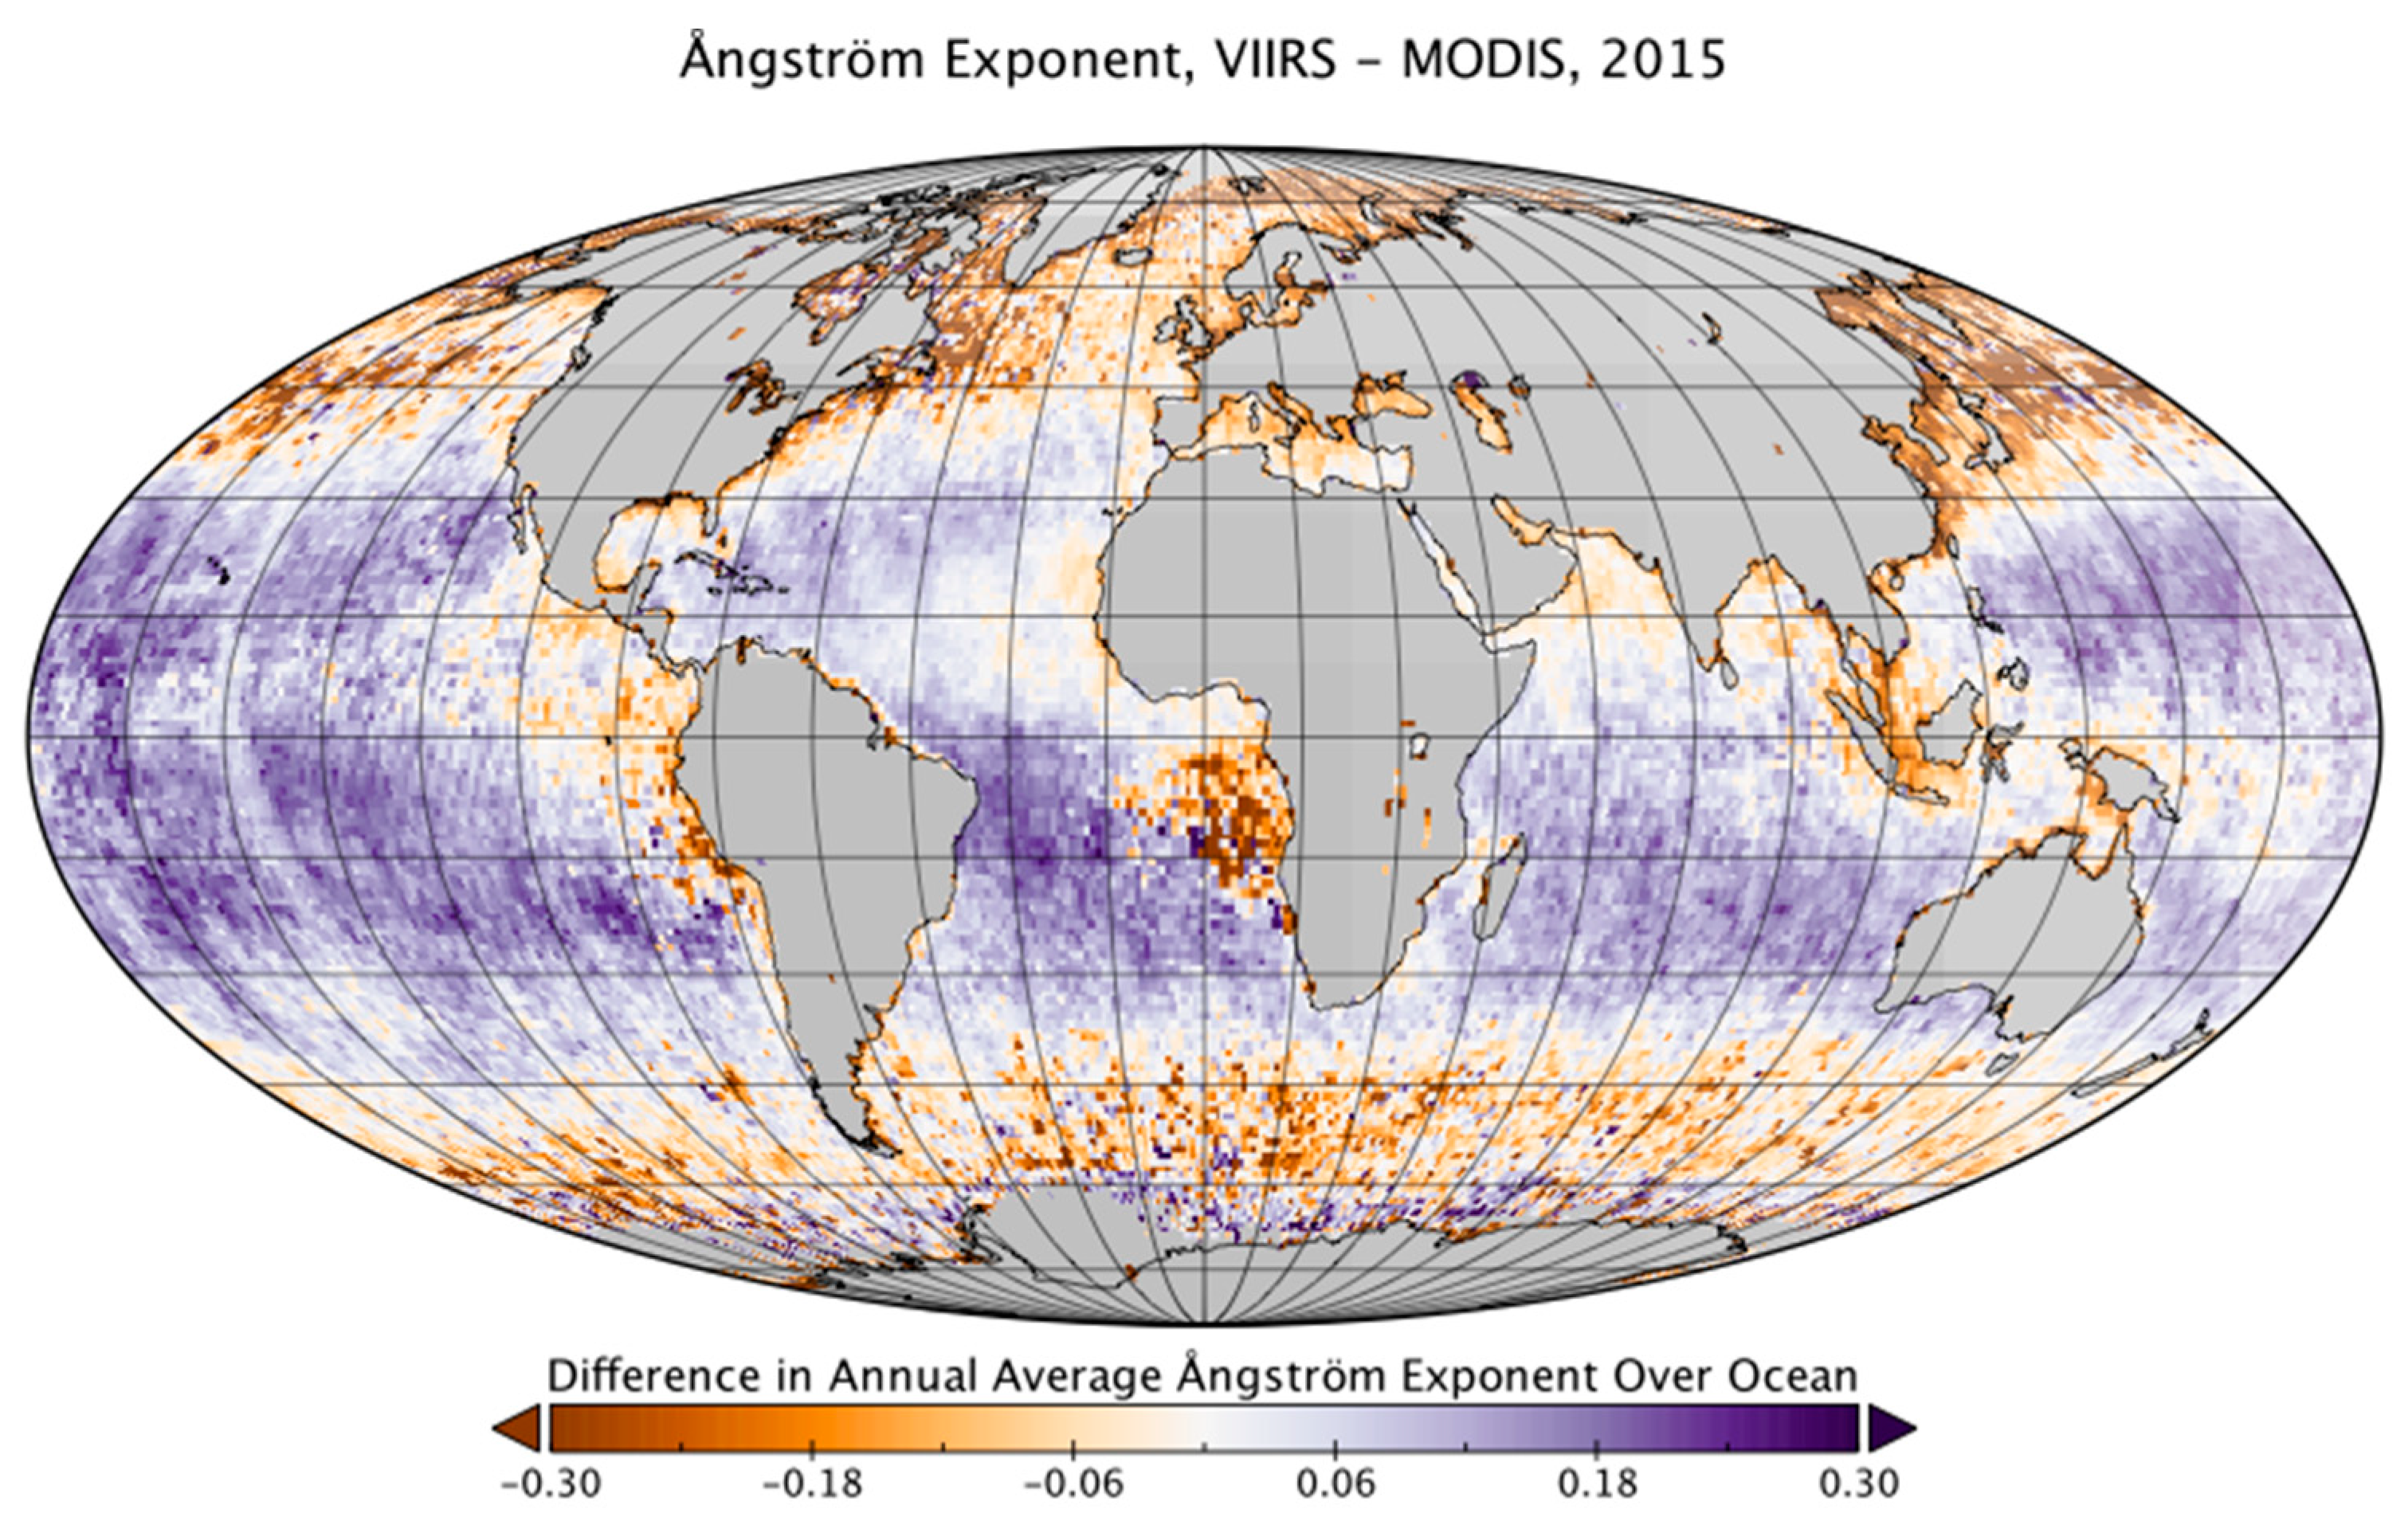
The monthly and annual gridded averages show an overall high bias of the VIIRS product over ocean, averaging +0.006 over the total length of the VIIRS mission, which is more pronounced in August than in March. A small but widespread positive bias is overlaid by regional biases associated with cloud cover and consequently, very low AOD retrievability. This bias is larger at 0.55 μm than at 0.86 μm, which unfortunately means that the MODIS–VIIRS offset is even more striking in the Ångström exponent product than in AOD.
6.2. AOD over Land
Over land, as compared to AERONET, the percentage within EE is similar for both sensors: 70.32% for VIIRS and 74.41% for MODIS. The positive bias between VIIRS and AERONET is 0.038 for VIIRS but only 0.008 for MODIS. As over ocean, the VIIRS DT product is less accurate over land than its MODIS heritage, but still sufficiently skilled to recommend use.
To determine how well the VIIRS product matches the old MODIS product we again turn to level 3-like global statistics.
Among the level 3-like daily gridded averages:
Unlike ocean, over land there is no consistent overall bias, and differences vary much more significantly both seasonally and regionally.
When collocated (47% of grid cells) the reported AOD values for the annual total are even more similar over land than they are over ocean.
The remaining cases in which one sensor retrieves AOD but the other does not are again both skewed higher than the distribution of collocated AODs for either sensor. This time, annually, in the 51% of cases in which VIIRS retrieves but MODIS does not are skewed nearly the same amount as the 1.8% in which MODIS retrieves but VIIRS does not.
In March, the skew of the non-collocated AOD distribution is higher for VIIRS than for MODIS.
In August, however, the skew is higher for MODIS than for VIIRS.
The monthly and annual gridded averages show that the bias of the VIIRS product relative to MODIS averages at about −0.002, but varies between positive and negative bias that fluctuate seasonally. The largest negative amplitude is in August, while positive offsets occur in March. On the global difference map, the land surface has mixed positive and negative bias. The bias is regionally dependent, and appears to be driven by areas that experience high aerosol loading during seasonal events.
6.3. Causes of Offsets
The persistent offset between the Aqua and Terra twin MODIS instruments, described and analyzed in Levy et al. [
12], demonstrates the difficulty in creating a continuous CDR from multiple instruments. In perspective, when comparing to MODIS Aqua, the bias for VIIRS is smaller than it is for MODIS Terra. The small average bias and the lack of a trend over time between MODIS Aqua and VIIRS SNPP is a very encouraging result.
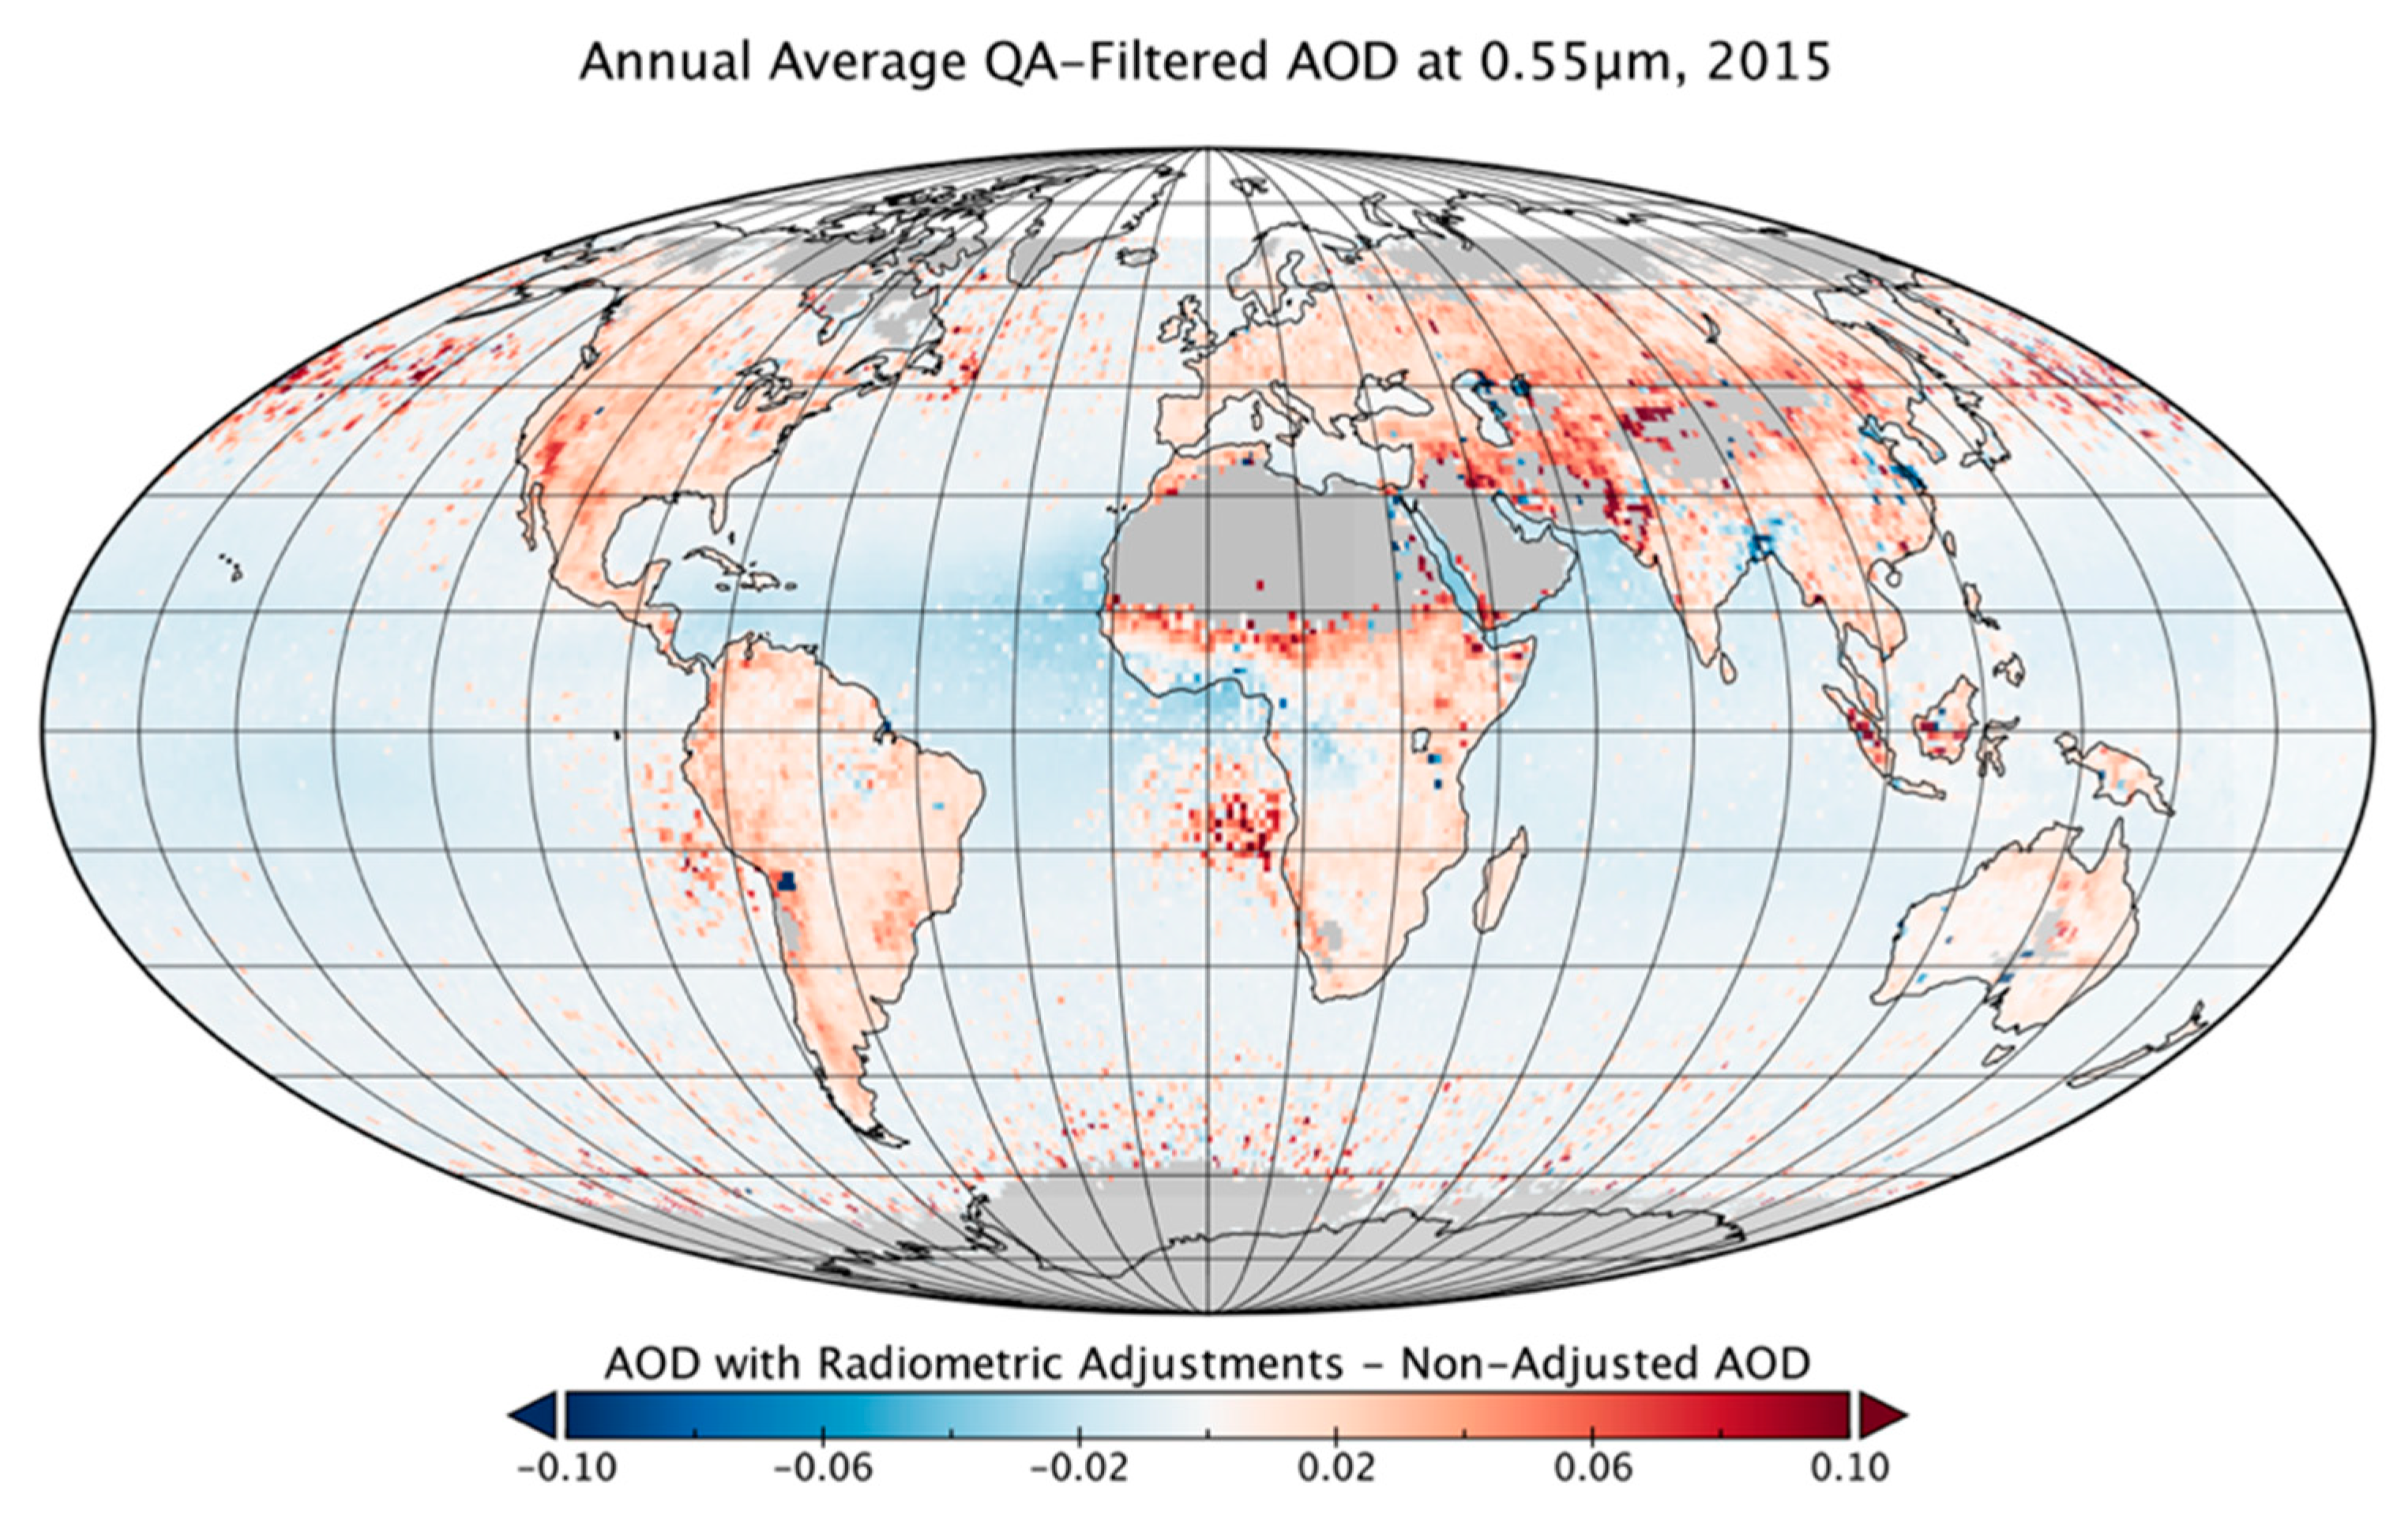
The biases between the instruments are not globally or temporally uniform. Over ocean, we see a modest positive bias almost everywhere with an intensification of that bias in certain specific locations. Over land, the situation is more varied, and the seasonal cycle has a larger impact on the offset. By applying a calibration correction introduced by Sayer et al. [
54] to VIIRS SNPP spectral radiances, we can mitigate some of the modest bias over ocean relative to MODIS Aqua. However, the calibration correction does not eliminate the bias, and in some areas only makes the bias worse. Furthermore, this calibration adjustment is a one-time empirical fix that may not persist as both sensors evolve and degrade over time. We conclude that the operational aerosol algorithm should continue to ingest operational level 1b radiances, and that any calibration adjustments be applied at level 1, not within the level 2 aerosol code.
Because the biases cannot be entirely explained by calibration, we look for other reasons why VIIRS DT aerosol products do not match the MODIS ones more consistently. We find that the bias nearly disappears when VIIRS and MODIS daily mean one-degree gridded AOD are collocated, meaning that on a given day a one-degree grid cell contains a value for VIIRS-retrieved AOD and also a value for a MODIS-retrieved AOD. Most of the bias is introduced into the monthly or annual mean statistics for that grid cell when on a specific day MODIS has a value for AOD, but VIIRS does not, or vice-versa. The distribution of non-collocated AOD values differs from the distribution of collocated values; it is always skewed toward slightly higher AOD, but whether MODIS or VIIRS sees the greater difference changes seasonally over land.
What causes one sensor to produce a retrieval on a given day in a specific grid square and the other sensor not?
Glint over ocean may appear in different parts of the swath because the two sensors are flying different orbits.
VIIRS has a much wider swath width than for MODIS, allowing for greater daily spatial coverage than MODIS and more aerosol retrievals.
VIIRS pixels do not expand as much as MODIS pixels at swath edges, allowing for more possible retrievals from VIIRS over the same surface area.
Cloud masks are slightly different, and are not yet vetted as well for VIIRS.
Both the native level 1b pixel resolution and the resolution of the level 2 aerosol retrieval differ between MODIS and VIIRS, influencing the fraction of the scene that is available for retrieval after masking.
All of these sampling factors play a role in creating the differences between global and regionally distributed mean statistics for VIIRS and MODIS DT aerosol products. Of particular interest are the high biases that develop in cloud fields. There, in the cloudy environment, the situation is marginal for an aerosol retrieval, creating a situation with a high probability that one of the sensor’s retrievals will fail, stranding the other. The retrieval that does succeed will likely produce a higher AOD than in non-cloudy situations, maybe due to cloud contamination, but more likely due to other near-cloud phenomena such as 3D effects or enhancement from hydrated aerosol and dissipating cloud droplets. In constructing a CDR, and continuing a data record from one sensor to the other, sampling differences are as fundamental as calibration differences, and often more significant.
6.4. Future Work
Like other MODIS and VIIRS products, VIIRS Dark Target has future updates planned. The NRT and level 3 gridded products described in
Section 3.5 are part of this plan. Other steps include changes to the main level 2 algorithm:
Improvements for retrieval over urban surfaces and coastal sediments that were added to MODIS Dark Target in C6.1.
High-resolution cloud masking using the VIIRS I-bands at 0.375 km, analogous to existing cloud masking for MODIS at 0.5 km resolution.
Adjusted minimum sampling thresholds of level 1b pixels for retrieval as well as level 2 retrievals for gridded averaging, to compensate for the effects of different product resolutions.
Interpolation of the main AOD retrieval to 554 nm (MODIS green band) rather than 551 nm (VIIRS green band) for consistency with other versions of Dark Target, including retrievals from geostationary satellites.
Investigation into alternative sources of ancillary data, where a reanalysis with higher spatial or temporal resolution may improve the AOD retrieval.
Further investigation into the calibration adjustments discussed in
Section 5.1, alongside other corrections, such as matching swath width, for product users who require seamless continuity with the MODIS Aqua record.
The overall conclusion from this exercise is that the VIIRS Dark Target aerosol product is ready for operations. It is producing an aerosol product that performs as well as would be expected if the retrievals had come from a third MODIS launch instead of a new sensor: offsets and differences in the decision to retrieve given pixels are inevitable, but they are well understood, and VIIRS SNPP is in overall better agreement with MODIS Aqua than MODIS Aqua is with its twin, MODIS Terra. The AOD values from VIIRS SNPP are comparable in agreement with ground truth to the existing product from MODIS Aqua, with well-defined error bars.
Therefore, for most purposes, the VIIRS SNPP version of the Dark Target product is in continuity with the existing MODIS DT record, and it can serve to continue AOD measurements after the end of the MODIS mission. For more specialized uses, where the specific Terra or Aqua record must be continued without introducing artificial trends, an adjusted VIIRS product would be necessary to maintain continuity across the transition. However, there is sufficient overlap with the lifespans of Terra and Aqua to allow for the creation of such an adjusted product. This will be the subject of future study.


