Potential Underestimation of Satellite Fire Radiative Power Retrievals over Gas Flares and Wildland Fires


Abstract
1. Introduction
2. Data and Methods
2.1. VIS- SWIR 2 μm Data
2.2. MIR 4 μm FRP Data
2.3. Methods
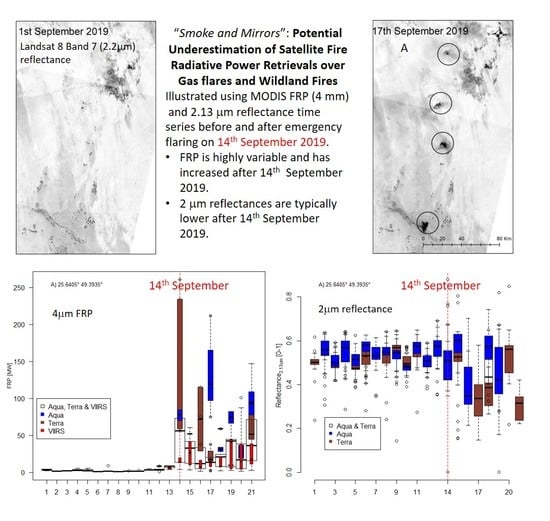
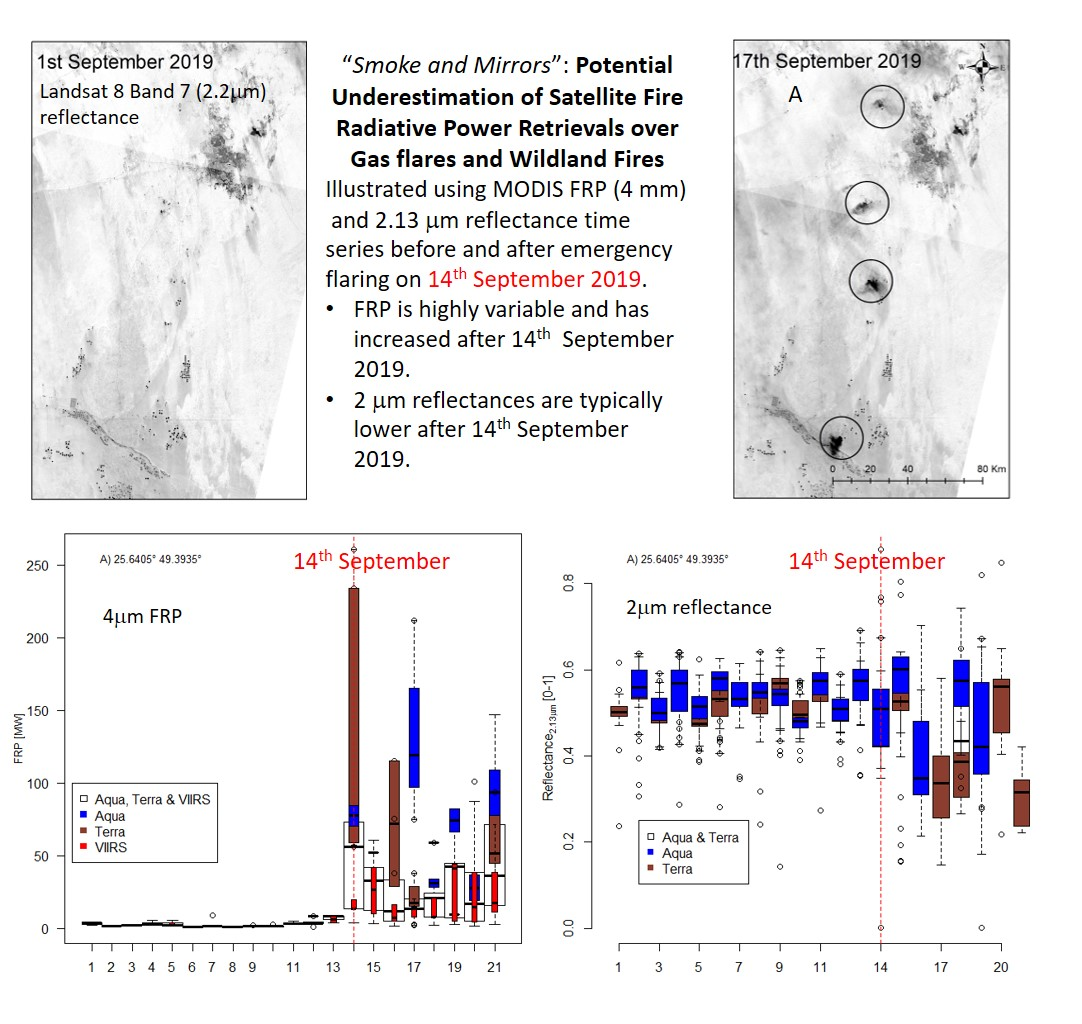
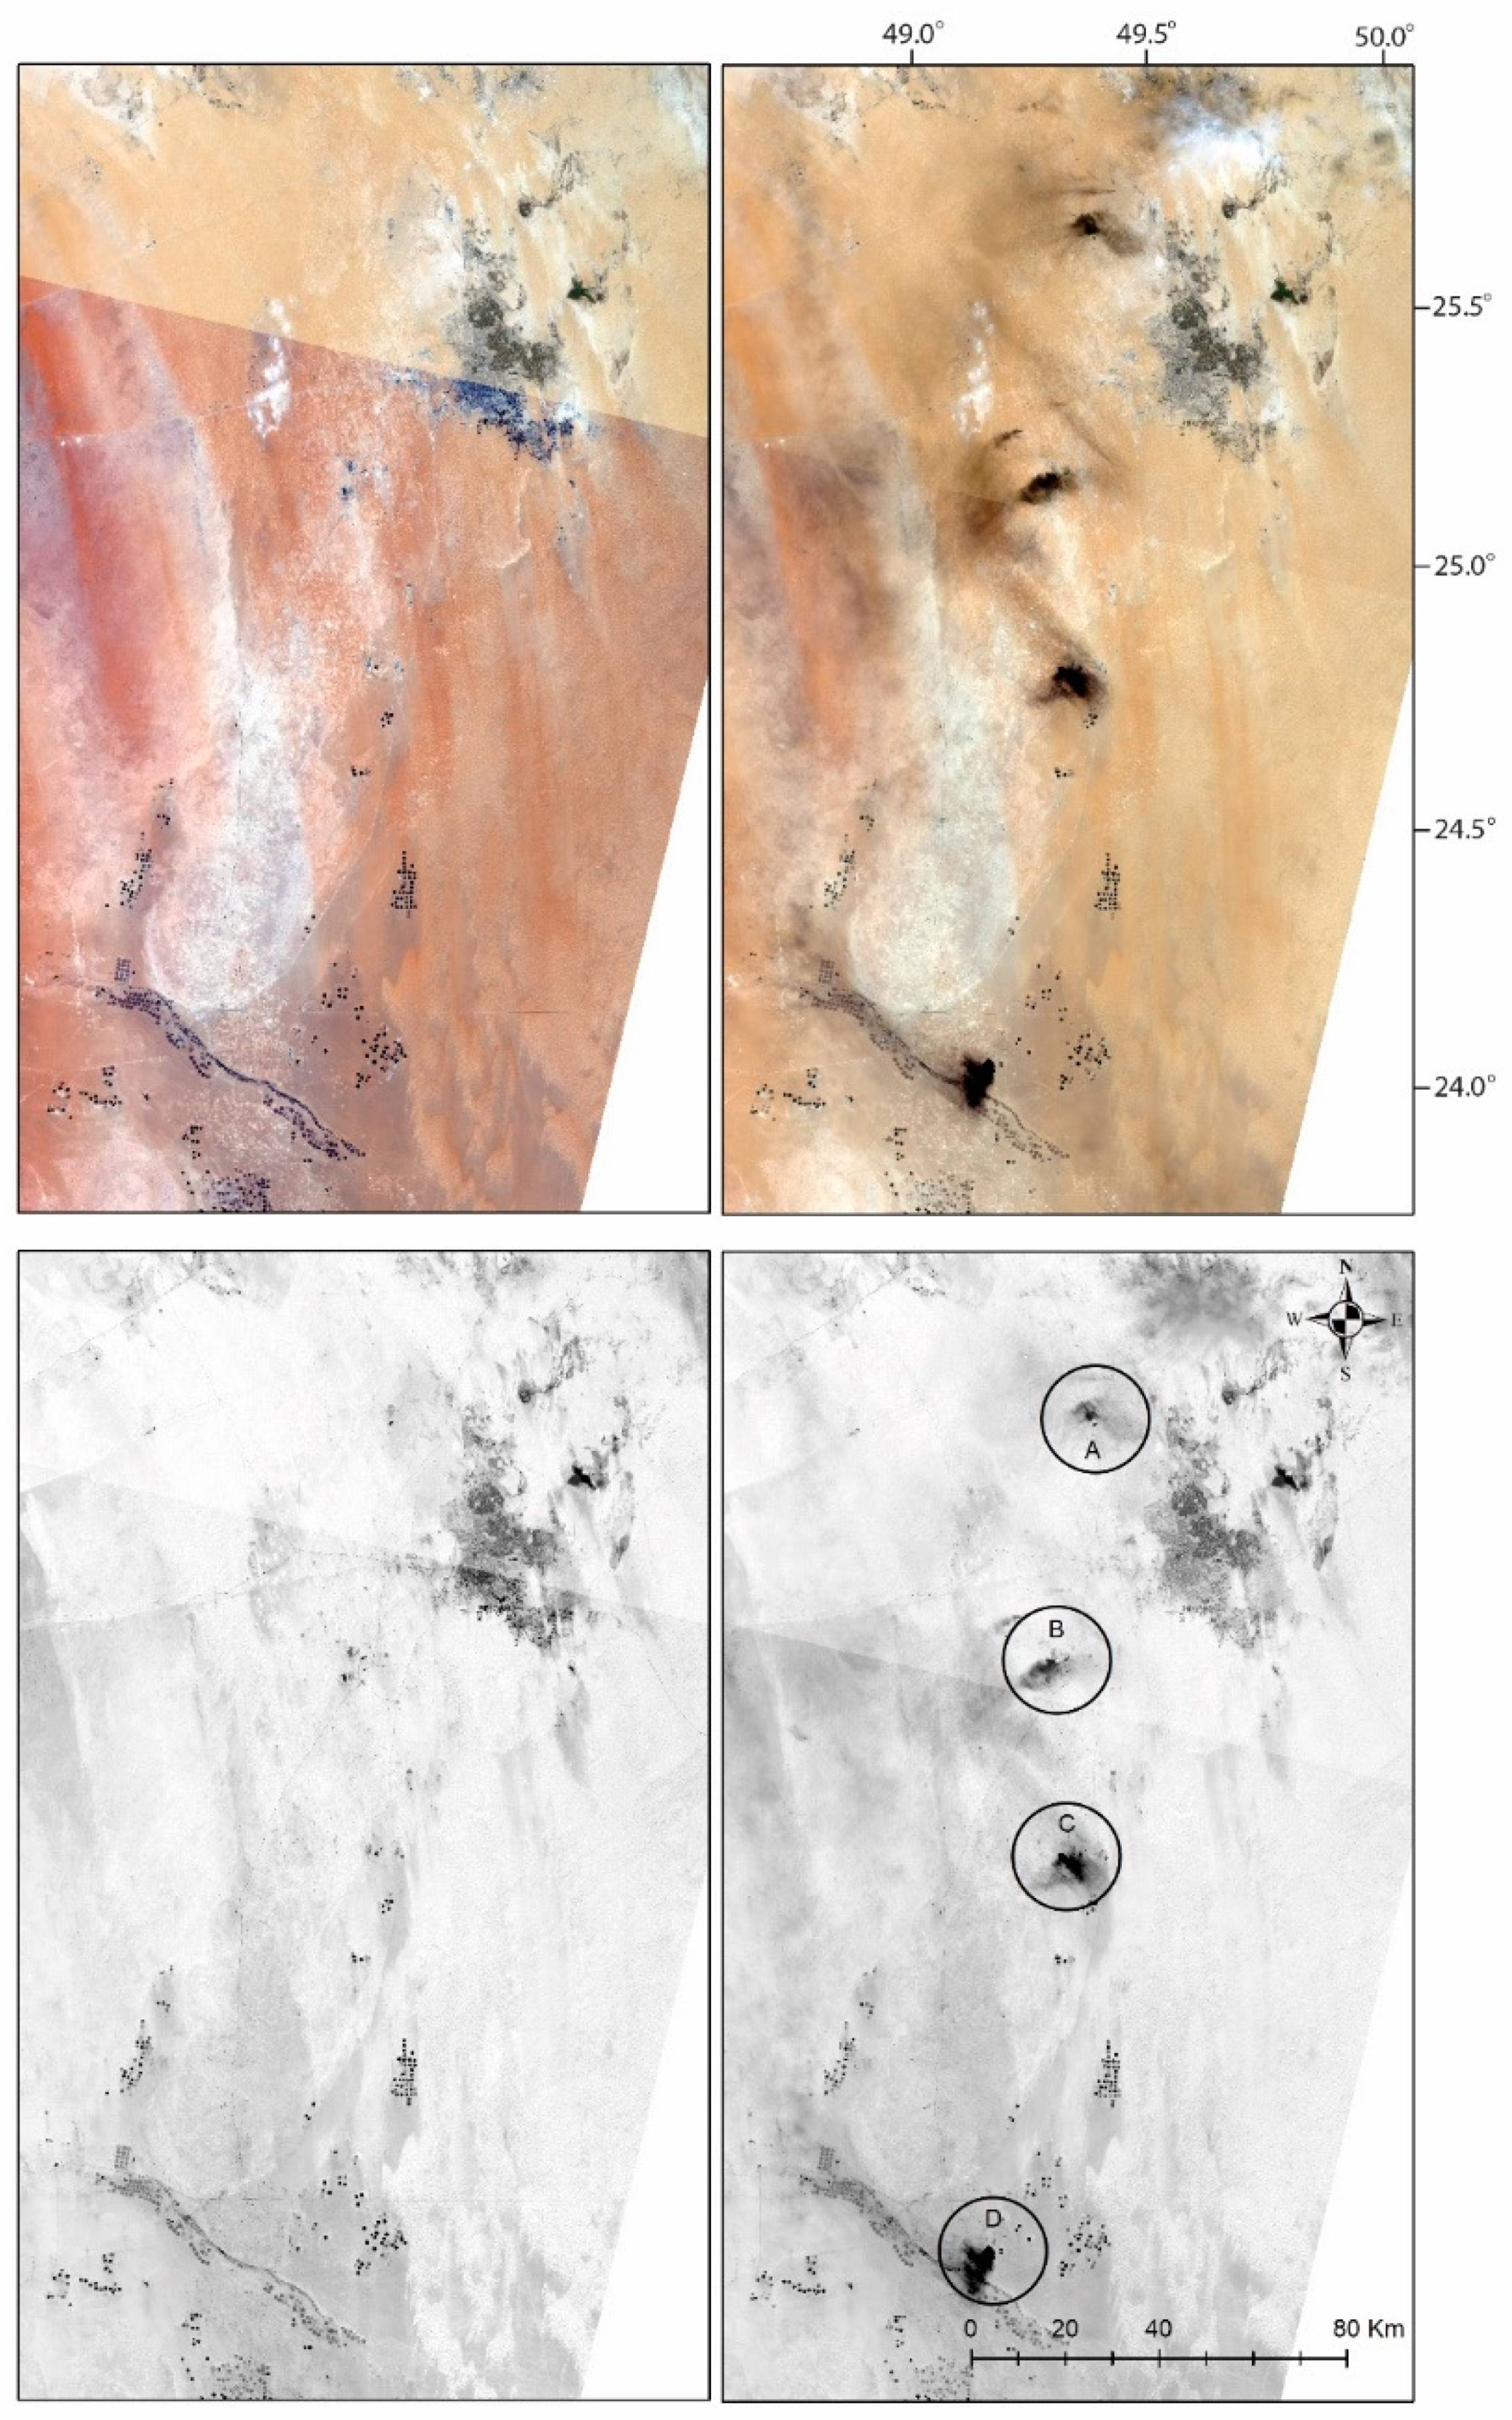
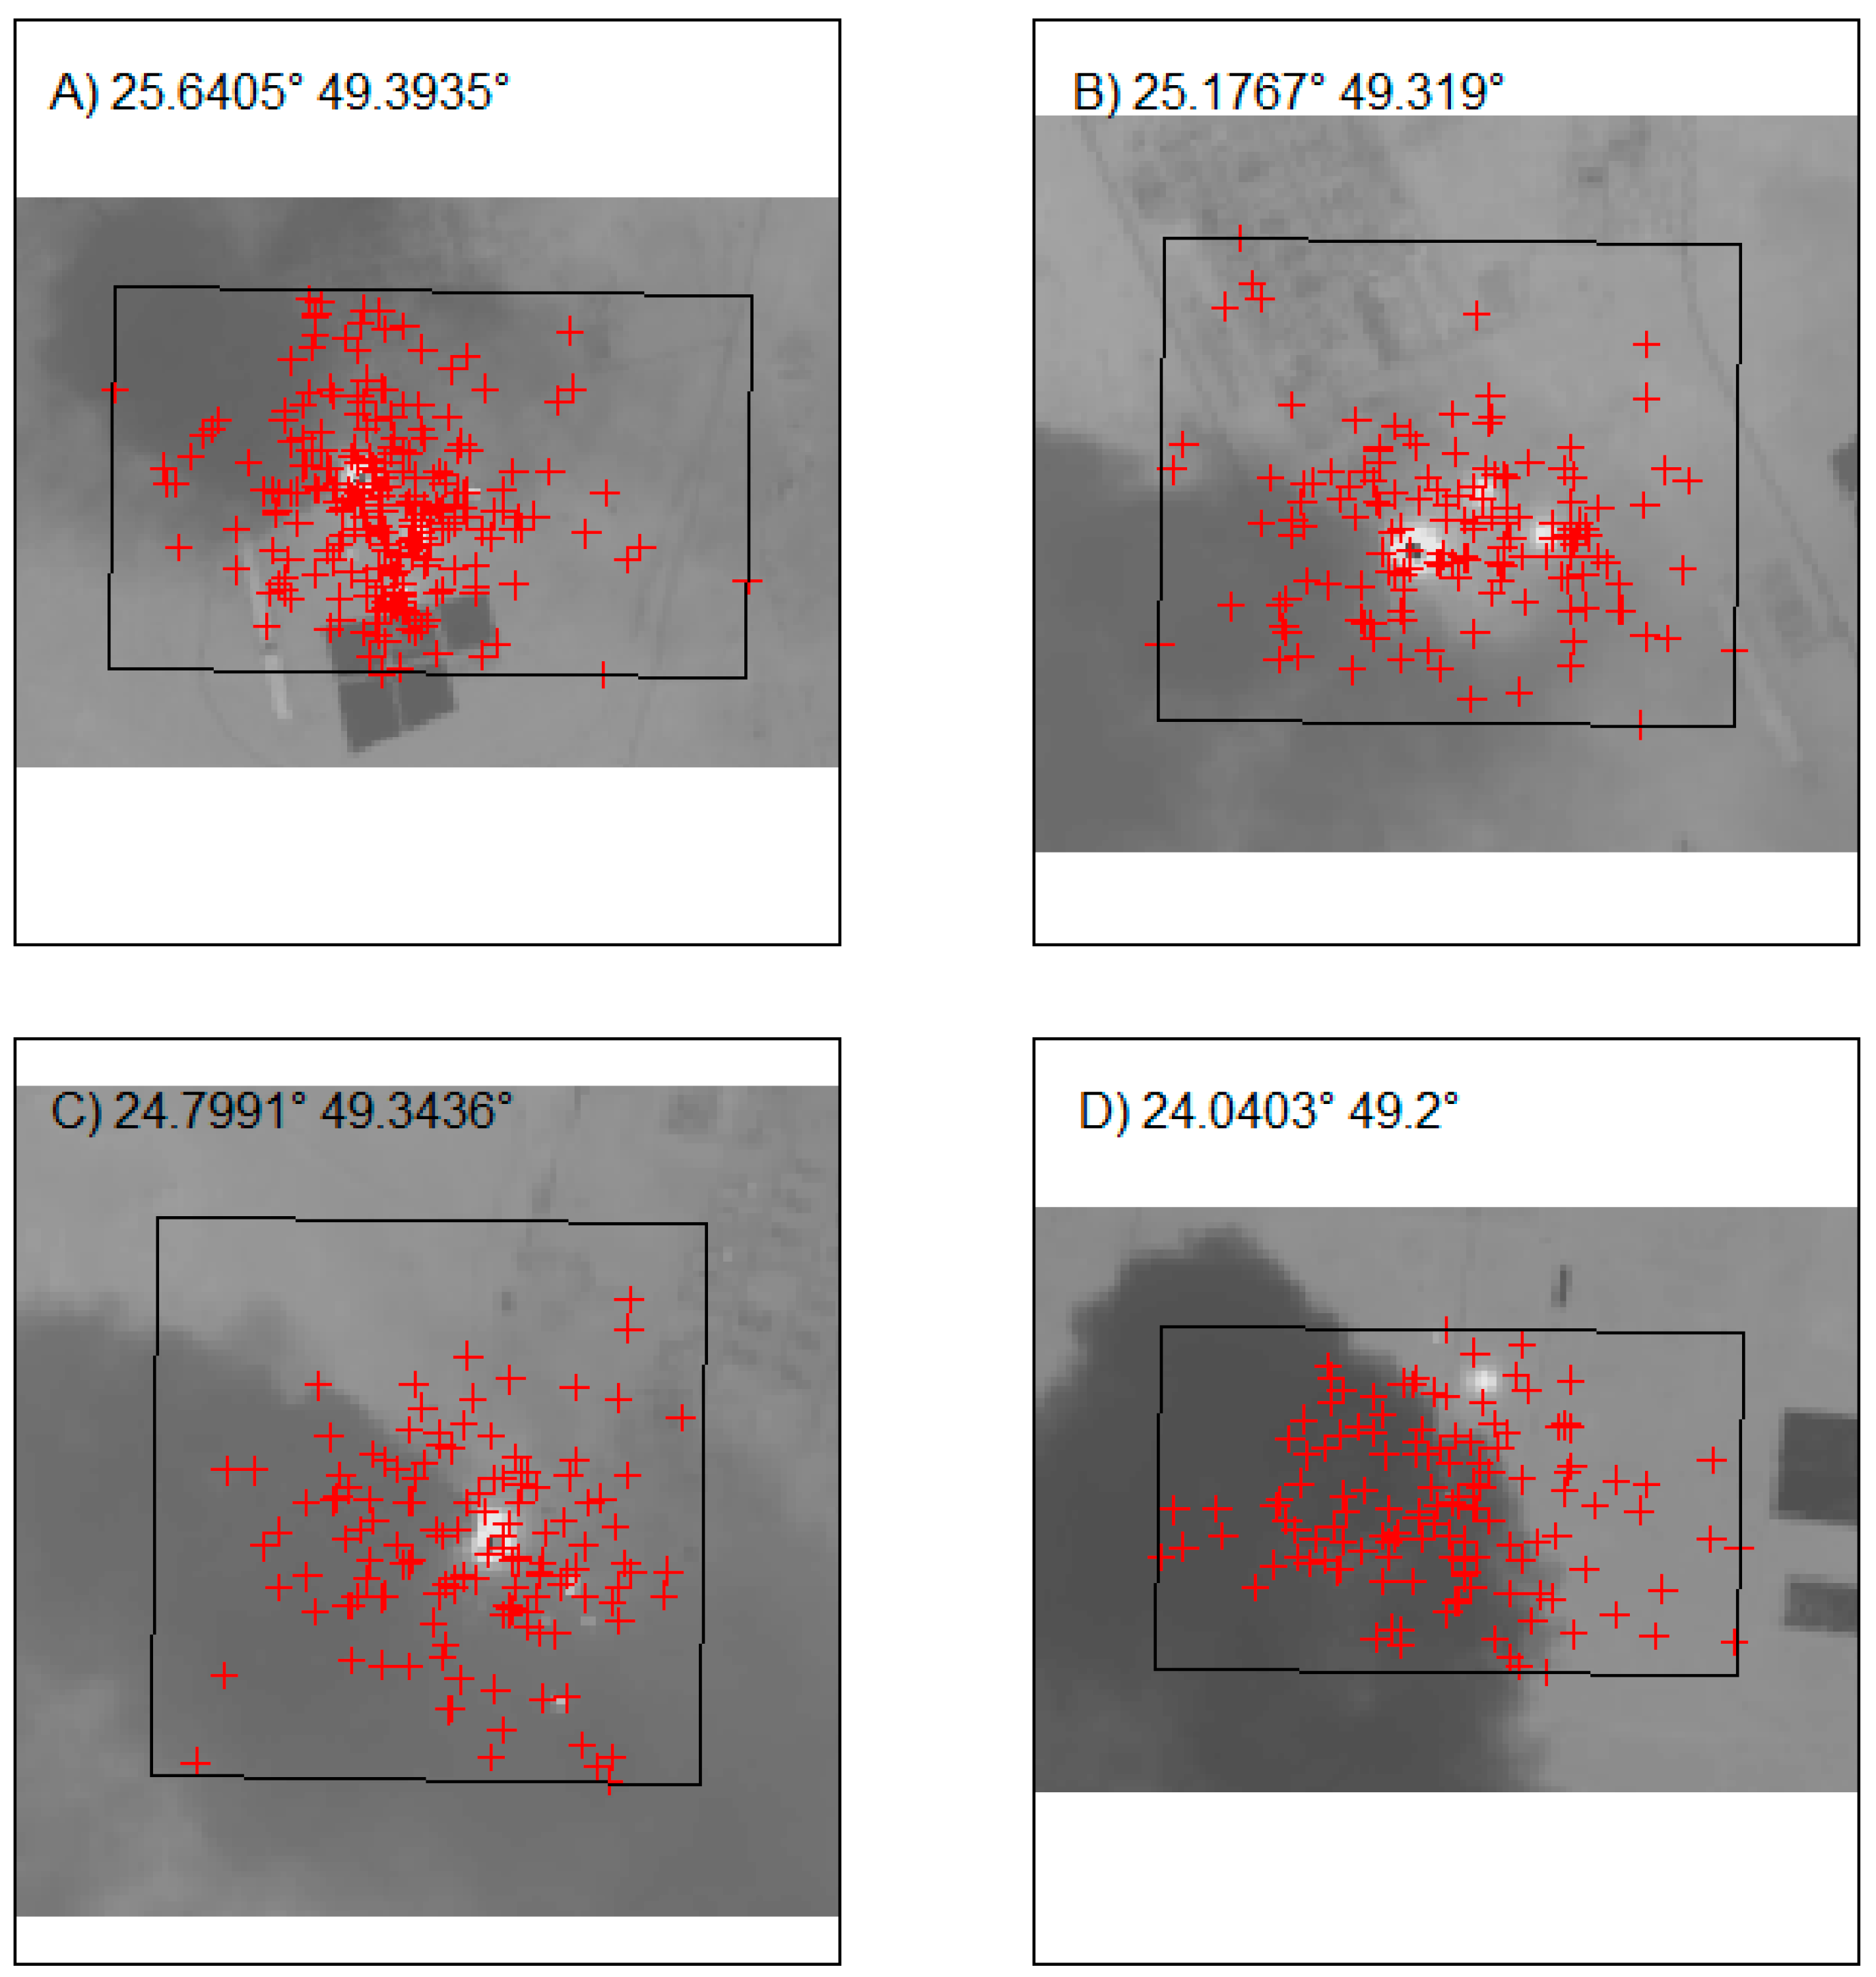
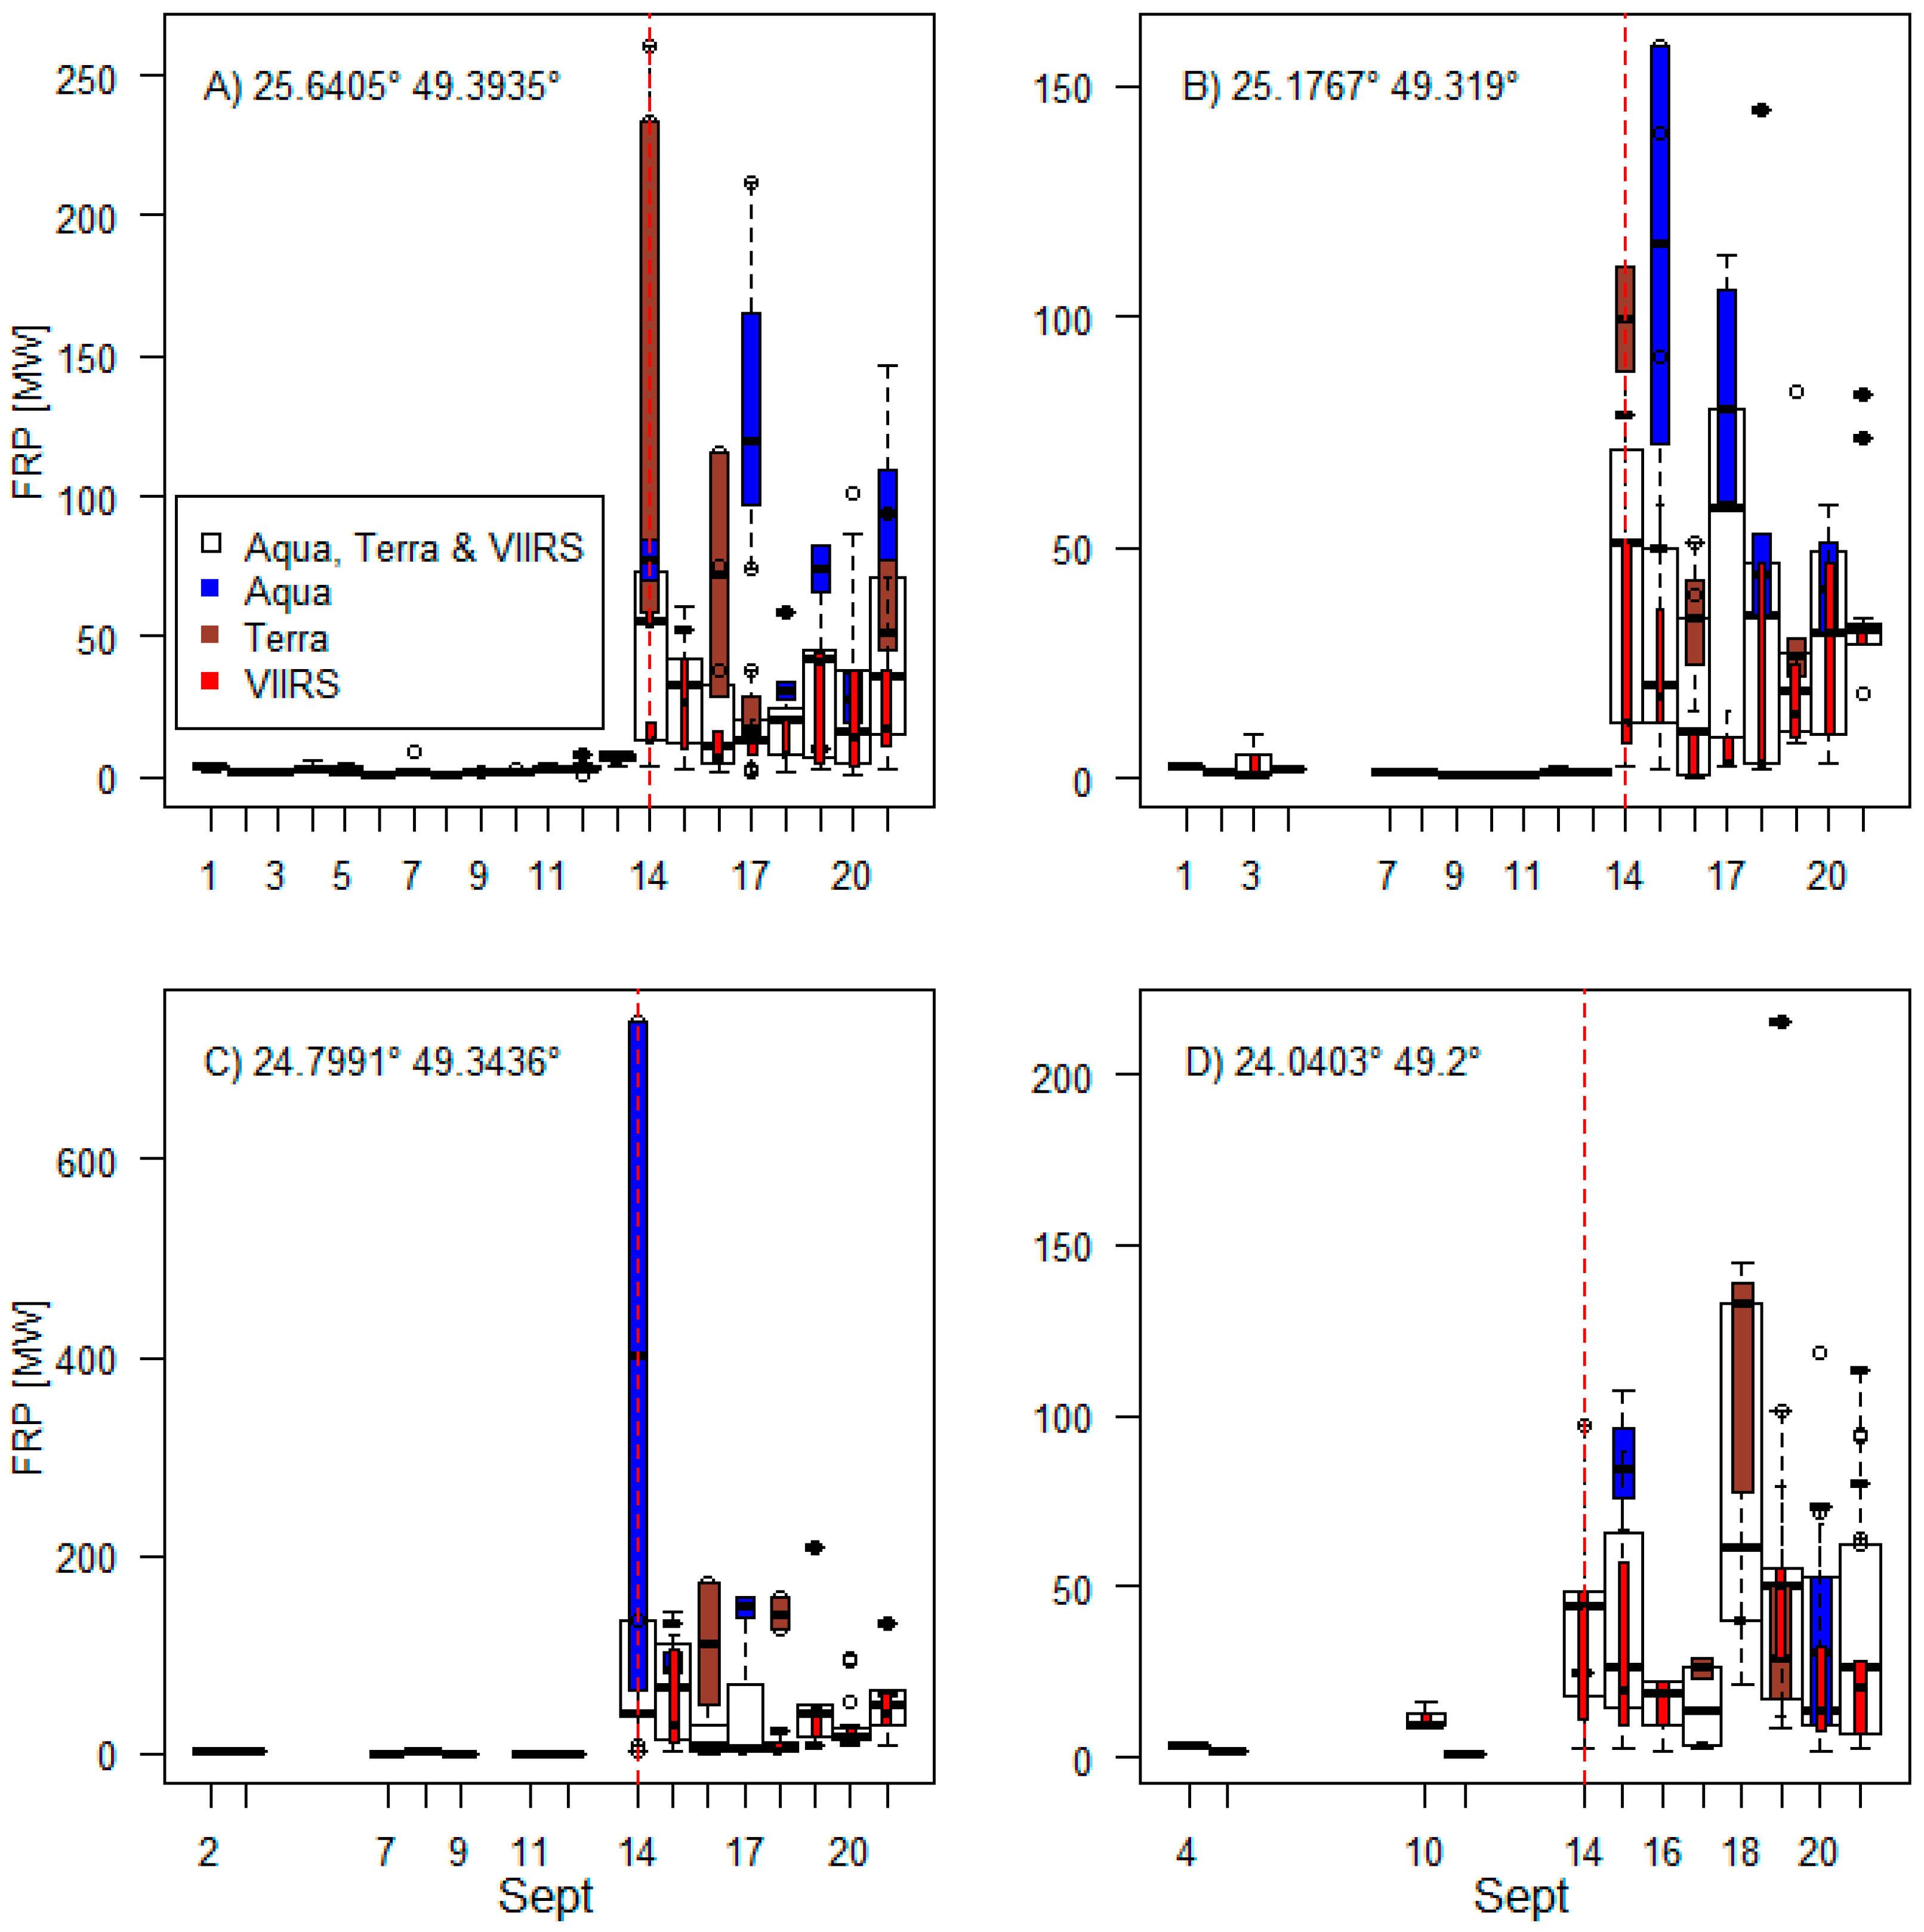
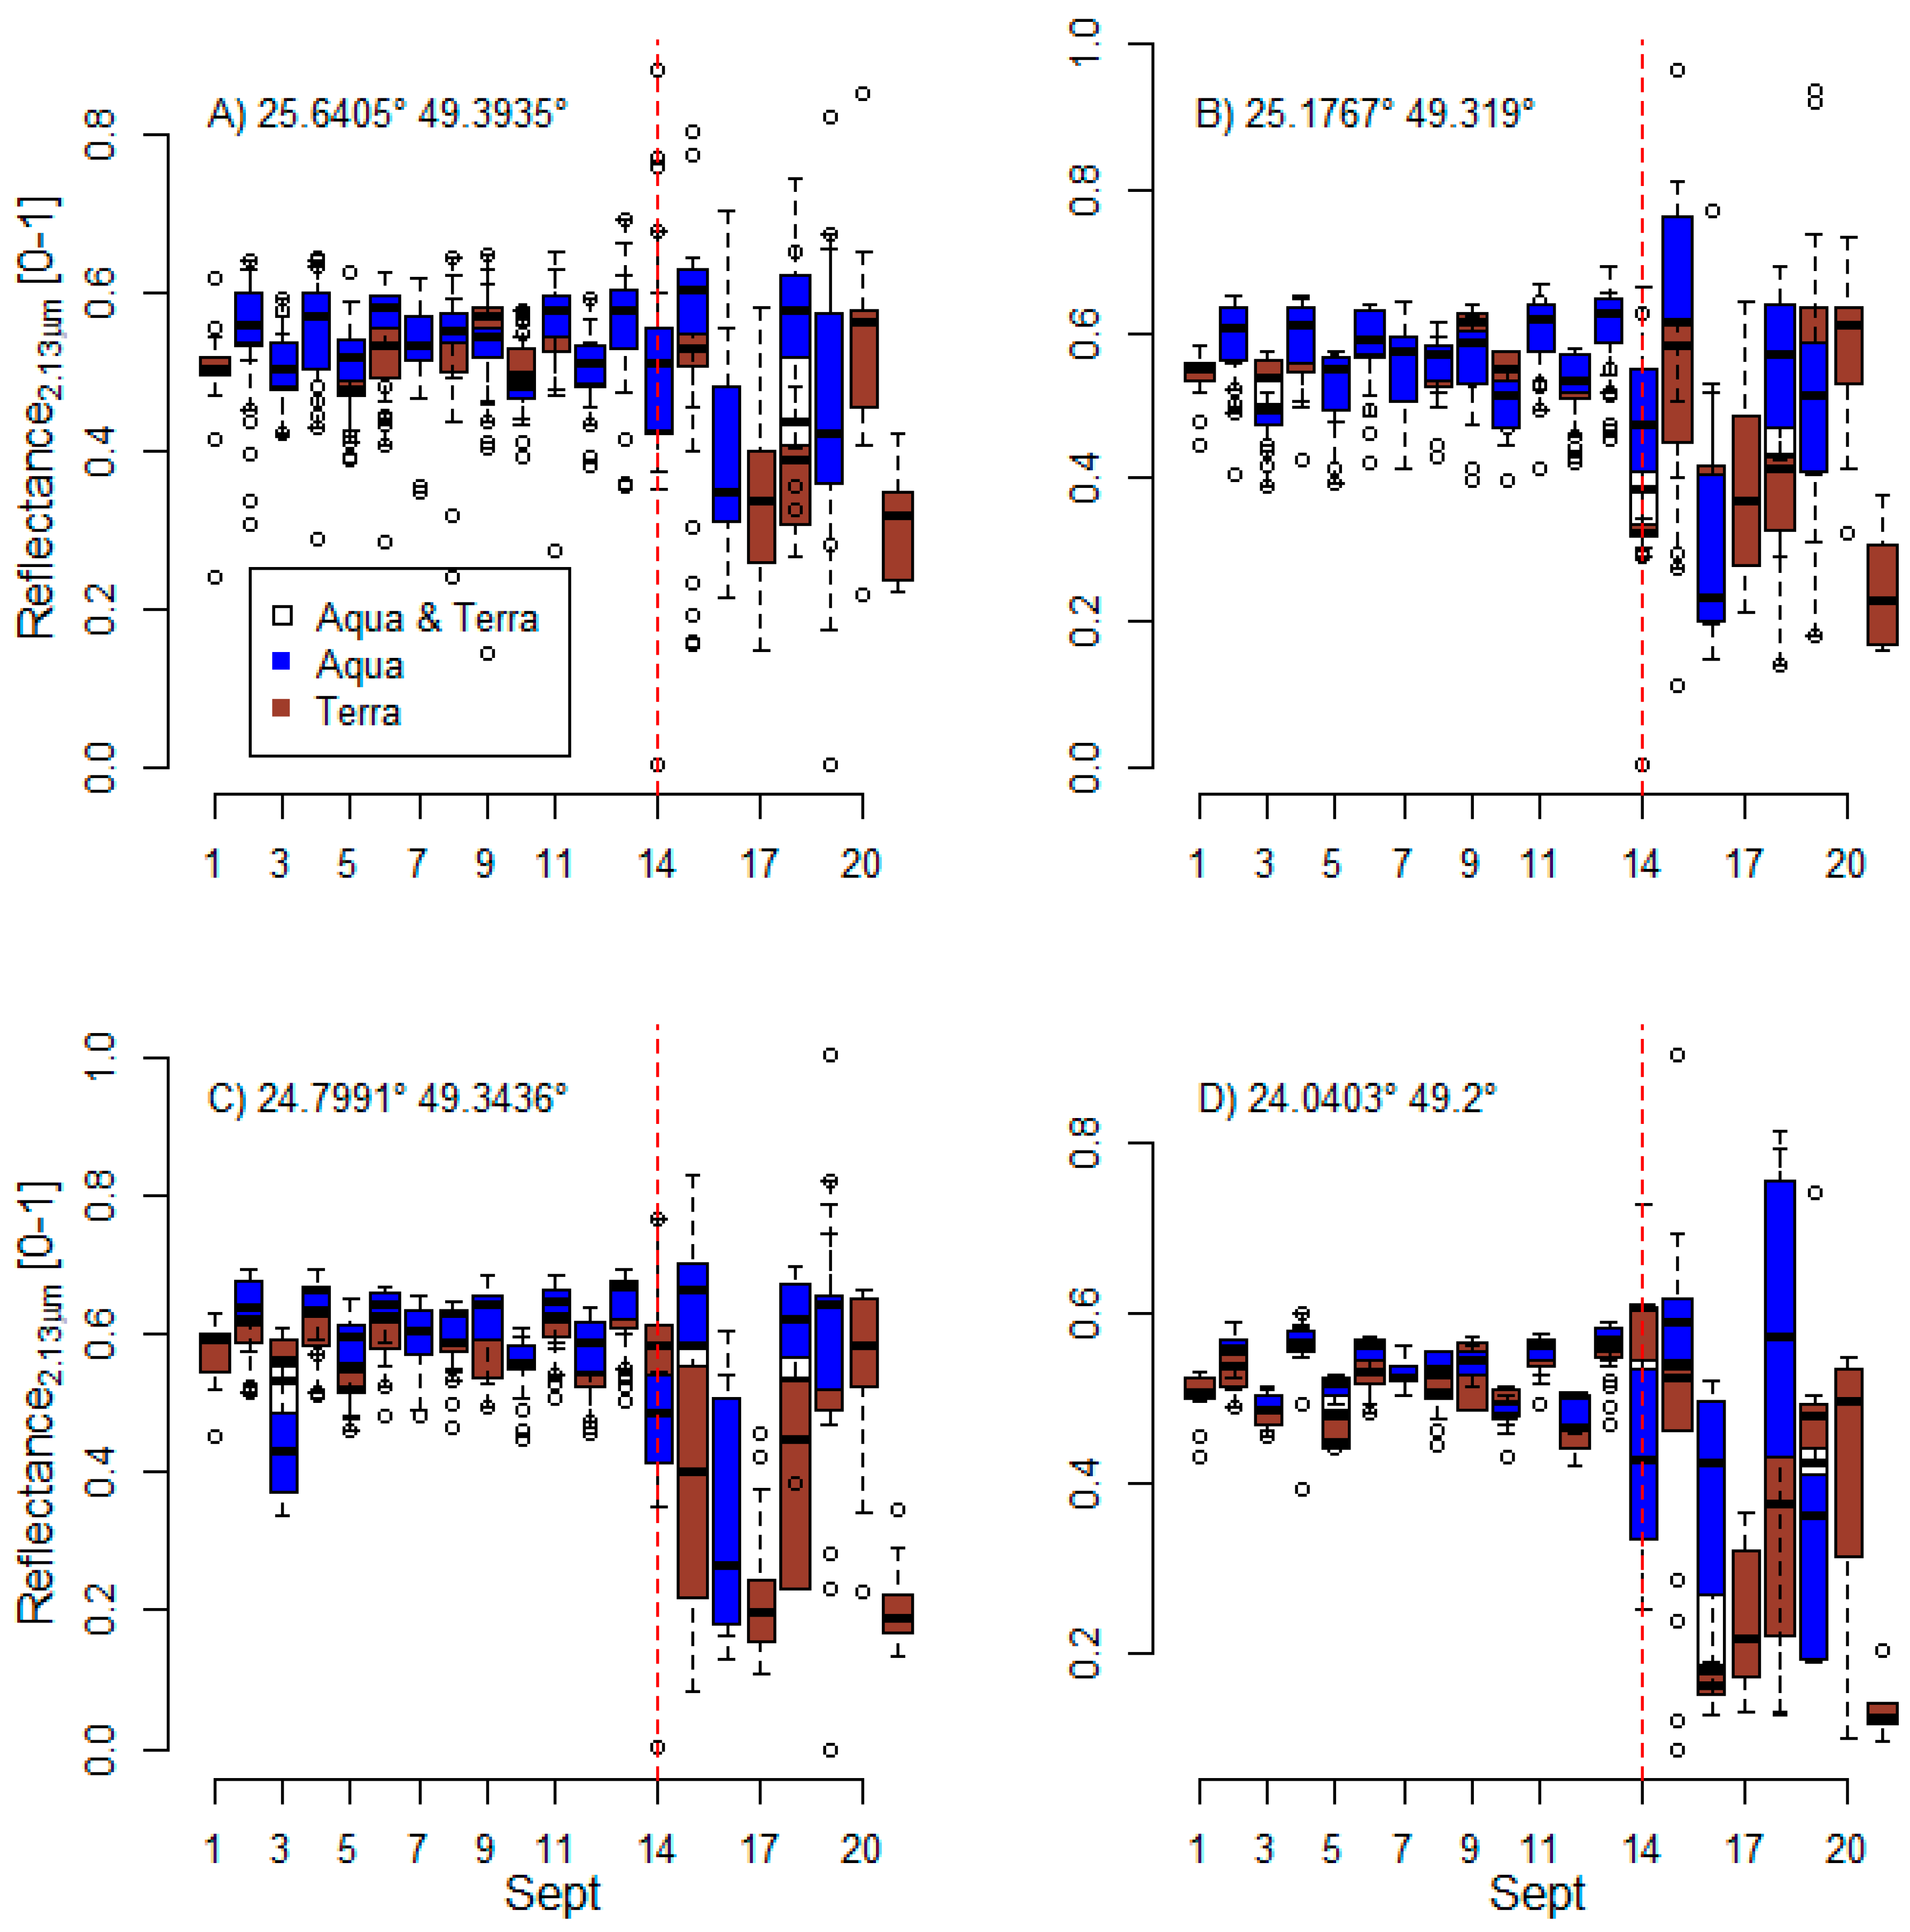
3. Results
4. Conclusions
Author Contributions
Funding
Acknowledgments
Conflicts of Interest
References
- Crutzen, P.J.; Andreae, M.O. Biomass burning in the tropics: Impact on atmospheric chemistry and biogeochemical cycles. Science 1990, 250, 1669–1678. [Google Scholar] [CrossRef] [PubMed]
- Smith, A.M.; Talhelm, A.F.; Johnson, D.M.; Sparks, A.M.; Kolden, C.A.; Yedinak, K.M.; Apostol, K.G.; Tinkham, W.T.; Abatzoglou, J.T.; Lutz, J.A. Effects of fire radiative energy density dose on Pinus contorta and Larix occidentalis seedling physiology and mortality. Int. J. Wildland Fire 2017, 26, 82–94. [Google Scholar] [CrossRef]
- Sparks, A.M.; Kolden, C.A.; Smith, A.M.; Boschetti, L.; Johnson, D.M.; Cochrane, M.A. Fire intensity impacts on post-fire temperate coniferous forest net primary productivity. Biogeosciences 2018, 15, 1173. [Google Scholar] [CrossRef]
- Kolden, C.; Sparks, A. Towards Improved Quantification and Prediction of Post-Fire Recovery in Conifers: Expanding Laboratory Fire Radiative Energy-Tree Physiology Experiments to a Mature Forest Stand. Final Report Joint Fire Science Project 16-2-01-9; Boise, ID; 2018; pp. 1–18. Available online: https://www.firescience.gov/projects/16-2-01-9/project/16-2-01-9_final_report.pdf (accessed on 26 September 2019).
- Fisher, D.; Wooster, M. Shortwave IR Adaption of the Mid-Infrared Radiance Method of Fire Radiative Power (FRP) Retrieval for Assessing Industrial Gas Flaring Output. Remote Sens. 2018, 10, 305. [Google Scholar] [CrossRef]
- Kaufman, Y.J.; Justice, C.; Flynn, L.; Kendall, J.; Giglio, L.; Prins, E.; Ward, D.; Menzel, P.; Setzer, A. Monitoring global fires from EOS-MODIS. J. Geophys. Res. 1998, 103, 215–239. [Google Scholar] [CrossRef]
- Wooster, M.J.; Roberts, G.; Perry, G.; Kaufman, Y. Retrieval of biomass combustion rates and totals from fire radiative power observations: FRP derivation and calibration relationships between biomass consumption and fire radiative energy release. J. Geophys. Res. Atmos. 2005, 110. [Google Scholar] [CrossRef]
- Oliva, P.; Schroeder, W. Atmospheric correction of VIIRS and MODIS fire radiative power retrievals for multi-sensor comparison. In Proceedings of the IEEE International Geoscience and Remote Sensing Symposium (IGARSS), Milan, Italy, 26–31 July 2015; pp. 2038–2040. [Google Scholar]
- Kumar, S.S.; Picotte, J.J.; Peterson, B. Prototype Downscaling Algorithm for MODIS Satellite 1 km Daytime Active Fire Detections. Fire 2019, 2, 29. [Google Scholar] [CrossRef]
- Wooster, M.J.; Roberts, G.; Smith, A.M.; Johnston, J.; Freeborn, P.; Amici, S.; Hudak, A.T. Thermal remote sensing of active vegetation fires and biomass burning events. In Thermal Infrared Remote Sensing; Springer: Dordrecht, Germany, 2013; pp. 347–390. [Google Scholar]
- Wooster, M.; Zhukov, B.; Oertel, D. Fire radiative energy for quantitative study of biomass burning: Derivation from the BIRD experimental satellite and comparison to MODIS fire products. Remote Sens. Environ. 2003, 86, 83–107. [Google Scholar] [CrossRef]
- Smith, A.M.; Wooster, M.J. Remote classification of head and backfire types from MODIS fire radiative power and smoke plume observations. Int. J. Wildland Fire 2005, 14, 249–254. [Google Scholar] [CrossRef]
- Elvidge, C.; Zhizhin, M.; Baugh, K.; Hsu, F.-C.; Ghosh, T. Methods for global survey of natural gas flaring from visible infrared imaging radiometer suite data. Energies 2016, 9, 14. [Google Scholar] [CrossRef]
- Kumar, S.S.; Roy, D.P. Global operational land imager Landsat-8 reflectance-based active fire detection algorithm. Int. J. Digit. Earth 2018, 11, 154–178. [Google Scholar] [CrossRef]
- Barbero, R.; Abatzoglou, J.T.; Larkin, N.; Kolden, C.; Stocks, B. Climate change presents increased potential for very large fires in the contiguous United States. Int. J. Wildland Fire 2015, 24, 892–899. [Google Scholar] [CrossRef]
- Dennison, P.E.; Brewer, S.C.; Arnold, J.D.; Moritz, M.A. Large wildfire trends in the western United States, 1984–2011. Geophys. Res. Lett. 2014, 41, 2928–2933. [Google Scholar] [CrossRef]
- Giglio, L.; Csiszar, I.; Restás, Á.; Morisette, J.T.; Schroeder, W.; Morton, D.; Justice, C.O. Active fire detection and characterization with the advanced spaceborne thermal emission and reflection radiometer (ASTER). Remote Sens. Environ. 2008, 112, 3055–3063. [Google Scholar] [CrossRef]
- Schroeder, W.; Prins, E.; Giglio, L.; Csiszar, I.; Schmidt, C.; Morisette, J.; Morton, D. Validation of GOES and MODIS active fire detection products using ASTER and ETM+ data. Remote Sens. Environ. 2008, 112, 2711–2726. [Google Scholar] [CrossRef]
- Morton, D.; Defries, R.; Randerson, J.; Giglio, L.; Schroeder, W.; Van Der Werf, G. Agricultural intensification increases deforestation fire activity in Amazonia. Glob. Chang. Biol. 2008, 14, 2262–2275. [Google Scholar] [CrossRef]
- Gambrell, J. Saudi Arabia: Drone Attacks Knocked Out Half Its Oil Supply. Available online: https://www.apnews.com/d20f80188e3543bfb36d512df7777cd4 (accessed on 26 September 2019).
- Mosley, T. Attacks on Saudi Oil Plant Carry Heavy Environmental Cost. Available online: https://www.wbur.org/hereandnow/2019/09/19/saudi-oil-attacks-environment (accessed on 26 September 2019).
- Bloomberg. Available online: https://www.bloomberg.com/news/articles/2019-09-15/saudis-race-to-restore-oil-output-after-crippling-aramco-attack (accessed on 26 September 2019).
- Fisher, D.; Wooster, M.J. Multi-decade global gas flaring change inventoried using the ATSR-1, ATSR-2, AATSR and SLSTR data records. Remote Sens. Environ. 2019, 232, 111298. [Google Scholar] [CrossRef]
- Loveland, T.R.; Dwyer, J.L. Landsat: Building a strong future. Remote Sens. Environ. 2012, 122, 22–29. [Google Scholar] [CrossRef]
- EARTHDATA. Available online: https://earthdata.nasa.gov/ (accessed on 26 September 2019).
- Schroeder, W.; Oliva, P.; Giglio, L.; Csiszar, I.A. The New VIIRS 375 m active fire detection data product: Algorithm description and initial assessment. Remote Sens. Environ. 2014, 143, 85–96. [Google Scholar] [CrossRef]
- FIRMS. Available online: https://earthdata.nasa.gov/earth-observation-data/near-real-time/firms (accessed on 26 September 2019).


© 2020 by the authors. Licensee MDPI, Basel, Switzerland. This article is an open access article distributed under the terms and conditions of the Creative Commons Attribution (CC BY) license (http://creativecommons.org/licenses/by/4.0/).
Share and Cite
Kumar, S.S.; Hult, J.; Picotte, J.; Peterson, B. Potential Underestimation of Satellite Fire Radiative Power Retrievals over Gas Flares and Wildland Fires. Remote Sens. 2020, 12, 238. https://doi.org/10.3390/rs12020238
Kumar SS, Hult J, Picotte J, Peterson B. Potential Underestimation of Satellite Fire Radiative Power Retrievals over Gas Flares and Wildland Fires. Remote Sensing. 2020; 12(2):238. https://doi.org/10.3390/rs12020238
Chicago/Turabian StyleKumar, Sanath Sathyachandran, John Hult, Joshua Picotte, and Birgit Peterson. 2020. "Potential Underestimation of Satellite Fire Radiative Power Retrievals over Gas Flares and Wildland Fires" Remote Sensing 12, no. 2: 238. https://doi.org/10.3390/rs12020238
APA StyleKumar, S. S., Hult, J., Picotte, J., & Peterson, B. (2020). Potential Underestimation of Satellite Fire Radiative Power Retrievals over Gas Flares and Wildland Fires. Remote Sensing, 12(2), 238. https://doi.org/10.3390/rs12020238