Technical Note

A New Approach for Estimating Soil Salinity Using A Low-Cost Soil Sensor In Situ: A Case Study in Saline Regions of China’s East Coast

1
Jiangsu Key Laboratory of Crop Genetics and Physiology/Jiangsu Key Laboratory of Crop Cultivation and Physiology, Agricultural College of Yangzhou University, Yangzhou 225009, China
2
Jiangsu Co-Innovation Center for Modern Production Technology of Grain Crops, Yangzhou University, Yangzhou 225009, China
3
Ottawa Research and Development Centre, Agriculture and Agri-Food Canada, Ottawa, ON K1A OC6, Canada
4
Key Laboratory of Digital Earth Science, Institute of Remote Sensing and Digital Earth, Chinese Academy of Sciences, Beijing 100094, China
5
Joint International Research Laboratory of Agriculture and Agricultural Product Safety, Yangzhou University, Yangzhou 225009, China
*
Author to whom correspondence should be addressed.
Remote Sens. 2020, 12(2), 239; https://doi.org/10.3390/rs12020239
Submission received: 10 November 2019 / Revised: 25 December 2019 / Accepted: 8 January 2020 / Published: 10 January 2020
(This article belongs to the Section Remote Sensing in Agriculture and Vegetation)

Abstract

:
Accurate and timely information on soil salinity is crucial for vegetation growth and agricultural productivity in coastal regions. This study investigates the potential of using Wifi POGO, an in situ electromagnetic sensor, for soil salinity assessment over saline coastal regions in eastern China. The sensor readings, soil moisture, and temperature-corrected apparent electrical conductivity (ECa) were used to generate models for EC1:5 (a surrogate for soil salinity) estimation. Two salty areas with distinct soil textures, sandy loam (Shuntai) and clay (Dongxin), were selected. This study revealed that the difference between soil salinity and the in situ measured soil ECa (i.e., EC1:5-ECa) had a strong curvilinear relationship with soil moisture. Such a relationship allows for the direct estimation of soil salinity from soil ECa with the aid of soil moisture information. Both ECa and soil moisture can be measured in situ using a Wifi POGO, a low-cost ground-based soil sensor. By using the leave-one-out cross-validation (LOOCV), the achieved root mean square error (RMSE) and relative RMSE (RRMSE) in EC1:5 estimation were 0.0109 S/m and 19.24% respectively in Shuntai, and 0.0157 S/m and 16.05%, in Dongxin. This new method offers a simple, cost-effective and reliable tool for assessing soil salinity in dynamic coastal regions.

Graphical Abstract

1. Introduction

Soil salinization is a widespread and serious issue worldwide, especially in arid and semi-arid inland areas and humid coastal regions. Salt-affected areas cover about one billion hectares, approximately 7% of the earth’s continental surface [1]. In addition to these natural salt-affected areas, there are 77 million hectares of salinized land, resulting from human activities, especially in fields that are extensively irrigated with bad-quality water and are poorly drained [2]. China has a total of 36 million hectares of saline soils, equivalent to 4.88% of the country’s total available land [3]. China’s saline soils are mainly distributed in the arid northwest and humid east coast.
In general, soil salinity affects plants through osmotic stress and ion toxicity [4]. Osmotic stress disrupts plants’ water uptake [5] whereas ion toxicity hampers enzymes responsible for metabolic processes including photosynthesis [6], leading to reduced crop yield [7]. Information on soil salinity is critical for assessing soil suitability for plant growth and agricultural productivity [8]. Keeping track of changes in soil salinity can help making well-informed management decisions to reduce salinity-induced stress on plants [2].
A saline soil is defined as having the electrical conductivity (EC) of the saturation extract (ECe) in the root zone that exceeds 0.4 S/m (approximately 40 mM NaCl) at 25 °C and exchangeable sodium of 15% [9]. To determine soil salinity, soil samples were usually collected in situ and transported to a laboratory for analysis. Soil salinity is generally measured by ECe in the laboratory [8] following the standard method established by the United States Department of Agriculture [10]. ECe is better linked with plant response under salinity stress than other indices [11]. However, preparing saturated soil-paste extracts requires highly skilled laboratory technicians [8,12], and the quality of the paste has a direct impact on the ECe readings. Hence, the electrical conductivity of the 1:5 soil:water extracts (EC1:5) is widely used to determine the soil salinity instead of ECe in some countries such as Australia, China, and Central Asia [13] because the 1:5 soil:water extracts are faster and easier to prepare [8,14].
However, the ECe or EC1:5 measurement approach is expensive, time consuming, and labor intensive [15], making it unsuitable for intensive and extensive soil salinity assessments over large areas. To develop a fast and efficient method for measuring soil salinity, ground-based electromagnetic induction meters have been applied to measure the root substrate electrical conductivity in the field by inducing an electromagnetic field in a volume of soil between the transmitter and receiver coils [16]. Such an in situ derived soil apparent electrical conductivity (ECa) was used as a surrogate for soil salinity. For instance, Valdes et al. [17] used HydraProbe (Stevens Water Monitoring Systems, Inc., Portland, OR, USA) to measure soil bulk electrical conductivity for better saline irrigation management in the production of potted poinsettia. Li et al. [18] used EM38 (Geonics Ltd., Mississauga, ON, Canada) to study the vertical distribution of soil salinity in a coastal farm in eastern China.
The aforementioned studies aimed to obtain information on soil salinity without taking soil samples and conducting laboratory analysis. However, different from ECe or EC1:5, ECa cannot be referred to as soil salinity because it is also affected by soil moisture and temperature [19,20,21]. Previous studies assumed that soil salinity was the main factor influencing ECa. For example, Williams and Baker [22] reported that soil salinity alone could explain 65 to 70% of the variance in ECa in saline areas. Sun [23] reported that soil salinity had much higher effect on ECa than soil moisture did. Farahani et al. [24] reported that soil salinity was the main cause of ECa variability in saline fields, while ECa maps could be viewed as surrogate maps for soil moisture, clay, and/or organic matter content in non-saline fields. In situ measured ECa has simply been converted to ECe or EC1:5 through regression equations [25,26,27,28,29].
The efficacy of these regression models requires further investigation because variations in soil condition can significantly affect the accuracies of such conversions [16]. Metternicht and Zinck [2] suggested the establishment of a proper regression for a specific soil moisture condition to better convert ECa to ECe or EC1:5. However, these approaches are not practical, especially in humid saline coastal regions, such as those of eastern China, because of the large spatial variabilities in soil moisture within a short distance.
This study investigated the potential of using Wifi POGO (Stevens Water Monitoring Systems, Inc., Portland, OR, USA), a low-cost ground-based portable wireless electromagnetic soil sensor, for accurate soil salinity estimation. Wifi POGO, with built-in Wifi, is able to provide information on several key soil parameters like soil moisture and temperature-corrected ECa. The objective of the present study was to develop a Wifi POGO-based method to effectively and accurately retrieve EC1:5, a surrogate from in situ measured soil ECa and soil moisture data in dynamic saline coastal regions.

2. Materials and Methods

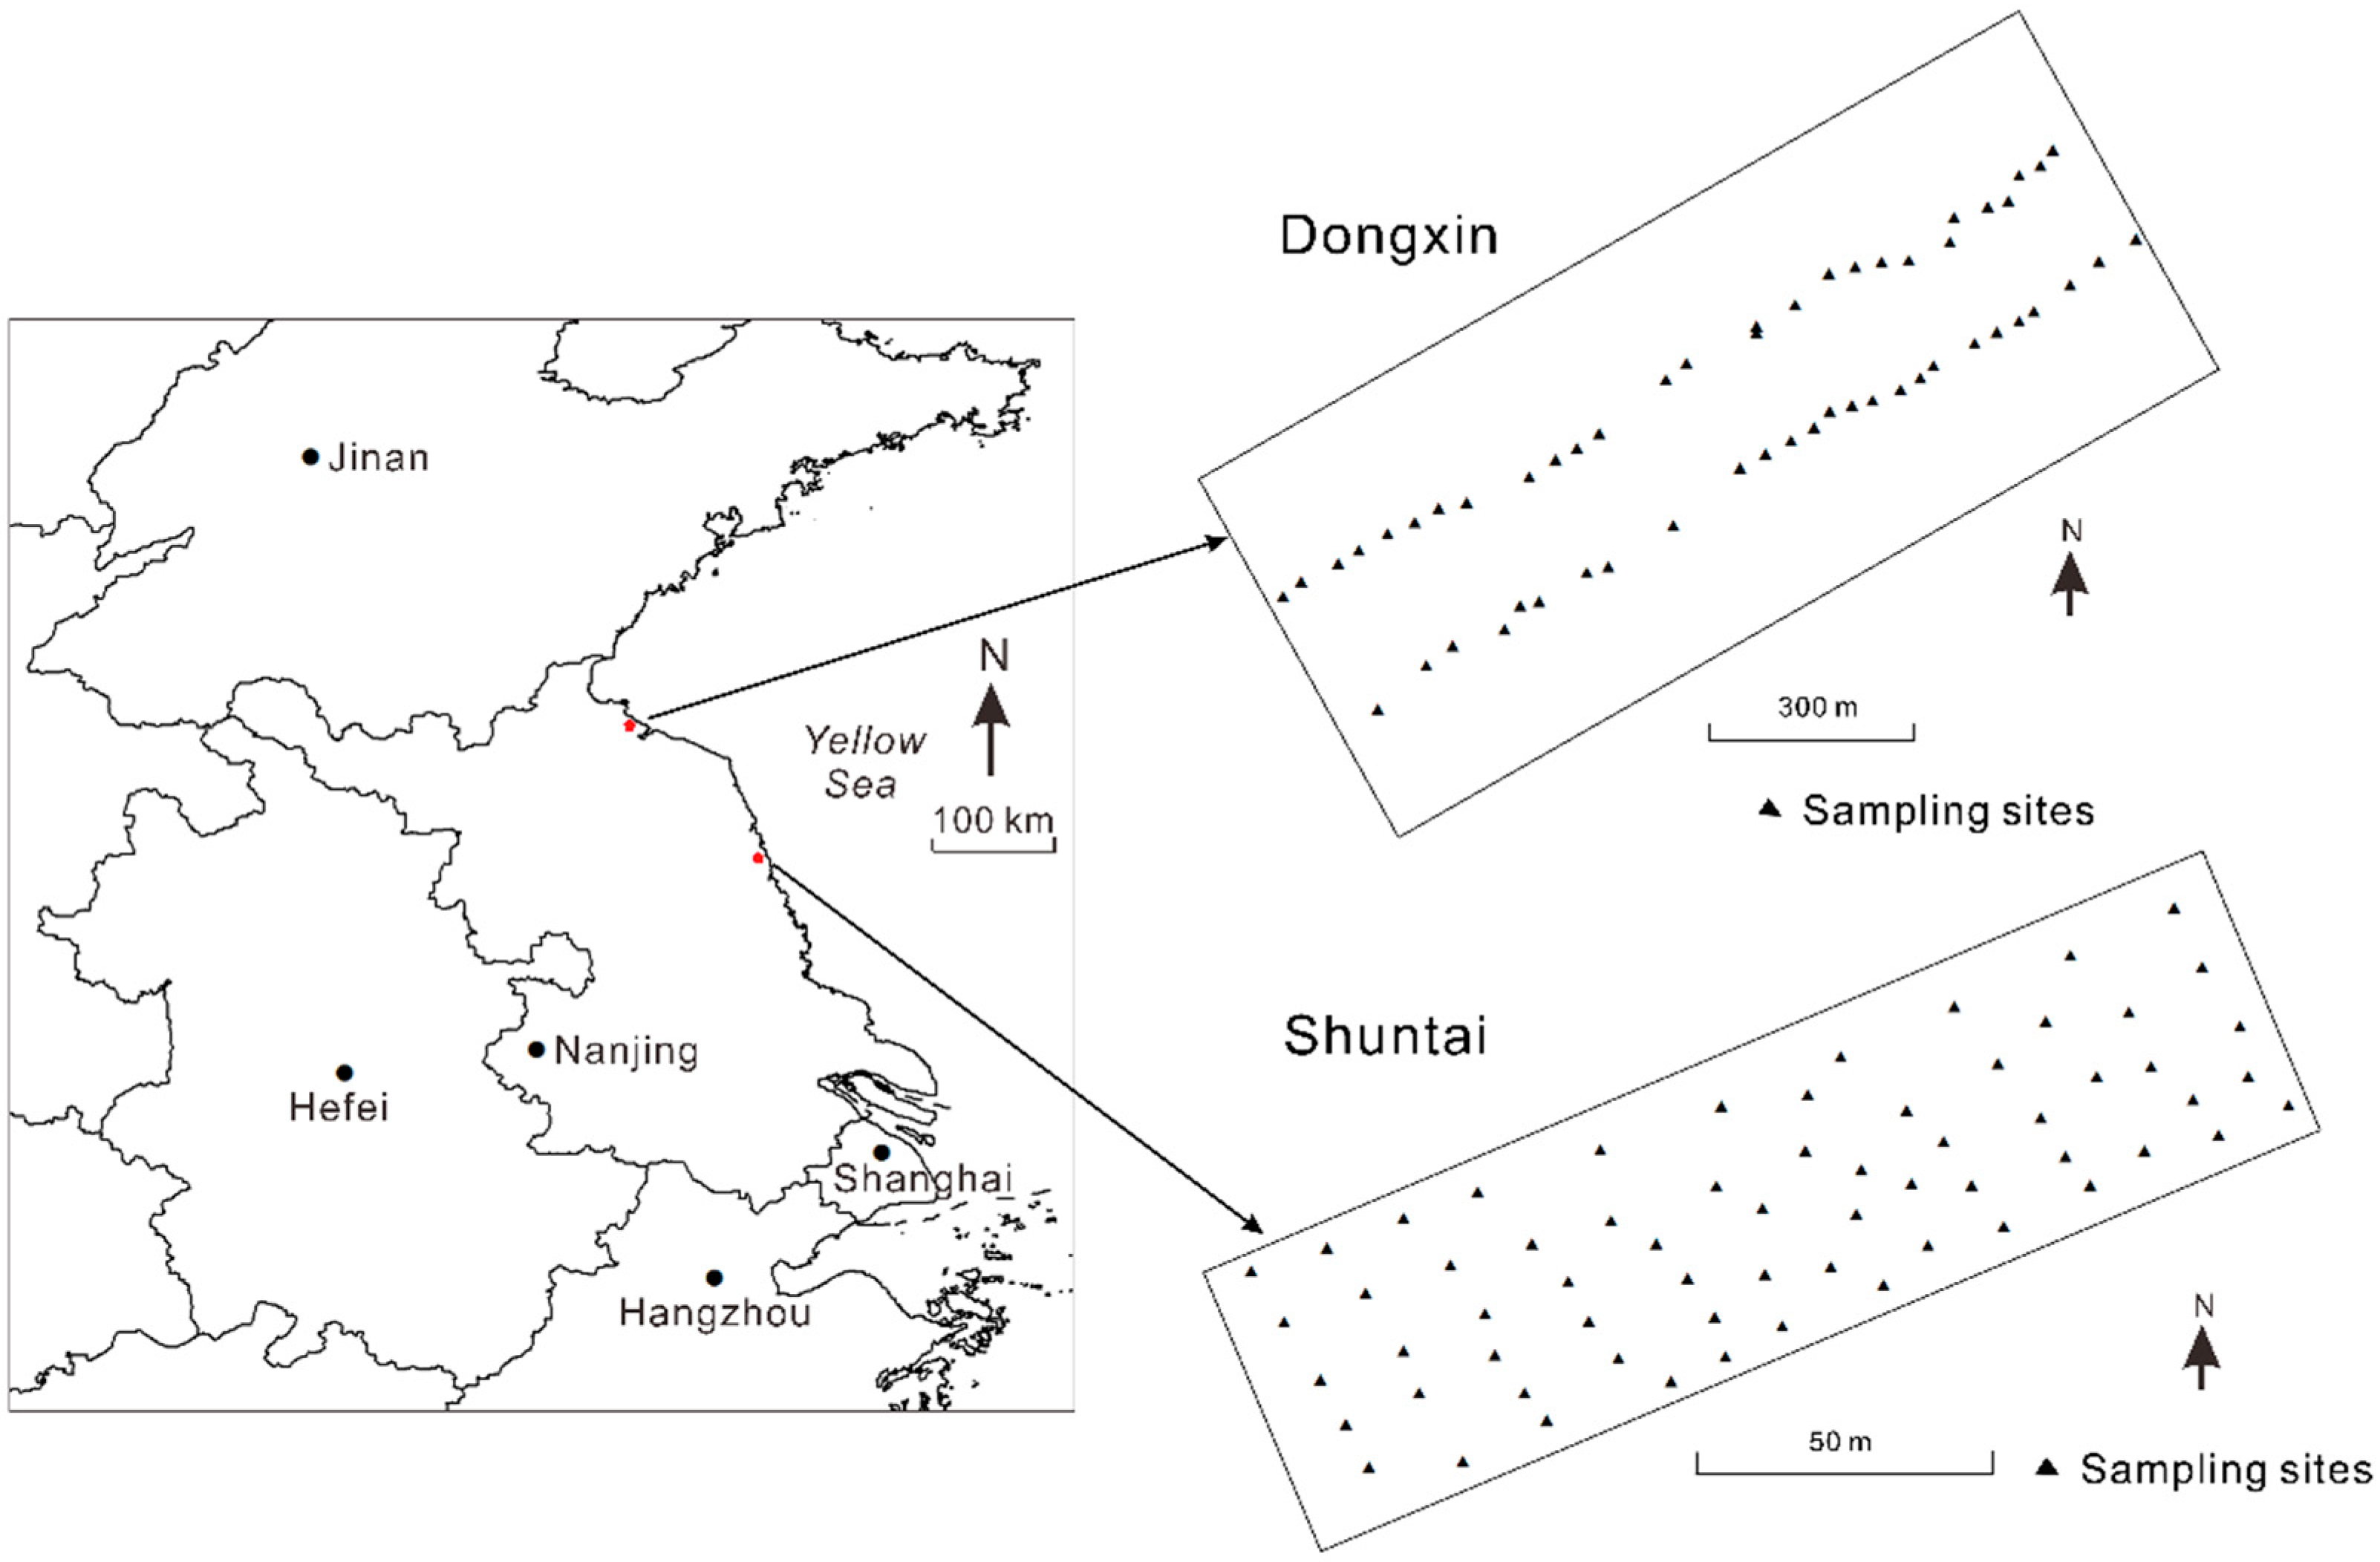
2.1. Study Areas and Data Acquisition

Two study areas, representative of two major soil types of the region, were selected in Jiangsu Province of eastern China (Figure 1). The Shuntai study area covers a 50 × 170 m segment of Shuntai Farm (33.692955°N, 120.383896°E), Yancheng City. Its soil type is salty sandy loam [30]. Its annual mean temperature and rainfall are 13.8 °C and 1000 mm, respectively [31]. The Dongxin study area is a 600 × 1400 m segment of Dongxin Farm (34.566993°N, 119.438438°E), Lianyungang City. Its soil type is salty clay [32]. Its annual mean temperature and rainfall are 14.3 °C and 901.4 mm, respectively [33]. Both study areas, former salterns, belong to humid subtropical monsoon climate. Most precipitation occurs between June and September in the form of rainfall.
Field surveys were conducted at 64 sampling sites in Shuntai on October 30, 2015 after rice (Oryza sativa) harvest and at 54 sampling sites in Dongxin on May 8th, 2016 before wheat (Triticum aestivum) harvest. Different from the Shuntai study area, the sampling sites in Dongxin study area were deployed along two southwest-northeast transects because soil salinity showed a southwest-northeast trend according to local knowledge from the corresponding author of the paper. At each sampling site, the Wifi POGO soil sensor’s four rods were vertically pushed into the soil, resulting in a sensing depth of 5.7 cm, equal to the rod length. The sensor operated at a frequency of 50 MHz. Using the Wifi POGO soil sensor, site locations (i.e., global positioning system (GPS) coordinates) and soil parameters including moisture in units of water fraction by volume (wfv) and temperature-corrected apparent electrical conductivity (ECa) were automatically monitored and recorded in situ by a smart phone using the free Stevens HydraMon App. Then, a soil sample was collected from each sampling site immediately after the measurements were taken. Soil samples were drawn from 0 to 15 cm depth using a soil sampler with a 38 mm inside diameter and stored in plastic bags. The 15 cm topsoil layer is crucial for crop root growth.
The EC1:5 method, which is widely used in China, was adopted to determine soil salinity instead of ECe [13] following Yao et al. [34] at the temperature of 25 °C in laboratory. Soil samples were air-dried, ground, and passed through a 2-mm sieve. The soil suspension (20 g soil:100 mL ultra-pure water) in a beaker flask with cap was agitated by a constant temperature shaker for 5 min. After being left to stand for 30 min, the supernatant was carefully decanted into a tube and centrifuged at 3000 revolutions per minute (RPM) for 5 min. Then, the supernatant liquid in the centrifuge tube was measured to determine the EC1:5 directly with a conductivity meter (Model: Leici DDS-307A; Shanghai Precision & Scientific Instrument CO. LTD, Shanghai, China).
Soil sample properties including soil texture, minimum, maximum, and mean values of the measured soil moisture, ECa and EC1:5 are listed in Table 1 for each study area. The two study areas had similar ranges of soil moisture and ECa values, but quite different variations in EC1:5 values.

2.2. Data Analysis

For each study area, the relationships among the variables (ECa, EC1:5, soil moisture and the difference between EC1:5 and ECa) were modeled through non-linear regression. EC1:5 was then derived from the in situ measurements of ECa and soil moisture.
Model validation was conducted using the leave-one-out cross-validation (LOOCV) technique. LOOCV is well accepted to perform an unbiased assessment of the estimation capacity of a given model [35]. The model goodness-of-fit was assessed by comparing the root mean square error (RMSE) and relative RMSE (RRMSE) obtained from the LOOCV procedure.
RMSE and RRMSE were calculated as follows:
R M S E = 1 n × i = 1 n ( E i M i ) 2
R R M S E = R M S E / ( 1 n × i = 1 n M i ) × 100 %
where Ei and Mi are estimated and measured EC1:5 values, respectively, and n is number of samples.

3. Results and Discussion

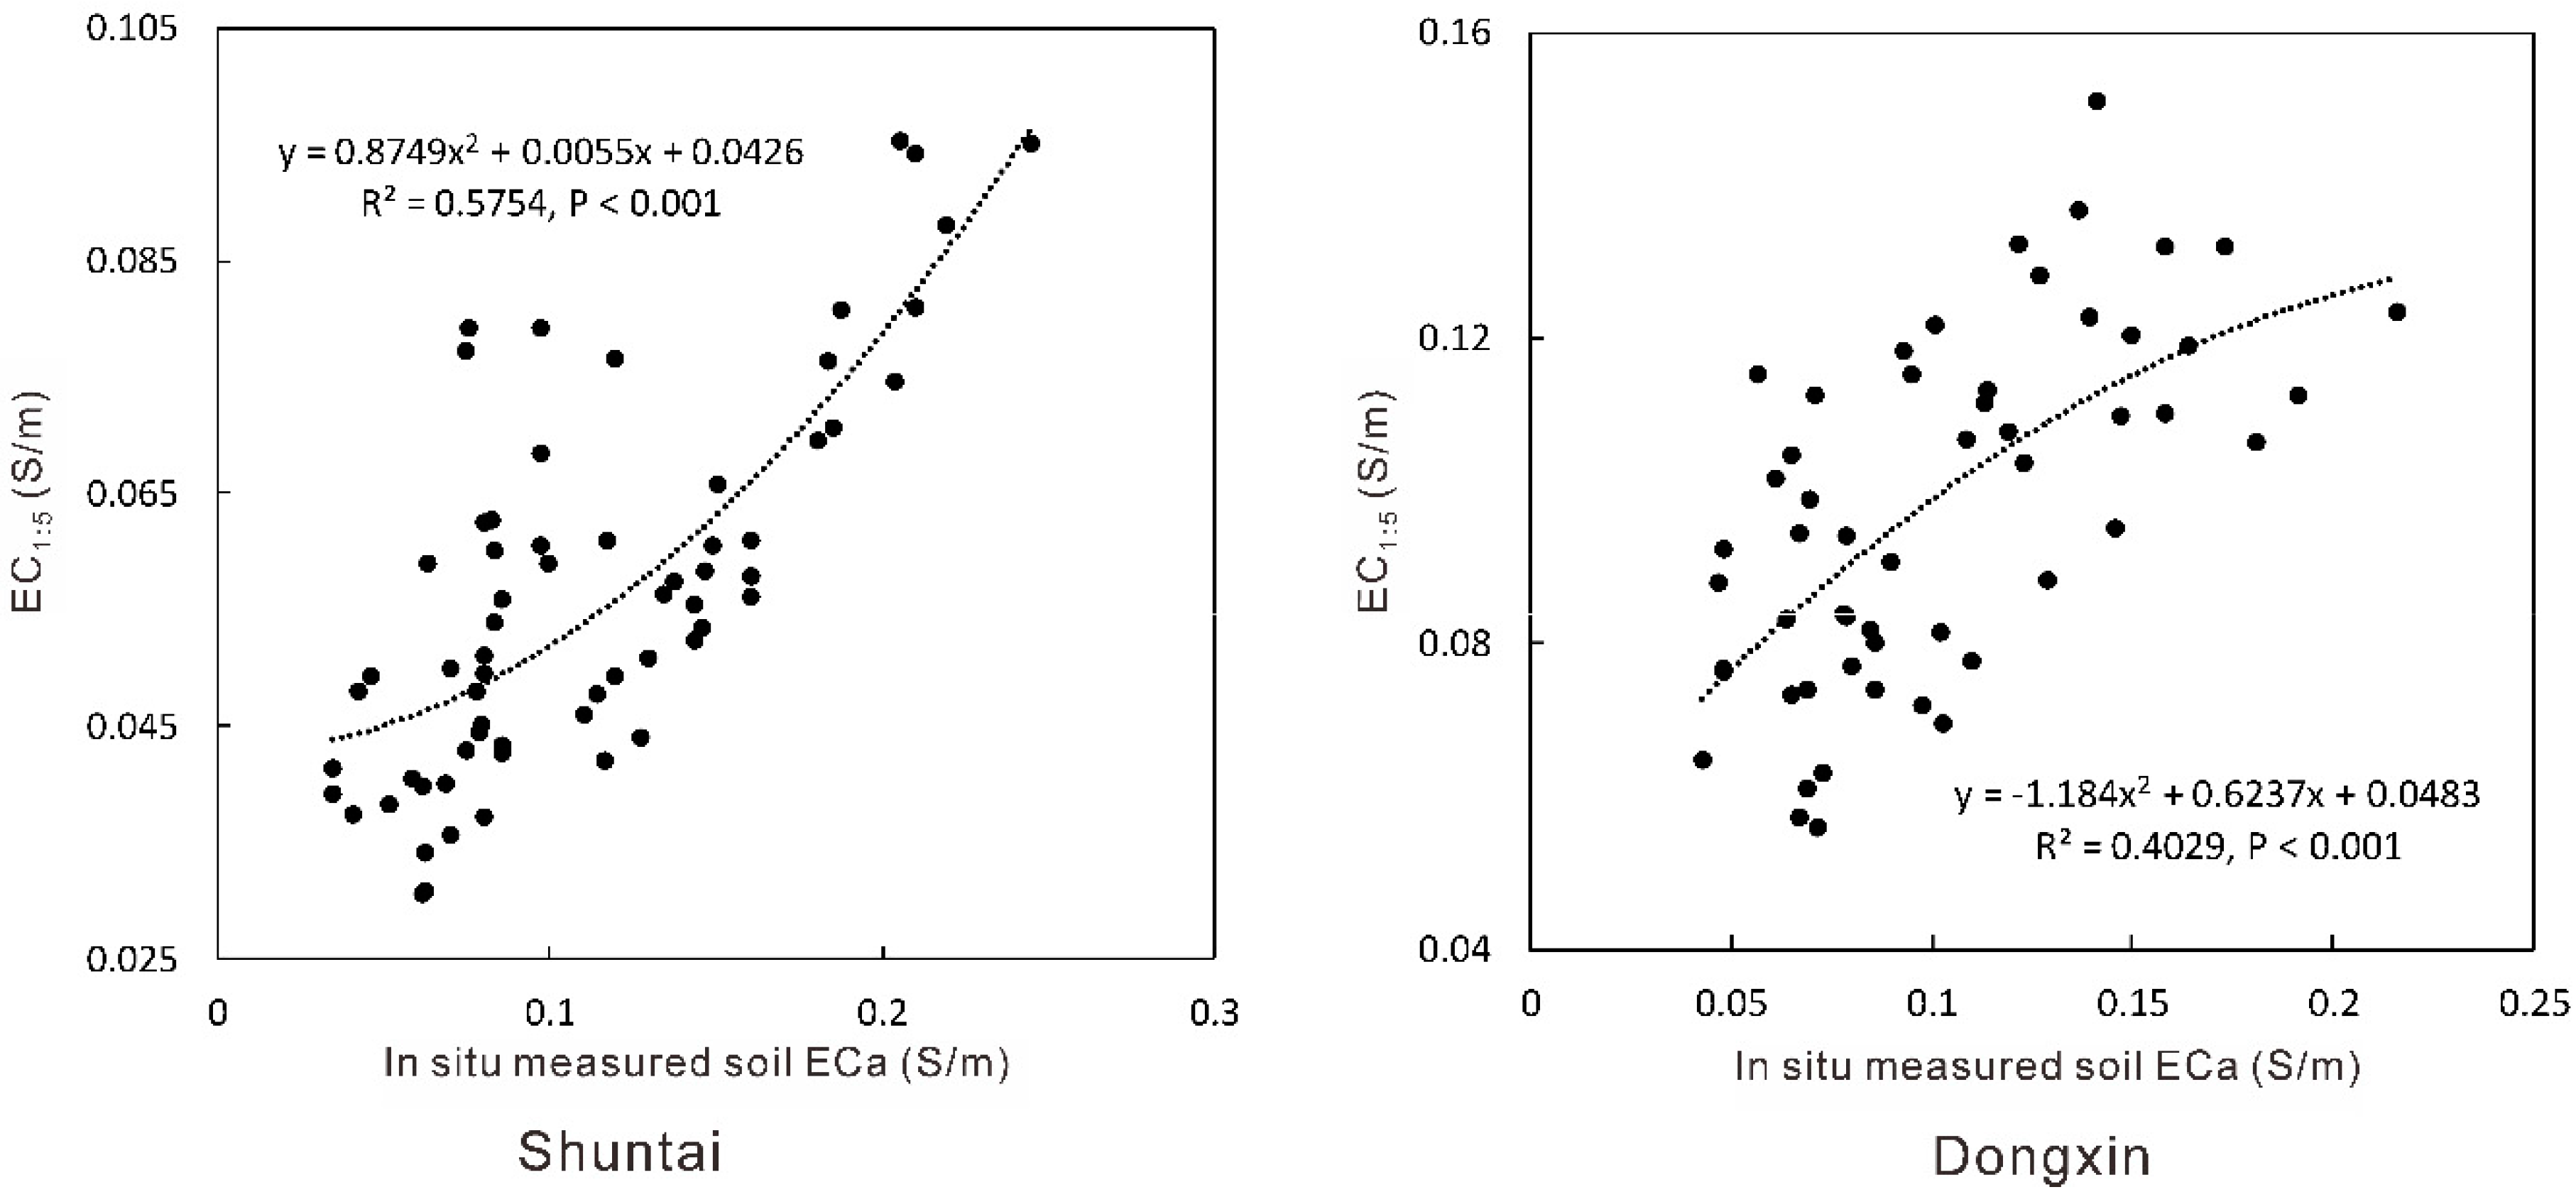
3.1. Relationships between ECa and EC1:5

Results from this study revealed that EC1:5 exhibited positive correlations with in situ measured ECa in both study areas (Figure 2). However, the coefficients of determination (R2) were only 0.58 and 0.40 when using polynomial models in the study areas of Shuntai and Dongxin, respectively. This implies that soil salinity cannot be accurately estimated using ECa alone.

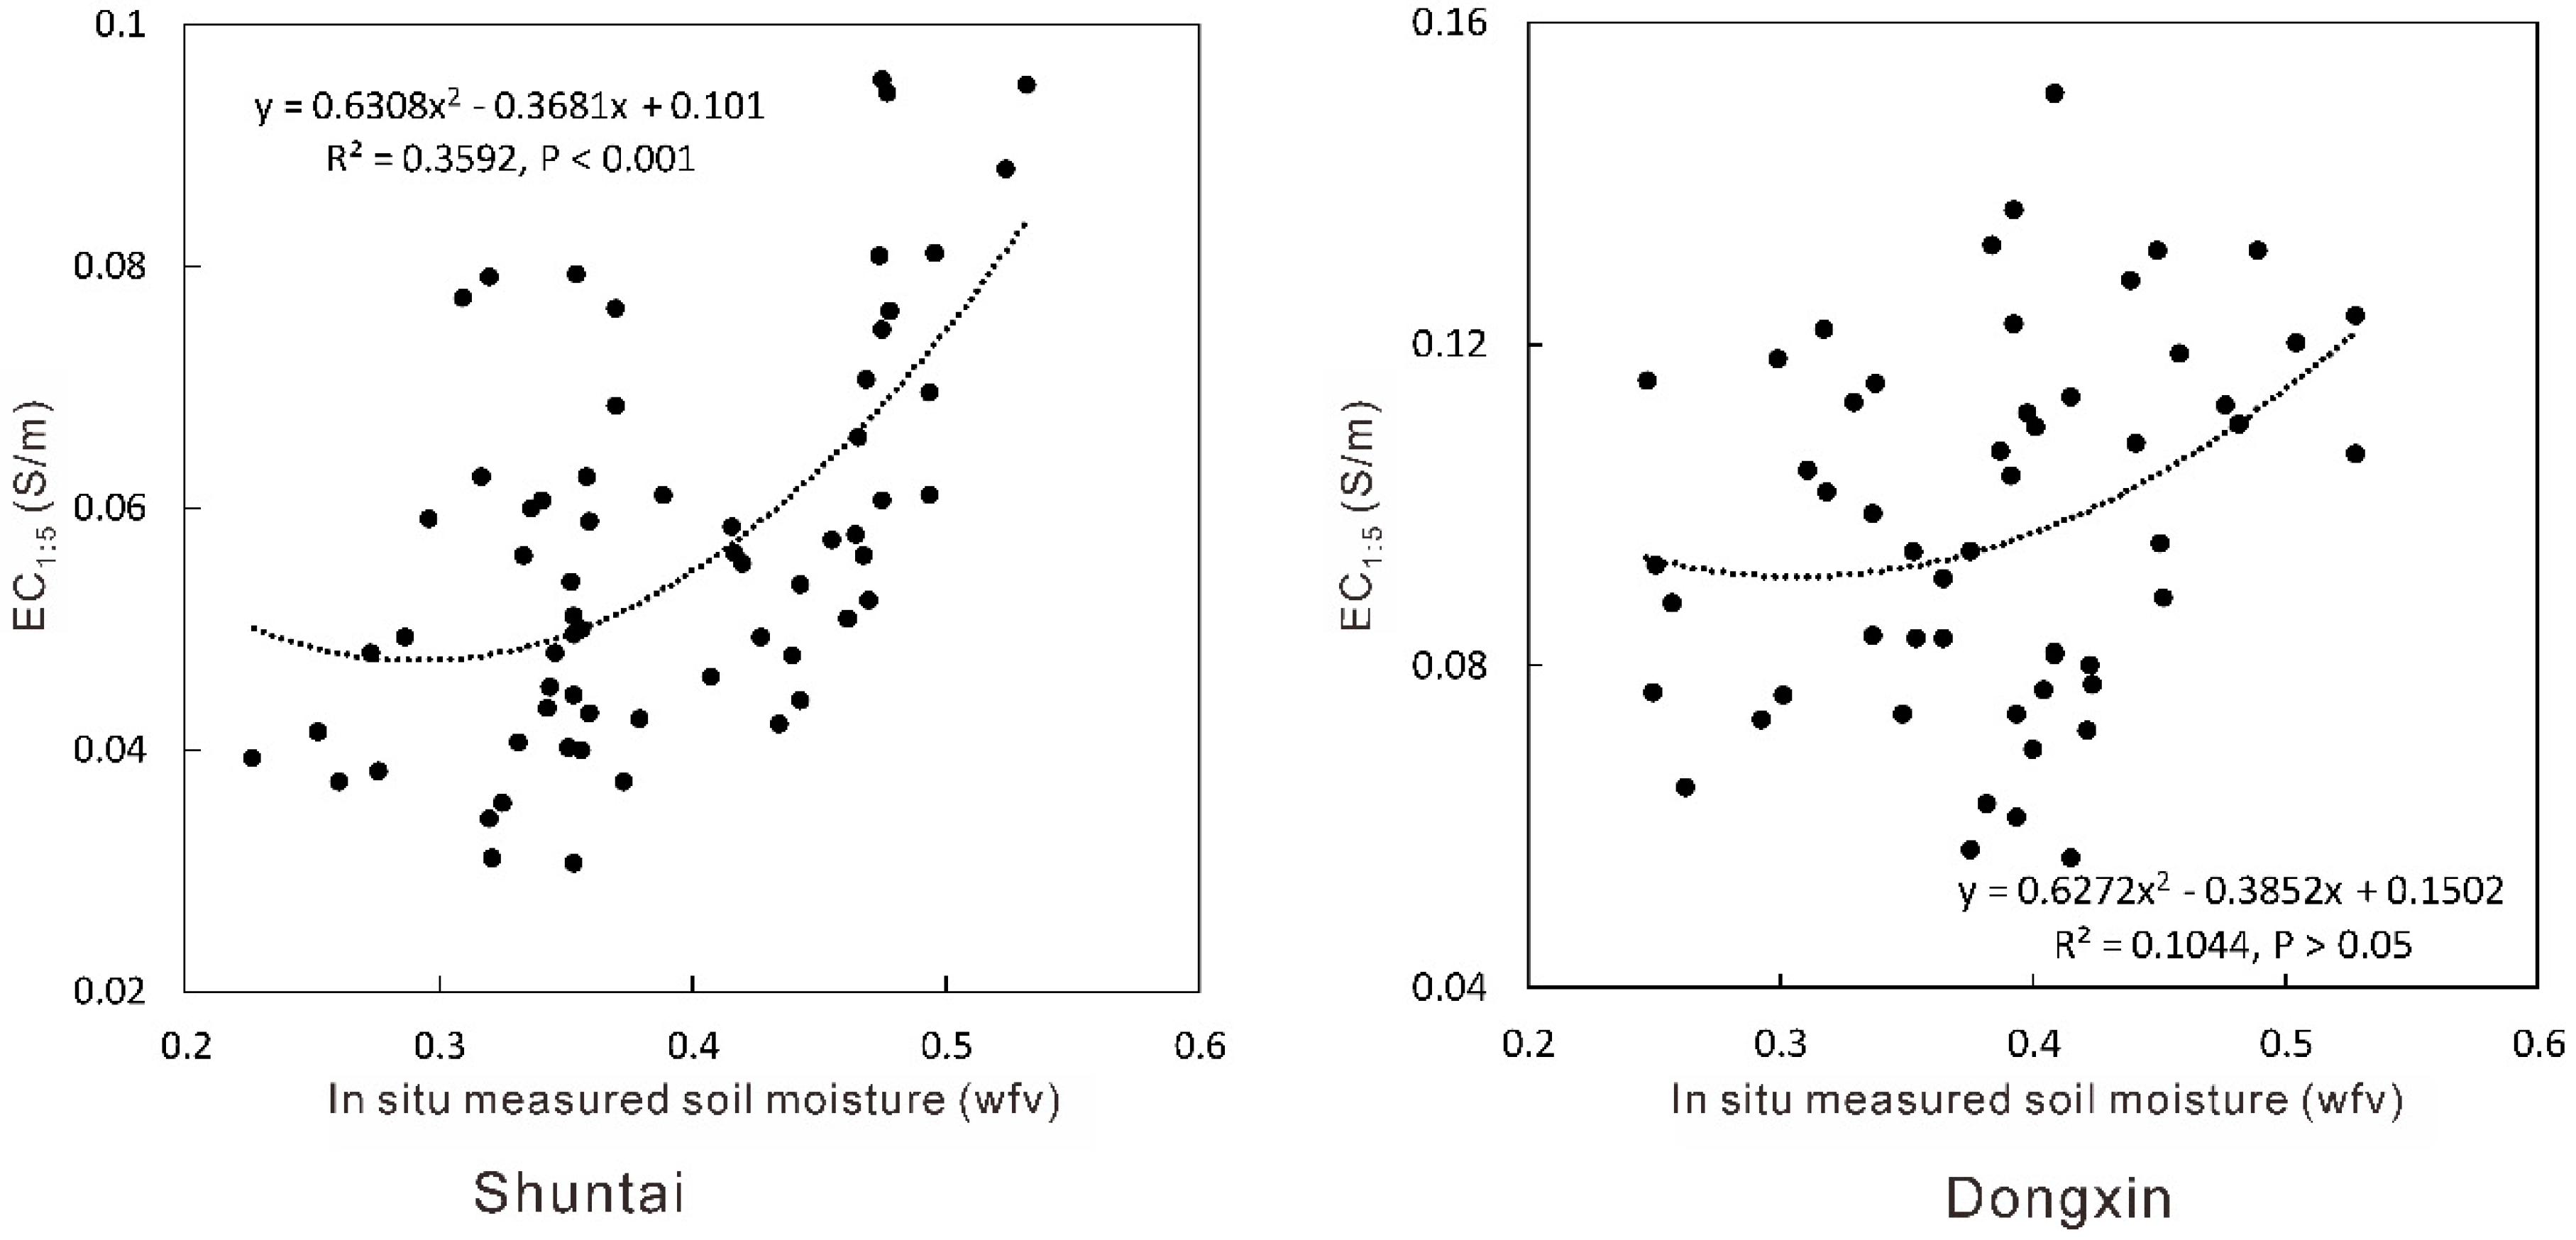
3.2. Relationships between Soil Moisture and EC1:5

Figure 3 shows that EC1:5 exhibited positive correlation with in situ measured soil moisture in Shuntai. However, soil moisture only explained 35.9% of the variability in EC1:5 using a polynomial model. In Dongxin, EC1:5 did not exhibit significant correlation with in situ measured soil moisture (p > 0.05).

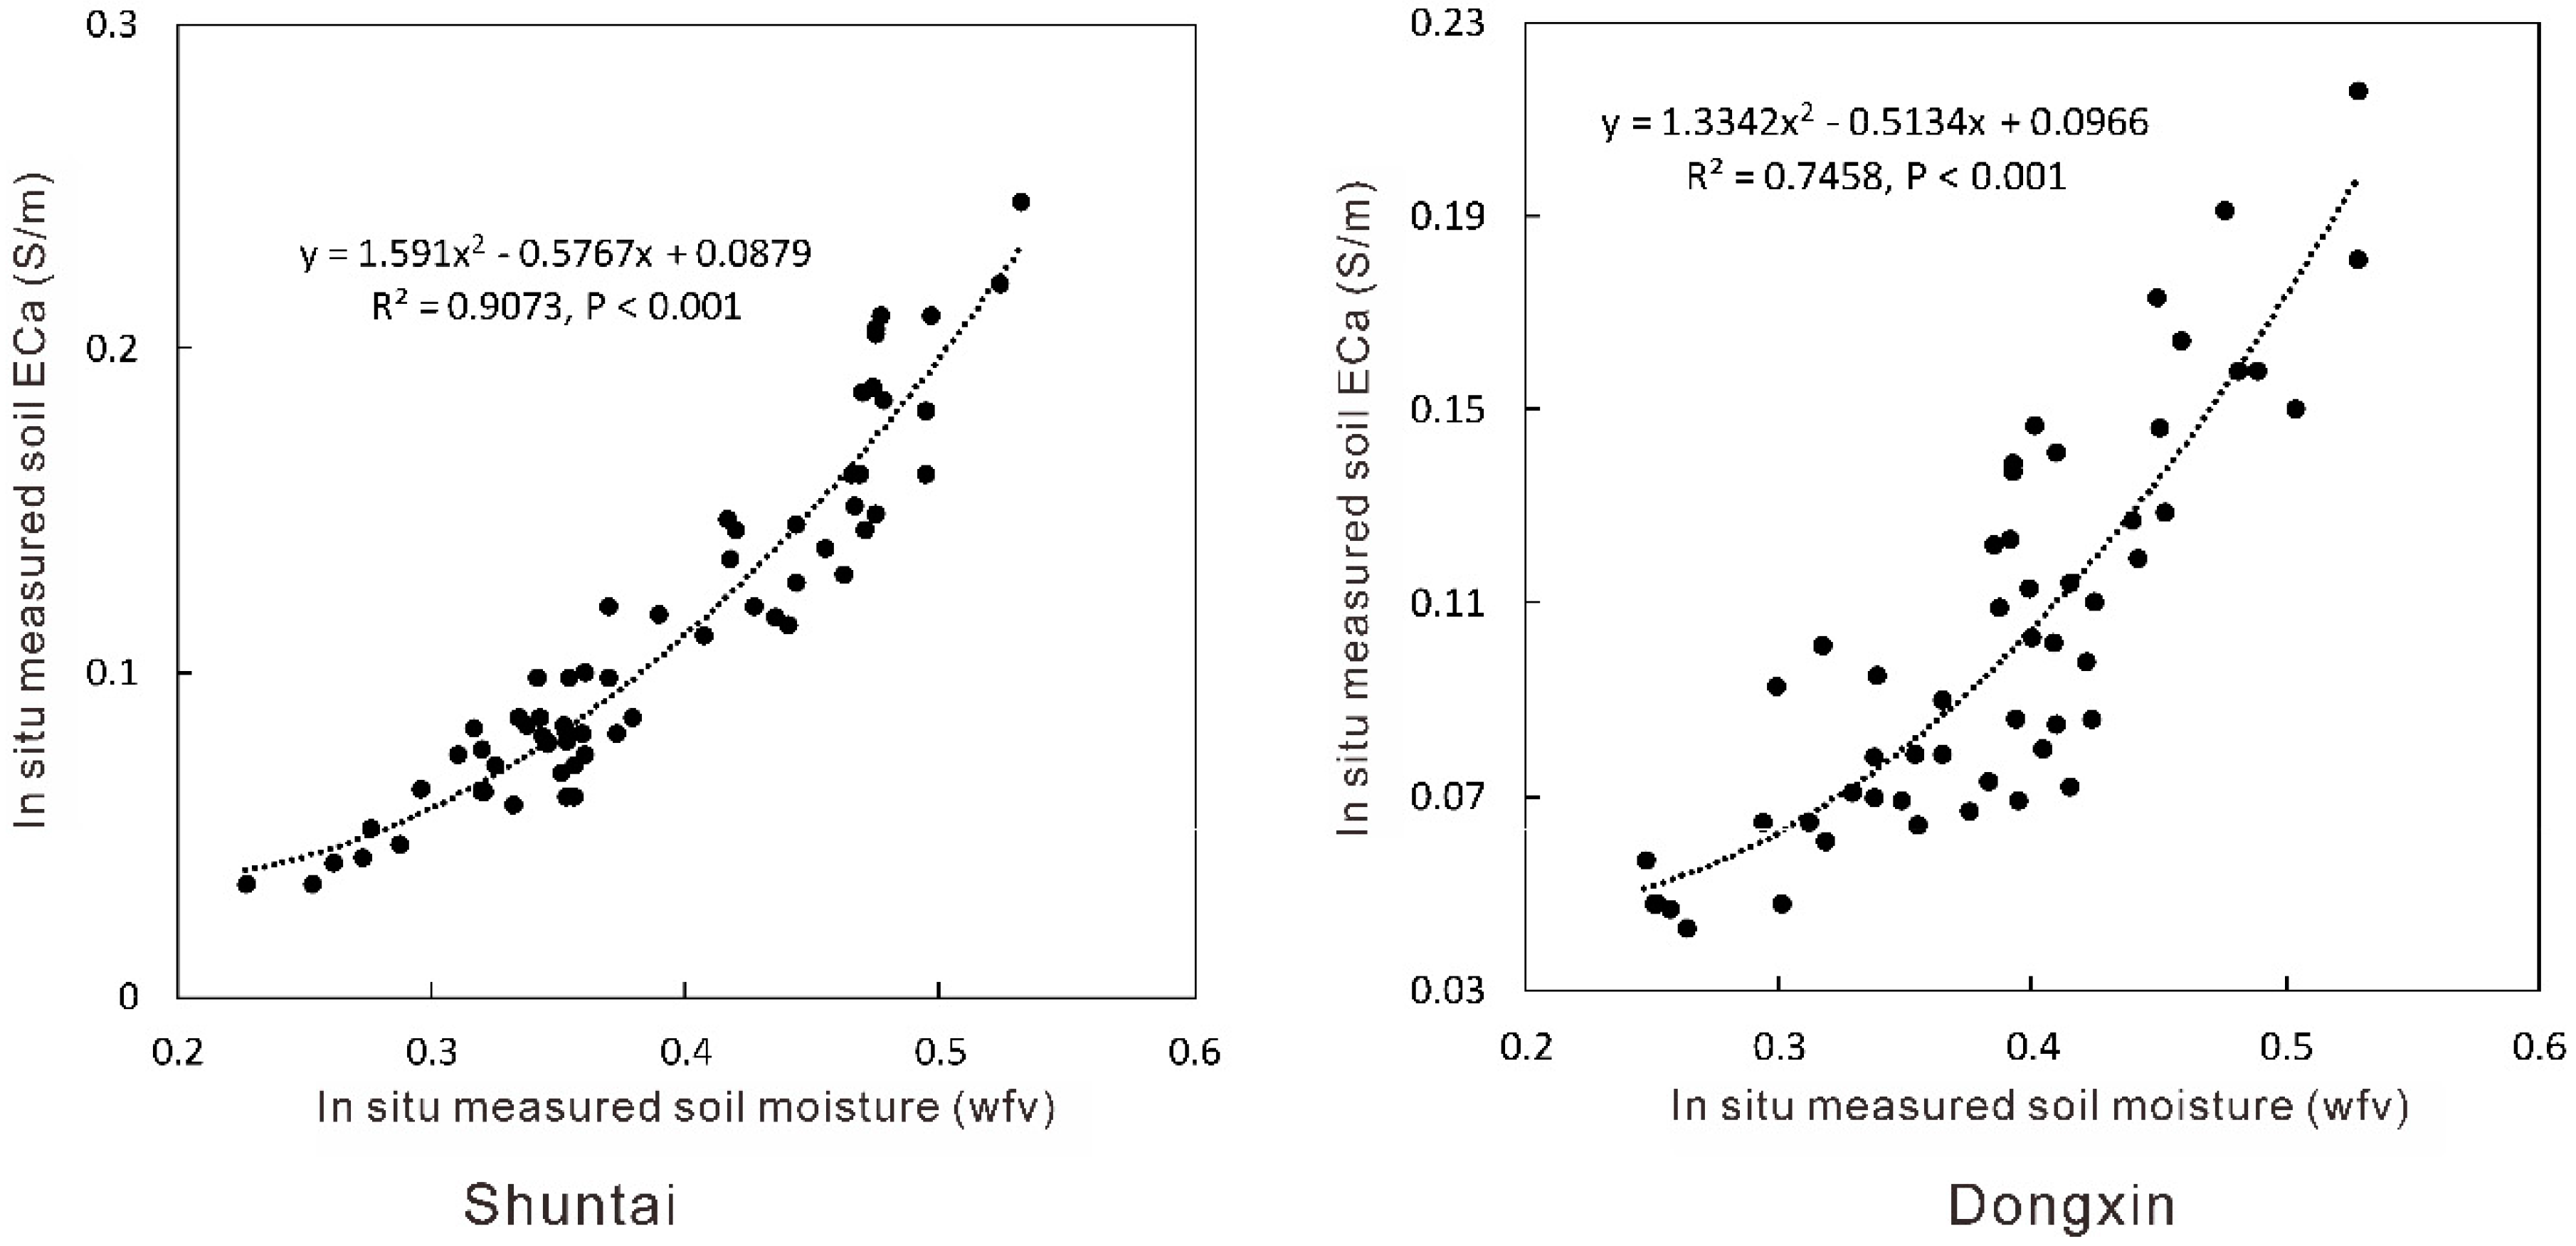
3.3. Relationships between Soil Moisture and ECa

In situ measured soil ECa exhibited strong positive correlations with in situ measured soil moisture in both study areas (Figure 4). Soil moisture explained 90.7 and 74.6% of variability in ECa using polynomial models in Shuntai and Dongxin, respectively. Hence, in situ measured ECa was largely impacted by soil moisture, rather than by soil salinity.
Although previous studies estimated soil salinity directly from in situ measured ECa [26,27,28,29], the results were valid only when soil salinity was the main factor influencing ECa [22,23,25]. In this study, soil moisture had a critical impact on the measured ECa for both study areas. Therefore, the effects of soil moisture must be taken into consideration in order to achieve accurate estimates of EC1:5 from ECa.
The study by Ghany et al. [36] in the middle Nile Delta reported that ECe and ECa were not significantly correlated. After classifying the samples into four groups based on their soil moisture values, the relationships between ECe and ECa became significant, and the relationships developed for each specific group were able to estimate ECe from its respective ECa. Metternicht and Zinck [2] also suggested the establishment of proper calibrations between ECa and ECe values for specific soil moisture conditions. However, even if samples are classified into several groups according to their soil moisture levels, there are still different soil moisture values within each group. Hence, a practical and accurate soil ECe and EC1:5 estimation model should take into account the individual soil moisture values.

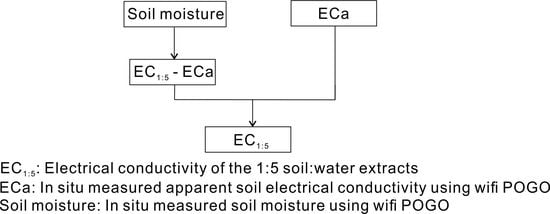
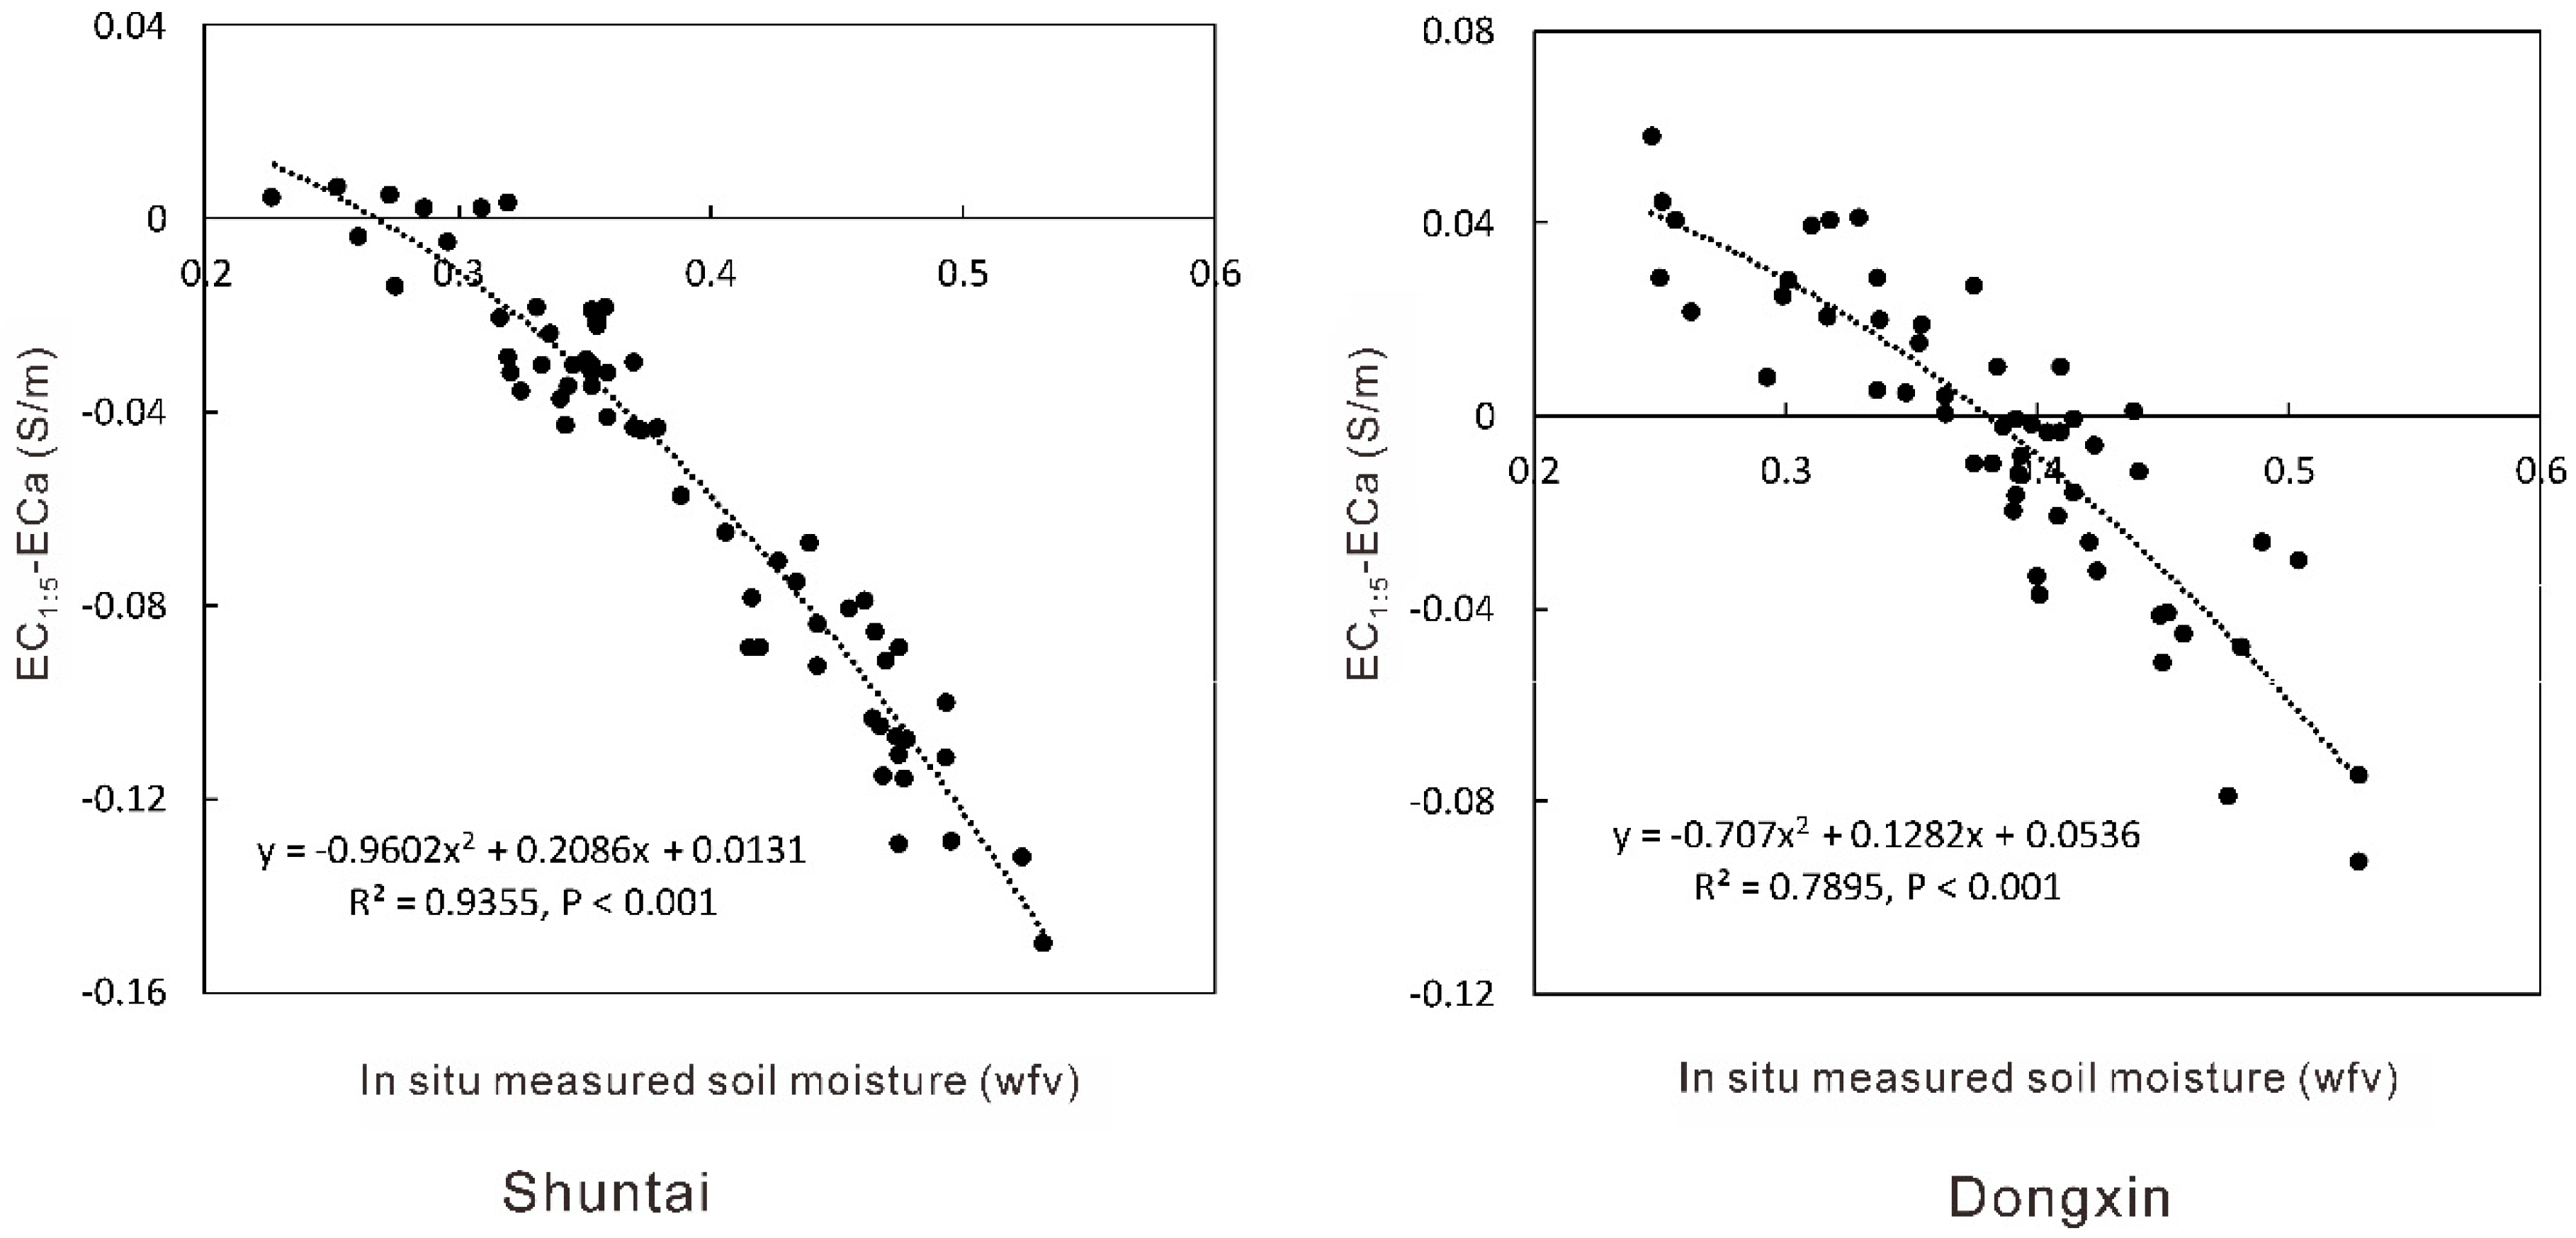
3.4. Relationships between Soil Moisture and EC1:5-ECa

EC1:5-ECa exhibited strong negative correlations with soil moisture for both study areas (Figure 5). Soil moisture explained 93.6 and 79.0% of variability in EC1:5-ECa using polynomial models in Shuntai and Dongxin, respectively. In other words, the difference between soil salinity and in situ measured ECa was dominated by soil moisture.
This suggests that soil moisture increased the ECa values at a specific soil salinity level, which was consistent with the findings by Hanson et al. [37]. More importantly, this study found that soil moisture explained 93.6 and 79.0% of the variability in EC1:5-ECa depending on the study area. Thus, incorporation of the in situ measured soil moisture into the modeling approach can lead to increased accuracy in estimating EC1:5-ECa. Subsequently, EC1:5 can be derived from in situ measured soil ECa with soil moisture incorporated.
Although EC1:5-ECa had strong curvilinear relationships with soil moisture, the regression coefficients were different between the two study areas, confirming the effects of soil type on ECa [21,38].

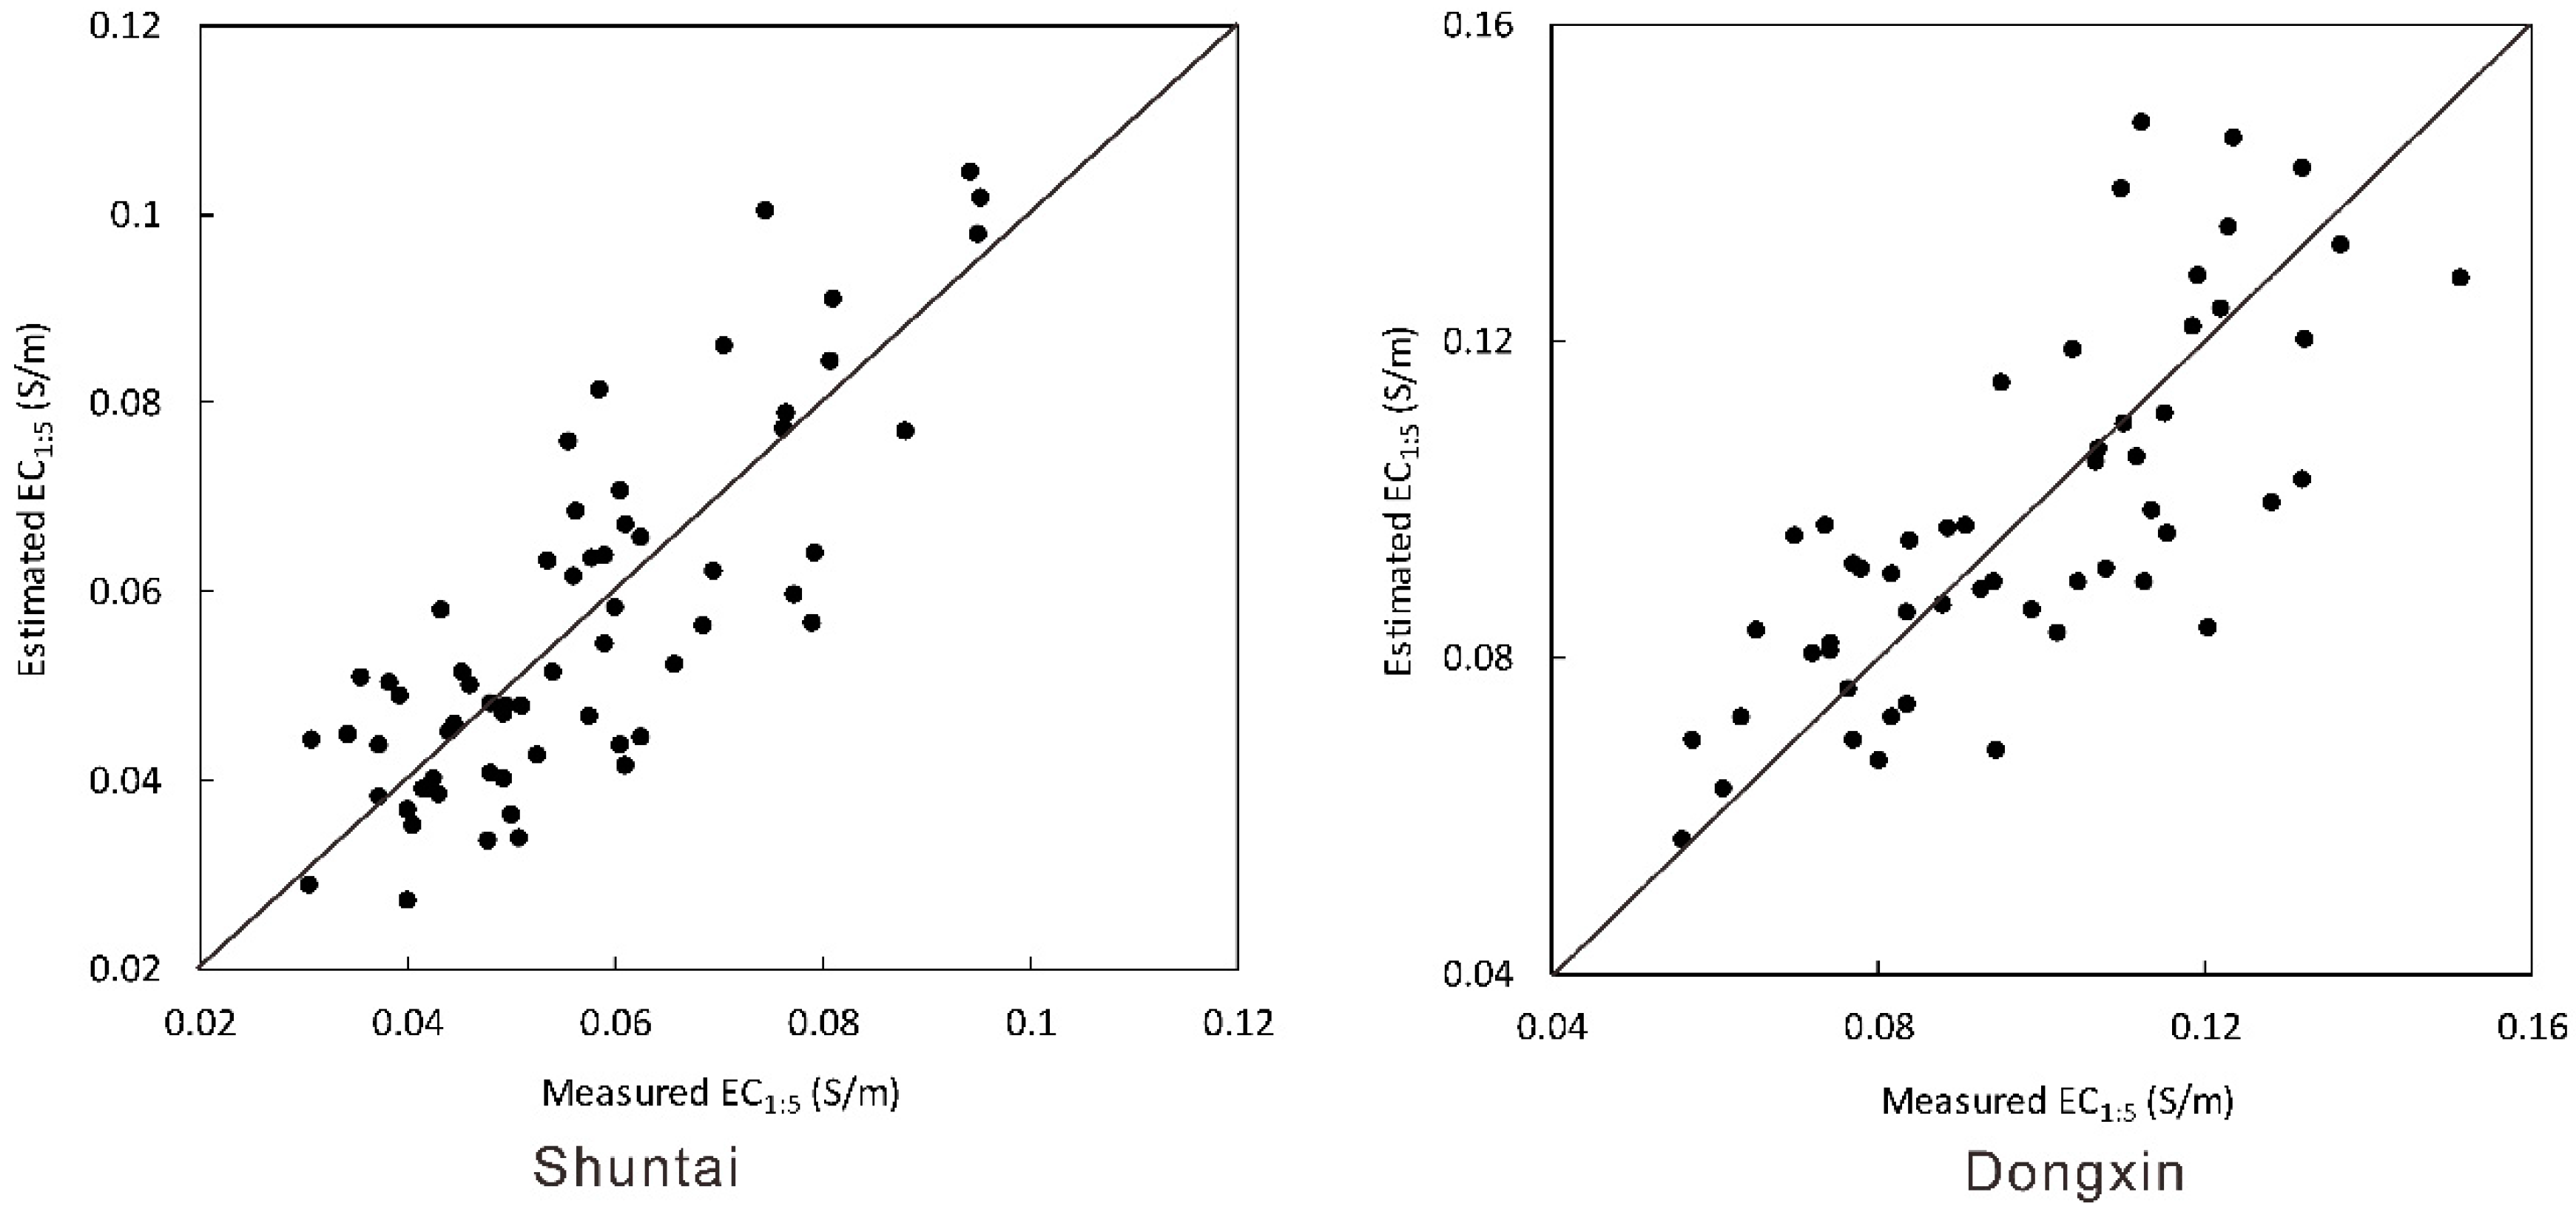
3.5. Deriving EC1:5 from In Situ Measured Soil ECa and Moisture

Since EC1:5-ECa was dominated by soil moisture, EC1:5-ECa can be accurately estimated from in situ measured soil moisture. In other words, EC1:5 can be determined from soil ECa and soil moisture, both of which were measured in situ using Wifi POGO.
Using LOOCV, a polynomial relationship was established between EC1:5-ECa and soil moisture for Shuntai as follows:
EC1:5-ECa = −0.959843202 × moisture2 + 0.208238812 × moisture + 0.013183444
where EC1:5-ECa is in S/m, moisture is in wfv, R2 = 0.94, P < 0.001 and n = 64.
For Dongxin, a polynomial relationship using LOOCV was also established between EC1:5-ECa and soil moisture as follows:
EC1:5-ECa = −0.706711836 × moisture2 + 0.128015443 × moisture + 0.053617606
where EC1:5-ECa is in S/m, moisture is in wfv, R2 = 0.79, P < 0.001 and n = 54.
Then, EC1:5 can be calculated using the measured ECa. The scatter plots of measured EC1:5 against estimated EC1:5 show that the data points are close to the 1:1 line (Figure 6). The achieved RMSE and RRMSE were 0.0109 S/m and 19.24%, respectively in Shuntai, and 0.0157 S/m and 16.05%, respectively in Dongxin.
Overall, in humid saline coastal regions, such as those of eastern China, fields exhibit large heterogeneity in soil moisture. As ECa is dominated by soil moisture, omitting soil moisture variations will lead to biased ECe or EC1:5 estimates. The newly proposed method incorporates soil moisture values directly from in situ measurement into the equation, which is easier for operational implementations than the approaches in previous studies that require classifying soil moisture conditions into discrete categories (e.g., [36]) or establish a proper regression for a specific soil moisture level to convert ECa to ECe or EC1:5 (e.g., [2]).
It should be noted that the new method only incorporated the dominant factor of soil moisture into the model, and other ECa impacting factors such as soil organic matter and metal contents are not considered [24,39].

4. Conclusions

In situ measured soil ECa was largely controlled by soil moisture rather than soil salinity (i.e., EC1:5) in both study areas in saline coastal regions of east China. Under such condition, ECa alone could not be used to accurately estimate soil salinity. This study found that the difference between soil salinity and in situ measured ECa (i.e., EC1:5-ECa) was largely affected by soil moisture. Their relationship could be fitted by polynomial models. Such relationship allows for accurate estimation of soil EC1:5 from soil ECa and soil moisture, both of which can be measured in situ using a Wifi POGO soil sensor.
Although the coefficients of the developed polynomial regression models vary with soil types, the method developed in this study is feasible for applications in saline coastal regions of eastern China. It is anticipated that future research will include further validation of this method over other soil types to broaden the validity range of the model. In addition, other soil properties such as organic matter and metal contents will also be incorporated into the model to further improve the estimation accuracy of soil salinity.

Author Contributions

Conceptualization, J.W.; formal analysis, J.W.; funding acquisition, J.W. and Q.D.; investigation, J.W. and G.Z.; methodology, J.W.; supervision, J.W. and Q.D.; visualization, J.W, Q.S., F.W.; writing—original draft, J.W., J.S., Q.S., and J.Z.; writing—review and editing, J.W. and J.S. All authors have read and agreed to the published version of the manuscript.

Funding

This research was funded by Natural Science Foundation of Jiangsu Province, China (grant no. BK20171286), Ministry of Science and Technology of China (project no. 2015BAD01B03), the Key Research and Development Program of Jiangsu Province, China (project no. BE2015337-11), and the Priority Academic Program Development of Jiangsu Higher Education Institutions (PAPD), China.

Acknowledgments

Special thanks to Zhigao Cao, Shuntai Farm, and Hongyan Du, Dongxin Farm, Jiangsu, for their kind help when we looked for study area.

Conflicts of Interest

The authors declare no conflict of interest.

References

  1. Ghassemi, F.; Jakeman, A.J.; Nix, H.A. Salinisation of Land and Water Resources: Human Causes, Extent, Management and Case Studies; CAB International: Wallingford, UK, 1995. [Google Scholar]
  2. Metternicht, G.I.; Zinck, J.A. Remote sensing of soil salinity: Potentials and constraints. Remote Sens. Environ. 2003, 85, 1–20. [Google Scholar] [CrossRef]
  3. Wang, J.L.; Huang, X.J.; Zhong, T.Y.; Chen, Z.G. Review on sustainable utilization of salt-affected land. Acta Geogr. Sin. 2011, 66, 673–684. (In Chinese) [Google Scholar]
  4. Vaid, N.; Pandey, P.; Srivastava, V.K.; Tuteja, N. Pea lectin receptor-like kinase functions in salinity adaptation without yield penalty, by alleviating osmotic and ionic stresses and upregulating stress responsive genes. Plant Mol. Biol. 2015, 88, 193–206. [Google Scholar] [CrossRef] [PubMed]
  5. Omisun, T.; Sahoo, S.; Saha, B.; Panda, S.K. Relative salinity tolerance of rice cultivars native to north east India: A physiological, biochemical and molecular perspective. Protoplasma 2018, 255, 193–202. [Google Scholar] [CrossRef] [PubMed]
  6. Munns, R.; Tester, M. Mechanisms of salinity tolerance. Annu. Rev. Plant Biol. 2008, 59, 651–681. [Google Scholar] [CrossRef] [PubMed] [Green Version]
  7. Ghosh, B.; Md, N.A.; Gantait, S. Response of rice under salinity stress: A review update. Rice Res. Open Access 2016, 4, 167. [Google Scholar] [CrossRef] [Green Version]
  8. Kargas, G.; Chatzigiakoumis, I.; Kollias, A.; Spiliotis, D.; Kerkides, P. An investigation of the relationship between the electrical conductivity of the soil saturated paste extract ece with the respective values of the mass soil/water ratios 1:1 and 1:5 (EC1:1 and EC1:5). Proceedings 2018, 2, 661. [Google Scholar] [CrossRef] [Green Version]
  9. Shrivastava, P.; Kumar, R. Soil salinity: A serious environmental issue and plant growth promoting bacteria as one of the tools for its alleviation. Saudi J Biol. Sci. 2015, 22, 123–131. [Google Scholar] [CrossRef] [Green Version]
  10. United States Department of Agriculture. Diagnoses and Improvement of Saline and Alkali Soils; Agriculture Handbook No 60; USSL: Riverside, CA, USA, 1954.
  11. Rhoades, J.D.; Manteghi, N.A.; Shouse, P.J.; Alves, W.J. Estimating soil salinity from saturated soil-paste electrical conductivity. Soil Sci. Soc. Am. J. 1989, 53, 428–433. [Google Scholar] [CrossRef] [Green Version]
  12. Longenecker, D.E.; Lyerly, P.J. Making soil pastes for salinity analysis: A reproducible capillary procedure. Soil Sci. 1964, 97, 268–275. [Google Scholar] [CrossRef]
  13. He, Y.; Desutter, T.; Hopkins, D.; Jia, X.; Wysocki, D.A. Predicting ECe of the saturated paste extract from value of EC1:5. Can. J. Soil Sci. 2013, 93, 585–594. [Google Scholar] [CrossRef]
  14. Khorsandi, F.; Yazdi, F.A. Gypsum and texture effects on the estimation of saturated paste electrical conductivity by two extraction methods. Commun. Soil Sci. Plan Anal. 2007, 38, 1105–1117. [Google Scholar] [CrossRef]
  15. Amakor, X.N.; Cardon, G.E.; Symanzik, J.; Jacobson, A.R. A new electromagnetic induction calibration model for estimating low range salinity in calcareous soils. Soil Sci. Soc. Am. J. 2013, 77, 985–1000. [Google Scholar] [CrossRef]
  16. Johnston, M.; Savage, M.; Moolman, J.; du Plessis, H. Evaluation of calibration methods for interpreting soil salinity from electromagnetic induction measurements. Soil Sci. Soc. Am. J. 1997, 61, 1627–1633. [Google Scholar] [CrossRef]
  17. Valdes, R.; Miralles, J.; Franco, J.A.; Sanchez-Blanco, M.J.; Banon, S. Using soil bulk electrical conductivity to manage saline irrigation in the production of potted poinsettia. Sci. Hortic. 2014, 170, 1–7. [Google Scholar] [CrossRef]
  18. Li, H.; Shi, Z.; Wu, C.; Li, F.; He, F. EM38-based in-situ determination of electrical conductivity of coastal saline soil in profile. Acta Pedol. Sin. 2013, 6, 1231–1235. [Google Scholar]
  19. Gebbers, R.; Luck, E.; Dabas, M.; Domsch, H. Comparison of instruments for geoelectrical soil mapping at the field scale. Near Surf. Geophys. 2009, 179–190. [Google Scholar] [CrossRef]
  20. Eldeiry, A.A.; Garcia, L.A. Evaluating the performance of ordinary kriging in mapping soil salinity. J. Irrig. Drain. Eng. 2012, 138, 1046–1059. [Google Scholar] [CrossRef]
  21. Doolittle, J.A.; Brevik, E.C. The use of electromagnetic induction techniques in soils studies. Geoderma 2014, 223, 33–45. [Google Scholar] [CrossRef] [Green Version]
  22. Williams, B.G.; Baker, G. An electromagnetic induction technique for reconnaissance surveys of soil salinity hazards. Soil Res. 1982, 20, 107–118. [Google Scholar] [CrossRef]
  23. Sun, R.Y. Experimental survey for the effects of soil water content and soil salinity on soil electrical conductivity. J. China Agric. Univ. 2000, 5, 39–41, (In Chinese with English abstract). [Google Scholar]
  24. Farahani, H.J.; Buchleiter, G.W.; Brodahl, M.K. Characterization of apparent soil electrical conductivity variability in irrigated sandy and non-saline fields in Colorado. Am. Soc. Agric. Eng. 2005, 48, 155–168. [Google Scholar] [CrossRef]
  25. Heil, K.; Schmidhalter, U. The application of EM38: Determination of soil parameters, selection of soil sampling points and use in agriculture and archaeology. Sensors 2017, 17, 2540. [Google Scholar] [CrossRef] [PubMed] [Green Version]
  26. Slavich, P.G.; Petterson, G.H. Estimating average rootzone salinity from electromagnetic induction (EM-38) measurements. Aust. J. Soil Res. 1990, 28, 453–463. [Google Scholar] [CrossRef]
  27. Triantafilis, J.; Laslett, G.M.; McBratney, A.B. Calibrating an electromagnetic induction instrument to measure salinity in soil under irrigated cotton. Soil Sci. Soc. Am. J. 2000, 64, 1009–1017. [Google Scholar] [CrossRef]
  28. Yao, R.J.; Yang, J.S.; Liu, G.M. Calibration of soil electromagnetic conductivity in inverted salinity profiles with an integration method. Pedosphere 2007, 17, 246–256. [Google Scholar] [CrossRef]
  29. Lesch, S.M. Statistical models for the prediction of field-scale and spatial salinity patterns from soil conductivity survey data. In Agricultural Salinity Assessment and Management; Wallender, W.W., Tanji, K.K., Eds.; ASCE: Reston, VA, USA, 2012. [Google Scholar]
  30. Yan, K.; Jiang, Y.; Tang, J.; Dai, Q. Effects of nitrogen fertilizer rate and transplanting density on yield and grain quality of rice on saline-alkaline land. Chin. Soils Fert. 2018, 2, 67–74, (In Chinese with English Abstract). [Google Scholar]
  31. Xu, Z.; Zuo, P.; Wang, J.; Gao, Z.; Wu, Q. Changes of vegetation carbon storage in yancheng coastalwetlands for six periods. Wetl. Sci. 2014, 12, 709–713, (In Chinese with English Abstract). [Google Scholar]
  32. Meng, Q.D.; Du, H.Y. Effects of different nitrogen application levels on agronomic traits and nitrogen use efficiency (NUE) of paddy rice. Agric. Sci. Jiangsu 2013, 41, 46–48. (In Chinese) [Google Scholar]
  33. Chen, J. Characteristics of drought and its strategy of mitigation in Lianyungang, Jiangsu. Chin. Flood Drought Manag. 2013, 5, 28–30. (In Chinese) [Google Scholar]
  34. Yao, R.J.; Yang, J.S.; Wu, D.H.; Xie, W.P.; Cui, S.Y.; Wang, X.P.; Yu, S.P.; Zhang, X. Determining soil salinity and plant biomass response for a farmed coastal cropland using the electromagnetic induction method. Comput. Electron. Agric. 2015, 119, 241–253. [Google Scholar] [CrossRef]
  35. Bouvier, M.; Durrieu, S.; Fournier, R.A.; Renaud, J.P. Generalizing predictive models of forest inventory attributes using an area-based approach with airborne LiDAR data. Remote Sens. Environ. 2015, 156, 322–334. [Google Scholar] [CrossRef]
  36. Ghany, A.H.; Omara, A.M.; El Nagar, M.A. Testing Electromagnetic Induction Device (EM 38) Under Egyptian Conditions; Vlotman, W.F., Ed.; EM38 Workshop: New Delhi, India, 2000. [Google Scholar]
  37. Hanson, B.R.; Kaita, K. Response of electromagnetic conductivity meter to soil salinity and soil-water content. J. Irrig. Drain. Eng. 1997, 123, 141–143. [Google Scholar] [CrossRef]
  38. Corwin, D.L.; Lesch, S.M. Apparent soil electrical conductivity measurements in agriculture. Comput. Electron. Agric. 2005, 46, 11–43. [Google Scholar] [CrossRef]
  39. Rana, L.; Dhankhar, R.; Chhikara, S. Soil characteristics affected by long term application of sewage wastewater. Int. J. Environ. Res. 2010, 4, 513–518. [Google Scholar]
Figure 1. Locations of the two study areas in the east coast of China and schemes of sampling site arrangement at each area.
Remotesensing 12 00239 g001
Figure 2. Relationships between EC1:5 and in situ measured soil ECa for the two study sites.
Remotesensing 12 00239 g002
Figure 3. Relationships between EC1:5 and in situ measured soil moisture for the two study sites.
Remotesensing 12 00239 g003
Figure 4. Relationships between in situ measured soil ECa and in situ measured soil moisture for the two study sites.
Remotesensing 12 00239 g004
Figure 5. Relationships between EC1:5-ECa (i.e., the difference between EC1:5 and in situ measured soil ECa) and in situ measured soil moisture for the two study sites.
Remotesensing 12 00239 g005
Figure 6. Comparison between the estimated EC1:5 and the measured EC1:5 from the leave-one-out cross-validation (LOOCV) of the two study areas. The diagonal lines show the 1:1 relationship.
Remotesensing 12 00239 g006
Table 1. Soil type and average, minimum and maximum values of soil moisture, apparent electrical conductivity (ECa) and electrical conductivity of the soil extract (EC1:5) for the two studied areas.
Study AreaSoil TextureSample Number Moisture (wfv)ECa (S/m)EC1:5 (S/m)
Shuntaisalty 64Min0.2270.0350.031
sandy Max0.5320.2450.095
loam Mean0.3880.1120.056
Dongxinsalty54Min0.2470.0430.056
clay Max0.5280.2160.151
soil Mean0.3840.1020.098
Note: Soil moisture and ECa are measured using the Wifi POGO in situ, and EC1:5 was measured in the laboratory.

