Article

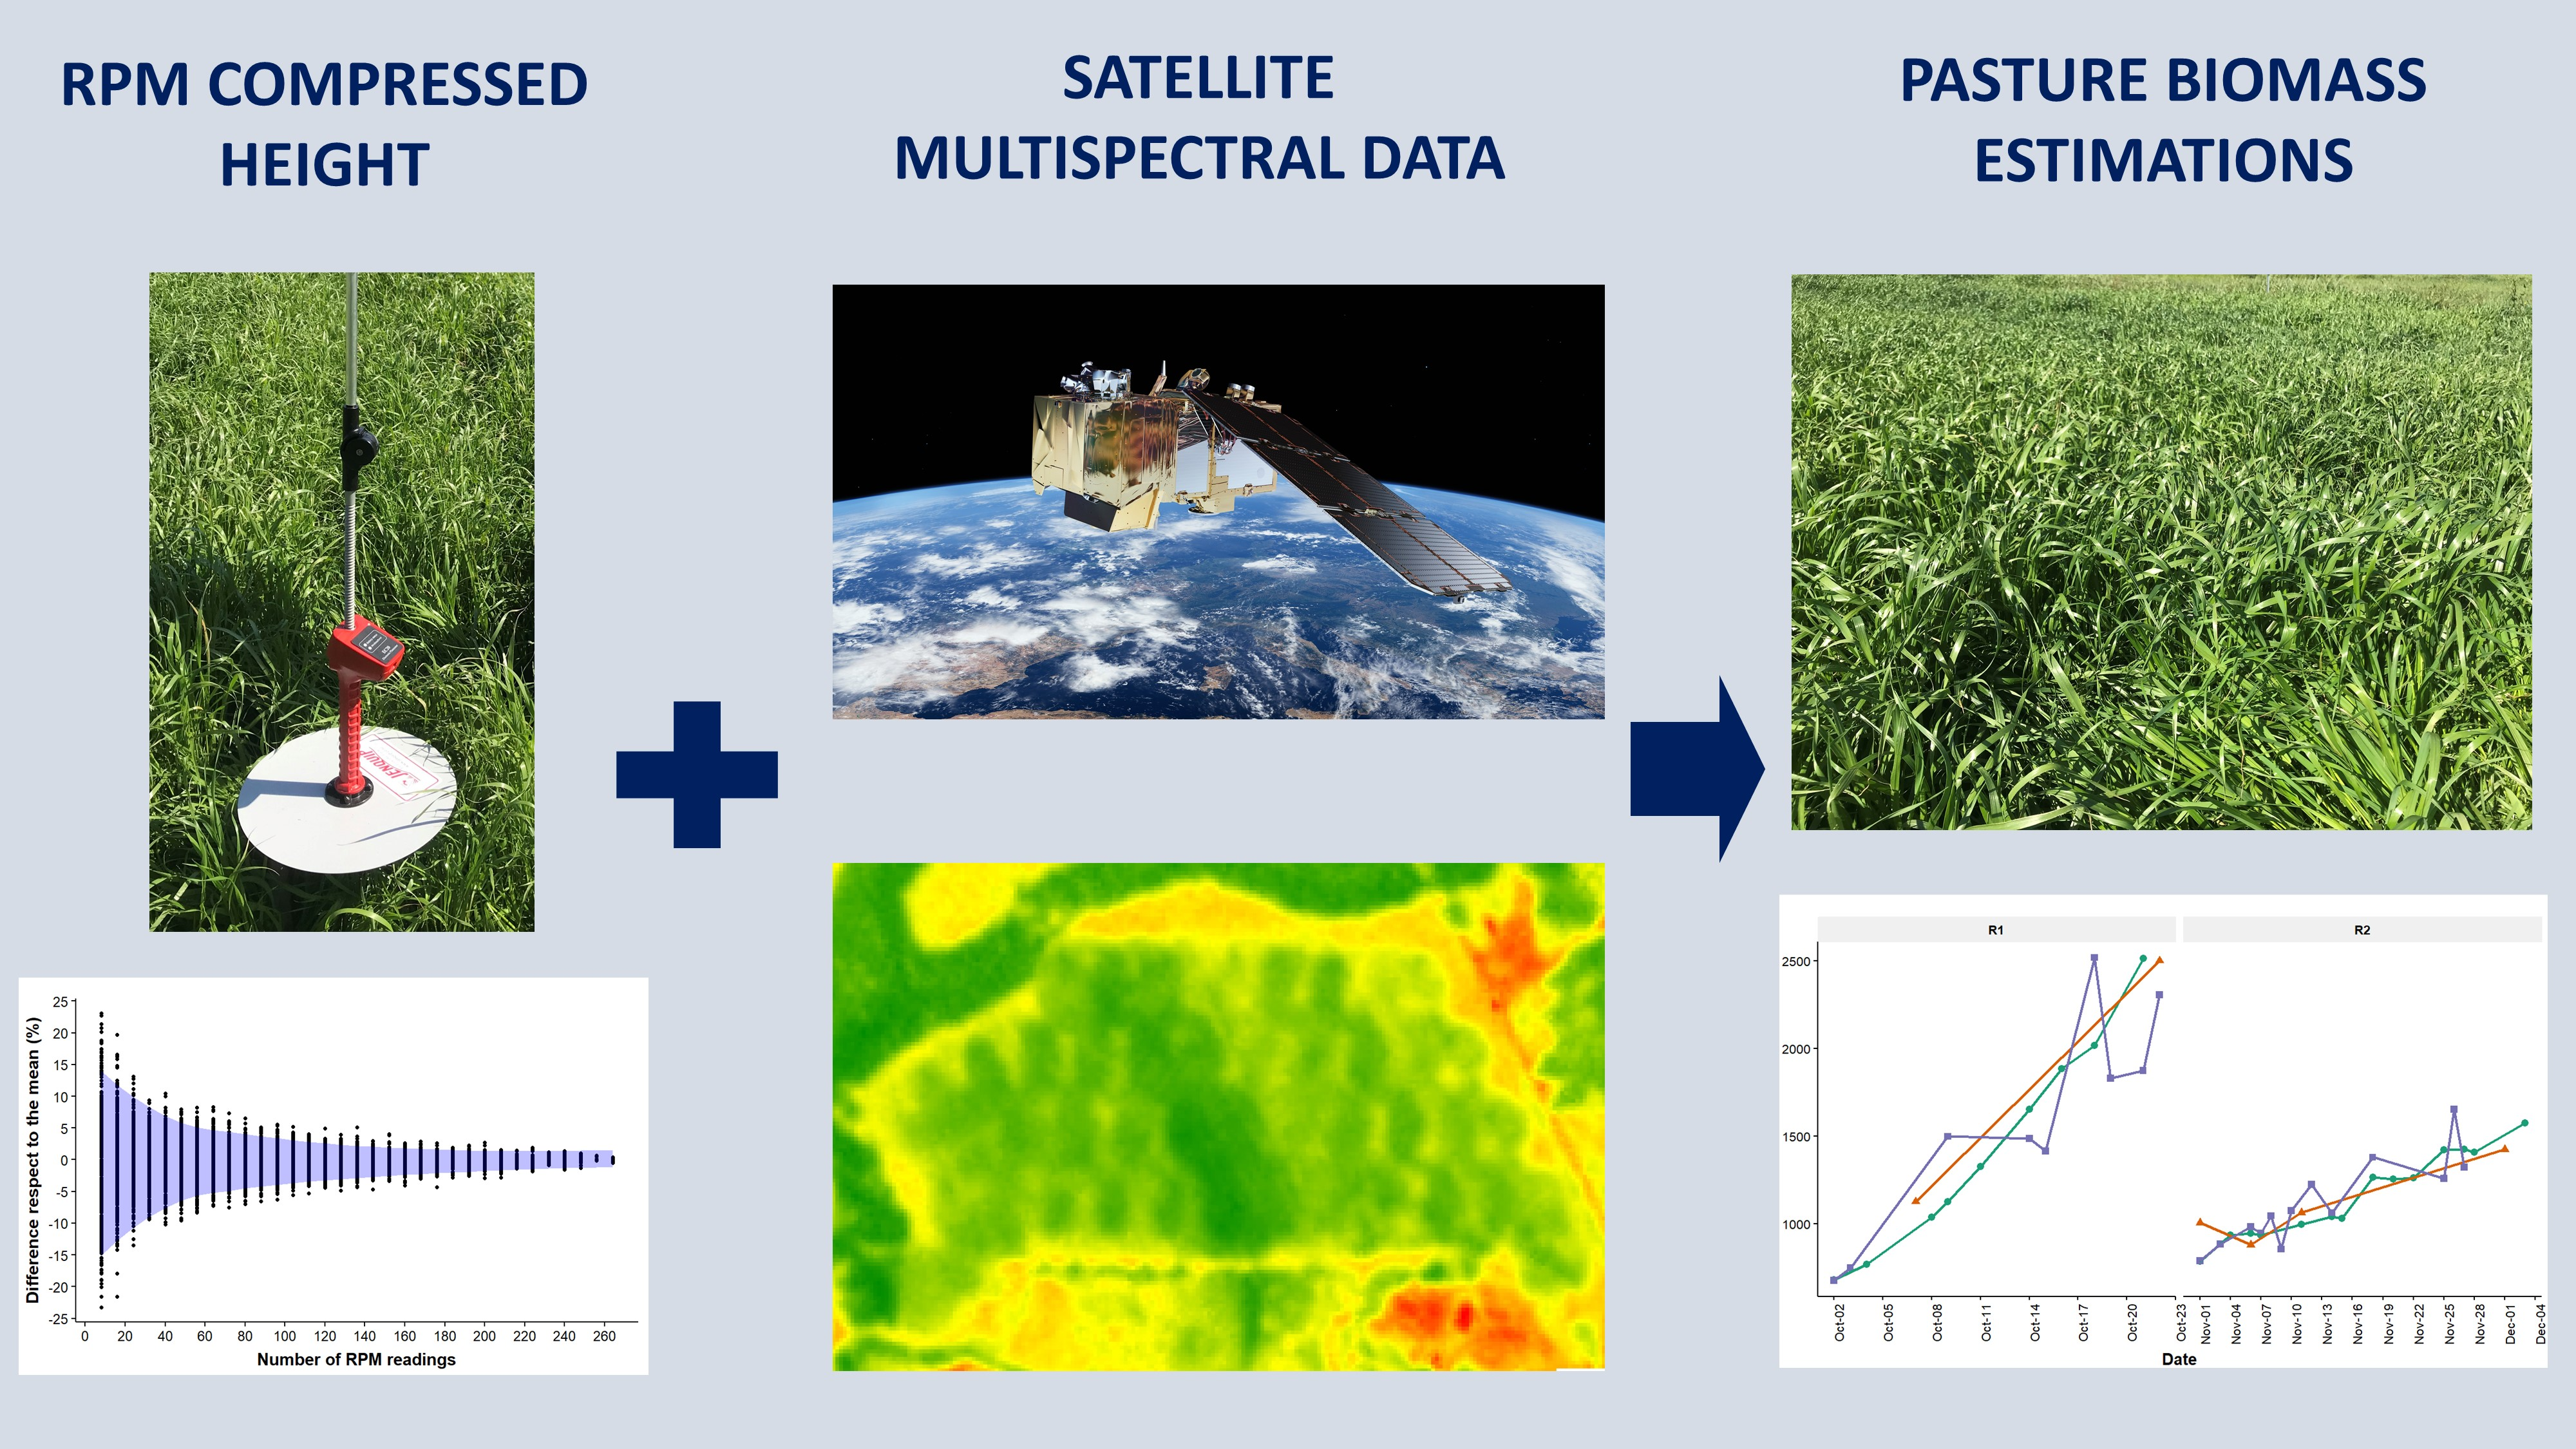
Spatial and Temporal Pasture Biomass Estimation Integrating Electronic Plate Meter, Planet CubeSats and Sentinel-2 Satellite Data

1
Dairy Science Group, Livestock Production and Welfare Group, School of Life and Environmental Sciences, Faculty of Science, The University of Sydney, Camden, NSW 2567, Australia
2
NSW Department of Primary Industries, Menangle, NSW 2568, Australia
3
Agronomy and Agro-Industry, UniLaSalle, 60000 Beauvais, France
4
Local Land Services, Hunter, Taree, NSW 2430, Australia
*
Author to whom correspondence should be addressed.
Remote Sens. 2020, 12(19), 3222; https://doi.org/10.3390/rs12193222
Submission received: 24 August 2020 / Revised: 24 September 2020 / Accepted: 30 September 2020 / Published: 3 October 2020
(This article belongs to the Special Issue Digital Agriculture)

Abstract

:
There is a substantial opportunity to lift feed utilization and profitability on pasture-based dairy systems through both increased pasture monitoring accuracy and frequency. The first objective of this experiment was to determine the impact of the number of electronic rising plate meter (RPM) readings and walking pattern on the accuracy of the RPM to determine pasture biomass. The second objective was to evaluate current satellite technology (i.e., small CubeSats and traditional large satellites) in combination with the electronic RPM as an accurate tool for systematic pasture monitoring. The experiment was conducted from October to December 2019 at Camden, Australia. Two experimental paddocks, each of 1.1 ha, were sown with annual ryegrass and monitored with an electronic RPM integrated with Global Navigation Satellite System and with two different satellites (Planet CubeSats and Sentinel-2 satellite). Here we show that 70 RPM readings achieve a ± 5% error in the pasture biomass estimations (kg DM/ha), with no effect of the walking pattern on accuracy. The normalized difference vegetation index (NDVI) derived from satellites showed a good correlation with pasture biomass estimated using the electronic RPM (R2 0.74–0.94). Satellite pasture biomass and growth rate estimations were similar to RPM in one regrowth period but underestimated by ≈20% in the other. Our results also reveal that the accuracy of uncalibrated satellites (i.e., biomass estimated using NDVI to kg DM/ha standard equations) is low (R2 0.61, RMSE 566–1307 kg DM/ha). However, satellites calibrated with a RPM showed greater accuracy in the estimations (R2 0.72, RMSE 255 kg DM/ha). Current satellite technology, when used with the electronic RPM, has the potential to not only reduce the time required to monitor pasture biomass manually but provide finer scale measurements of pasture biomass within paddocks. Further work is required to test this hypothesis, both spatially and temporally.

Graphical Abstract

1. Introduction

Feed accounts for more than 50% of total dairy farm costs on average in Australia [1]. As the annual pasture utilization (pasture ingested per cows per hectare) is positively associated with profitability [2,3], methods to increase this utilization should improve the overall farm business performance. In this regard, there is a substantial opportunity for most commercial farms to lift profitability, given the large gap between current and potential pasture utilization [4,5,6]. Accurate measurement and allocation of pasture can increase milk production by ≈10%, mainly by utilizing the pasture that otherwise would be wasted [7]. However, the proportion of farms that conduct daily measurements of pasture for better grazing management decision making is small, and even fewer use or have any technology for this purpose [8].
From the technologies currently available for pasture monitoring, the rising plate meter (RPM) is the most used [9]. This device consists of a handle and a plate that slides over a shaft. When placed over the pasture canopy, it measures the height (in half centimeters) of the compressed pasture material between the plate and the ground. Compressed height is then converted into pasture biomass (kg DM/ha) using a calibration equation that changes according to pasture species and time of the year or season. As this technology requires an operator to walk across paddocks taking multiple measurements (usually weekly), it is often perceived by farmers and farm managers to be time-consuming and impractical for monitoring the whole farm [10]. Therefore, and given the variability in biomass that exists within a paddock [5,11], the challenge with RPM use is to obtain an accurate estimate of pasture biomass, minimizing labor requirements.
Regarding this, the minimum number of measurements required per paddock at a given time (i.e., RPM readings) impacts the accuracy of biomass estimation. Previous research conducted in New Zealand by García [12] showed that increasing the number of readings per paddock (to up to 90–100 readings) minimized the error of the average pasture biomass estimations (in comparison to the ‘true’average of that paddock). Other studies have estimated that the minimum readings needed is around 50 [13] and that between 50 and 80 readings are required to achieve the maximum accuracy [14]. However, none of these studies were designed specifically to answer which is the minimum number of readings per paddock required. Additionally, the impact of the walking pattern (routes) to use when taking the RPM readings remains unknown. A potential strategy would be to use a standard grid approach; however, in practice, farmers use more convenient patterns across paddocks to obtain a reliable estimate of pasture biomass while minimizing the duration of the task. Despite this, the association between the pattern of RPM use and the accuracy has not been explored previously. In this regard, the integration of the RPM with Global Navigation Satellite Systems (GNSS) and user-friendly mapping tools [15] provides new opportunities to efficiently collect and easily process large amounts of data to fill this knowledge gap.
In contrast to the RPM, the use of satellites for monitoring pastures allows dairy farmers to monitor large areas with little to no labor required. However, constraints associated with the pixel size (spatial resolution) and the frequency of data collection (temporal resolution) have prevented the more widespread application of this technology [16]. Additionally, there are other limitations such as the weather conditions (i.e., high cloud cover) that prevent optical satellite imagery from being used, or the saturation observed with high plant density when some specific vegetation indices are used [17]. Most of the previous research conducted in Australia and New Zealand used satellite images with relatively low temporal and spatial resolution [10,18,19,20]. This might not be adequate to achieve consistent and accurate pasture measurements that fulfill the farmer’s needs [21]. Recent improvements in spatial and temporal resolution, image processing and data analysis techniques, and image costs [22,23] position satellites as a potentially practical and reliable technology for monitoring pasture.
There is also a gap to further explore the integration of satellite-derived data with data from other sensors. In New Zealand, Romera et al. [24] proposed using a software tool that integrates weather data and historic pasture biomass to predict future pasture growth rate and biomass. The predictions could then be used to fill gaps of missing data, for example, when the satellite has a low temporal resolution or if images are not available due to high cloud cover. Additionally, research conducted in Australia suggested that pasture height measurements combined with vegetation indices could improve the accuracy of pasture biomass estimations [25,26]. These findings highlight that it might be possible to measure pasture height, for example, using an electronic RPM with a positioning system, and use it to calibrate the satellite data more efficiently and accurately.
The objectives of our experiment were two-fold. The first was to quantify the effect of the number of readings and the walking pattern on the accuracy of the electronic RPM to monitor pasture at a paddock level. The second was to assess current satellite technology in combination with the RPM as a tool for systematic pasture monitoring to reduce the requirement to walk the farm regularly. We hypothesized that there is a minimum number of plate readings that maximize accuracy that could be located between 50 and 100 readings, despite the walking pattern. Additionally, we hypothesized that current satellite technology could be utilized in combination with the electronic RPM to monitor pastures accurately.

2. Materials and Methods

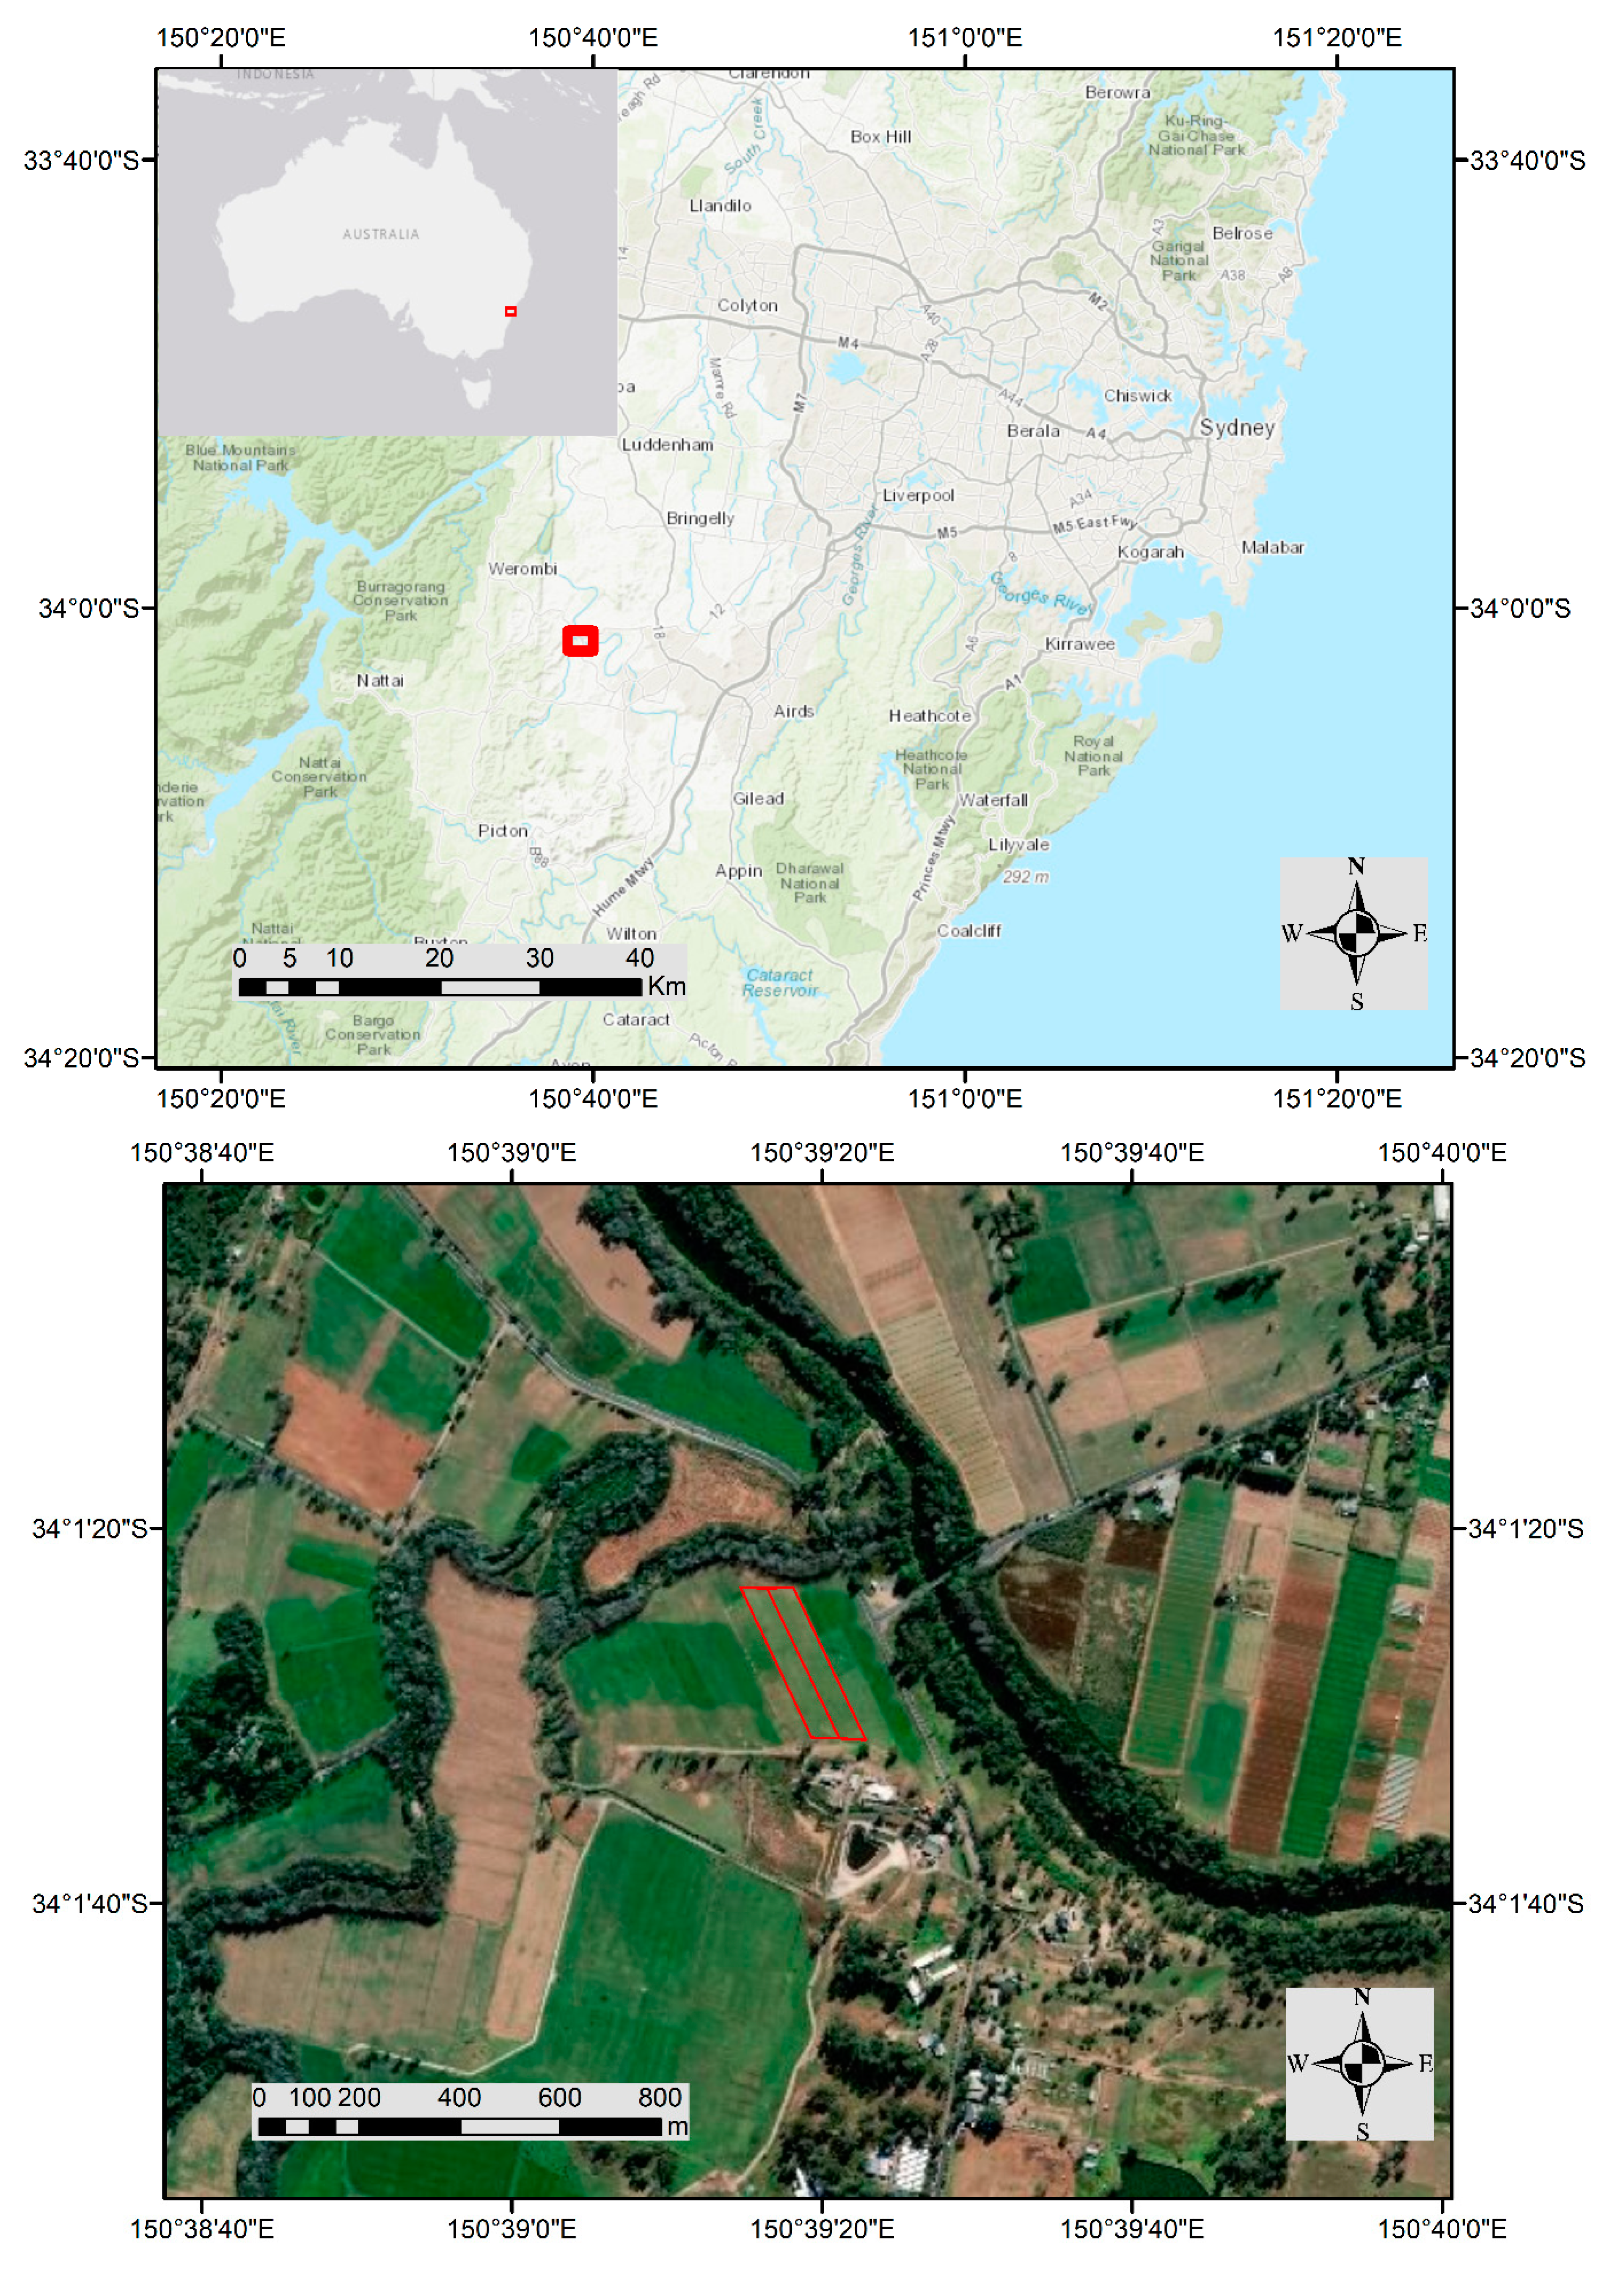
2.1. Experimental Design

The experiment was conducted from October to December 2019 at the University of Sydney’s dairy farm ‘Corstorphine’ located at Camden, New South Wales, Australia (34°024S, 150°655E) (Figure 1). Two experimental paddocks (P1 and P2) sown with annual ryegrass (Lolium multiflorum Lam.) in autumn (April), each with an area of 1.1 ha, were used. The paddocks were cut for silage at approximately 5 cm height on 1 and 30 October, respectively.

2.2. Data Collection and Management

2.2.1. Rising Plate Meter

After cutting for silage, compressed pasture height (0.5 cm height units) was measured using an EC20 Jenquip (Fielding, New Zealand) electronic RPM every 2 days, and over two regrowth periods (R1 and R2). This RPM works with a smartphone integrated with an internal GNSS receiver (accuracy could range from 0.05 to 5.5 m depending on the smartphone model) [27], which allowed us to collate the compressed pasture height for each plate meter recording and associated position. Following a systematic pattern of eight premarked transects, 240 readings were taken on average by the same operator from each paddock and date. Markers were situated on the border of paddocks at set intervals to ensure consistency in the location of the transects. This allowed us to construct the different walking patterns analyzed in the experiment easily (Figure 2). For the calibration cuts, we selected each week, three areas with high, medium, and low pasture availability. Compressed height and pasture biomass cuts above ground level within a 0.25 m2 quadrant were taken to create the equations required to convert RPM readings into kg DM/ha. We collected three pasture subsamples from each area, which were weighed in the paddock, immediately refrigerated, and oven-dried at 80 °C to constant weight to determine DM content.

2.2.2. Satellite Images

Open-source satellite images for the period of the experiment were available from the European Space Agency earth observation mission Sentinel-2 [28]. Images type ‘Level-2A’ (bottom of the atmosphere corrected) were extracted using Copernicus Open Access Hub (https://scihub.copernicus.eu/). The mission started in 2015 and provides multispectral imagery for land monitoring from a constellation of two large polar-orbiting satellites. Sentinel-2 imagery contains 13 spectral bands in the visible and near infra-red and the short-wave infrared. The spatial resolution varies for each band, being 10 m for the blue, green, red, and near infra-red bands and 20 or 60 m for the rest. The temporal resolution of the combined constellation is 5 days in mid-latitudes. Images were filtered automatically according to the proportion of cloud cover using the cloud cover filter tool. For R1 and R2, there were four images (from a total of 10 available) with high cloud cover that could not be utilized for the analysis (12 and 17 October, and 16 and 21 November) (Table 1).
Additionally, commercial satellite imagery from Planet Labs Inc. (San Francisco, CA, USA) was available through the Planet’s Education Research Program [29]. Since 2016, this company operates PlanetScope, a constellation of 130 CubeSats (i.e., small cubic satellites) that collect multispectral imagery of the entire earth with a potential temporal resolution of ≈1 day (depending on location and atmospheric conditions) and a spatial resolution of 3.7 m. We utilized ‘PlanetScope Analytic Ortho Tile’ images, a product that has been orthorectified and has radiometric and sensor corrections, suitable for value-added image processing such as vegetation indices. Nine images were discarded from a total of 31 available due to high cloud cover (corresponding to dates 5 and 7 October and 11, 15, 16, 20, 24, 28, and 30 November). We calculated the normalized difference vegetation index (NDVI) [30] using bands 4 and 8 for Sentinel-2 and bands 3 and 4 for Planet (red and near infra-red bands, respectively, for both satellites).

2.3. Data Collation and Processing

Data preparation, image processing, and statistical analyses were performed with R software version 3.6.2 (www.r-project.org/).

2.3.1. RPM and Satellite Calibrations

Weekly calibration samples were used to convert RPM compressed height into biomass (kg DM/ha). We used linear regression equations with samples pooled within regrowth period. Planet and Sentinel-2 satellites were calibrated using the calibrated RPM. We selected only images having an RPM reading the same date of acquisition (Planet) or within ± 2 days (Sentinel-2) for converting satellite NDVI values into kg DM/ha. This was done to avoid penalizing either Sentinel-2 with additional missing data points (if RPM readings were taken on the same day); or Planet with time differences between acquisition and ground measurements (if readings were taken every 2 days). From each paddock and date, the NDVI values corresponding to the particular positioning of every single plate reading were extracted. Paddocks were divided into four sectors having around 60 plate readings (sectors corresponding to transects 1-2, 3-4, 5-6, and 7-8 in Figure 2), and the average NDVI and the kg DM/ha (derived from the calibrated RPM) of those sectors were calculated. These values were then used to fit different exponential equations that were, in turn, utilized to convert NDVI data (from all satellite images available throughout the experiment) into kg DM/ha.

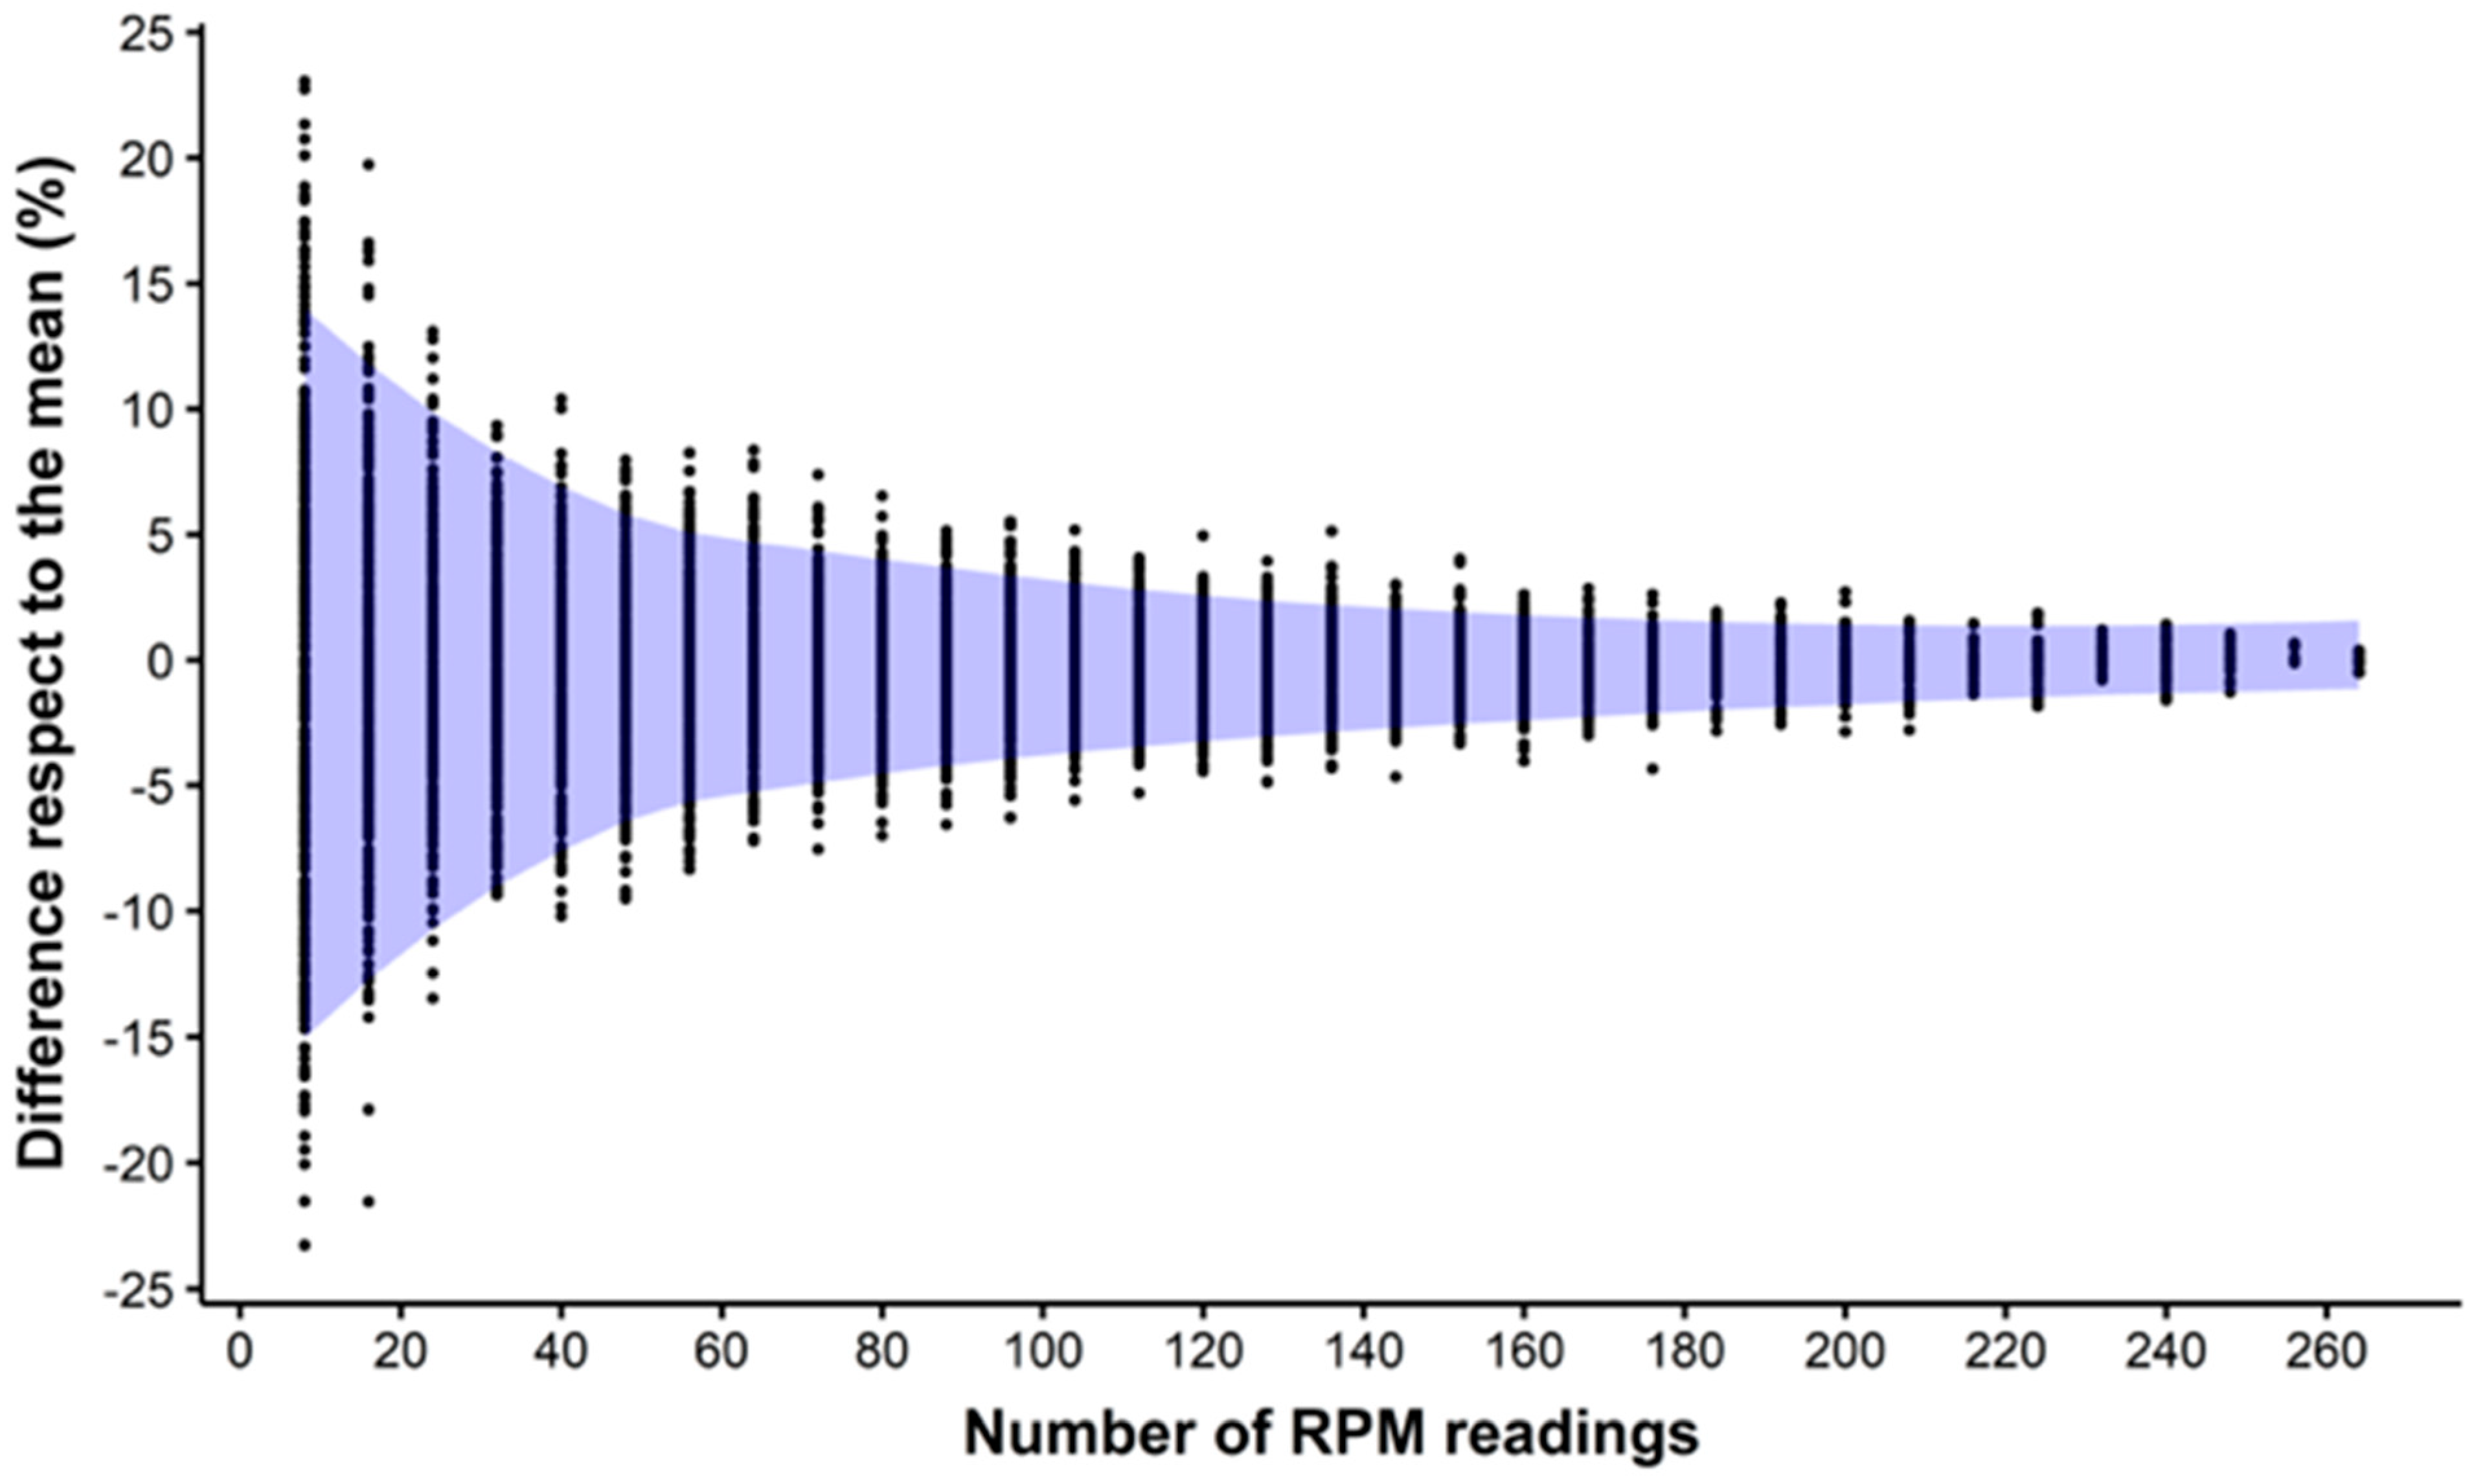
2.3.2. Minimum Number of RPM Readings

A new dataset was created to calculate the minimum number of RPM readings required for maximum accuracy. We did this by sampling RPM observations from each date, paddock, and transect from the initial dataset. The process consisted of sampling incrementally random observations from the eight transects up to the maximum possible, based on the transect having the minimum number of plate readings. For example, for P1 on day one, the minimum number of readings in a transect was 30; therefore, the process started sampling randomly one point per transect in the first iteration (i.e., eight points for the whole paddock) up to 30 points per transect in the last iteration (240 points in the whole paddock). We repeated each iteration 10 times and conducted the whole process for every date and paddock. This method allowed us to calculate the average kg DM/ha for n number of readings (i.e., 8, 16, 32, up to 240), and the difference in the percentage of n with the average of the whole paddock (i.e., the average of biomass after 240 readings, considered as the control mean).

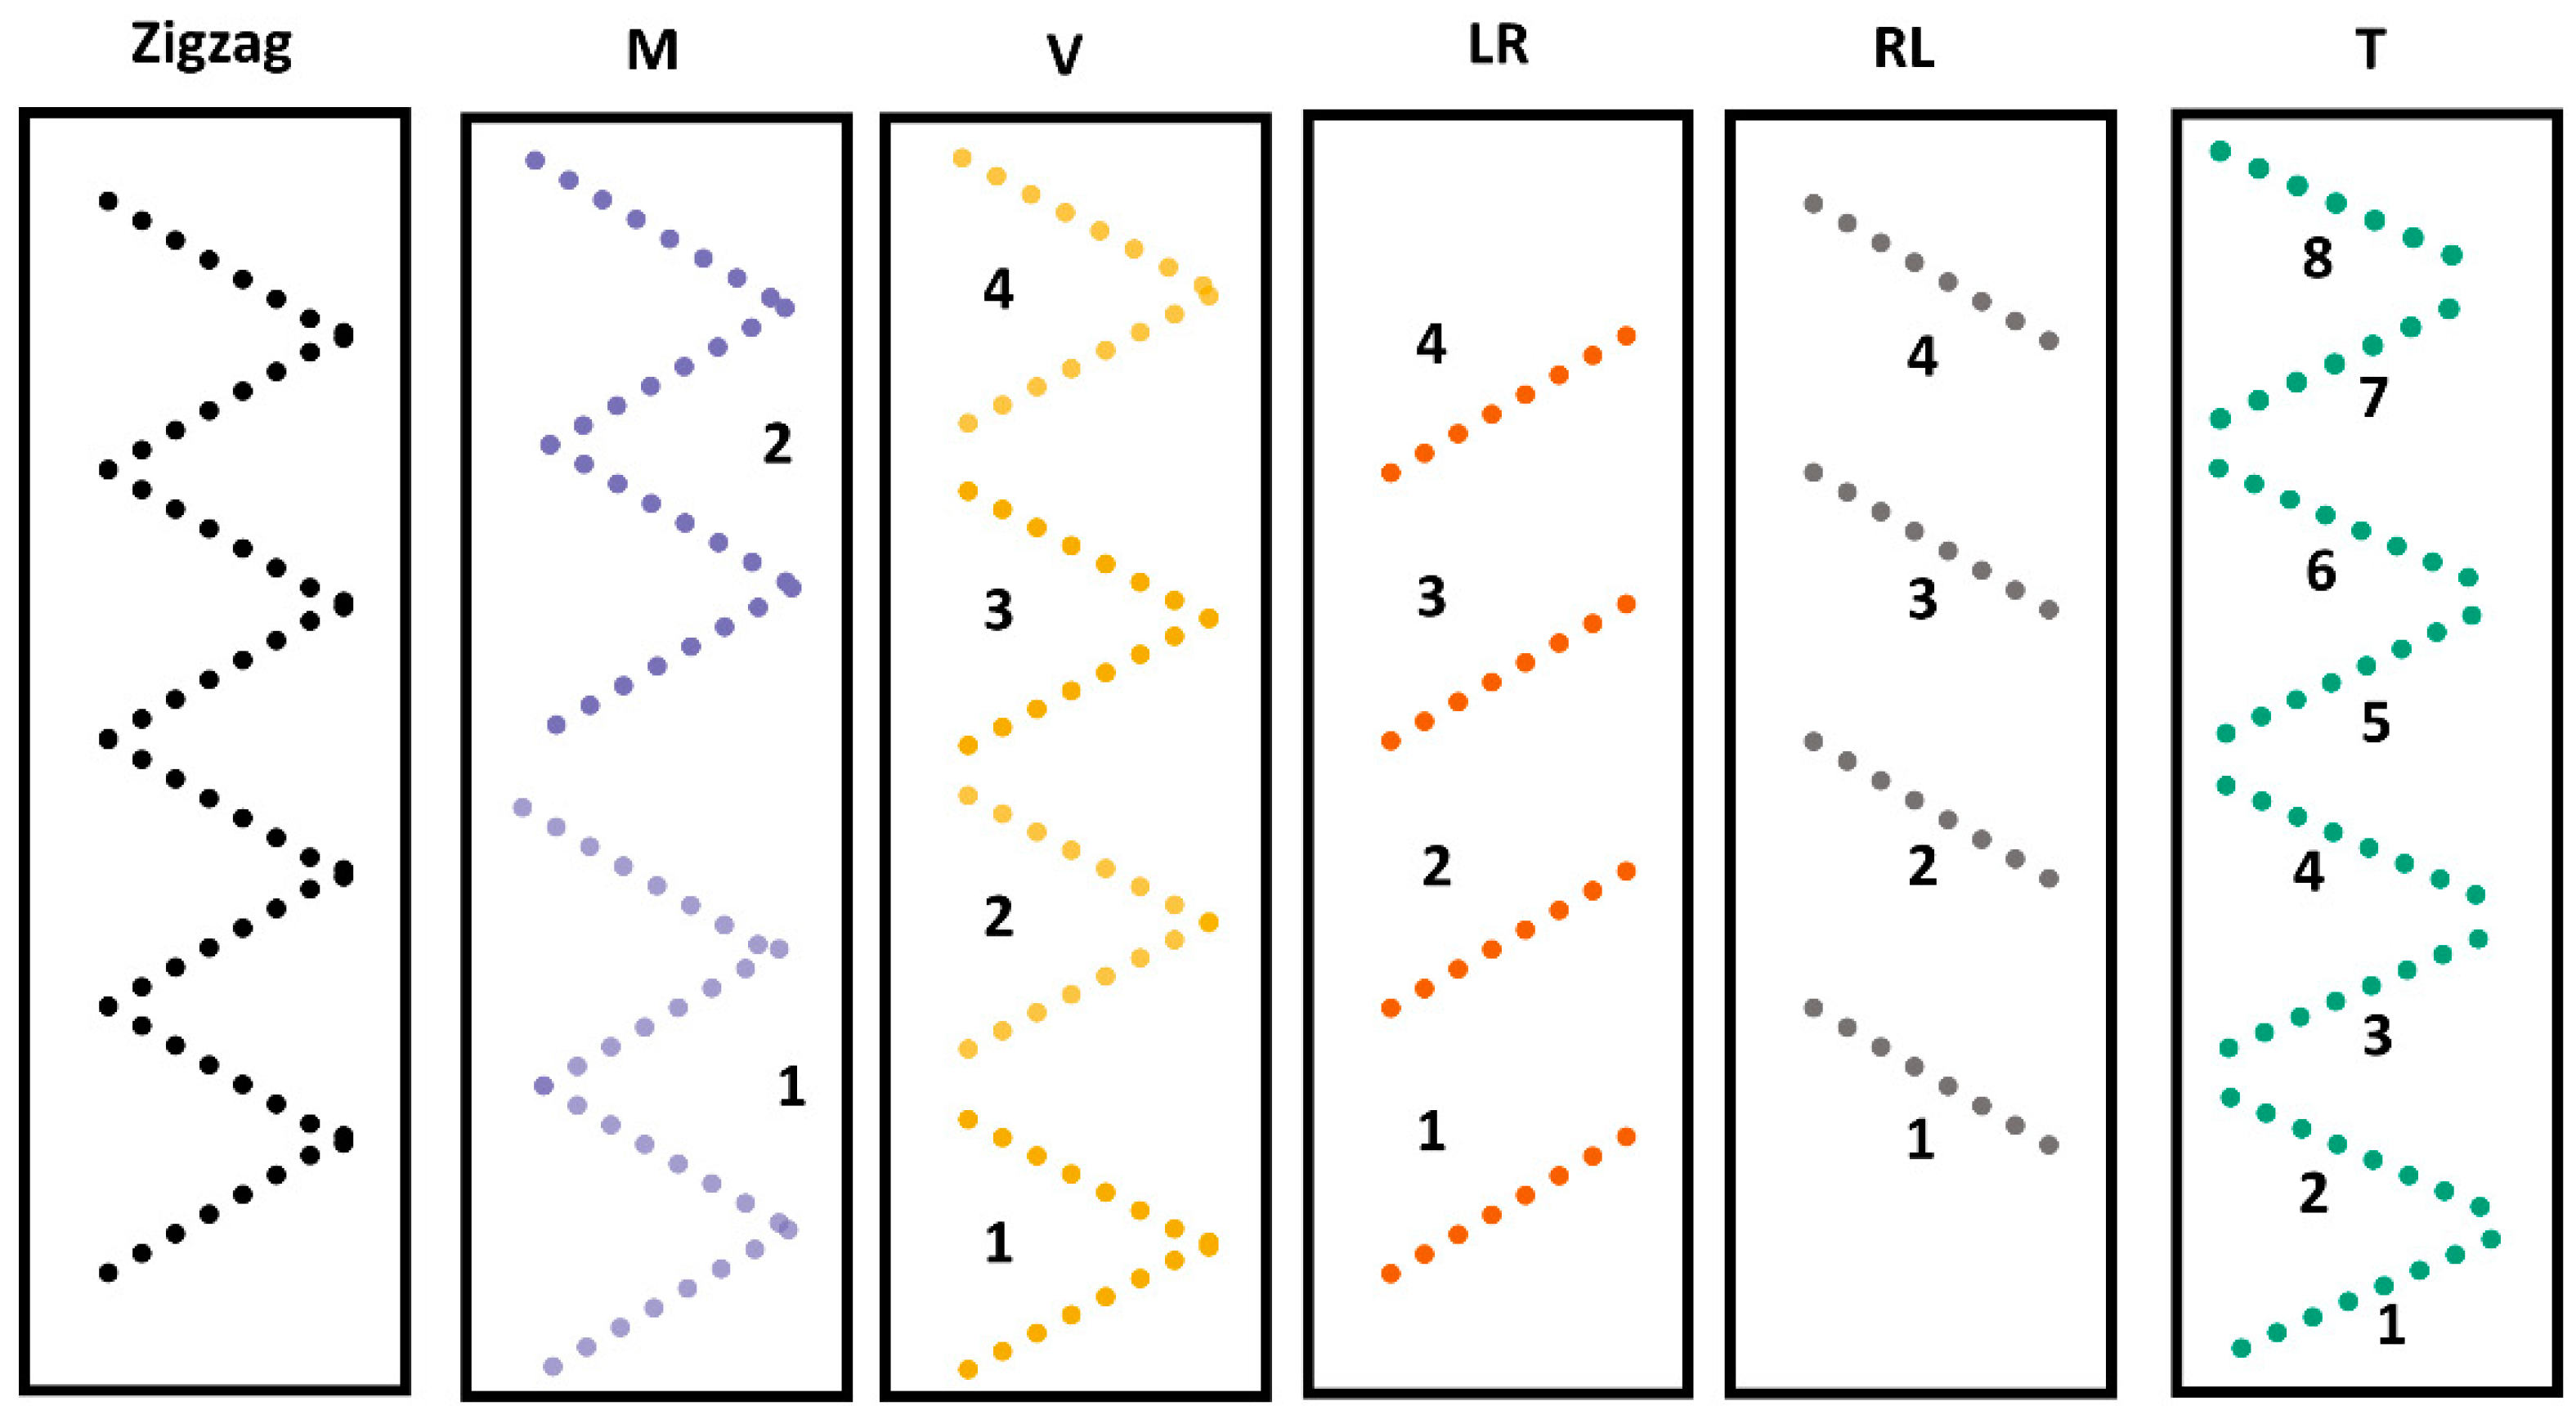
2.3.3. Walking Pattern Analysis

A new dataset was created based on the initial dataset to test the effect of different walking patterns on the accuracy of the measurements. The process used the transects to build different walking patterns simulating possible farm scenarios (i.e., zigzag, M and V-shape, left-right, right-left, and individual transects) (Figure 2). The pattern zigzag, which contained all the possible readings, was considered as the control mean.

2.3.4. Calibration Methodology Comparison

We considered the calibrated RPM as the control and compared it with uncalibrated RPM, satellite calibrated with calibrated and uncalibrated RPM, and uncalibrated satellite. Uncalibrated RPM refers to the use of standardized equations previously developed to convert RPM height into kg DM/ha. In this regard, we tested daily equations for the same pasture species at the same site [31], monthly equations provided by the manufacturer [32], and the annual equation widely utilized in the industry [33] (Table 2). Satellite evaluation included estimations using our methodology (i.e., satellite calibrated with calibrated RPM), satellite calibrated with an uncalibrated RPM (using the three standardized equations above-mentioned), and uncalibrated satellite, which refers to the satellite calibrated using NDVI to biomass equations previously published for Australia [25] and the United States [34] (Table 3). Due to the small number of observations, we could not use Sentinel-2 satellite and only conducted this comparison for Planet satellite.

2.4. Statistical Analysis

For the RPM and satellite calibrations, linear and exponential regressions per regrowth period were used, respectively. We used models with observations pooled per regrowth (and not weekly) because they had a lower Akaike information criterion (AIC) and a higher coefficient of determination (R2). Linear regressions for the RPM were set to intercept zero to avoid negative biomass values that would affect the results. For the calibration methodology comparison, we performed linear regressions between each of the methodologies previously described (considered as the predicted value) and the calibrated RPM as the control (actual value). A similar approach was used for the walking pattern analysis, where for every date and paddock, the average of each pattern analyzed was considered as the predicted value and the zigzag pattern as the actual value. We assessed the models using R2, which measures the variance of the dependent variable explained by the independent variable, and with the root mean square error (RMSE), which indicates the spread of the residuals in absolute value around the estimated curve. For the assessment of the minimum number of RPM readings, we calculated for each reading the confidence intervals (95%). The confidence interval’s upper and lower limits were fitted into a smoothed curve using locally estimated scatterplot smoothing (LOESS) [35].

3. Results

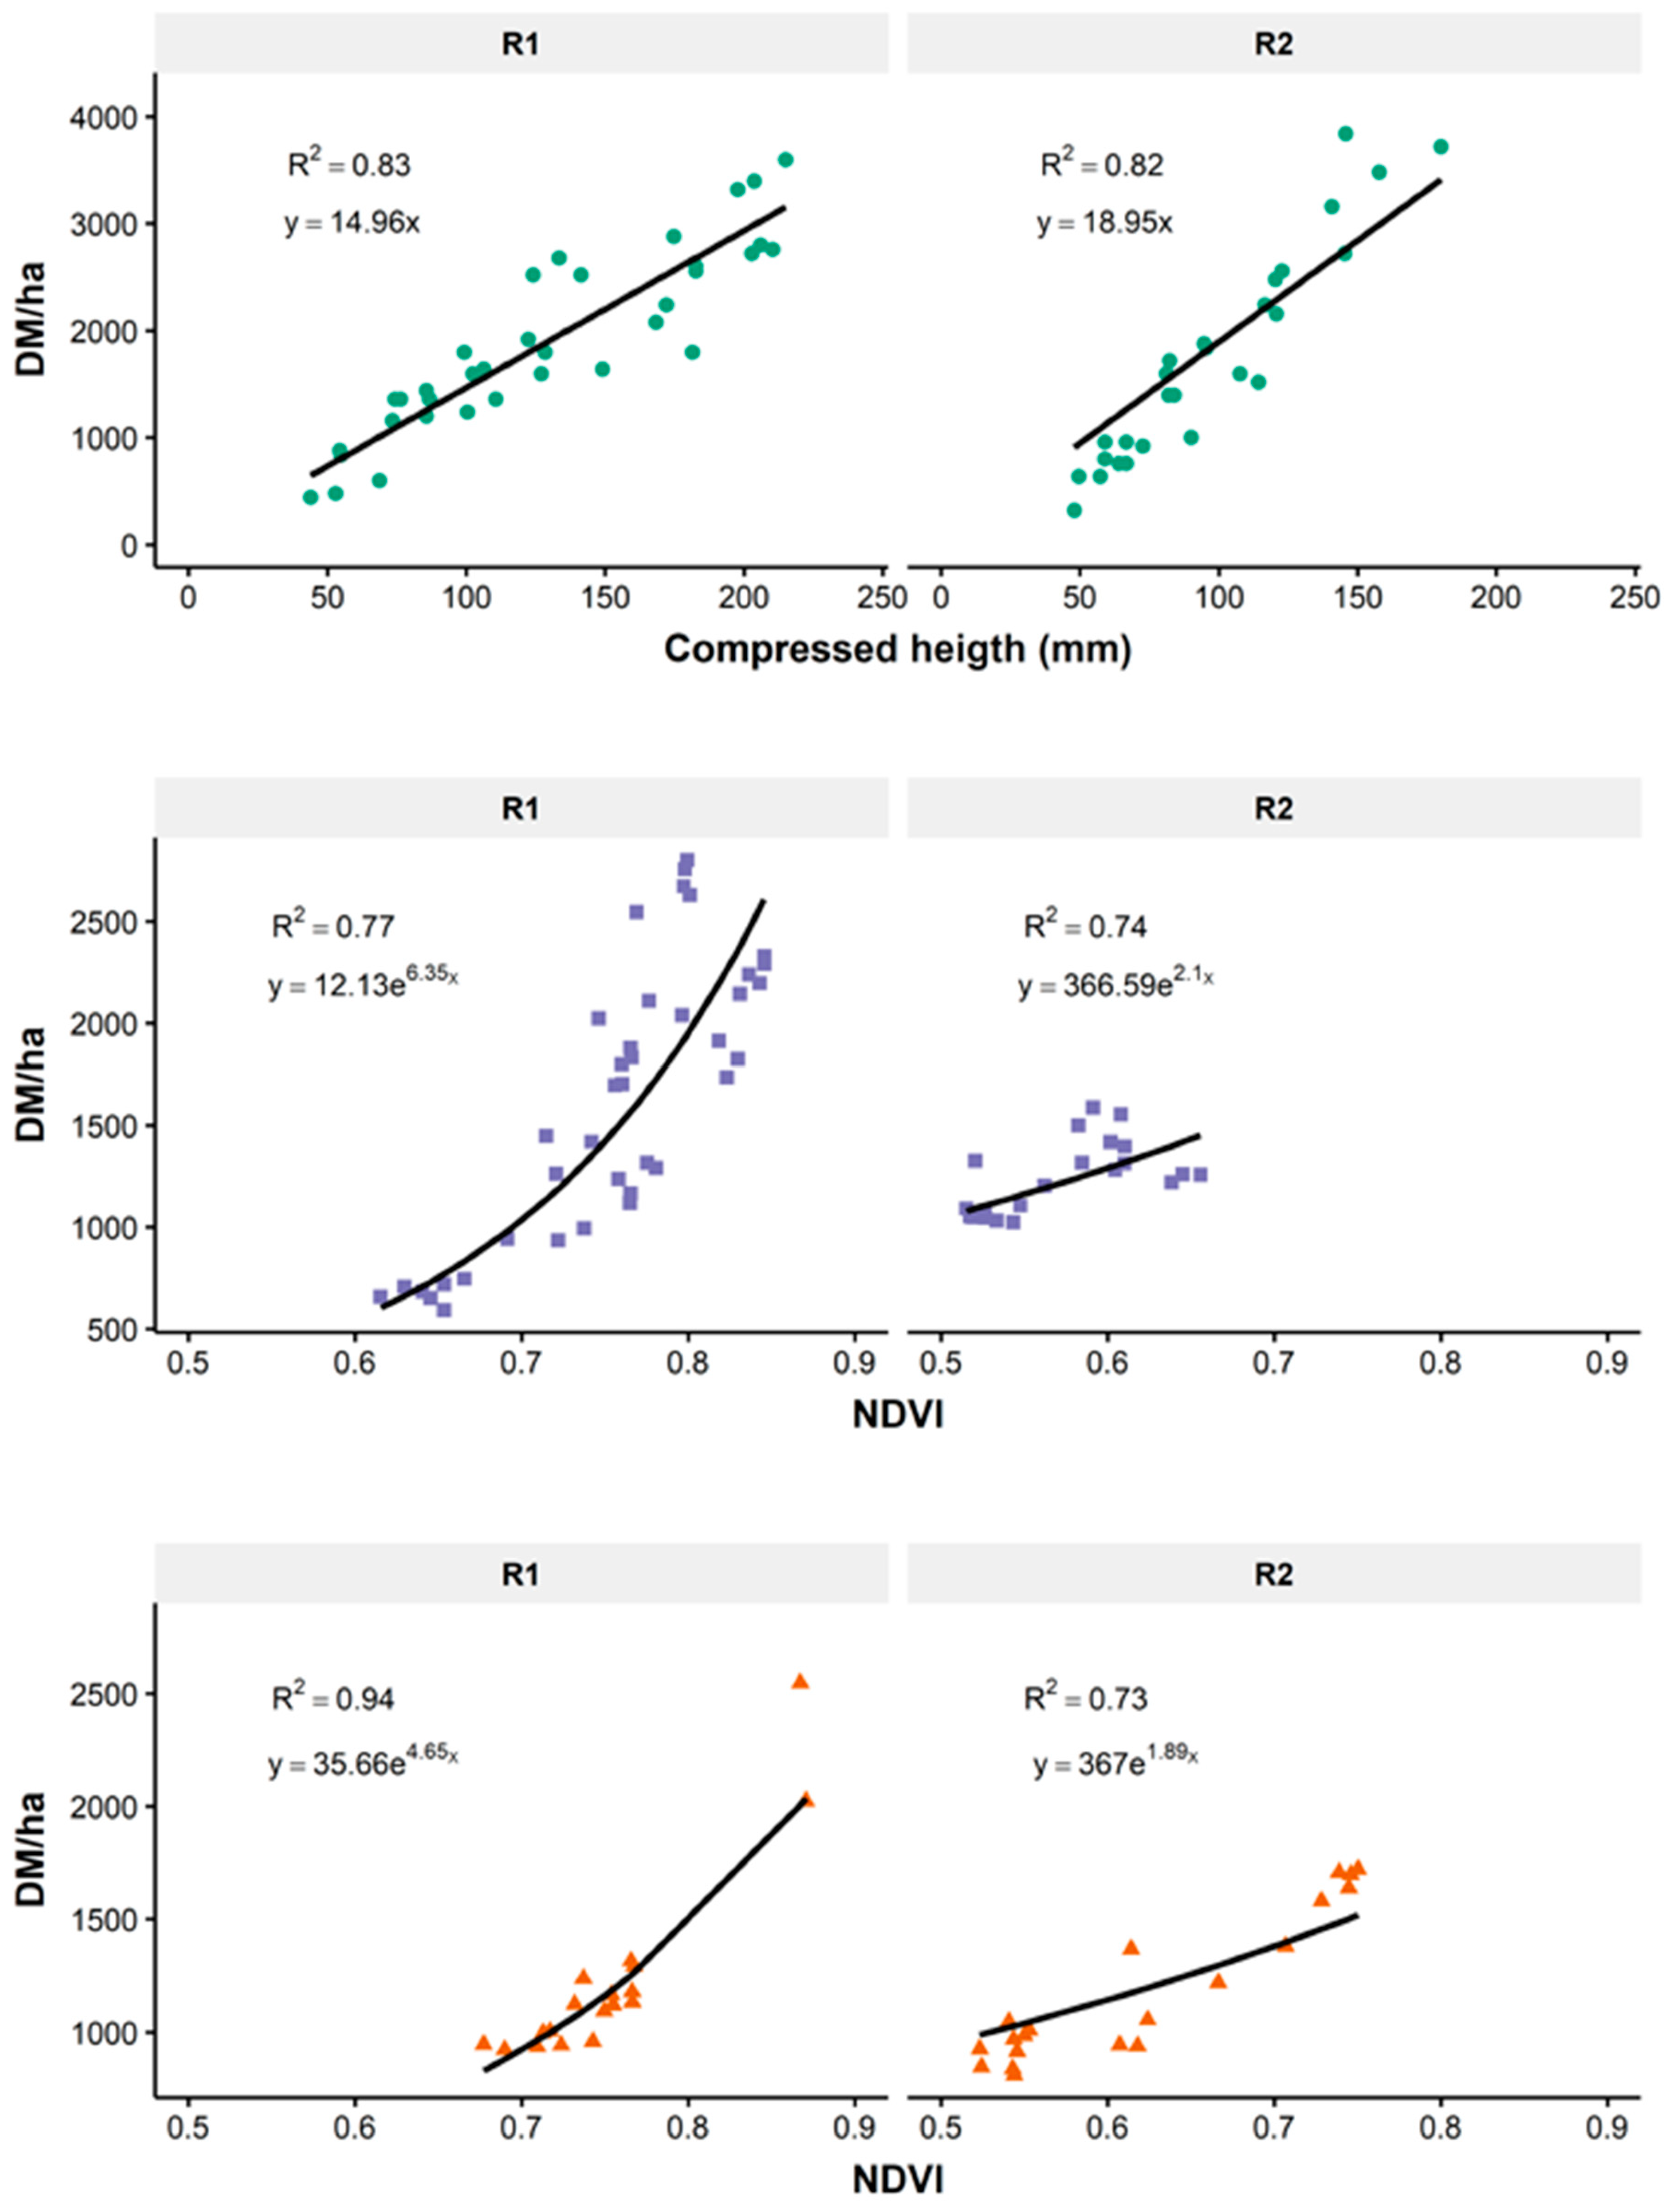
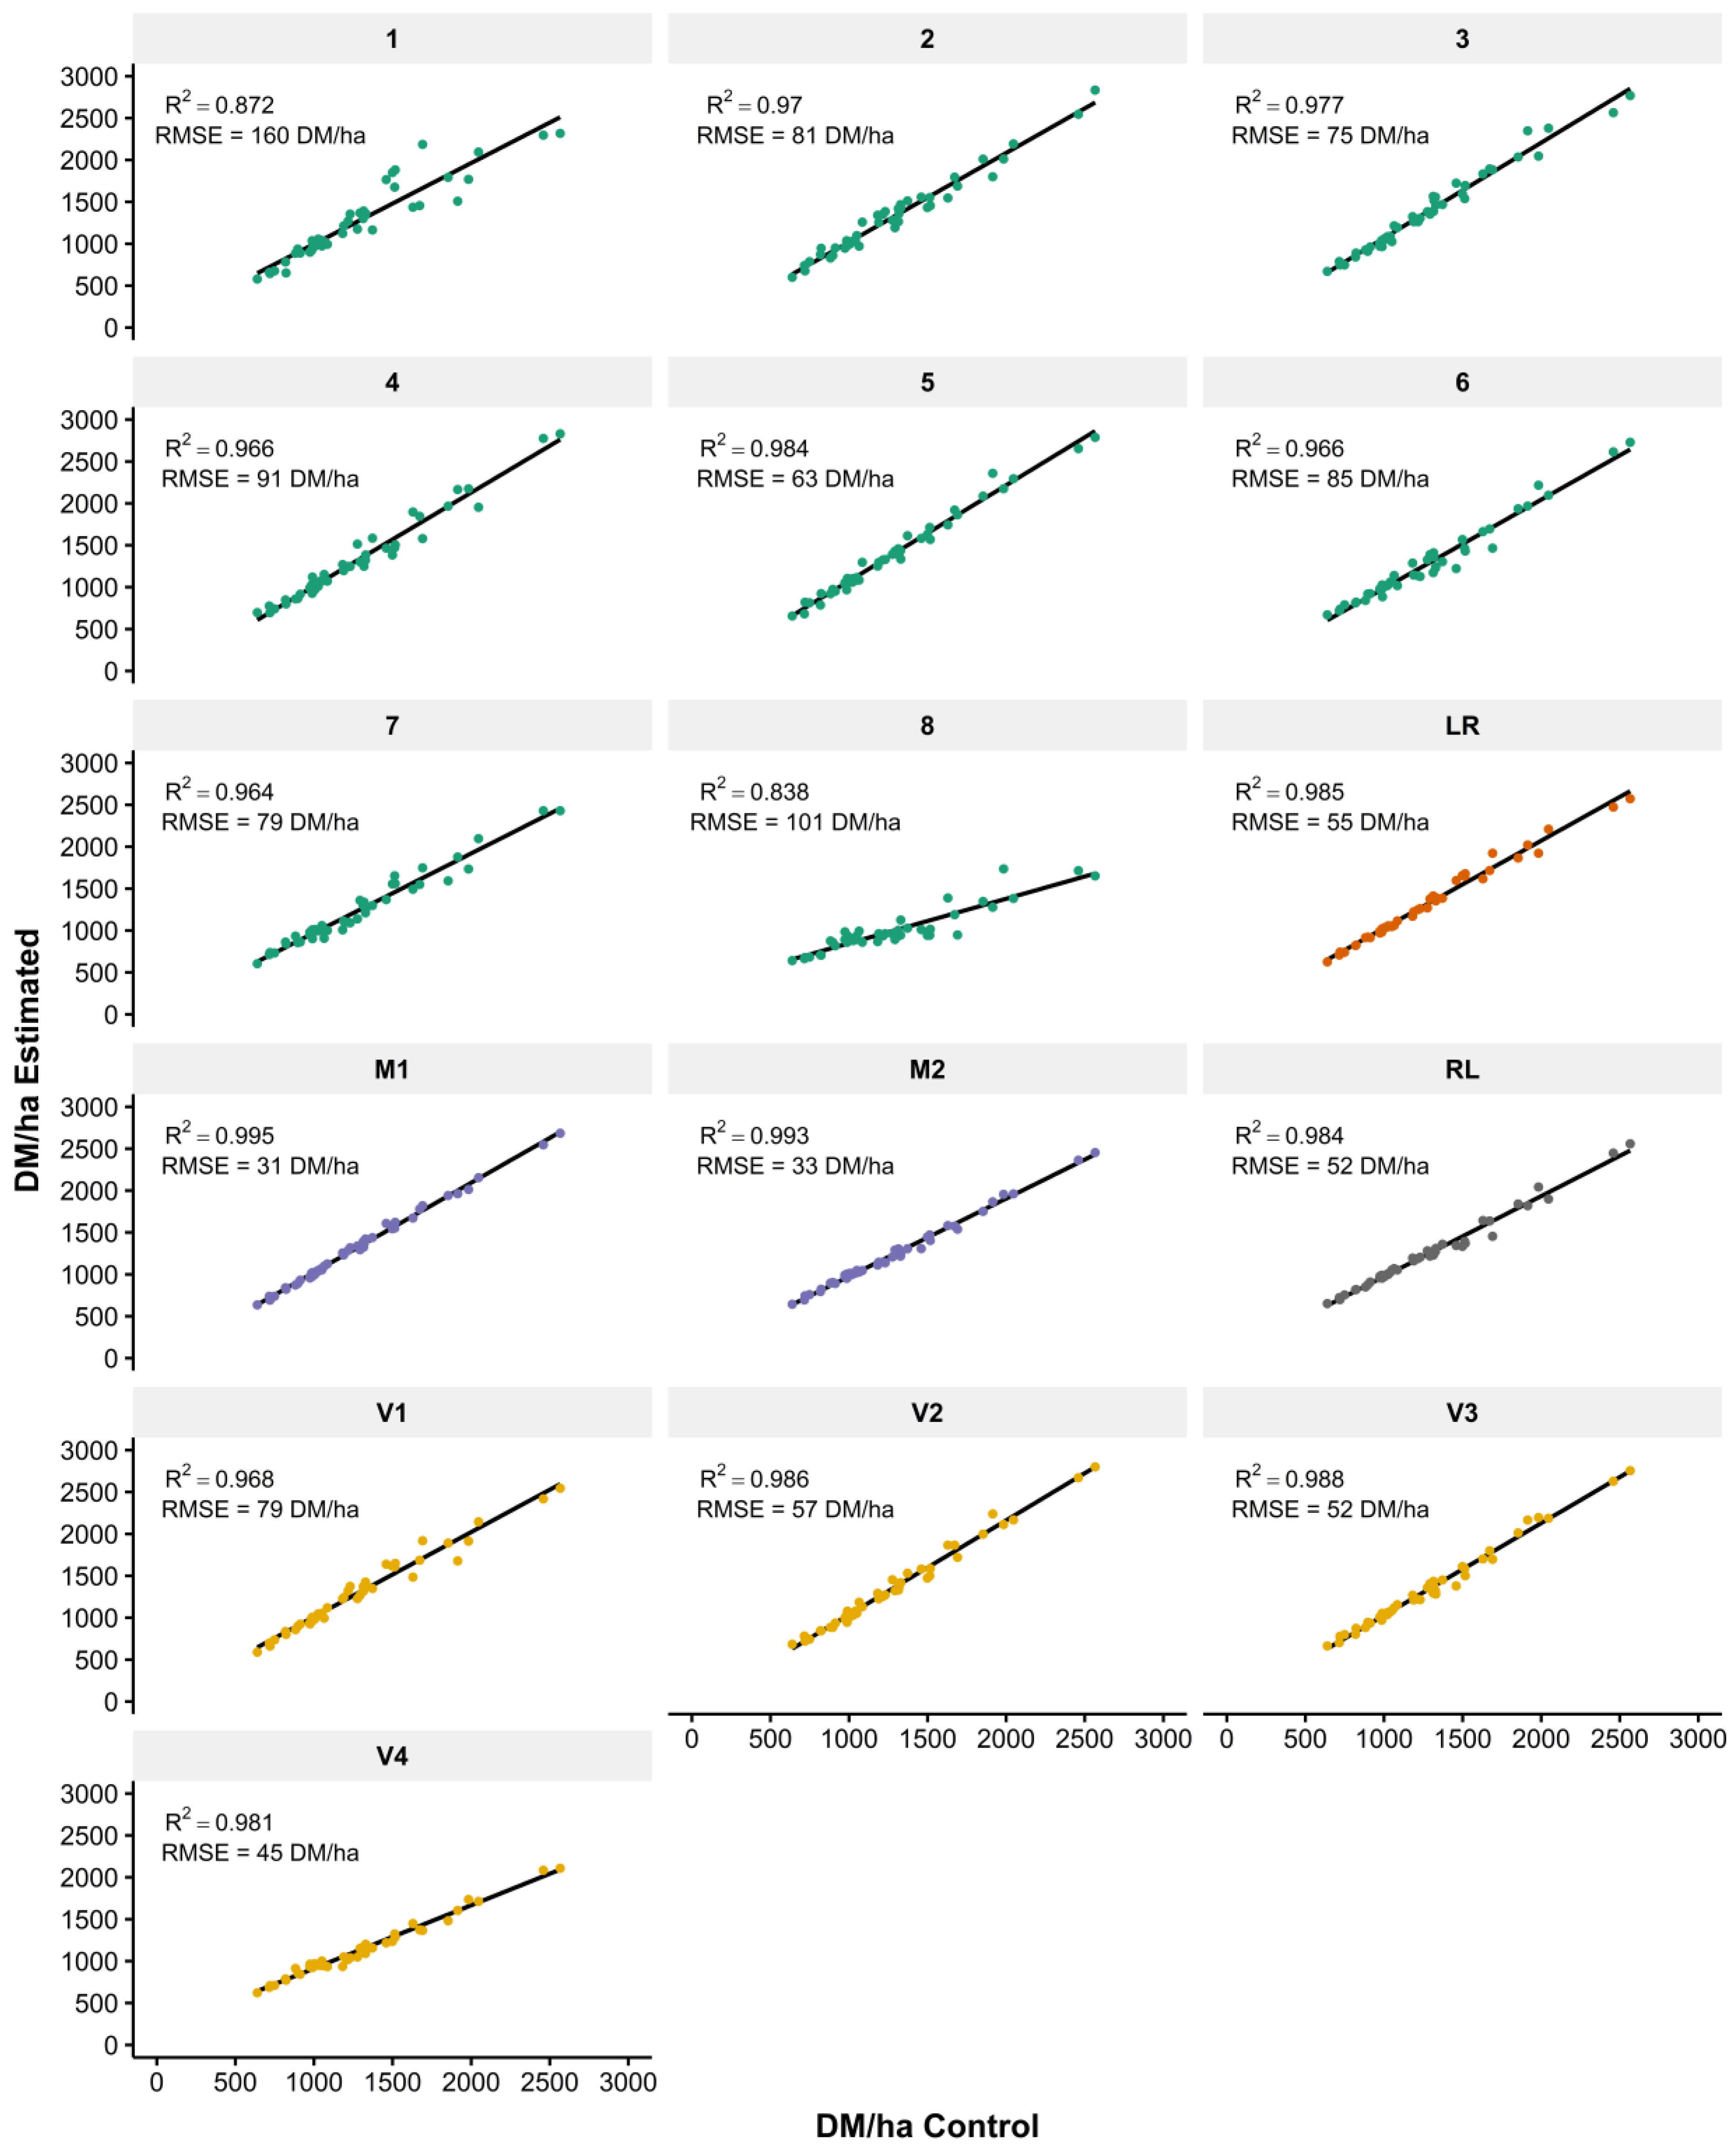
3.1. Calibration Equations

Figure 3 shows the calibration equations between pasture biomass (kg DM/ha), the electronic RMP, and the two satellites. The variance in biomass explained by RPM height was high for R1 and R2 (R2 0.83 and 0.82, respectively); however, there was a difference in the slopes between R1 and R2 ( y = 14.96 x and y = 18.95 x ) (Figure 3). For Planet satellite, the regressions between NDVI and pasture biomass were similar in the amount of variance explained for both regrowth periods (R2 0.77 and R2 0.74), but there was a clear difference in the estimates of the exponential equations ( y = 12.13 e 6.35 x and y = 366.59 e 2.1 x ). Contrarily, for Sentinel-2, NDVI explained a higher variation of pasture biomass for R1 than for R2 (R2 0.94 and R2 0.73), mainly because of an extreme high NDVI value. Additionally, there was a clear difference in the equation estimates ( y = 35.66 e 4.65 x and y = 367 e 1.89 x ).

3.2. Minimum Number of RPM Readings

As expected, increasing the number of RPM readings reduced the error associated with pasture biomass in relation to the paddock’s mean (Figure 4). In total, 27, 70, and 184 plate readings were required to achieve an error of 10%, 5%, and 2% from the control paddock mean (confidence interval of 95%). For every 10 units of increase in the RPM readings, and up to 40 readings, a 2.3% decrease in pasture biomass error was observed. The decrease in error was reduced to 0.3% between 41 and 140 readings and remained almost constant (0.1%) over 140 readings. The total time required to sample a paddock (1.1 ha) was, on average, 8 min 11 s (ranging from 6 min 14 s to 13 min 30 s), which represents ≈2.2 s per reading, on average.

3.3. Walking Pattern

Overall, we found little differences between the walking pattern analyzed and the paddock control mean (full zigzag pattern), which could be observed in the goodness of fit of the regression equations shown in Figure 5. The R2 values ranged from 0.98 to 0.99 when sampling from left to right or from right to left, from 0.97 to 0.99 for the V pattern, and from 0.993 to 0.995 for the M pattern. However, for the individual transects, we observed a higher difference for transects 1 and 8 (R2 0.87 and 0.84, respectively) in comparison to the other transects (between 0.96 and 0.98). The same is shown with the RMSE values, which ranged from 52 to 55 kg DM/ha when sampling from left to right or from right to left, from 45 to 79 kg DM/ha for the V pattern, and from 31 to 33 for the M pattern. However, transects 1 and 8 had higher RMSE (160 and 101 kg DM/ha, respectively) than the other transects (between 63 and 91 kg DM/ha).

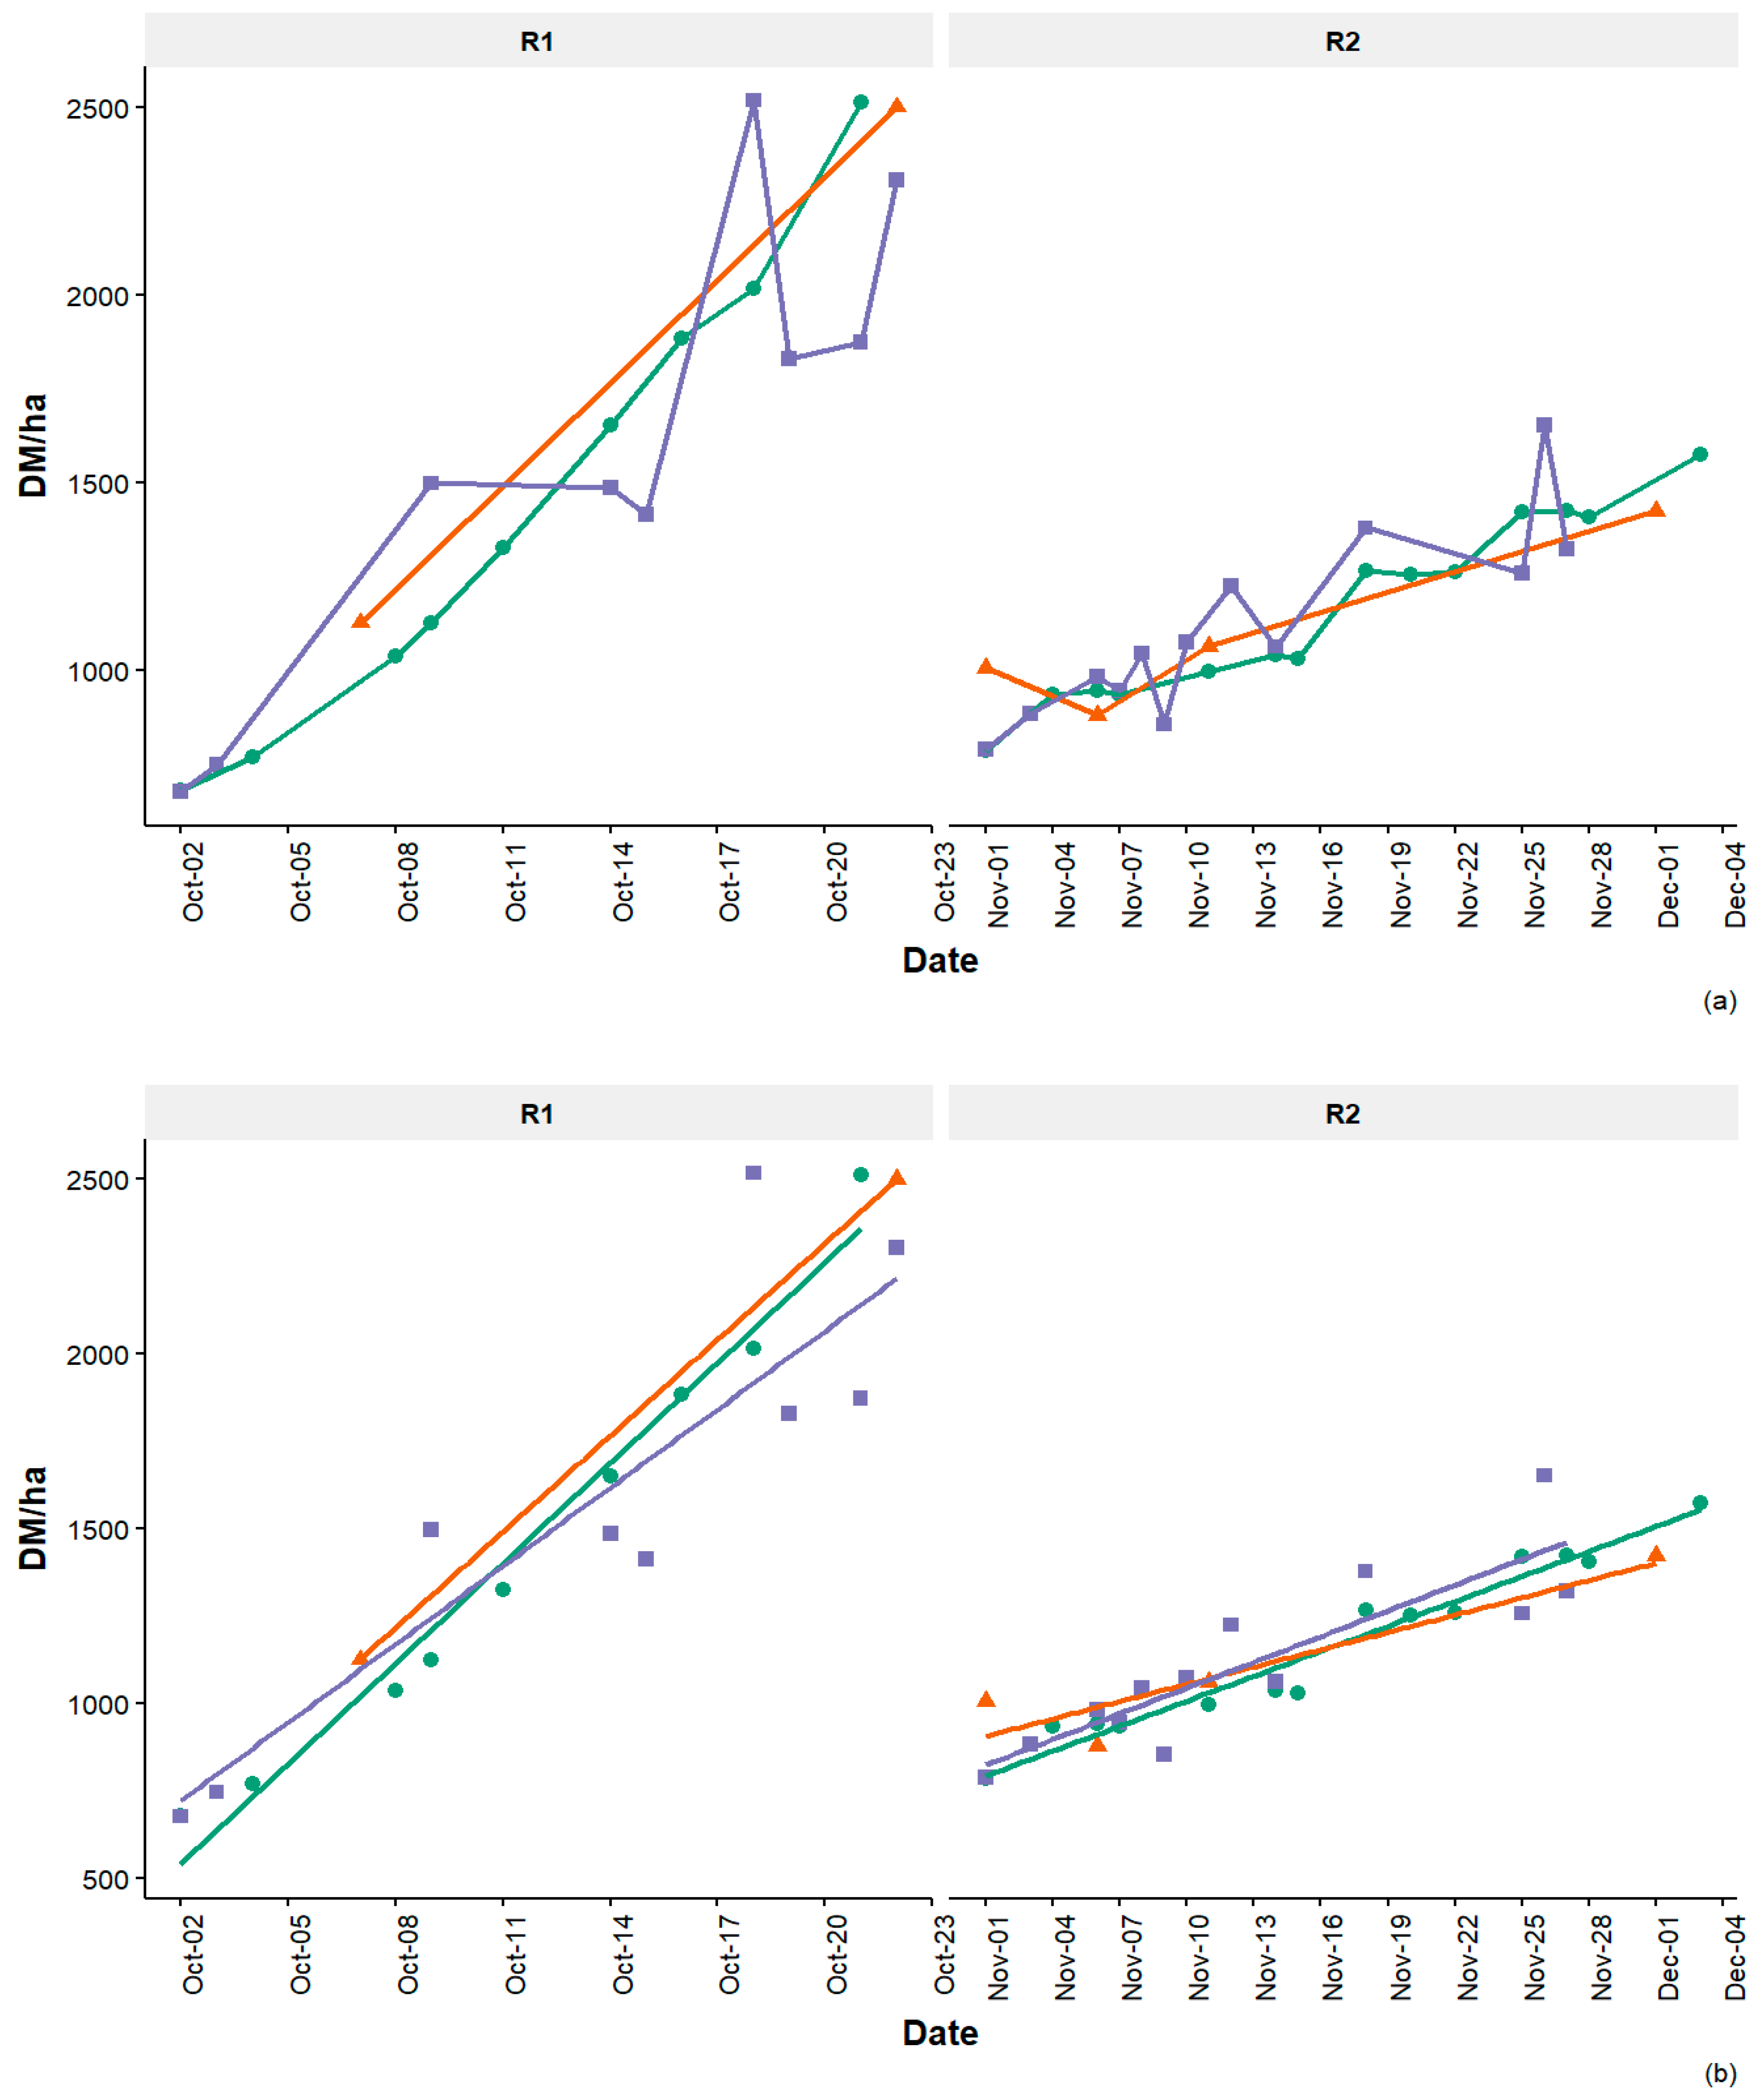
3.4. Pasture Biomass Estimations

Figure 6a shows the estimated pasture biomass per day and per regrowth for the RPM, Planet, and Sentinel-2 satellites. Biomass curves for the three methods follow a similar pattern across time for both R1 and R2. Figure 6b also shows the linear regressions fitted to the pasture biomass estimations, with the slopes of the curves indicating the average daily pasture growth rates (kg DM/ha.d) for each sensor in R1 and R2. We found that in R2, growth rates were relatively similar for the three methods; however, in R1 growth rates were 20% lower for Planet in comparison to RPM and Sentinel-2. Growth rates were 96, 92, and 75 kg DM/ha.d in R1 and 24, 17, and 24 kg DM/ha.d in R2 for RPM, Sentinel-2, and Planet, respectively. The RMSE was higher for the satellites in comparison to the electronic RPM. The RMSE was 87 and 265 kg DM/ha in R1 for RPM and Planet (Sentinel-2 had only two observations and could not be calculated) and 47, 75, and 113 kg DM/ha in R2 for RPM, Sentinel-2, and Planet, respectively. We observed a clear difference in the number of observations available for the satellites, mainly due to differences in temporal resolution and cloud cover. For Sentinel-2 satellite, and out of a net regrowth period of 53 days (R1 and R2), there were only two dates with observations for R1 and 4 for R2 (11% of the days). For Planet satellite, there were nine dates with observations for R1 and 13 for R2 (42% of the days).

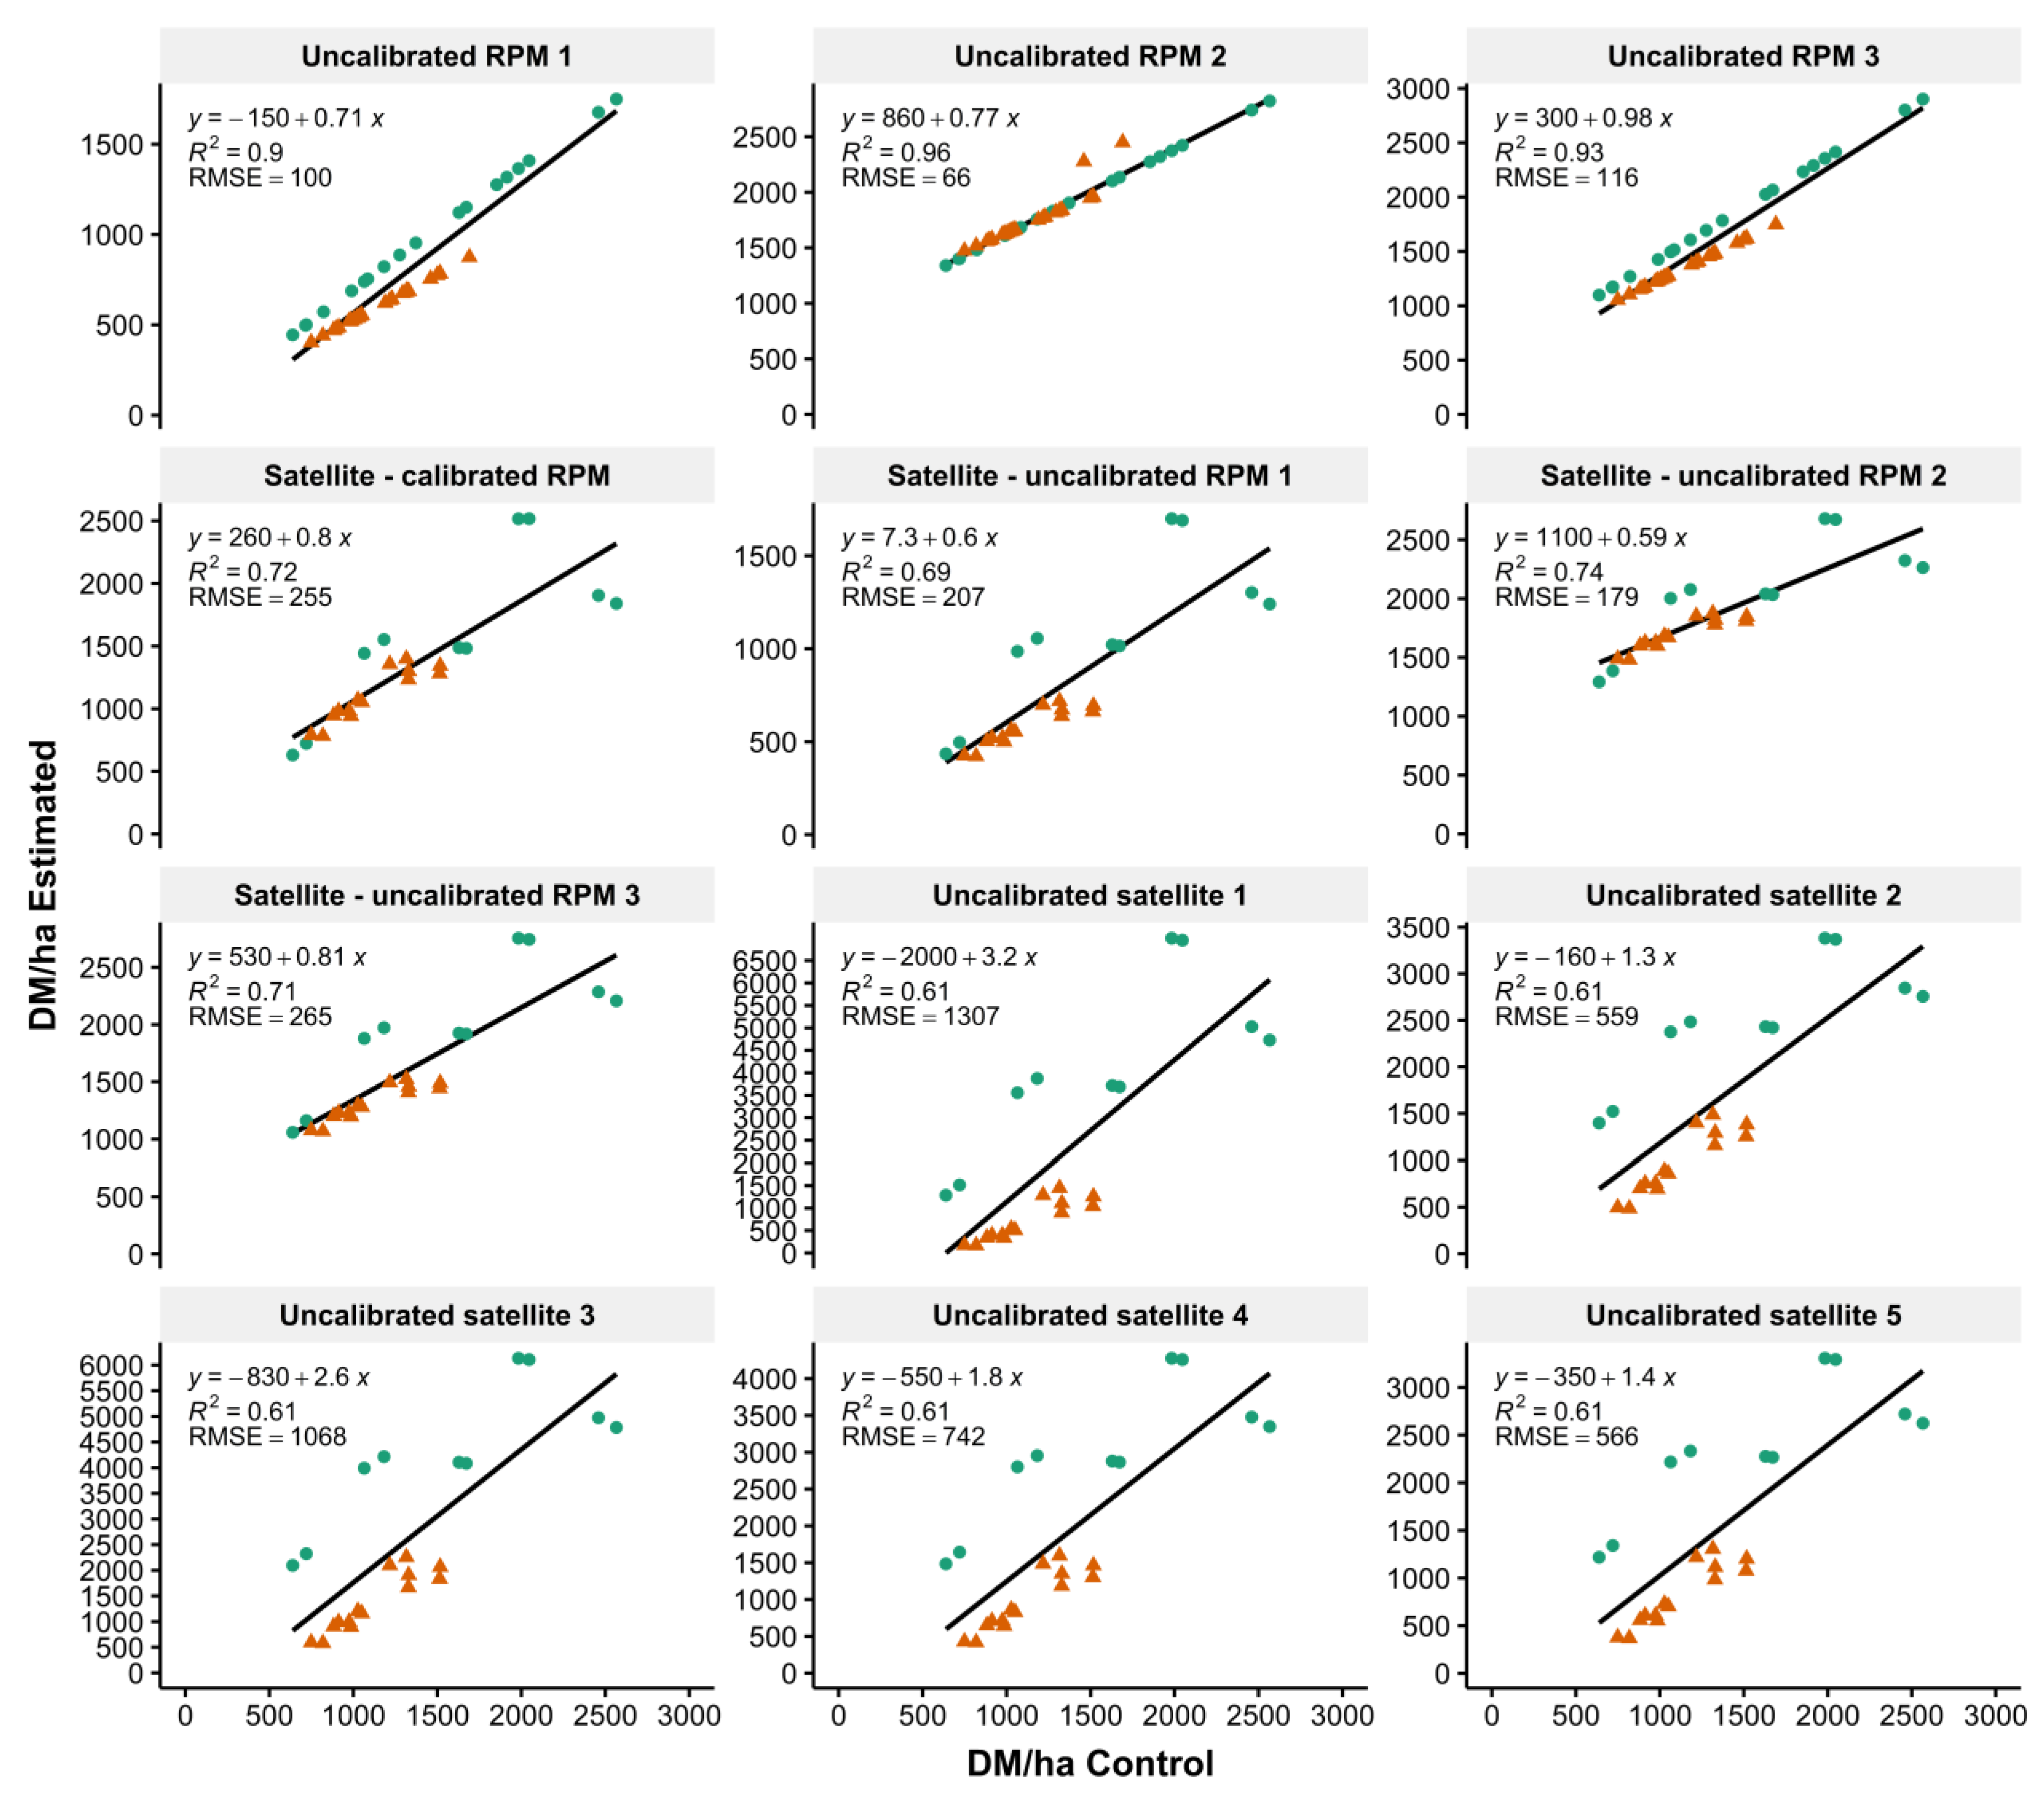
3.5. Calibration Methodology Comparison

The calibration methodology assessment is shown in Figure 7. The use of the uncalibrated RPM showed a good performance in comparison to the calibrated RMP (the experiment control). The R2 varied from 0.90 to 0.96, RMSE66 to 116 kg DM/ha, and slopes from 0.71 to 0.98. Satellite estimations using the calibrated RPM (the proposed methodology for the satellites in this experiment) also showed good performance (R2 0.72, RMSE255 kg DM/ha, slope 0.8). However, this was not very different from calibrating the satellite using the uncalibrated RPM (R2 between 0.69 and 0.71, RMSE between 179 and 265 kg DM/ha, and slopes between 0.59 and 0.81). Contrarily, pasture biomass estimations with uncalibrated satellites (i.e., using NDVI to biomass equations previously published) was poor (R2 0.61, RMSEbetween 566 and 1307 kg DM/ha) and overestimated pasture biomass (slopes between 1.3 and 3.2).

4. Discussion

Our results show that seventy RPM readings were sufficient for an acceptable level of accuracy of the pasture cover on an individual 1.1 ha paddock (i.e., ≈64 readings/ha). We also found that over 140 RPM readings, there was a negligible variation from the paddock mean, with the error increasing exponentially with less than 40 readings. Previously, García [12], using a different methodology with perennial ryegrass pasture in New Zealand, reported that the error with respect to the final mean (control) decreased up to about 90–100 readings per paddock (≈2.5 ha). In comparison to our findings, these results were higher per paddock basis, but lower per hectare. In a previous experiment conducted by Thomson et al. [14], several farms having between 36 and 112 paddocks were monitored using 15 RPM readings per paddock. Based on the assessment of the standard error obtained (350–450 kg DM/ha), the authors concluded that 15 readings were not enough and speculated that between 50 and 80 measurements should be taken to obtain the most accurate estimation of pasture biomass, which is similar to our results. Another experiment conducted in New Zealand [13] measured 218 paddocks over 3 years, using 25–50 readings per paddock. The researchers concluded that the high variability in biomass obtained was due to operator variations and differences in the number of RPM readings. They also suggested that at least 50 readings per paddock are needed if the operator is consistent. It is important to mention in all these studies, paddocks were grazed with cows, whereas the paddocks in our experiment were cut for silage. Given that previous research has not quantified the number of RPM with precision, it is possible that for grazed paddocks, with presumably greater initial variability, more than 70 readings would be required to achieve a 5% error.
The distribution of the readings (in practice, the walking pattern implemented) may be of importance if the RPM is used to link locally assessed biomass to calibrate data captured by remote sensing. In our study, the walking pattern had little effect on RPM accuracy, suggesting that walking across the middle of the paddock (on a typically rectangular and relatively homogenous paddock) would enable an accurate estimation of the entire paddock biomass. However, conducting a farm walk close to the borders of the paddocks increased the error, possibly due to edge effects. Thus, a farmer that aims to achieve relatively high accuracy for the estimation of pasture biomass, should take at least 70 RPM readings, equating to approximately one reading every second step, through the middle of the paddock. This has positive practical implications if the RPM is used to calibrate remote sensing-captured data, as it simplifies the task. If we consider an average farm with an area of ≈150 ha [6] and 64 RPM readings/ha, the farmer will need to perform 9,600 readings to achieve good accuracy. From the duration per RPM reading recorded in the current work (2.2 s per reading), monitoring with the RPM across the whole farm will require 5.9 h. Anecdotal evidence from dairy farmers indicates that this task could require ≈3 h on average, suggesting that farmers would work with reduced numbers of steps as we recommend here, and therefore increased error. Considering 30.3 Australian dollars (A$) per hour as imputed labor cost for the farmers’ time [1], monitoring the whole farm every week could cost the farm somewhere between 91 and 182 A$/week (for 3–5.9 h, respectively). The additional labor costs could be offset by the ≈10% increase in milk production expected from systematic pasture monitoring [7], which would be around 1,605 A$/week for an average Australian dairy farm milking 273 cows, producing 17 L/cow.d and receiving a farmgate milk price of A$ 0.50/L [36]. While the return on the use of the RPM is clear, the use of the RPM on dairy farms is sparse [8,9], and as such, the combination with satellite technology may be able to fill this gap.
Results from both satellites showed good accuracy in the calibrations (Figure 3). However, particularly for Planet satellite in R1, the growth rate was underestimated by ≈20% compared to the RPM (Figure 6b). Such a difference could represent, at the end of the regrowth period, a variation of ≈400 kg DM/ha. This could be due to the differences in pasture biomass between R1 and R2; however, given that only two regrowth periods were evaluated in this experiment, these results cannot be conclusive and further investigation is required. A method proposed in this experiment, where the satellite is calibrated using an electronic RPM integrated with a GNSS, could still be appealing and convenient for dairy farmers, particularly with large farm areas. The results showed that using uncalibrated satellites has poor performance; however, calibrating satellites with calibrated RPM or even with uncalibrated RPM, improved accuracy. A satellite calibrated with an uncalibrated RPM was utilized in New Zealand by Mata et al. [19]; however, they used images with only 1 month of temporal resolution and 10–20 m of spatial resolution, which is lower than the resolution of Planet images. These results highlight that there is an opportunity to use newer satellites with increased temporal and spatial resolution calibrated periodically with a RPM to improve accuracy. As shown here, this could be conducted with an uncalibrated RPM with no necessity of performing pasture cuts, saving a significant amount of labor and reducing operator bias. Additionally, the use of satellite imagery opens the possibility of producing maps (e.g., NDVI or enhanced vegetation index, EVI) to identify areas of high spatial variability, setting in advance more efficient sampling.
A clear difference in the number of observations between both satellites evaluated was observed, which significantly impacted the reliability of the estimations. For Sentinel-2 twin satellites, with a temporal resolution of 5 days, 6 days of cloudy weather could represent 15 days of missing data, which would certainly limit the scope of technology. Contrarily, for Planet’s CubeSats constellation with images available on average every 1.7 days, the impact of cloud cover on the missing data could be significantly reduced. Other factors, such as the sun position or the satellite elevation angle, may also affect the quality and availability of the images [37]. Additionally, it is important to consider that for small paddocks or grazing strips as those typically used in small dairy farms (e.g., less than 1 ha per paddock), the spatial resolution of Sentinel-2 might not be adequate for providing reliable measurements [38]. However, it is also worth mentioning that contrary to Sentinel-2, Planet images are not freely available for commercial use, something that farmers need to consider when assessing the cost-benefit of using one satellite or the other.
Previous studies have shown the possibility of fusing images from two or more satellites [39] as a viable solution for reducing the impact of the missing data. In our experiment, this would have increased, from 42% to 47%, the number of images utilized. Other research showed the potential to integrate satellite with weather data to build more complex growth rate predictive models and overcome some of these issues [24]. Additionally, it has been proposed the use of synthetic-aperture radars (SARs), i.e., satellites that transmit microwaves from an antenna to the surface and receive back the signal, as an option to overcome this problem because they can operate regardless of the weather conditions [17]. However, SARs also present limitations such as problems distinguishing the signal response associated with the vegetation from moisture, and loss of spatial resolution after image processing [17,40]. In contrast, the use of multispectral cameras mounted on unmanned aerial vehicles (UAV) offer more opportunities to deal with low temporal resolutions and weather conditions, providing at the same time images with a high level of detail [41]. For instance, in the United States, Insúa et. al. [34] used UAV to not only estimate pasture biomass accurately, but also map spatial variability with a resolution of 6 cm. These authors also demonstrated that it is possible to accurately predict changes in the nutritive value of grasses through integration of pasture biomass data (derived from UAV) into a model that predicts changes in leaf morphogenesis. Additionally, in Australia, researchers were able to increase the accuracy of biomass estimations by integrating UAV derived spectral and structural data (i.e., height obtained from 3D datasets generated with 2D images) using a machine learning framework [42]. Weekly information on pasture cover and average growth rate is required for accurate pasture management and timely decision-making. In this regard, the weather conditions could have a significant impact on optical satellite data availability, however, other technologies available such as UAV can be used to deal with this.

5. Conclusions

This research showed that ≈70 RPM readings per paddock (approximately 60/ha) sampled across the middle of the paddock could provide an accurate estimation of pasture biomass (±5% error). Weekly monitoring a whole farm with the electronic RPM could cost between $91 and $182 per week, which is more than offset by the economic benefits of monitoring pastures systematically. Current satellite technology has the potential to monitor pasture biomass, reducing the time required for this task but also providing measurements almost every 2 days. However, for achieving a reasonable accuracy, the technology needs to be calibrated, for example, with an electronic RMP with positioning. More research under more extended periods and sites is needed to quantify this accurately. Finally, there is an opportunity to evaluate the use of technologies such as UAVs and other ground-based remote sensors, and the integration of data from multiple sources to improve the accuracy of the estimations.

Author Contributions

Conceptualization, J.G., C.C. and S.G.; methodology, J.G., C.C., P.B. and S.G.; investigation, J.G. and G.d.V.; resources, S.G., N.L. and P.B.; data curation, J.G. and G.d.V.; writing—original draft preparation, J.G.; writing—review and editing, C.C., N.L., P.B. and S.G.; visualization, J.G.; supervision, C.C., N.L. and S.G.; funding acquisition, S.G. and N.L.; all authors have read and agreed to the published version of the manuscript. All authors have read and agreed to the published version of the manuscript.

Funding

This research was part of a collaborative project between the University of Sydney (Sydney, Australia), the NSW Department of Primary Industries (Orange, Australia), and NSW Local Land Services (Hunter Valley, Australia). The first author is the recipient of a Postgraduate Research Scholarship in Automation and Robotics for Dairy Production funded by the NSW Department of Primary Industries and the Dairy Research Foundation (The University of Sydney, Brownlow Hill, Australia).

Acknowledgments

The authors thank The University of Sydney’s dairy farm staff involved in this experiment.

Conflicts of Interest

The authors declare no conflict of interest.

References

  1. Dairy Australia. Dairy Farm Monitor Project. Available online: https://www.dairyaustralia.com.au/farm/farm-business-management/dairy-farm-monitor-project (accessed on 17 April 2020).
  2. Hanrahan, L.; McHugh, N.; Hennessy, T.; Moran, B.; Kearney, R.; Wallace, M.; Shalloo, L. Factors associated with profitability in pasture-based systems of milk production. J. Dairy Sci. 2018, 101, 5474–5485. [Google Scholar] [CrossRef] [PubMed] [Green Version]
  3. Neal, M.; Dela Rue, B.; Eastwood, C. Defining the value proposition for using technology to improve pasture management and harvest more pasture. In Proceedings of the 7th International Tri-Conference for Precision Agriculture, Hamilton, New Zealand, 16–18 October 2017. [Google Scholar]
  4. Clark, C.; Farina, S.; Garcia, S.; Islam, M.; Kerrisk, K.; Fulkerson, W. A comparison of conventional and automatic milking system pasture utilization and pre- and post-grazing pasture mass. Grass Forage Sci. 2016, 71, 153–159. [Google Scholar] [CrossRef]
  5. Clark, C.E.F.; Romera, A.J.; Macdonald, K.A.; Clark, D.A. Inter-paddock annual dry matter yield variability for dairy farms in the Waikato region of New Zealand. N. Z. J. Agric. Res. 2010, 53, 187–191. [Google Scholar] [CrossRef]
  6. Gargiulo, J.I.; Lyons, N.A.; Kempton, K.; Armstrong, D.A.; Garcia, S.C. Physical and economic comparison of pasture-based automatic and conventional milking systems. J. Dairy Sci. 2020, 103. [Google Scholar] [CrossRef] [PubMed]
  7. Fulkerson, W.J.; McKean, K.; Nandra, K.S.; Barchia, I.M. Benefits of accurately allocating feed on a daily basis to dairy cows grazing pasture. Aust. J. Exp. Agric. 2005, 45, 331–336. [Google Scholar] [CrossRef]
  8. Gargiulo, J.I.; Eastwood, C.R.; Garcia, S.C.; Lyons, N.A. Dairy farmers with larger herd sizes adopt more precision dairy technologies. J. Dairy Sci. 2018, 101, 5466–5473. [Google Scholar] [CrossRef]
  9. Hall, A.; Turner, L.; Irvine, L.; Kilpatrick, S. Pasture management and extension on Tasmanian dairy farms-who measures up? Rural Ext. Innov. Syst. J. 2017, 13, 32. [Google Scholar]
  10. Eastwood, C.; Mata, G.; Handcock, R.; Kenny, S. Evaluating satellite-based pasture measurement for Australian dairy farmers. In Proceedings of the Joint International Agricultural Conference, Wageningen, The Netherlands, 6–8 July 2009. [Google Scholar]
  11. García, S.C.; Holmes, C.W. Seasonality of calving in pasture-based dairy systems: Its effects on herbage production, utilisation and dry matter intake. Aust. J. Exp. Agric. 2005, 45, 1–9. [Google Scholar] [CrossRef]
  12. García, S.C. Systems, Component, and Modelling Studies of Pasture-Based Dairy Systems in Which the Cows Calve at Different Times of the Year. Ph.D. Thesis, Massey University, Palmerston North, New Zealand, 2000. [Google Scholar]
  13. Lile, J.; Blackwell, M.; Thomson, N.; Penno, J.; Macdonald, K.; Nicholas, P.; Lancaster, J.; Coulter, M. Practical use of the rising plate meter (RPM) on New Zealand Dairy Farms. Proc. N. Z. Grassl. Assoc. 2001, 63, 159–164. [Google Scholar] [CrossRef]
  14. Thomson, N.; McCallum, D.; Howse, S.; Holmes, C.; Matthews, P.; Matthew, C. Estimation of dairy pastures-the need for standardisation. N. Z. Grassl. Assoc. 1997, 59, 221–226. [Google Scholar] [CrossRef]
  15. French, P.; O’Brien, B.; Shalloo, L. Development and adoption of new technologies to increase the efficiency and sustainability of pasture-based systems. Anim. Prod. Sci. 2015, 55, 931–935. [Google Scholar] [CrossRef]
  16. Punalekar, S.M.; Verhoef, A.; Quaife, T.L.; Humphries, D.; Bermingham, L.; Reynolds, C.K. Application of Sentinel-2A data for pasture biomass monitoring using a physically based radiative transfer model. Remote Sens. Environ. 2018, 218, 207–220. [Google Scholar] [CrossRef]
  17. Ali, I.; Cawkwell, F.; Dwyer, E.; Barrett, B.; Green, S. Satellite remote sensing of grasslands: From observation to management. J. Plant Ecol. 2016, 9, 649–671. [Google Scholar] [CrossRef] [Green Version]
  18. Edirisinghe, A.; Hill, M.; Donald, G.; Hyder, M. Quantitative mapping of pasture biomass using satellite imagery. Int. J. Remote Sens. 2011, 32, 2699–2724. [Google Scholar] [CrossRef]
  19. Mata, G.; Clark, D.; Edirisinghe, A.; Waugh, D.; Minneé, E.; Gherardi, S. Predicting accurate paddock-average pasture cover in Waikato dairy farms using satellite images. N. Z. Grassl. Assoc. 2007, 69, 23. [Google Scholar] [CrossRef]
  20. Hill, M.J.; Donald, G.E.; Hyder, M.W.; Smith, R.C.G. Estimation of pasture growth rate in the south west of Western Australia from AVHRR NDVI and climate data. Remote Sens. Environ. 2004, 93, 528–545. [Google Scholar] [CrossRef]
  21. Eastwood, C.; Kenny, S. Art or science?: Heuristic versus data driven grazing management on dairy farms. Ext. Farming Syst. J. 2009, 5, 95. [Google Scholar]
  22. Asher, M.; Raedts, P.; Harrison, M.; Hills, J.; Rawnsley, R. Estimating pasture biomass with Planet Labs CubeSats. In Proceedings of the 2018 Australasian Dairy Science Symposium, Palmerston North, New Zealand, 21–23 November 2018; pp. 196–198. [Google Scholar]
  23. Anderson, G.P.; Rawlings, M.; Lunniss, Z.; McNAUGHTON, L.; Rossi, L.; Wims, C.; Roach, C.; Ludemann, C.I. Use of pasture botanical composition data on the accuracy of satellite pasture biomass estimates. J. N. Z. Grassl. 2019, 81, 249–254. [Google Scholar] [CrossRef]
  24. Romera, A.; Beukes, P.; Clark, D.; Clark, C.; Tait, A. Pasture growth model to assist management on dairy farms: Testing the concept with farmers. Grassl. Sci. 2013, 59, 20–29. [Google Scholar] [CrossRef]
  25. MLA. Real Time Measurement of Pasture Quantity. Available online: https://www.mla.com.au/research-and-development/search-rd-reports/final-report-details/Real-time-measurement-of-pasture-quantity/3647 (accessed on 5 May 2020).
  26. Schaefer, M.T.; Lamb, D.W. A combination of plant NDVI and LiDAR measurements improve the estimation of pasture biomass in tall fescue (Festuca arundinacea var. Fletcher). Remote Sens. 2016, 8, 109. [Google Scholar] [CrossRef] [Green Version]
  27. Dabove, P.; Di Pietra, V.; Piras, M. GNSS Positioning Using Mobile Devices with the Android Operating System. ISPRS Int. J. Geo-Inf. 2020, 9, 220. [Google Scholar] [CrossRef] [Green Version]
  28. ESA. Sentinel-2 Program. Available online: https://sentinel.esa.int/web/sentinel/missions/sentinel-2 (accessed on 27 March 2020).
  29. Planet Team. Planet Application Program Interface: In Space for Life on Earth. San Francisco, CA. Available online: https://api.planet.com (accessed on 5 March 2020).
  30. Tucker, C.J. Red and photographic infrared linear combinations for monitoring vegetation. Remote Sens. Environ. 1979, 8, 127–150. [Google Scholar] [CrossRef] [Green Version]
  31. Garcia, S.C.; Fulkerson, W.J.; Brookes, S.U. Dry matter production, nutritive value and efficiency of nutrient utilization of a complementary forage rotation compared to a grass pasture system. Grass Forage Sci. 2008, 63, 284–300. [Google Scholar] [CrossRef]
  32. Jenquip. Handbook EC10 Platemeter. Available online: https://www.jenquip.nz/wp-content/uploads/2019/05/Handbook-EC10-Generic-web-.pdf (accessed on 19 June 2020).
  33. Thomson, N.A.; Blackwell, M. The new pasture assessment model. Proc. South Isl. Dairy Event 1999, 1, 60–67. [Google Scholar]
  34. Insua, J.R.; Utsumi, S.A.; Basso, B. Estimation of spatial and temporal variability of pasture growth and digestibility in grazing rotations coupling unmanned aerial vehicle (UAV) with crop simulation models. PLoS ONE 2019, 14, e0212773. [Google Scholar] [CrossRef] [PubMed] [Green Version]
  35. Cleveland, W.S. Robust locally weighted regression and smoothing scatterplots. J. Am. Stat. Assoc. 1979, 74, 829–836. [Google Scholar] [CrossRef]
  36. Dairy Australia. In Focus 2019: The Australian Dairy Industry. Available online: https://www.dairyaustralia.com.au/-/media/dairyaustralia/documents/about-dairy-australia/key-publications/infocus-2019_final.pdf?la=en&hash=2E3AC335EB665671468CDC7EA557BD0DDFBDA067 (accessed on 5 May 2020).
  37. Epiphanio, J.N.; Huete, A.R. Dependence of NDVI and SAVI on sun/sensor geometry and its effect on fAPAR relationships in Alfalfa. Remote Sens. Environ. 1995, 51, 351–360. [Google Scholar] [CrossRef]
  38. Vajsová, B.; Fasbender, D.; Wirnhardt, C.; Lemajic, S.; Devos, W. Assessing Spatial Limits of Sentinel-2 Data on Arable Crops in the Context of Checks by Monitoring. Remote Sens. 2020, 12, 2195. [Google Scholar]
  39. Gašparović, M.; Medak, D.; Pilaš, I.; Jurjević, L.; Balenović, I. Fusion of Sentinel-2 and PlanetScope Imagery for Vegetation Detection and Monitorin. In Proceedings of the Volumes ISPRS TC I Mid-term Symposium Innovative Sensing-From Sensors to Methods and Applications, Karlsruhe, Germany, 10–12 October 2018. [Google Scholar]
  40. Sonobe, R. Combining ASNARO-2 XSAR HH and Sentinel-1 C-SAR VH/VV polarization data for improved crop mapping. Remote Sens. 2019, 11, 1920. [Google Scholar] [CrossRef] [Green Version]
  41. von Bueren, S.K.; Burkart, A.; Hueni, A.; Rascher, U.; Tuohy, M.P.; Yule, I. Deploying four optical UAV-based sensors over grassland: Challenges and limitations. Biogeosciences 2015, 12, 163–175. [Google Scholar] [CrossRef] [Green Version]
  42. Karunaratne, S.; Thomson, A.; Morse-McNabb, E.; Wijesingha, J.; Stayches, D.; Copland, A.; Jacobs, J. The Fusion of Spectral and Structural Datasets Derived from an Airborne Multispectral Sensor for Estimation of Pasture Dry Matter Yield at Paddock Scale with Time. Remote Sens. 2020, 12, 2017. [Google Scholar] [CrossRef]
Figure 1. Location of the two paddocks evaluated in the study at the University of Sydney’s dairy farm (Camden, New South Wales, Australia). Maps were created using ArcMap™.
Remotesensing 12 03222 g001
Figure 2. Schematic representation of the different walking patterns evaluated: Zigzag (●); M = M-shape (), V = V-shape (); LR = left to right transects (); RL = right to left transects (); T = individual transects (). Numbers indicate the different repetitions within each pattern evaluated.
Remotesensing 12 03222 g002
Figure 3. Calibration equations of compressed height into pasture biomass (kg DM/ha) for the electronic rising plate meter (,—) and normalized difference vegetation index (NDVI) into pasture biomass for Planet satellite (;—) and Sentinel satellite (;—), for regrowth periods 1 and 2 (R1 and R2, respectively).
Remotesensing 12 03222 g003
Figure 4. Effect of the number of readings on the accuracy of the rising plate meter. Zero represents the pasture biomass of the paddock when all the readings of a specific date were averaged. The purple area shows the confidence interval (CI, 95%). Confidence interval’s upper and lower limits values were smoothed using locally weighted scatterplot smoothing (LOESS).
Remotesensing 12 03222 g004
Figure 5. Linear regressions showing the coefficients of determination (R2) and root mean square error (RMSE) of the different walking patterns evaluated and the zigzag pattern (considered as the control mean). 1 to 8 = individual transects from 1 to 8 (); LR = all left to right transects (); M = two M-shape patterns (); RL = all right to left transects (); V = four V-shape patterns ().
Remotesensing 12 03222 g005
Figure 6. (a) Average pasture biomass (kg DM/ha) per regrowth period (R1 and R2) for the electronic rising plate meter (●,—), Planet satellite (■;—), and Sentinel-2 satellite (▲;—). Each data point shows the average of the two paddocks evaluated in the experiment. (b) Linear regressions per regrowth period for each sensor, the slopes of the lines indicate the daily pasture growth rate (kg DM/ha.d).
Remotesensing 12 03222 g006
Figure 7. Linear regressions show the comparison of different calibration methodologies (DM/ha estimated) against the calibrated rising plate meter (DM/ha Control). Uncalibrated RPM = rising plate meter calibrated with standard equations (RPM 1: daily equation, RPM 2: monthly equation, RPM 3: Annual equation). Satellite-calibrated RPM = satellite calibrated with a calibrated rising plate meter. Satellite-uncalibrated RPM = satellite calibrated with a rising plate meter calibrated with standardized equations. Uncalibrated satellite = satellite calibrated with a standard NDVI to biomass equations. Observations for regrowth 1 () and regrowth 2 () are shown in the figures, together with the regression equations, coefficients of determination (R2), and the root means square errors (RMSE).
Remotesensing 12 03222 g007
Table 1. Number of days with satellite images available, discarded due to high cloud cover and utilized in the study. Details provided for Sentinel-2 and Planet CubeSats for each regrowth period.
ImagesR1R2
Sentinel-2PlanetSentinel-2Planet
Available411620
High cloud cover2227
Utilized29413
R1: regrowth 1, R2: regrowth 2.
Table 2. Standardized calibration equations evaluated for converting rising plate meter (RPM) compressed height into pasture biomass (kg DM/ha).
MonthDayRPM
Daily 1Monthly 2Annual 3
October1–13 y = 104 h y = 115 h + 850 y = 140 h + 500
14–20 y = 103 h
21–31 y = 102 h
November1–3 y = 102 h y = 120 h + 1000
4–10 y = 101 h
11–17 y = 100 h
18–24 y = 99 h
25–30 y = 98 h
December1–8 y = 98 h y = 140 h + 1200
9–15 y = 97 h
16–22 y = 96 h
23–30 y = 95 h
31 y = 94 h
RPM = rising plate meter; h = compressed height (cm); 1 Daily calibration equations developed in Camden (Australia) by Garcia et al. [31]; 2 and 3 Monthly and annual calibration equations provided by the RPM manufacturer.
Table 3. Different standardized calibration equations for converting normalized difference vegetation index (NDVI) into pasture biomass (kg DM/ha) evaluated in the study.
ItemEquation
Uncalibrated satellite 1 y = 10.05 e 7.82 N D V I
Uncalibrated satellite 2 y = 111.44 e 4.08 N D V I
Uncalibrated satellite 3 y = 96.36 e 4.96 N D V I
Uncalibrated satellite 4 y = 71.35 e 4.88 N D V I
Uncalibrated satellite 5 y = 69.63 e 4.61 N D V I
NDVI = normalized difference vegetation index; Uncalibrated satellite 1 to 4 = NDVI to biomass calibration equations published for Australia by MLA [25]; Uncalibrated satellite 5 = NDVI to biomass calibration equation published for the United States by Insua et al. [34].

