Hyperspectral and Thermal Sensing of Stomatal Conductance, Transpiration, and Photosynthesis for Soybean and Maize under Drought

 ,
,  ,
,  ,
, 
Abstract
1. Introduction
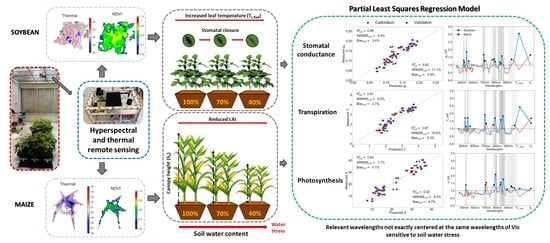
- Assess responses to soil water stress of soybean and maize physiology (canopy ET, leaf gs, leaf Tr and leaf A), morphology (hc, LAI), biochemistry (chl), and remote sensing (TL,Rad and reflectance) variables.
- Investigate PLS-R as a method to model leaf gs, Tr, and A using hyperspectral data and identify the most relevant wavelengths contributing to the model as well as the model improvement when incorporating TL,Rad and hc into the models.
2. Materials and Methods
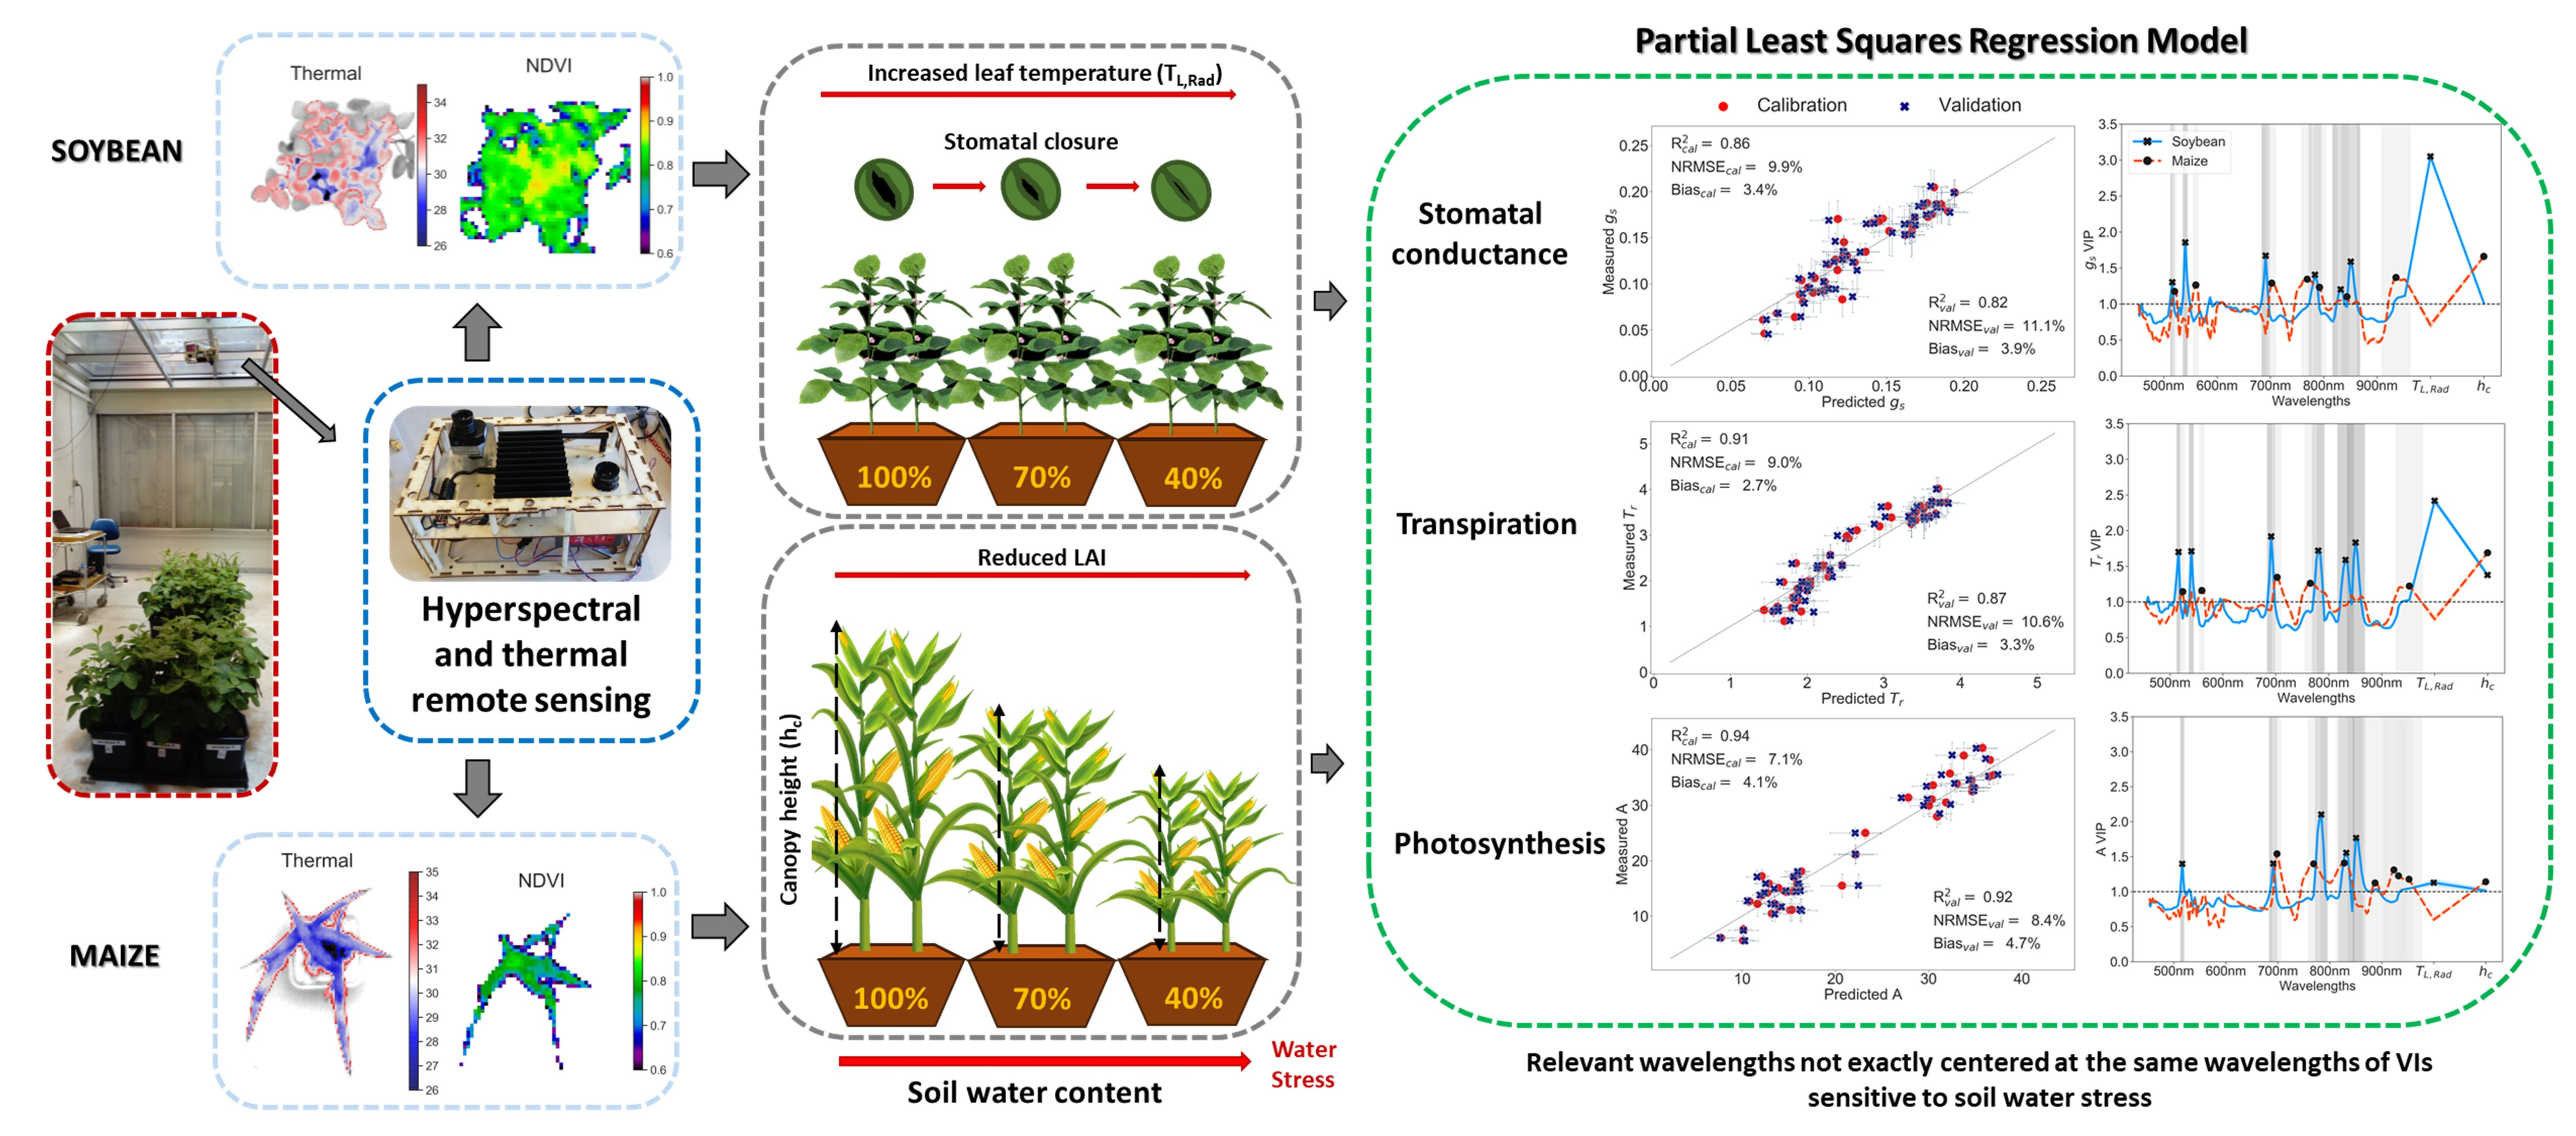
2.1. Experimental Design
2.2. Gas Exchange and Plant Measurements
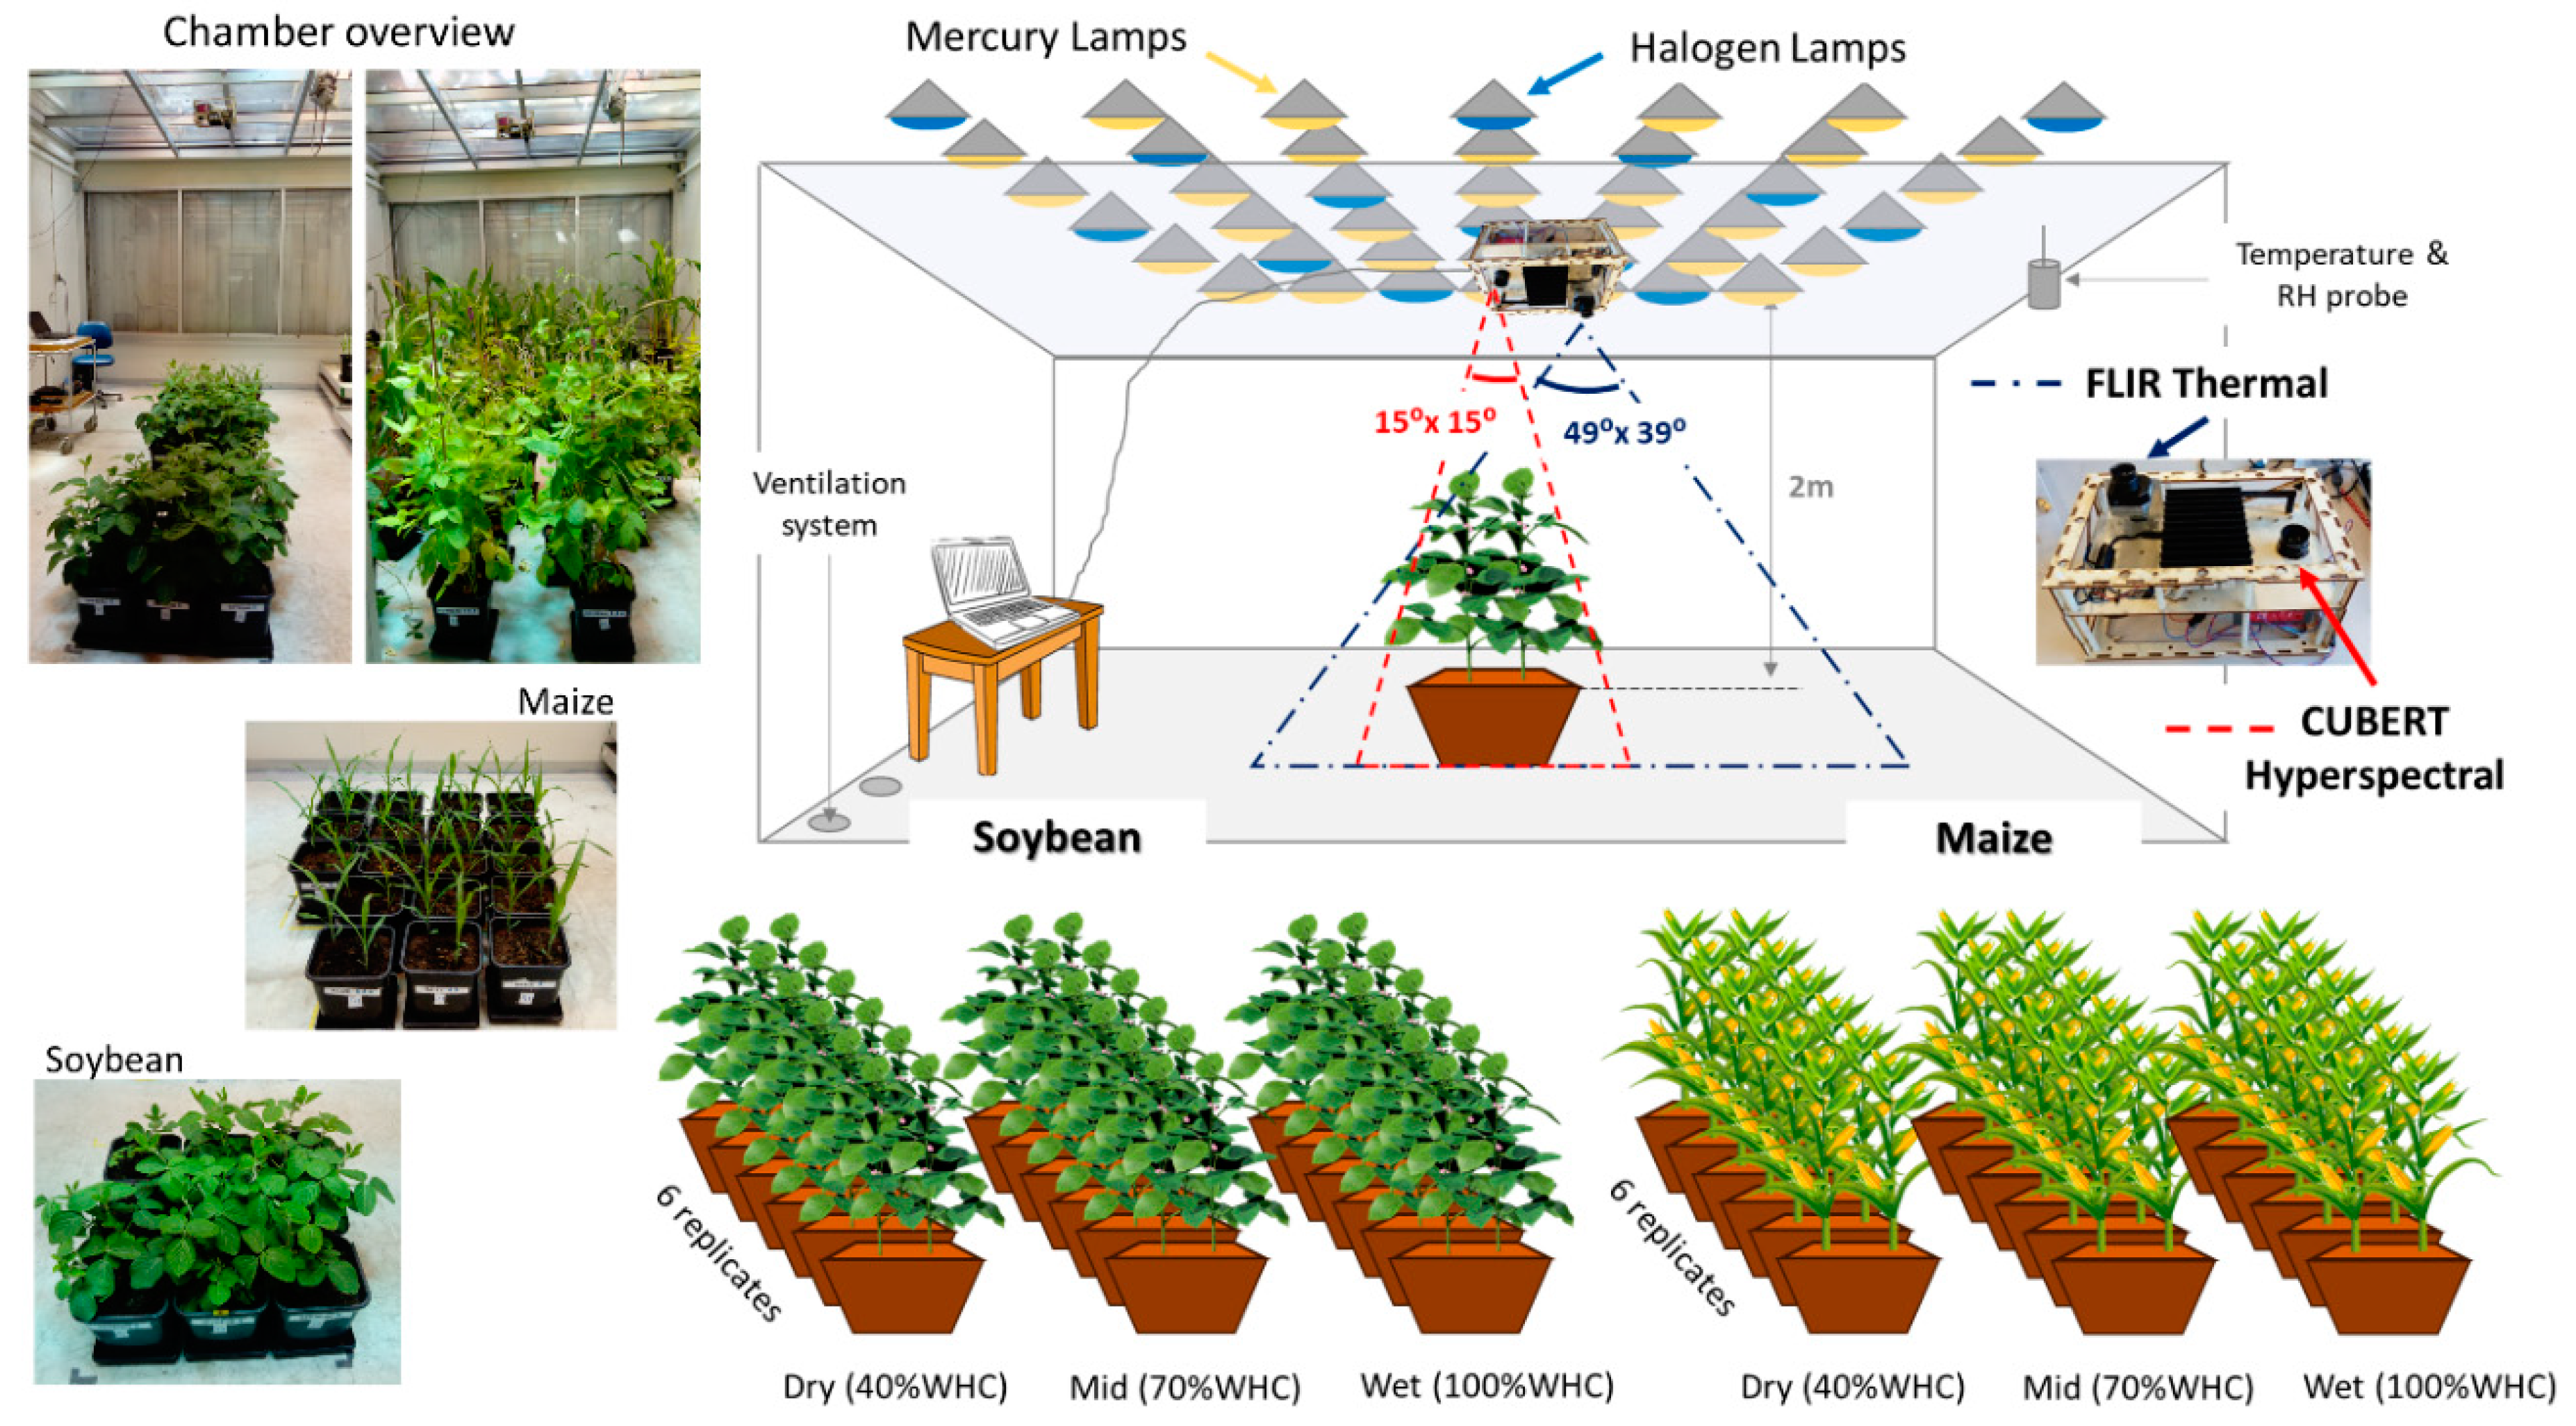
2.3. Remote Sensing Measurements
2.3.1. Image Pre-Processing
Hyperspectral Images
Thermal Images
2.3.2. Spectral Indices to Predict Leaf Physiology
2.4. Statistical Analysis
2.4.1. Analysis of Variance and Post-Hoc Test
2.4.2. Partial Least Squares Regression (PLS-R) Modeling
PLS-R Preprocessing
PLS-R Selection and Assessment
3. Results
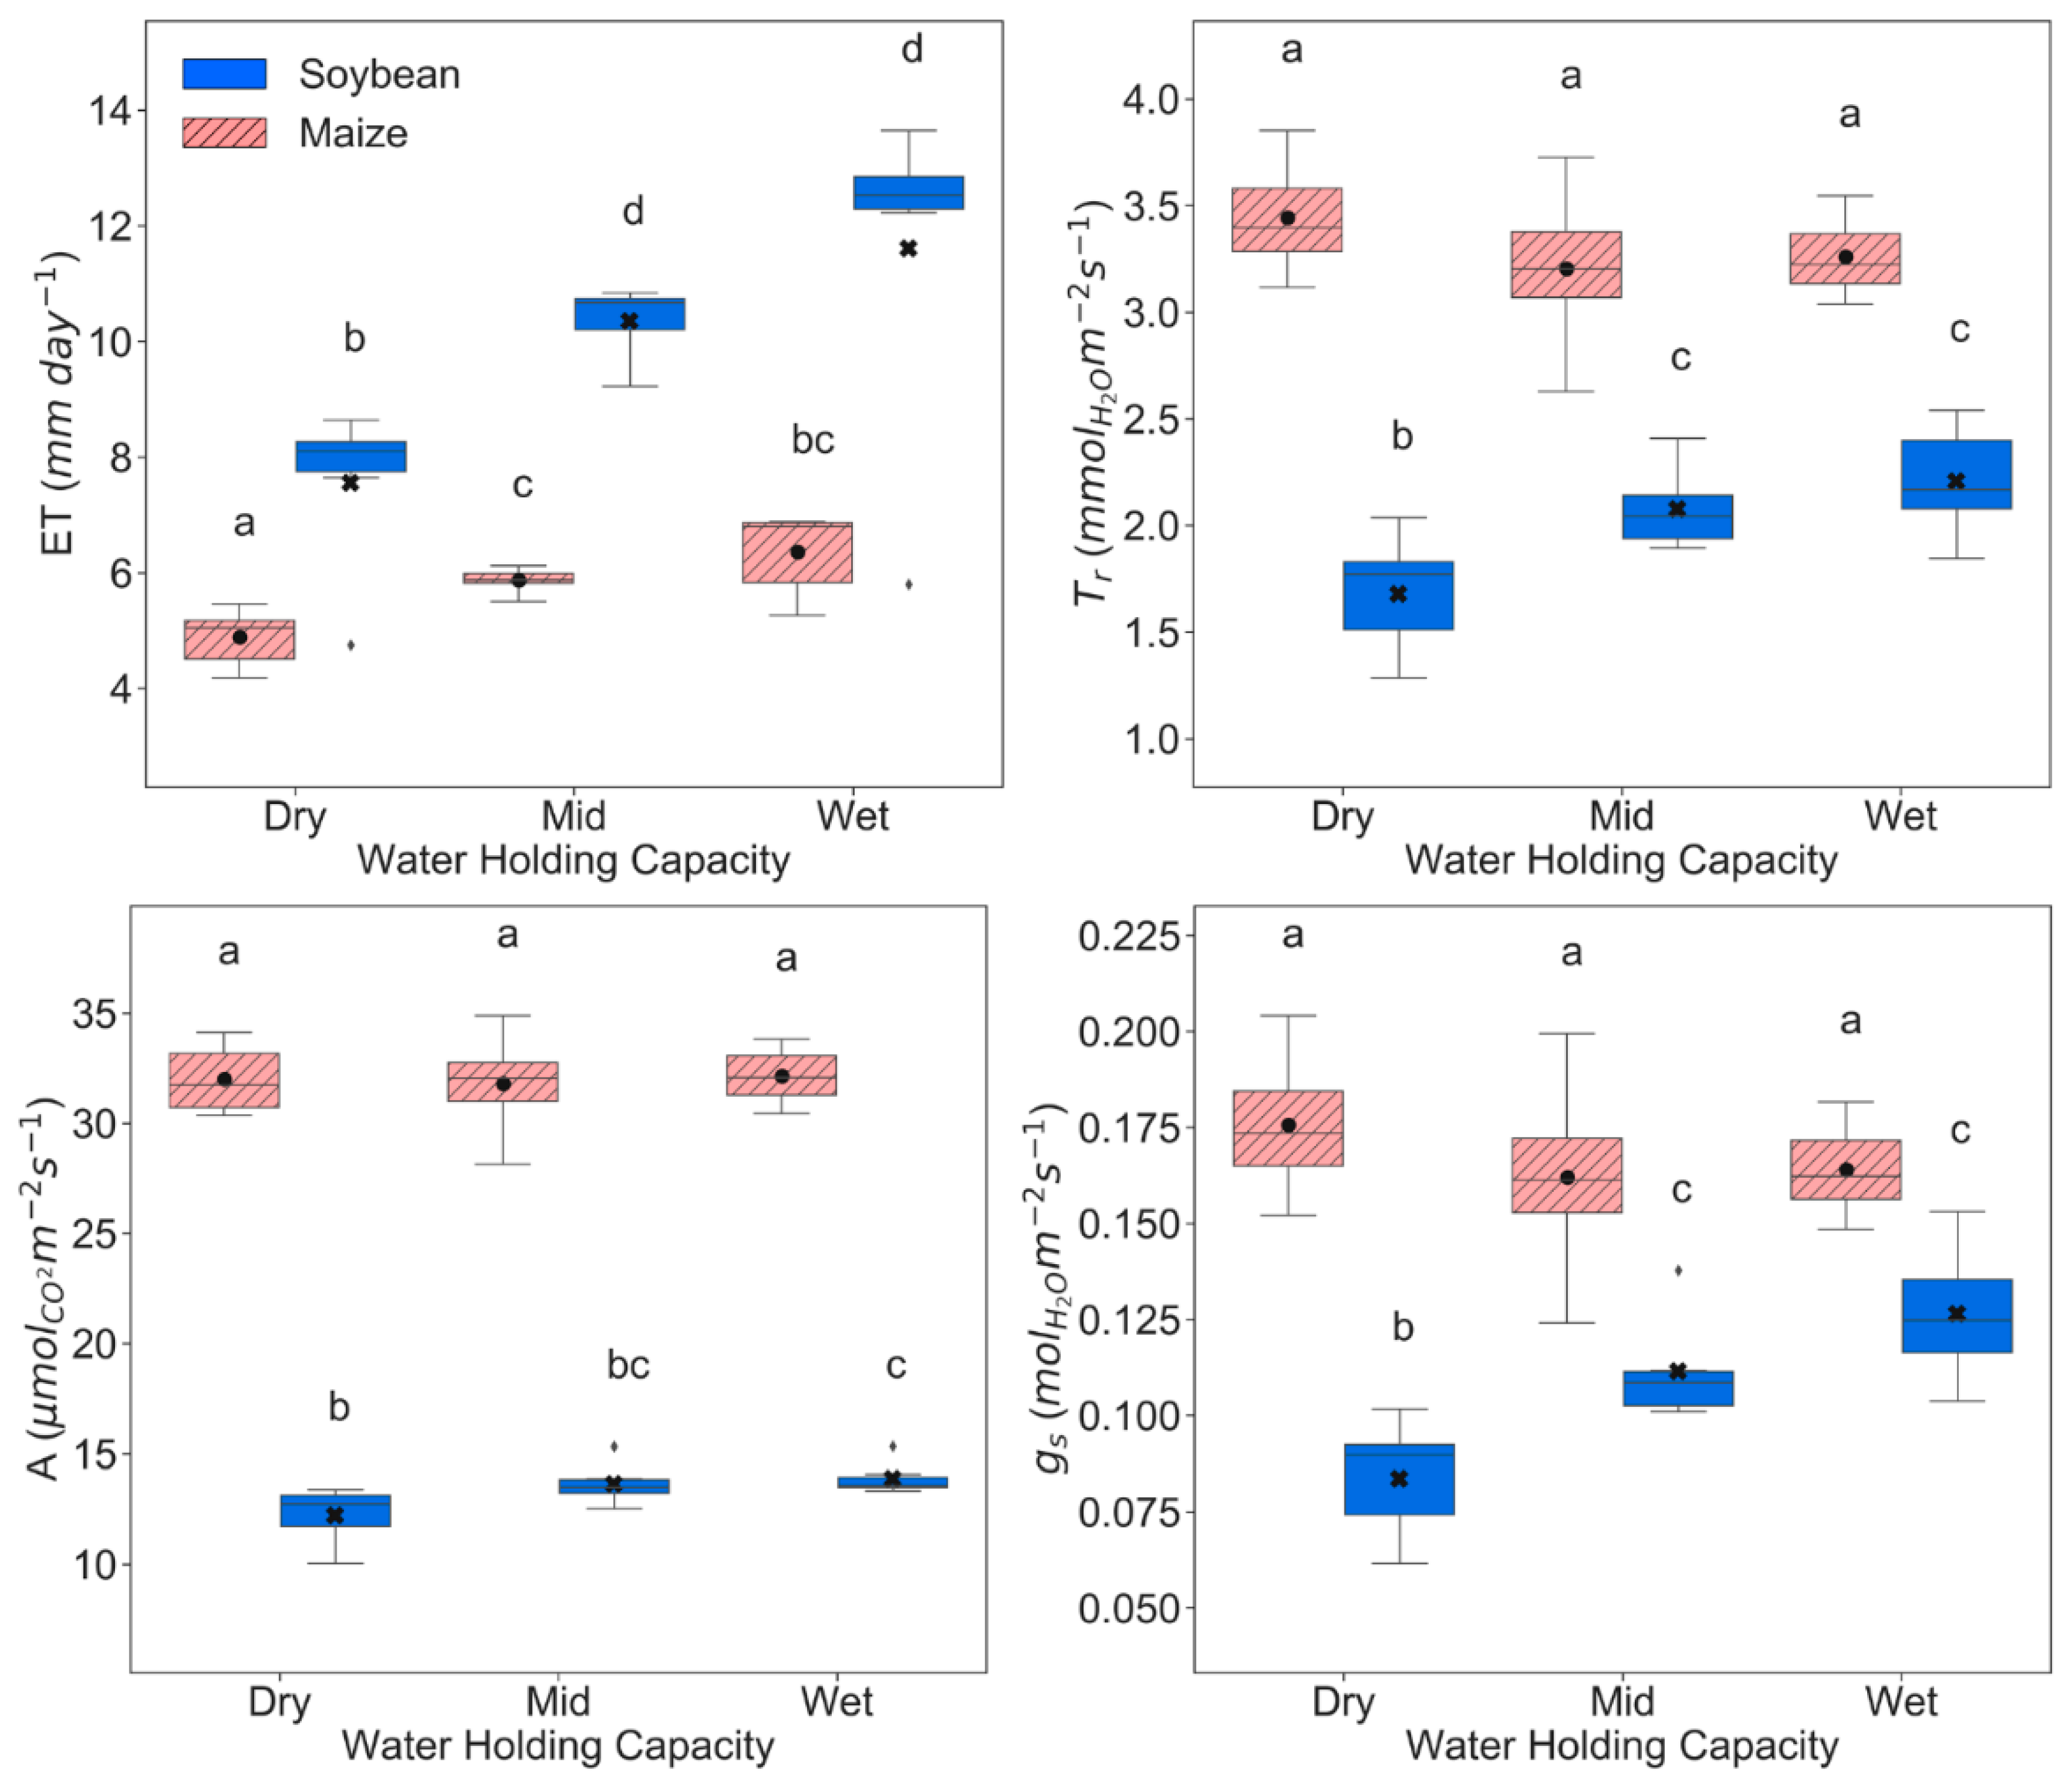
3.1. Physiological, Biochemical, and Morphological Responses
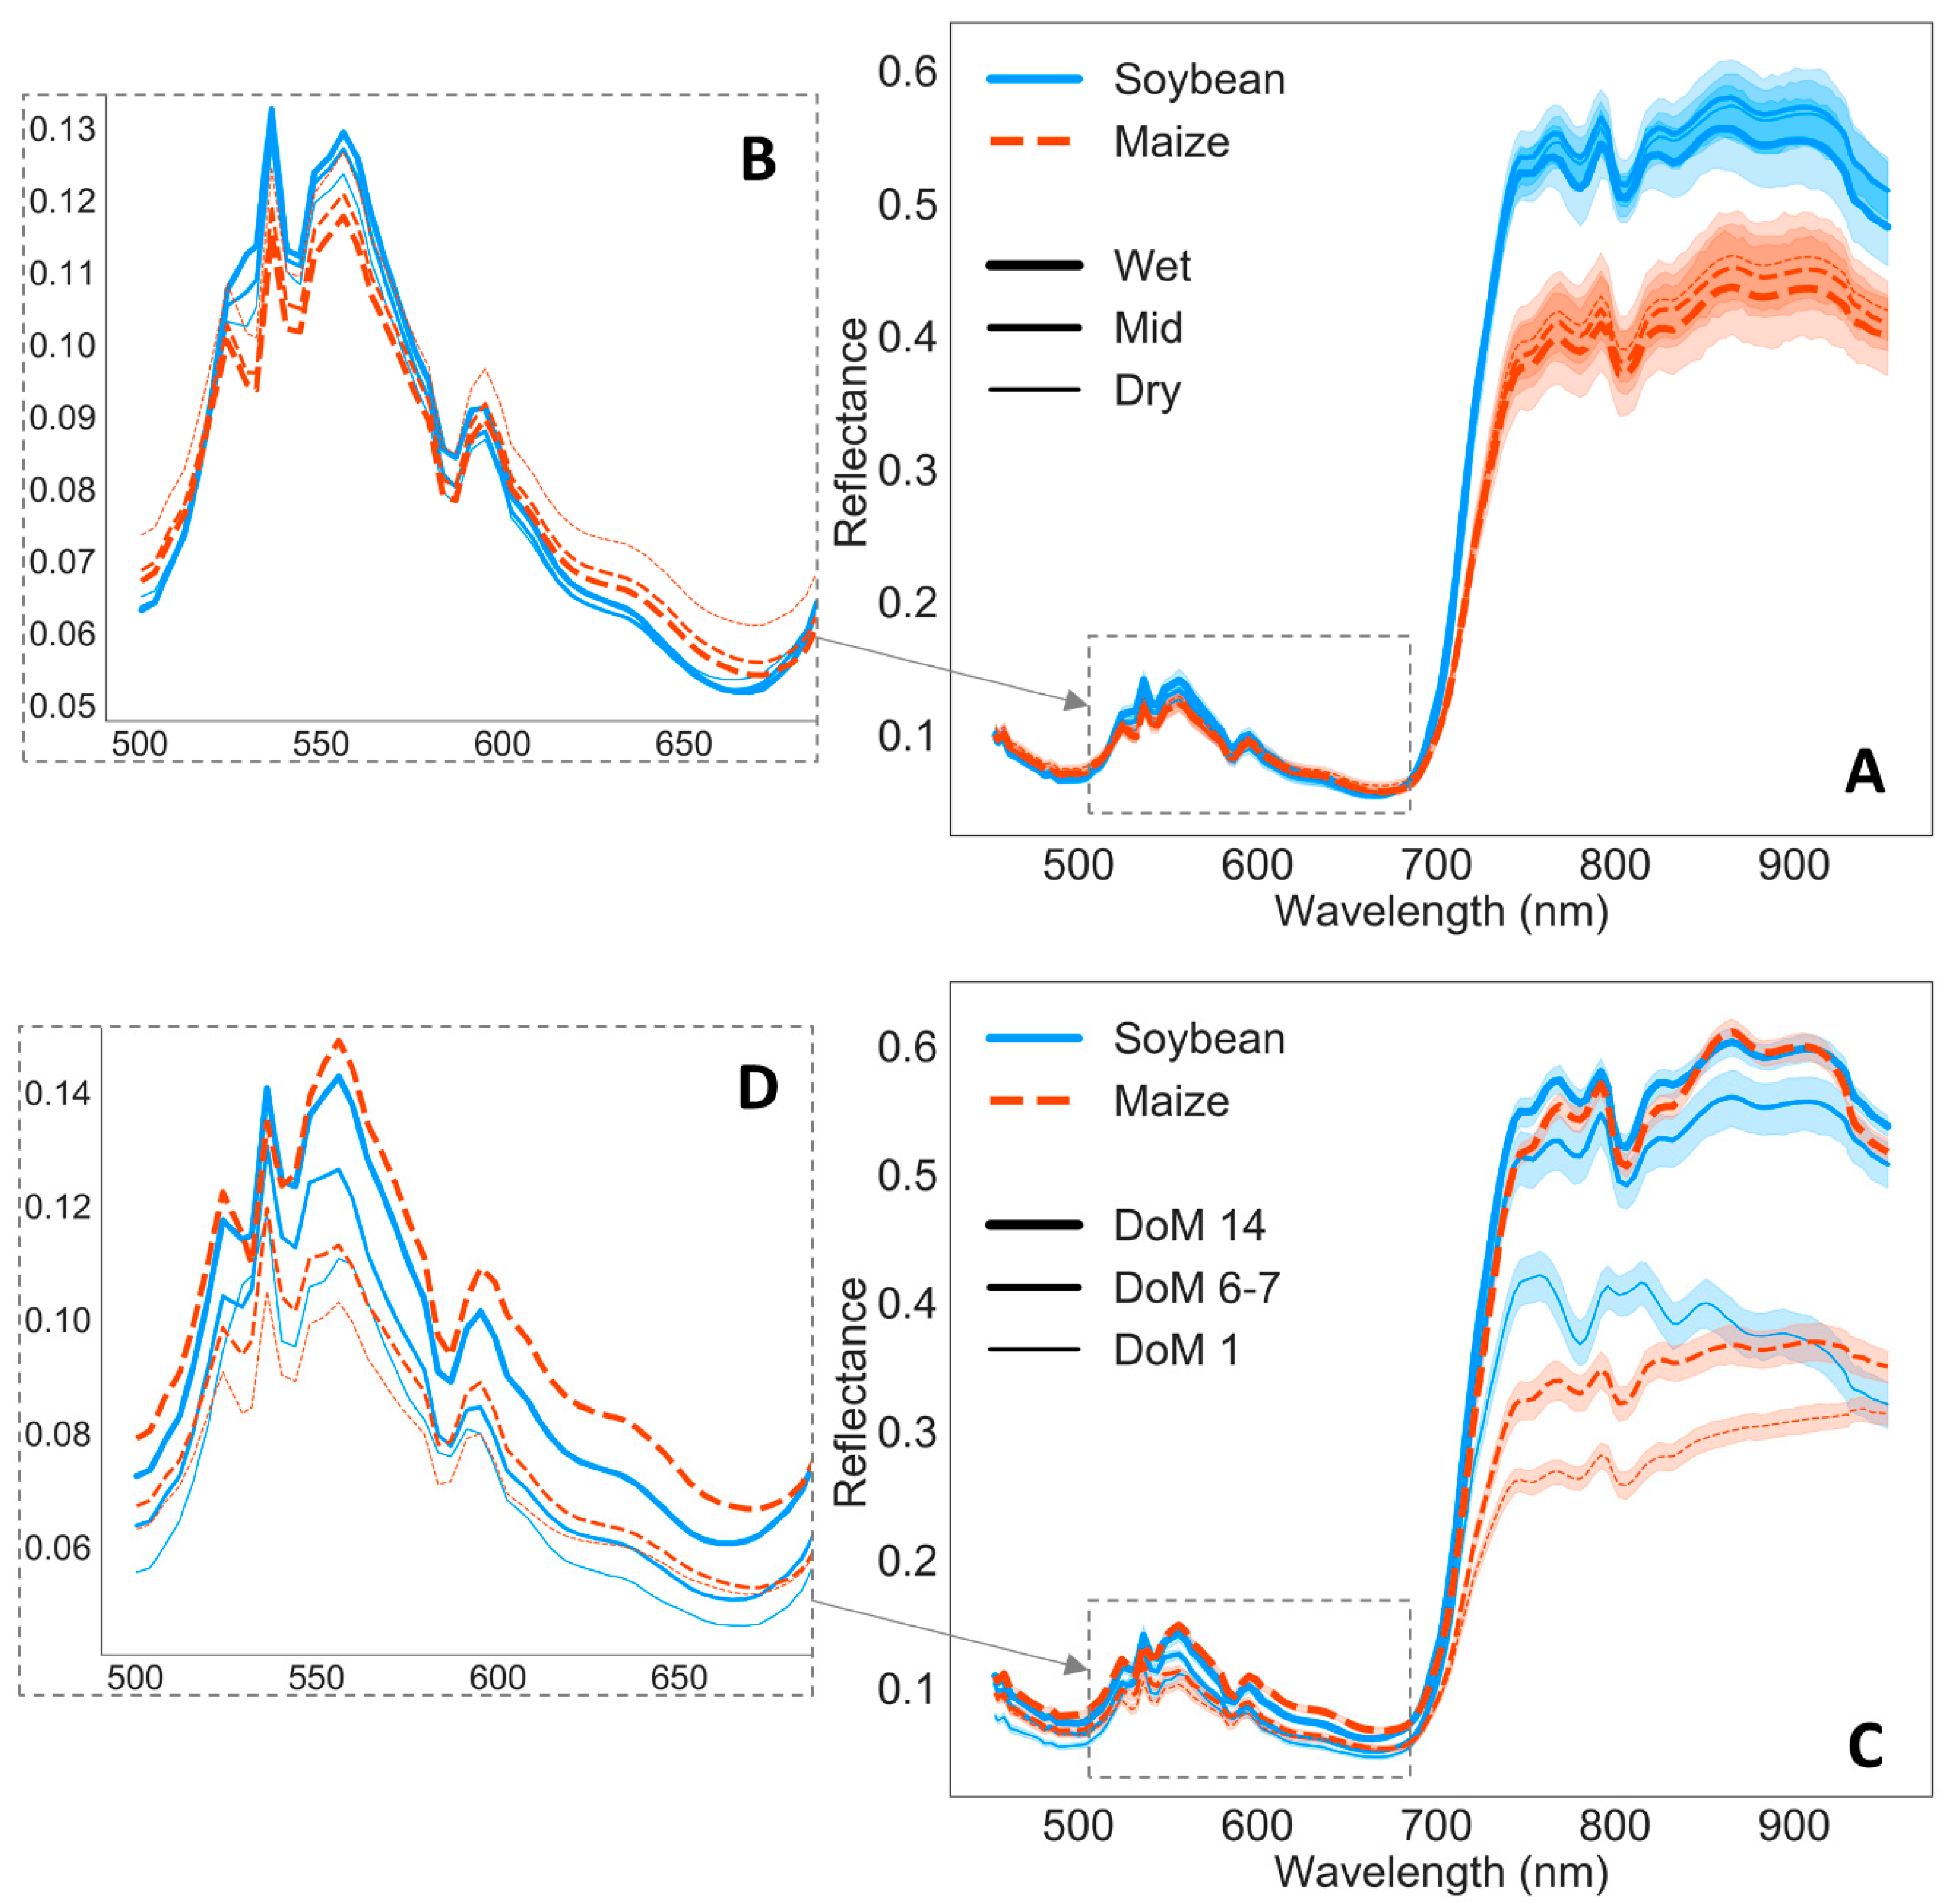
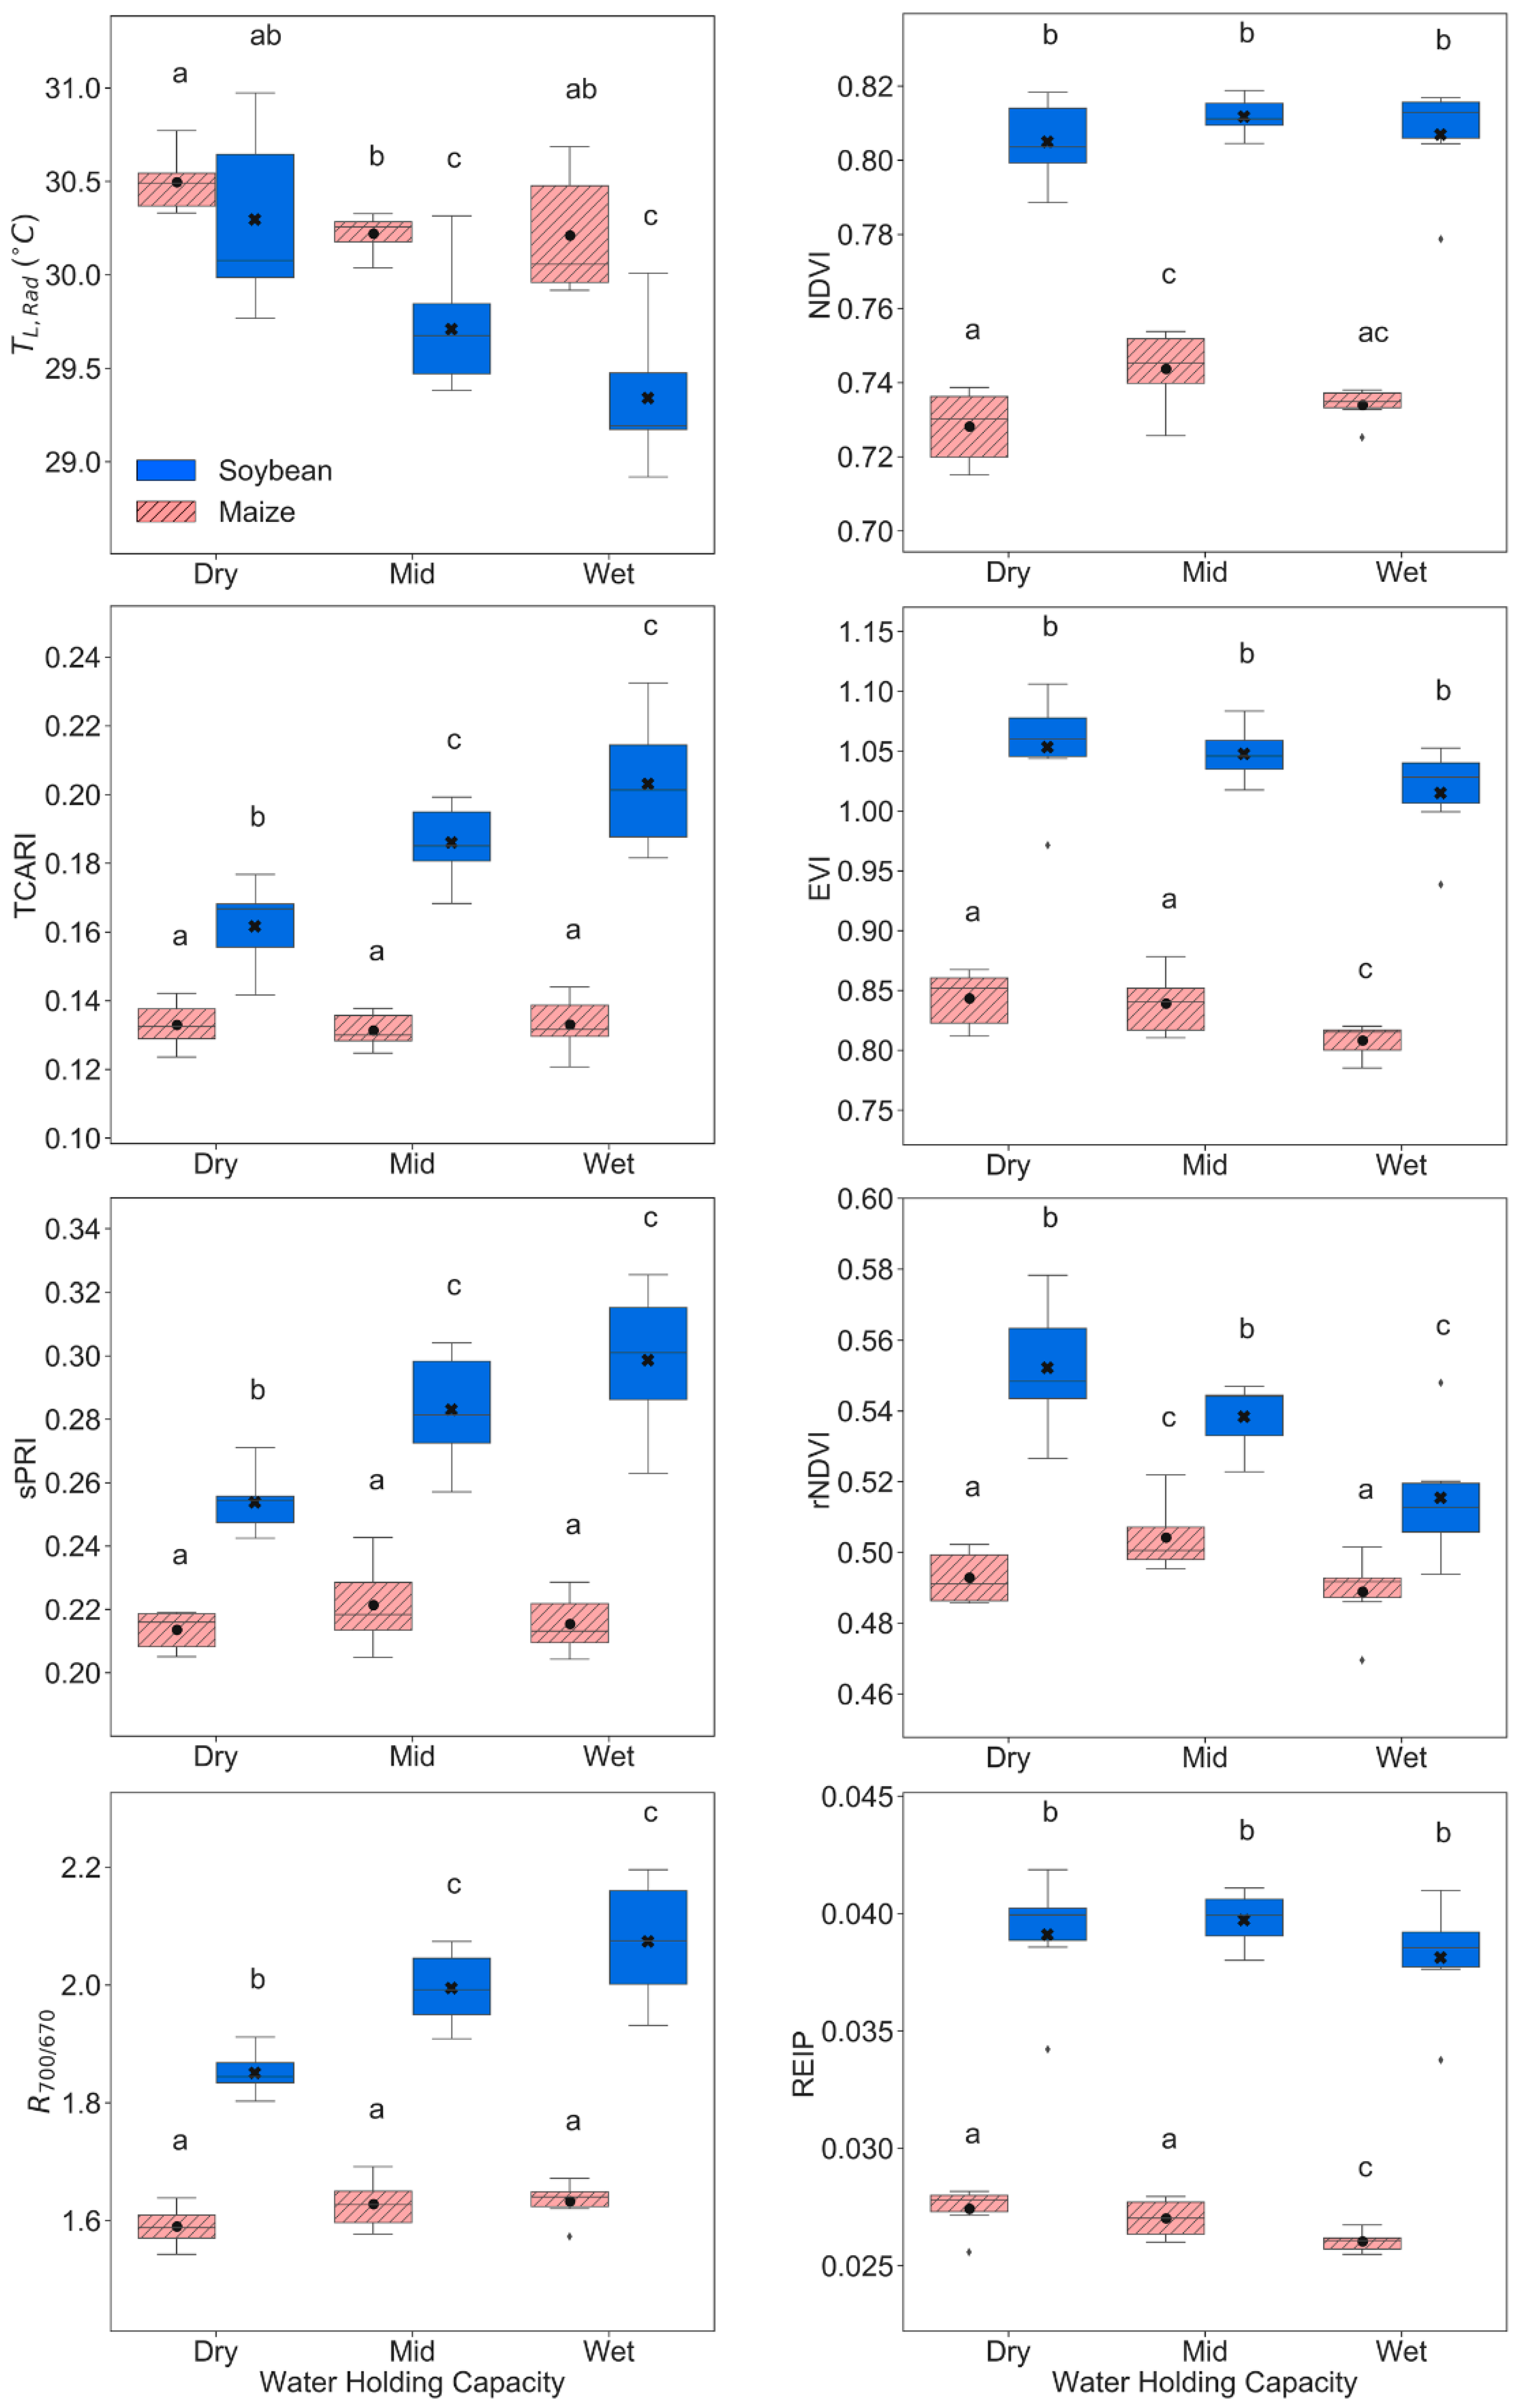
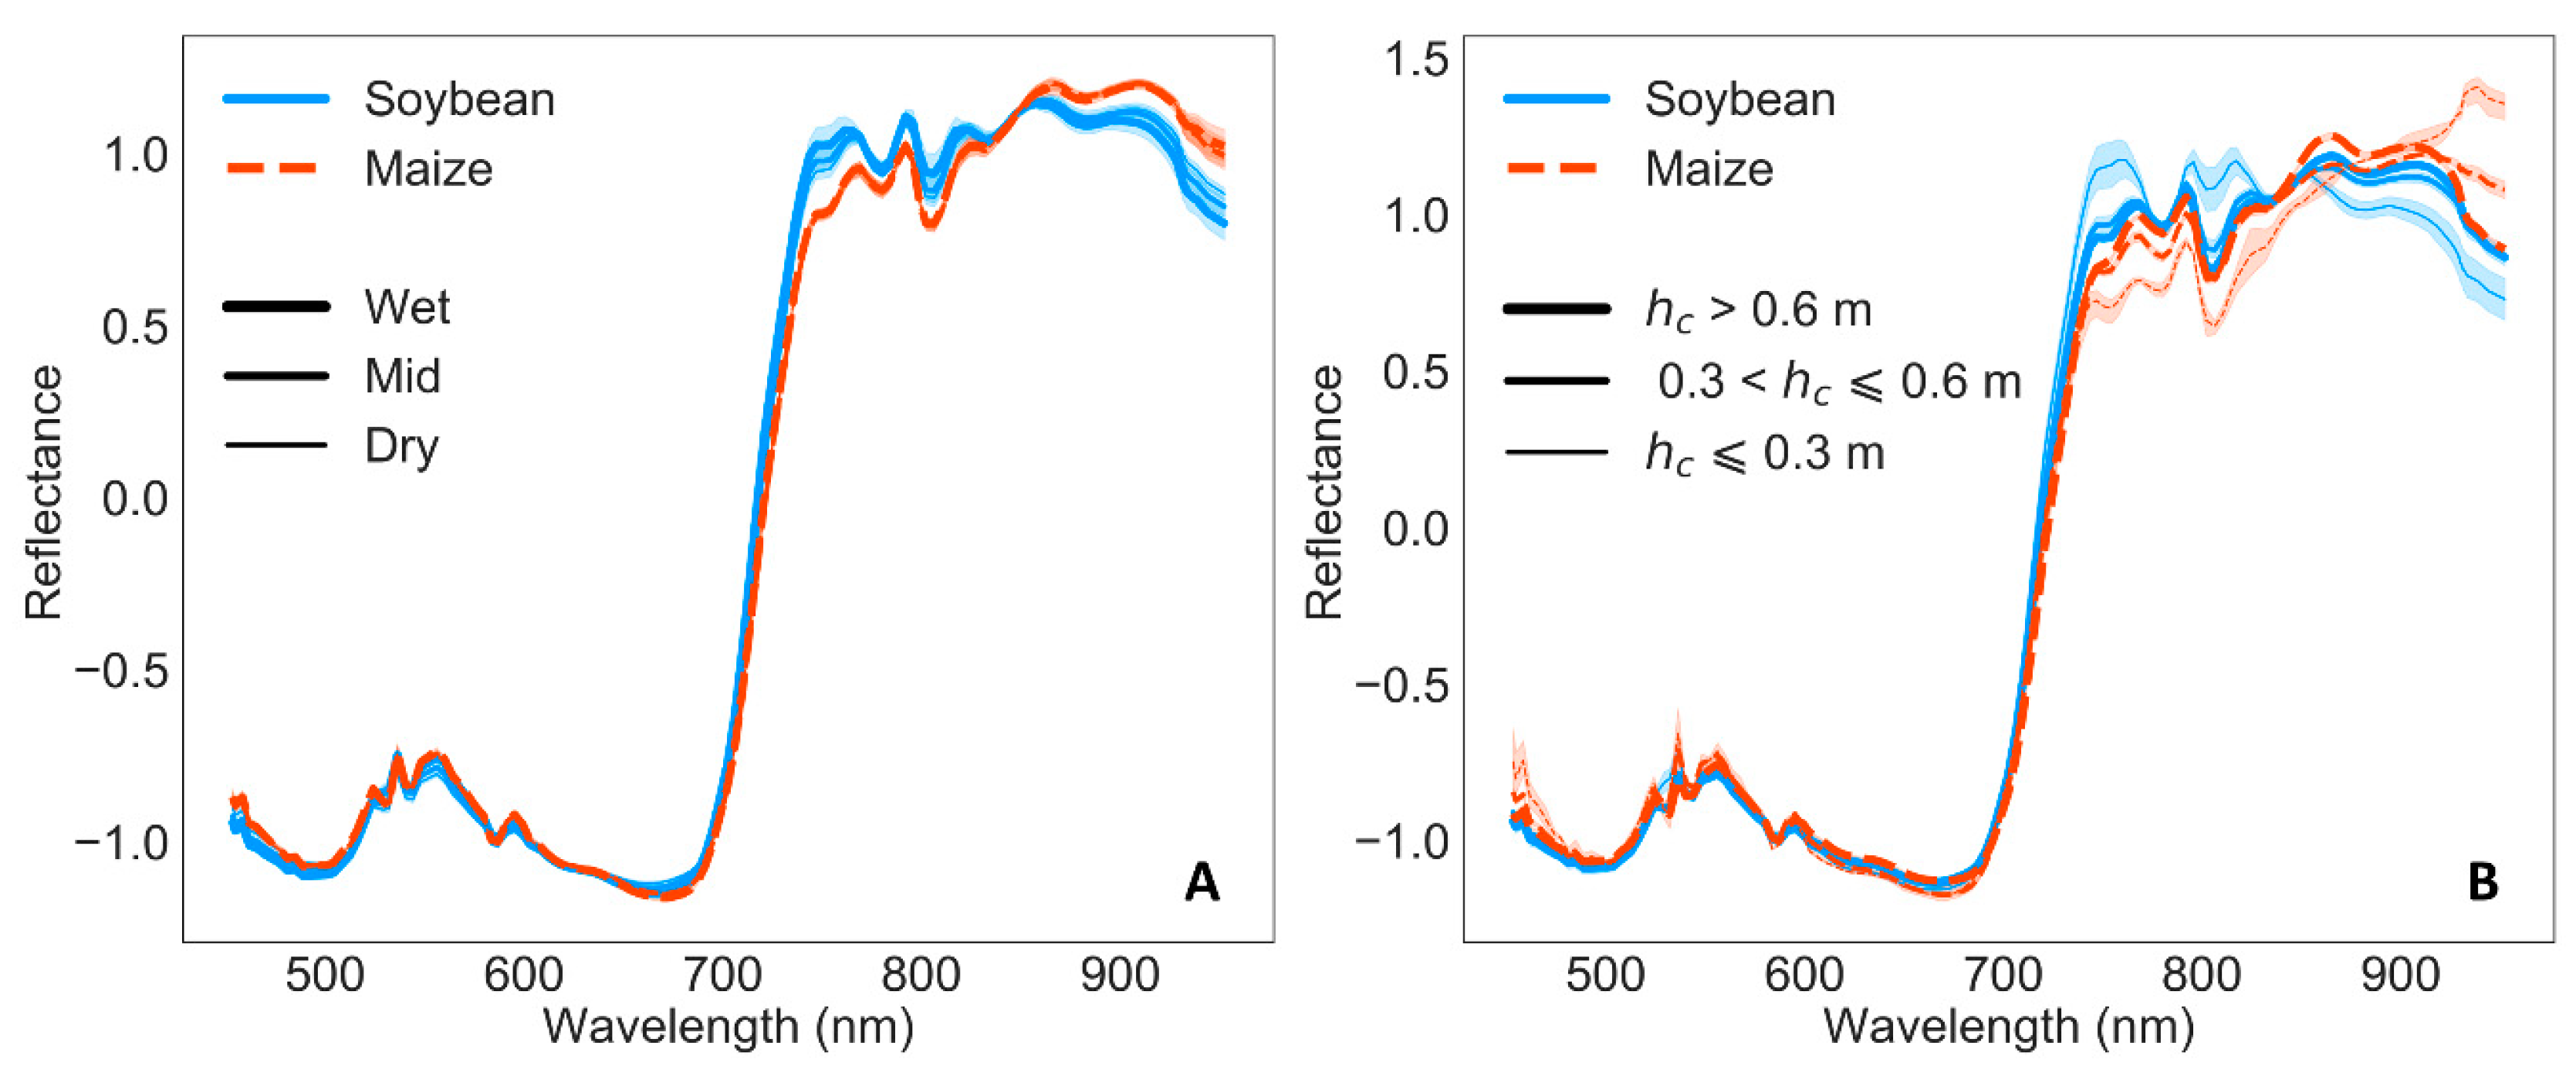
3.2. Remote Sensing Responses
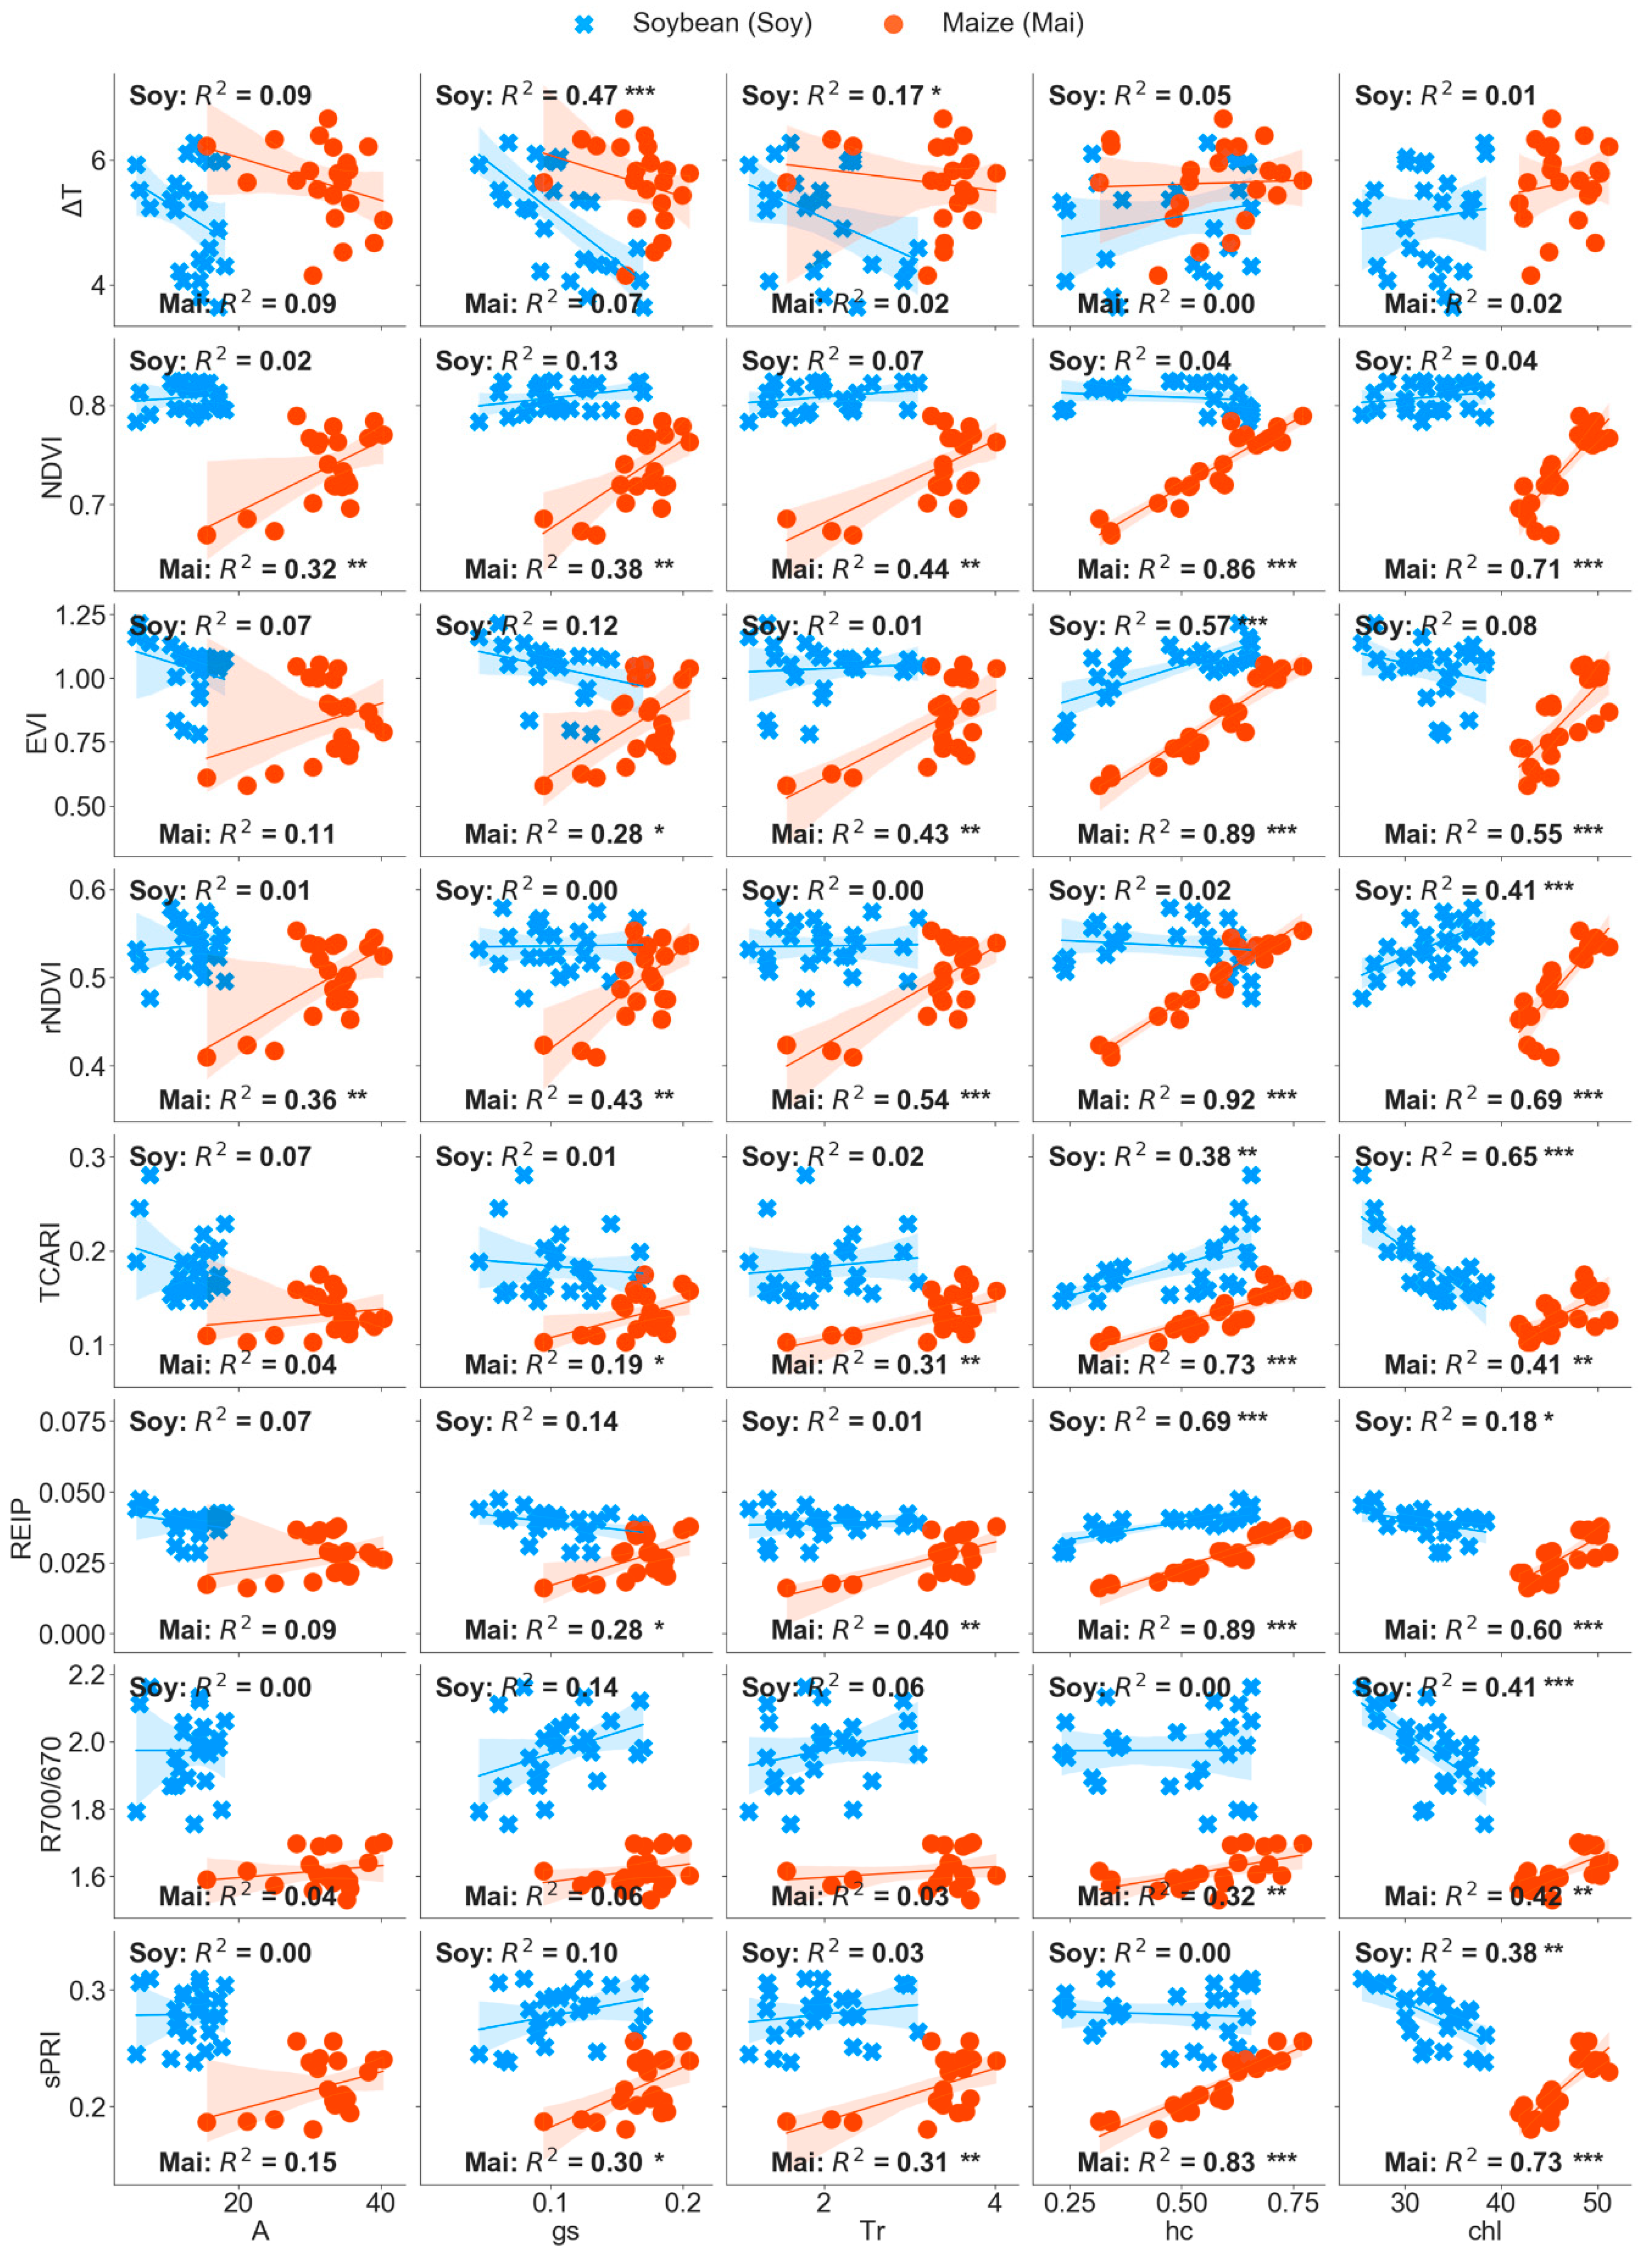
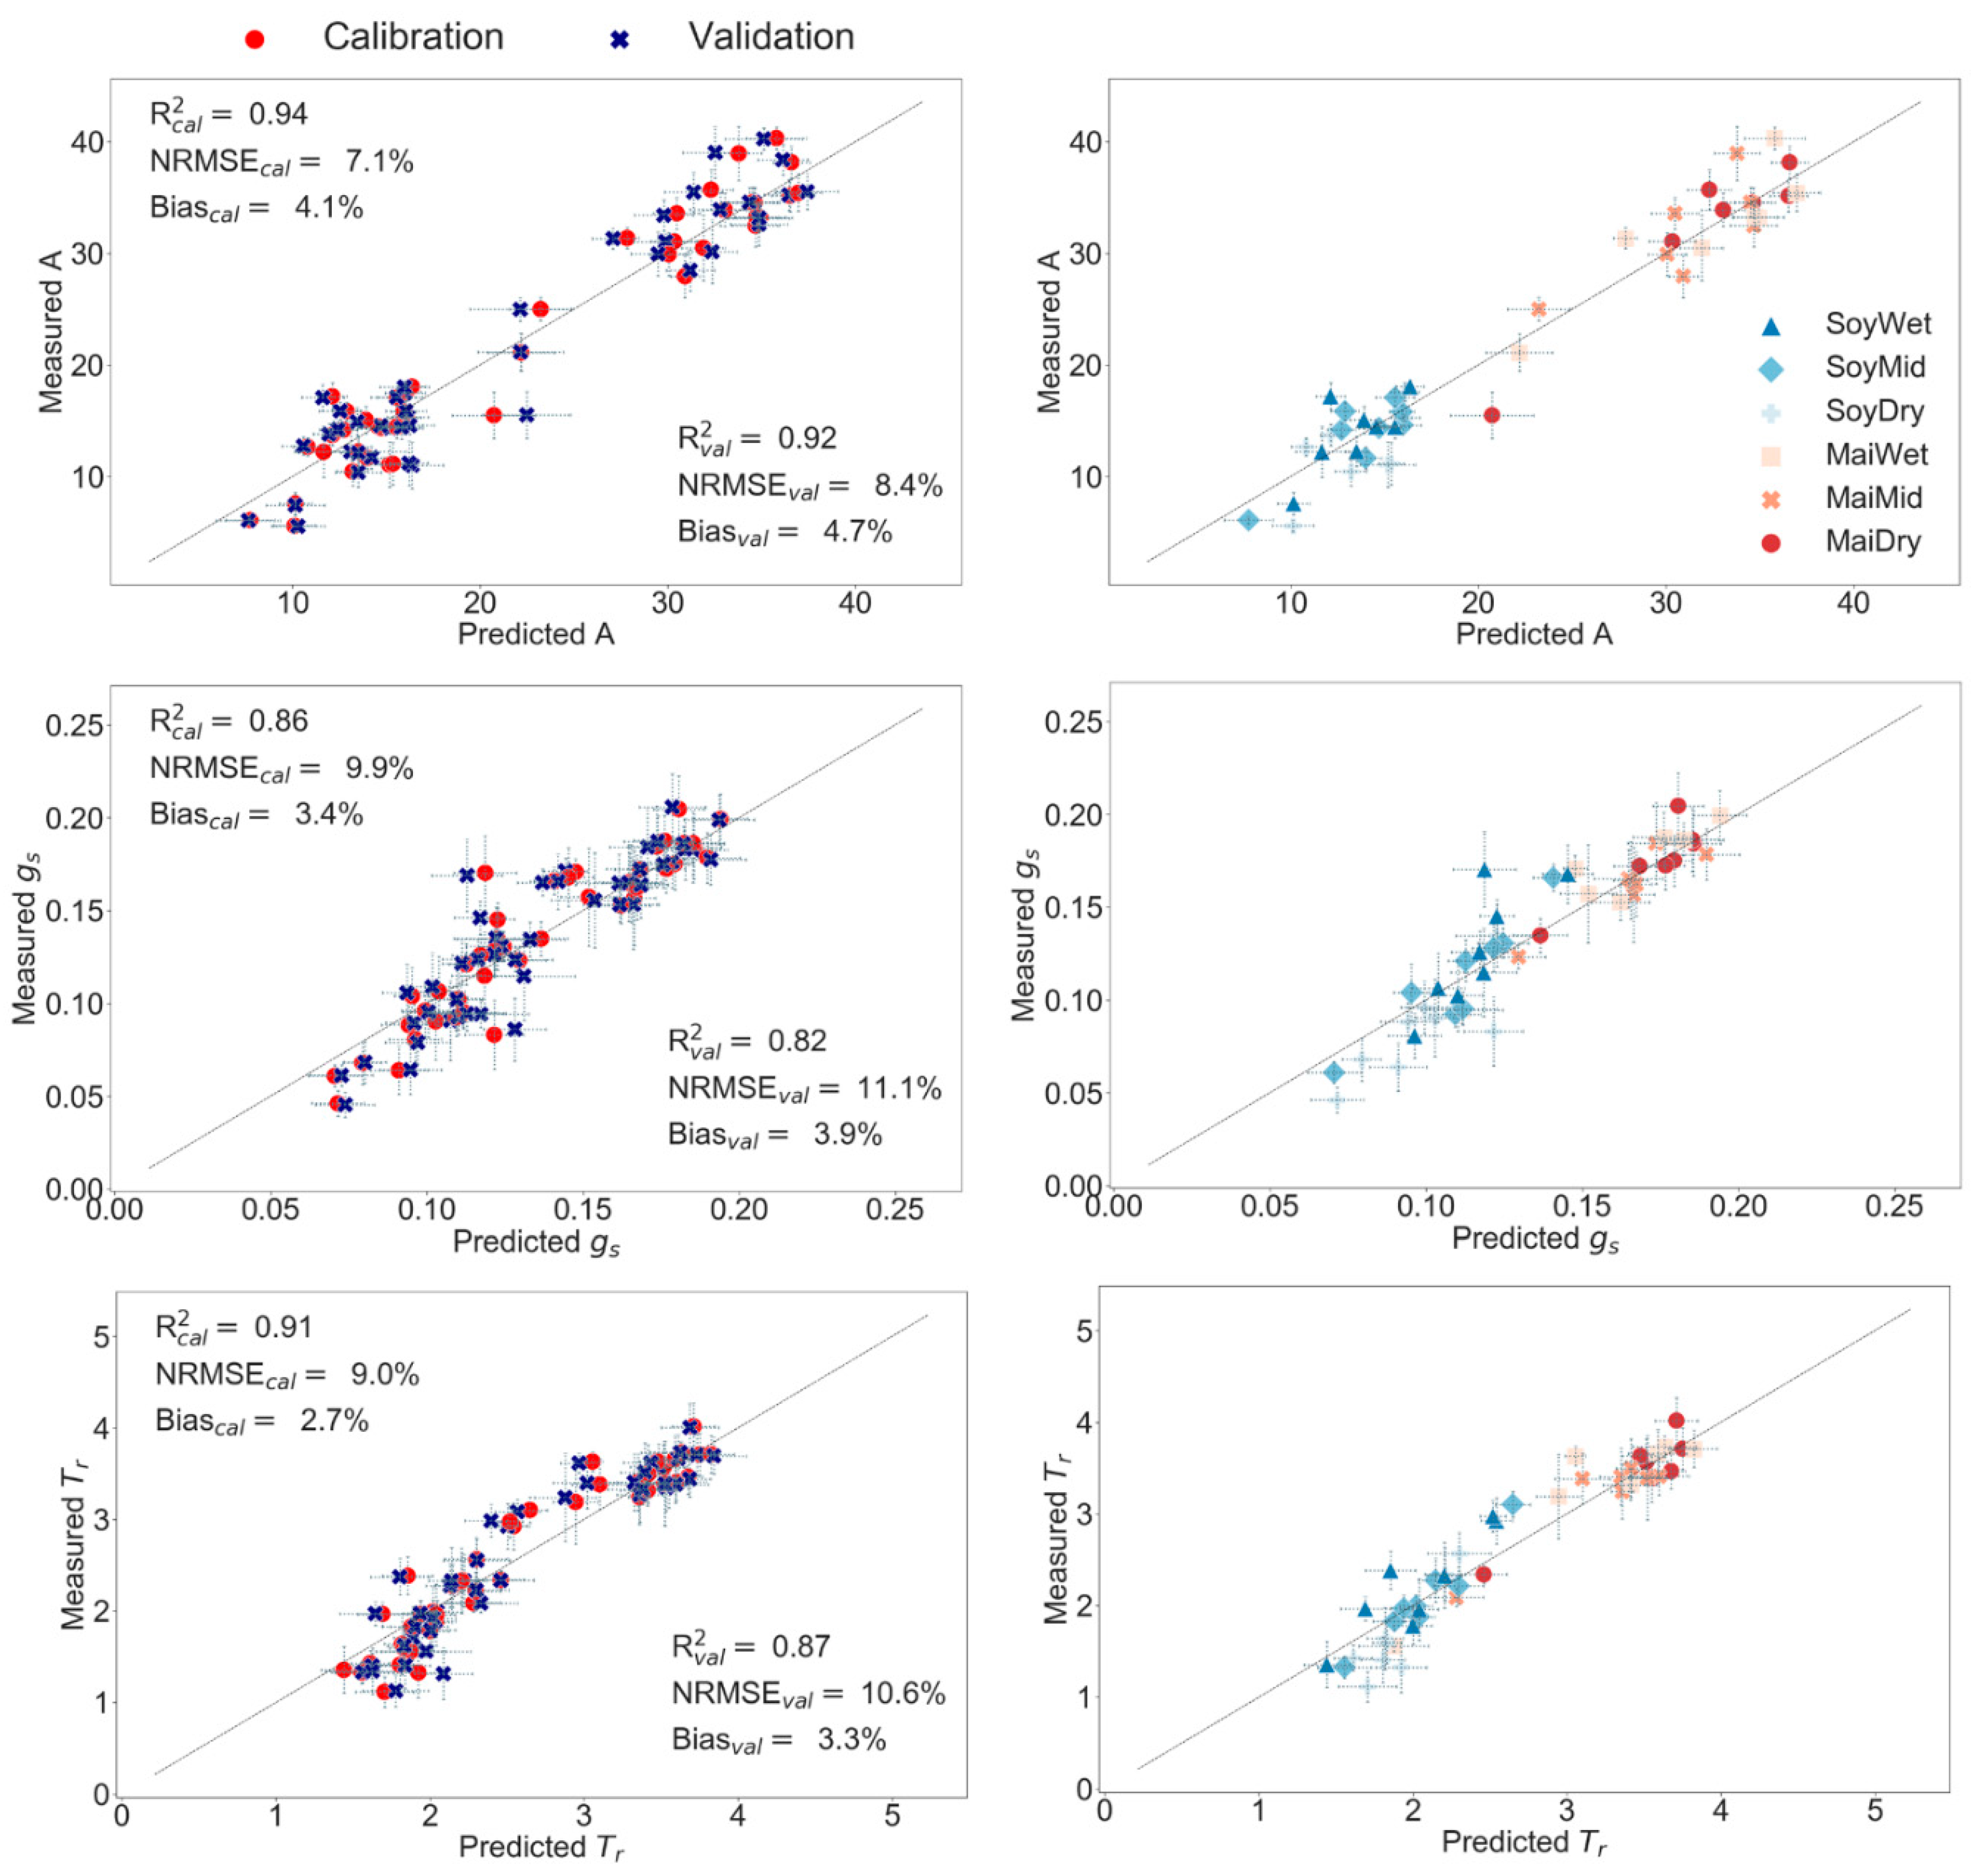
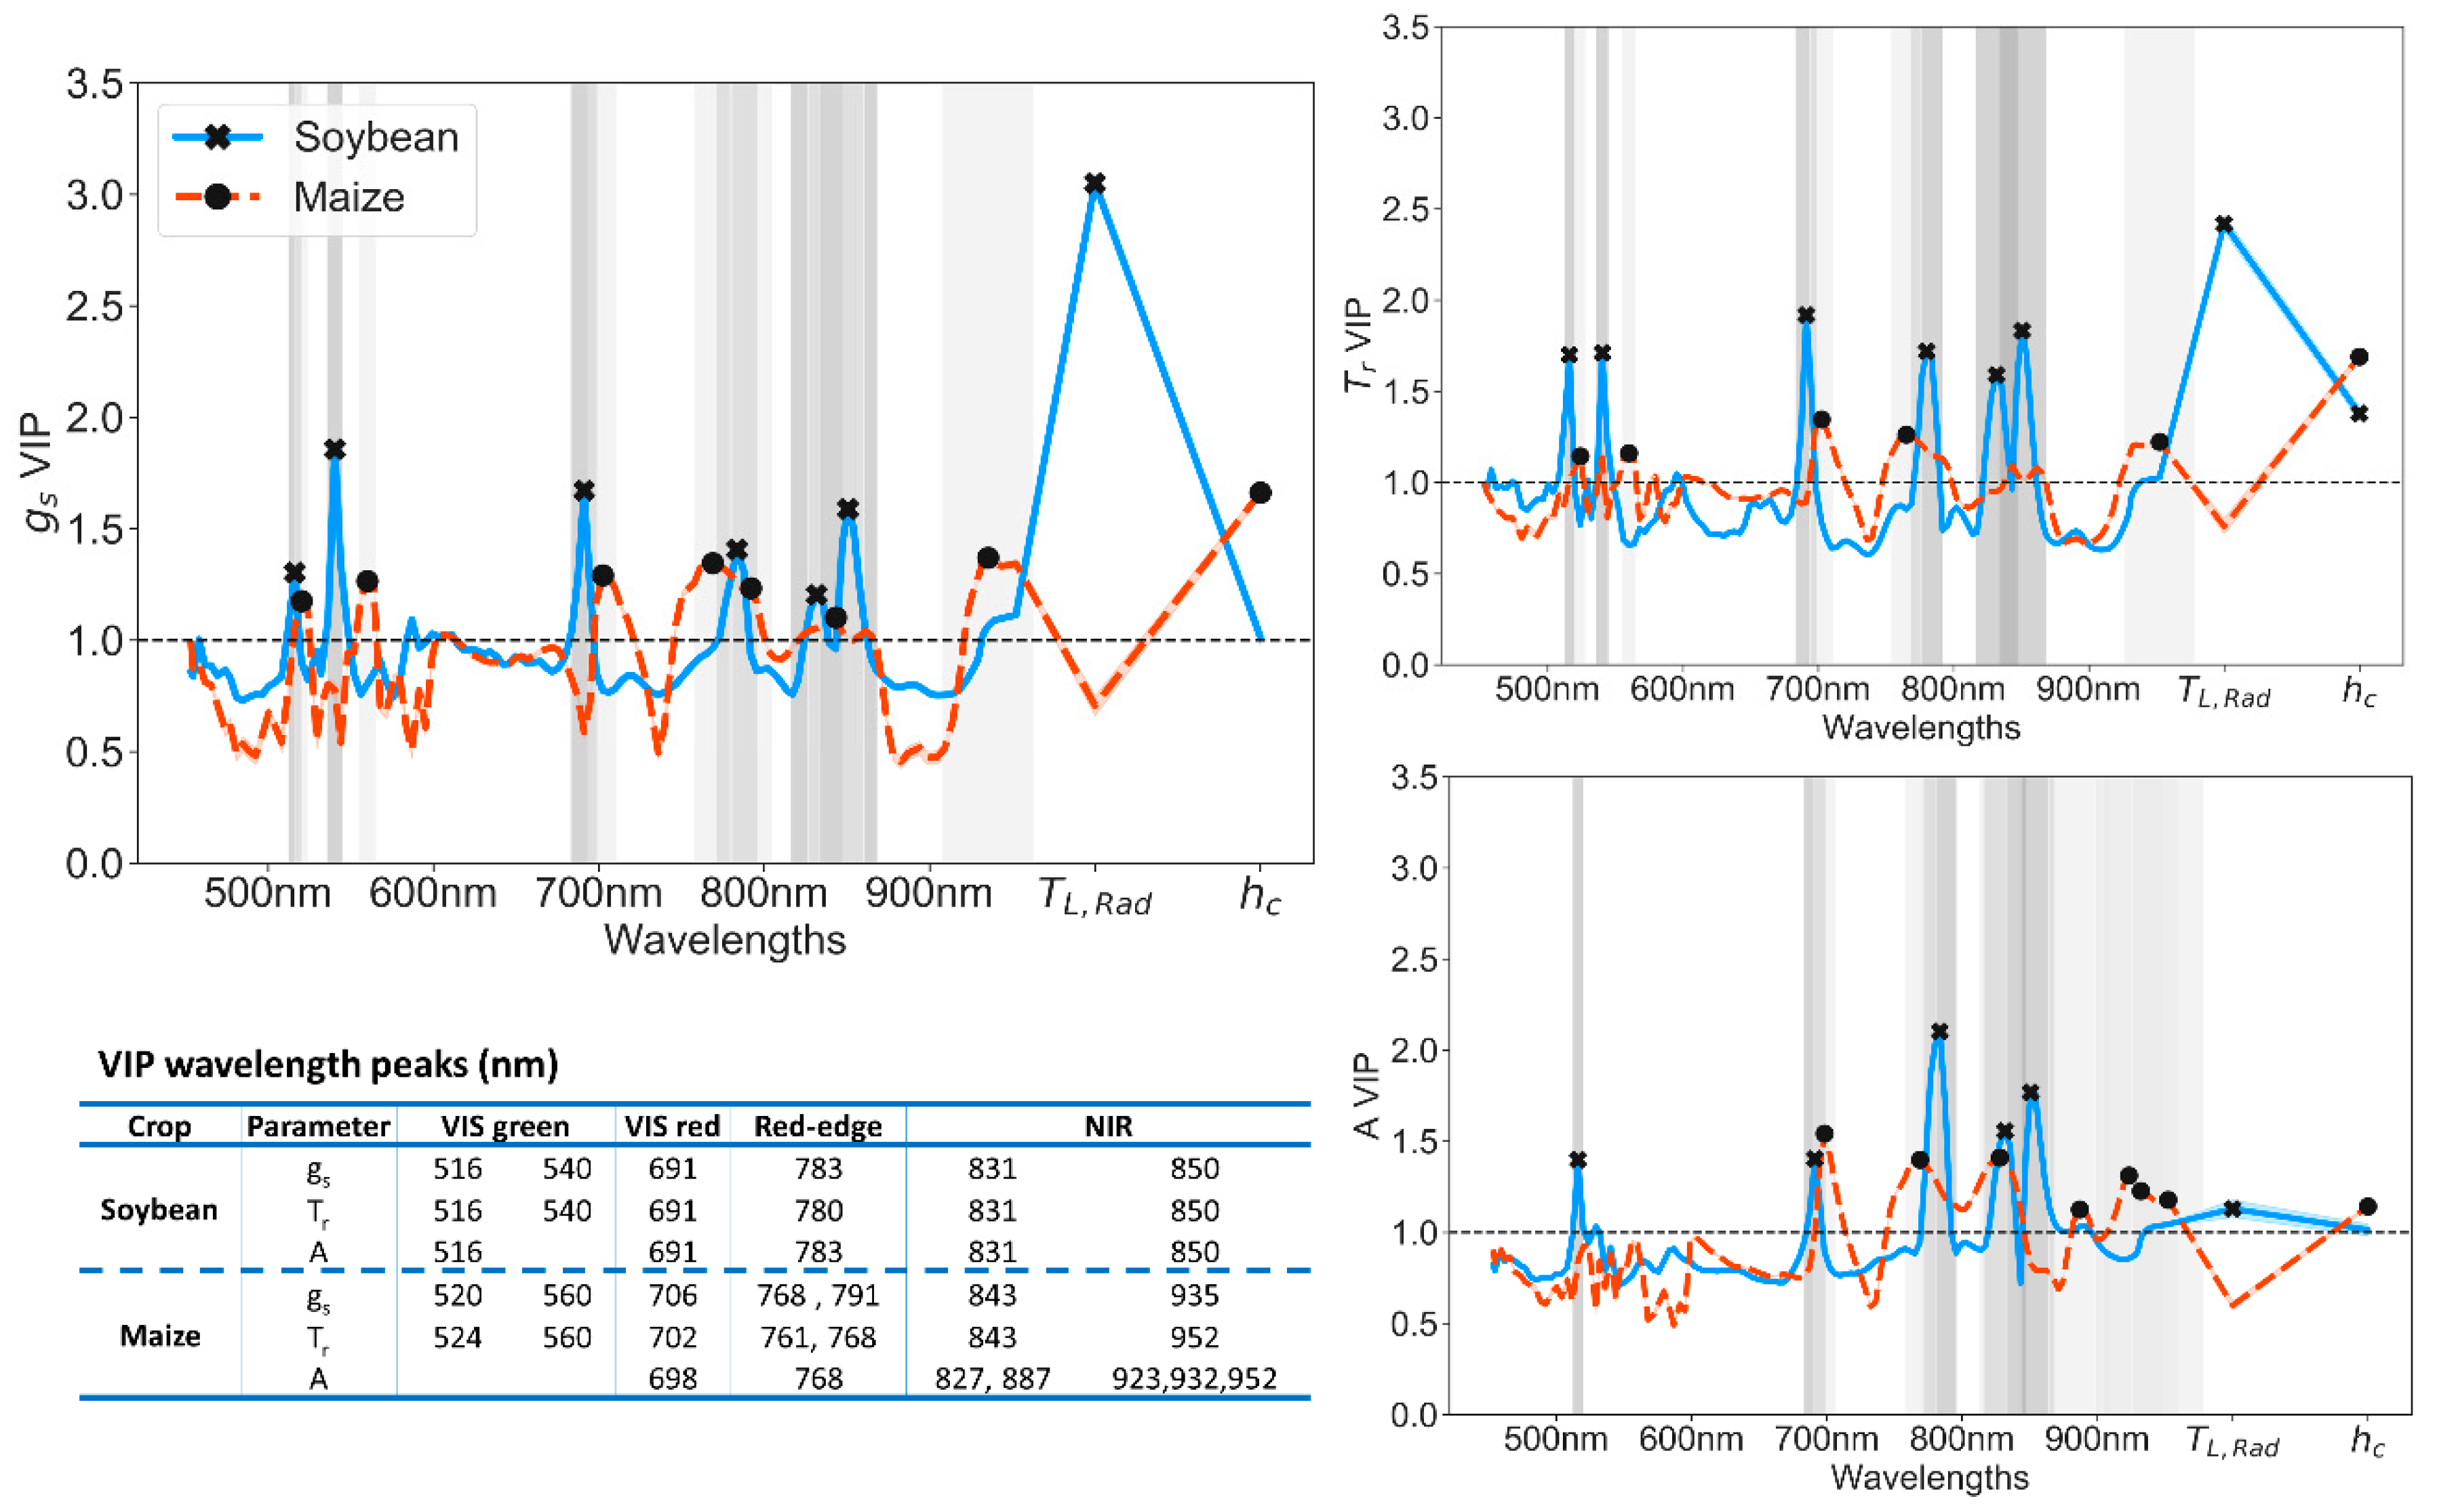
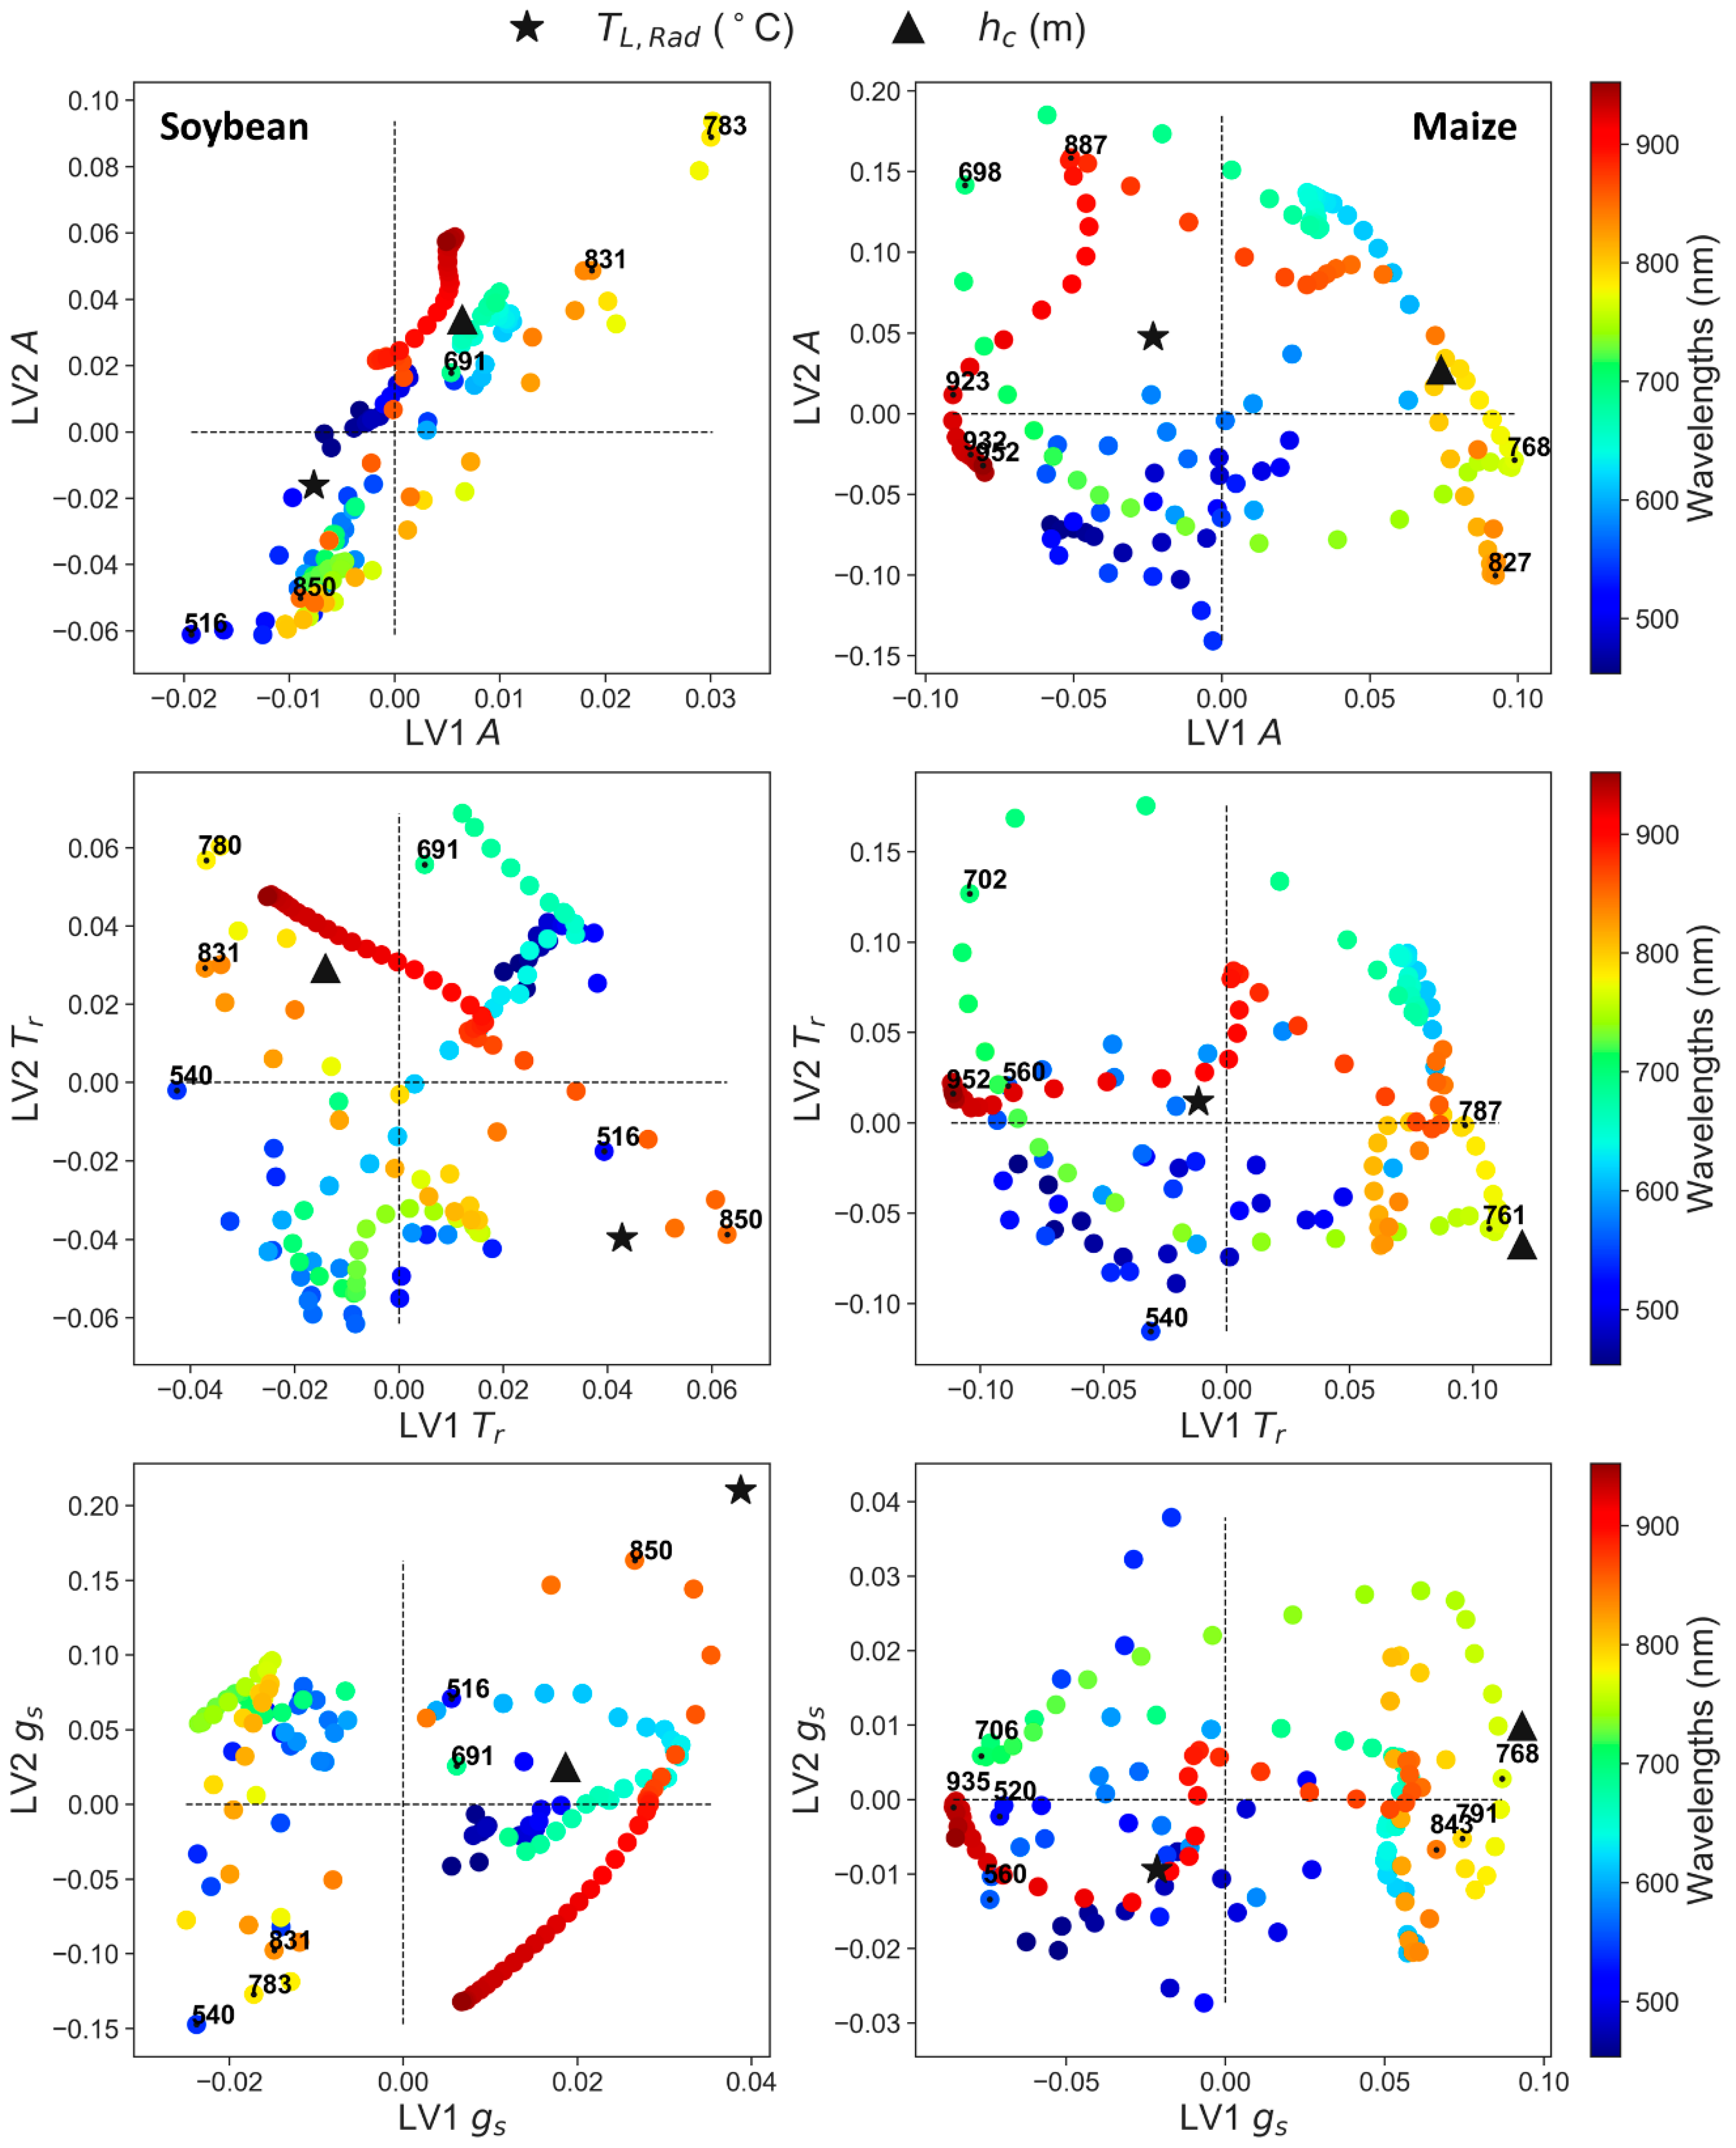
3.3. Partial Least Squares Regression (PLS-R) to Predict Leaf Physiology
4. Discussion
4.1. Physiological, Biochemical, Morphological, and Remote Sensing Responses under Water Stress
4.2. Synergies of Optical, Thermal, and Canopy Height Observations for PLS-R Modeling
5. Conclusions
Supplementary Materials
Author Contributions
Funding
Acknowledgments
Conflicts of Interest
Abbreviations
| A | Leaf photosynthetic CO2 assimilation rate (µmol CO2 m−2 s−1) |
| chl | Chlorophyll content from SPAD (µg cm−2) |
| Ci | Intercellular CO2 concentration (µmol CO2 mol−1 moist Air) |
| DAS | Days after sowing |
| DoM | Days of measurement |
| Dry | Soil water content corresponding to 40% water holding capacity |
| DTU | Denmark technical university |
| ET | Evapotranspiration at canopy level (mm day−1) |
| EVI | Enhanced vegetation index |
| FoV | Field of view |
| GPP | Gross primary productivity |
| gs | Leaf stomatal conductance (mol H2O m−2 s−1) |
| hc | Canopy height (m) |
| IQR | Interquartile range |
| LAI | Leaf area index |
| LiDAR | Light detection and ranging |
| LUE | Light use efficiency |
| LV | Latent variable |
| mARI | Modified anthocyanin reflectance index |
| Mid | Soil water content corresponding to 70% water holding capacity |
| NDVI | Normalized difference vegetation index |
| NIR | Near infrared |
| OSAVI | Optimized soil adjusted vegetation index |
| PAR | Photosynthetic active radiation |
| PLS-R | Partial least squares regression |
| PRI | Photochemical reflectance index |
| PSNDc | Pigment specific normalized difference index |
| PT-JPL | Priestley-Taylor Jet Propulsion Laboratory |
| R700/670 | Ratio between reflectance at 700 and 670 nm |
| REIP | Red-edge inflection point |
| RERAF | Risø environmental risk assessment facility |
| RH | Relative humidity |
| rNDVI | Red-edge normalized difference vegetation index |
| SCOPE | Soil Canopy Observation, Photochemistry, and Energy fluxes |
| SfM | Structure from motion |
| sPRI | Similar photochemical reflectance index |
| SWIR | Short-wave infrared |
| Tair | Air temperature (⁰C) |
| TCARI | Transformed chemical absorption reflectance index |
| TL,Rad | Radiometric leaf temperature from thermal camera (⁰C) |
| Tr | Leaf transpiration rate (mmol H2O m−2 s−1) |
| UAV | Unmanned aircraft vehicle |
| Vcmax | Maximum Rubisco activity |
| VI | Vegetation index |
| VIS | Visible |
| VNIR | Visible near infrared |
| VPD | Vapor pressure deficit (KPa) |
| Wet | Soil water content corresponding to 100% water holding capacity |
| WHC | Water holding capacity |
| WUE | Water use efficiency |
| ΔT | Leaf–air temperature difference (°C) |
| ΨL | Leaf water potential |
References
- WWAP (World Water Assessment Programme). The United Nations World Water Development Report 4: Managing Water under Uncertainty and Risk; UNSECO: Paris, France, 2012; ISBN 978-92-3-104235-5. [Google Scholar]
- UN-Water. The United Nations World Water Development Report 2018. Nature-Based Solutions for Water; UNESCO: Paris, France, 2018; ISBN 9789231002649. [Google Scholar]
- Arnell, N.W.; Lowe, J.A.; Challinor, A.J.; Osborn, T.J. Global and regional impacts of climate change at different levels of global temperature increase. Clim. Chang. 2019, 155, 377–391. [Google Scholar] [CrossRef]
- Teuling, A.J. A hot future for European droughts. Nat. Clim. Chang. 2018, 8, 364–365. [Google Scholar] [CrossRef]
- Samaniego, L.; Thober, S.; Kumar, R.; Wanders, N.; Rakovec, O.; Pan, M.; Zink, M.; Sheffield, J.; Wood, E.F.; Marx, A. Anthropogenic warming exacerbates European soil moisture droughts. Nat. Clim. Chang. 2018, 8, 421–426. [Google Scholar] [CrossRef]
- Mishra, V.; Cherkauer, K.A. Retrospective droughts in the crop growing season: Implications to corn and soybean yield in the Midwestern United States. Agric. For. Meteorol. 2010, 150, 1030–1045. [Google Scholar] [CrossRef]
- Ku, Y.-S.; Au-Yeung, W.-K.; Yung, Y.-L.; Li, M.-W.; Wen, C.-Q.; Liu, X.; Lam, H.-M. Drought Stress and Tolerance in Soybean. In A Comprehensive Survey of International Soybean Research—Genetics, Physiology, Agronomy and Nitrogen Relationships; Board, J.E., Ed.; InTechOpen: London, UK, 2013; pp. 209–237. [Google Scholar]
- Aslam, M.; Maqbool, M.A.; Cengiz, R. Drought Stress in Maize (Zea mays L.) Effects, Resistance, Mechanisms, Global Achievements and Biological Strategies for Improvement; Springer: Cham, Switzerland, 2015; ISBN 9783319254425. [Google Scholar]
- FAO Food and Agriculture Organization of the Unitated States. Land & Water: Crop Water Information. Available online: http://www.fao.org/land-water/databases-and-software/crop-information/en/ (accessed on 17 June 2020).
- Damm, A.; Paul-Limoges, E.; Haghighi, E.; Simmer, C.; Morsdorf, F.; Schneider, F.D.; van der Tol, C.; Migliavacca, M.; Rascher, U. Remote sensing of plant-water relations: An overview and future perspectives. J. Plant Physiol. 2018, 227, 3–19. [Google Scholar] [CrossRef] [PubMed]
- Acevedo, E.; Hsiao, T.C.; Henderson, D.W. Immediate and Subsequent Growth Responses of Maize Leaves to Changes in Water Status. Plant Physiol. 1971, 48, 631–636. [Google Scholar] [CrossRef] [PubMed]
- Gimenez, C.; Gallardo, M.; Thompson, R.B. Plant—Water Relations. In Encyclopedia of Soils in the Environment; Elsevier: Almeria, Spain, 2005; pp. 231–238. [Google Scholar]
- Hsiao, T.C. Plant Responses to Water Stress. Plant Physiol. 1973, 24, 519–570. [Google Scholar] [CrossRef]
- Schulze, E.-D.; Beck, E.; Muller-Hohenstein, K. Plant Ecology; Springer: Berlin/Heidelberg, Germany, 2005; ISBN 354020833X. [Google Scholar]
- Rapaport, T.; Hochberg, U.; Shoshany, M.; Karnieli, A.; Rachmilevitch, S. Combining leaf physiology, hyperspectral imaging and partial least squares-regression (PLS-R) for grapevine water status assessment. ISPRS J. Photogramm. Remote Sens. 2015, 109, 88–97. [Google Scholar] [CrossRef]
- Martínez-Vilalta, J.; Garcia-Forner, N. Water potential regulation, stomatal behaviour and hydraulic transport under drought: Deconstructing the iso/anisohydric concept. Plant Cell Environ. 2017, 40, 962–976. [Google Scholar] [CrossRef]
- Wijewardana, C.; Alsajri, F.A.; Irby, J.T.; Krutz, L.J.; Golden, B.; Henry, W.B.; Gao, W.; Reddy, K.R. Physiological assessment of water deficit in soybean using midday leaf water potential and spectral features. J. Plant Interact. 2019, 14, 533–543. [Google Scholar] [CrossRef]
- Bayat, B.; van der Tol, C.; Verhoef, W. Remote sensing of grass response to drought stress using spectroscopic techniques and canopy reflectance model inversion. Remote Sens. 2016, 8, 557. [Google Scholar] [CrossRef]
- Zhang, J.; Liu, J.; Yang, C.; Du, S.; Yang, W. Photosynthetic performance of soybean plants to water deficit under high and low light intensity. S. Afr. J. Bot. 2016, 105, 279–287. [Google Scholar] [CrossRef]
- Gamon, J.A.; Somers, B.; Malenovský, Z.; Middleton, E.M.; Rascher, U.; Schaepman, M.E. Assessing Vegetation Function with Imaging Spectroscopy. Surv. Geophys. 2019, 40, 489–513. [Google Scholar] [CrossRef]
- Kocacinar, F.; Sage, R.F. Hydraulic Properties of the Xylem in Plants of Different Photosynthetic Pathways. In Vascular transport in Plants; Holbrook, N.M., Zwieniecki, M.A., Eds.; Elsevier Inc.: Burlington, MA, USA, 2005; pp. 517–533. [Google Scholar] [CrossRef]
- Bonan, G. Ecological Climatology: Concepts and Applications, 3rd ed.; Cambridge University Press, Center for Atmospheric Research: Boulder, CO, USA, 2015; ISBN 9781107339200. [Google Scholar]
- Taylor, S.H.; Ripley, B.S.; Woodward, F.I.; Osborne, C.P. Drought limitation of photosynthesis differs between C3 and C4 grass species in a comparative experiment. Plant Cell Environ. 2011, 34, 65–75. [Google Scholar] [CrossRef]
- Ghannoum, O. C4 photosynthesis and water stress. Ann. Bot. 2009, 103, 635–644. [Google Scholar] [CrossRef]
- Konings, A.G.; Williams, A.P.; Gentine, P. Sensitivity of grassland productivity to aridity controlled by stomatal and xylem regulation. Nat. Geosci. 2017, 10, 284–288. [Google Scholar] [CrossRef]
- Wang, S.; Ibrom, A.; Bauer-Gottwein, P.; Garcia, M. Incorporating diffuse radiation into a light use efficiency and evapotranspiration model: An 11-year study in a high latitude deciduous forest. Agric. For. Meteorol. 2018, 248, 479–493. [Google Scholar] [CrossRef]
- Fisher, J.B.; Tu, K.P.; Baldocchi, D.D. Global estimates of the land-atmosphere water flux based on monthly AVHRR and ISLSCP-II data, validated at 16 FLUXNET sites. Remote Sens. Environ. 2008, 112, 901–919. [Google Scholar] [CrossRef]
- García, M.; Sandholt, I.; Ceccato, P.; Ridler, M.; Mougin, E.; Kergoat, L.; Morillas, L.; Timouk, F.; Fensholt, R.; Domingo, F. Actual evapotranspiration in drylands derived from in-situ and satellite data: Assessing biophysical constraints. Remote Sens. Environ. 2013, 131, 103–118. [Google Scholar] [CrossRef]
- Monteith, J.L. Solar Radiation and Productivity in Tropical Ecosystems. J. Appl. Ecol. 1972, 9, 744–766. [Google Scholar] [CrossRef]
- Potter, C.S.C.; Randerson, J. Terrestrial ecosystem production: A process model based on global satellite and surface data. Glob. Biogeochem. Cycles 1993, 7, 811–841. [Google Scholar] [CrossRef]
- van der Tol, C.; Verhoef, W.; Timmermans, J.; Verhoef, A.; Su, Z. An integrated model of soil-canopy spectral radiances, photosynthesis, fluorescence, temperature and energy balance. Biogeosciences 2009, 6, 3109–3129. [Google Scholar] [CrossRef]
- Asner, G.P. Biophysical and Biochemical Sources of Variability in Canopy Reflectance. Remote Sens. Environ. 1998, 253, 234–253. [Google Scholar] [CrossRef]
- Elachi, C.; van Zyl, J.J. Introduction to the Physics and Techniques of Remote Sensing, 2nd ed.; John Wiley & Sons, Inc.: Hoboken, NJ, USA, 2006; ISBN 9780471475699. [Google Scholar]
- Ustin, S.L.; Gamon, J.A. Remote sensing of plant functional types. New Phytol. 2010, 186, 795–816. [Google Scholar] [CrossRef] [PubMed]
- Gerhards, M.; Schlerf, M.; Mallick, K.; Udelhoven, T. Challenges and future perspectives of multi-/Hyperspectral thermal infrared remote sensing for crop water-stress detection: A review. Remote Sens. 2019, 11, 1240. [Google Scholar] [CrossRef]
- Elvanidi, A.; Katsoulas, N.; Ferentinos, K.P.; Bartzanas, T.; Kittas, C. Hyperspectral machine vision as a tool for water stress severity assessment in soilless tomato crop. Biosyst. Eng. 2017, 165, 25–35. [Google Scholar] [CrossRef]
- Zarco-Tejada, P.J.; González-Dugo, V.; Berni, J.A.J. Fluorescence, temperature and narrow-band indices acquired from a UAV platform for water stress detection using a micro-hyperspectral imager and a thermal camera. Remote Sens. Environ. 2012, 117, 322–337. [Google Scholar] [CrossRef]
- Rouse, J.W.; Haas, R.H.; Schell, J.A.; Deering, D.W.; Harlan, J.C. Monitoring the Vernal Advancement and Retrogradation (Greenwave Effect) of Natural Vegetation; Texas A&M University: College Station, TX, USA, 1974. [Google Scholar]
- Haboudane, D.; Miller, J.R.; Tremblay, N.; Zarco-Tejada, P.J.; Dextraze, L. Integrated narrow-band vegetation indices for prediction of crop chlorophyll content for application to precision agriculture. Remote Sens. Environ. 2002, 81, 416–426. [Google Scholar] [CrossRef]
- Blackburn, G.A. Quantifying Chlorophylls and Caroteniods at Leaf and Canopy Scales. Remote Sens. Environ. 1998, 66, 273–285. [Google Scholar] [CrossRef]
- Gamon, J.A.; Peñuelas, J.; Field, C.B. A Narrow-Waveband Spectral Index That Tracks Diurnal Changes in Photosynthetic Efficiency. Remote Sens. Environ. 1992, 41, 35–44. [Google Scholar] [CrossRef]
- Thenkabail, P.S.; Lyon, J.G.; Huete, A. Hyperspectral Remote Sensing of Vegetation, 1st ed.; CRC Press: Boca Raton, FL, USA, 2016; ISBN 9781439845370. [Google Scholar]
- Ballester, C.; Zarco-Tejada, P.J.; Nicolás, E.; Alarcón, J.J.; Fereres, E.; Intrigliolo, D.S.; Gonzalez-Dugo, V. Evaluating the performance of xanthophyll, chlorophyll and structure-sensitive spectral indices to detect water stress in five fruit tree species. Precis. Agric. 2018, 19, 178–193. [Google Scholar] [CrossRef]
- Gago, J.; Fernie, A.R.; Nikoloski, Z.; Tohge, T.; Martorell, S.; Escalona, J.M.; Ribas-Carbó, M.; Flexas, J.; Medrano, H. Integrative field scale phenotyping for investigating metabolic components of water stress within a vineyard. Plant Methods 2017, 13, 1–14. [Google Scholar] [CrossRef] [PubMed]
- Gerhards, M.; Rock, G.; Schlerf, M.; Udelhoven, T. Water stress detection in potato plants using leaf temperature, emissivity, and reflectance. Int. J. Appl. Earth Obs. Geoinf. 2016, 53, 27–39. [Google Scholar] [CrossRef]
- Gerhards, M.; Schlerf, M.; Rascher, U.; Udelhoven, T.; Juszczak, R.; Alberti, G.; Miglietta, F.; Inoue, Y. Analysis of airborne optical and thermal imagery for detection of water stress symptoms. Remote Sens. 2018, 10, 1139. [Google Scholar] [CrossRef]
- Leinonen, I.; Jones, H.G. Combining thermal and visible imagery for estimating canopy temperature and identifying plant stress. J. Exp. Bot. 2004, 55, 1423–1431. [Google Scholar] [CrossRef]
- Costa, J.M.; Grant, O.M.; Chaves, M.M. Thermography to explore plant-environment interactions. J. Exp. Bot. 2013, 64, 3937–3949. [Google Scholar] [CrossRef]
- Humplík, J.F.; Lazár, D.; Husičková, A.; Spíchal, L. Automated phenotyping of plant shoots using imaging methods for analysis of plant stress responses—A review. Plant Methods 2015, 11, 1–10. [Google Scholar] [CrossRef]
- Liu, Y.; Subhash, C.; Yan, J.; Song, C.; Zhao, J.; Li, J. Maize leaf temperature responses to drought: Thermal imaging and quantitative trait loci (QTL) mapping. Environ. Exp. Bot. 2011, 71, 158–165. [Google Scholar] [CrossRef]
- Mo, X.; Liu, S.; Hu, S.; Xia, J.; Shen, Y. Sensitivity of terrestrial water and carbon fluxes to climate variability in semi-humid basins of Haihe River, China. Ecol. Model. 2017, 353, 117–128. [Google Scholar] [CrossRef]
- Wang, S.; Garcia, M.; Bauer-Gottwein, P.; Jakobsen, J.; Zarco-Tejada, P.J.; Bandini, F.; Sobejano-Paz, V.; Ibrom, A. High spatial resolution monitoring land surface energy, water and CO2 fluxes from an Unmanned Aerial System. Remote Sens. Environ. 2019, 229, 14–31. [Google Scholar] [CrossRef]
- Guan, K.; Wu, J.; Kimball, J.S.; Anderson, M.C.; Frolking, S.; Li, B.; Hain, C.R.; Lobell, D.B. The shared and unique values of optical, fluorescence, thermal and microwave satellite data for estimating large-scale crop yields. Remote Sens. Environ. 2017, 199, 333–349. [Google Scholar] [CrossRef]
- Verrelst, J.; Malenovský, Z.; van der Tol, C.; Camps-Valls, G.; Gastellu-Etchegorry, J.P.; Lewis, P.; North, P.; Moreno, J. Quantifying Vegetation Biophysical Variables from Imaging Spectroscopy Data: A Review on Retrieval Methods. Surv. Geophys. 2018. [Google Scholar] [CrossRef]
- Matthes, J.H.; Knox, S.H.; Sturtevant, C.; Sonnentag, O.; Verfaillie, J.; Baldocchi, D. Predicting landscape-scale CO2 flux at a pasture and rice paddy with long-term hyperspectral canopy reflectance measurements. Biogeosciences 2015, 12, 4577–4594. [Google Scholar] [CrossRef]
- Doughty, C.E.; Asner, G.P.; Martin, R.E. Predicting tropical plant physiology from leaf and canopy spectroscopy. Oecologia 2011, 165, 289–299. [Google Scholar] [CrossRef]
- El-Hendawy, S.; Al-Suhaibani, N.; Alotaibi, M.; Hassan, W.; Elsayed, S.; Tahir, M.U.; Mohamed, A.I.; Schmidhalter, U. Estimating growth and photosynthetic properties of wheat grown in simulated saline field conditions using hyperspectral reflectance sensing and multivariate analysis. Sci. Rep. 2019, 9, 16473. [Google Scholar] [CrossRef]
- Serbin, S.P.; Singh, A.; Desai, A.R.; Dubois, S.G.; Jablonski, A.D.; Kingdon, C.C.; Kruger, E.L.; Townsend, P.A. Remotely estimating photosynthetic capacity, and its response to temperature, in vegetation canopies using imaging spectroscopy. Remote Sens. Environ. 2015, 167, 78–87. [Google Scholar] [CrossRef]
- Wu, J.; Rogers, A.; Albert, L.P.; Ely, K.; Prohaska, N.; Wolfe, B.T.; Oliveira, R.C.; Saleska, S.R.; Serbin, S.P. Leaf reflectance spectroscopy captures variation in carboxylation capacity across species, canopy environment and leaf age in lowland moist tropical forests. New Phytol. 2019, 224, 663–674. [Google Scholar] [CrossRef]
- Wang, S.; Guan, K.; Wang, Z.; Ainsworth, E.A.; Zheng, T.; Townsend, P.A.; Li, K.; Moller, C.; Wu, G.; Jiang, C. Unique Contributions of Chlorophyll and Nitrogen to Predict Crop Photosynthetic Capacity from Leaf Spectroscopy. Available online: https://academic.oup.com/jxb/advance-article/doi/10.1093/jxb/eraa432/5906627 (accessed on 16 September 2020).
- Silva-Perez, V.; Molero, G.; Serbin, S.P.; Condon, A.G.; Reynolds, M.P.; Furbank, R.T.; Evans, J.R. Hyperspectral reflectance as a tool to measure biochemical and physiological traits in wheat. J. Exp. Bot. 2018, 69, 483–496. [Google Scholar] [CrossRef]
- Serbin, S.P.; Singh, A.; Mcneil, B.E.; Kingdon, C.C.; Townsend, P.A.; Serbin, S.P.; Singh, A.; Mcneil, B.E.; Kingdon, C.C.; Townsend, P.A. Spectroscopic determination of leaf morphological and biochemical traits for northern temperate and boreal tree species. Ecol. Appl. 2014, 24, 1651–1669. [Google Scholar]
- Frenck, G.; van der Linden, L.; Mikkelsen, T.N.; Brix, H.; Jørgensen, R.B. Response to multi-generational selection under elevated [CO2] in two temperature regimes suggests enhanced carbon assimilation and increased reproductive output in Brassica napus L. Ecol. Evol. 2013, 3, 1163–1172. [Google Scholar] [CrossRef]
- Ingvordsen, C.H.; Backes, G.; Lyngkjær, M.F.; Peltonen-Sainio, P.; Jensen, J.D.; Jalli, M.; Jahoor, A.; Rasmussen, M.; Mikkelsen, T.N.; Stockmarr, A.; et al. Significant decrease in yield under future climate conditions: Stability and production of 138 spring barley accessions. Eur. J. Agron. 2015, 63, 105–113. [Google Scholar] [CrossRef]
- Wang, S.; Garcia, M.; Ibrom, A.; Jakobsen, J.; Köppl, C.J.; Mallick, K.; Looms, M.C.; Bauer-Gottwein, P. Mapping root-zone soil moisture using a temperature-vegetation triangle approach with an unmanned aerial system: Incorporating surface roughness from structure from motion. Remote Sens. 2018, 10, 1978. [Google Scholar] [CrossRef]
- Köppl, C.J.; Garcia, M.; Bandidi, F.; Bauer-Gottwein, P. Thermal Imaging from Unmanned Airborne Vehicles. Master’s Thesis, Technical University of Denmark, Lyngby, Denmark, 2016. [Google Scholar]
- Gulyas, L.; Garcia, M.; Sobejano-Paz, V.; Baum, A. Prediction of Ecophysiological Variables from Remote Sensing Data Using Machine Learning Methods. Master’s Thesis, Technical University of Denmark, Lyngby, Denmark, 2020. [Google Scholar]
- Gitelson, A.A.; Keydan, G.P.; Merzlyak, M.N. Three-band model for noninvasive estimation of chlorophyll, carotenoids, and anthocyanin contents in higher plant leaves. Geophys. Res. Lett. 2006, 33, 2–6. [Google Scholar] [CrossRef]
- Huete, A.R.; Liu, H.Q.; Batchily, K.; Leeuwen, W. Van A Comparison of Vegetation Indices over a Global Set of TM Images for EOS-MODIS. Remote Sens. Environ. 1997, 59, 440–451. [Google Scholar] [CrossRef]
- Rondeaux, G.; Steven, M.; Baret, F. Optimization of soil-adjusted vegetation indices. Remote Sens. Environ. 1996, 55, 95–107. [Google Scholar] [CrossRef]
- Horler, D.N.H.; Dockray, M.; Barber, J. The red edge of plant leaf reflectance. Remote Sens. 1983, 4, 273–288. [Google Scholar] [CrossRef]
- Gitelson, A.A.; Merzlyak, M.N.; Lichtenthaler, H.K. Detection of red edge position and chlorophyll content by reflectance measurements near 700 nm. J. Plant Physiol. 1996, 148, 501–508. [Google Scholar] [CrossRef]
- Tsirogiannis, I.L.; Katsoulas, N.; Savvas, D.; Karras, G.; Kittas, C. Relationships between reflectance and water status in a greenhouse rocket (Eruca sativa Mill.) cultivation. Eur. J. Hortic. Sci. 2013, 78, 275–282. [Google Scholar]
- Hernández-Clemente, R.; Navarro-Cerrillo, R.M.; Zarco-Tejada, P.J. Carotenoid content estimation in a heterogeneous conifer forest using narrow-band indices and PROSPECT+DART simulations. Remote Sens. Environ. 2012, 127, 298–315. [Google Scholar] [CrossRef]
- Maimaitiyiming, M.; Ghulam, A.; Bozzolo, A.; Wilkins, J.L.; Kwasniewski, M.T. Early Detection of Plant Physiological Responses to Different Levels of Water Stress Using Reflectance Spectroscopy. Remote Sens. 2017, 9, 745. [Google Scholar] [CrossRef]
- Katsoulas, N.; Elvanidi, A.; Ferentinos, K.P.; Kacira, M.; Bartzanas, T.; Kittas, C. Crop reflectance monitoring as a tool for water stress detection in greenhouses: A review. Biosyst. Eng. 2016, 151, 374–398. [Google Scholar] [CrossRef]
- Vallat, R. Pingouin: Statistics in Python. J. Open Source Softw. 2018, 3, 1026. [Google Scholar] [CrossRef]
- Wu, J.; Chavana-Bryant, C.; Prohaska, N.; Serbin, S.P.; Guan, K.; Albert, L.P.; Yang, X.; van Leeuwen, W.J.D.; Garnello, A.J.; Martins, G.; et al. Convergence in relationships between leaf traits, spectra and age across diverse canopy environments and two contrasting tropical forests. New Phytol. 2017, 214, 1033–1048. [Google Scholar] [CrossRef] [PubMed]
- Wold, S.; Sjostrom, M.; Eriksson, L.; Sweden, S. PLS-regression: A basic tool of chemometrics. Chemom. Intell. Lab. Syst. 2001, 58, 2001–2109. [Google Scholar] [CrossRef]
- Geladi, P.; Kowalski, B.R. Partial least-squares regression: A tutorial. Anal. Chim. 1986, 185, 1–17. [Google Scholar] [CrossRef]
- Pedregosa, F.; Varoquaux, G.; Gramfort, A.; Michel, V.; Thirion, B.; Grisel, O.; Blondel, M.; Prettenhofer, P.; Weiss, R.; Dubourg, V.; et al. Scikit-learn: Machine Learning in Python. J. Mach. Learn. Res. 2011, 12, 2825–2830. [Google Scholar] [CrossRef]
- Wegelin, J.A. A Survey of Partial Least Squares (PLSR) Methods, with Emphasis on the Two-Block Case; University of Washington: Seattle, WA, USA, 2000; Volume 371. [Google Scholar]
- Barnes, R.J.; Dhanoa, M.S.; Lister, S.J. Standard normal variate transformation and de-trending of near-infrared diffuse reflectance spectra. Appl. Spectrosc. 1989, 43, 772–777. [Google Scholar] [CrossRef]
- Richter, K.; Atzberger, C.; Hank, T.B.; Mauser, W. Derivation of biophysical variables from Earth observation data: Validation and statistical measures. J. Appl. Remote Sens. 2012, 6, 063557. [Google Scholar] [CrossRef]
- Andersen, C.M.; Bro, R. Variable selection in regression-a tutorial. J. Chemom. 2010, 24, 728–737. [Google Scholar] [CrossRef]
- Das, A.; Eldakak, M.; Paudel, B.; Kim, D.; Hemmati, H.; Basu, C.; Rohila, J.S. Leaf Proteome Analysis Reveals Prospective Drought and Heat Stress Response Mechanisms in Soybean. Biomed. Res. Int. 2016, 2016, 23. [Google Scholar] [CrossRef]
- Locke, A.M.; Ort, D.R. Leaf hydraulic conductance declines in coordination with photosynthesis, transpiration and leaf water status as soybean leaves age regardless of soil moisture. J. Exp. Bot. 2014, 65, 6617–6627. [Google Scholar] [CrossRef] [PubMed]
- Herrmann, I.; Pimstein, A.; Karnieli, A.; Cohen, Y.; Alchanatis, V.; Bonfil, D.J. LAI assessment of wheat and potato crops by VENμS and Sentinel-2 bands. Remote Sens. Environ. 2011, 115, 2141–2151. [Google Scholar] [CrossRef]
- Briglia, N.; Montanaro, G.; Petrozza, A.; Summerer, S.; Cellini, F.; Nuzzo, V. Drought phenotyping in Vitis vinifera using RGB and NIR imaging. Sci. Hortic. 2019, 256, 108555. [Google Scholar] [CrossRef]
- Yoshioka, H.; Miura, T.; Demattê, J.A.M.; Batchily, K.; Huete, A.R. Soil line influences on two-band vegetation indices and vegetation isolines: A numerical study. Remote Sens. 2010, 2, 545–561. [Google Scholar] [CrossRef]
- Li, M.; Chu, R.; Yu, Q.; Islam, A.R.M.T.; Chou, S.; Shen, S. Evaluating Structural, Chlorophyll-Based and Photochemical Indices to Detect Summer Maize Responses to Continuous Water Stress. Water 2018, 10, 500. [Google Scholar] [CrossRef]
- Zhang, F.; Zhou, G. Estimation of vegetation water content using hyperspectral vegetation indices: A comparison of crop water indicators in response to water stress treatments for summer maize. BMC Ecol. 2019, 19, 1–12. [Google Scholar] [CrossRef]
- Mangus, D.L.; Sharda, A.; Zhang, N. Development and evaluation of thermal infrared imaging system for high spatial and temporal resolution crop water stress monitoring of corn within a greenhouse. Comput. Electron. Agric. 2016, 121, 149–159. [Google Scholar] [CrossRef]
- Feng, R.; Zhang, Y.; Yu, W.; Hu, W.; Wu, J.; Ji, R.; Wang, H.; Zhao, X. Analysis of the relationship between the spectral characteristics of maize canopy and leaf area index under drought stress. Acta Ecol. Sin. 2013, 33, 301–307. [Google Scholar] [CrossRef]
- Ratzmann, G.; Meinzer, F.C.; Tietjen, B. Iso/Anisohydry: Still a Useful Concept. Trends Plant Sci. 2019, 24, 191–194. [Google Scholar] [CrossRef]
- Meinzer, F.C.; Woodruff, D.R.; Marias, D.E.; Smith, D.D.; McCulloh, K.A.; Howard, A.R.; Magedman, A.L. Mapping ‘hydroscapes’ along the iso- to anisohydric continuum of stomatal regulation of plant water status. Ecol. Lett. 2016, 19, 1343–1352. [Google Scholar] [CrossRef]
- Tardieu, F.; Simonneau, T. Variability among species of stomatal control under fluctuating soil water status and evaporative demand: Modelling isohydric and anisohydric behaviours. J. Exp. Bot. 1998, 49, 419–432. [Google Scholar] [CrossRef]
- Wang, Q.; He, Q.; Zhou, G. Applicability of common stomatal conductance models in maize under varying soil moisture conditions. Sci. Total Environ. 2018, 628–629, 141–149. [Google Scholar] [CrossRef] [PubMed]
- Lambers, H.; Chapin, F.S., III; Pons, T.L. Plant Physiological Ecology, 2nd ed.; Springer Science + Bussiness Media BV.: Cham, Switzerland, 2008; ISBN 978-0-387-78340-6. [Google Scholar]
- Jones, H.G.; Leinonen, I. Thermal Imaging for the Study of Plant Water Relations. J. Agric. Meteorol. 2003, 59, 205–217. [Google Scholar] [CrossRef]
- Leinonen, I.; Grant, O.M.; Tagliavia, C.P.P.; Chaves, M.M.; Jones, H.G. Estimating stomatal conductance with thermal imagery. Plant Cell Environ. 2006, 29, 1508–1518. [Google Scholar] [CrossRef]
- Espinoza, C.Z.; Khot, L.R.; Sankaran, S.; Jacoby, P.W. High resolution multispectral and thermal remote sensing-based water stress assessment in subsurface irrigated grapevines. Remote Sens. 2017, 9, 961. [Google Scholar] [CrossRef]
- Schuerger, A.C.; Richards, J.T. Effects of artificial lighting on the detection of plant stress with spectral reflectance remote sensing in bioregenerative life support systems. Int. J. Astrobiol. 2006, 5, 151–169. [Google Scholar] [CrossRef]
- Peñuelas, J.; Pinol, J.; Ogaya, R.; Filella, I. Estimation of plant water concentration by the reflectance Water Index WI (R900/R970). Int. J. Remote Sens. 1997, 18, 2869–2875. [Google Scholar] [CrossRef]


| Date (2018) | 15-Apr. | 18-Apr. | 21-Apr. | 24-Apr. | 26-Apr. | 28-Apr. | 30-Apr. | 2-May | Samples | |
|---|---|---|---|---|---|---|---|---|---|---|
| Soybean | DAS | 23 | 26 | 29 | 32 | 34 | 36 | 38 | 40 | 144 |
| DoM | 1 | 4 | 7 | 10 | 12 | 14 | 16 | 18 | ||
| Date (2018) | 21-Apr. | 24-Apr. | 26-Apr. | 28-Apr. | 30-Apr. | 2-May | 4-May | Samples | ||
| Maize | DAS | 12 | 15 | 17 | 19 | 21 | 23 | 25 | 126 | |
| DoM | 1 | 4 | 6 | 8 | 10 | 12 | 14 | |||
| Acronym | Indices | Equation | Reference |
|---|---|---|---|
| Structure | |||
| NDVI | Normalized difference vegetation index | (ρ800 − ρ670)/(ρ800 + ρ670) | [38] |
| EVI | Enhanced vegetation index | 2.5*(ρ800 − ρ680)/(ρ800 + 6*ρ680 − 7.5*ρ450 + 1) | [69] |
| OSAVI | Optimized soil adjusted vegetation index | (1 + 0.16)*(ρ800 − ρ670)/(ρ800 + ρ670 + 0.16) | [70] |
| REIP | Red-edge inflection point | Max dρ (680 − 780) | [71] |
| rNDVI | Red-edge normalized difference vegetation index | (ρ750 − ρ705)/(ρ750 + ρ705) | [72] |
| Pigments: Chlorophyll, Carotenoids, and Anthocyanin | |||
| TCARI | Transformed chlorophyll absorption in reflectance index | 3*((ρ700 − ρ670) − 0.2*(ρ700 − ρ550)*(ρ700/ρ670)) | [39] |
| TCARI/OSAVI | Transformed chemical absorption reflectance index/optimized soil adjusted vegetation index | (3*((ρ700 − ρ670) − 0.2*(ρ700 − ρ550)*(ρ700/ρ670)))/((1 + 0.16)*(ρ800 − ρ670)/(ρ800 + ρ670 + 0.16)) | [39] |
| R700/670 | Ratio between reflectance at 700 and 670 nm | ρ700/ρ670 | [43] |
| PSNDc | Pigment specific normalized difference index | (ρ800 − ρ470)/(ρ800 + ρ470) | [40] |
| mARI | Modified anthocyanin reflectance index | ((1/ρ550) − (1/ρ660)*ρ780 | [68] |
| Photochemical Activity | |||
| PRI | Photochemical reflectance index | (ρ531 − ρ570)/(ρ531 + ρ570) | [41] |
| sPRI | Similar photochemical reflectance index | (ρ560 − ρ510)/(ρ560 + ρ510) | [73] |
| PRI(570–515) | Modified photochemical reflectance index | (ρ570 − ρ515)/(ρ570 − ρ515) | [74] |
| Temperature | |||
| ΔT | Temperature difference | TL,Rad − Tair | |
| Crop | Soybean | Maize | ||||
|---|---|---|---|---|---|---|
| Parameter | WHC | DoM | WHC*DoM | WHC | DoM | WHC*DoM |
| ET (mm day−1) | 49.9 *** | 38.2 *** | 0.7 ns | 58.5 *** | 163.8 *** | 2.3 * |
| A (µmol CO2 m−2 s−1) | 6.6 ** | 35.0 *** | 1.2 ns | 0.1 ns | 45.5 *** | 3.3 *** |
| Tr (mmol H2O m−2 s−1) | 15.0 *** | 18.2 *** | 1.3 ns | 2.2 ns | 20.2 *** | 1.1 ns |
| gs (mol H2O m−2 s−1) | 23.0 *** | 14.7 *** | 1.1 ns | 2.0 ns | 9.0 *** | 0.9 ns |
| chl (µg m−2) | 39.3 *** | 20.6 *** | 1.5 ns | 1.7 ns | 18.4 *** | 0.5 ns |
| hc (m) | 1.1 ns | 34.4 *** | 0.4 ns | 1.7 ns | 192.8 *** | 1.1 ns |
| LAI a (m2 m−2) | 0.2 ns | - | - | 19.8 ** | - | - |
| Crop | Soybean | Maize | ||||
|---|---|---|---|---|---|---|
| Parameter | WHC | DoM | WHC*DoM | WHC | DoM | WHC*DoM |
| NDVI | 2.5 ns | 13.3 *** | 0.9 ns | 12.1 *** | 120.7 *** | 1.1 ns |
| EVI | 5.0 ** | 65.8 *** | 0.9 ns | 8.2 *** | 245.5 *** | 2.4 ** |
| OSAVI | 2.0 ns | 19.8 *** | 0.9 ns | 9.2 *** | 319.5 *** | 1.5 ns |
| REIP | 2.8 ns | 45.0 *** | 0.9 ns | 7.5 *** | 352.1 *** | 2.1 * |
| rNDVI | 25.4 *** | 12.3 *** | 0.6 ns | 11.8 *** | 170.1 *** | 1.2 ns |
| TCARI | 27.9 *** | 16.3 *** | 2.0 * | 0.3 ns | 64.0 *** | 3.1 ** |
| TCARI/OSAVI | 29.5 *** | 14.1 *** | 1.8 * | 1.8 ns | 14.7 *** | 2.6 ** |
| R(700/670) | 38.5 *** | 1.3 ns | 1.5 ns | 6.9 ** | 10.9 *** | 1.2 ns |
| PSNDc | 3.4 * | 2.4 * | 0.7 ns | 5.4 ** | 118.3 *** | 1.0 ns |
| mARI | 5.6 ** | 17.1 *** | 1.7 ns | 13.1 *** | 77.6 *** | 1.0 ns |
| PRI | 1.1 ns | 13.7 *** | 1.4 ns | 0.1 ns | 3.0 ** | 0.3 ns |
| sPRI | 38.5 *** | 2.0 ns | 1.4 ns | 3.5 * | 54.8 *** | 1.1 ns |
| PRI(570–515) | 34.1 *** | 5.4 *** | 2.1 * | 3.1 * | 70.3 *** | 0.5 ns |
| TL,Rad (°C) | 9.9 *** | 7.9 *** | 2.0 * | 1.7 ns | 7.3 *** | 2.8 ** |
| ΔT (°C) | 9.9 *** | 5.1 *** | 2.0 * | 1.7 ns | 6.7 *** | 2.8 ** |
| Hyper | Crop | R2cal | R2val | NRMSEcal (%) | NRMSEval (%) | Biascal (%) | Biasval (%) | LV |
|---|---|---|---|---|---|---|---|---|
| Soybean | 0.79 | 0.67 | 12 | 15 | 2.9 | 3.4 | 8 | |
| A (µmol CO2 m−2 s−1) | Maize | 0.87 | 0.79 | 8 | 10 | 1.1 | 1.4 | 5 |
| Soybean + Maize | 0.94 | 0.92 | 7 | 9 | 4.1 | 4.8 | 11 | |
| Soybean | 0.71 | 0.54 | 14 | 18 | 3.5 | 4.2 | 8 | |
| gs (mol H2O m−2 s−1) | Maize | 0.65 | 0.58 | 13 | 15 | 1.3 | 1.5 | 2 |
| Soybean + Maize | 0.82 | 0.77 | 11 | 13 | 3.6 | 3.9 | 10 | |
| Soybean | 0.82 | 0.68 | 12 | 15 | 2.6 | 3.9 | 9 | |
| Tr (µmol CO2 m−2 s−1) | Maize | 0.85 | 0.75 | 9 | 12 | 1.3 | 1.7 | 5 |
| Soybean + Maize | 0.89 | 0.86 | 10 | 11 | 2.9 | 3.6 | 10 | |
| Hyper + TL,Rad | Crop | R2cal | R2val | NRMSEcal | NRMSEval | Biascal | Biasval | LV |
| Soybean | 0.78 | 0.68 | 13 | 15 | 3.0 | 3.6 | 8 | |
| A (µmol CO2 m−2 s−1) | Maize | 0.87 | 0.79 | 8 | 11 | 1.1 | 1.5 | 5 |
| Soybean + Maize | 0.94 | 0.92 | 7 | 8 | 4.1 | 4.9 | 11 | |
| Soybean | 0.81 | 0.68 | 12 | 15 | 3.1 | 3.8 | 8 | |
| gs (mol H2O m−2 s−1) | Maize | 0.65 | 0.57 | 14 | 15 | 1.3 | 1.5 | 2 |
| Soybean + Maize | 0.86 | 0.82 | 10 | 11 | 3.3 | 3.9 | 10 | |
| Soybean | 0.83 | 0.70 | 11 | 15 | 2.7 | 3.7 | 9 | |
| Tr (µmol CO2 m−2 s−1) | Maize | 0.83 | 0.74 | 10 | 12 | 1.4 | 1.9 | 5 |
| Soybean + Maize | 0.90 | 0.86 | 9 | 11 | 3.0 | 3.4 | 10 | |
| Hyper + TL,Rad + hc | Crop | R2cal | R2val | NRMSEcal | NRMSEval | Biascal | Biasval | LV |
| Soybean | 0.79 | 0.66 | 12 | 16 | 2.9 | 3.7 | 7 | |
| A (µmol CO2 m−2 s−1) | Maize | 0.86 | 0.79 | 8 | 11 | 1.1 | 1.5 | 5 |
| Soybean + Maize | 0.94 | 0.92 | 7 | 8 | 4.1 | 4.7 | 11 | |
| Soybean | 0.79 | 0.65 | 12 | 16 | 3.3 | 3.7 | 8 | |
| gs (mol H2O m−2 s−1) | Maize | 0.69 | 0.61 | 13 | 14 | 1.2 | 1.4 | 3 |
| Soybean + Maize | 0.86 | 0.82 | 10 | 11 | 3.4 | 3.9 | 10 | |
| Soybean | 0.83 | 0.71 | 11 | 15 | 2.6 | 3.8 | 8 | |
| Tr (µmol CO2 m−2 s−1) | Maize | 0.91 | 0.81 | 7 | 10 | 0.8 | 1.2 | 7 |
| Soybean + Maize | 0.91 | 0.87 | 9 | 11 | 2.7 | 3.3 | 10 |
© 2020 by the authors. Licensee MDPI, Basel, Switzerland. This article is an open access article distributed under the terms and conditions of the Creative Commons Attribution (CC BY) license (http://creativecommons.org/licenses/by/4.0/).
Share and Cite
Sobejano-Paz, V.; Mikkelsen, T.N.; Baum, A.; Mo, X.; Liu, S.; Köppl, C.J.; Johnson, M.S.; Gulyas, L.; García, M. Hyperspectral and Thermal Sensing of Stomatal Conductance, Transpiration, and Photosynthesis for Soybean and Maize under Drought. Remote Sens. 2020, 12, 3182. https://doi.org/10.3390/rs12193182
Sobejano-Paz V, Mikkelsen TN, Baum A, Mo X, Liu S, Köppl CJ, Johnson MS, Gulyas L, García M. Hyperspectral and Thermal Sensing of Stomatal Conductance, Transpiration, and Photosynthesis for Soybean and Maize under Drought. Remote Sensing. 2020; 12(19):3182. https://doi.org/10.3390/rs12193182
Chicago/Turabian StyleSobejano-Paz, Verónica, Teis Nørgaard Mikkelsen, Andreas Baum, Xingguo Mo, Suxia Liu, Christian Josef Köppl, Mark S. Johnson, Lorant Gulyas, and Mónica García. 2020. "Hyperspectral and Thermal Sensing of Stomatal Conductance, Transpiration, and Photosynthesis for Soybean and Maize under Drought" Remote Sensing 12, no. 19: 3182. https://doi.org/10.3390/rs12193182
APA StyleSobejano-Paz, V., Mikkelsen, T. N., Baum, A., Mo, X., Liu, S., Köppl, C. J., Johnson, M. S., Gulyas, L., & García, M. (2020). Hyperspectral and Thermal Sensing of Stomatal Conductance, Transpiration, and Photosynthesis for Soybean and Maize under Drought. Remote Sensing, 12(19), 3182. https://doi.org/10.3390/rs12193182