Abstract
The latest advances in technical characteristics of unmanned aerial systems (UAS) and their onboard sensors opened the way for smart flying vehicles exploiting new application areas and allowing to perform missions seemed to be impossible before. One of these complicated tasks is the 3D reconstruction and monitoring of large-size, complex, grid-like structures as radio or television towers. Although image-based 3D survey contains a lot of visual and geometrical information useful for making preliminary conclusions on construction health, standard photogrammetric processing fails to perform dense and robust 3D reconstruction of complex large-size mesh structures. The main problem of such objects is repeated and self-occlusive similar elements resulting in false feature matching. This paper presents a method developed for an accurate Multi-View Stereo (MVS) dense 3D reconstruction of the Shukhov Radio Tower in Moscow (Russia) based on UAS photogrammetric survey. A key element for the successful image-based 3D reconstruction is the developed WireNetV2 neural network model for robust automatic semantic segmentation of wire structures. The proposed neural network provides high matching quality due to an accurate masking of the tower elements. The main contributions of the paper are: (1) a deep learning WireNetV2 convolutional neural network model that outperforms the state-of-the-art results of semantic segmentation on a dataset containing images of grid structures of complicated topology with repeated elements, holes, self-occlusions, thus providing robust grid structure masking and, as a result, accurate 3D reconstruction, (2) an advanced image-based pipeline aided by a neural network for the accurate 3D reconstruction of the large-size and complex grid structured, evaluated on UAS imagery of Shukhov radio tower in Moscow.
1. Introduction
Periodical monitoring of the technical state of industrial buildings and constructions is of great importance for their safety and proper operating. The importance of this issue grows notably if the object to be monitored is aged and is of cultural heritage meaning. New sensors and technologies such as photogrammetric multi-view stereo or laser scanning can now provide accurate and dense 3D geometric information of complex objects. However some complicated man-made structures, such as mesh-like tall objects, electricity towers, metallic bridges with arches, and so forth, still pose challenges for comprehensive studies and 3D reconstructions.
Nowadays unmanned aerial systems (UAS) [1,2,3] are used in wide variety of applications [1,4,5] due to their ability to fly in an extensive range of heights and velocities, to reach hardly accessible area and to carry various sensors as a payload. Their advanced capabilities allow to use them in very complicated missions such as rescue operations, cargo delivery to dangerous or inaccessible areas, monitoring of hardly accessible objects, and so forth. Technical abilities of UASs and their onboard sensors are sufficient to reach, inspect and survey complex objects such as television towers and bridges for surveying and image acquisition purposes.
The paper addresses a problem of an image-based 3D reconstruction of the Shukhov Radio Tower in Moscow (Russia), also known as Shabolovka. This tower was built during 1920–1922 years by Russian architect Vladimir Shukhov, who proposed a novel type of constructions—doubly curved structural forms used both for light-weight towers (Figure 1a,b) and roofs (Figure 1c) Shukhov Radio Tower (Figure 1b) is one of these construction, and now it is a part of World cultural heritage.
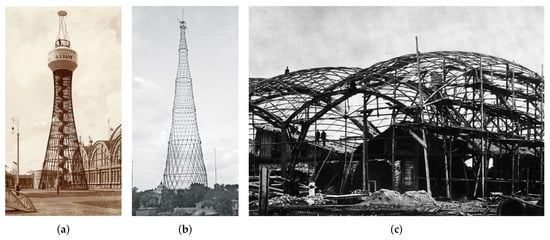
Figure 1.
The world’s first diagrid hyperboloid water tower (37 m height) built by V. Shukhov for the All-Russian Exposition in 1896 in Nizhny Novgorod, Russia (a). The Shukhov radio tower, also known as the Shabolovka tower, build between 1919 and 1922 in Moscow, Russia (b). The world’s first double curvature steel diagrid by Shukhov (during construction), Vyksa near Nizhny Novgorod, 1897 (c).
Unfortunately Shukhov Tower has had no extensive technical inspection for a long time, so its technical state needs to be observed and documented. With this aim two surveys has been carried out during the period 2012–2015. The first one employed laser scanning with further 3D modeling of the wired structure [6] whereas the second employed UAS-based images for photogrammetric processing and 3D reconstruction. The UAS-based survey resulted in a set of images acquired during the UAS ascending/descending (vertical image ‘stripes’) trajectory (Figure 2).
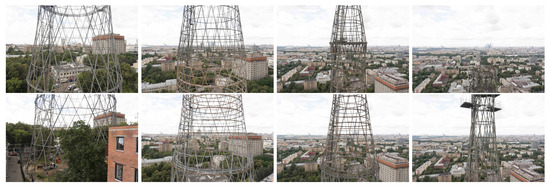
Figure 2.
Samples from image ’stripe’.
Despite the impressive progress in image processing techniques for automatic 3D reconstruction based on Structure-from-Motion and Multi-View Stereo frameworks [7], complex wired structures such as the Shukhov Tower could not be automatically reconstructed. Indeed, the complicated grid elements of the tower and its tubular structure induce many failures in image-based methods and require a lot of manual processing, even for laser scanning [6].
The paper presents a methodology developed for the automated image-based 3D reconstruction of complex grid structures aided by deep learning. The main contributions of the paper are: (1) a deep learning WireNetV2 convolutional neural network model that outperforms the state-of-the-art results of semantic segmentation on a dataset containing images of grid structures of complicated topology with repeated elements, holes, self-occlusions, thus providing robust grid structure masking and, as a result, accurate 3D reconstruction, (2) the first accurate image-based textured 3D reconstruction of the Shukhov Radio Tower by multi-view stereo processing of UAS-taken imagery, failing to be processed by standard photogrammetric methods. We made our dataset and reconstruction results publicly available (http://www.zefirus.org/ShukhovTower).
2. Related Works
2.1. UAS Based Photogrammetric Imaging
The spectrum of UAS types and application fields is wide and is expanding rapidly, including agriculture, industrial monitoring of large size objects, cultural heritage, forestry, environment and ecological monitoring and mapping, fast updating of local geospatial information, and so forth [8,9,10,11,12]. Due to their high performance and easy control, UASs are successfully exploited for photogrammetric surveying.
In archaeology and cultural heritage UAS supports aerial surveying for planning and monitoring excavation sites [13,14], for producing new types of archaeological documents such as textured 3D models and orthoimages [15].
The application of UASs in agriculture and forestry grows rapidly due to possibility of obtaining high quality actual data that is allows to plan agricultural activity, to support precision farming [16], to estimate plants condition [17], and so forth.
Environment monitoring involves the use of UASs in different purposes such as a disaster impact analysis [5,18], wildlife monitoring and conservation [19], plastic pollution detection and classification [20], collecting real time information from a specific location and uploading this data onto web server for on-line viewing [21], and so forth.
Due to flexibility and variety of UAS-based imaging platforms, they are also used to perform surveying and monitoring of roads for estimating traffic conditions and road pavement state [22,23,24]. UAS is also an attractive platform for acquiring imagery for 3D reconstruction and technical inspection of industrial large-size objects [25,26,27].
UAS’ ability to reach almost any place, acquiring multi-modal data and delivering high quality information make these flying machines also useful in many situations and tasks where actual geo-spatial information is required for rapid reaction to changing circumstances [28].
2.2. Grid Structures 3D Reconstruction
Image-based 3D reconstruction of grid structures poses significant challenges due to the complicated topology of the objects, repetitive features hard to be distinguished in matching operations, self-occlusions, and so forth. Due to the complexity of the problem a list of works related to grid structures 3D reconstruction is not so long. Most of the approaches presented in recent publications try to extract a topology of a mesh object using some assumption about the object structure, like wire smoothness [29], linearity of elements [30,31] or their tubular shape [32].
In Huang et al. [33] a -medial skeleton as a curve skeleton representation for 3D point cloud object data was introduced. The developed algorithm extracts curve skeletons from unorganized, un-oriented, and incomplete 3D raw point clouds, thus providing topology representation (but not 3D reconstruction) of the object.
Similar to Reference [33], Morioka et al. [34] retrieved a topology of a 3D point cloud as a 3D graph, with further representation of a wire-structure object as a combination of cylindrical elements centered along the edges of the graph. The method uses Delaunay tetrahedralization to make the initial edges and simplifies the edges by applying iterative edge contractions to extract the graph representing the wire topology. Furthermore, an optimization technique is applied to the positions of the cylindrical surfaces in order to improve the geometrical accuracy of the final reconstructed surface. So the methods allows to reconstruct the 3D structure of an object without reconstructing the shape of wire elements.
Su et al., 2018 [35] used an optical-based method to produce digital 3D data of spider web architecture and perform topology analysis. The focus of the study was developing an innovative experimental method to directly capture the complete digital 3D spider web architecture with micron scale resolution. The authors built an automatic segmentation and scanning platform to obtain high-resolution 2D images of individual cross-sections of the web that were illuminated by a sheet laser. The developed image processing algorithms were used to reconstruct the digital 3D fibrous network by analyzing the 2D images. This digital network provides a model that contains all of the structural and topological features of the porous regions of a 3D web with high fidelity, and when combined with a mechanical model of silk materials, will allow us to directly simulate and predict the mechanical response of a realistic 3D web under mechanical loads.
The available publications on grid structures 3D reconstruction do not propose methods for dense accurate grid object 3D reconstruction from raw UAS-taken imagery. The main problem that one has to solve for multi-view stereo 3D reconstruction of such objects is a false feature matching in the images, caused by repeated elements of a construction appearing both in the foreground and in the background of a scene. Masking images for eliminating disturbing or not significant for 3D reconstruction areas seems to be a promising approach for complex cases. Reference [36] used semantic image segmentation and binary masking for eliminating effect of moving objects in images. A method [37] utilises the camera relative orientation of a pair of images to find a reliable object segmentation for further accurate 3D reconstruction. But these and some more related works [38,39,40] addresses to the problem of continuous (not grid-structured) objects. Recent impressive progress in deep learning methods makes them powerful mean for solving various complicated task with high quality.
2.3. Deep Convolutional Neural Networks
In the last years, deep convolutional neural networks (CNNs) started to be employed within the 3D image-based pipeline in order to boost the processing and facilitate some steps. According to their role within the 3D reconstruction pipeline, neural networks could be divided intro three broad groups:
- CNNs for single-photo 3D reconstruction: multiple neural network models were proposed for reconstruction of objects and buildings from a single image using conditional generative adversarial networks (GAN) [41,42,43,44,45,46,47]. While deep models such as Pix2Vox [44] and Z-GAN [47] proved to reconstruct complex structures from a single photo, but a large training dataset is required to achieve the desired quality. However, no public datasets of wire structures are available to date to train such models.
- CNNs for feature matching: the presented approaches [48,49,50,51,52] seem to outperform handcrafted feature detectors/descriptor methods. Still, their performance is closely related to the similarity of local image patches in the training dataset with respect to the images used during inference. However, repeating metal beams of wire structures are not present in modern datasets.
- CNNs for semantic image segmentation and boosting of SfM/MVS procedures: CNN methods [53,54,55,56,57,58,59] have also demonstrated their potential for detecting a numerous number of elements in the images and then boost the processing pipeline in terms of constrained tie point extraction or semantic multi-view stereo [60,61,62]. The advantages of image masking for dense point cloud generation are well known in the literature [62,63,64]. While there are multiple readily available segmenation models for oblique aerial photos [63] or buildings [64,65], the generation of pixel-level semantic segmentation for sparse wire objects is challenging. The analysis of repetitive patterns [66,67] allows to partly solve this problem for opaque objects (e.g., skyscrapers). Still, for objects with holes, such methods do not provide robust results. Generative Adversarial Networks (GANs) [68,69] have demonstrated a significant improvement for models that generate high fidelity output such as color images and semantic segmentation. Luc et al. [70] has proposed an adversarial framework for learning a robust semantic segmentation models capable of reconstructing fine details in the input imagery. Luc proposed to use masked images as an input for the discriminator. The discriminator observes color images masked with real masks and masks predicted by the framework. It learns to distinguish ‘real’ images and ‘fake’ images. This allows to provide a meaningful adversarial loss that improves the quality of segmentation in terms of small objects and object boundaries. So, considering image segmentation and masking as a key point for repetitive and self-occlusive structures 3D reconstruction from images, some deep network models were presented: MobileNetV2 [54], a fast network leveraging inverted residuals and linear bottlenecks; UPerNet [71] model, a multi-task network that uses internal feature map fusing to increase the labelling accuracy; HRNetV2 [72] which utliizes high-resolution representation and multiple streams of different spatial sizes to perform high-fidelity image segmentation. These CNN models serve as baselines and a starting point for developing our deep learning technique for accurate and robust image segmentation for further multi-view stereo 3D reconstruction of the Shukhov Radio tower.
3. Shukhov Tower and UAS-Based Surveying
3.1. Shukhov Radio Tower as a Photogrammetric Challenge
Shukhov Radio Tower, also called Shabolovka tower, was built in Moscow (Russia) in the years 1920–1922. The author of the Tower design is Vladimir Shukhov, a genius Russian engineer and architect. He has invented a new type of grid constructions based on hyperboloid structure. Such approach allows to significantly reduce the weight of the construction keeping its high rigidity.
Shukhov has built the first diagrid tower for the All-Russian Exhibition in Nizhny Novgorod (Russia) in 1896 (Figure 1a). Later, Shukhov designed the Shabolovka tower, which was built in Moscow under his direction in 1920–1922. The Shukhov radio tower in Moscow is a landmark in the history of structural engineering and an emblem of the creative genius of an entire generation of modernist architects in the years that followed the Russian Revolution. The tower is interesting for its original architectural construction method and is now a cultural heritage monument under preservation.
Due to historical circumstances, the original drawing for the Shukhov towers has been left. During the almost century from the day of the tower starting to operate only two inspections of the tower condition were performed (1947 and 1971). So gathering information about the current state of the Shukhov tower is very important for safety and preserving this historical monument.
While photogrammetric techniques, such as SfM or MVS, demonstrated an impressive performance in automatic image processing and accurate high-quality 3D model generations of continuous surfaces, they meet significant problem with complicated objects like grid structures. As such, the Shukhov tower poses several challenges for image-based 3D reconstruction:
- The tower’s size (137 m height) and shape require some specific means for acquiring the necessary images keeping appropriate scale and ray intersection angles. UASs give a solution for this challenge allowing to acquire images of such huge-sized and hardly-get object according the specific requirements.
- The 3D surveying’s design and preparation must consider that the historical monument is now an operating radio translation tower: radio transmitters located on the tower disturb UAS control and operations.
- An effective image processing should minimize manual operation and also be able to handle holes, wire structures, repeated elements and shiny surfaces. This challenge can be answer with deep learning technique for detecting tower elements in images (Section 4).
3.2. UAS-Based Survey
The aim of the photogrammetric UAS based survey was the 3D reconstruction of the tower geometry along with visual data acquisition about the current state of the tower steel elements. The photogrammetric survey aimed at collecting and producing documentation and restoration data about the tower. The survey was performed using an AscTec Falcon 8 UAS equipped with a SONY NEX-5 camera (Figure 3). Main technical characteristics of the UAS and the camera are presented in Table 1 and Table 2.
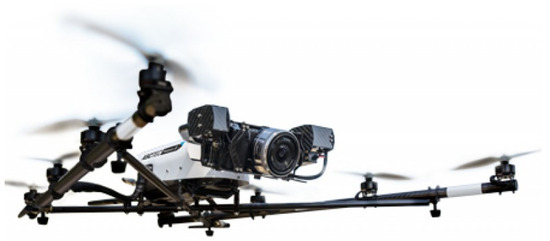
Figure 3.
AscTec Falcon 8 unmanned aerial system (UAS) equipped with a SONY NEX-5 camera.

Table 1.
Main characteristics of SONY NEX-5 camera.

Table 2.
Main characteristics of AscTec Falcon 8.
A preliminary geodetic survey was carried out for obtaining a set of ground control points (GCP). GCPs are necessary to assess the quality of the 3D reconstruction and for geo-referencing the resulting photogrammetric 3D results. A geodetic group, using a Geomax Zoom 25pro total station, performed the measurement of 10 GCPs located at two levels of the tower (Figure 4): at foundation level and at 3-rd section level (about 50 m altitude). Special targets located on the tower parts helped to identify the control points while measuring them and in the acquired imagery (Figure 5).
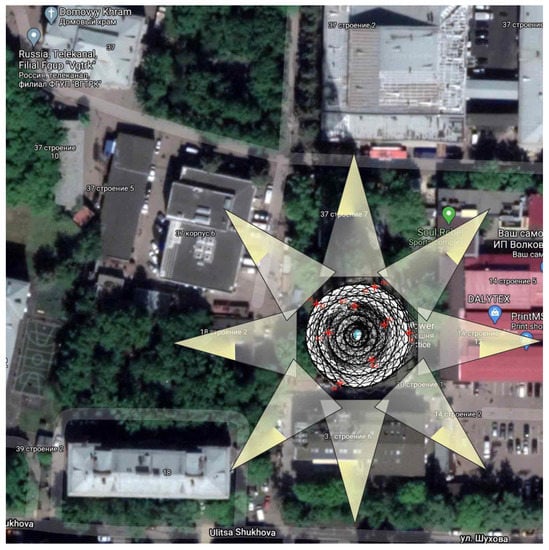
Figure 4.
A scheme of imaging directions (’8-ray star’) and marker locations.
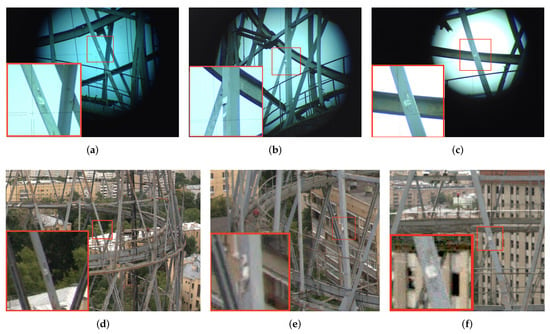
Figure 5.
Special markers used for labeling the reference point measured by Geomax Zoom 25pro total station (a–c) and corresponding images from UAS imagery (d–f).
For UAS survey ‘8-ray star configuration’ (Figure 4) was applied that allows all-around imaging with required image overlapping for photogrammetric processing. This configuration provided a scale of approximately 1:1700 with an average ground sample distance (GSD) of of mm. Eight vertical stripes were flown and images acquired during the UAS ascending/descending. This resulted in about 600 images. Sample images from one of the ‘stripes’ are shown in Figure 2.
3.3. Standard Imagery Processing
The first attempt to perform 3D reconstruction using the acquired UAS imagery was carried out applying a standard photogrammetric pipeline provided by Agisoft Photoscan software (https://www.agisoft.com). The results of the image triangulation process (SfM) and dense point cloud generation (MVS) are shown in Figure 6. The 3D point cloud has a lot of outliers and many images are not correctly oriented.

Figure 6.
Image orientation (a), sparse point cloud (b) and dense point cloud (c) produced on a set of images by standard processing.
Even after a manual selection of images with reliable orientation and good intersection angles, the multi-view stereo 3D reconstruction (Figure 6c) failed due to the many repeated structures and holes in the tower. The complex structure of the tower poses a challenge for corresponding points’ detection and dense point cloud generation, thus resulting in a great number of false correspondences and, as a consequence, in problem with image orientation and 3D coordinates estimation. In absence of a robust algorithm for corresponding points matching, occlusion detection and repeated pattern handling, the only way to overcome the problem would be manual image masking, although very time consuming and error-prone.
With the recent advances in deep learning techniques, it was understood that a learning-based approach for image segmentation and background detection could allow to develop a convolutional neural network model for robust tower structure detection and masking in the acquired images.
4. Deep-Learning Aided Iimage-Based 3D Reconstruction
4.1. Deep Learning Approach
Local patch similarity is one of the main problem in photogrammetric 3D reconstruction procedures. False matches result in poor quality of camera external orientation estimation and a large number of outliers in the dense point clouds. In the case study under investigation, the main reason for the false feature point matching is the repeating structures and similar elements. Moreover, feature point matching algorithms confuse points located on the foremost sections of the tower with those points located on the rear but visible through the holes of the wire tower.
Masking irrelevant object parts to improve the stereo matching accuracy is a well-known technique for improving the quality of 3D reconstructions. Still, the total number of photos in the UAS survey exceeded 600. Therefore, manual labelling of all acquired data was impossible. The presented approach was inspired by recent research [62] which used semantic segmentation in images for improving accuracy of a multi-view stereo processing. A deep learning based technique is proposed to automatically generate image masks in case of complex wired structures (like the Shukhov tower).
Firstly, a simple U-net [53] model was trained but the quality of image segmentation was insufficient for correct point matching. The segmentation results of a HRNetv2 [72] were much more correct. Still, the model was unable to distinguish between foreground and background wire structures in the images. Hence, a new model, based on the HRNetv2, was developed and called WireNet [73] to improve the segmentation of the frontmost and rear parts of the tower.
4.2. WireNetV2 Model Architecture
The WireNet model was designed using multi-scale fusion and high-to-low resolution convolutions developed for a HRNetv2 [72] model. Similar to the HRNetv2, the original WireNet model has four multi-resolution convolution blocks that provide parallel fusion of multi-scale convolutions. Such approach allows the model to track both fine and coarse details of the processed image at the layers of different depth. The multi-resolution group convolution layer is similar to a regular group convolution layer that divides the input channels into groups and learns a separate kernels for each group. In contrast with a regular group convolution, the multi-resolution group convolution includes different spatial resolution. This allows the network to implicit reasoning about relationships between find and coarse details.
The original WireNet [73] model extended the HRNetv2 with two key contributions: (1) an additional parallel channel for the segmentation of rear structures, (2) a negative log likelihood loss function. While the modified architecture was capable of segmenting images of dense wire structures with sufficient quality, it still suffered from two disadvantages:
- (i)
- It had low generalization ability and failed to label wire parts with a similar texture but different structure, such as the upper levels of the tower, if the training dataset included only ground-truth masks of the bottom and middle levels;
- (ii)
- The segmentation had soft edges at sharp corners that were caused by the negative log likelihood loss. Such soft edges reduced the matching accuracy during the sparse key-point matching stage.
To eliminate these disadvantages, the neural network was improved into WireNetV2 by adding an additional adversarial loss to the WireNet baseline (Figure 7).
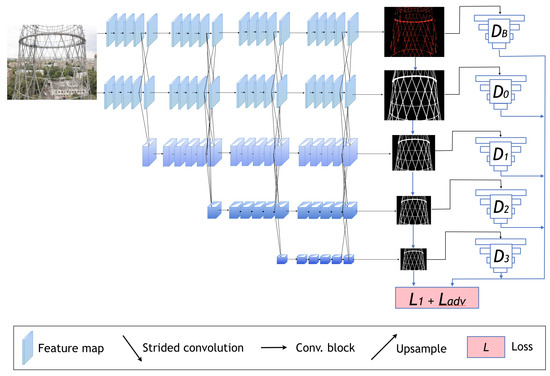
Figure 7.
Overview of the WireNetV2 model.
Assumptions made by Luc et al. [70] were used as a starting point for the developed adversarial loss. Specifically, an additional adversarial loss provided by a discriminator network was added to improve the labelling quality in terms of both generalization ability and reduction of soft edges of the segmentation. Furthermore, following Zhang [74], the proposed approach uses a tree like discriminator structure that verifies the synthesized images at different resolutions. Five PatchGAN [69] discriminators were added to the framework: . Discriminator aimes to qualify the labelling of the rear structures as either ‘real’ or ‘fake’ and the remaining discriminators similarly verify the network labelling with different spatial resolutions. The PatchGAN [69] discriminator consists of N convolutional layers. Each layer provides a receptive field of , where s is the stride for the layer, and k is the kernel size. Hence, the total receptive field of the PatchGAN model depends on the number of convolutional layers. The architecture of the PatchGAN discriminator and receptive fields for various number of layers are presented in Table 3.

Table 3.
The PatchGAN discriminator architecture and receptive fields for different number of layers [69].
Discriminators and use five convolutional layers. Discriminators , use four convolutional layers.
The necessity of the proposed adversarial loss function was evaluated by comparing two ablated versions of WireNetV2 framework (Figure 8). Qualitative experimental results demonstrate that the adversarial loss allows to improve the quality of the segmentation in terms of contour accuracy. This improvement results in notable reducing of the root mean square error of the best-fit point-to-point alignment with point cloud of the laser scanning [6] in comparison with first version of WireNet [73] (Section 5.3, Figure 15).
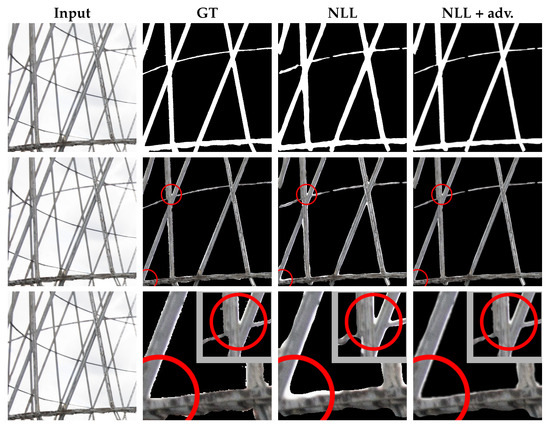
Figure 8.
Ablation study of the adversarial loss function: Two versions of the WireNetV2 model are compared: an ablated version without adversarial loss (NLL) and the full version (NLL + adv). Please, note that adversarial loss allows to reduce the amount of background visible through the masks (areas in red circles).
4.3. WireNetV2 Loss Function
Three loss functions govern the training process of the WireNetV2 model:
where is the ground truth foreground segmentation, is the predicted foreground segmentation, is the ground truth background segmentation, is the predicted background segmentation, , and are the hyperparameters, is a negative log likelihood loss function given by:
where are the image width and height, is the ground truth semantic labelling, is multichannel probability map defining the probability of pixel with coordinates belonging to class i, is the class weight for class i.
The adversarial loss function is given by:
4.4. WireNet Training Dataset
The acquired UAS imagery, consisting of about 600 images, was analyzed to identify the training sample for the WireNet model. Fifty images (about 8% of the whole data), containing descriptive features of the grid structure, have been selected for creating a training dataset. Image processing for preparing the training dataset included the following steps:
- pixel-wise segmentation into two classes “tower” and “background”,
- generation of training labels.
As a result, the training dataset contains original RGB images and corresponding binary ground truth labels.
Figure 9 shows samples of image-label pairs from the training dataset at different heights (levels) of the tower.
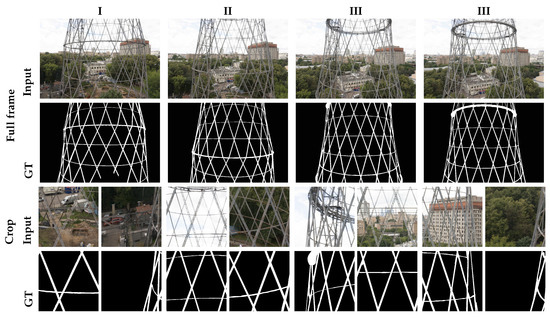
Figure 9.
Training dataset:The samples from the paired training dataset containing color images and labelling. Roman numbers indicate various levels of the tower. All images were labeled at the original resolution of 4912 × 3264 pixels. To match the size of the receptive field of the WireNetV2 model, full images were cropped tiles of 1000 × 1000 pixels. Please note that only labeled levels I–IV of the tower from two imaging directions were labeled to perform the segmentation of all levels from all viewpoints.
5. Results
5.1. Training Process and Performance of WireNetV2 Model
The developed WireNetV2 model has been trained using the PyTorch library [75] on the training part of the generated dataset (Section 4.4).
The training procedure was similar to a baseline training protocol. The data are augmented by random cropping (from 4912 × 3264 to 1000 × 1000), random scaling in the range of , and random horizontal flipping. The stochastic gradient descend (SGD) optimizer had the base learning rate of 0.01, the momentum of 0.9 and the weight decay of 0.0005. The poly learning rate policy with the power of 0.9 is used for dropping the learning rate. All the models are trained for 120 K iterations with the batch size of 12 using two NVIDIA GTX 2080 Ti GPU and syncBN.
The evaluation of the model on the independent test set demonstrated 91% accuracy for the Intersection-over-Union (IoU) metric. The validation proved the better generalization ability of the WireNetV2 model comparing with WireNet, thus allowing to improve the quality of the imagery processing aimed at tower segmentation in images.
5.2. Quantitative and Qualitative Evaluation of the WireNetV2 Model
The proposed WireNetV2 was compared with three modern image segmentation methods— MobileNetV2 [54], UPerNet [71], HRNetV2 [72]. An independent test split of the labeled images consisting of 100 images was used to evaluate the segmentation accuracy of the WireNetV2 model and with respect to the other three state-of-the-art methods. The test split contains images captured at different heights of the tower (I, II, III). The accuracy is reported in terms of the Intersection over Union (IoU) metric. Qualitative results are given in Figure 10. Quantitative results are reported in Table 4.
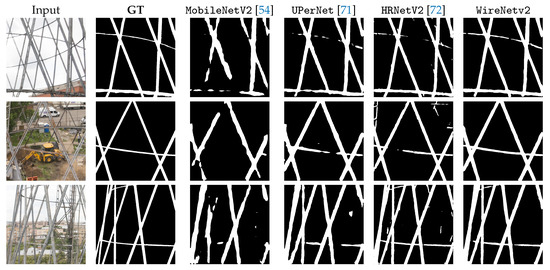
Figure 10.
Examples of semantic segmentation using MobileNetV2 [54], UPerNet [71], HRNetV2 [72], and the WireNetV2 model on independent test split of the dataset to automatically separate wires and background. Note that most of the compared methods fails to distinguish between foremost and rare wire structures.

Table 4.
Intersection-over-Union (IoU) values for the WireNetV2 model and three state-of-the-art methods for various levels of the tower and the average IoU for all levels.
5.3. Image-Based 3D Reconstruction
Preliminary image selection was performed to eliminate blurred and low quality images captured during the complex acquisition moments in the field. Then the photogrammetric image processing was performed on a remaining set of ca 500 images using the COLMAP pipeline (https://colmap.github.io) [76,77]. As all images contain the far-away scene in the background of the tower, given the short baselines between the UAS images, a threshold on the ray intersection angle was imposed in order to avoid 3D points reconstructed under a very small intersection angle.
COLMAP has demonstrated good performance and the results of the camera orientation are shown in Figure 11. These camera poses and sparse point cloud were used to apply the dense image matching procedure in order to derive the final dense point cloud of the wire tower.
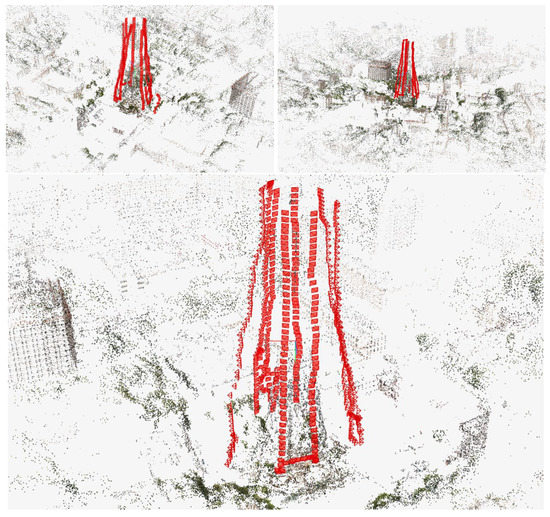
Figure 11.
Results of camera orientation procedure for ca 500 acquired images.
As said (Section 3.3), the main problem preventing an accurate dense 3D reconstruction of the wire structure was the incorrect and noisy dense matching result when no masks were used in the MVS process (Figure 6). Therefore a detailed image masking, based on the developed neural network, was applied to constrain the patch-based MVS method. Figure 12 and Figure 13 illustrate the results of dense point cloud generation and surface 3D reconstruction.

Figure 12.
One of the ’stripes’ processed with proposed technique: left—whole ’stripe’ processing, right—a fragment of surface 3D model.
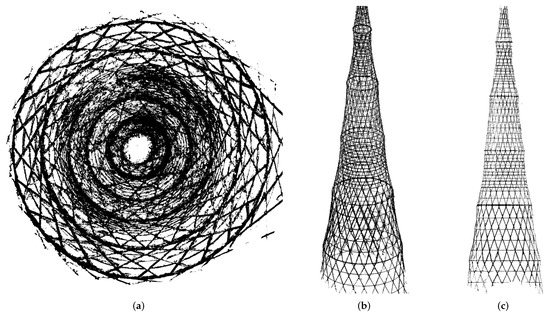
Figure 13.
Dense 3D point cloud of Shukhov tower (4.2 mil points): bottom view (a), isometry view (b) and front view (c), with rear part eliminated for better presentation.
The trained WireNetV2 model was applied to the UAS images for the automatic segmentation of the wire structures, providing a quick and robust masking of the background scene and also eliminating many outliers in the dense point cloud.
To evaluate the accuracy of the image-based 3D reconstruction results, the obtained dense point cloud was compared with the 3D data (http://www.andreyleonov.ru/projects/shukhov-tower.html) produced by the manual processing of the laser scanning survey (32 mil points) [6].
Qualitative results that demonstrate the impact of the masks quality on the reconstructed 3D model are given in Figure 14.
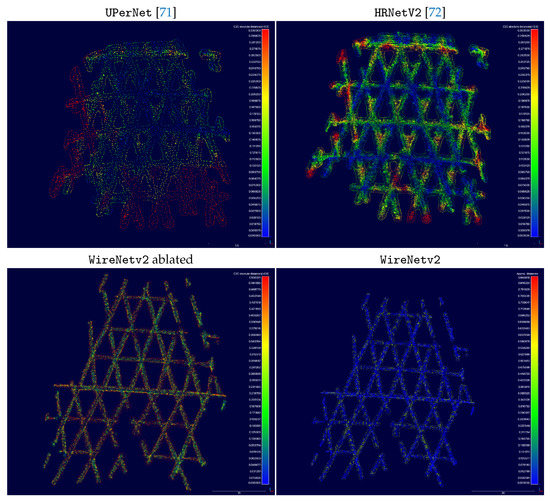
Figure 14.
Comparison of the accuracy (in meters) of the final point clouds with respect to various accuracy of object masks provided by UPerNet [71], HRNetV2 [72], and the WireNetV2 model in the ablated and full versions. All point clouds were obtained from a series of ten photos of the II level of the tower.
Table 5 shows the results of the best-fit point-to-point alignment between the point cloud obtained by laser scanning and multi-view stereo processing with different masking methods: UPerNet [71], HRNetV2 [72], and the WireNetV2.

Table 5.
Best-fitting errors (in meters) between the reference laser scanning point cloud and the photogrammetric point cloud computed with the different masking methods.
Results of the best-fit point-to-point alignment between the two point clouds are presented in Figure 15. The root mean square error between the two 3D clouds is 0.12 m with standard deviation of 0.115 m.
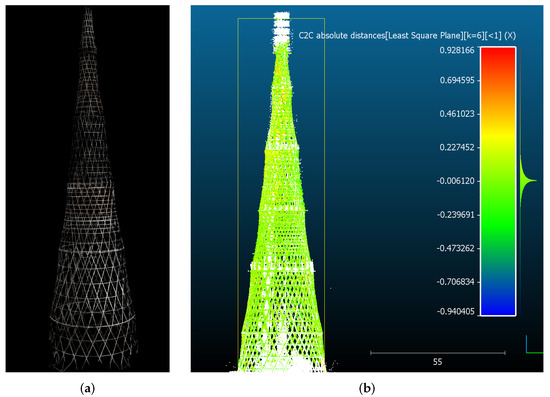
Figure 15.
Textured full 3D model of the tower (a), and point-to-point alignment and comparison the two point clouds: image-based and manually processed laser scanning data (b).
5.4. Textured 3D Model
An advantage of image-based 3D reconstruction methods is the provision of high quality texture information, useful to investigate current construction state (e.g., location of rust areas or cracks in the metallic structures) and plan conservation activities. Figure 16 presents a fragment of the created textured 3D model of the tower structures.
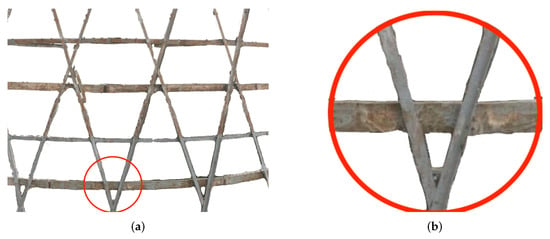
Figure 16.
Textured fragment of the tower 3D model (a) with up-scaled detail (b).
Surface 3D model was created by Delaunay triangulation of the dense point cloud with restriction on edge length. An image with the orientation that is closest to the mean normal of the surface fragment was used for texture mapping. Photorealistic surface texturing was performed using the external orientation of the chosen image provided by image orientation from MVS processing. The quality of the produced textured 3D model is enough for preliminary analysis of the tower elements condition and for the identification of possible problem in its structures.
6. Discussion
Image-based 3D reconstruction of wire-structured and non-Lambertian reflecting objects share many common problems. Reconstruction of such objects is repeatedly reported to be one of the most challenging fields in modern photogrammetry and computer vision [31,78,79]. Many attempts were made to reconstruct various complicated objects with multiple holes such as grid structures [29,30,31,32], gas flows [80,81], and flames [82,83]. While multiple modern baselines demonstrate the theoretical possibility of reconstruction of wire-structured objects, most methods require either fixed setup of sensors or a detailed physical model of the object being reconstructed. An example of such an object is a radio tower constructed from metal rods with multiple holes. Multiple attempts were made to develop methods for reconstruction of such objects. Existing algorithms leverage either constraint based on the repetitive structure of an object [66,67] or try to match line segments instead of feature points [84].
The presented research was focused on developing a robust pipeline for 3D reconstruction of complex wire structures with repeated elements. The pipeline should use only multi-view images as an input and provide robust performance without prior orientation and physical constraints on the object’s structure. The primary goal was to make the proposed pipeline robust and general. To this end, the developed method should be similar to existing image-based 3D reconstruction methods. The main contribution of the presented research is a deep learning-based image masking approach that allows to virtually convert a semi-transparent wire object to an opaque object that can be easily reconstructed using readily available multi-view stereo and structure-from-motion algorithms. To this end, the developed WireNetV2 model aims to separate front looking faces of the object from the backward-looking faces visible through the holes in the object’s surface.
The extensive experimental research proved that false matches are one of the main problems of the MVS procedure. Such matches usually occur when the point matching algorithm confuses the point on the front side with the feature point on the inside part visible through the holes in the object. These false matches generate random outliers inside and outside of the true wire ‘surface’. A comparison of reconstruction results (Figure 14 and Table 5) generated with and without image masking prove that only the developed WireNetV2 model that leverages semantic labeling allows reconstructing the surface of the complicated wire object and its texture.
Moreover, the comparison of the developed WireNetV2 model with state-of-the-art segmentation baselines presented in Figure 10 demonstrated that only the developed model could solve this sophisticated task focused on distinguishing front and rare metal structures. An ablation study (Figure 8 and Figure 14) demonstrates that the proposed adversarial loss allows reducing the number of outliers at the boundaries of the object’s structure. The main reason for this is that the negative log-likelihood loss aims to minimize the integral segmentation error. It tends to learn smoothed silhouettes of objects, especially at the sharp edges. While such smoothing is acceptable for general segmentation tasks, it includes parts of the background at the feature point matching step. Such errors in the masks stimulate the outlier points to appear in the resulting dense point cloud. While the developed method was crucial for the reconstruction of the Shukhov tower, the proposed pipeline is general and can be applied to other similar objects.
7. Conclusions
The paper presented an advanced image-based pipeline aided by a neural network for the 3D reconstruction of the large-size and complex Shukhov radio tower in Moscow. The performed study demonstrates a high potential of UASs for solving challenging 3D reconstruction tasks of complex grid structures. The image-based pipeline was combined with a deep learning approach in order to robustly detect and separate wire structure elements in UAS imagery, thus facilitating the feature matching and the creation of accurate 3D products. The developed WireNetV2 neural network model is able to carry out robust segmentation of complex grid structure in images with an IoU quality of 0.83, thus significantly reducing the number of false feature matching, and, as consequence, improving the quality of 3D reconstruction to 0.12 m RMSE compared to laser scanning. The quality of the resulting dense point cloud is enough for creating a textured 3D model of the tower, a product useful to carry out preliminary visual inspection of the construction condition and to easily identify the location of places of interest in the tower.
Further research will address the problem of improving the performance of WireNetV2 model for more accurate wire structure segmentation to obtain thin elements in images. This will allow to perform more detailed 3D reconstruction of the tower elements using the same UAS imagery. Another topic of the future research is to use texture maps for the automatic detection of potentially weak elements.
Author Contributions
Conceptualization, V.A.K. and F.R.; methodology, V.A.K., V.V.K. and F.R.; software, V.V.K.; validation, V.A.K., V.V.K. and F.R.; formal analysis, V.A.K.; investigation, V.A.K., V.V.K. and F.R.; data curation, S.Y.Z. and A.G.; writing–original draft preparation, V.A.K.; writing–review and editing, V.A.K., V.V.K. and F.R.; visualization, V.V.K.; All authors have read and agreed to the published version of the manuscript.
Funding
This research was partially funded by Russian Foundation for Basic Research (RFBR) grant numbers 17-29-04410 and 17-29-04509. The APC was funded by authors.
Conflicts of Interest
The authors declare no conflict of interest. The funders had no role in the design of the study; in the collection, analyses, or interpretation of data; in the writing of the manuscript, or in the decision to publish the results.
Abbreviations
The following abbreviations are used in this manuscript:
| CNN | Convolution Neural Network |
| GAN | Generative Adversarial Network |
| GCP | Ground Control Point |
| GSD | Ground Sample Distance |
| IoU | Intersection-over-Union |
| MVS | Multi-view Stereo |
| RMSE | Root Mean Square Error |
| SfM | Structure from Motion |
| SGD | Stochastic Gradient Descend |
| UAS | Unmanned Aerial System |
| UAV | Unmanned Aerial Vehicle |
References
- Colomina, I.; Molina, P. Unmanned aerial systems for photogrammetry and remote sensing: A review. ISPRS J. Photogramm. Remote Sens. 2014, 92, 79–97. [Google Scholar] [CrossRef]
- Nex, F.; Remondino, F. UAV for 3D mapping applications: A review. Appl. Geomat. 2014, 6, 1–15. [Google Scholar] [CrossRef]
- Granshaw, S.I. RPV, UAV, UAS, RPAS … or just drone? Photogramm. Rec. 2018, 33, 160–170. [Google Scholar] [CrossRef]
- Hassanalian, M.; Abdelkefi, A. Classifications, applications, and design challenges of drones: A review. Prog. Aerosp. Sci. 2017, 91, 99–131. [Google Scholar] [CrossRef]
- Giordan, D.; Hayakawa, Y.; Nex, F.; Remondino, F.; Tarolli, P. Review article: The use of remotely piloted aircraft systems (RPASs) for natural hazards monitoring and management. Nat. Hazards Earth Syst. Sci. 2018, 18, 1079–1096. [Google Scholar] [CrossRef]
- Leonov, A.V.; Anikushkin, M.N.; Ivanov, A.V.; Ovcharov, S.V.; Bobkov, A.E.; Baturin, Y.M. Laser scanning and 3D modeling of the Shukhov hyperboloid tower in Moscow. J. Cult. Herit. 2015, 16, 551–559. [Google Scholar] [CrossRef]
- Stathopoulou, E.K.; Welponer, M.; Remondino, F. Open-source image-based 3d reconstruction pipelines: Review, comparison and evaluation. ISPRS Int. Arch. Photogramm. Remote Sens. Spat. Inf. Sci. 2019, XLII-2/W17, 331–338. [Google Scholar] [CrossRef]
- Mandlburger, G.; Pfennigbauer, M.; Schwarz, R.; Flory, S.; Nussbaumer, L. Concept and Performance Evaluation of a Novel UAV-Borne Topo-Bathymetric LiDAR Sensor. Remote Sens. 2020, 12, 986. [Google Scholar] [CrossRef]
- Anthony, D.; Elbaum, S.; Lorenz, A.; Detweiler, C. On crop height estimation with UAVs. In Proceedings of the 2014 IEEE/RSJ International Conference on Intelligent Robots and Systems, Chicago, IL, USA, 14–18 September 2014; pp. 4805–4812. [Google Scholar] [CrossRef]
- Candiago, S.; Remondino, F.; De Giglio, M.; Dubbini, M.; Gattelli, M. Evaluating Multispectral Images and Vegetation Indices for Precision Farming Applications from UAV Images. Remote Sens. 2015, 7, 4026–4047. [Google Scholar] [CrossRef]
- Kameyama, S.; Sugiura, K. Estimating Tree Height and Volume Using Unmanned Aerial Vehicle Photography and SfM Technology, with Verification of Result Accuracy. Drones 2019, 3, 26. [Google Scholar] [CrossRef]
- Nex, F.; Remondino, F. Preface: Latest Developments, Methodologies, and Applications Based on UAV Platforms. Drones 2019, 3, 26. [Google Scholar] [CrossRef]
- Rinaudo, F.; Chiabrando, F.; Lingua, A.; Spanò, A. Archaeological site monitoring: UAV photogrammetry can be an answer. ISPRS Int. Arch. Photogramm. Remote Sens. Spat. Inf. Sci. 2012, 39, 583–588. [Google Scholar] [CrossRef]
- Knyaz, V.; Chibunichev, A.; Zhuravlev, D. Multisource data fusion for documenting archaeological sites. In Image and Signal Processing for Remote Sensing XXIII; Bruzzone, L., Ed.; International Society for Optics and Photonics (SPIE): Bellingham, WA, USA, 2017; Volume 10427, pp. 508–516. [Google Scholar] [CrossRef]
- Sauerbier, M.; Eisenbeiss, H. UAVs For The Documentation Of Archaeological Excavations. ISPRS Int. Arch. Photogramm. Remote Sens. Spat. Inf. Sci. 2010, 38, 526–531. [Google Scholar]
- Radoglou-Grammatikis, P.; Sarigiannidis, P.; Lagkas, T.; Moscholios, I. A compilation of UAV applications for precision agriculture. Comput. Netw. 2020, 172, 107148. [Google Scholar] [CrossRef]
- Grenzdorffer, G.J.; Engel, A.; Teichert, B. The Photogrammetric Potential of Low-Cost UAVS in Forestry and Agriculture. ISPRS Int. Arch. Photogramm. Remote Sens. Spat. Inf. Sci. 2008, 31, 1207–1214. [Google Scholar]
- Hildmann, H.; Kovacs, E. Review: Using Unmanned Aerial Vehicles (UAVs) as Mobile Sensing Platforms (MSPs) for Disaster Response, Civil Security and Public Safety. Drones 2019, 3, 59. [Google Scholar] [CrossRef]
- Gonzalez, L.; Montes, G.; Puig, E.; Johnson, S.; Mengersen, K.; Gaston, K. Unmanned Aerial Vehicles (UAVs) and Artificial Intelligence Revolutionizing Wildlife Monitoring and Conservation. Sensors 2016, 16, 97. [Google Scholar] [CrossRef]
- Jakovljevic, G.; Govedarica, M.; Alvarez-Taboada, F. A Deep Learning Model for Automatic Plastic Mapping Using Unmanned Aerial Vehicle (UAV) Data. Remote Sens. 2020, 12, 1515. [Google Scholar] [CrossRef]
- Ya’acob, N.; Zolkapli, M.; Johari, J.; Yusof, A.L.; Sarnin, S.S.; Asmadinar, A.Z. UAV environment monitoring system. In Proceedings of the 2017 International Conference on Electrical, Electronics and System Engineering (ICEESE), Kanazawa, Japan, 9–10 November 2017; pp. 105–109. [Google Scholar] [CrossRef]
- Iglesias, L.; De Santos-Berbel, C.; Pascual, V.; Castro, M. Using Small Unmanned Aerial Vehicle in 3D Modeling of Highways with Tree-Covered Roadsides to Estimate Sight Distance. Remote Sens. 2019, 11, 2625. [Google Scholar] [CrossRef]
- Knyaz, V.A.; Chibunichev, A.G. Photogrammetric techniques for road surface analysis. ISPRS Int. Arch. Photogramm. Remote Sens. Spat. Inf. Sci. 2016, 41, 515–520. [Google Scholar] [CrossRef]
- Romero-Chambi, E.; Villarroel-Quezada, S.; Atencio, E.; Munoz-La Rivera, F. Analysis of Optimal Flight Parameters of Unmanned Aerial Vehicles (UAVs) for Detecting Potholes in Pavements. Appl. Sci. 2020, 10, 4157. [Google Scholar] [CrossRef]
- Wefelscheid, C.; Hänsch, R.; Hellwich, O. Three-dimensional building reconstruction using images obtained by unmanned aerial vehicles. ISPRS Int. Arch. Photogramm. Remote Sens. Spat. Inf. Sci. 2011, 38, 183–188. [Google Scholar] [CrossRef]
- Qin, R.; Grün, A.; Huang, X. UAV project—Building a reality-based 3D model of the NUS (National University of Singapore) campus. In Proceedings of the 33rd Asian Conference on Remote Sensing, Pattaya, Thailand, 26–30 November 2012. [Google Scholar]
- Calì, M.; Ambu, R. Advanced 3D Photogrammetric Surface Reconstruction of Extensive Objects by UAV Camera Image Acquisition. Sensors 2018, 18, 2815. [Google Scholar] [CrossRef]
- Hein, D.; Kraft, T.; Brauchle, J.; Berger, R. Integrated UAV-Based Real-Time Mapping for Security Applications. ISPRS Int. J. Geo Inf. 2019, 8, 219. [Google Scholar] [CrossRef]
- Liu, L.; Ceylan, D.; Lin, C.; Wang, W.; Mitra, N.J. Image-Based Reconstruction of Wire Art. ACM Trans. Graph. 2017, 36, 1–11. [Google Scholar] [CrossRef]
- Hofer, M.; Wendel, A.; Bischof, H. Line-based 3D Reconstruction of Wiry Objects. In Proceedings of the 18th Computer Vision Winter Workshop, Petersburg, Russia, 16–18 July 2013; pp. 78–85. [Google Scholar]
- Bacharidis, K.; Sarri, F.; Ragia, L. 3D Building Façade Reconstruction Using Deep Learning. ISPRS Int. J. Geo Inf. 2020, 9, 322. [Google Scholar] [CrossRef]
- Martin, T.; Montes, J.; Bazin, J.C.; Popa, T. Topology-Aware Reconstruction of Thin Tubular Structures. In SIGGRAPH Asia 2014 Technical Briefs; Association for Computing Machinery: New York, NY, USA, 2014. [Google Scholar] [CrossRef]
- Huang, H.; Wu, S.; Cohen-Or, D.; Gong, M.; Zhang, H.; Li, G.; Chen, B. L1-Medial Skeleton of Point Cloud. ACM Trans. Graph. 2013, 32, 65-1–65-8. [Google Scholar] [CrossRef]
- Morioka, K.; Ohtake, Y.; Suzuki, H. Reconstruction of Wire Structures from Scanned Point Clouds. In Advances in Visual Computing; Bebis, G., Boyle, R., Parvin, B., Koracin, D., Li, B., Porikli, F., Zordan, V., Klosowski, J., Coquillart, S., Luo, X., et al., Eds.; Springer: Berlin/Heidelberg, Germany, 2013; pp. 427–436. [Google Scholar]
- Su, I.; Qin, Z.; Saraceno, T.; Krell, A.; Mühlethaler, R.; Bisshop, A.; Buehler, M.J. Imaging and analysis of a three-dimensional spider web architecture. J. R. Soc. Interface 2018, 15, 20180193. [Google Scholar] [CrossRef]
- Nooruddin, M.; Rahman, M. Improved 3D Reconstruction for Images having Moving Object using Semantic Image Segmentation and Binary Masking. In Proceedings of the 2018 4th International Conference on Electrical Engineering and Information Communication Technology (iCEEiCT), Dhaka, Bangladesh, 13–15 September 2018; pp. 32–37. [Google Scholar] [CrossRef]
- Mohammed, H.M.; El-Sheimy, N. Segmentation of image pairs for 3d reconstruction. ISPRS Int. Arch. Photogramm. Remote Sens. Spat. Inf. Sci. 2019, XLII-2/W16, 175–180. [Google Scholar] [CrossRef]
- Ketcha, M.D.; Silva, T.D.; Uneri, A.; Kleinszig, G.; Vogt, S.; Wolinsky, J.P.; Siewerdsen, J.H. Automatic masking for robust 3D-2D image registration in image-guided spine surgery. In Medical Imaging 2016: Image-Guided Procedures, Robotic Interventions, and Modeling; Webster, R.J., III, Yaniv, Z.R., Eds.; International Society for Optics and Photonics (SPIE): Bellingham, WA, USA, 2016; Volume 9786, pp. 98–104. [Google Scholar] [CrossRef]
- Kaneko, M.; Iwami, K.; Ogawa, T.; Yamasaki, T.; Aizawa, K. Mask-SLAM: Robust Feature-Based Monocular SLAM by Masking Using Semantic Segmentation. In Proceedings of the 2018 IEEE/CVF Conference on Computer Vision and Pattern Recognition Workshops (CVPRW), Salt Lake City, UT, USA, 18–22 June 2018; pp. 371–3718. [Google Scholar] [CrossRef]
- Wan, Q.; Li, Y.; Cui, H.; Feng, Z. 3D-Mask-GAN:Unsupervised Single-View 3D Object Reconstruction. In Proceedings of the 2019 6th International Conference on Behavioral, Economic and Socio-Cultural Computing (BESC), Beijing, China, 28–30 October 2019; pp. 1–6. [Google Scholar] [CrossRef]
- Girdhar, R.; Fouhey, D.F.; Rodriguez, M.; Gupta, A. Learning a Predictable and Generative Vector Representation for Objects. In Computer Vision—ECCV 2016; Leibe, B., Matas, J., Sebe, N., Welling, M., Eds.; Springer International Publishing: Cham, Switzerland, 2016; pp. 484–499. [Google Scholar]
- Shin, D.; Fowlkes, C.C.; Hoiem, D. Pixels, Voxels, and Views: A Study of Shape Representations for Single View 3D Object Shape Prediction. In Proceedings of the 2018 IEEE/CVF Conference on Computer Vision and Pattern Recognition, Salt Lake City, UT, USA, 18–22 June 2018; pp. 3061–3069. [Google Scholar] [CrossRef]
- Choy, C.B.; Xu, D.; Gwak, J.; Chen, K.; Savarese, S. 3D-R2N2: A Unified Approach for Single and Multi-view 3D Object Reconstruction. In Computer Vision—ECCV 2016; Leibe, B., Matas, J., Sebe, N., Welling, M., Eds.; Springer International Publishing: Cham, Switzerland, 2016; pp. 628–644. [Google Scholar] [CrossRef]
- Xie, H.; Yao, H.; Sun, X.; Zhou, S.; Zhang, S. Pix2Vox: Context-Aware 3D Reconstruction From Single and Multi-View Images. In Proceedings of the IEEE International Conference on Computer Vision (ICCV), Seoul, Korea, 27 October–2 November 2019; pp. 2690–2698. [Google Scholar] [CrossRef]
- Shin, D.; Ren, Z.; Sudderth, E.B.; Fowlkes, C.C. 3D Scene Reconstruction With Multi-Layer Depth and Epipolar Transformers. In Proceedings of the IEEE International Conference on Computer Vision (ICCV), Seoul, Korea, 27 October–2 November 2019; pp. 2172–2182. [Google Scholar] [CrossRef]
- Knyaz, V.A.; Kniaz, V.V.; Remondino, F. Image-to-Voxel Model Translation with Conditional Adversarial Networks. In Computer Vision—ECCV 2018; Springer: Cham, Switzerland, 2018; pp. 601–618. [Google Scholar] [CrossRef]
- Kniaz, V.V.; Remondino, F.; Knyaz, V.A. Generative adversarial networks for single photo 3D reconstruction. ISPRS Int. Arch. Photogramm. Remote Sens. Spat. Inf. Sci. 2019, XLII-2/W9, 403–408. [Google Scholar] [CrossRef]
- Yi, K.M.; Trulls, E.; Lepetit, V.; Fua, P. LIFT: Learned Invariant Feature Transform. In Computer Vision—ECCV 2018; Springer: Cham, Switzerland, 2018; pp. 467–483. [Google Scholar] [CrossRef]
- Ono, Y.; Trulls, E.; Fua, P.; Yi, K.M. LF-Net: Learning Local Features from Images. In Proceedings of the Annual Conference on Neural Information Processing Systems 2018, NeurIPS 2018, Montréal, QC, Canada, 3–8 December 2018; pp. 6237–6247. [Google Scholar]
- Christiansen, P.H.; Kragh, M.F.; Brodskiy, Y.; Karstoft, H. UnsuperPoint: End-to-end Unsupervised Interest Point Detector and Descriptor. arXiv 2019, arXiv:1907.04011. [Google Scholar]
- Shen, X.; Wang, C.; Li, X.; Yu, Z.; Li, J.; Wen, C.; Cheng, M.; He, Z. RF-Net: An End-to-End Image Matching Network based on Receptive Field. arXiv 2019, arXiv:1906.00604. [Google Scholar]
- Kniaz, V.V.; Mizginov, V.; Grodzitsky, L.; Bordodymov, A. GANcoder: Robust feature point matching using conditional adversarial auto-encoder. In Optics, Photonics and Digital Technologies for Imaging Applications VI; Schelkens, P., Kozacki, T., Eds.; International Society for Optics and Photonics (SPIE): Bellingham, WA, USA, 2020; Volume 11353, pp. 59–68. [Google Scholar] [CrossRef]
- Ronneberger, O.; Fischer, P.; Brox, T. U-net: Convolutional networks for biomedical image segmentation. In Proceedings of the International Conference on Medical image computing and Computer-Assisted Intervention, Shenzhen, China, 13–17 October 2019; Springer: Berlin/Heidelberg, Germany, 2015; pp. 234–241. [Google Scholar]
- Sandler, M.; Howard, A.G.; Zhu, M.; Zhmoginov, A.; Chen, L. MobileNetV2: Inverted Residuals and Linear Bottlenecks. In Proceedings of the 2018 IEEE Conference on Computer Vision and Pattern Recognition, CVPR 2018, Salt Lake City, UT, USA, 18–22 June 2018; pp. 4510–4520. [Google Scholar] [CrossRef]
- Minaee, S.; Boykov, Y.; Porikli, F.M.; Plaza, A.J.; Kehtarnavaz, N.; Terzopoulos, D. Image Segmentation Using Deep Learning: A Survey. arXiv 2020, arXiv:2001.05566. [Google Scholar]
- Kniaz, V.V. Conditional GANs for semantic segmentation of multispectral satellite images. In Image and Signal Processing for Remote Sensing XXIV; Bruzzone, L., Bovolo, F., Eds.; International Society for Optics and Photonics (SPIE): Bellingham, WA, USA, 2018; Volume 10789, pp. 259–267. [Google Scholar] [CrossRef]
- Kniaz, V.V. Deep learning for dense labeling of hydrographic regions in very high resolution imagery. In Image and Signal Processing for Remote Sensing XXV; Bruzzone, L., Bovolo, F., Eds.; International Society for Optics and Photonics (SPIE): Bellingham, WA, USA, 2019; Volume 11155, pp. 283–292. [Google Scholar] [CrossRef]
- Shelhamer, E.; Long, J.; Darrell, T. Fully Convolutional Networks for Semantic Segmentation. arXiv 2016, arXiv:1605.06211. [Google Scholar] [CrossRef]
- Christiansen, P.; Nielsen, L.N.; Steen, K.A.; Jørgensen, R.N.; Karstoft, H. DeepAnomaly: Combining Background Subtraction and Deep Learning for Detecting Obstacles and Anomalies in an Agricultural Field. Sensors 2016, 16, 1904. [Google Scholar] [CrossRef]
- Huang, P.; Matzen, K.; Kopf, J.; Ahuja, N.; Huang, J. DeepMVS: Learning Multi-view Stereopsis. In Proceedings of the 2018 IEEE/CVF Conference on Computer Vision and Pattern Recognition, Salt Lake City, UT, USA, 18–22 June 2018; pp. 2821–2830. [Google Scholar]
- Kuhn, A.; Sormann, C.; Rossi, M.; Erdler, O.; Fraundorfer, F. DeepC-MVS: Deep Confidence Prediction for Multi-View Stereo Reconstruction. arXiv 2019, arXiv:1912.00439. [Google Scholar]
- Stathopoulou, E.K.; Remondino, F. Multi-view stereo with semantic priors. ISPRS Int. Arch. Photogramm. Remote Sens. Spat. Inf. Sci. 2019, XLII-2/W15, 1135–1140. [Google Scholar] [CrossRef]
- Wei, Z.; Wang, Y.; Yi, H.; Chen, Y.; Wang, G. Semantic 3D Reconstruction with Learning MVS and 2D Segmentation of Aerial Images. Appl. Sci. 2020, 10, 1275. [Google Scholar] [CrossRef]
- De Nunzio, G. A software tool for the semi-automatic segmentation of architectural 3D models with semantic annotation and Web fruition. ACTA IMEKO 2018, 7, 64–72. [Google Scholar] [CrossRef]
- Stathopoulou, E.K.; Remondino, F. Multi view stereo with semantic priors. arXiv 2020, arXiv:2007.02295. [Google Scholar] [CrossRef]
- Roberts, R.; Sinha, S.N.; Szeliski, R.; Steedly, D. Structure from motion for scenes with large duplicate structures. In CVPR 2011; IEEE: Piscataway, NJ, USA, 2011; pp. 3137–3144. [Google Scholar]
- Jiang, N.; Tan, P.; Cheong, L.F. Seeing double without confusion: Structure-from-motion in highly ambiguous scenes. In Proceedings of the 2012 IEEE Conference on Computer Vision and Pattern Recognition, Providence, RI, USA, 6–21 June 2012; IEEE: Piscataway, NJ, USA, 2012; pp. 1458–1465. [Google Scholar]
- Goodfellow, I.J.; Pouget-Abadie, J.; Mirza, M.; Xu, B.; Warde-Farley, D.; Ozair, S.; Courville, A.C.; Bengio, Y. Generative Adversarial Nets. In Proceedings of the Annual Conference on Neural Information Processing Systems, Montreal, QC, Canada, 8–13 December 2014; pp. 2672–2680. [Google Scholar]
- Isola, P.; Zhu, J.; Zhou, T.; Efros, A.A. Image-to-Image Translation with Conditional Adversarial Networks. In Proceedings of the 2017 IEEE Conference on Computer Vision and Pattern Recognition, CVPR 2017, Honolulu, HI, USA, 21–26 July 2017; pp. 5967–5976. [Google Scholar] [CrossRef]
- Luc, P.; Couprie, C.; Chintala, S.; Verbeek, J. Semantic Segmentation using Adversarial Networks. arXiv 2016, arXiv:1611.08408. [Google Scholar]
- Xiao, T.; Liu, Y.; Zhou, B.; Jiang, Y.; Sun, J. Unified Perceptual Parsing for Scene Understanding. In Computer Vision—ECCV 2018; Springer: Cham, Switzerland, 2018; pp. 432–448. [Google Scholar] [CrossRef]
- Sun, K.; Zhao, Y.; Jiang, B.; Cheng, T.; Xiao, B.; Liu, D.; Mu, Y.; Wang, X.; Liu, W.; Wang, J. High-Resolution Representations for Labeling Pixels and Regions. arXiv 2019, arXiv:1904.04514. [Google Scholar]
- Kniaz, V.V.; Zheltov, S.Y.; Remondino, F.; Knyaz, V.A.; Bordodymov, A.; Gruen, A. Wire structure image-based 3D reconstruction aided by deep learning. ISPRS Int. Arch. Photogramm. Remote Sens. Spat. Inf. Sci. 2020, 43, 435–441. [Google Scholar] [CrossRef]
- Zhang, H.; Xu, T.; Li, H.; Zhang, S.; Wang, X.; Huang, X.; Metaxas, D.N. StackGAN++: Realistic Image Synthesis with Stacked Generative Adversarial Networks. IEEE Trans. Pattern Anal. Mach. Intell. 2019, 41, 1947–1962. [Google Scholar] [CrossRef] [PubMed]
- Paszke, A.; Gross, S.; Massa, F.; Lerer, A.; Bradbury, J.; Chanan, G.; Killeen, T.; Lin, Z.; Gimelshein, N.; Antiga, L.; et al. PyTorch: An Imperative Style, High-Performance Deep Learning Library. In Proceedings of the Annual Conference on Neural Information Processing Systems 2019, NeurIPS 2019, Montréal, QC, Canada, 3 December 2019. [Google Scholar]
- Schönberger, J.L.; Zheng, E.; Frahm, J.M.; Pollefeys, M. Pixelwise View Selection for Unstructured Multi-View Stereo. In Computer Vision—ECCV 2016; Leibe, B., Matas, J., Sebe, N., Welling, M., Eds.; Springer International Publishing: Cham, Switzerland, 2016; pp. 501–518. [Google Scholar] [CrossRef]
- Schönberger, J.L.; Frahm, J. Structure-from-Motion Revisited. In Proceedings of the 2016 IEEE Conference on Computer Vision and Pattern Recognition (CVPR), Las Vegas, NV, USA, 27–30 June 2016; pp. 4104–4113. [Google Scholar] [CrossRef]
- Wu, B.; Zhou, Y.; Qian, Y.; Gong, M.; Huang, H. Full 3D reconstruction of transparent objects. ACM Trans. Graph. 2018, 37, 103:1–103:11. [Google Scholar] [CrossRef]
- Bianco, S.; Ciocca, G.; Marelli, D. Evaluating the Performance of Structure from Motion Pipelines. J. Imaging 2018, 4, 98. [Google Scholar] [CrossRef]
- Atcheson, B.; Ihrke, I.; Heidrich, W.; Tevs, A.; Bradley, D.; Magnor, M.A.; Seidel, H. Time-resolved 3d capture of non-stationary gas flows. ACM Trans. Graph. 2008, 27, 132. [Google Scholar] [CrossRef]
- Ji, Y.; Ye, J.; Yu, J. Reconstructing Gas Flows Using Light-Path Approximation. In Proceedings of the 2013 IEEE Conference on Computer Vision and Pattern Recognition, Portland, OR, USA, 23–28 June 2013; pp. 2507–2514. [Google Scholar] [CrossRef]
- Ihrke, I.; Magnor, M.A. Image-based tomographic reconstruction of flames. In ACM SIGGRAPH 2004 Sketches (SIGGRAPH’04); Association for Computing Machinery: New York, NY, USA, 2004. [Google Scholar] [CrossRef]
- Wu, Z.; Zhou, Z.; Tian, D.; Wu, W. Reconstruction of three-dimensional flame with color temperature. Vis. Comput. 2015, 31, 613–625. [Google Scholar] [CrossRef]
- Hofer, M.; Maurer, M.; Bischof, H. Efficient 3D scene abstraction using line segments. Comput. Vis. Image Underst. 2017, 157, 167–178. [Google Scholar] [CrossRef]
© 2020 by the authors. Licensee MDPI, Basel, Switzerland. This article is an open access article distributed under the terms and conditions of the Creative Commons Attribution (CC BY) license (http://creativecommons.org/licenses/by/4.0/).