Abstract
Due to a limited number of monitoring stations in Western Africa, the impact of mineral dust on PM10 surface concentrations is still poorly known. We propose a new method to retrieve PM10 dust surface concentrations from sun photometer aerosol optical depth (AOD) and CALIPSO/CALIOP Level 2 aerosol layer products. The method is based on a multi linear regression model that is trained using co-located PM10, AERONET and CALIOP observations at 3 different locations in the Sahel. In addition to the sun photometer AOD, the regression model uses the CALIOP-derived base and top altitude of the lowermost dust layer, its AOD, the columnar total and columnar dust AOD. Due to the low revisit period of the CALIPSO satellite, the monthly mean annual cycles of the parameters are used as predictor variables rather than instantaneous observations. The regression model improves the correlation coefficient between monthly mean PM10 and AOD from 0.15 (AERONET AOD only) to 0.75 (AERONET AOD and CALIOP parameters). The respective high and low PM10 concentration during the winter dry season and summer season are well produced. Days with surface PM10 above 100 μg/m3 are better identified when using the CALIOP parameters in the multi linear regression model. The number of true positives (actual and predicted concentrations above the threshold) is increased and leads to an improvement in the classification sensitivity (recall) by a factor 1.8. Our methodology can be extrapolated to the whole Sahel area provided that satellite derived AOD maps are used in order to create a new dataset on population exposure to dust events in this area.
1. Introduction
Aeolian mineral dust is a major component of the aerosol load in the atmosphere of our planet. Dust influences the Earth’s radiative budget and therefore the climate system [1] or weather forecasting [2,3]. Desert dust is transported over thousands of kilometers and reaches environments far from emission areas. Northern Africa is the largest source of suspended mineral dust in the world with emission of 400 to 2200 Tgr/yr [4]. During Summer, the dust is transported over long distances covering the Tropical Atlantic Ocean and the Mediterranean sea [5,6,7,8]. During the dry season from October to April, the Sahel is under the influence of the northeasterly Harmattan wind [9] bringing dust to populated areas of western Africa. On one hand dust deposition provides a significant input of nutriments for marine and terrestrial ecosystems [10,11,12]. On the other hand, dust impacts the wellness and health of human beings because of its respirable fraction [13]. Among adverse health effects, dust events are suspected to play a role in the meningitis outbreaks occurring in the so-called “Meningitis belt” in Northern Africa [14] during the dry season [15,16,17,18]. However the scarcity of in situ observations of dust surface concentrations in Northern Africa is a limitating factor for a better assessment of the dust impact on health.
Satellite remote sensing offers a relevant alternative to ground stations for the purpose of dust atmospheric concentration monitoring [19]. The aerosol optical depth (AOD) has been widely used to infer the particulate matter surface concentration [20,21,22]. Deroubaix et al. [23] have shown that the OMI aerosol index is suitable to reflect the dust surface concentration in the Sahel during the core of the dry season (January to March). However [24] have underlined that columnar AOD as a proxy for dust surface concentration is one of the limiting factor in their epidemiological studies on meningetis in Burkina Faso. Indeed, AOD is a columnar integrated aerosol optical property and its relationship with surface dust concentration depends on several parameters including the vertical distribution of the dust in atmosphere. The altitude and depth of the dust layer in Northern Africa has a seasonal variation. During the Harmattan weather regime dust is advected close to the surface while during the pre-monsson and monsoon period the dust can be uplifted to higher altitude due to convective activity. This results in a seasonal cycle in the altitude of the dust transport [25,26], which has an impact on the relationship between the aerosol optical depth and the dust concentration at the surface [27].
Lidar (light detection and ranging) technology can provide the vertical distribution of the dust in the atmosphere. The spaceborne lidar CALIOP (Cloud-Aerosol LIdar with Orthogonal Polarization) aboard the CALIPSO (Cloud Aerosol Lidar and Infrared Pathfinder Satellite Observations) mission [28] launched in April 2006 provides an unprecedented set of observations on the aerosol and cloud vertical distributions from the surface layer to the top of the atmosphere. The accuracy of the top altitude of the layers derived from CALIOP has been estimated within ±0.1 km [29,30]. The scene classification algorithm [31] enables the identification of the mineral dust layers among the different scattering structure of the atmosphere. This capacity has been largely used to analyze the altitude of the transport of dust at the global scale [28,32,33]. The CALIOP dust products have also been used to analyze dust activity in the vicinity of source areas. Todd and Cavazos-Guerra [34] were able to derive a map of the summertime dust emissions in the Sahara from the CALIOP aerosol products.
The objective of the study is to improve the prediction of PM10 surface concentrations from AODs in the Sahel region by using CALIOP lidar aerosol products. The hypothesis is that the characteristics of the lowest dust layer detected by the lidar can be used to constrain the retrieval of dust surface concentrations from AODs.
2. Data and Method
2.1. Data
The International Network to study Deposition and Atmospheric composition in Africa (INDAAF) is a programme dedicated to the long-term monitoring of the atmospheric composition and atmospheric deposition fluxes in Africa. Surface PM10 concentrations are measured at specific locations over a Sahelian transect (Figure 1), in Niger (station named Banizoumbou, 2.66°E, 13.54°N), in Mali (Cinzana, 5.93°W, 13.28°N) and in Senegal (MBour, 16.95°W, 14.39°N). PM10 are measured using a Tapered Element Oscillating Microbalance (TEOM 1400A from Thermo Scientific) with a time resolution of 5 min [35,36]. The description of the stations and the database is given by Marticorena et al. [35]. PM10 observations are available with an hourly resolution. Daily PM10 are computed over 24 h by averaring hourly PM10 observations. Spurious variations in the daily PM10 are filtered out by site. Outliers are defined as outside 1.5 times the interquartile range of the log-transform distribution. It results in a 2% reduction in the daily PM10.
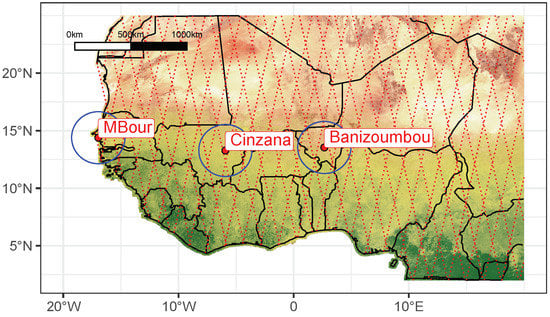
Figure 1.
AERONET and PM10 monitoring stations in the Sahel and (blue circle) 250 km range around the stations. (dotted lines) CALIPSO/CALIOP ground tracks. Coloring of the background map based on land cover (see http://www.naturalearthdata.com/).
The stations in Mali, Senegal and Niger are also equipped with an automatic sun photometer belonging to the Aerosol Robotic Network (AERONET). The sun photometers measure the direct sun irradiance and the sky brightness in spectral channels at 440, 675, 870 and 1020 nm [37,38]. The total aerosol optical depth (AOD) is retrieved from direct sun measurements according to the Beer-Lambert’s law. We use in this study the daily level 2.0 AOD delivered by the version 3 of the direct sun algorithm. The daily AOD is interpolated at a reference wavelength of 550 nm from the AOD at 440 and 675 nm and following the Angström law.
CALIPSO was launched in April 2006. The CALIOP lidar records atmospheric attenuated backscattering profiles at 532 and 1064 nm with an along-track resolution of 335 m [39] during day and night. The depolarization of the return laser beam is measured at 532 nm. The sampling vertical resolution of CALIOP is 30 m in the lower part of the profile from the surface to 8.2 km above mean sea level, and 60 m between 8.2 and 20.2 km [28]. CALIPSO has a sun-synchronous orbit of 99 min and repeat the same ground track every 16 days. The laser beam diameter at the Earth’s surface is 70 m. We use in this study the level 2 Aerosol layer products (namely 05kmALay) from 2006 to 2014 [40]. Version 3.01 is used from June 2006 to October 2011, version 3.02 from November 2011 to February 2013 and version 3.30 from March 2013 to December 2014. CALIOP level 2 algorithm consists in three major steps [41]. The first one is the detection of atmospheric scattering layers [31], followed by the classification of the scene [42] and the retrieval of the extinction coefficient [43]. The level 2 aerosol layer product slices the atmosphere in up to 8 layers. The bottom and top altitude (see Vaughan et al. [31], and references therein) as well as the aerosol type and the AOD is provided for each layer.
The maximum acceptable distance between the station and the lidar track is set to 250 km. Only the tracks over land are selected around the station of M’Bour to avoid sampling the Saharan air layer [26,44]. The 250 km distance allows to have a average number of 5.5 profiles per months. A threshold on the cloud-aerosol discrimination (CAD) was set to −20 for selecting only high confidence aerosol profiles. We have retained only the profiles for which the quality criteria on extinction retrieval (namely “ExtinctionQC_532” parameter) indicates that the lidar ratio was unchanged or constrained during the retrieval. The total column AOD, the layer AOD, the top and the bottom altitude of the first detected layer starting from the ground level, which is identified as “DUST” in the feature mask are extracted. The base altitude of optically thick aerosol layer can be biased toward higher altitude due to the attenuation of the laser beam within the layer. This artifact was corrected in the version 3 of the algorithm by extending the base altitude of the layer to 90 m above mean sea level.
2.2. Method
We have made the hypothesis that the relationship between the PM10 surface concentration and the AOD is linear but influenced by the seasonal variability in the altitude of the lowermost dust layer and its AOD. In the following analysis we test a multilinear regression model on the monthly and daily PM10 and AERONET AOD. We introduce the seasonal variability by using the monthly mean annual cycle of AERONET AOD and CALIOP parametes. In addition to the lowermost layer properties (top and bottom altitude and AOD) we also use the CALIOP columnar total AOD and columnar dust AOD. The columnar dust AOD differs from the lowermost dust layer AOD as it includes all the possible dust layers. In case of only one layer, both quantities are equal.
Log-transform variables are used in the model and averages are computed using the geometrical mean. Because of the low number of observations per months (less than 6 on average) the monthly mean annual cycle is computed from the daily observations for each site. The dependent variable [PM10] represents the monthly mean PM10 concentration measured at each stations The predictor variables include the logarithm of the monthly mean AERONET [AOD] at each station, and the logarithm of the monthly mean annual cycle of AERONET AOD (), CALIOP-derived top () and bottom () altitude of the lowermost dust layer, AOD of the lowermost dust layer (), columnar total () and dust AOD (). is the intercept, are the regression coefficients and is the error term.
We have applied a backward elimination based on Akaike Information Criteria [45] on the predictor variables in Equation (1) in order to select the best performance of the model. Equation (1) is applied to all data rather than for each station independently. Using the monthly mean [PM10] and [AOD] gives a total number of 280 observations that are used for training the model. The same equation is used for the daily observations, replacing [PM10] and [AOD] by daily values and keeping the monthly mean annual cycle () unchanged. Collocated daily PM10 and daily AERONET observations gives a dataset of 6509 measurements. CALIOP daily observations can also be introduced in Equation (1) as independent variables (i.e., [] in a similar way as [AOD]). However the dataset is reduced to 1335 measurements when considering a collocation with daily CALIOP observations. The impact of collocated instantaneous CALIOP parameters is discussed in the section below.
3. Results and Discussion
3.1. PM10 and AOD Time Series
The timeseries span between January 2007 to December 2017. A total of 8983 daily PM10 observations and 7911 AERONET AOD were collected. The daily time series and monthly averages of PM10 and AERONET AOD are displayed on Figure 2. Maxima in daily concentrations are observed at Banizoumbou (1250 μg/m3), followed by Cinzana (707 μg/m3) and M’Bour (390 μg/m3). However higher concentrations can be observed in Cinzana and Banizoumbou, the mean daily PM10 (geometric mean) is higher in M’Bour (73 μg/m3) than in Banizoumbou (66 μg/m3) and Cinzana (49 μg/m3). The monthly average time series (black solid lines in Figure 2) highlights the seasonal variability in the concentrations. The mean concentrations are the highest during the winter dry season that starts in November and ends in March.
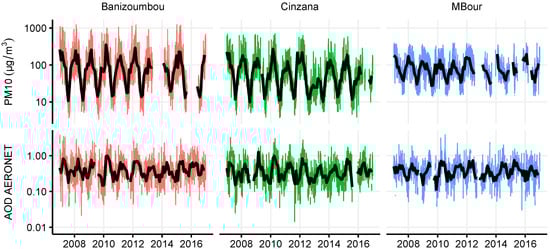
Figure 2.
Daily PM10 (top) concentrations and AERONET AOD at 550 nm (bottom) observed at Banizoumbou, Cinzana and M’Bour between 2007 and 2017. Black solid line are the monthly averages.
The daily AOD at 550 nm (no unit) ranges between 0.01 and 3.83 and follows a rather similar pattern as the PM10 but with a weaker amplitude. The mean AOD are similar for the 3 sites: 0.39 in Banizoumbou, 0.35 in M’Bour and in Cinzana. Monthly averages are computed for months with at least 10 daily observations leading to 280 monthly PM10 and AOD data. The monthly mean PM10 and AOD ranges between 10 and 350 μg/m3 and 0.11 and 1.26, respectively. The two stations farther inland (Banizoumbou and Cinzana) have a larger range in monthly mean PM10 than the coastal station (M’Bour). M’Bour is located downwind the dust sources and can be viewed as a receptor area for dust outbreaks coming from the Sahara [46]. So the baseline PM10 concentration in M’Bour remains at an upper level than for the stations located upwind. Local sources of sea salts or anthropogenic aerosols may also contribute to the surface concentrations but marginaly. The anthropogenic fraction in PM10 is about 11% [47] and relative abundance of dust in the coarse fraction at M’Bour is >80% [46]. The similar monthly patterns in AOD and PM10 between the 3 stations indicates that large scale transport of dust is the main driver of the variability and that a regional model linking AOD to PM10 may applied.
3.2. Predictor Variables
Predictor variables are presented in Figure 3. The PM10 monthly mean annual cycle is also diplayed in Figure 3. From January to March, PM10 concentrations are at a highest (200 μg/m3, all station average), while the AERONET AOD () is increasing from its minimal value (in December–January) to its maximum value in May. All the different AOD components (, , , and ) follows the same annual cycle with slight differences in amplitude. and have almost the same annual cycle thus indicating that dust is the dominant component in the atmospheric column, which is expected in the Sahel. The top () and bottom () altitudes of the layer present a bell shape with a maximum at about 4 km in June–July. The shift of the dust layer toward higher altitudes is associated with an increase in the AOD in the first half of the year and a decrease in the PM10 concentrations. In the second half of the year the AODs remain rather constant while the PM10 are increasing as the altitude of the dust layer is shifting toward lower altitude. There is a E-W gradient (between Banizoumbou and M’Bour) in the top altitude of the dust layer indicating that the dust layer sinks at it moves eastward.
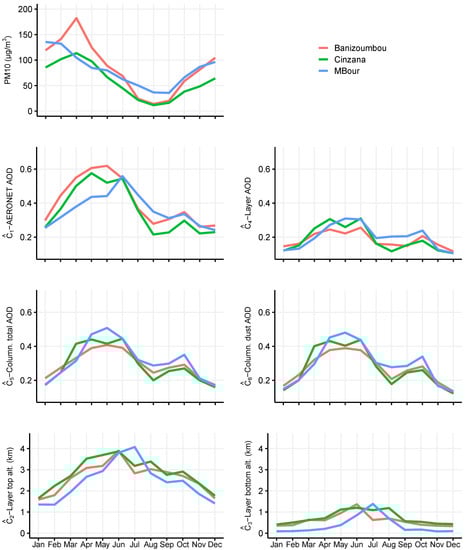
Figure 3.
Monthtly mean annual cycle of PM10, () AERONET AOD and () CALIOP columnar total and () columnar dust AOD, () top and () bottom altitude and () AOD of the lowermost dust layer.
The AOD components(, , , and ) are correlated and introduce multicollinearity in the regression, i.e., predictors are partially redundant with each other. Multicollinearity doesn’t affect the model performance but it affects the calculation regarding individual predictors. The multicollinearity is addressed by using the variance inflation factor (VIF) [48]. A VIF above 5 indicates a multicollinearity problem.
The backward elimination applied on Equation (1) including all the predictors removes the variable (columnar total AOD) from the model. VIF indicates that , , and introduce multicollinearity in the model. When removing those predictors, is discarded by the backward elimination. The predictor coefficients are presented in Table 1 for 3 cases: all set of predictors (AOD+CALIOP all), no collinearity (AOD+CALIOP alt) and AERONET AOD only. The coefficients given for (AOD+CALIOP all), although significant, must be taken with caution because of multicollinearity. However the model performance is still increased when using and .

Table 1.
Summary table of the multilinear regression parameters on the monthly variables (number of data = 280).
The introduction of CALIOP parameters improves significantly the prediction of monthly mean PM10 from AOD (Figure 4). All the parameters are significant. The adjusted is increased from 0.15 to 0.75 and the residual standard error is reduced by almost a factor of 2. The negative coefficients on the altitude of the layer ( and ) shows that the shift of the dust layer toward upper altitude during summer period decreases the surface concentrations. The relationship to surface concentrations is positive and negative for and , respectively. This indicates that the fraction of AOD within the dust layer is a good indicator and that finally the influence of the seasonal variability in the altitude and load of the dust layer on surface concentrations can so be approximated by the proportion of AOD with the dust layer divided by its altitude.
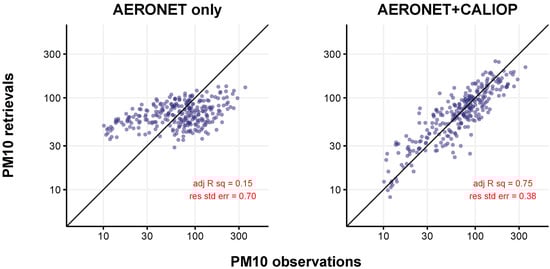
Figure 4.
Scatter plot of measured and predicted monthly PM10 in μg/m3 considering (left) AERONET AOD only and (right) AERONET AOD and CALIOP parameters. Number of points N = 280, ajd R sq is the adjusted coefficient of determination, and res std err is the residual standard error.
3.3. Application to Daily Observations
Figure 5 presents the scatter plot of the daily data for both the regression based on AERONET AOD only and AERONET AOD and the additional predictors from CALIOP. The number of data is drastically reduced when considering collocation of daily CALIOP observations with AERONET and PM10 observations (a factor of 5 between both dataset). Morever the performance of the model is moderately improved (e.g., increased by 8%). CALIPSO has 2 overpasses per day (day and night) at fix time. The weak impact of collocated daily CALIOP observations could be explained by the lack of representativity of the instantaneous daily lidar soundings in the very limited area of the CALIOP track.
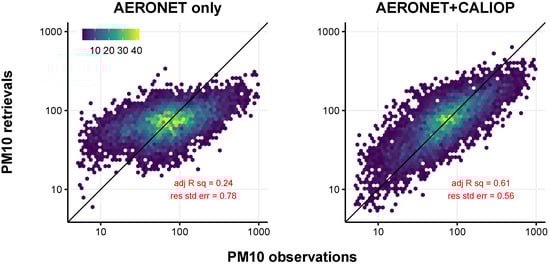
Figure 5.
Scatter plot of measured and predicted daily PM10 in μg/m3 considering (left) AERONET AOD only and (right) AERONET AOD and CALIOP parameters. Number of points N = 6509, ajd R sq is the adjusted coefficient of determination, and res std err is the residual standard error.
The prediction of daily observations is improved by using the monthly mean annual cyle of the CALIOP parameters. The adjusted correlation coefficient increases from = 0.24 to = 0.61 and the residual standard error is reduced by a factor of 1.4. However the dispersion of the data remains large. The root mean square error is reduced from 104 to 83 μg/m3 and the mean absolute percentage error from 80 to 50%. There are little difference from one station to the other. The RMSE gain is 26%, 22% and 12% for M’Bour, Banizoumbou and Cinzana, respectively.
The ability of the multi linear regression model to improve the detection of daily high dust events from AODs is evaluated by using a threshold on both actual and predicted PM10 concentrations. The threshold is fixed at 100 μg/m3 corresponding to unhealthy conditions. True positive corresponds to actual and predicted over the threshold while true negative corresponds to actual and predicted below the threshold.
The number of days classified as true positive is a factor of 2 higher for the AERONET+CALIOP model compared to the AERONET only model, in agreement with its ability to predict higher concentrations. The total predicted number of days exceeding 100 μg/m3 is 2039 with a precision (true positive divided by true positive and false positive) of 0.71. The recall of the model (true positive divided by the number of true positive and false negative) is increased from 0.37 to 0.68 (a factor 1.8) indicating the improvement in the classification of large AOD that are associated to actual PM10 events.
4. Conclusions
The CALIOP layer aerosol layer products have been used to improve the statistical relationship between AOD and surface PM10 at three stations located in the Sahel over a period of 10 years. However there is not a direct model to predict the surface concentration from the satellite observations, it is shown that the monthly mean annual cycles of the altitude and AOD of the lowermost detected dust layer are good predictors for surface concentrations in conjunction with co-located AOD observations. The decorrelation between surface PM10 concentrations and AODs during the summer period can be attributed to the uplift of the dust layer. A linear regression model that accounts for the seasonal variability in the vertical shift of the dust layer improves the estimation of surface concentrations on a monthly and daily basis. Due to the low revisit time of the CALIOP lidar, introducing the daily CALIOP products have a limited impact on the regression analysis. The prediction of the days with unhealthy PM10 concentrations from satellite data remains challenging however it is improved by using the CALIOP layer parameters whatever the location. The lowest performance for such prediction is observed in M’Bour, that is possibly influenced by either marine atmosphere or anthropogenic emissions.
The proposed methodology can be applied to the whole Sahel area provided that passive imager derived AODs (e.g., MODIS) and CALIOP predictor variables are averaged on a regular geographical grid. In this paper the impact of biased or inaccurate AODs have been limited by the use of AERONET AODs but a further spatial extension would require an extensive validation of satellite AODs over the targeted area.
Author Contributions
Conceptualization, methodology and original draft preparation, J.-F.L.; Funding acquisition, writing—review and editing, N.M.; data preparation, S.M. All authors have read and agreed to the published version of the manuscript.
Funding
This work was conducted in the frame of the TELEDM research project leaded by Biogeosciences and funded by the Centre National d’Etudes Spatiales (CNES).
Acknowledgments
The authors greatly thanks the INDAAF (International Network to study Deposition and Atmospheric chemistry in AFrica) program and the AERONET (Aerosol Robotic Network) for mainting the observatories in Africa and providing the PM10 and aerosol optical depth, respectively.
Conflicts of Interest
The authors declare no conflict of interest.
References
- Myhre, G.; Shindell, D.; Bréon, F.M.; Collins, W.; Fuglestvedt, J.; Huang, J.; Koch, D.; Lamarque, J.F.; Lee, D.; Mendoza, B.; et al. Anthropogenic and Natural Radiative Forcing. In Climate Change 2013: The Physical Science Basis. Contribution of Working Group I to the Fifth Assessment Report of the Intergovernmental Panel on Climate Change and Natural Radiative Forcing; Stocker, T.F., Qin, D., Plattner, G.-K., Tignor, M., Allen, S.K., Boschung, J., Nauels, A., Xia, Y., Bex, V., Midgley, P.M., Eds.; Cambridge University Press: Cambridge, UK, 2013. [Google Scholar]
- Tompkins, A.M.; Cardinali, C.; Morcrette, J.J.; Rodwell, M. Influence of aerosol climatology on forecasts of the African Easterly Jet. Geophys. Res. Lett. 2005, 32, L10801. [Google Scholar] [CrossRef]
- Chaboureau, J.P.; Richard, E.; Pinty, J.P.; Flamant, C.; Di Girolamo, P.; Kiemle, C.; Behrendt, A.; Chepfer, H.; Chiriaco, M.; Wulfmeyer, V. Long-range transport of Saharan dust and its radiative impact on precipitation forecast: A case study during the Convective and Orographically-induced Precipitation Study (COPS). Q. J. R. Meteorol. Soc. 2011, 137, 236–251. [Google Scholar] [CrossRef]
- Huneeus, N.; Schulz, M.; Balkanski, Y.; Griesfeller, J.; Prospero, J.; Kinne, S.; Bauer, S.; Boucher, O.; Chin, M.; Dentener, F.; et al. Global dust model intercomparison in AeroCom phase I. Atmos. Chem. Phys. 2011, 11, 7781–7816. [Google Scholar] [CrossRef]
- Perry, K.D.; Cahill, T.A.; Eldred, R.A.; Dutcher, D.D.; Gill, T.E. Long-range transport of North African dust to the eastern United States. J. Geophys. Res. Atmos. 1997, 102, 11225–11238. [Google Scholar] [CrossRef]
- Moulin, C.; Guillard, F.; Dulac, F.; Lambert, C.E. Long-term daily monitoring of Saharan dust load over ocean using Meteosat ISCCP-B2 data: 1. Methodology and preliminary results for 1983–1994 in the Mediterranean. J. Geophys. Res. Atmos. 1997, 102, 16947–16958. [Google Scholar] [CrossRef]
- Chiapello, I. Understanding the long-term variability of African dust transport across the Atlantic as recorded in both Barbados surface concentrations and large-scale Total Ozone Mapping Spectrometer (TOMS) optical thickness. J. Geophys. Res. 2005, 110. [Google Scholar] [CrossRef]
- Prospero, J.M.; Collard, F.X.; Molinié, J.; Jeannot, A. Characterizing the annual cycle of African dust transport to the Caribbean Basin and South America and its impact on the environment and air quality: African dust transport to South America. Glob. Biogeochem. Cycles 2014, 28, 757–773. [Google Scholar] [CrossRef]
- Middleton, N.J.; Goudie, A.S. Saharan dust: Sources and trajectories. Trans. Inst. Br. Geogr. 2001, 26, 165–181. [Google Scholar] [CrossRef]
- Okin, G.S.; Mahowald, N.; Chadwick, O.A.; Artaxo, P. Impact of desert dust on the biogeochemistry of phosphorus in terrestrial ecosystems. Glob. Biogeochem. Cycles 2004, 18, GB2005. [Google Scholar] [CrossRef]
- Jickells, T.D.; An, Z.S.; Andersen, K.K.; Baker, A.R.; Bergametti, G.; Brooks, N.; Cao, J.J.; Boyd, P.W.; Duce, R.A.; Hunter, K.A.; et al. Global Iron Connections Between Desert Dust, Ocean Biogeochemistry, and Climate. Science 2005, 308, 67–71. [Google Scholar] [CrossRef]
- Bristow, C.S.; Hudson-Edwards, K.A.; Chappell, A. Fertilizing the Amazon and equatorial Atlantic with West African dust. Geophys. Res. Lett. 2010, 37, L14807. [Google Scholar] [CrossRef]
- Goudie, A.S. Desert dust and human health disorders. Environ. Int. 2014, 63, 101–113. [Google Scholar] [CrossRef] [PubMed]
- Lapeyssonnie, L. La méningite cérébro-spinale en Afrique. Bull. World Health Org. 1963, 28, 3–114. [Google Scholar]
- Yaka, P.; Sultan, B.; Broutin, H.; Janicot, S.; Philippon, S.; Fourquet, N. Relationships between climate and year-to-year variability in meningitis outbreaks: A case study in Burkina Faso and Niger. Int. J. Health Geogr. 2008, 7, 34. [Google Scholar] [CrossRef]
- Agier, L.; Deroubaix, A.; Martiny, N.; Yaka, P.; Djibo, A.; Broutin, H. Seasonality of meningitis in Africa and climate forcing: Aerosols stand out. J. R. Soc. Interface 2012, 10, 20120814. [Google Scholar] [CrossRef]
- Martiny, N.; Chiapello, I. Assessments for the impact of mineral dust on the meningitis incidence in West Africa. Atmos. Environ. 2013, 70, 245–253. [Google Scholar] [CrossRef]
- García-Pando, C.P.; Stanton, M.C.; Diggle, P.J.; Trzaska, S.; Miller, R.L.; Perlwitz, J.P.; Baldasano, J.M.; Cuevas, E.; Ceccato, P.; Yaka, P.; et al. Soil Dust Aerosols and Wind as Predictors of Seasonal Meningitis Incidence in Niger. Environ. Health Perspect. 2014, 122, 679–686. [Google Scholar] [CrossRef]
- Kaufman, Y.J.; Tanré, D.; Boucher, O. A satellite view of aerosols in the climate system. Nature 2002, 419, 215–223. [Google Scholar] [CrossRef]
- Kacenelenbogen, M.; Léon, J.F.; Chiapello, I.; Tanré, D. Characterization of aerosol pollution events in France using ground-based and POLDER-2 satellite data. Atmos. Chem. Phys. 2006, 6, 4843–4849. [Google Scholar] [CrossRef]
- Hoff, R.M.; Christopher, S.A. Remote Sensing of Particulate Pollution from Space: Have We Reached the Promised Land? J. Air Waste Manag. Assoc. 2009, 59, 645–675. [Google Scholar] [CrossRef]
- van Donkelaar, A.; Martin, R.V.; Brauer, M.; Kahn, R.; Levy, R.; Verduzco, C.; Villeneuve, P.J. Global Estimates of Ambient Fine Particulate Matter Concentrations from Satellite-Based Aerosol Optical Depth: Development and Application. Environ. Health Perspect. 2010, 118, 847–855. [Google Scholar] [CrossRef] [PubMed]
- Deroubaix, A.; Martiny, N.; Chiapello, I.; Marticorena, B. Suitability of OMI aerosol index to reflect mineral dust surface conditions: Preliminary application for studying the link with meningitis epidemics in the Sahel. Remote Sens. Environ. 2013, 133, 116–127. [Google Scholar] [CrossRef]
- Woringer, M.; Martiny, N.; Porgho, S.; Bicaba, B.W.; Bar-Hen, A.; Mueller, J.E. Atmospheric Dust, Early Cases, and Localized Meningitis Epidemics in the African Meningitis Belt: An Analysis Using High Spatial Resolution Data. Environ. Health Perspect. 2018, 126, 097002. [Google Scholar] [CrossRef] [PubMed]
- Chiapello, I.; Bergametti, G.; Gomes, L.; Chatenet, B.; Dulac, F.; Pimenta, J.; Santos Suares, E. An additional low layer transport of Sahelian and Saharan dust over the North-Eastern Tropical Atlantic. J. Geophys. Res. 1995, 22, 3191–3194. [Google Scholar] [CrossRef]
- Léon, J.F.; Derimian, Y.; Chiapello, I.; Tanré, D.; Podvin, T.; Chatenet, B.; Diallo, A.; Deroo, C. Aerosol Vertical Distribution and Optical Properties over M’Bour (16.96° W; 14.39° N), Senegal from 2006 to 2008. Atmos. Chem. Phys. 2009, 9, 9249–9261. [Google Scholar] [CrossRef]
- Yahi, H.; Marticorena, B.; Thiria, S.; Chatenet, B.; Schmechtig, C.; Rajot, J.L.; Crepon, M. Statistical relationship between surface PM10 concentration and aerosol optical depth over the Sahel as a function of weather type, using neural network methodology. J. Geophys. Res. Atmos. 2013, 118, 13265–13281. [Google Scholar] [CrossRef]
- Winker, D.M.; Tackett, J.L.; Getzewich, B.J.; Liu, Z.; Vaughan, M.A.; Rogers, R.R. The global 3-D distribution of tropospheric aerosols as characterized by CALIOP. Atmos. Chem. Phys. 2013, 13, 3345–3361. [Google Scholar] [CrossRef]
- Kim, S.W.; Berthier, S.; Raut, J.C.; Chazette, P.; Dulac, F.; Yoon, S.C. Validation of aerosol and cloud layer structures from the space-borne lidar CALIOP using a ground-based lidar in Seoul, Korea. Atmos. Chem. Phys. 2008, 8, 3705–3720. [Google Scholar] [CrossRef]
- Perrone, M.R.; De Tomasi, F.; Burlizzi, P. Aerosol products by CALIOP at 532 nm and by a ground-based Raman lidar at 355 nm: Intercomparison methodology. Atmos. Res. 2011, 101, 438–449. [Google Scholar] [CrossRef]
- Vaughan, M.A.; Powell, K.A.; Winker, D.M.; Hostetler, C.A.; Kuehn, R.E.; Hunt, W.H.; Getzewich, B.J.; Young, S.A.; Liu, Z.; McGill, M.J. Fully Automated Detection of Cloud and Aerosol Layers in the CALIPSO Lidar Measurements. J. Atmos. Ocean. Technol. 2009, 26, 2034–2050. [Google Scholar] [CrossRef]
- Tsamalis, C.; Chédin, A.; Pelon, J.; Capelle, V. The seasonal vertical distribution of the Saharan Air Layer and its modulation by the wind. Atmos. Chem. Phys. 2013, 13, 11235–11257. [Google Scholar] [CrossRef]
- Huang, J.; Guo, J.; Wang, F.; Liu, Z.; Jeong, M.J.; Yu, H.; Zhang, Z. CALIPSO inferred most probable heights of global dust and smoke layers. J. Geophys. Res. Atmos. 2015, 120, 2014JD022898. [Google Scholar] [CrossRef]
- Todd, M.C.; Cavazos-Guerra, C. Dust aerosol emission over the Sahara during summertime from Cloud-Aerosol Lidar with Orthogonal Polarization (CALIOP) observations. Atmos. Environ. 2016, 128, 147–157. [Google Scholar] [CrossRef][Green Version]
- Marticorena, B.; Chatenet, B.; Rajot, J.L.; Traoré, S.; Coulibaly, M.; Diallo, A.; Koné, I.; Maman, A.; NDiaye, T.; Zakou, A. Temporal variability of mineral dust concentrations over West Africa: Analyses of a pluriannual monitoring from the AMMA Sahelian Dust Transect. Atmos. Chem. Phys. 2010, 10, 8899–8915. [Google Scholar] [CrossRef]
- Kaly, F.; Marticorena, B.; Chatenet, B.; Rajot, J.L.; Janicot, S.; Niang, A.; Yahi, H.; Thiria, S.; Maman, A.; Zakou, A.; et al. Variability of mineral dust concentrations over West Africa monitored by the Sahelian Dust Transect. Atmos. Res. 2015, 164–165, 226–241. [Google Scholar] [CrossRef]
- Holben, B.N.; Eck, T.F.; Slutsker, I.; Tanre, D.; Buis, J.P.; Setzer, A.; Vermote, E.; Reagan, J.A.; Kaufman, Y.J.; Nakajima, T.; et al. AERONET—A federated instrument network and data archive for aerosol characterization. Remote. Sens. Environ. 1998, 66, 1–16. [Google Scholar] [CrossRef]
- Holben, B.N.; Tanre, D.; Smirnov, A.; Eck, T.F.; Slutsker, I.; Abuhassan, N.; Newcomb, W.W.; Schafer, J.S.; Chatenet, B.; Lavenu, F.; et al. An emerging ground-based aerosol climatology: Aerosol optical depth from AERONET. J. Geophys. Res. Atmos. (1984–2012) 2001, 106, 12067–12097. [Google Scholar] [CrossRef]
- Winker, D.M.; Vaughan, M.A.; Omar, A.; Hu, Y.; Powell, K.A.; Liu, Z.; Hunt, W.H.; Young, S.A. Overview of the CALIPSO Mission and CALIOP Data Processing Algorithms. J. Atmos. Ocean. Technol. 2009, 26, 2310–2323. [Google Scholar] [CrossRef]
- Kittaka, C.; Winker, D.M.; Vaughan, M.A.; Omar, A.; Remer, L.A. Intercomparison of column aerosol optical depths from CALIPSO and MODIS-Aqua. Atmos. Meas. Tech. 2011, 4, 131–141. [Google Scholar] [CrossRef]
- Kim, M.H.; Kim, S.W.; Yoon, S.C.; Omar, A.H. Comparison of Aerosol Optical Depth between CALIOP and MODIS-Aqua for CALIOP Aerosol Subtypes over the Ocean: AOD COMPARISON FOR CALIOP AEROSOL TYPES. J. Geophys. Res. Atmos. 2013, 118, 13241–13252. [Google Scholar] [CrossRef]
- Liu, Z.; Vaughan, M.; Winker, D.; Kittaka, C.; Getzewich, B.; Kuehn, R.; Omar, A.; Powell, K.; Trepte, C.; Hostetler, C. The CALIPSO Lidar Cloud and Aerosol Discrimination: Version 2 Algorithm and Initial Assessment of Performance. J. Atmos. Ocean. Technol. 2009, 26, 1198–1213. [Google Scholar] [CrossRef]
- Young, S.A.; Vaughan, M.A. The Retrieval of Profiles of Particulate Extinction from Cloud-Aerosol Lidar Infrared Pathfinder Satellite Observations (CALIPSO) Data: Algorithm Description. J. Atmos. Ocean. Technol. 2009, 26, 1105–1119. [Google Scholar] [CrossRef]
- Carlson, T.; Prospero, J.S. The Large Scale Movement of Saharan Air Outbreaks over the Northern Equatorial Atlantic. Mon. Wea. Rev. 1972, 11, 283–297. [Google Scholar] [CrossRef]
- Venables, W.N.; Ripley, B.D. Modern Applied Statistics with S, 4th ed.; Statistics and Computing; Springer: New York, NY, USA, 2002. [Google Scholar] [CrossRef]
- Flament, P.; Deboudt, K.; Cachier, H.; Châtenet, B.; Mériaux, X. Mineral Dust and Carbonaceous Aerosols in West Africa: Source Assessment and Characterization. Atmos. Environ. 2011, 45, 3742–3749. [Google Scholar] [CrossRef]
- Rivellini, L.H.; Chiapello, I.; Tison, E.; Fourmentin, M.; Féron, A.; Diallo, A.; N’Diaye, T.; Goloub, P.; Canonaco, F.; Prévôt, A.S.H.; et al. Chemical Characterization and Source Apportionment of Submicron Aerosols Measured in Senegal during the 2015 SHADOW Campaign. Atmos. Chem. Phys. 2017, 17, 10291–10314. [Google Scholar] [CrossRef]
- James, G.; Witten, D.; Hastie, T.; Tibshirani, R. (Eds.) An Introduction to Statistical Learning: With Applications in R; Number 103 in Springer Texts in Statistics; Springer: New York, NY, USA, 2013. [Google Scholar]
Sample Availability: AERONET data are available at https://aeronet.gsfc.nasa.gov/. PM10 data can be accessed from https://indaaf.obs-mip.fr/ and CALIOP products from the NASA Atmospheric Data Center at https://asdc.larc.nasa.gov/. |


© 2020 by the authors. Licensee MDPI, Basel, Switzerland. This article is an open access article distributed under the terms and conditions of the Creative Commons Attribution (CC BY) license (http://creativecommons.org/licenses/by/4.0/).