Article

Continuous Forest Monitoring Using Cumulative Sums of Sentinel-1 Timeseries

1
School of Engineering and Innovation, The Open University, Milton Keynes MK7 6AA, UK
2
Biological and Environmental Sciences, The University of Stirling, Stirling FK9 4LA, UK
3
Forest Research, Agency of the British Forestry Commission, Roslin, Midlothian, Edinburgh EH25 9SY, UK
*
Author to whom correspondence should be addressed.
Remote Sens. 2020, 12(18), 3061; https://doi.org/10.3390/rs12183061
Submission received: 30 July 2020 / Revised: 24 August 2020 / Accepted: 15 September 2020 / Published: 18 September 2020
(This article belongs to the Special Issue SAR for Forest Mapping)

Abstract

:
Forest degradation is recognized as a major environmental threat on a global scale. The recent rise in natural and anthropogenic destruction of forested ecosystems highlights the need for developing new, rapid, and accurate remote sensing monitoring systems, which capture forested land transformations. In spite of the great technological advances made in airborne and spaceborne sensors over the past decades, current Earth observation (EO) change detection methods still need to overcome numerous limitations. Optical sensors have been commonly used for detecting land use and land cover changes (LULCC), however, the requirement of certain technical and environmental conditions (e.g., sunlight, not cloud-coverage) restrict their use. More recently, synthetic aperture radar (SAR)-based change detection approaches have been used to overcome these technical limitations, but they commonly rely on static detection approaches (e.g., pre and post disturbance scenario comparison) that are slow to monitor change. In this context, this paper presents a novel approach for mapping forest structural changes in a continuous and near-real-time manner using dense Sentinel-1 image time-series. Our cumulative sum–spatial mean corrected (CUSU-SMC) algorithm approach is based on cumulative sum statistical analysis, which allows the continuous monitoring of radar signal variations, derived from forest structural change. Taking advantage of the high data availability offered by the Sentinel-1 (S-1) C-band constellation, we used an S-1 ground range detected (GRD) dual (VV, VH) polarization timeseries, formed by a total of 84 images, to monitor clear-cutting operations carried out in a Scottish forest during 2019. The analysis showed a user’s accuracy of 82% for the (conservative) detection approach. The use of a post-processing neighbor filter increased the detection performance to a user’s accuracy of 86% with an overall accuracy of 77% for areas of a minimum extent of 0.4 ha. To further validate the detection performance of the method, the CUSU-SMC change detector was tested against commonly-used pairwise change detection approaches for the same period. These results emphasize the capabilities of dense SAR time-series for environmental monitoring and provide a useful tool for optimizing national forest inventories.

Graphical Abstract

1. Introduction

Forests are one of the major contributors to climate change mitigation, playing an integral role in the global carbon cycle by removing 2.1 Gt CO2 per year [1,2]. However, accelerating changes in global climate dynamics, together with high pressures exerted by current socio-economic forces, are leading to a dramatic reduction of global forested regions, which is threatening the conservation of world forest ecosystems [3,4,5,6,7]. Among the many land use and land cover changes (LULCC) that threaten global ecosystems, deforestation has been recognized as the most important human-induced land transformation during the last half century [8]. In addition, prediction models based on the current global environmental trends forecast a global canopy cover reduction of 223 million hectares by 2050 [9,10,11]. These facts highlight the need to develop accurate forest monitoring systems which contribute to an optimal management and conservation of the world’s forests.
At present, there are numerous institutions and programs that seek to reverse the current deforestation trend through joint ecological agreements. Initiatives such as the United Nations Reducing Emissions from Deforestation and Forest Degradation (REDD+ program), seeking to develop a joint and multi-scale global forest inventory; the UK Space Agency Forest2020 project, aiming to restore 300 million hectares of tropical forest while improving forest monitoring systems in developing countries [12]; or the European Space Agency Climate Change Initiative (ESA-CCI) [13], exploiting the potential of earth observation technology for climate change response, are some examples of international projects aiming to protect forest ecosystems through the development of improved environmental monitoring systems.
Forest inventories are recognized as the standard tool for quantifying and monitoring forest characteristics [14]. However, the highly dynamic nature of forests normally renders inventories inefficient tools for monitoring the continuous transformation processes that occur in these ecosystems as they are mostly generated through infrequent, sometimes one-off, ground surveys. Remote sensing (RS) techniques have emerged as valuable alternatives for overcoming this challenge, thanks to the advances that aerospace technology and geographical information systems (GIS) have accomplished over the last decades [15].
The work presented here utilised synthetic aperture radar (SAR) to address the inadequacies of forest inventories. Historically, the use of RS for forestry purposed has focused on optical systems, however this approach is hindered in areas with recurrent cloud coverage (e.g., Tropical areas) or limited solar illumination (e.g., Polar latitudes) [16,17,18]. Another disadvantage of optical systems derives from the fact that they can only extract information from the very top canopy layer. This limits the use of optical methods for real time forest monitoring, since under-canopy disturbances may be unnoticed or clouds may lead to a long wait time before the disturbance is assessed.
SAR basic imaging principles rely on the measurement of the energy that is redirected back to the radar antenna after an interaction occurring between the transmitted signal and the object studied. Depending on the intensity of the backscatter, it is possible to determine diverse information about the physical properties of the target [19]. Radar signals are highly influenced by three main physical parameters which are inherent of any object or surface target: the geometry, roughness, and moisture content. Any changes in these parameters in a forest may result in a noticeable variation in the backscattered intensity [20,21].
The integration of EO datasets into forest monitoring systems has generated a significant impact in forest management and policy making. Products such as the JICA-JAXA Forest Early Warning System in the Tropics (JJ-FAST) [22] or the UMD-GLAD (University of Maryland Global Land Analysis and Discovery) Global Forest change map [23]; the global forest/non-forest maps from ALOS PALSAR data [24], or the TanDEM-X forest/non-forest global map [25] are widely used by international policymakers for reviewing the annual conservation status of the world’s forests. However, the use of these products presents diverse limitations. Technical and environmental aspects such as the coarse spatial resolution (i.e., 100–1000 m) or low temporal resolution, due to persistent cloud coverage, hinder the detection of small forest degradation events as well as the generation of sub-annual or rapid response alerts [14].
The launch of the European Space Agency’s (ESA) Sentinel-1 satellite constellation in 2014, opened the door to new opportunities for environmental monitoring. With freely available data and improved sensor characteristics (e.g., dual polarization 6- or 12-day revisit period), Sentinel-1 rapidly stood out as a valuable resource for effective monitoring of highly dynamic forest ecosystems [17,26].

Detecting Forest Changes With Pairwise Analysis of SAR Data
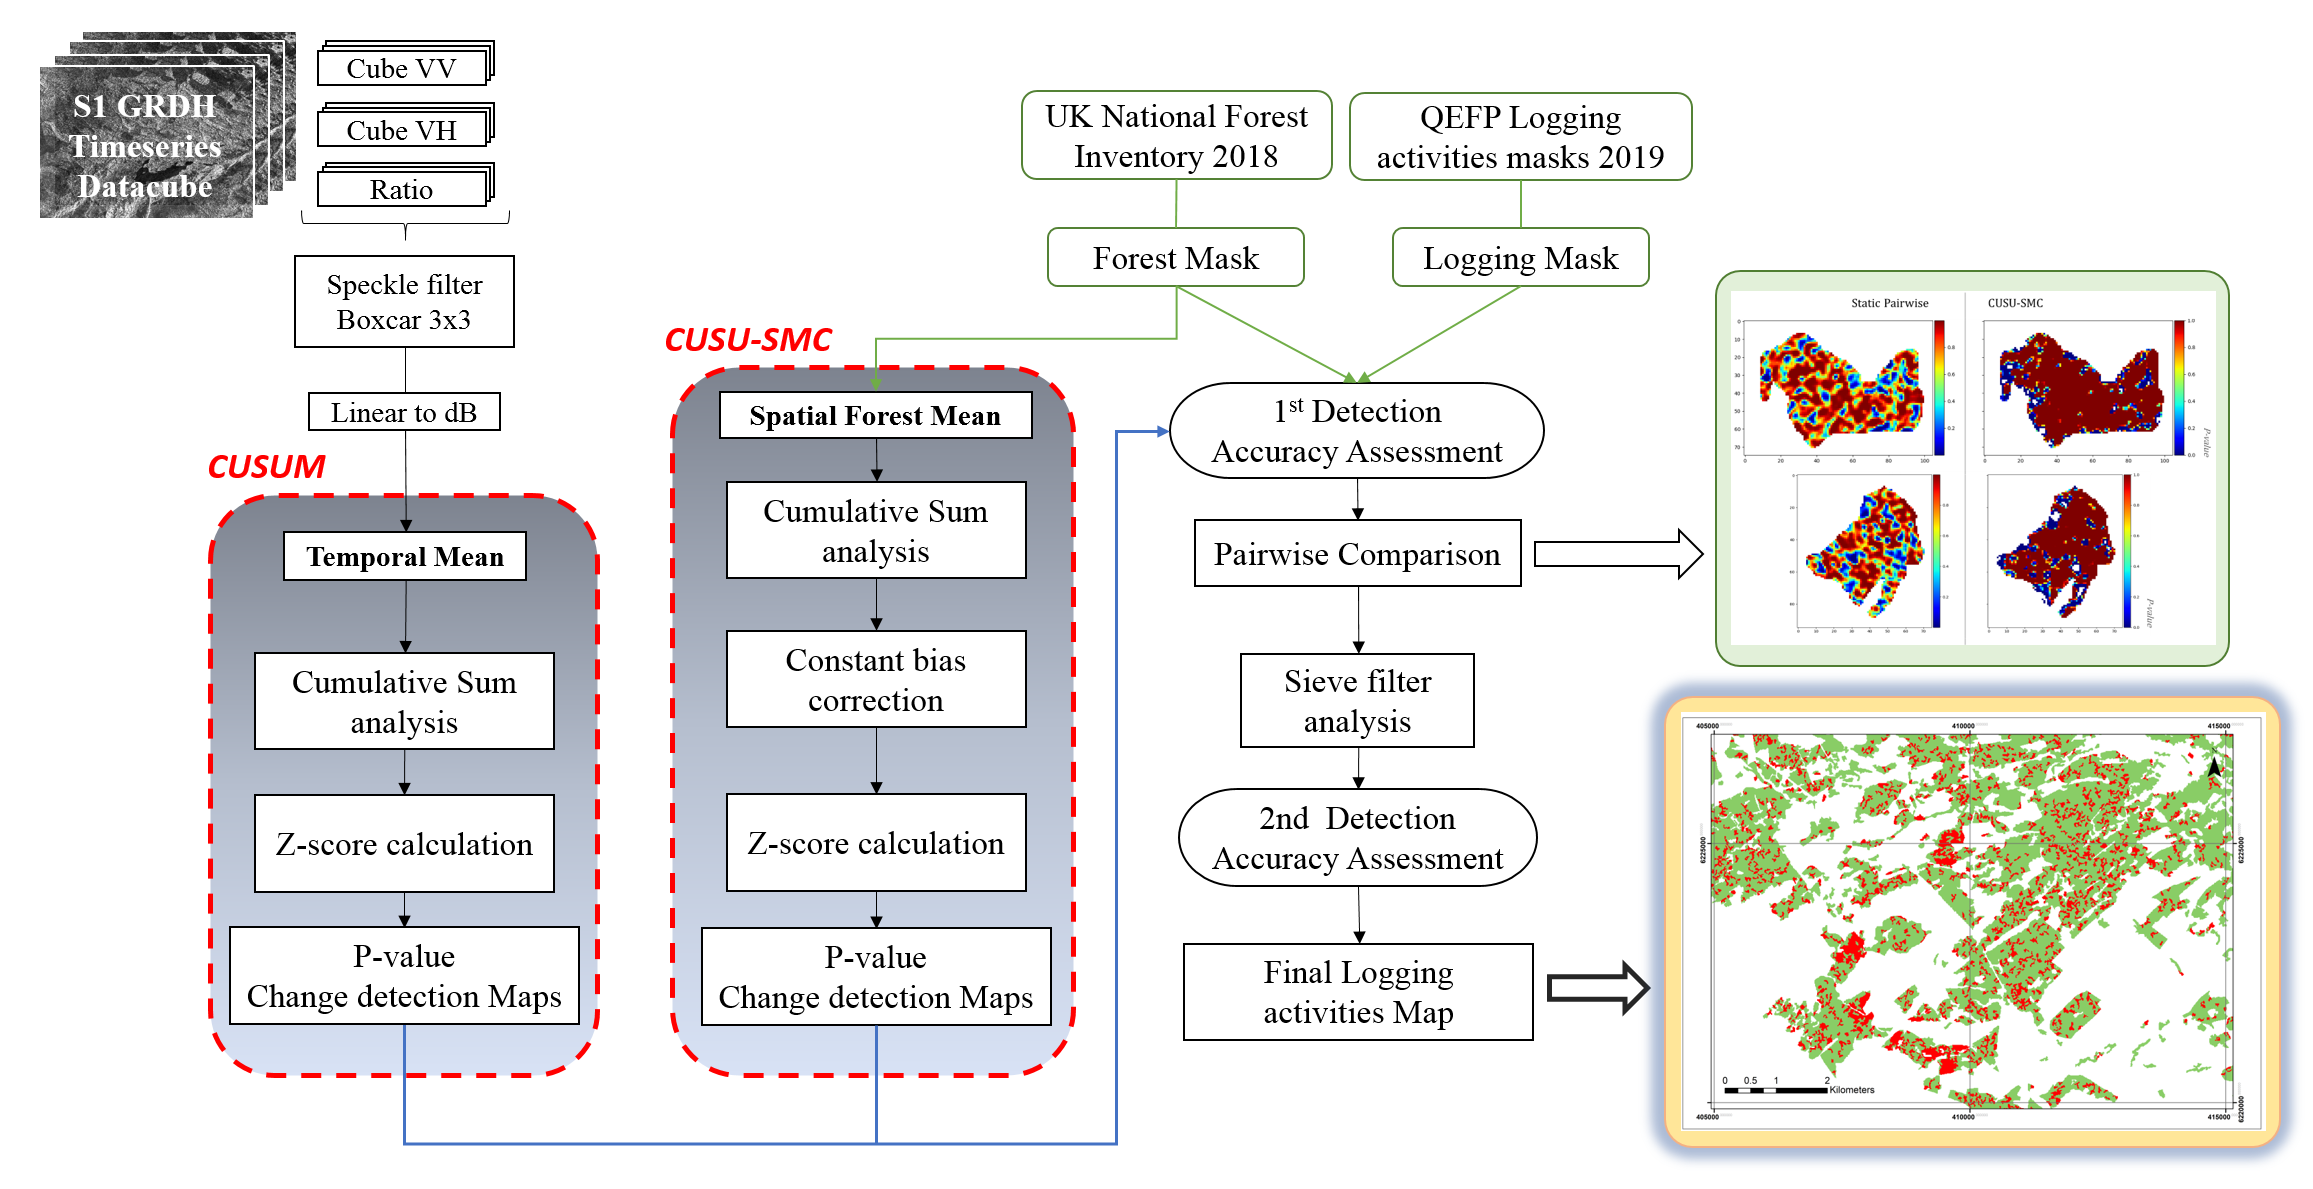
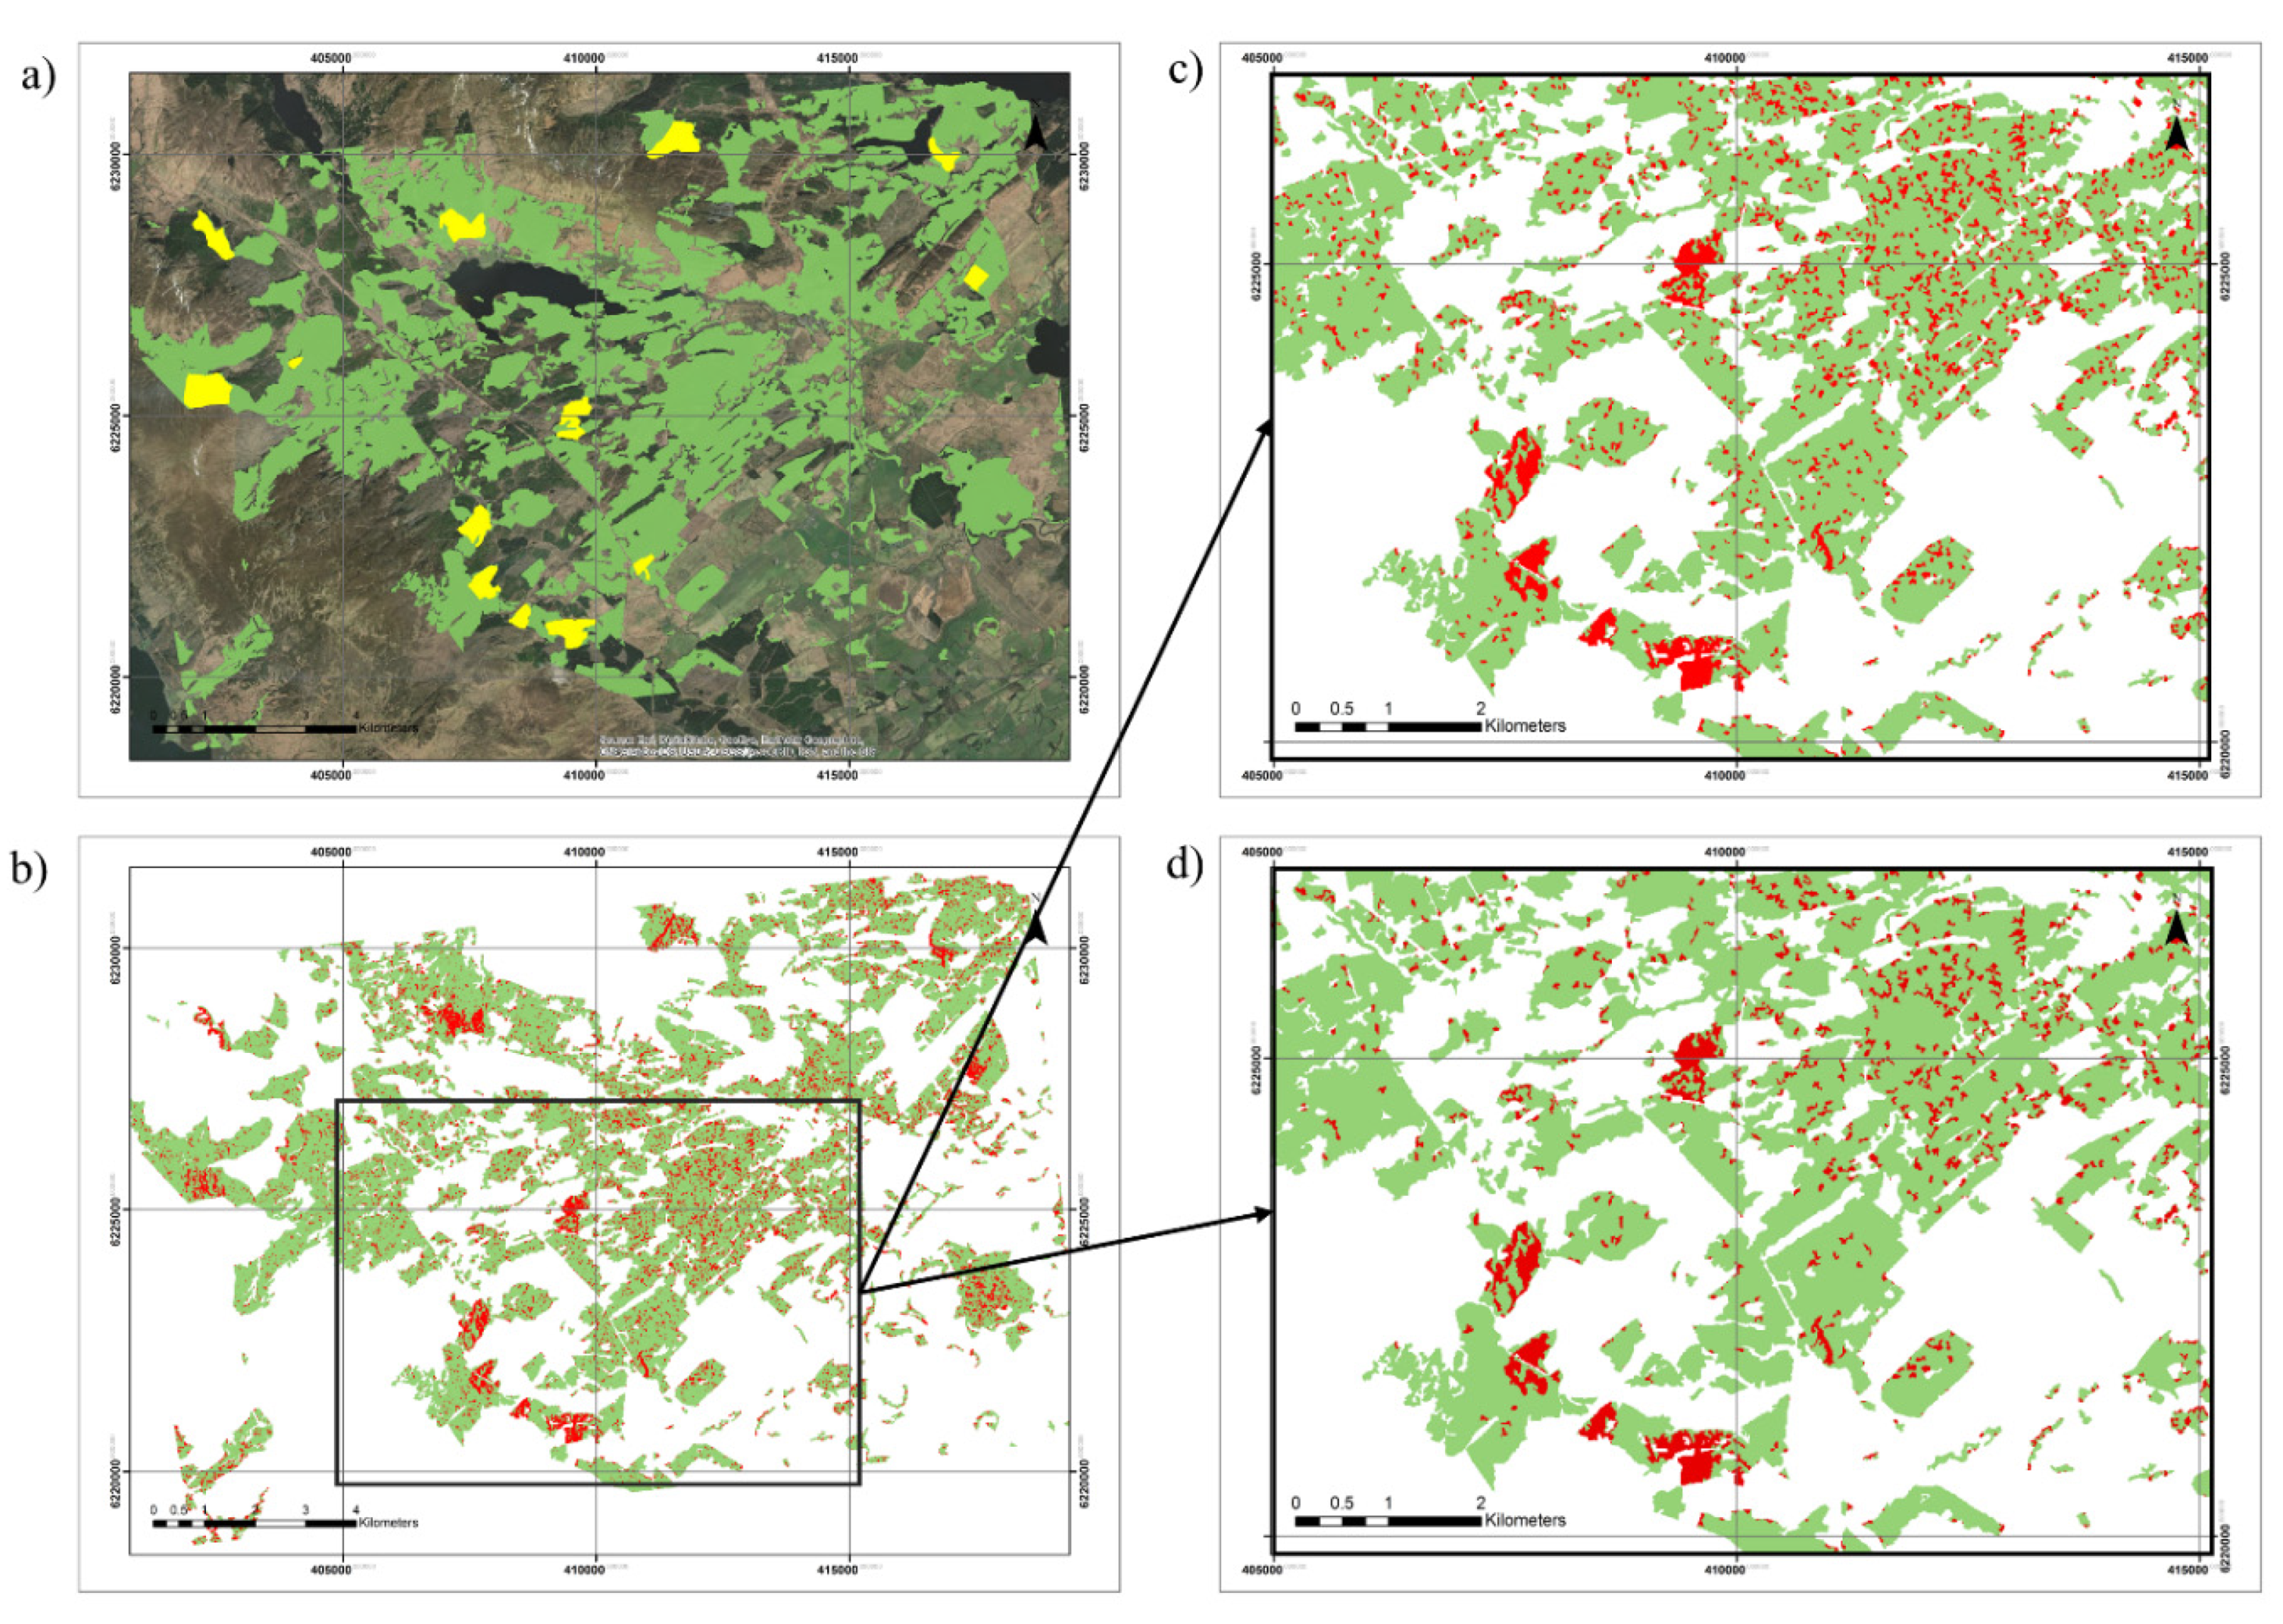
In this work we have adopted an innovative approach which uses long time series of data to detect forest change. However, to determine the effectiveness of this approach, we compared it to several methodologies which only use pairwise difference or ratio between consecutive images. As will be shown by our analysis these methods present some limitations.
Previous studies have shown the capabilities of SAR systems for forest change monitoring at lower scales [16,27,28,29,30,31,32,33]. Most of these studies were based on pairwise or single epoque image comparison for detecting the changes between two specific dates. Others investigated the use of time series for developing near real-time change detectors by using multitemporal averages (e.g., monthly average). A major limitation to this approach is that when comparing images acquired over a relative small time gap, possible changes occurring during this time gap may go undetected [32,34]. For instance, direct pairwise comparison between closely acquired images could lead to an erroneous estimation of land cover changes associated with divergences in the environmental conditions. Minor variation in some land surface parameters (i.e., soil moisture, canopy moisture, plant phenology) may result in radar backscatter changes between the compared images. Another limitation is that often there is a time lag between the change happening and the SAR images showing the change. Several studies [32,34,35,36] have reported significant delays in the forest change detection that range from weeks to months after the disturbance. This phenomenon was also observed by Watanabe et.al [36], where the reduced sensitivity to change was related to the persistence of branches left on the ground after the felling activities. Consequently, there are inherent difficulties in selecting the right time gap for performing pairwise difference analyses. Pairs with, for example, between 6- or 12-days difference may not be able to detect changes, whereas using larger time gaps can lead to the identification of changes due to seasonality. Lastly, pairwise change detection methods do not allow the advantages associated with long-time series multitemporal information to be realised, which facilitates the search for specific trends over the time domain. Therefore, building the change detector algorithm on parameters extracted from dense datasets provides a higher level of confidence when assessing the monitoring processes.
This study aims to develop a novel approach for monitoring forest structural changes in a continuous manner using Sentinel 1 image time-series data. Based on cumulative sum statistical analysis, this method was developed for exploiting the continuous variation in radar signals derived from forest changes (e.g., logging activities). This approach was validated in the Queen Elizabeth Forest Park (Scotland) in collaboration with Forest Research (FR) and Forest and Land Scotland (FLS). However, the new forest monitoring tool is designed to be applicable to any UK National Forests.
To summarize, the main novelties of this work are (1) the design of statistical tests for cumulative sums using SAR data, (2) the design of a novel SAR-based change detection algorithm for continuous forest monitoring (CUSUM-SMC) and (3) the quantitative evaluation of the change detection performance of the statistical tests for forest structural disturbances.

2. Study Area

The study area was located within the boundaries of the Queen Elizabeth Forest Park (19,665 ha), near Aberfoyle village, Scotland (Figure 1). This area is part of the Loch Lomond and Trossachs National Park and has been widely used as a research forest by FR. The area is characterized by large natural forests and forest plantations. Main forest types, according to the most recent (2016) National Forest Inventory (NFI), are ‘conifer woodlands’ (9001.34 ha) and ‘broadleaved and mixed woodlands’ (1547.76 ha). There is a clear predominance of plantations of Sitka spruce (Picea sitchensis) (5351 ha) with smaller areas of Pinus contorta (468 ha) and Quercus petreae and robur (612 ha).
According to historical data (1981–2010) obtained from the closest Met Office climate station at Arrochymore (56.096, −4.548), 30 m above sea level, the bioclimate of this region is considered as ‘Cfb’- ‘oceanic or highland climate’ (Köppen–Geiger classification). The mean annual temperature for the area is 12.6 °C and annual rainfall (1735 mm) is distributed evenly throughout the year. July is the hottest month with an average temperature of 19.2 °C, while January shows the lowest temperatures with an average of 6.9 °C. The soils are drifts derived from acid metamorphic rocks and Lower Old Red Sandstone sediments, classified as “brown soils” [37]. To ensure the absence of any significant geometric distortion that may compromise the use of radar images, a detailed analysis of the main topographic variables (e.g., elevation, aspect, hill shade, orientation) was carried out. Results showed a predominance of lowland and foothills with generally gentle slopes, although some hills do present a significant slope, which did not condition the utilization of radar in the area of study.

3. Materials

3.1. SAR Data

Dual polarization (VV, VH) Sentinel-1 Level-1 ground range detected (GRD) images, were retrieved from the ESA data archive using the Sentinel Data Access Service (SEDAS) platform. S1- IW_GRD_HR products were acquired in interferometric wide swath (IW) high resolution (HR). The center frequency was 5.405 GHz (which leads to a 5.3 cm wavelength) and with around 20 × 22 meters resolution [38,39]. GRD products were focused SAR data that had already been converted into intensities, multi-looked, and projected to ground range using the Earth ellipsoid model WGS84 [40]. In total, the radar time-series was composed of 84 scenes, downloaded for the period between 01 January 2018 and 30 September 2019. All images were acquired in ascending mode and using a unique orbit (i.e., relative orbit 30), aiming to maintain the identical radar geometry in all acquisitions.

3.2. SAR Data Pre-Processing

All images were pre-processed using ESA-SNAP 7.0 and ESA-NEST 4.1 software and following a four step procedure: 1. subset, 2. radiometric calibration, 3. coregistration, and 4. geometric terrain correction. First, the subset process was carried out to eliminate those areas located out of the boundaries of the region of interest. Second, radiometric calibration was applied to convert backscatter values to sigma-naught (σ0). It should be noted that in cases where the analysis considers multiple orbits, the use of sigma0 as calibration will not be effective. A calibration process able to remove geometrical distortions associated to steep slopes will be required (e.g., gamma0). The use of a multi-orbit approach was beyond the scope of the work presented here, however; the benefits of this approach will be explored in the future. Third, data coregistration served to precisely stack together all images into a single multi-layer (composite) product. Fourth, terrain correction allowed the geolocation of all pixels, using the 30 m Shuttle Radar Topography Mission (STRM) digital elevation model (DEM) and subsequently projected to the (WGS84, UTM 30N) coordinates system. The final output resulted in a data stack formed by 168 images (84 co-polarization, 84 cross-polarization).

3.3. Validation Data: Forest Mask and Logging Activities Reference Data
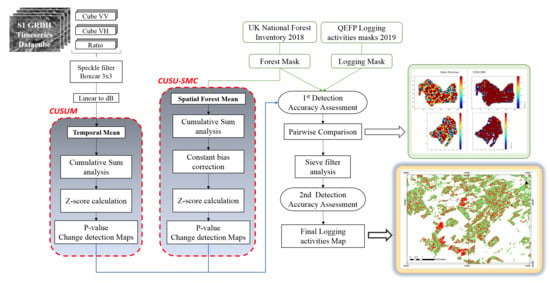
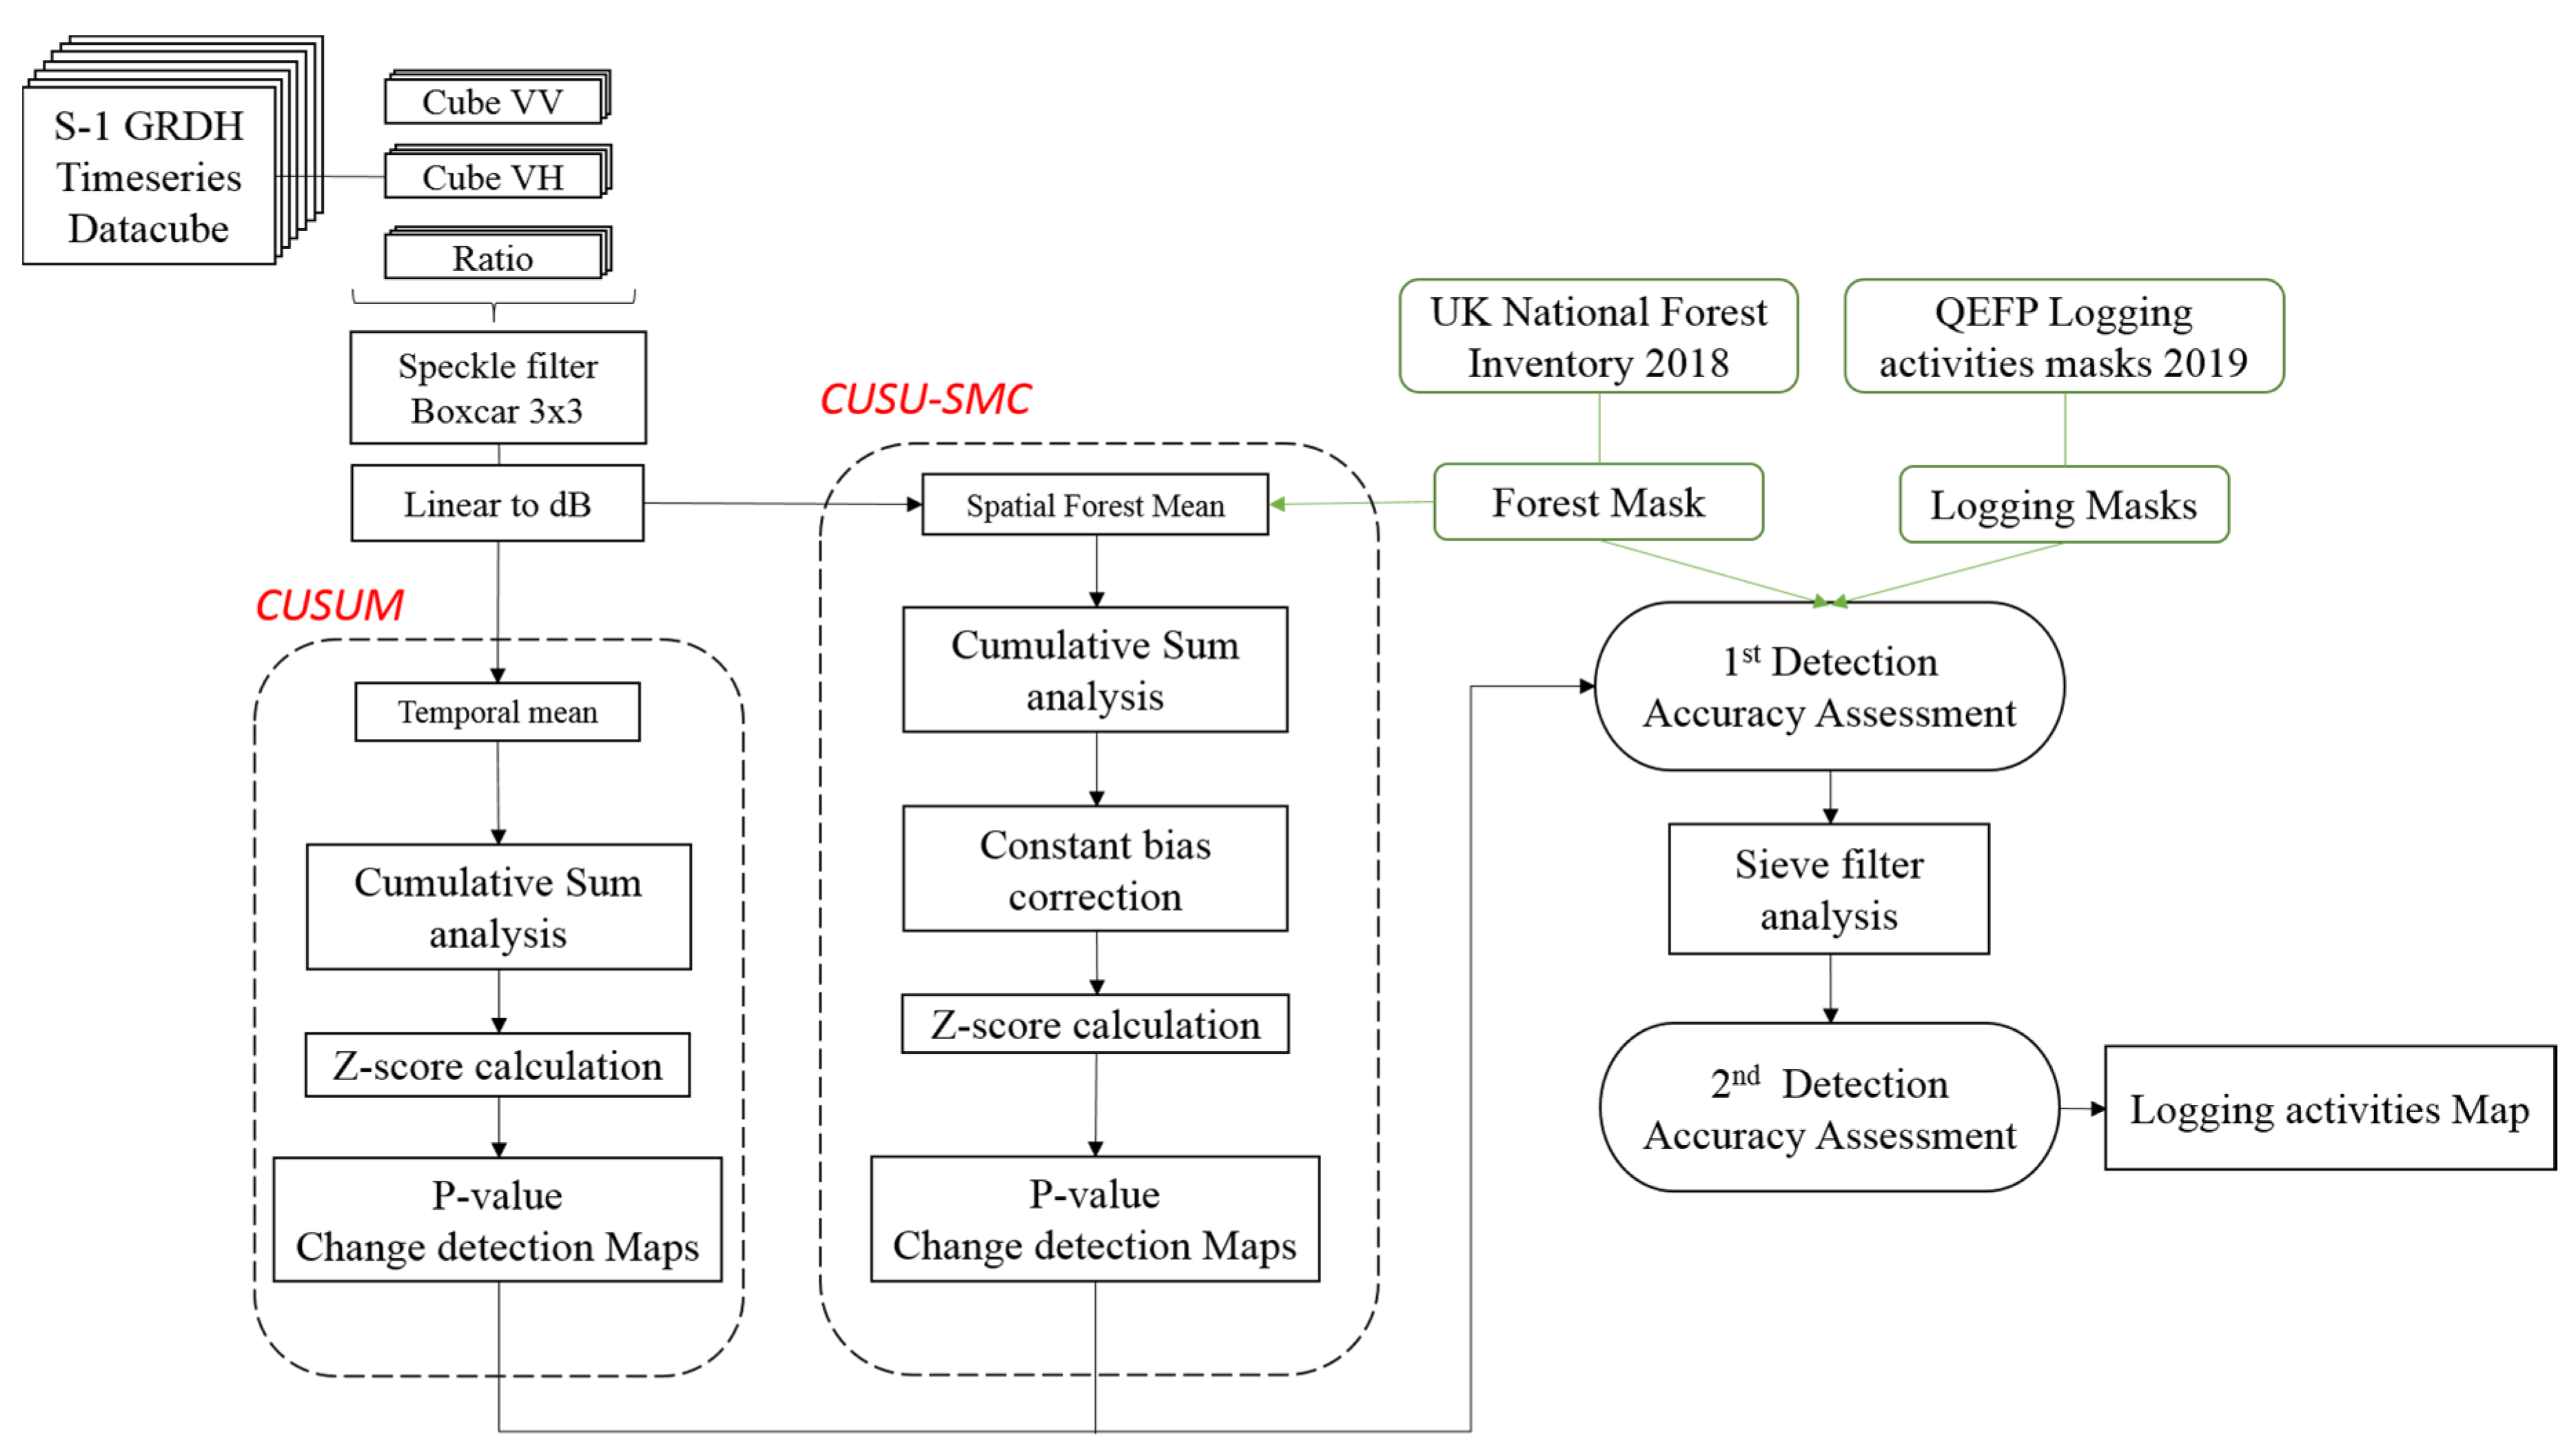
The forest mask was obtained from the 2018 United Kingdom National Forest Inventory [41]. The forest definition used for the forest mask includes both conifer and broadleaves areas, regardless of their pure or mixed typology. We did not discriminate between forest species because of the mixed nature of the forest and the impossibility of differentiation, at the pixel level, between typologies of forested areas.
All of the developed algorithms were tested for detecting clear-cut activities carried out in the Queen Elizabeth forest park between 1 January and 30 September 2019 (Figure 2b). We worked with the harvesting forest office of the FLS with the aim of gathering and verifying information about the start and end dates of each logging activity.
To obtain the initial draft of the change map, we looked for any clear optical images (cloud coverage <10%) acquired over Aberfoyle over this period. A pair of Landsat 8 (OLI) shortwave infrared images acquired on 25 June 2018 and 28 June 2019 (a year later) provided the best characteristics for the required period (Figure 2a). Shortwave infrared is a band combination highly recommended for studying vegetation health and stress, change detection, and disturbed soils [42]. It combines the Short-wave Infrared (SWIR), Near infrared (NIR), and red bands to generate images where vegetation can be clearly differentiated from bare soils.
Using a visual interpretation process, we manually identified forest areas which had experienced significant transformation. Finally, once all the three land classes (change-forest, stable-forest, non-forest) were mapped as vector polygons, we extracted the pixel’s boundaries of each particular area by overlapping these polygons over a terrain corrected Sentinel 1 image, extracted from the cube. This process generated a total of 30 areas, 10 for each land class, of various sizes (from 2.5 to 50 ha). These areas were used for the signal behavior analysis, as shown in the following section.

4. Methodologies

4.1. Cumulative Sum Change Detection Analysis

In this study we adapt cumulative sum (CUSUM) statistical methods for monitoring forest disturbances over dense time series. CUSUM has been widely used by the financial sector, being recognized as an excellent big data analytic tool for detecting changes in the market [43]. This method however has not been extensively used in scientific and environmental applications. Recent research [43,44,45,46] showed the potential capabilities of this methodology for monitoring environmental variations. Manogaran et al. [43], proposed a novel climate change detection algorithm to monitor changes in the seasonal climate. The preliminary results showed a high robustness of the method when detecting variations in climate. Kellndorfer [44] explores the use of CUSUM for monitoring deforestation and forest degradation processes, however no quantitative validation of the method is performed. In this work, we developed a novel methodology which is based on the concepts of the CUSUM.
CUSUM is used to monitor the deviation of a variable from its mean based on measurements acquired over a given time frame. It stands as a powerful statistical method for analysing multitemporal processes, since it allows the detection of both slow and abrupt variations in the mean value of a quantity of interest [43,46]. In most cases, these changes in the mean are associated with temporal or permanent changes in the variable analysed [47], a fact which makes this method especially suitable for environmental monitoring purposes, where we have seasonal trends that we must remove. Contrary to what the name may suggest, the cumulative sum is not the cumulative sum of the values, but the cumulative sum of the differences between the values and the mean. This is:
Σ d = i = 0 N I i E [ I ]
where N is the total number of temporal samples, Ii represents a sample take at time i and E[I] is the expected value of the samples over a training time frame. The expected value E[] is approximated by using the sampling average and assuming a large enough sample size.

4.2. CUSU-SMC

In this section we present the modification to the CUSUM algorithm to make it more suitable for work with SAR data, which can show seasonal trends. We call this proposed change detector CUSU-SMC (cumulative sum-spatial mean corrected).
As the main goal of this research focuses on detecting the forest changes that occurred from the beginning of 2019 onwards, we used the information compiled in all 2018 images as control samples. As is shown later, the selection of the mean plays an important role. We used spatio-temporal datasets, where data are stored in cubes with spatial dimensions (range and azimuth) and a temporal dimension. Accordingly, we can calculate the mean value E[I] in the spatial domain or the temporal domain.
1. Temporal mean: previous approaches, followed by [43,44], calculate the average backscatter value for each pixel, using all the images acquired over the reference time, in this case, the year 2018.
E [ I ] = I ¯ t = 1 N t i = 0 N t I i
where Nt is the number of images in the reference time.
This will generate a single mean value I ¯ t for each specific pixel.
This approach presents certain theoretical disadvantages for dense time series over vegetation. A unique mean value for each pixel does not take into account any temporal variation that might be associated with the seasonal change in vegetation (e.g., phenology variations) or meteorological events (e.g., precipitation or temperature). We understand that seasonal variations (due for instance to phenology) represent genuine changes to the forest canopy. Additionally, a drought or a rain event which produces changes all over the forested areas may be misinterpreted as structural changes.
2. Spatial mean: To minimize the possible influence that seasonal variation may have on the detection of forest structural changes, we used a spatial mean (instead of a temporal one) which follows the seasonal variation of forest ecosystems. This approach uses the mean estimated over the forest areas at each specific date in the timeseries.
E [ I ] = I ¯ s = 1 N s i = 0 N s I i
where Ns is the number of pixels included in forest areas and Ii are the pixels in forested areas.
In other words, each time step has a characteristic I ¯ s .
To do this, we needed to use a forest inventory or produce a rough forest classification mask using SAR or optical images.

4.3. CUSU-SMC Implementation

The implementation was done in Python, downloading data using the SEDAS Sentinel Data Service Access Hub.
Data cubes were first created using the Sentinel-1 images. Three data cubes were created, using the polarization channels VV, VH, and their ratio VH/VV. The cubes were then overlaid with forest inventories masks. The forest mask was previously extracted from the 2018 Scottish National Forest Inventory [41]. Forest can be classified differently based on different precision ranges. In this case, it was decided that forest must contain indistinct conifer and broadleaf masses, no matter if they are pure or mixed stands. Once the forest cube is calculated, it is possible to get the spatial forest mean (SFM) for each specific date and implement it into the CUSU-SMC analysis.
In terms of numerical implementation, the CUSU is calculated with the following iteration:
(1)
Temporal mean|CUSUM
c u s u m i = c u s u m i 1 + ( I i [ I ¯ s ]   ) f o r   i = 1 ,   2 , ,   N t
(2)
Spatial mean|CUSU-SMC
c u s u m i = c u s u m i 1 + ( I i [ I ¯ s , f o r e s t ] i   ) f o r   i = 1 ,   2 , ,   N t
where c u s u m 0 = 0 and i is an iteration over the temporal axis of the cube. Nt is the total number of acquisitions used in the training dataset. The image I can be the VV, VH polarization channels or their ratio. The comparison of results using the three observables is provided in the following.

4.4. Z Score Calculation

The result of the CUSUMs (refers to both CUSUM and CUSU-SMC approaches) is either a cumulate intensity or ratio. In order to produce a detector a threshold value was needed for both CUSUM algorithms. In this work we proposed a rigorous statistical framework to set thresholds for both CUSUM algorithms.
The first step was to understand which type of distribution the CUSUMs have. In the following we will show that after all the processing the CUSUM in the training dataset was distributed as a Gaussian zero mean with standard deviation σ . This allowed us to use a Z test for setting thresholds in a statistically rigorous way, with some significance value attached to the results. The first step was to calculate the standard score, which will provide information about the probability of a point having a set Z score. The Z score needs knowledge of the population mean C ¯ and standard deviation σ C :
σ C Z =   c u s u m i σ i
where, σ C   is calculated using all the images acquired during the reference year (2018, with 54 images in our case). c u s u m i is the cumulative sum at time i and σ i is the standard deviation of c u s u m i at the time i.
In the future, we will explore the use of alternative methodologies such as autoregression models associated with the output of the CUSUMs.
The null hypothesis is that “no change” occurred. This is the hypothesis where the c u s u m i , under test belongs to the same population as the training dataset. The alternative hypothesis is that a change happened, or more formally the c u s u m i under test does not belong to the same population as the training dataset:
H0 = No change
H1 = Change
In the test the p-value is the probability that the CUSUM sample belongs to the null hypothesis (H0). This means that a small p-value will suggest that the H0 is rather unlikely and therefore we can reject H0 and argue that we have a large confidence that H1 is true.

4.5. Logging Area Detection Accuracy Assessment

In this work, the accuracy of the algorithm was assessed through an error matrix (or confusion matrix), an approach which evaluated the quality of the classifier, based on the correspondence between the classification results and a reference image (Table 1). From the confusion matrix, overall accuracy (OA, Equation (7)), producer accuracy (PA, Equation (8)), user accuracy (UA, Equation (9)) and F-measure (F-score, Equation (10)) were individually calculated for each data cube. F-measure is one of the best measures for evaluating the detector performance since it summarizes the balance between (PA) and (OA), prioritizing the identification of real detections over the detection of true negatives [48,49].
O v e r a l l   a c c u r a c y   ( O A ) =   T P + T N ( T P + T N + F P + F N )
P r o d u c e r   a c c u r a c y   ( R e c a l l ) =   T P ( T P + F N )
U s e r   a c c u r a c y   ( P r e c i s i o n ) =   T P ( T P + F P )
F - m e a s u r e =   2 R e c a l l P r e c i s i o n ( R e c a l l + P r e c i s i o n )

4.6. Post-Processing and Sieve Filtering

The high sensitivity of electromagnetic signals to many variations occurring in target parameters (e.g., geometry, moisture contents, or surface roughness) makes SAR technology a valuable tool for detecting changes. However, this sensitivity also leads to significant misclassifications and estimation errors when performing change detection analyses. Tackling high false alarm rates is a common issue when working with satellite imagery. A methodology that can be used at the expense of spatial resolution is post-processing with morphological filters, such as the sieve filter [50]. The sieve filter removes all polygons smaller than a given size and merges them with their largest neighbors [50,51]. Beside the threshold on the number of connected pixels, a sieve filter differentiates among two types of pixel connectivity. A type 4 connectivity is established for adjacent pixels that share a side, while a pixel with a connectivity of 8 shares any side or a vertex with its adjacent [51].
The filtering impact on classification accuracy was evaluated using three different thresholds of 10, 15, and 25 pixels; with a connectivity of type 8, as this is less restrictive in terms of shape. The analysis was performed using the geospatial tools of ArcMap 10.5 (Int, Region group), and QGIS software (Gdal-Sieve filter). The final accuracy assessment was carried out in the Python environment, making use of the open source Geospatial Data Abstraction Library (GDAL).

4.7. CUSUMs Framework

All Sentinel-1 GRD images acquired for our period of study considered the VV and VH polarization channels. Channels were calibrated as normalised radar cross sections. We used these to compute the ratio of VH over VV. The timeseries was stored in 3 data cubes, one for VV, one for VH, and one for ratio. In the following step, we reduced noise by applying a boxcar filter (3 × 3 window size). The filtering helped reduce speckle variation. Subsequently, unitless backscatter values were converted to dB using a logarithmic transformation. This pre-processing was identical for CUSUM and CUSU-SMC.
σ d B = 10 log 10 D N ,  
where DN is digital number.
The following step marks the separation between the CUSUM and CUSU-SMC approaches. CUSUM uses a unique mean value for each pixel calculated over the reference timeseries (year 2018). CUSU-SMC uses a unique mean for each acquisition, and this mean is updated for each acquisition. Z-score calculation allowed us to evaluate the probability of change, rejecting or accepting our hypothesis under different levels of significance. Change detection maps were subject to a first accuracy assessment, making use of reference logging activity masks, provided by the FLS as the validation dataset. Finally, a sieve morphological filter, with multiple windows sizes, was applied to reduce the number of random flagged pixels, and the accuracy was assessed again to evaluate the effects of the morphological filter on the final result (Figure 3).

5. Results

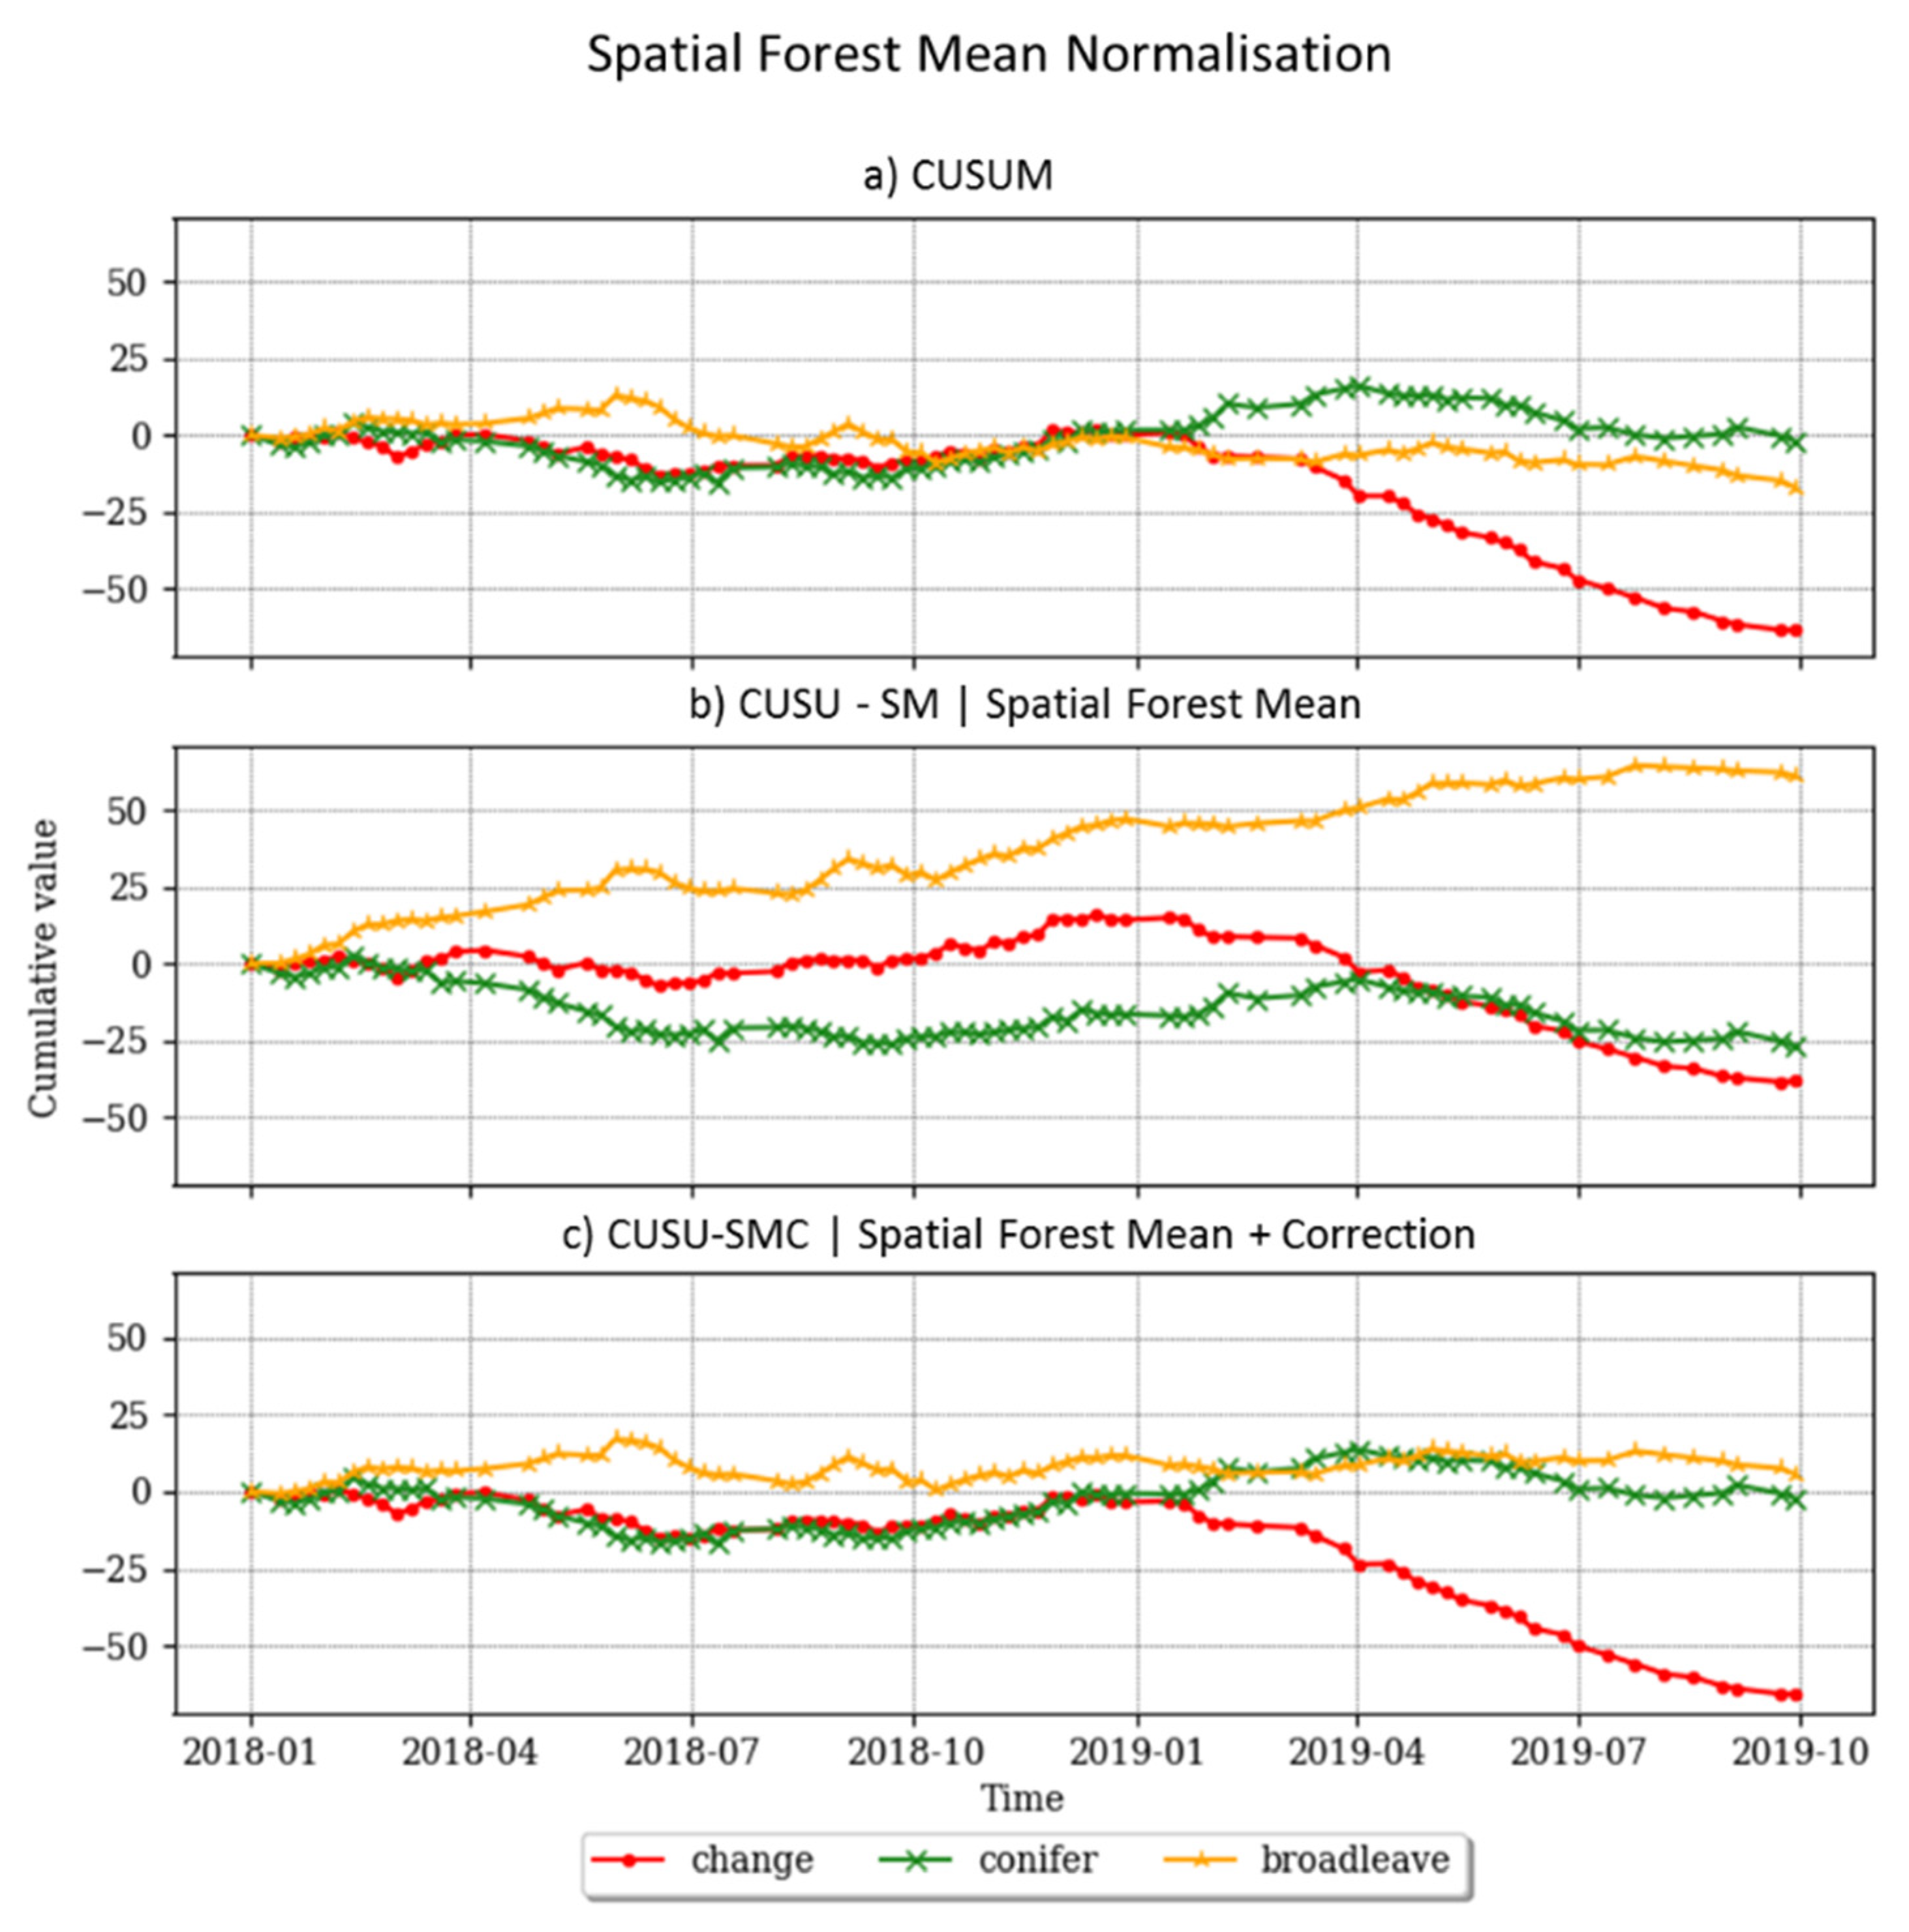
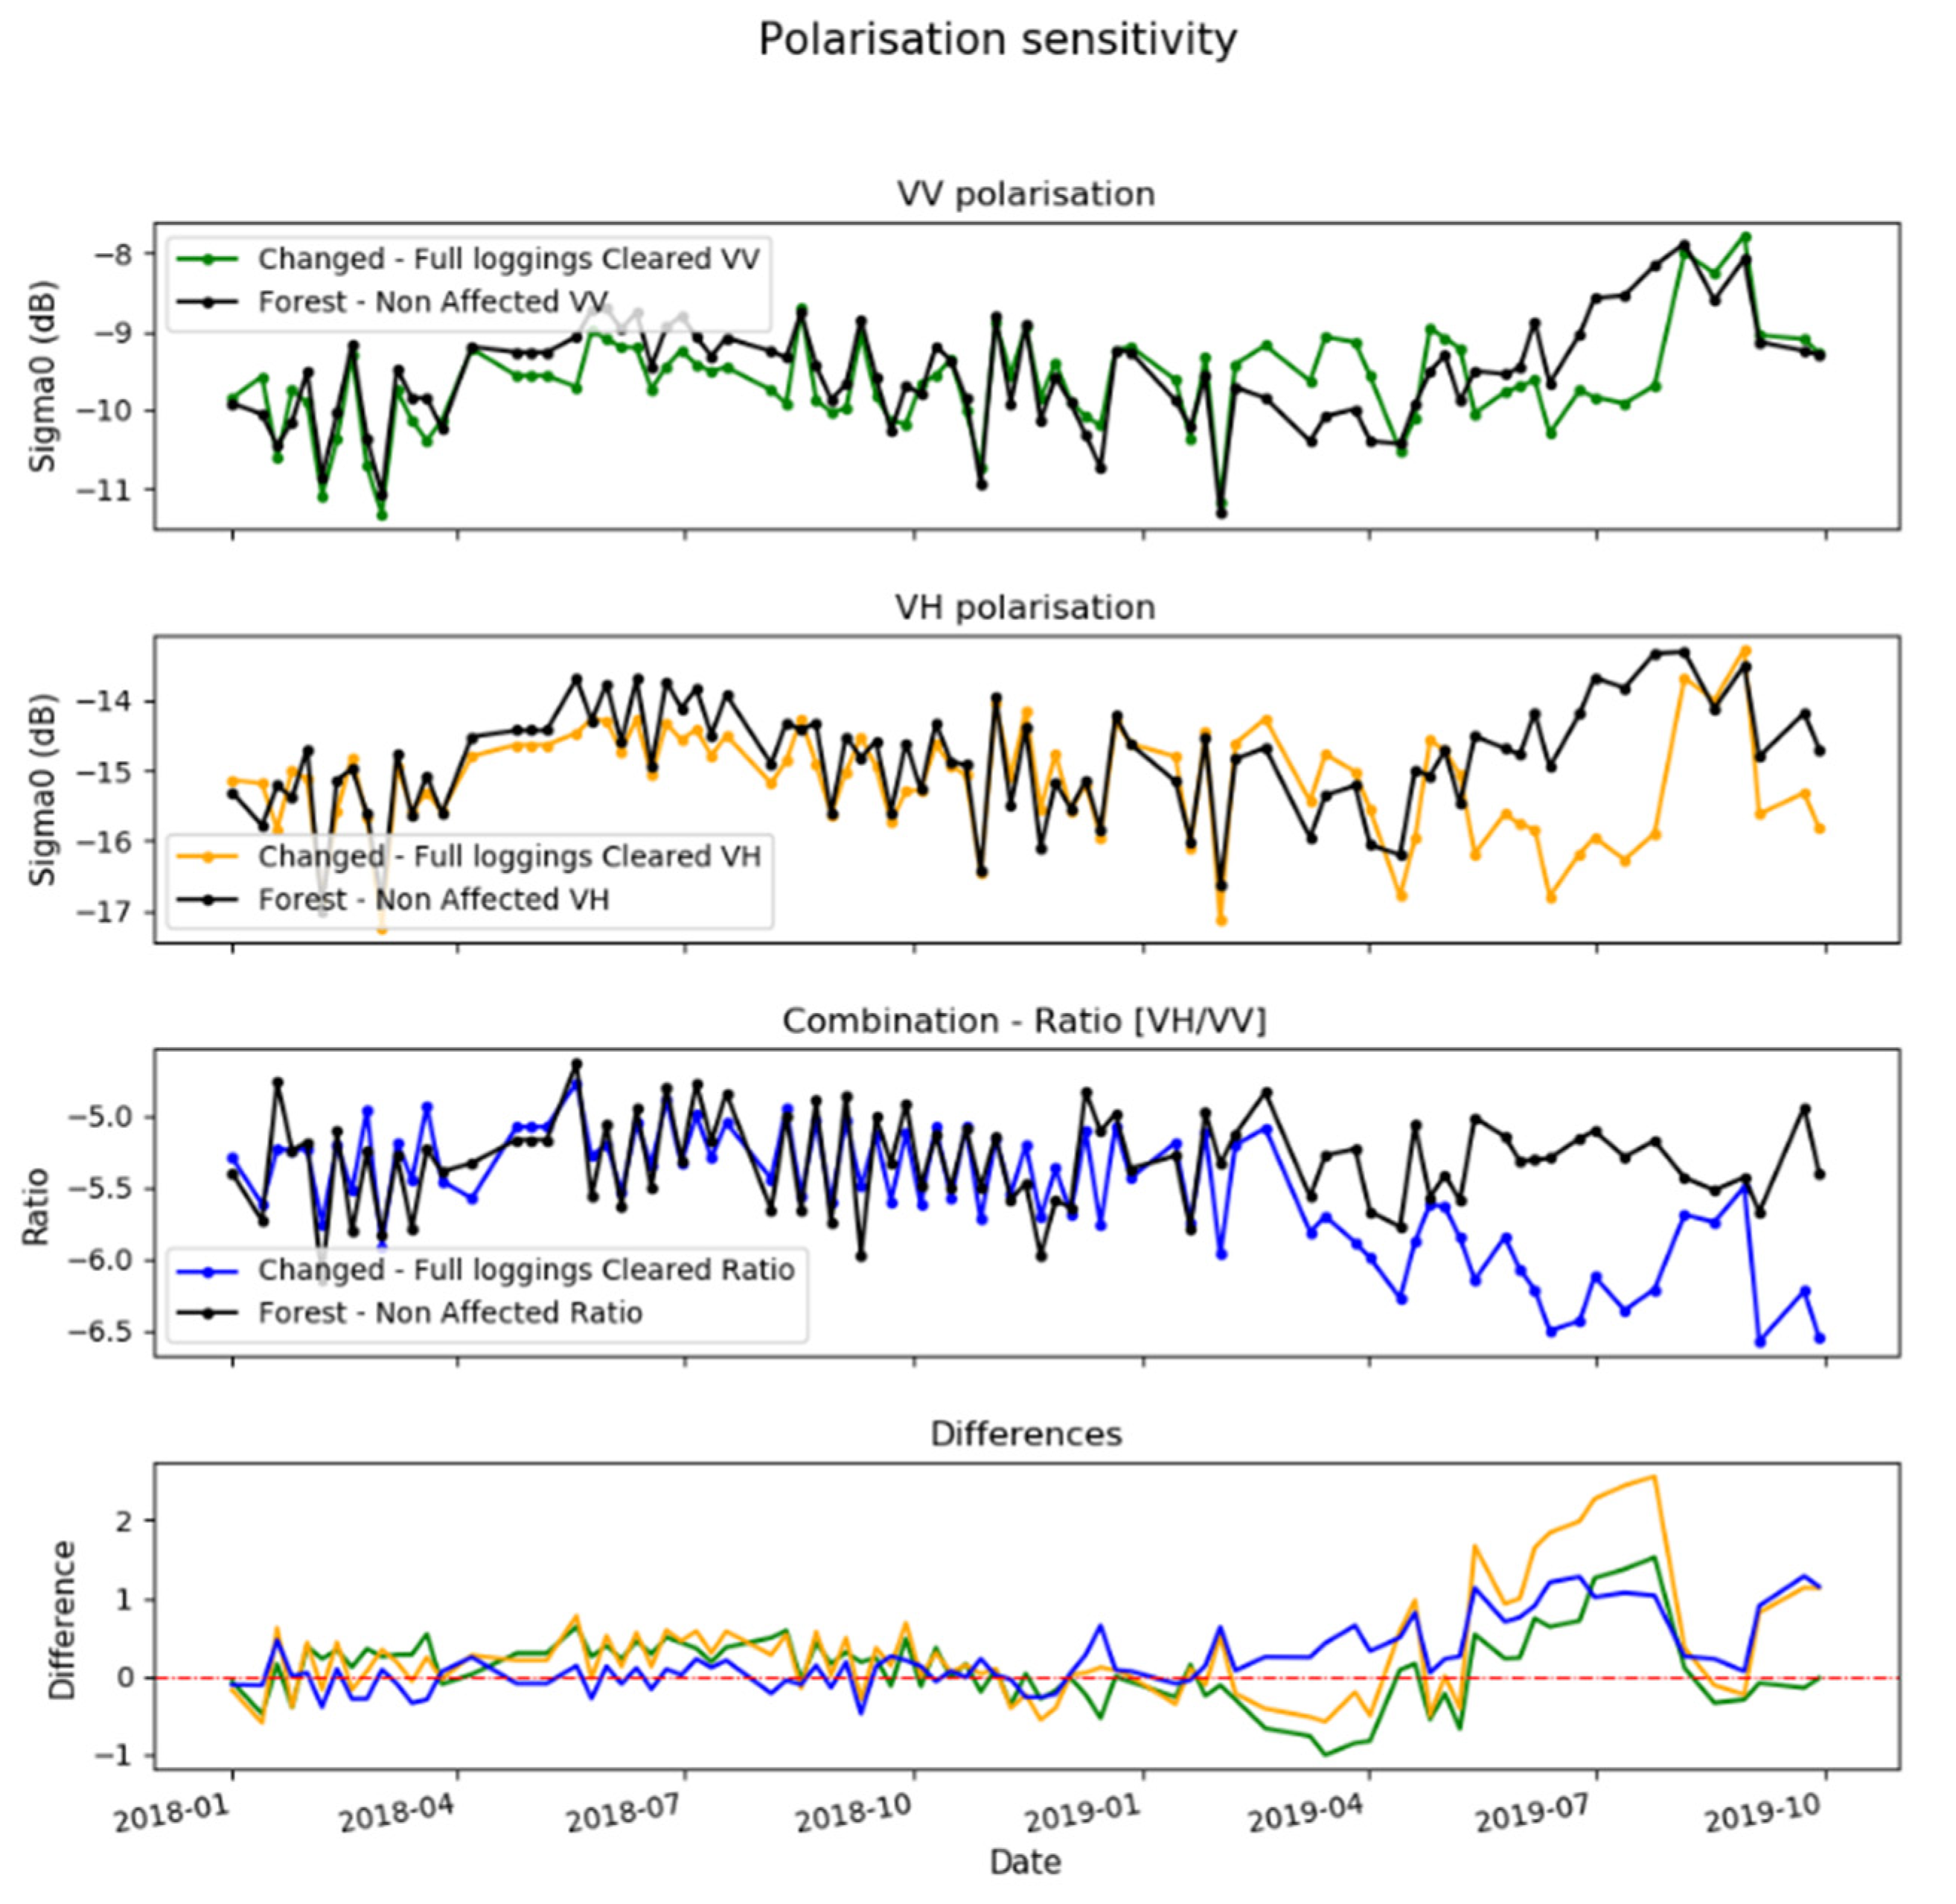
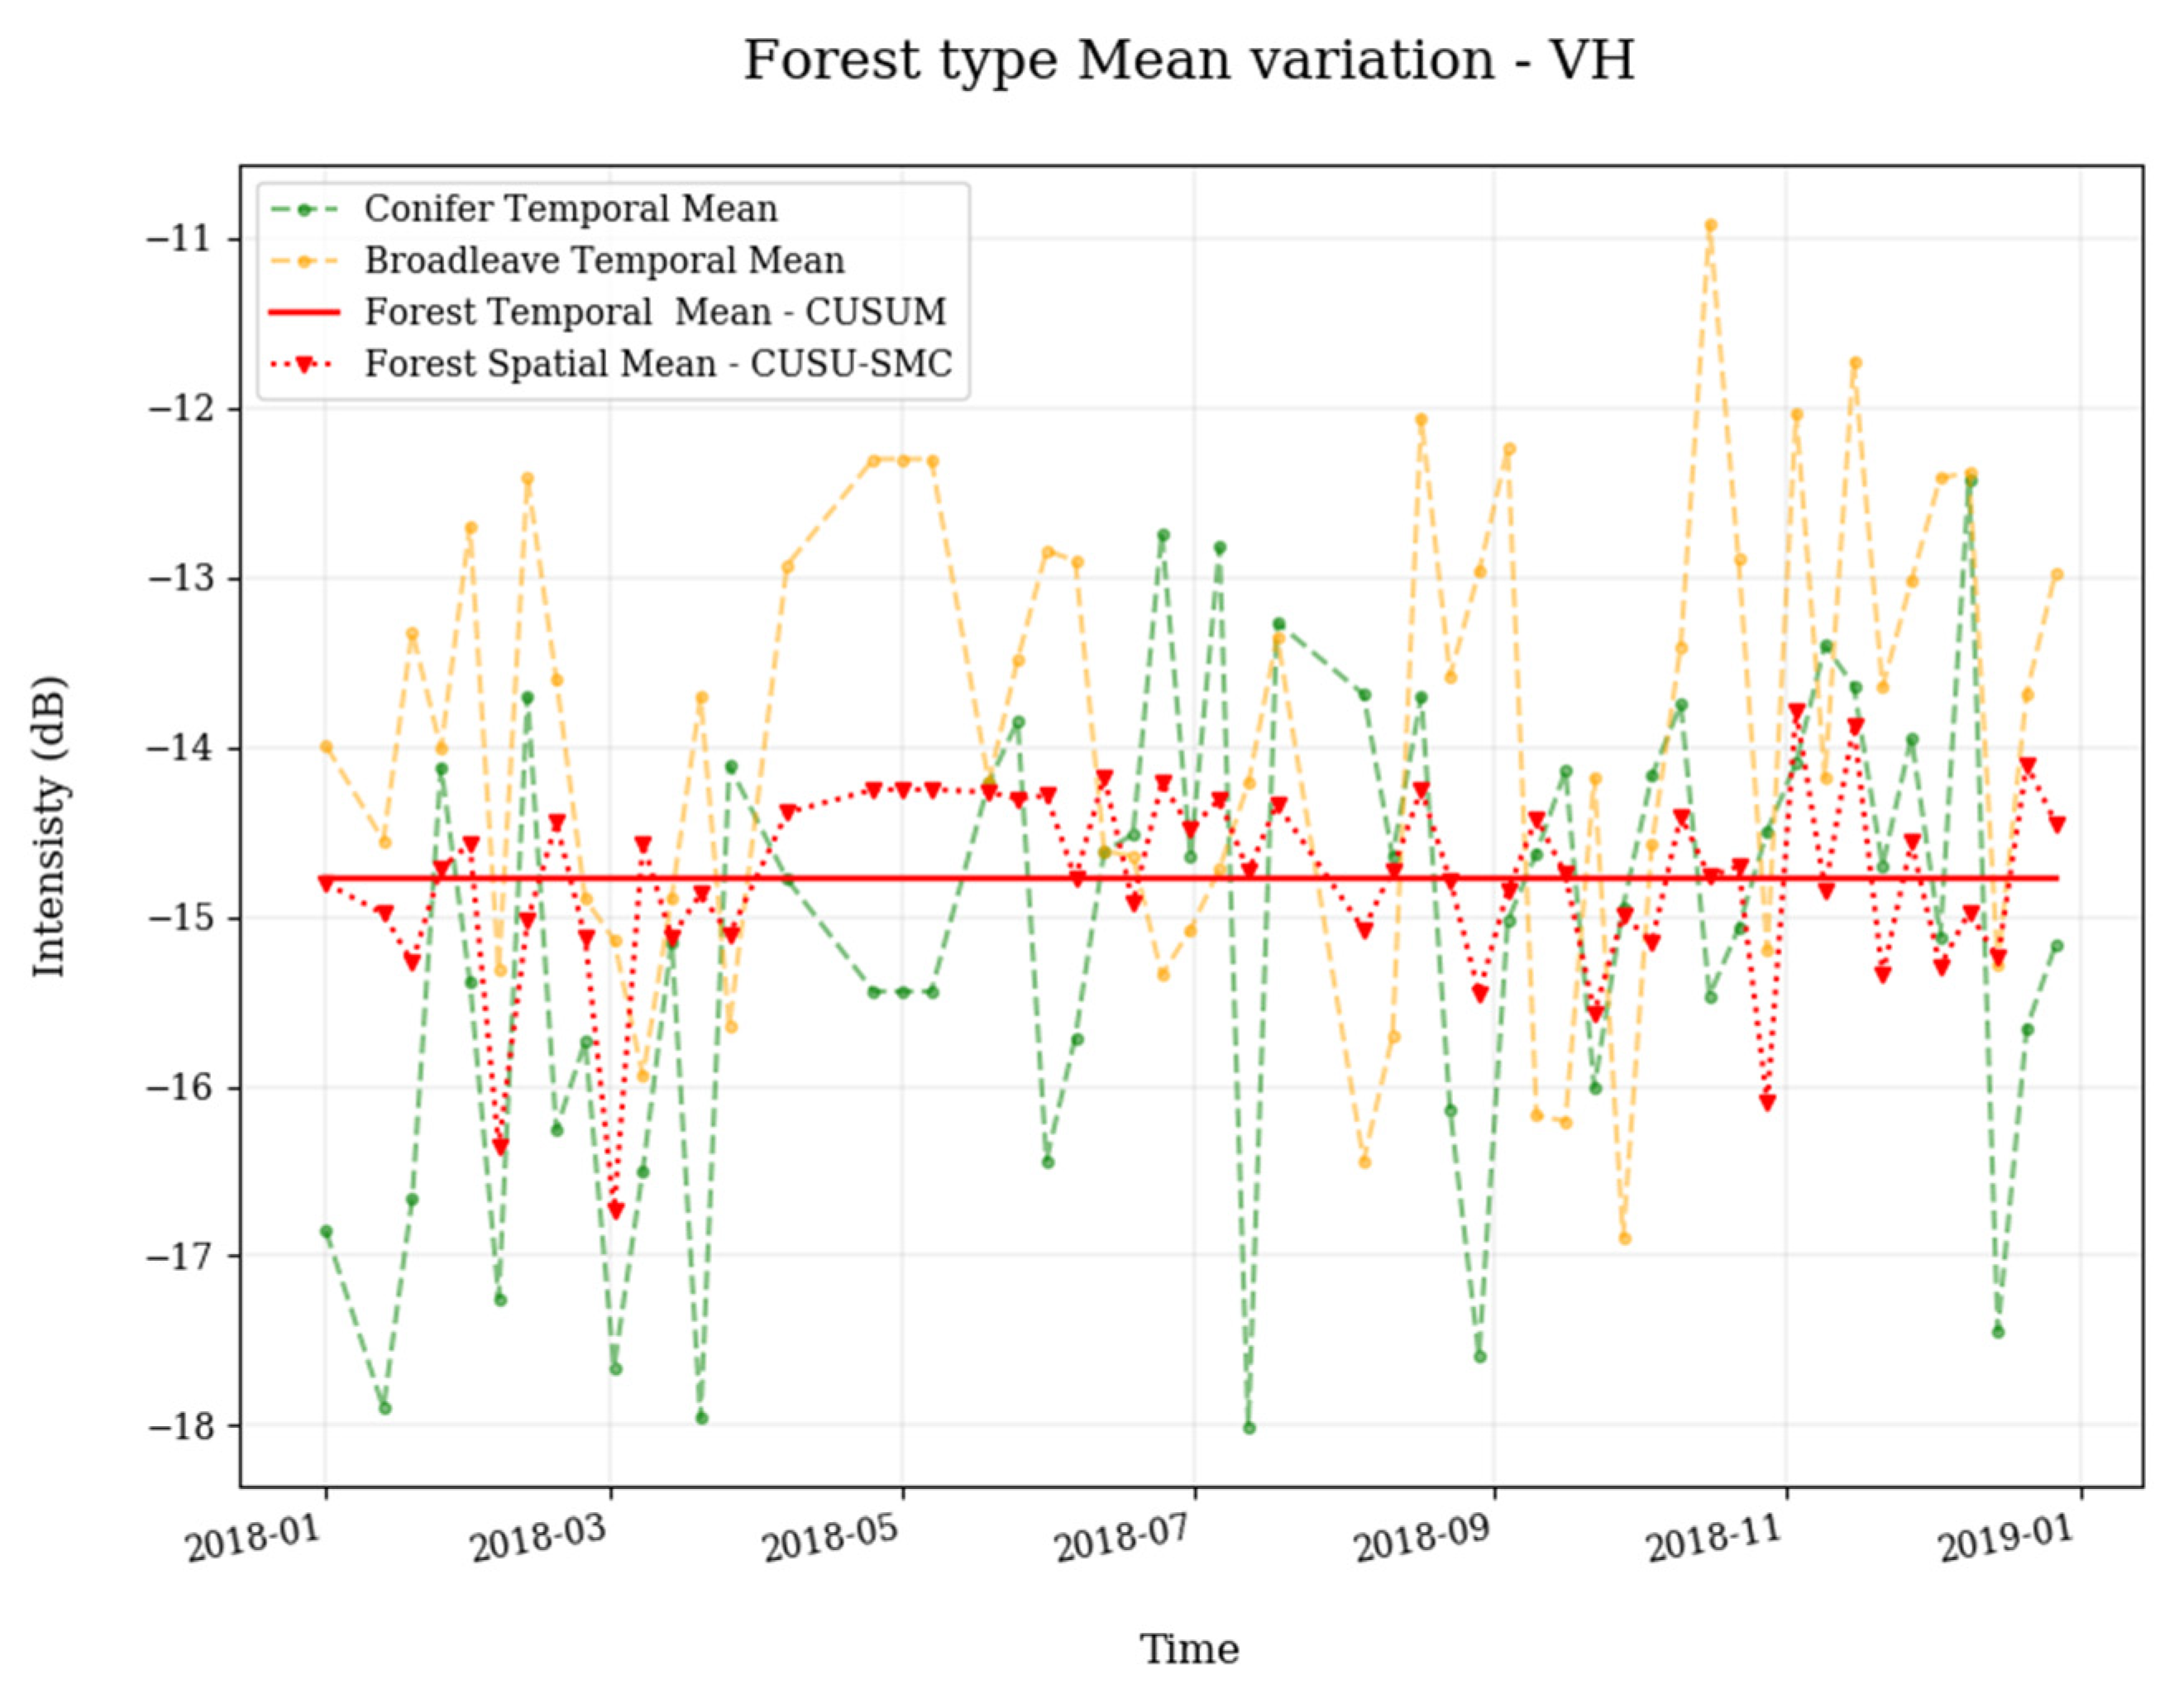
5.1. Trends and Biases of CUSUMs

In this section we want to validate the CUSUM [46] and compare this with the new CUSU-SMC. As explained, the main difference is in the use of a spatial mean instead of a temporal one.To demonstrate the results, in the following we will plot the CUSUM and CUSU-SMC using the polarization ratio only. Other polarization channels show similar behavior. Figure 4a presents the CUSUM over three plots for three classes, “change”, “conifer”, and “broadleaves”. In this test the training was done using the 2018 data (54 dates). As can be seen in Figure 4a, all the lines seem to converge to zero after exactly one year and then diverge afterwards. This is due to a mathematical constraint that forces a value of zero when the CUSUM is calculated for exactly 54 dates. The equation used to calculate the CUSUM is linear and we get zero when the added part equals the mean:
C U S U M 54 =   i = 1 N [ I i 1 M j = 1 M I j ] = 0 , f o r   N = M = 54
As a comparison Figure 4b presents the proposed CUSU-SMC over the same regions for the three classes, “change”, “conifer”, and “broadleaves”. This figure shows that CUSU-SMC seems to slowly, but constantly, diverge for each of the classes. This observation can be made for almost all the pixels in the image. This is because some pixels will naturally have a backscattering which is higher (or lower) than the mean I ¯ s due to different forest structures. The constant change will act as a bias and accumulate over time forming a ramp. Since most of the pixels present different forest structures they will all show a ramp.
Since the differences act as a constant bias the trend is approximately linear (i.e., this is the function with a constant gradient). We can easily estimate the line of best fit for the temporal trend during the training dataset and remove it for the rest of the time series. After removal, the CUSU-SM pixels will be fluctuating around 0, unless there is a change. Figure 4c shows the result of CUSU-SMC (after correction), where the ramp did not remove the change because it is estimated over the training dataset where no changes occurred.Moreover, It should be noted that the corrected trends are not constrained to be zero at the end of the training interval. The change that they show is what was actually accumulated compared to the rest of the forest.
One rational for using the spatial mean is that in theory this will help remove anomalies due to meteorological conditions or forest phenology. Since the weather and phenology will affect all the surrounding forest in a roughly equal way, this will modify the spatial mean that we calculate and therefore the weather signal would be removed. This procedure may be seen as an attempt to calibrate the data based on the weather condition. Of course, there will still remain some random fluctuation, due to the fact that some forest species may not change backscattering in the same way compared to other forest stands. However, this should be a second order error, that could be eventually corrected if we have, either an accurate forest inventory or a good model to predict more accurately the change of the forest behavior due to weather conditions.

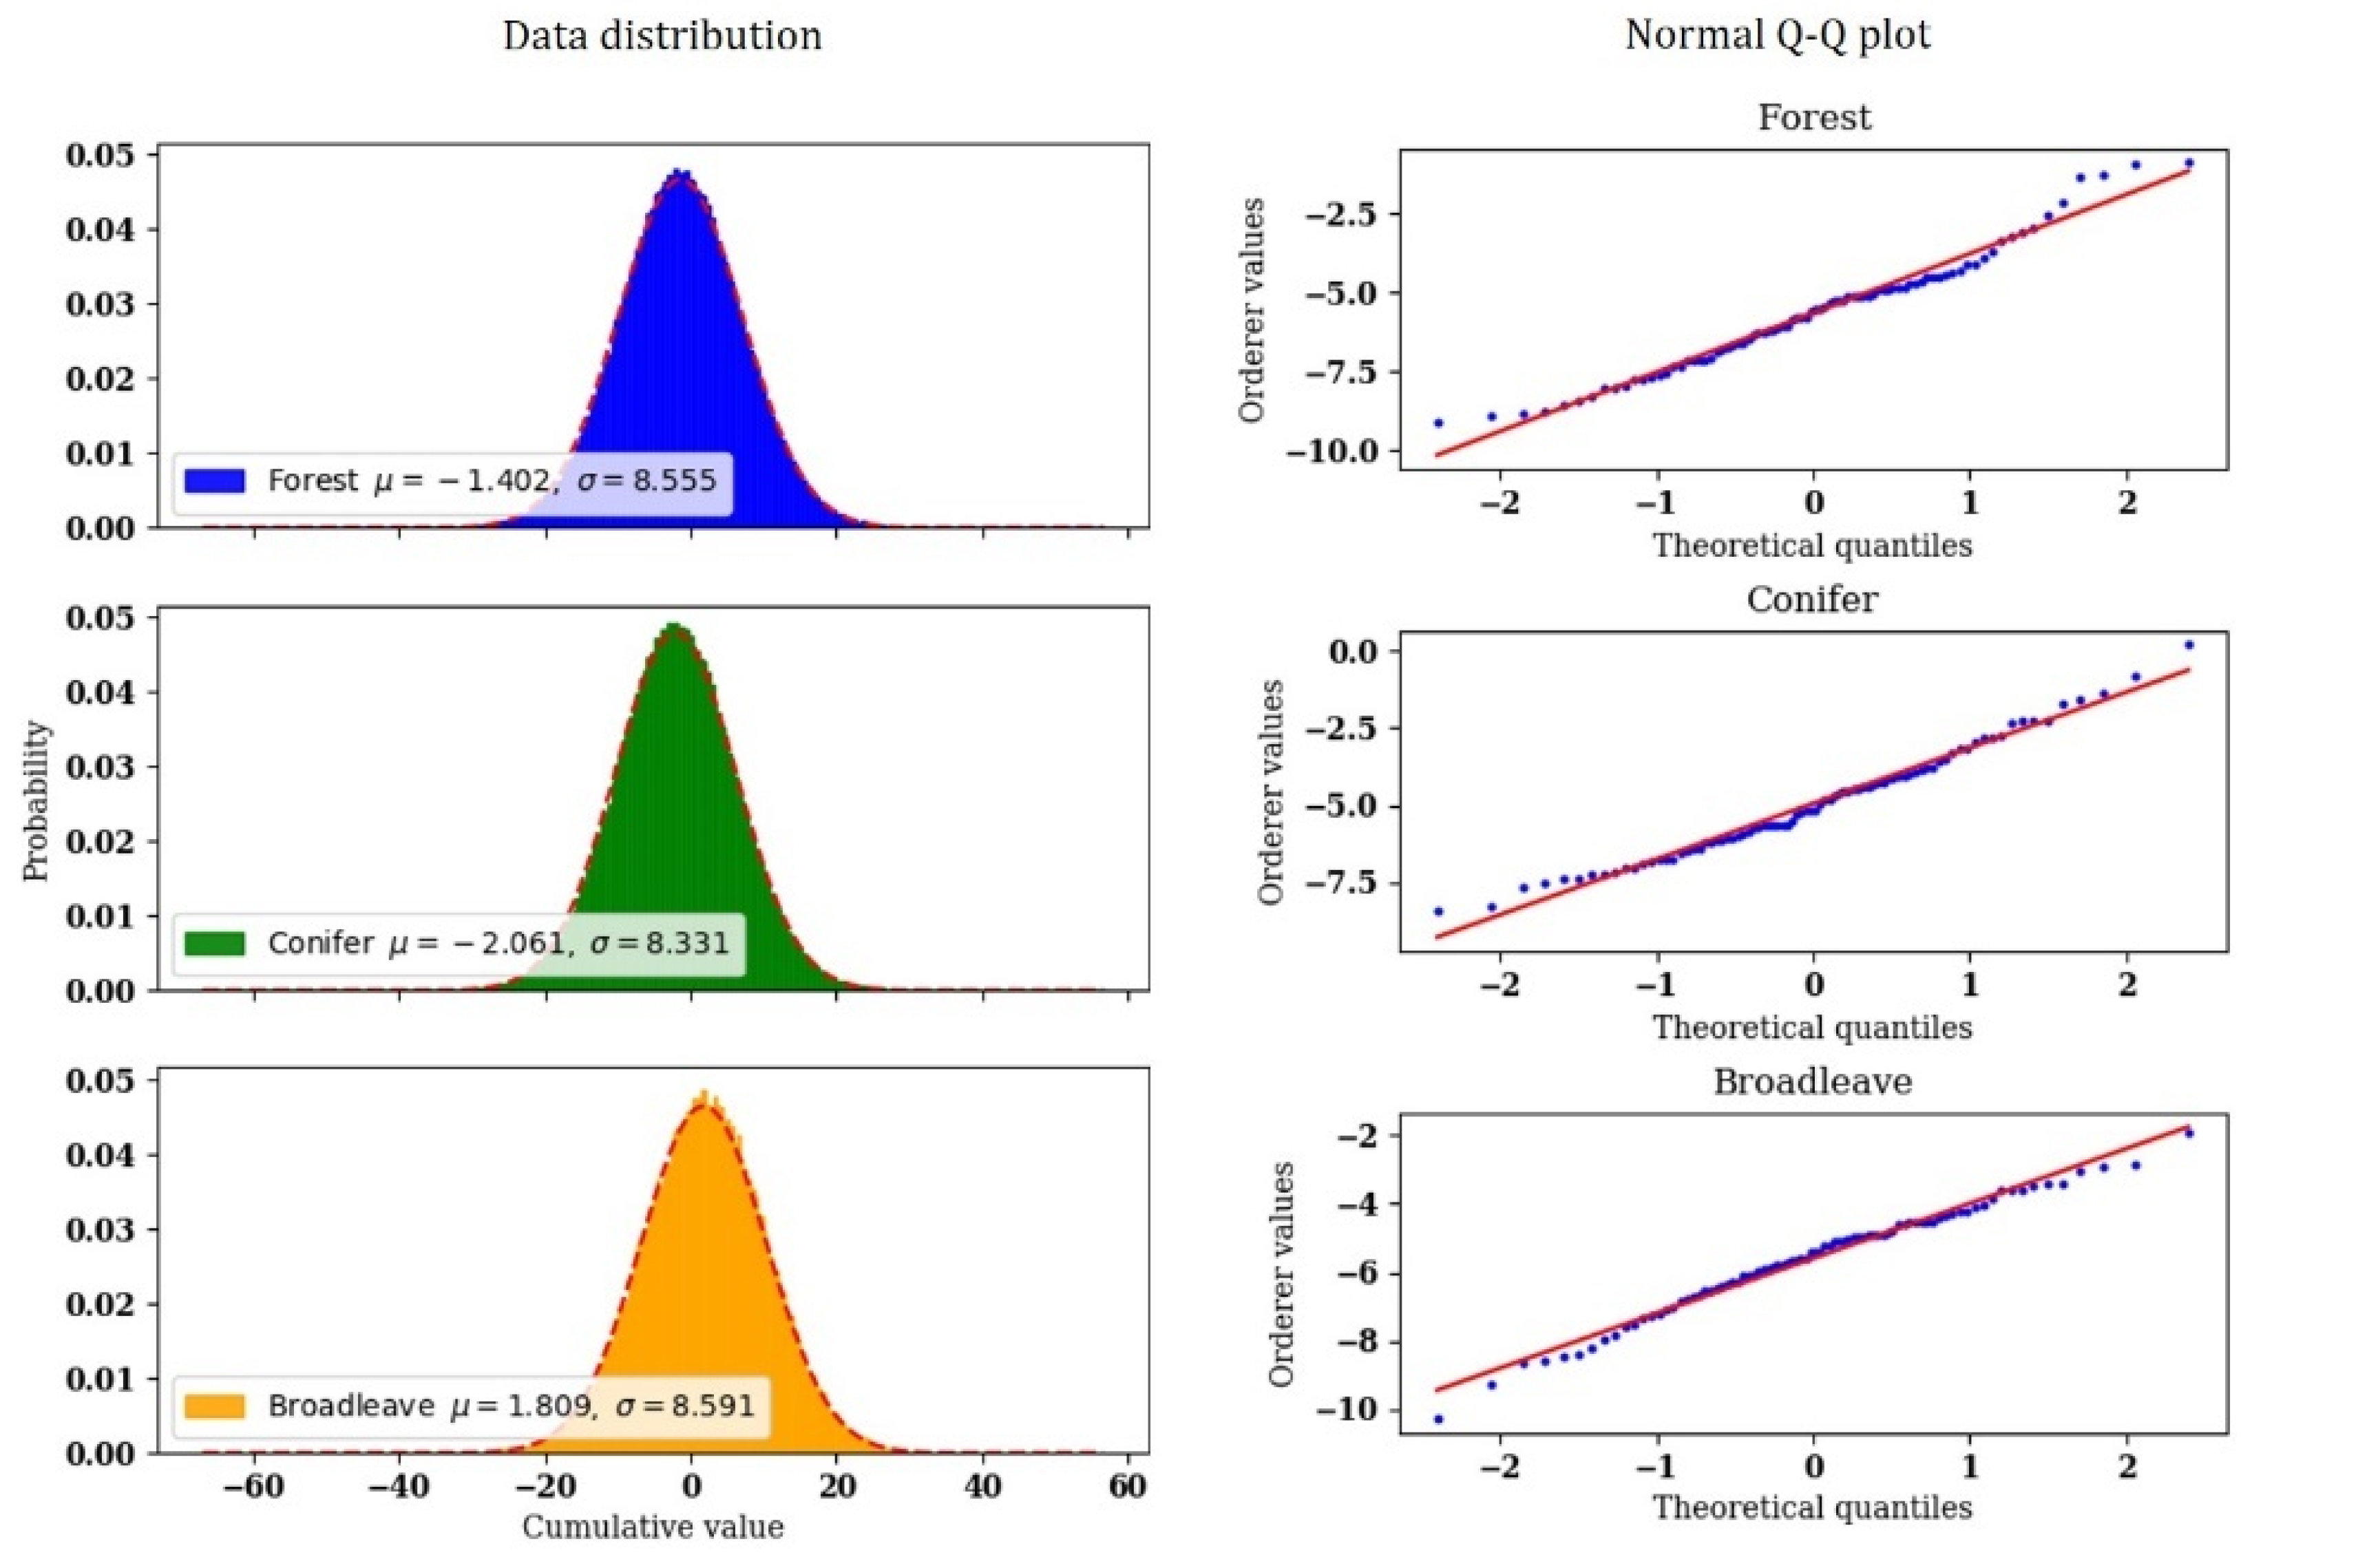
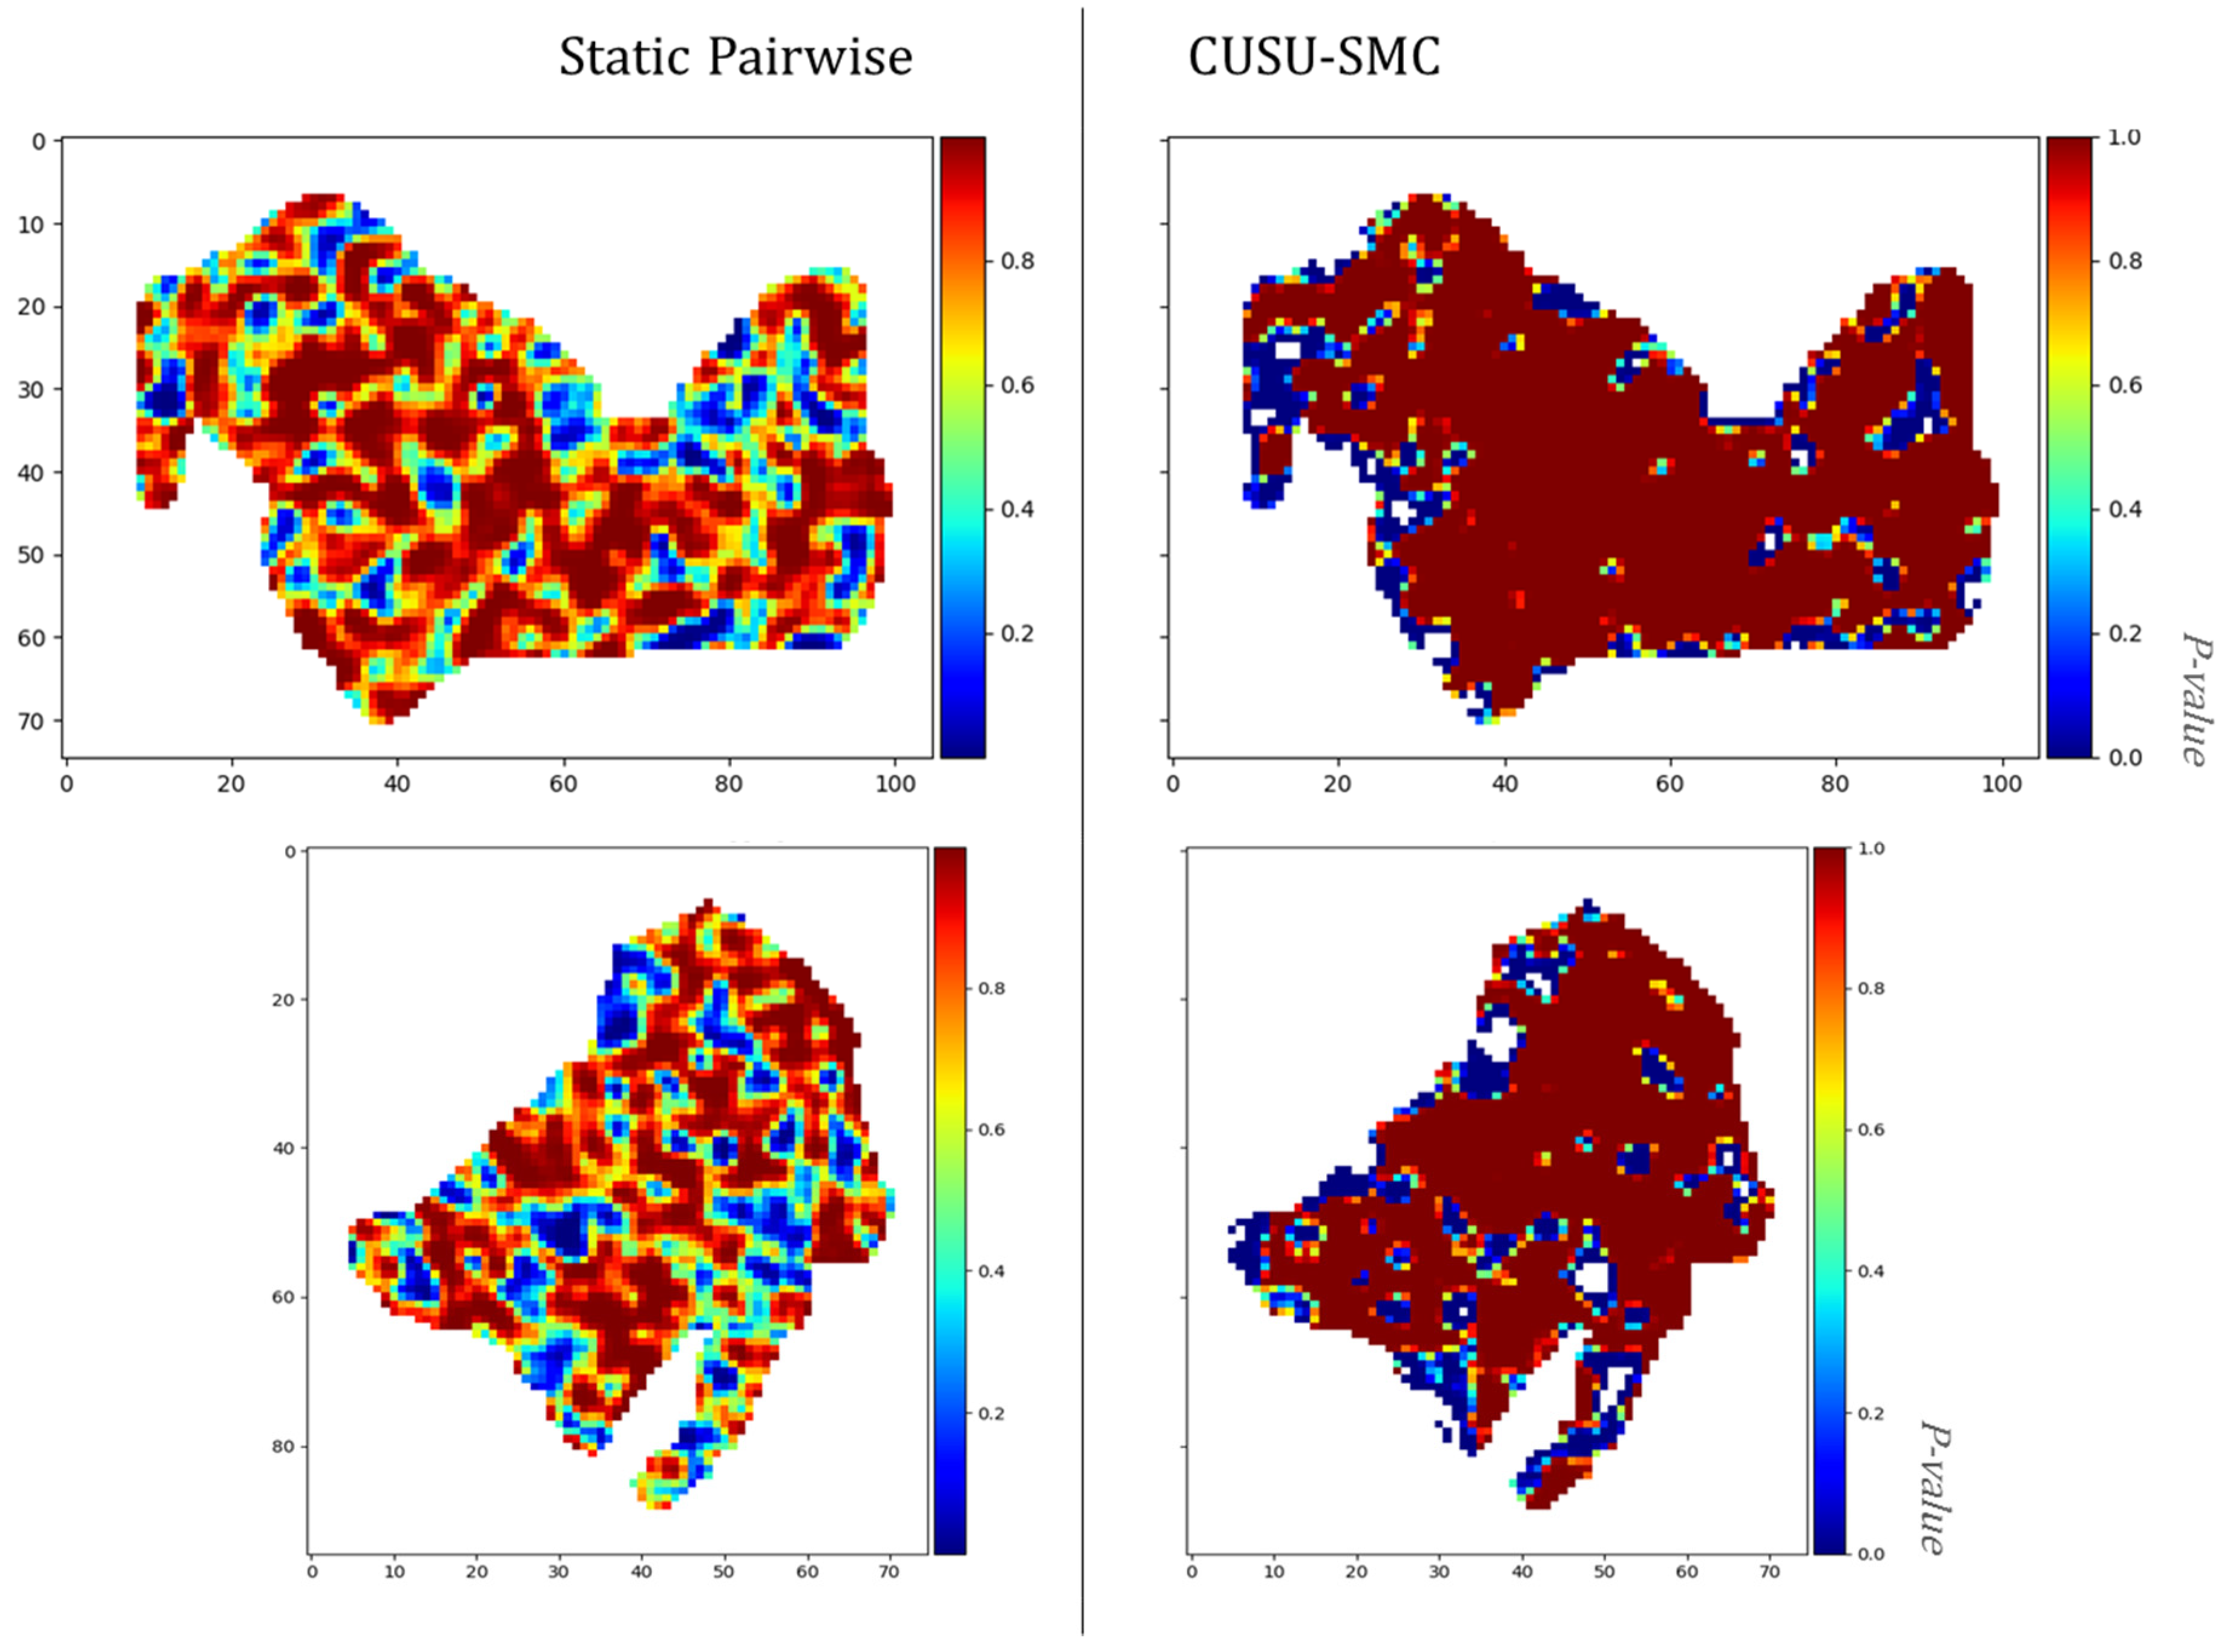
5.2. Testing the Assumptions

In this section we want to test the assumption that the CUSUMs obey a Gaussian zero mean distribution. We decided to determine normality by investigating graphically the output of data histograms and quantile–quantile plots. The results obtained for each of the three classes “forest”, ”conifer”, and “broadleaves” provided enough evidences to ensure the data is normally distributed. As can be seen in Figure 5, histograms highlighted a close approximation of the data to the theoretical bell curve distribution; while in the Q–Q plots data points appeared closely distributed along the diagonal line.

5.3. CUSUM Logging Activities Detection

The results obtained from the accuracy assessment showed an optimal change detection performance, for both the CUSUM and the CUSU-SMC. The accuracy assessment was carried out by using multiple significance levels in order to test the performance of the methods. Despite different results being obtained for each level of significance, we decided to set alpha = 0.05 as the most appropriate value for comparing the tested products. Results are shown in Table 2 from which we can conclude:
(1) Best polarization channel:
Assessing the best polarimetric channel to monitor logging for temperate forest is crucial since previous studies have shown some discrepancy regarding this. Previous work [16,52,53] suggested that co-polarized backscatter (HH, VV) was more sensitive to forest gaps; with other work [44,54] demonstrating higher sensitivity of cross-polarized (VH, HV) for forest structural changes, as a result of the disruption of the high backscatter values associated with the complex geometries of tree canopies.
The temporal trend for VV, VH, and the ratio are showed in Figure 6. Data were filtered with a 3 × 3 boxcar filter. The last row of Figure 6 shows the backscatter differences between the stable forest areas and the logging areas for the VV, VH and its ratio.
The CUSUM method [46], showed the best results for the VH polarization channel (OA = 73.6%; F = 69.5%), providing a medium to high performance in the detection of true positives (TP = 60.2%) and a significantly high performance in the rejection of false positives (FP = 13.0%). Similarly, the proposed CUSU-SMC also showed its higher performance with the VH polarization channel (OA = 65.7% and F = 68.0%), offering a high performance in detecting true positives (TP = 72.4%), but a relatively high false alarm rate (FP = 40.6%). The ratio (VH/VV) combination provided a good performance for both CUSUM (F = 68.7%) and CUSU-SMC (F = 67.4%) methods. Finally, the impact of ground on the co-polarized channel (VV) provided the lowest separation between forest and deforested areas.
(2) Detection strategies:
Despite the similar overall performance observed for both CUSUM and CUSU-SMC, we found a notable difference in terms of true positives and false alarms. Specifically, the CUSU-SMC showed a much higher power of the statistical test, which means it is much more capable of detecting true positives, but it also had an increase of true negatives. Given that the total OA is similar, we can identify two main detection strategies as: (a) conservative strategy (*C); this leads to low false positive rate, but also lower true positive; (b) tolerant strategy (*T); this leads to higher true detection rates at the expense of having more false alarms.
In Table 2 we identified the algorithm and polarization channel that would lead to best results for one of the two strategies.
(3) Improvement of correction for CUSU-SMC:
The correction for the constant bias applied in the CUSU-SMC approach, provided a significant improvement in the detection performance (OA = +5%, F= +4.3%), as a result of a considerable reduction of the false alarms rates (FP = −6.7%) (see Table 2, *NC). It is therefore important to apply this when using the CUSU-SMC.
The similar F-score obtained for CUSUM and CUSU-SMC (F-score differences of 2.1%) may inform us that correcting for seasonal trends does not improve the detection. This could be explained by the stable behavior of the radar backscatter signal observed for forest areas. This behavior was also observed by Quegan et al. [55], who found that old forest exhibits a lower seasonal variability than younger forests. To check this point in Figure 7, we plotted the single temporal mean (CUSUM method) and the spatial forest mean (CUSU-SMC method) as time trends, where the single temporal mean was a constant in the plot. The different curves represent conifer and broadleaf forest stands. It can be seen how conifer and broadleaf plots present opposite behaviors, in terms of time trends. The spatial forest mean averaged over all the trends, and therefore these temporal trends are averaged out. If the forest inventory is large enough, calculating the spatial forest mean over different forest types may improve the final detection.

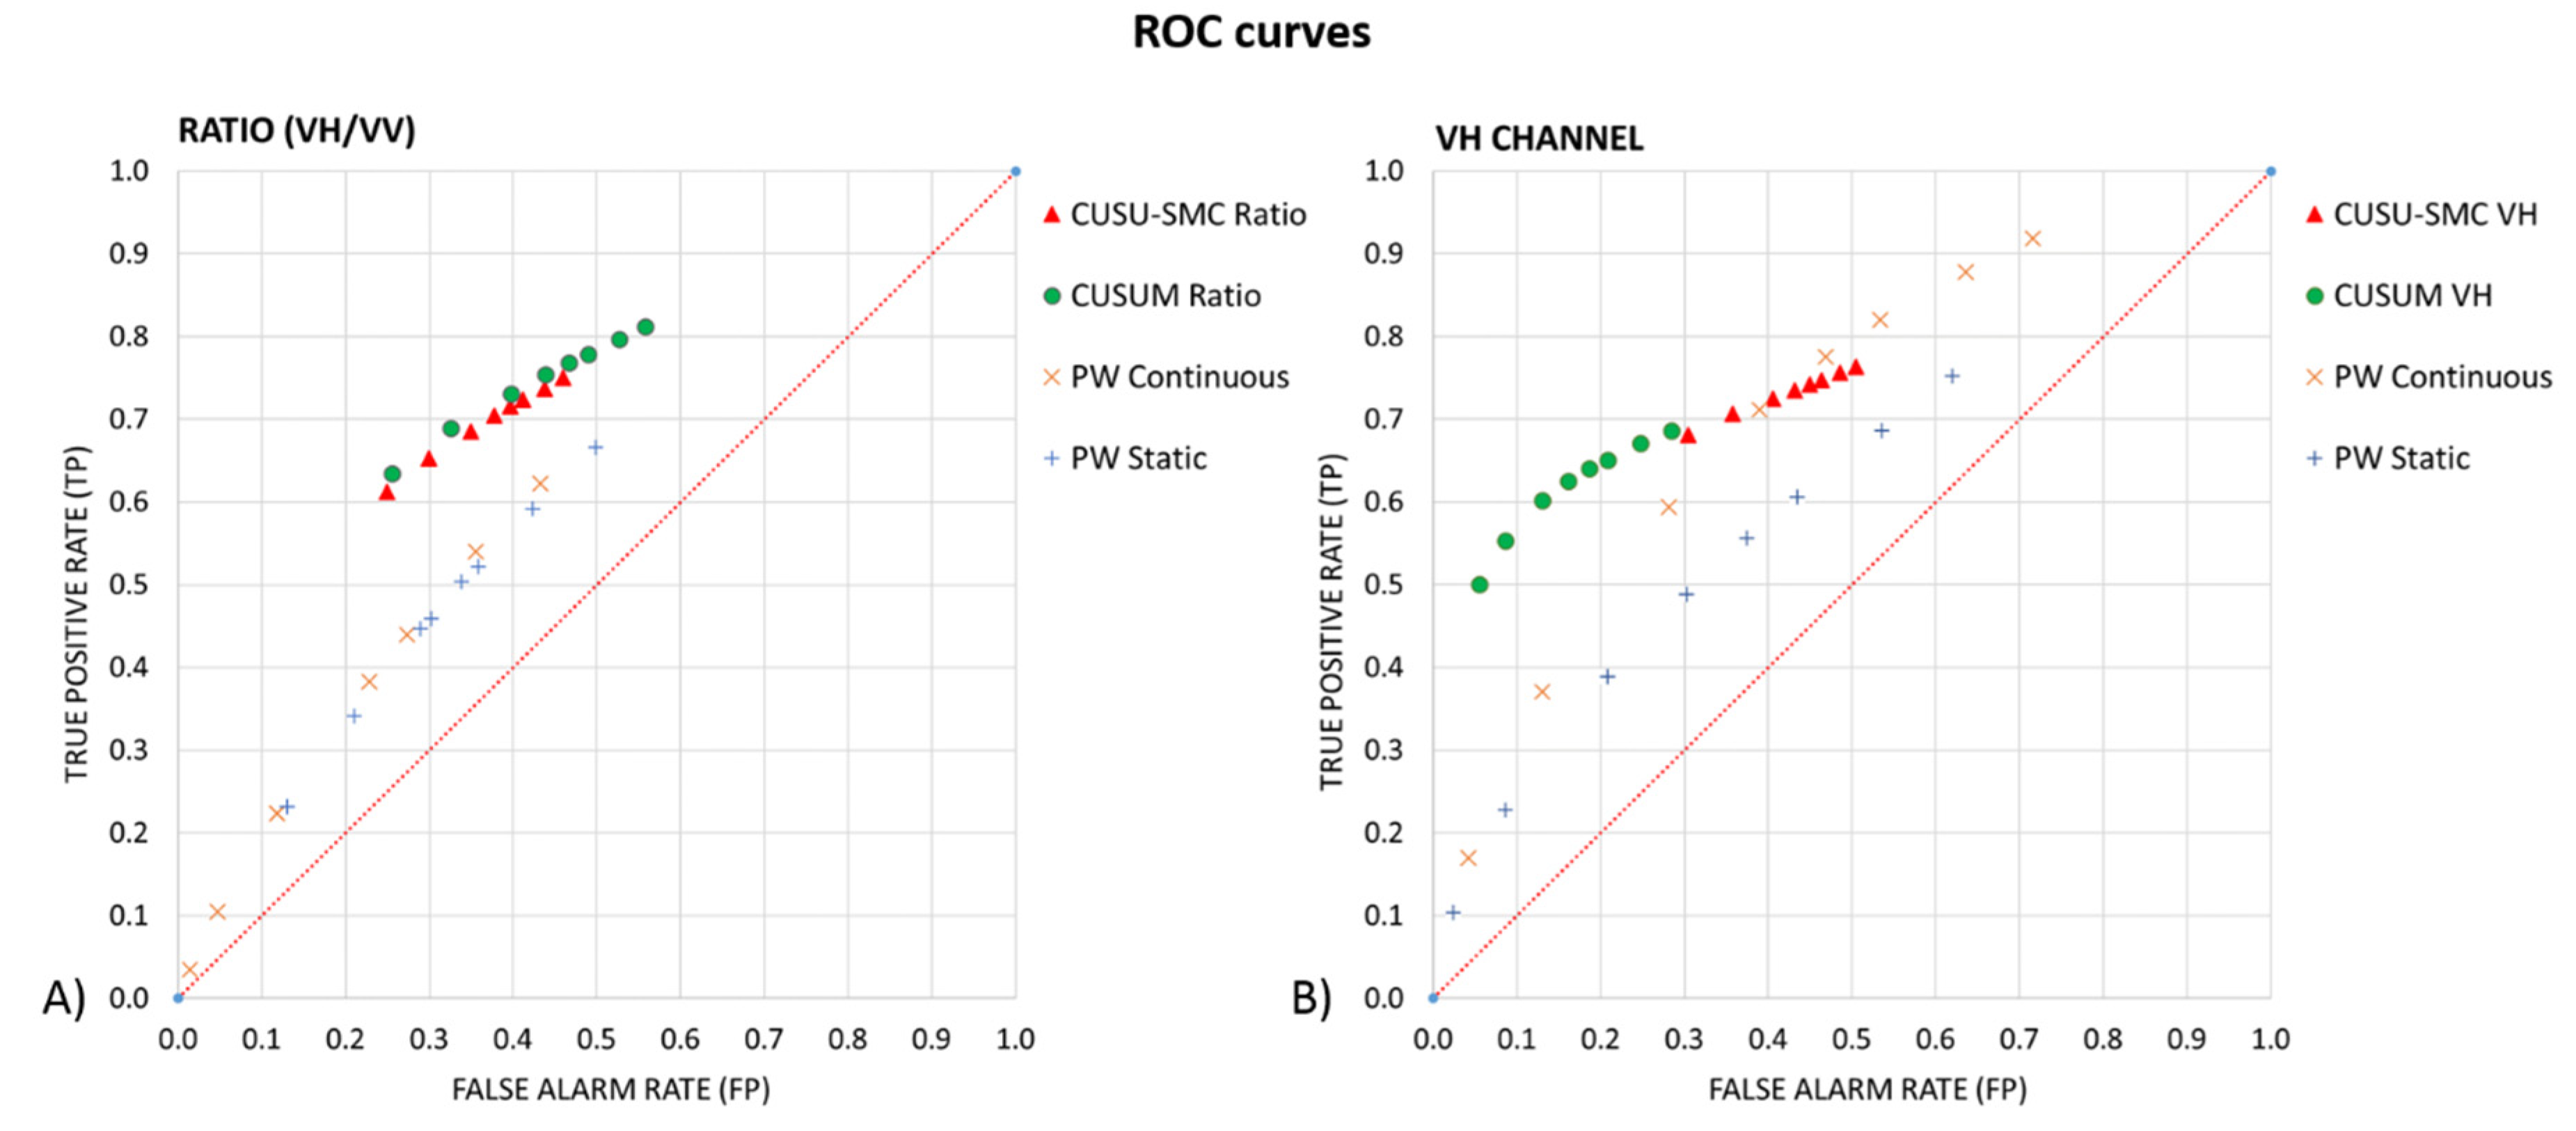
5.3.1. Comparison with Pairwise Analysis

In order to compare the CUSUMs performance against pairwise combination we considered two different approaches:
  • Continuous pairwise. This approach aims to generate a continuous change analysis based on the comparison of each image present in the timeseries to the image acquired three times before.
    P a i r w i s e i = I i ( I i 3   ) f o r   i = 1 ,   2 , ,   N t
    where, i is an iteration over the temporal axis of the cube. Nt is the total number of acquisitions used in the training dataset. The image I used for the analysis corresponds to a channel, or the ratio after applying a boxcar filter (window size = 3).
  • Static pairwise. This methodology follows the common direct pairwise change detection, by which two acquisitions separated in time by a specific event (clear-cut activities in our study case) are directly compared. Considering that all logging activity studies were carried out between 1 December 2018 and 20 June 2019, we have used the image acquired on 3 November 2018 as the reference image (pre-event), and the last image of the timeseries acquired on 29 September 2019 as the change image (post-event).
The results obtained for both pairwise methods are shown in Table 3. It is clear thatthe pairwise method had a significantly lower performance in the detection of logging activities when compared to the proposed CUSUM and CUSU-SMC methods. The low detection performance may have been due to the high signal variation that SAR images may have on single dates. Minor changes to weather variables (e.g., rainfall, temperature, wind) or to vegetation phenology may lead to significant misclassification errors.

5.3.2. ROC Curves

Although the Gaussian model fits very well the CUSUM values for no-change, it is still important to check that it is not the statistical model adopted that is producing the different performance, but the framework to process the SAR data. We therefore analysed the receiver operating characteristic (ROC) curves [56], which are independent of the selection of the threshold (and therefore the significance level). Figure 8 presents the ROC curves of both continuous and static pairwise approaches, CUSUM, and CUSU-SMC using VH polarization and ratio (VV has not been shown due to its significantly lower performance). ROC curves plot the true positive rate against the false-positive rate while the threshold is varied and have been widely used for change detection performance comparisons in multiple scientific disciplines [57]. The closer the ROC curve is to the upper left corner, the higher the overall accuracy of the test [58]. In our test, detection performance was tested over multiple significance levels (0.4, 0.3, 0.2, 0.15, 0.1, 0.05, 0.01, 0.001). A higher detection performance was obtained by both CUSUM and CUSU-SMC, which show a similar pattern. Using the ratio, the pairwise approaches always show lower detection accuracy, while using the VH channel the pairwise gives similar performance when the probabilities of false alarms is very high (higher than 0.5).

5.3.3. Final Detection Mask

The differences between CUSUM and pairwise are also clearly noticeable in the final detection maps. Since the detector we developed is statistical, we can also attach probabilities to the change. This therefore helps evaluate how confident we are that a change is genuine.
Figure 9 compares the change detection map of static pairwise against the CUSU-SMC method for two study areas affected by clear-cuts. The change map for the CUSUM is very similar to the CUSU-SMC and therefore has not been presented here. As can be seen, CUSU-SMC offered the best performance, detecting almost the entire affected area in a homogeneous way, with only a lower detection capability observed at the edges. On the contrary, the pairwise analysis identified a significantly smaller area of change, being those changed areas detected in a scattered way. Additionally, the pairwise approach showed overall lower probability values, a fact which manifests the lower power of the test.

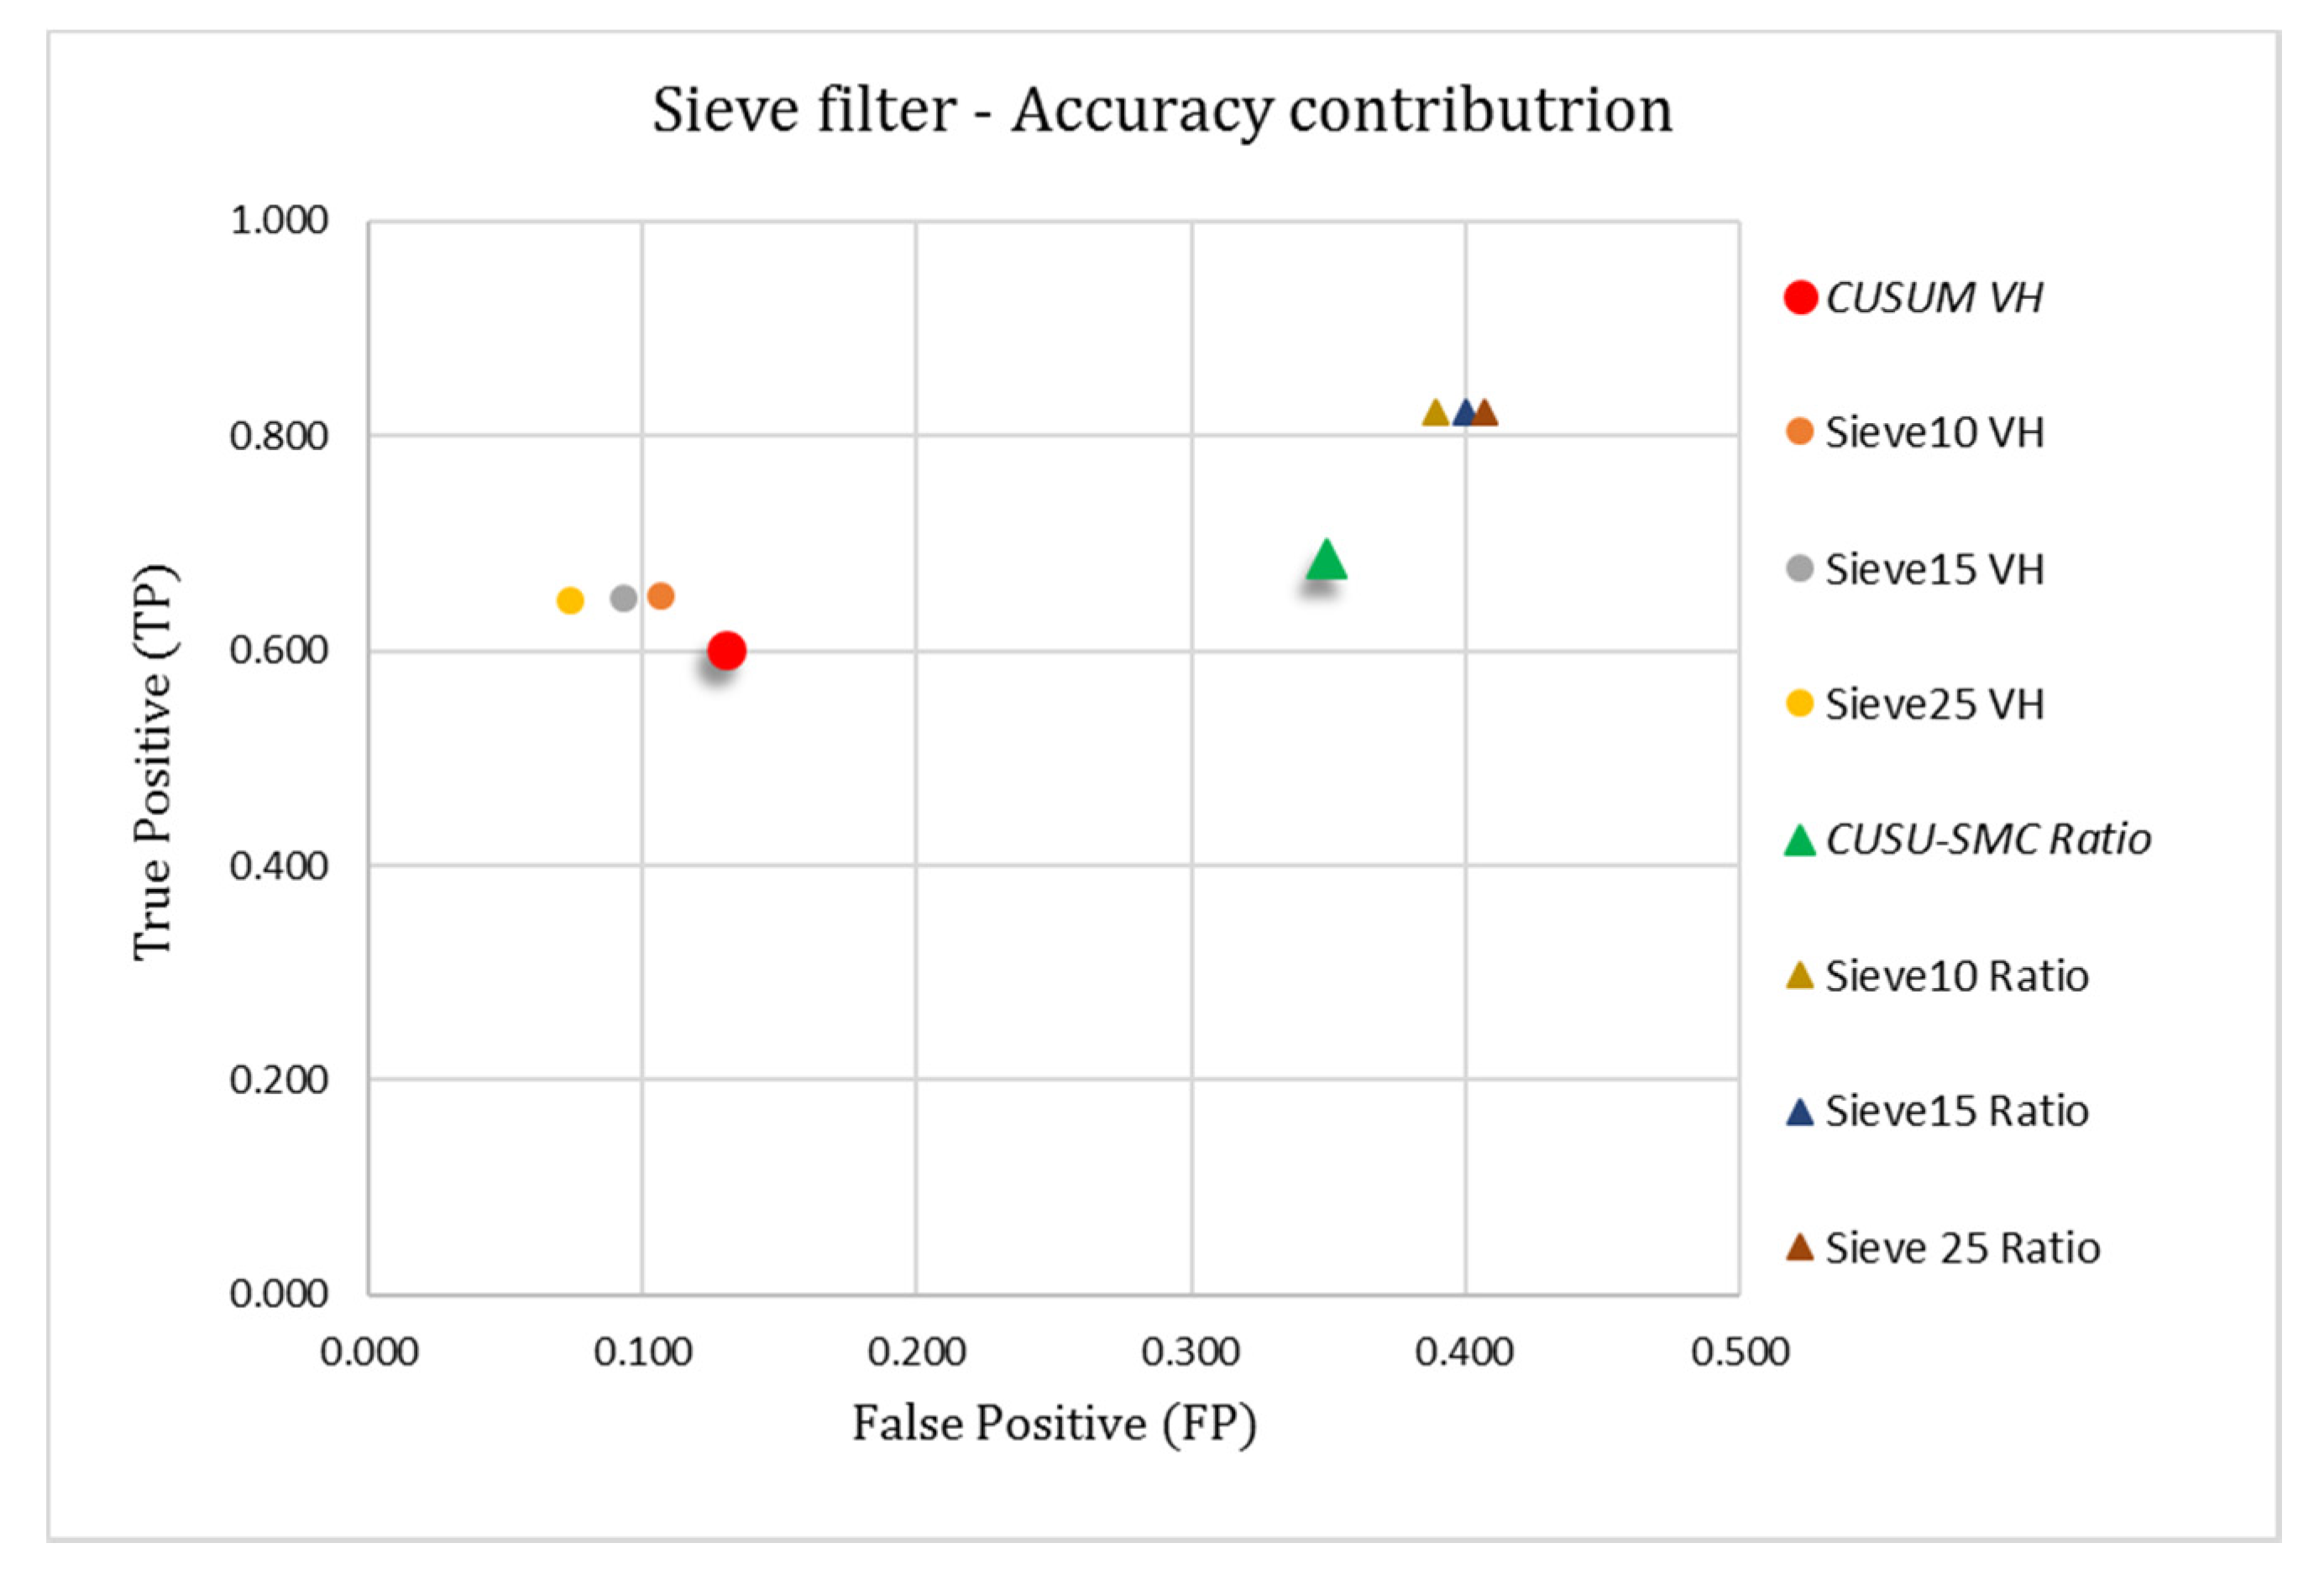
5.4. Post-Processing Sieve Filter

Table 4 shows that the sieve filter produces a significant increase in the detection accuracy as a result of a reduction of false alarms. This spatial filter added between 3.6% to 5% to the overall accuracy and 3.5% to 7% to the F-score; this improvement being greater with a smaller filter size of 10 connected pixels. Contrary to Rüetschi et al. [16], our results suggest that the use of wider windows would result in a more inefficient performance of the detector, since, considering the accuracy/resolution trade-off, the slight accuracy improvements would not compensate for the loss in spatial resolution. We believe that the best filter size is a function of plot size and logging extent, and therefore needs to be set using knowledge of the area.
The sieve filter also provided a considerable improvement in visual interpretation, since cleared areas could be distinguished more readily due to the high, and continuous, aggregation of ’change’ pixels and the significant enhancement of the polygon edges. Finally, Figure 10 shows the influence of the sieve filter on the final change detection accuracy of both the CUSUM and CUSU-SMC methods using ROCs.
.

5.5. Forest Logging Detection Maps with Sieve Filter

In Figure 11, the final change detection maps show the capabilities of the cumulative sum to detect logging activities. Despite the high presence of isolated false positives in forest areas, all clear-cut areas are distinguishable. The implementation of the pixel connectivity sieve filter significantly helped to remove those flagged pixels, which were likely caused by environmental factors (e.g., meteorological condition variation). This step contributed to the refinement of the final product by generating a better representation of the disturbed areas, while improving the overall detection accuracy rate.

6. Discussion

The results of this study indicate that the proposed method, which is based on the analysis of dense SAR timeseries by the cumulative sum test, detects forest logging activities in a continuous way, with similar spatial accuracy to previous forest change detectors [16,31,54,59]. The analysis of SAR temporal backscatter signal showed significant differences between felled areas and intact forest areas. Despite these differences, observed in both polarizations, the cross-polarization (VH) channel showed the higher sensitivity to forest structural variations, providing the best change detection performances. From the various parameters and cumulative sum approaches tested, the combination of the CUSUM method with a 3 × 3 mean filter generated the best results, offering an OA = 73.6% and F = 69.5%. The subsequently added sieve-pixel connectivity filter (10 pixels) increased the detection accuracy values to UA = 85.9%, OA = 77.2, and F = 74.0.

6.1. Near Real Time

The proposed method emerges as a valuable forest monitoring tool when it is compared to the existing forest change detector products. The exploitation of dense SAR timeseries for the CUSUMs allows the monitoring of forest structural disturbances in a rapid, continuous manner, which contrasts with the current monitoring methods based on optical systems. Both CUSUM and CUSU-SMC methods allow the gathering of information about changes that extends over long periods of time. This may be significantly helpful when analysing diverse patterns and trajectories associated with those disturbances which can be crucial to forecast future alterations, as in the case of illegal deforestation, agriculture expansion, or risk management. When developing a near real-time (NRT) monitoring tool, low latency is considered as the driving factor for obtaining high temporal accuracies [16,60]. This stands out as the main disadvantage associated with the use of spaceborne optical sensors, since data acquisition is highly limited by cloud coverage. The CUSUM methods have been tested using a repeat-track orbit and single acquisition mode (ascending). For the 22-month study period (1 January 2019–30 September 2020), a total of 84 observations were used (~3.8 img/month). Despite the Sentinel-1 image acquisition strategy allowing a lower latency for the study area (~1 img/3 days), the irregular topography of the region hindered the use of a multi-aspect approach. The utilization of multiple acquisition modes would generate a significant increment in the false alarm rate, caused by the geometrical and signal divergences between different viewing angles. The implementation of CUSU-SMC in flatter areas, would allow the combined use of tracks and orbits (ascending/descending). This approach needs to be further explored in order to assess the contribution of the multi-aspect approach to time detection n performance.

6.2. Adaptability to Other Sensors and Applications (Synergies)

The CUSUM-SMC method enhances the capability of the SAR system for monitoring environmental disturbances over natural ecosystems, thus standing out as a reliable alternative to the current optical-based deforestation monitoring methods [31]. The single requirement of having access to a continuous data acquisition program gives CUSUMs approaches the ability to be easily adaptable to other SAR missions and applications. Apart from the ensured continuity of the Sentinel-1 mission until 2030, there are other SAR missions whose image acquisition programs would allow the implementation of this method. The C-band RADARSAT Constellation Mission (RCM), operational from November 2019 and with a lifespan of 7 years, will provide additional C-band data with a revisit time of 4-days [61,62], a fact which will contribute to shorten the times between acquisitions [16]. Moreover, the recent announcement of the future free-data policy of ALOS-2/(ScanSAR), the upcoming ALOS-4 L-band (launch date: 2021), and NASA-ISRO (NISAR) L,S-band (launch date: 2022) SAR missions might serve to enhance the performance of the CUSUMs, due to the higher sensitivity that longer wavelengths have to structural forest disturbances [17].
With respect to adaptability to other environmental monitoring applications, this method shows high versatility. The ability of CUSUMs to detect disturbances in a continuous manner makes it potentially suitable for other applications (e.g., flood mapping, coastal erosion, land degradation) characterized by high dynamicity in the environment.

6.3. Limitations and Future Work

The area of study used for this work may have led to underestimations in terms of the potential capabilities of the algorithm. Aspects such as the irregular topography of the region or the low backscatter variability, showed by old forests throughout the whole timeseries, may have led to lower accuracies in the detection of forest structural disturbances.
In the future we are planning to test the algorithm more globally, over very different forest types and conditions. To achieve this in an efficient way we are working on the transcription of the code to the Google Earth Engine (GEE) platform. GEE will allow us to test the CUSU-SMC over other forest regions around the globe, assessing the influence of the diverse environmental conditions and minimizing the pre-processing times. The resultant GEE product will provide a worldwide, free, and time efficient forest monitoring tool accessible to foresters.
Additionally, we will try some more complex statistical methodologies to apply to the CUSUMs outputs, such as autoregression models [63].
Another very interesting future work is to try to relate the forest change to diverse physical parameters of the forests, such as leaf area index [64] or biomass, thus exploring the influence of forest variability on the CUSUMs detection performance [65].

7. Conclusions

This study introduced a new forest monitoring method for detecting forest disturbances from the analysis of dense SAR time series. Prolonged differences in the radar backscatter signal (before and after logging activities) between stable and disturbed forest areas highlighted the sensitivity of C-band SAR systems to forest structural changes. The high spatial and temporal resolution, global coverage, and free data policy of the ESA-Sentinel 1 mission has allowed the exploitation of dense SAR time-series for environmental monitoring. The cumulative sum method makes use of dense time-series, allowing the detection of forest changes in a continuous and rapid manner. The main outcome of this study was the demonstration of the efficient detection capabilities of SAR systems over other more expensive (e.g., LiDAR, manual surveys) or weather dependent monitoring systems (e.g., optical).
The method presented was tested for logging activities in Scottish forests, providing faster detection rates (early warning/rapid response) than current optical methodologies used for the national forest inventory. With the single requirement of having access to continuous data acquisition, the proposed method can be easily implemented on other SAR sensors such as the recently launched RCM constellation or the ALOS-Palsar mission (open policy recently agreed), and on other global forests. CUSU-SMC stands out as a valuable monitoring tool for foresters/forest managers because it reduces the current response times, while also cuts the costs and efforts, when evaluating forest damage.

Author Contributions

Conceptualization, Methodology and Investigation J.R.-R. and A.M.; Formal analysis, J.R.-R.; Resources, J.S. and C.B.; Supervision, A.M., C.B. and J.S.; Writing—original draft preparation, J.R.-R.; Writing-review and editing, J.R.-R., A.M., C.B. and J.S.; Funding acquisition, C.B. and A.M. All authors have read and agreed to the published version of the manuscript.

Funding

This research was funded by the Science, Technology, Engineering and Mathematics Faculty at the Open University through a PhD studentship.

Acknowledgments

We would like to thank John Hair and James Kyle from Forestry and Land Scotland for supporting and providing valuable data of the studied forests.

Conflicts of Interest

The authors declare no conflict of interest.

References

  1. Nunes, L.J.R.; Meireles, C.I.R.; Gomes, C.J.P.; Ribeiro, N.M.C.A. Forest contribution to climate change mitigation: Management oriented to carbon capture and storage. Climate 2020, 8, 21. [Google Scholar] [CrossRef] [Green Version]
  2. Federici, S.; Tubiello, F.N.; Salvatore, M.; Jacobs, H.; Schmidhuber, J. New estimates of CO2 forest emissions and removals: 1990–2015. For. Ecol. Manage. 2015, 352, 89–98. [Google Scholar] [CrossRef] [Green Version]
  3. FAO Forest threats. Unasylva An Int. J. For. For. Ind. 2004, 55, 1.
  4. IUCN. Deforestation and Forest Degradation; International Union for Conservation of Nature: Gland, Switzerland, 2017. [Google Scholar]
  5. Kissinger, G.; Herold, M.; De Sy, V. Drivers of Deforestation and Forest Degradation: A Synthesis Report for REDD+ Policymakers; Lexeme Consulting: Vancouver, BC, Canada, 2012. [Google Scholar]
  6. FAO. UN-REDD Fact Sheet: About REDD+. Fao Undp Unep 2015, 1–4. [Google Scholar]
  7. Defries, R.S. Why Forest Monitoring Matters for People and the Planet. In Global Forest Monitoring from Earth Observation; Achard, F., Hansen, M., Eds.; CRC Press/Taylor & Francis: Boca Raton, FL, USA, 2013; pp. 1–14. [Google Scholar]
  8. Rudel, T.K. How Do People Transform. Landscapes? A Sociological Perspective on Suburban Sprawl and Tropical Deforestation 1. Am. J. Sociol. 2009, 115, 129–154. [Google Scholar] [CrossRef]
  9. Saxe, H.; Cannell, M.G.R.; Johnsen, Ø.; Ryan, M.G.; The, S.; Phytologist, N.; Mar, N.; Saxe, H.; Cannell, M.G.R.; Ryan, M.G.; et al. Tree and forest functioning in response to global warming. Tansley Rev. 2001, 149, 369–399. [Google Scholar] [CrossRef]
  10. Apps, M.J. Forests, the global carbon cycle and climate change. In Congress Proceedings, B—Forests for the Planet; XII World Forestry Congress: Quebec, QC, Canada, 2003; pp. 21–28. [Google Scholar]
  11. Bastin, J.-F.; Finegold, Y.; Garcia, C.; Mollicone, D.; Rezende, M.; Routh, D.; Zohner, C.M.; Crowther, T.W. The global tree restoration potential. Science 2019, 365, 76–79. [Google Scholar] [CrossRef]
  12. GOV. UK Forest 2020—Case Study—GOV. UK Space Agency: Swindon , UK, 2017. Available online: https://www.gov.uk/government/case-studies/ecometrica-forest-monitoring-systems (accessed on 16 September 2020).
  13. Plummer, S.; Lecomte, P.; Doherty, M. The ESA Climate Change Initiative (CCI): A European contribution to the generation of the Global Climate Observing System. Remote Sens. Environ. 2017, 203, 2–8. [Google Scholar] [CrossRef]
  14. Mitchard, E. The hectares indicators: A Review of Earth Observation Methods for Detecting and Measuring Forest Change in the Tropics; Ecometrica: Edinburgh, UK, 2016; ISBN 9780995691810. [Google Scholar]
  15. Chuvieco, E. Fundamentals of Satellite Remote Sensing: An Environmental Approach, 2nd.; CRC Press/Taylor & Francis: Boca Raton, FL, USA, 2016; ISBN 9781498728058. [Google Scholar]
  16. Rüetschi, M.; Small, D.; Waser, L.; Rüetschi, M.; Small, D.; Waser, L.T. Rapid Detection of Windthrows Using Sentinel-1 C-Band SAR Data. Remote Sens. 2019, 11, 115. [Google Scholar] [CrossRef] [Green Version]
  17. Tanase, M.A.; Villard, L.; Pitar, D.; Apostol, B.; Petrila, M.; Chivulescu, S.; Leca, S.; Borlaf-Mena, I.; Pascu, I.S.; Dobre, A.C.; et al. Synthetic aperture radar sensitivity to forest changes: A simulations-based study for the Romanian forests. Sci. Total Environ. 2019, 689, 1104–1114. [Google Scholar] [CrossRef]
  18. Verbyla, D.L.; Kasischke, E.S.; Hoy, E.E. Seasonal and topographic effects on estimating fire severity from Landsat TM/ETM+ data. Int. J. Wildl. Fire 2008, 17, 527–534. [Google Scholar] [CrossRef]
  19. Schmitt, M.; Hughes, L.H.; Zhu, X.X. The SEN1-2 dataset for deep learning in SAR-optical data fusion. In Proceedings of the ISPRS Annals Photogrammretry Remote Sense Spatial Information Sciences, Karlsruhe, Germany, 10–12 October 2018; Volume IV-1, pp. 141–146. [Google Scholar]
  20. Polarimetry Tutorial PolSARpro ESA. Available online: https://earth.esa.int/web/polsarpro/polarimetry-tutorial (accessed on 16 July 2019).
  21. Podest, E. Conceptos Básicos del Radar de Apertura Sintética 2017. Available online: https://arset.gsfc.nasa.gov/sites/default/files/water/Brazil_2017/Day1/S1P2-span.pdf (accessed on 25 July 2020).
  22. JJ-FAST. Available online: https://www.eorc.jaxa.jp/jjfast/jj_index.html (accessed on 20 August 2020).
  23. Hansen, M.C.; Potapov, P.V.; Moore, R.; Hancher, M.; Turubanova, S.A.; Tyukavina, A.; Thau, D.; Stehman, S.V.; Goetz, S.J.; Loveland, T.R.; et al. High-Resolution Global Maps of 21st-Century Forest Cover Change. New Ser. 2013, 342, 850–853. [Google Scholar] [CrossRef] [Green Version]
  24. Shimada, M.; Itoh, T.; Motooka, T.; Watanabe, M.; Shiraishi, T.; Thapa, R.; Lucas, R. New global forest/non-forest maps from ALOS PALSAR data (2007–2010). Remote Sens. Environ. 2014, 155, 13–31. [Google Scholar] [CrossRef]
  25. Martone, M.; Rizzoli, P.; Wecklich, C.; González, C.; Bueso-Bello, J.L.; Valdo, P.; Schulze, D.; Zink, M.; Krieger, G.; Moreira, A. The global forest/non-forest map from TanDEM-X interferometric SAR data. Remote Sens. Environ. 2018, 205, 352–373. [Google Scholar] [CrossRef]
  26. Hardy, A.; Ettritch, G.; Cross, D.E.; Bunting, P.; Liywalii, F.; Sakala, J.; Silumesii, A.; Singini, D.; Smith, M.; Willis, T.; et al. Automatic detection of open and vegetated water bodies using Sentinel 1 to map African malaria vector mosquito breeding habitats. Remote Sens. 2019, 11, 593. [Google Scholar] [CrossRef] [Green Version]
  27. Tanase, M.A.; Perez-Cabello, F.; de la Riva, J.; Santoro, M. TerraSAR-X Data for Burn Severity Evaluation in Mediterranean Forests on Sloped Terrain. IEEE Trans. Geosci. Remote Sens. 2010, 48, 917–929. [Google Scholar] [CrossRef]
  28. Joshi, N.; Mitchard, E.T.; Woo, N.; Torres, J.; Moll-Rocek, J.; Ehammer, A.; Collins, M.; Jepsen, M.R.; Fensholt, R. Mapping dynamics of deforestation and forest degradation in tropical forests using radar satellite data. Environ. Res. Lett. 2015, 10, 034014. [Google Scholar] [CrossRef] [Green Version]
  29. Tanase, M.A.; Kennedy, R.; Aponte, C. Radar Burn Ratio for fire severity estimation at canopy level: An example for temperate forests. Remote Sens. Environ. 2015, 170, 14–31. [Google Scholar] [CrossRef]
  30. Antropov, O.; Rauste, Y.; Väänänen, A.; Mutanen, T.; Häme, T. Mapping Forest Disturbance Usign Long Time series of Sentinel-1 data: Case studies over Boreal and Tropical Forests. In Proceedings of the 2016 IEEE International Geoscience and Remote Sensing Symposium (IGARSS), Beijing, China, 10–15 July 2016; pp. 3906–3909. [Google Scholar]
  31. Bouvet, A.; Mermoz, S.; Ballère, M.; Koleck, T.; Le Toan, T. Use of the SAR Shadowing Effect for Deforestation Detection with Sentinel-1 Time Series. Remote Sens. 2018, 10, 1250. [Google Scholar] [CrossRef] [Green Version]
  32. Reiche, J.; Hamunyela, E.; Verbesselt, J.; Hoekman, D.; Herold, M. Improving near-real time deforestation monitoring in tropical dry forests by combining dense Sentinel-1 time series with Landsat and ALOS-2 PALSAR-2. Remote Sens. Environ. 2018, 204, 147–161. [Google Scholar] [CrossRef]
  33. Tanase, M.A.; Belenguer-Plomer, M.Á.; Roteta, E.; Bastarrika, A.; Wheeler, J.; Fernández-Carrillo, Á.; Tansey, K.; Wiedemann, W.; Navratil, P.; Lohberger, S.; et al. Burned Area Detection and Mapping: Intercomparison of Sentinel-1 and Sentinel-2 Based Algorithms over Tropical Africa. Remote Sens. 2020, 12, 334. [Google Scholar] [CrossRef] [Green Version]
  34. Belenguer-Plomer, M.A.; Chuvieco, E.; Tanase, M.A. Temporal decorrelation of c-band backscatter coefficient in mediterranean burned areas. Remote Sens. 2019, 11, 2661. [Google Scholar] [CrossRef] [Green Version]
  35. Ruiz-Ramos, J.; Marino, A.; Boardman, C.P. Using sentinel 1-SAR for monitoring long term variation in burnt forest areas. In Proceedings of the International Geoscience and Remote Sensing Symposium (IGARSS), Valencia, Spain, 22–27 July 2018. [Google Scholar]
  36. Watanabe, M.; Koyama, C.N.; Hayashi, M.; Nagatani, I.; Shimada, M. Early-stage deforestation detection in the tropics with L-band SAR. IEEE J. Sel. Top. Appl. Earth Obs. Remote Sens. 2018, 11, 2127–2133. [Google Scholar] [CrossRef]
  37. Soil Survey of Scotland Staff. Soil Maps of Scotland at a Scale of 1:250 000; Soil Survey of Scotland Staff: Aberdeen, Scotland, 1981. [Google Scholar]
  38. Torres, R.; Snoeij, P.; Geudtner, D.; Bibby, D.; Davidson, M.; Attema, E.; Potin, P.; Rommen, B.; Floury, N.; Brown, M.; et al. GMES Sentinel-1 mission. Remote Sens. Environ. 2012, 120, 9–24. [Google Scholar] [CrossRef]
  39. Filipponi, F. Sentinel-1 GRD Preprocessing Workflow. Proceedings 2019, 18, 11. [Google Scholar] [CrossRef] [Green Version]
  40. Ground Range Detected Sentinel-1 SAR Technical Guide Sentinel Online. Available online: https://sentinel.esa.int/web/sentinel/technical-guides/sentinel-1-sar/products-algorithms/level-1-algorithms/ground-range-detected (accessed on 21 December 2019).
  41. Forest Research About the NFI Forest Research. Available online: https://www.forestresearch.gov.uk/tools-and-resources/national-forest-inventory/about-the-nfi/ (accessed on 16 December 2019).
  42. Earth Observing System Shortwave Infrared (SWIR) For Agriculture: Band Combination. Available online: https://eos.com/shortwave-infrared/ (accessed on 17 September 2020).
  43. Manogaran, G.; Lopez, D. Spatial cumulative sum algorithm with big data analytics for climate change detection R. Comput. Electr. Eng. 2017, 65, 207–221. [Google Scholar] [CrossRef]
  44. Kellndorfer, J. Using SAR data for Mapping Deforestation and Forest Degradation. In The SAR Handbook. Comprehensive Methodologies for Forest Monitoring and Biomass Estimation; ServirGlobal: Hunstville, AL, USA, 2019; pp. 65–79. [Google Scholar]
  45. Bullock, E.L.; Woodcock, C.E.; Holden, C.E. Improved change monitoring using an ensemble of time series algorithms. Remote Sens. Environ. 2020, 238, 111165. [Google Scholar] [CrossRef]
  46. Kucera, J.; Barbosa, P.; Strobl, P. Cumulative Sum Charts—A Novel Technique for Processing Daily Time Series of MODIS Data for Burnt Area Mapping in Portugal. In Proceedings of the 2007 International Workshop on the Analysis of Multi-Temporal Remote Sensing Images, Leuven, Belgium, 18–20 July 2007; pp. 1–6. [Google Scholar]
  47. NCSS, L. Cumulative Sum (CUSUM) Charts. In NCSS 2019 Statistical Software (2019); © NCSS, LLC: Kaysville, UT, USA, 2019; pp. 247-1–247-20. [Google Scholar]
  48. Sasaki, Y.; Fellow, R. The Truth of the F-Measure, Manchester: MIB-School of Computer Science; University of Manchester: Manchester, UK, 2007. [Google Scholar]
  49. Ghoneim, S. Accuracy, Recall, Precision, F-Score & Specificity, which to optimize on? Available online: https://towardsdatascience.com/accuracy-recall-precision-f-score-specificity-which-to-optimize-on-867d3f11124 (accessed on 7 June 2020).
  50. GDAL/OGR contributors. GDAL/OGR Geospatial Data Abstraction Software Library; Open Source Geospatial Foundation: Chicago, IL, USA, 2018. [Google Scholar]
  51. Ose, K. Detection and Mapping of Clear-Cuts with Optical Satellite Images. In QGIS and Applications in Agriculture and Forest; John Wiley & Sons, Inc.: Hoboken, NJ, USA, 2018; pp. 153–180. ISBN 9781119457107. [Google Scholar]
  52. Green, R.M. The sensitivity of SAR backscatter to forest windthrow gaps. Int. J. Remote Sens. 1998, 19, 2419–2425. [Google Scholar] [CrossRef]
  53. Eriksson, L.E.B.; Fransson, J.E.S.; Soja, M.J.; Santoro, M. Backscatter signatures of wind-thrown forest in satellite SAR images. In Proceedings of the 2012 IEEE International Geoscience and Remote Sensing Symposium, Munich, Germany, 22–27 July 2012; pp. 6435–6438. [Google Scholar]
  54. Tanase, M.A.; Aponte, C.; Mermoz, S.; Bouvet, A.; Le, T.; Heurich, M. Remote Sensing of Environment Detection of windthrows and insect outbreaks by L-band SAR: A case study in the Bavarian Forest National Park. Remote Sens. Environ. 2018, 209, 700–711. [Google Scholar] [CrossRef]
  55. Quegan, S.; Le Toan, T.; Yu, J.J.; Ribbes, F.; Floury, N. Multitemporal ERS SAR analysis applied to forest mapping. IEEE Trans. Geosci. Remote Sens. 2000, 38, 741–753. [Google Scholar] [CrossRef]
  56. Ulehla, Z.J.; Martin, R.F. Operating characteristic analysis of attribute ratings. Behav. Res. Methods Instrum. 1971, 3, 291–293. [Google Scholar] [CrossRef] [Green Version]
  57. Zhuang, H.; Fan, H.; Deng, K.; Yu, Y. An improved neighborhood-based ratio approach for change detection in SAR images. Eur. J. Remote Sens. 2018, 51, 723–738. [Google Scholar] [CrossRef] [Green Version]
  58. Zweig, M.H.; Campbell, G. Receiver-Operating Characteristic (ROC) Plots: A Fundamental Evaluation Tool in Clinical Medicine. Clin. Chem. 1993, 39, 561–577. [Google Scholar] [CrossRef]
  59. Schwarz, M.; Steinmeier, C.; Holecz, F.; Stebler, O.; Wagner, H. Detection of Windthrow in Mountainous Regions with Different Remote Sensing Data and Classification Methods. Scand. J. For. Res. 2003, 18, 525–536. [Google Scholar] [CrossRef]
  60. Hansen, M.C.; Krylov, A.; Tyukavina, A.; Potapov, P.V.; Turubanova, S.; Zutta, B.; Ifo, S.; Margono, B.; Stolle, F.; Moore, R. Humid tropical forest disturbance alerts using Landsat data. Environ. Res. Lett. 2016, 11, 034008. [Google Scholar] [CrossRef]
  61. Dabboor, M.; Iris, S.; Singhroy, V. The RADARSAT Constellation Mission in Support of Environmental Applications. Proceedings 2018, 2, 323. [Google Scholar] [CrossRef] [Green Version]
  62. Canadian Space Agency (CSA) Technical characteristics-Canada.ca. Available online: https://www.asc-csa.gc.ca/eng/satellites/radarsat/technical-features/characteristics.asp (accessed on 2 March 2020).
  63. Montgomery, D.C.; Jennings, C.L.; Kulahci, M. Introduction to Time Series Analysis and Forecasting, 2nd ed.; John Wiley & Sons, Ed.; Wiley-Blackwell: Hoboken, NJ, USA, 2016; Volume 37. [Google Scholar]
  64. Stankevich, S.A.; Kozlova, A.A.; Piestova, I.O.; Lubskyi, M.S. Leaf area index estimation of forest using sentinel-1 C-band SAR data. In Proceedings of the MRRS 2017 IEEE Microwaves, Radar and Remote Sensing Symposium, Cherkasy Oblast, Ukraine, 29–31 August 2017; Institute of Electrical and Electronics Engineers Inc.: Piscataway, NJ, USA, 2017; pp. 253–256. [Google Scholar]
  65. Koyama, C.N.; Watanabe, M.; Hayashi, M.; Ogawa, T.; Shimada, M. Mapping the spatial-temporal variability of tropical forests by ALOS-2 L-band SAR big data analysis. Remote Sens. Environ. 2019, 233, 111372. [Google Scholar] [CrossRef]
Figure 1. Reference map showing the location and areas covered by the Queen Elizabeth Forest Park.
Remotesensing 12 03061 g001
Figure 2. Forest logging activity identification. (a) Landsat 8 shortwave infrared image used for the visual identification of forest changes. Acquired: 28 June 2019; pink tone areas represent land cover transformation from forest to bare ground. (b) Colored polygons represent Forest and Land Scotland (FLS)-verified forest logging activities carried out between 1 January 2019 and 30 September 2019.
Remotesensing 12 03061 g002
Figure 3. Proposed methods for the cumulative sum (CUSUM) and cumulative sum-spatial mean corrected (CUSU-SMC) forest change detectors.
Remotesensing 12 03061 g003
Figure 4. Spatial mean normalization. Ratio of backscatter variation of each class (‘forest’, ‘conifer’, ‘broadleaves’) for the entire timeseries, based on the cumulative sum methodologies; (a) CUSUM based on [46], (b) CUSU-SM spatial forest mean variant, (c) CUSU-SMC proposed method (spatial mean constant bias correction applied).
Remotesensing 12 03061 g004
Figure 5. Assessing if CUSUM and CUSU-SMC are normally distributed over the reference year. The data used for generating the histograms was obtained by masking out each region (“forest”, “conifer”, “broadleaves”) over a CUSU-SMC ratio image (29 July 2019). Data used for Q–Q plots correspond to temporal values of unique pixels, randomly selected, for each region.
Remotesensing 12 03061 g005
Figure 6. This figure illustrates the sensitivity of different polarization channels to forest structural changes by comparing the annual backscatter timeseries of logging areas with undisturbed forest. Temporal differences extracted from the comparison of logging areas and undisturbed forest (bottom) showed the higher sensitivity of the VH polarization channel.
Remotesensing 12 03061 g006
Figure 7. Synthetic aperture radar (SAR) backscatter signal comparison for mean reference values used for the CUSUM and CUSU-SMC change detection methods. The lack of significant differences in the values obtained for the forest mask for both cases tested could explain the similarity in the final results.
Remotesensing 12 03061 g007
Figure 8. This figure compares the performance of the pairwise approaches with the CUSUM and CUSU-SMC methods using a ROC curve representation, for both the (A) Ratio (VH/VV) and (B) VH channels. PW = pairwise. ROC curves were generated using the results obtained for the accuracy assessment, performed for the image acquired on 29 September 2019, using significance levels of (α = 0.4, 0.3, 0.2, 0.15, 0.1, 0.05, 0.01, 0.001).
Remotesensing 12 03061 g008
Figure 9. Logging activities change detection maps obtained for pairwise (static approach) (left) and CUSU-SMC (right) methods. The images show the probability of change (being P = 1 considered as change, and P = 0 as no change), obtained for the 29 September 2019 and ratio data cube, for the areas affected by clear-cuts “Unknown 4” (top), and “33020” (bottom).
Remotesensing 12 03061 g009
Figure 10. Contribution of the tested sieve filter to detection performance of the CUMSUM and CUSU-SMC approaches. Accuracy test carried out using a significance level of ( α = 0.05 ) .
Remotesensing 12 03061 g010
Figure 11. Forest changes detected in the Queen Elizabeth Forest Park using the conservative strategy (CUSUM VH). (a) Shows the logging activities reference dataset obtained for the period of study. (b) Illustrates the changes detected (red) for the CUMSUM VH (avg 3 × 3) detector. Subsets (c,d) show a closer look of the effect of the sieve filter on the final change detection maps [(c) 10 pixels; (d) 25 pixels].
Remotesensing 12 03061 g011
Table 1. Confusion matrix for change detection classification. H0: No change, H1: Change.
Product
ReferenceH0H1
H0True Negative (TN)False Positive (FP)
H1False Negative (FN)True Positive (TP)
Table 2. CUSUM and CUSU-SMC accuracy assessment. Accuracy rates were calculated using 2019 logging areas as reference, the same acquisition date (29 September 2019) and a significance level of (α = 0.05). TP = true positives, TN = true negatives, FP = false positives, FN = false negatives, OA = overall accuracy, PA = producer accuracy, UA = user accuracy. (*C = conservative approach, *T = tolerant approach, and *NC = results obtained without the application of the fitted ramp correction).
CUSUM CUSU-SMC
VVVH *CRatio (VH/VV)VH *TRatio (VH/VV)Ratio (VH/VV) *NC
TP0.3240.6020.7310.7240.6850.654
TN0.9170.8700.6020.5940.6500.583
FP0.0830.1300.3980.4060.3500.417
FN0.6760.3980.2690.2760.3150.346
OA0.6210.7360.6670.6590.6680.618
PA0.3240.6020.7310.7240.6850.654
UA0.7970.8220.6480.6410.6620.610
F-score0.4600.6950.6870.6800.6740.631
Table 3. Pairwise vs CUSUMs detection performance comparison. The change detection accuracy assessment was performed using a significance level of (α = 0.05) and the same image (29 September 2019) for both the CUSUMs and pairwise approaches. The CUSUMs approaches were the ones for conservative (*C) and tolerant (*T) strategies. TP = true positives, TN = true negatives, FP = false positives, FN = false negatives, OA = overall accuracy, PA = producer accuracy, UA = user accuracy.
CUSUMsPairwise
ContinuousStatic
CUSUM *C(VH)CUSU-SMC *T(Ratio)Continuous RatioContinuous VHStatic RatioStatic VH
TP0.6020.6850.2230.5940.4590.389
TN0.8700.6500.8820.7180.6970.792
FP0.1300.3500.1180.2820.3030.208
FN0.3980.3150.7770.4060.5410.611
OA0.7360.6680.5530.6560.5780.590
PA0.6020.6850.2230.5940.4590.389
UA0.8220.6620.6550.6780.6020.651
F-score0.6950.6740.3330.6330.5210.487
Table 4. Results showing the spatial filtering effects on detection performance/accuracy.
OAPAUAF-ScoreSpatial Loss
CUSU-SMC (Ratio)0.6680.6850.6620.674-
Sieve (10 pixels)0.7170.8220.6790.7440.4 ha
Sieve (15 pixels)0.7110.8220.6720.7400.6 ha
Sieve (25 pixels)0.7080.8230.6690.7381 ha
CUSUM (VH)0.7360.6020.8220.695-
Sieve (10 pixels)0.7720.6500.8590.7400.4 ha
Sieve (15 pixels)0.7780.6490.8750.7450.6 ha
Sieve (25 pixels)0.7860.6460.8980.7511 ha

