Article

Detection of a Moving UAV Based on Deep Learning-Based Distance Estimation

Department of Aeronautics and Aeronautics, National Cheng Kung University, Tainan 701, Taiwan
*
Author to whom correspondence should be addressed.
Remote Sens. 2020, 12(18), 3035; https://doi.org/10.3390/rs12183035
Submission received: 27 July 2020 / Revised: 12 September 2020 / Accepted: 14 September 2020 / Published: 17 September 2020

Abstract

:
Distance information of an obstacle is important for obstacle avoidance in many applications, and could be used to determine the potential risk of object collision. In this study, the detection of a moving fixed-wing unmanned aerial vehicle (UAV) with deep learning-based distance estimation to conduct a feasibility study of sense and avoid (SAA) and mid-air collision avoidance of UAVs is proposed by using a monocular camera to detect and track an incoming UAV. A quadrotor is regarded as an owned UAV, and it is able to estimate the distance of an incoming fixed-wing intruder. The adopted object detection method is based on the you only look once (YOLO) object detector. Deep neural network (DNN) and convolutional neural network (CNN) methods are applied to exam their performance in the distance estimation of moving objects. The feature extraction of fixed-wing UAVs is based on the VGG-16 model, and then its result is applied to the distance network to estimate the object distance. The proposed model is trained by using synthetic images from animation software and validated by using both synthetic and real flight videos. The results show that the proposed active vision-based scheme is able to detect and track a moving UAV with high detection accuracy and low distance errors.

Graphical Abstract

1. Introduction

With the advance of technology, unmanned aerial vehicles (UAVs) have become popular in the past two decades due to their wide and various applications. The advantages of UAVs include low cost, offering a less stressful environment, and long endurance. Most important of all, UAVs are unmanned, so they can reduce the need of manpower, and thus reduce the number of casualties caused by accidents. They also have many different applications including aerial photography, entertainment, 3D mapping [1], object detection for different usages [2,3,4], military use, and agriculture applications, such as pesticide spraying and vegetation monitoring [5]. With the increasing amounts of UAVs, there are more and more UAVs flying in the same airspace. If there is no air traffic control and management of UAVs, it may cause accidents and mid-air collisions to happen, which is one the most significant risks that UAVs are facing [6]. Thus, UAV sense and avoid (SAA) has become a critical issue. A comprehensive review of the substantial breadth of SAA architectures, technologies, and algorithms is presented in the tutorial [7], which concludes with a summary of the regulatory and technical issues that continue to challenge the progress on SAA. Without a human pilot onboard, unmanned aircraft systems (UASs) have to solely rely on SAA systems when in dense UAS operations in urban environments, or they are merged into the National Airspace System (NAS) [8]. There are many factors needed to be considered for UAS traffic management (UTM), such as cost, payload of UAV, accuracy of the senor, etc. Therefore, the determination of suitable sensors in UAV SAA of UTM for objective sensing is essential.
According to how the information is transmitted, current sensor technologies for SAA can be classified as cooperative and non-cooperative methods [8]. For cooperative sensors, the communication devices need to be equipped to communicate with the aircrafts in the same airspace, such as the traffic alert and collision avoidance system (TCAS) and the automatic dependent surveillance-broadcast (ADS-B), which have been widely used in commercial airlines. In contrast to cooperative sensors, there is no need for non-cooperative sensors to equip the same communication devices to exchange data with the other aircrafts for sharing the same airspace. Moreover, non-cooperative sensors are able to detect not only air objects but also ground targets, such as light detection and ranging (LIDAR), radar, and optical sensors (cameras). One drawback of small-scale UAVs is the limitation of their payload capability. Therefore, the camera becomes an ideal sensor for object and target detection. The camera has many advantages, such as its light weight, low cost, the fact that it is easy to equip, and it is also widely used in different applications.
Computer vision is one of the popular studies for onboard systems of UAVs, which make the vehicles able to “see” the targets or objects. With the rapid development of computer vision, vision-based navigation is now the promising technology for detecting potential threats [6]. For object sense/detection, there are many approaches have be proposed, such as multi-stage detection pipeline [9,10,11], machine learning [12,13,14,15], and deep learning [16]. Deep learning is widely used in machine vision for object detection, localization, and classification. In contrast to traditional object detection methods, detectors using deep learning are able to learn semantic, high-level, and deeper features to address the problems existing in traditional architectures [17]. Detectors based on deep learning can be divided into two categories, one stage and two stage. Two-stage detectors require a region proposal network (RPN) to generate regions of interests (ROI), such as the faster region convolution neural network (R-CNN) or the mask R-CNN [18,19]. On the other hand, the one-stage detector considers object detection as a single regression problem by taking an image as input to learn class probabilities and bounding box coordinates, such as the single shot multi-box detector (SSD) or you only look once (YOLO) [20,21]. Two-stages detectors have higher accuracy when compared to one-stage detectors, but their computational cost is higher than one-stage detectors.
Vison-based object detection methods have been studied for many decades and applied in many applications. In recent years, there are many studies focused on UAV detection with vision-based methods and deep learning [22,23,24,25,26]. These studies focus on the detection of quadrotor or multirotor UAVs, commonly known as drones, but it is difficult to obtain the detector for small fixed-wing UAVs, which have higher flight speed than multirotors and will increase the challenge of the vision-based detectors. Moreover, most of these studies emphasized the development of object detectors, and there is no vision-based distance estimation for the feasibility study of SAA and mid-air collision avoidance of UAVs using a monocular camera to detect the incoming small fixed-wing UAV. Some vison-based detection approaches for mid-air collision avoidance have been proposed for light fixed-wing aircrafts. For example, an image processing of multi-stage pipeline based on the hidden Markov model (HMM) has been utilized to detect the aircrafts with slow motion on the image plane [10]. The key stages of multi-stage pipeline are stabilized image input, image preprocessing, temporal filtering and detection logic. The advantage of this approach is that it can detect a Cessna 182 aircraft in long distance. However, when the movement of the aircraft on the image plane is too fast, this algorithm will fail. In [6], the proposed long-range vision-based SAA utilized the same multi-stage pipeline. Moreover, instead of using only morphological image processing in image processing stage, deep learning-based pixel-wised image segmentation is also applied to increase the detection range of a Cessna 182 whilst maintaining low false alarms. It classifies every pixel in image into two classes, aircraft and non-aircraft. Regarding to UAVs, Li et al. proposed a new method to detect and track UAVs from a monocular camera mounted on the owned aircraft [3]. The main idea of this approach is to adopt background subtraction. The background motion is calculated via optical flow to obtain the background subtracted images and to find the moving targets. This approach is able to detect moving objects without the limitations of moving speed or visual size.
For the obstacle avoidance, the distance information of the target object usually plays an important role. However, it is difficult to estimate distance with only a monocular camera. Some approaches exploit the known information, such as camera focal length and height of the object, to calculate distance via the pinhole model, and usually assume that the height or width of objects are known [27,28]. The distance estimation of the objects on the ground based on deep learning has been proposed in many studies, but the deep learning-based object detection of UAVs for mid-air collision avoidance is rare according to paper survey results. There are some studies focused on the monocular vision-based SAA of UAVs [29,30]. In the study [29], an approach to deal with monocular image-based SAA assuming constant aircraft velocities and straight flight paths was proposed and simulated in software-in-the-loop simulation test runs. A nonlinear model predictive control scheme for a UAV SAA scenario, which assumes that the intruder’s position is already confirmed as a real threat and the host UAV is on the predefined trajectory at the beginning of the SAA process, was proposed and verified through simulations [30]. However, in these two studies, there is no object detection method and real image data acquiring from a monocular camera. For the deep learning-based object detection, most of the studies utilize the images acquired from UAVs or a satellite to detect and track the objects on the ground, such as an automatic vehicle, airplane, and vessel [31,32,33]. For ground vehicles, Li et al. proposed a monocular distance estimation system for neuro-robotics by using CNN to concatenate horizontal and vertical motion of images estimated via optical flow as inputs to the trained CNN model and the distance information from the ultrasonic sensors [34]. The distance estimation is successfully estimated using only a camera, but the distance estimation results become worse when the velocity of robotics increases. In [
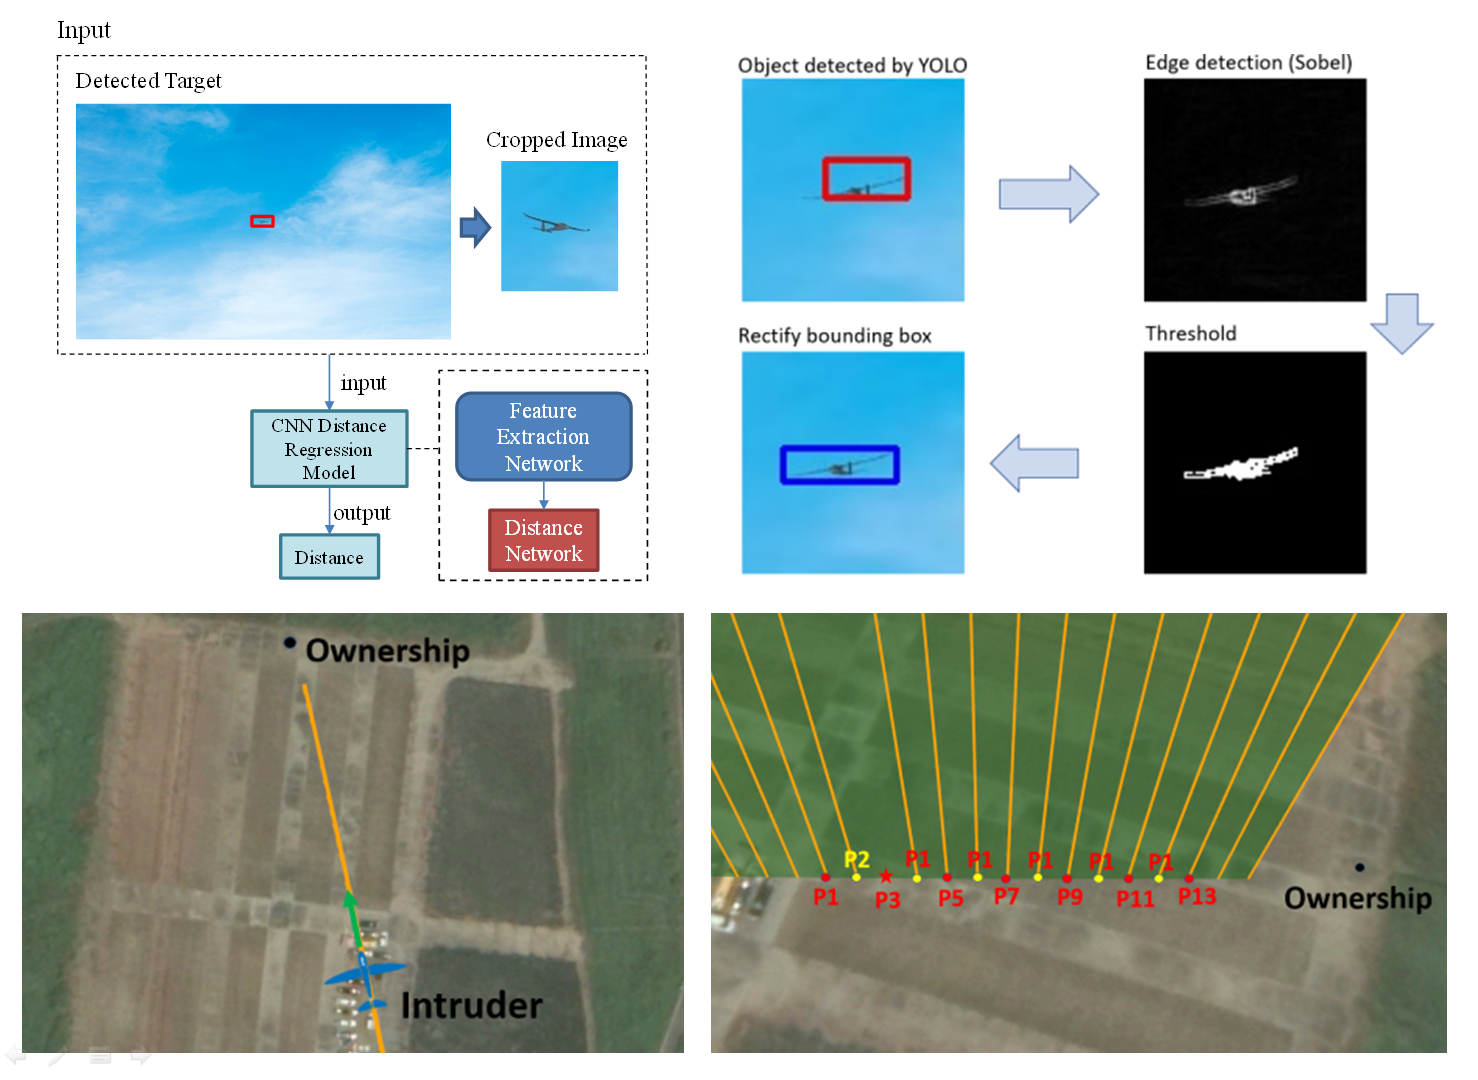
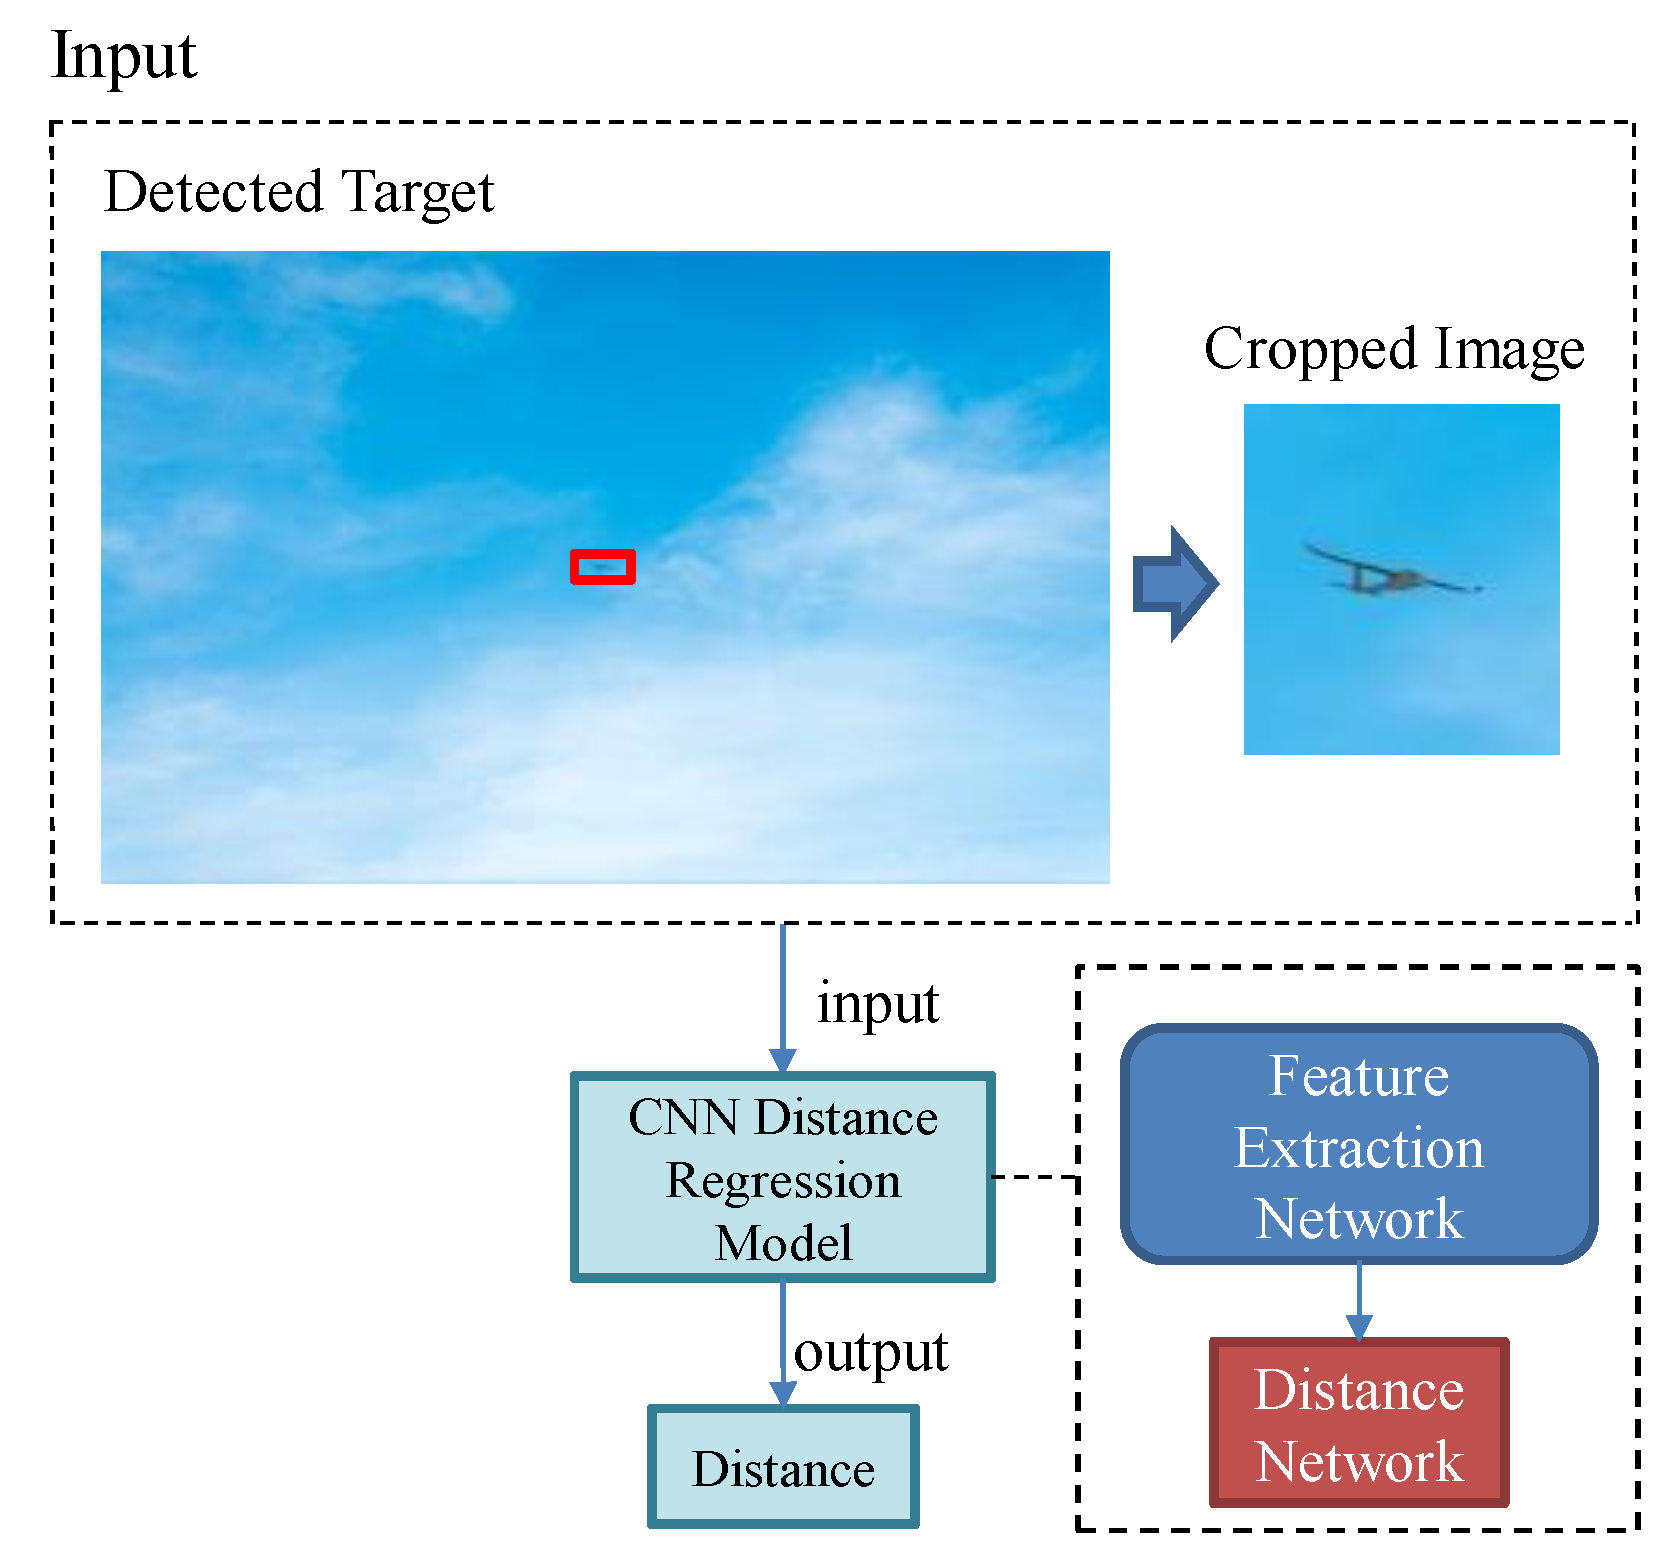
35], a deep neural network (DNN) named DisNet is proposed to detect the distance of a ground vehicle to objects, and it applied the bounding box of the objects detected by YOLO and image information, such as width and height, as inputs to train DisNet. The results show that DisNet is able to estimate the distance between objects and camera without either explicit camera parameters or a prior knowledge about the scene. However, the accuracy of the estimated distance may be directly affected due to the width and height of the bounding box.
With the rapid development in technology, UAVs have become an off-the-shelf consumer product. However, if there is no traffic control or UTM system to manage UAVs when they fly in the same airspace, it may cause mid-air collision, property loss, or causalities. Therefore, SAA and mid-air collision avoidance for UAVs have become an important issue. The goal of this study is to develop the detection of a moving UAV based on deep learning distance estimation to conduct the feasibility study of SAA and mid-air collision avoidance of UAVs. The adopted sensor for the detection of the moving object is a monocular camera, and DNN and CNN were applied to estimate the distance between the intruder and the owned UAV.
The rest of study is organized as follows: In Section 2, the overview of this study is presented, including the architecture of the proposed detection scheme and the methods to accomplish object detection. The methods of the proposed distance estimation using deep learning are presented in Section 3, and the introduction to model architecture and a proposed procedure to synthesize the dataset for training the model are also presented. Section 4 presents the performance evaluation of the proposed methods by using synthetic videos and real flight experiments. Results and discussions of model evaluation and experiments are shown in Section 5. Finally, the conclusion of this study is addressed in Section 6.

2. Detection of a Moving UAV

To develop the key technologies of mid-air collision avoidance for UAVs, a vision-based object detection method is developed using deep learning-based distance estimation processing. The developed approach is able to detect a fixed-wing intruder and estimate the distance between the ownership and intruder. However, it is important to detect the target object in both short and long distances, especially for aircrafts moving in relative high speed. In this study, since the camera is a passive non-cooperative sensor, a monocular camera was selected to be the only sensor to detect the target object in the airspace. A multi-stage object detection scheme is proposed to obtain the distance estimation of the moving targets on the image plane in long and short distances. The background subtraction method, based on the approach in [3], is applied to detect the long-range target and the moving object with a moving background on the image plane. When the target object is approaching the owned UAV, a deep learning-based model is trained to estimate the distance. Then, according to the distance estimation of the detected object on the image plane and its dynamic motion, a risk assessment of mid-air collision could be conducted to prevent mid-air collision from occurring. Figure 1 shows the flow chart of the research process of the proposed multi-stage target detection and distance estimation using a deep learning-based approach.

2.1. Object Detection

There are many approaches to achieve object detection, and machine learning (e.g., deep learning) is one of the popular methods for robotics and autonomous driving applications. For example, a histogram of an oriented gradient (HOG) descriptor is able to detect the features of an object, and the support vector machine (SVM) is utilized to classify the object. In the past decade, deep learning has attracted a lot of attention over the world, and many deep learning-based detectors, such as YOLOv3, Faster-RCNN, and RetinaNet, were proposed [18,31,36]. The deep learning-based detector is able to detect and classify objects with excellent efficiency and accuracy. In order to improve the detection range, a multi-stage object detection scheme is proposed to detect the target in long or short distances. The methods of object detection will be presented in this section. In this study, the main goal is to detect the intruder UAV and estimate the distance between the intruder and the owned UAVs. Background subtraction is utilized to detect moving and small objects, but this method is not able to estimate the distance of an unknown object. Therefore, the deep learning-based detector is used in this study to address the problem, which is able to detect and to classify objects at the same time. The detector used in this study is YOLOv3, and the advantages of this algorithm are as follows:
  • The required computing power is very low compared with the other deep-learning-based detectors.
  • Its accuracy is acceptable for most applications that require real-time onboard computing.
  • It is able to detect a relatively small objects, and the long-range targets occupy few pixels on the image plane.
YOLO is a one-stage detector, and it treats the task of detection as a single regression problem. It is an end-to-end single convolutional neural network that detects objects based on bounding box prediction and class probabilities [37]. The YOLO detector is well-known for its computational speed, and it is a good choice for the real-time applications. YOLOv3 is the third version of YOLO, which has a deeper network for feature extraction, a different network architecture, and a new loss function [36]. The new architecture of YOLOv3 boasts residual skip connections and upsampling. The most significant feature of v3 is that it makes detections at three different scales. The upsampled layers concatenated with the previous layers help preserve the fine grained features which help in detecting small objects. More details of different YOLO detectors are introduced in the literature [36,37].
Since the YOLOv3 detector is a high-speed detector, it is a good choice when real-time detection with acceptable accuracy is required for the onboard computing system of small UAVs. Because the purpose of this study is to conduct a feasibility study of active vision-based SAA for small UAVs using a deep learning-based approach, YOLOv3 is selected to be the detector for detecting the fixed-wing intruder. In order to perform the distance estimation with YOLOv3, the intruder distance is estimated at short range, where the object appearance on the image plane is larger than a few pixels. Moreover, the YOLOv3 detector was run on a personal computer to detect the object and to estimate the distance between the intruder and the owned UAV by using post processing with the synthetic images acquired from animation software and real flight tests. The computing power of the developed vision-based SAA is still regarded as a limitation to improve on for the future of real-time onboard implementation.

2.2. Object Collection

In this study, a low-cost fixed-wing UAV, named Sky Surfer X8, with a wingspan of 1400 mm, overall length of 915 mm, and flying weight of 1 kg was adopted to be the intruder. The real flight tests were conducted by using a Pixhawk autopilot to perform waypoint tracking in auto mode. In the training process, the proposed model was trained by using synthetic images of Sky Surfer from animation software. With the synthetic images, the YOLOv3 detector was pre-trained with the Microsoft COCO dataset [38] to train the feature extractor with the custom images of UAVs in this study. To train the custom YOLOv3 detector, it is necessary to collect images with target fixed-wing UAV. The software, named Blender, which is a free and open-source 3D creation suite, was utilized to synthesize the custom images. It supports the entirety of the 3D pipeline, such as modeling, animation, motion graphics, and rendering. Figure 2 shows one of the synthesis images to train the custom YOLOv3 detector, and the UAVs in each image are synthesized with a real image to be the background.
To train the model with the dataset, it is necessary to label the images in the training dataset with bounding box and class, respectively. The outputs of YOLOv3 are the bounding box information (coordinates) and classes. In this study, there is only one class, which is the fixed-wing UAV. Figure 3 shows the labeling process, and the adopted tool used to label the images is LabelImg, which is also an open-source software.

2.3. Detection Results

The detection results of the custom YOLOv3 detector are shown in Figure 4 and Figure 5. Figure 4 presents the detection result of one frame from a synthetic video with 100 frames, and the accuracy of 100 frames is also 100% with no false-positive detection. In Figure 5, 4 detection results of 4 images were obtained from 236 frames of 3 real flight videos, and the accuracy and recall rate of the custom YOLOv3 detector were 96.3% and 96.7%, respectively, with a few false-positives and false-negatives. The detections errors occurred when the aircraft’s color was similar to the background color in cloudy weather.

3. Distance Estimation

Since the detected objects on the 2D image plane could not provide the distance of the intruder, the depth of the target object is required to obtain its movement in 3D space. In this study, the distance between the ownership and intruder is estimated by deep learning-based methods to achieve SAA of UAVs. To obtain more accurate distance estimation results, two different deep learning methods are used to compare their performance of distance estimation in this study. One is CNN and the other is DNN with the DisNet regression model. From the comparison results, the better one will be applied to the videos of real flight tests in this study.

3.1. Distance Estimation Using CNN

CNN is a powerful algorithm in deep learning, and it is able to extract the different features of objects during the training process. In this study, the distance estimation is considered as a simple CNN regression problem, and the images with the target object were cropped as the inputs of the CNN distance regression model. As shown in Figure 6, the CNN distance regression model could be separated into two parts, the feature extraction network and the distance network.

3.1.1. Model Architecture

Feature Extraction Network

As shown in Figure 7, the feature extraction network is based on VGG-16 [39], which contains five convolution layers followed with a max-pooling layer, respectively. The feature extraction network is initialized with the pre-trained weights which were pre-trained with ImageNet. Then, the layer before the third pooling layer was frozen to fine-tune the remaining layers. In model evaluation, the results show that the model with no frozen layers in a feature extraction network has larger training loss (around 0.7 to 1.3) comparing to that with frozen layers in a feature extraction network (around 0.2 to 0.5). Therefore, the feature extraction network with frozen layers was chosen in this study.
The reasons of freezing some layers are as follows:
  • It could reduce some parameters of the model.
  • The weights (filters) are pre-trained with ImageNet and an image database to improve the performance of the filters in feature extraction.

Distance Network

The distance network is a simple DNN for regression, and its architecture is shown in Figure 8. The output of feature extraction network is flatted to obtain a 4608 × 1 as the input, and is then passed through four fully connected (FC) layers. Each FC layer is followed by batch normalization and activation, and the output layer is the estimated distance of the target. The activation function used in the distance network is rectified linear units (ReLU) [40], and batch normalization is applied to improve the training speed with better convergence.
To decide how many FC layers, excluding the output layer, have to be used in the distance network, and to discuss whether the distance network with different amounts of FC layers affects the performance, two different architectures, three FC layers and four FC layers, were compared in this study. The evaluation results of different models with different amounts of FC layers are shown in Figure 9. GT represents ground truth. Models 5 to 8 and Models 20 to 21 are the results with three FC layers. Models 13 to 15 are the results with four FC layers. The training and validation losses of all models are able to converge at around 0.2 to 0.5, and the results show that there is no significant difference between models with three FC layers and four FC layers. However, the models with three FC layers are slightly more accurate than the others with four FC layers, and the parameters of the models with three FC layers are much smaller than the models with four FC layers, which can decrease the training time.

3.1.2. Data Collection

Because there is no existing dataset with the CNN distance regression model, it is necessary to build a dataset to train the model, which is able to estimate the distance between the ownership and intruder UAVs using the deep learning-based approach. In order to obtain a dataset with a lot of various cropped images that contain a UAV with various distances and orientations, a procedure to synthesize this dataset is proposed in this study. In contrast to the approach in [35], which is a ground-based distance estimation for railway obstacle avoidance, this study presents a air-to-air obstacle avoidance scheme, in which it is more difficult to collect the real scene image for training, because the ground truth of the estimated distance needs to be determined rigorously.

Synthetic Images

To address the previously mentioned problem mentioned, Blender software was utilized to create the desired synthetic images. For the training dataset, a small-scale UAV, Sky Surfer X8, was imported to Blender as the intruder, and then it was randomly rotated to obtain different orientations, and the camera was adjusted to acquire various distances. In this study, scenes of a UAV toward to camera were considered, and the scenarios of head-on and crossing were conducted. The rotation range of the UAV was also limited to prevent unusual attitude and overtaking case. The information regarding the dataset built to training the CNN distance regression model is list in Table 1. Figure 10 shows the interface of Blender, which is able to change the location of the intruder by setting the parameters in the red box and changing the attitude parameters in the yellow box. Figure 11 shows one of the synthetic image produced by Blender, and Figure 12 shows some cropped images of the developed training dataset.

Image Augmentation

In order to create more data for model training, the image augmentation process, which randomly changes the images before inputting them into the model according to the given parameters, was applied during model training. Moreover, the image augmentation process can also prevent the trained model from overfitting. The augmentation process used in this study includes rotations and translations of the target object, which are performed by the image processing of width shifting and height shifting. The parameters are list in Table 2. For the translation process, the factor of 0.35 means shifting at most 70 pixels of the target object with a size of 200 × 200 pixels, which changes based on the size of the input images. For the rotation process, the maximum rotating angle is 3 degrees. In the training process, the image augmentation process randomly selects a set of parameter combinations of translation and rotation for each epoch.

3.1.3. Training Result

In order to train the proposed model, the dataset was collected by using the proposed procedure to synthesize the training data as previously mentioned. The amount of the produced images—which are cropped in RGB with a distance range of from 30 m to 95 m—in the dataset for training is about 10,000. First of all, the images were normalized to increase the training speed and model robustness, and then split to an 80% dataset for training and 20% for validation. Mean square error (MSE) was chosen to be the loss function, as shown in Equation (1), where y is the ground truth and y ^ is the prediction from the proposed model. Adaptive moment estimation (Adam) with a learning rate decay as shown in Equation (2) was chosen to be the optimizer; the model training result is illustrating in Figure 13. It took about 38 min to train the model with an NVIDIA GeForce GTX 1660 Graphics Processing Unit (GPU) card.
MSE = 1 n i = 1 n ( y i y ^ i ) 2
Learning   Rate = 0.001 Epoch

3.2. Distance Estimation Using DNN

In the study [35], an approach with a simple DNN regression to estimate distance is proposed, and it considers only the input image size, the bounding box of the detected object, and the size of the object. In this study, a simple DNN is also used to estimate the distance of air-to-air UAVs, but the inputs are different from the those in [35]. Figure 14 shows the distance regression model; it consists of a CNN attitude model and a DNN network with a DisNet regression model.

3.2.1. Attitude Estimation via CNN

The adopted DNN is modified from the study [35], and some parameters have been modified to obtain the attitude of the target. The first three input parameters in [35] are the information about the detected bounding box, but the remaining three parameters are the average height, width, and breadth of the object, which do not meet the requirement of this study to detect the attitude and distance of the intruder UAV. The distance of the intruder UAV is assumed to be the function of its attitude and the sizes of the detected bounding box. Hence, the last three parameters were changed to the roll, pitch, and yaw angles of the intruder. Since the attitude of the intruder UAV is unknown, it is necessary to estimate its attitude. Therefore, CNN regression is also applied to estimate the attitude of the intruder, and the architecture is identical to the CNN distance model, in which the outputs are changed Euler angles of the intruder. The training process and data collection are also similar to the CNN distance model.

3.2.2. Bounding Box Rectification

The accuracy of the detected bounding box is significant because it may directly affect the accuracy of the estimated distance. To make sure the estimated accuracy, Sobel edge detection is applied to rectify the bounding box, and there is a similar approach that utilizes bounding box rectification to center the bounding box onto the detected objects [41]. Figure 15 shows the process of bounding box rectification. It is obvious that the bounding box (red one) acquired from YOLOv3 is not accurate, but it is able to obtain the right bounding box (blue one) when the edge detection is applied and has passed the threshold. However, this method does not perform well when the background is too noisy.

3.2.3. DNN Architecture

Figure 16 shows the architecture of the DNN distance model, which consists of three hidden layers with 100 hidden units, respectively. The input vector is shown in Equation (3), and the output value is the estimated distance of the object. The distance network is trained with the same loss function and optimizer in Section 3.1.3.
v = [ 1 B h 1 B w 1 B d     θ   φ ]
where
  • B h : height of the object bounding box in pixels/image height in pixels;
  • B w : width of the object bounding box in pixels/image width in pixels;
  • B d : diagonal of the object bounding box in pixels/image diagonal in pixels;
  • : estimated roll angle;
  • θ : estimated pitch angle;
  • φ : estimated yaw angle.

3.2.4. Data Collection and Labeling

In order to train the attitude model, it is necessary to build a similar dataset, as shown in Section 3.1.2. The dataset is also built using Blender software, and each image is named according to the parameters (roll, pitch, yaw angles) as the ground truth as shown in Figure 10 (red box). For the DNN model, the LabelImg software, shown in Figure 3, is utilized to obtain the information of bounding box (first three parameters of the DNN model), and the name of the image provides the attitude information of the intruder (last three parameters of the DNN model). In this way, it is possible to train the DNN distance model.

3.3. Comparison of the Developed CNN and DNN Distance Regressions

In this study, two deep learning-based methods, CNN and DNN distance regression models, were applied to estimate the distance of the intruder. In this section, these two deep learning methods were conducted to compare their performance of distance estimation. From the comparison results, the better one will be applied to the videos of real flight tests in this study. Figure 17 shows the comparison of CNN (green dots) and DNN (blue dots) regression models. Figure 17a,b are the distance range of the intruder flying from 60 to 30 m, and Figure 17c is the distance range from 50 to 35 m. The results show that CNN regression is better and more reliable than DNN for most frames, especially for Figure 17b. This is perhaps for the following reasons:
  • The accuracy of DNN regression is affected by the accuracy of the bounding box size.
  • The estimated attitude contains large errors.
  • The bounding box rectification does not work well when the background is cloudy and complex.
Therefore, CNN regression is selected to be the distance estimation method. The reasons why CNN regression is selected are as follows:
  • It uses only one model to estimate the distance, but the DNN regression model requires an additional attitude estimation model to estimate the attitude of the intruder.
  • From the comparison results, it is more accurate than DNN distance regression.
  • It is more robust when the background is not so clear.

4. Model Evaluation and Real Flight Experiments

After CNN distance regression is chosen to be the method to estimate the distance of the intruder, it is necessary to evaluate whether its performance could meet the requirement of this study. Two types of videos, synthetic and real flight videos, were used to verity the distance estimation for SAA of UAVs. In general, there are three different scenarios of SAA for aircrafts, head-on, crossing, and overtaking. In this study, only head-on and crossing cases are considered for the evaluation of synthetic and real flight videos. The details about how to acquire these videos are presented in the following sections.

4.1. Model Evaluation in Synthetic Videos

The synthetic videos were acquired by using Blender software as mentioned in the previous sections. The small-scale UAV, Sky Surfer X8, was simulated as an intruder and flew toward or across to the ownership UAV with a camera onboard. In the synthetic videos, only two cases were conducted, head-on and crossing. The flight speed of the synthetic UAV was assumed to be constant, and the ground truth with respect to each video frame can be determined based on this assumption. Six synthetic videos with two weather conditions, clear and cloudy, were recorded for model evaluation, as given in Table 3. The intruder in each video has different attitudes and distance. Figure 18 illustrates the synthetic videos used for model evaluation. The red boxes indicate the crossing cases, and the yellow boxes indicate the head-on cases. The arrows show the flight paths of the intruder UAV on the image plane.
The results of model evaluation with synthetic videos are given in Table 4 and Figure 19. As shown in Table 4, the synthetic videos are grouped into two sets according to their distance. Set I presents the shorter distance with a clear background, and Set II shows the longer distance with a cloudy background. The root mean square error (RMSE) of each video was calculated to compare the performance of the results. RMSE_K indicates the RMSE with the Kalman filter in the distance estimation, and the Kalman filter in one dimension, which is adopted to be a low-pass filter in this study, is applied to smooth the output of the CNN distance regression model.
Figure 19 shows the estimated distance by the CNN distance regression model, where green line indicates the raw estimation from model, the blue line indicates the estimation with the Kalman filter, and the red line indicates the ground truth of the distance in each video frame. The ground true is determined by the positions of the intruder and the related frame with a timestamp. From Table 4 and Figure 19, it is obvious that the CNN distance regression model successfully estimated the distance in each frame; the RMSEs are small for different weather condition and cases, that is, using CNN regression to estimate distance works considerably well. The encountered problems, such as jittering of the estimated distance, can be improved by applying the Kalman filter to smooth the estimation, as show in Figure 19 (blue line).

4.2. Model Evaluation in Real Flight Videos

For the real flight experiments, a drone was hovering in the sky as the ownership, and a small-scale UAV (Sky Surfer in this study), which is as an intruder, flew along the designed waypoints. The reason why the ownership was hovering instead of moving is that it was able to identify the distance between the ownership and intruder for model evaluation. In the real flight experiments, it is hard to obtain the ground truth of each video frame. Therefore, the measurement of the distance between the owned UAV and the intruder were determined by their positions obtained from global positioning system (GPS) and the related frame with a timestamp. Every video frame with a timestamp is considered as an input of CNN distance model, and the error of estimated distance is calculated according to the video frame rate and the log file of GPS from Sky Surfer. A 4K-capable consumer-grade drone, Parrot Anafi, was selected to be the ownership UAV. The videos were recorded by Parrot Anafi at 4k (3840 by 2160) resolution with a 30 fps frame rate, and the ownership was hovering at a fixed position in the sky to record the videos with the incoming intruder. The specifications regarding the imaging system of the ownership are shown in Table 5. The lens distortion is considered to be negligible since the videos recorded by the ownership have been corrected by its built-in software of the consumer drone, Parrot Anafi, with a low-dispersion aspherical lens (ASPH). The GPS receiver equipped on the intruder, Sky Surfer X8, has a 5 Hz sampling rate. The real flight experiments and the performance of the CNN regression model in the real flight test are given in the following sections.

4.2.1. Experiment 1

Experiment 1 is a head-on scenario with misty weather, and the fly trajectory is shown in Figure 20. The yellow arrow is the flight direction, and the black arrow is the heading of the ownership. Figure 21 shows the measurements of GPS data for model evaluation, and the distance range is from 62 m to 22 m. Figure 22 shows the results of the CNN regression model, and Table 6 shows the information of Experiment 1 and the RMSE of the estimated distance. MEAS (Measurement) denotes the measurements of GPS data and EST (Estimation) is the estimated distance.

4.2.2. Experiment 2

Experiment 2 is a crossing scenario with misty weather, and the intruder flew from the right side of ownership to the left side, as shown in Figure 23. There are fifteen measurements of GPS data for model evaluation, as shown in Figure 24, and the distance range is from 61 m to 25 m. The evaluation results are shown in Figure 25 and Table 7.

4.2.3. Experiment 3

Experiment 3 is a head-on scenario with misty weather, and the intruder flew directly toward the ownership, as shown in Figure 26. There are fifteen measurements of GPS data for model evaluation, as shown in Figure 27, and the distance range is from 70 m to 25 m. The evaluation results are shown in Figure 28 and Table 8.

4.2.4. Experiment 4

Experiment 4 is head-on case with a clear background, and the intruder flew directly toward the ownership, as shown in Figure 29. There are thirteen measurements of GPS data for model evaluation, as shown in Figure 30, and the distance range is from 71 m to 21 m. The results show that Point 3 with a star mark is calculated by interpolation because there is data loss of GPS in the log file. The evaluation results are shown in Figure 31 and Table 9.

5. Result and Discussion

5.1. Synthetic Videos

The evaluation results of CNN regression model in synthetic videos are given in Table 4. The results show that the proposed model successfully estimates the distance only from the synthesized images of the intruder. The RMSEs of the estimation results are influenced by the weather conditions and the flight trajectories. The RMSEs of estimation results are smaller in Set 1 with a clear background than Set 2 with a cloudy (noisy) background. Moreover, the crossing cases have larger RMSEs compared to the head-on cases in both sets. The attitude of the intruder in each synthetic video is totally different regardless of what case it is. In contrast to crossing cases, the intruder in head-on cases stays almost in the center of images. As shown in Figure 19, the errors of the estimated distances are smaller when the intruder flies toward the center of images, and the distance estimation is more accurate for all synthetic videos when the intruder is close to the ownership. However, there are still some factors which affect the accuracy of the proposed model:
  • The intruder is located at the center of the images in the training dataset. However, the intruder in crossing cases is always far away from the image center, but the intruder in head-on cases is close to the center of the images.
  • Most of the cropped images for the model training are in clear weather, but the synthetic videos have a cloudy (noisy) background which may affect the accuracy.

5.2. Real Flight Tests

The evaluation the results of the CNN regression model in real flight experiments are given in Section 4.2. There are three head-on cases and one crossing case in the experiments. For the head-on cases, the RMSE of the estimation results in Experiment 4 is the smallest, and the reason is that Experiment 1 and 3 are conducted in misty weather, and the color of the background is close to that of the intruder. Experiment 4 has the best results in the head-on scenario with a clear background, allowing the model can easily extract features and estimate the accurate distance. From these experiments, it is obvious that the deep learning-based distance estimation model is able to estimate the distance from real scene images successfully, which means that the proposed approach is able to estimate the object distance using only a monocular camera. In the real flight experiments, the true color of the intruder is different from that used to train the model. The intruder in experiments is brighter than that in the training data images, which means that the feature network in the CNN distance regression model is able to extract the desired features (Sky Surfer) successfully.
The results show that the developed distance estimation is more accurate in the head-on cases than in the crossing cases for both synthetic and real flight videos. In the real flight experiments, the RMSEs of the estimation in the crossing cases are larger than those in the head-on cases, and the RMSEs of estimations are larger than those in the synthetic videos. The reason is that the scale of the intruder in the training dataset images is different from that in the real flight experiments, and the model is sensitive to the change in the scale. Moreover, there is a problem regarding the estimation results in long range. The pixels occupied by the intruder in the cropped image have no significant change when the intruder is far away from the ownership, which may cause the model to misestimate in the distance estimation and subsequently affect its accuracy.

6. Conclusions

In this work, the vision-based distance estimation using the deep learning-based approach to estimate the distance between the ownership and intruder UAVs was proposed for the feasibility study of SAA and mid-air collision avoidance of small UAVs with a consumer-grade monocular camera. First, the target object on the image plane was detected, classified, and located by YOLOv3, which is a popular deep learning-based object detector. Then, the distance between the ownership and intruder UAVs was estimated using deep learning approach which only takes images as input. To verify the performance of the CNN distance regression model, two types of videos were acquiring in this study, synthetic and real flight videos. The model evaluation results show that the performance of the proposed method is viable for the SAA of a small UAV with only the onboard camera. The proposed model was evaluated with the videos acquired from the real flight tests, and the results show that the RMSE in the head-on scenario with clear weather condition is only 1.423 m, which is satisfactory for mid-air collision avoidance of small UAVs. The major achievements are summarized as follows:
  • A custom YOLOv3 detector has been trained to detect a fixed-wing aircraft with high accuracy.
  • A vision-based distance estimation approach with monocular camera is proposed to verify the feasibility of mid-air collision avoidance of small UAVs.
  • A CNN distance regression model has been trained and evaluated by using air-to-air videos acquired from real flight tests.
  • A procedure to synthesize the dataset for training and testing of the deep learning-based approach is proposed in this study.
  • The real flight experiments were conducted to evaluate the performance of the proposed approach for the application of SAA and mid-air collision avoidance of small UAVs in the near future.
However, there are still some limitations of the proposed method in this study. One limitation is that the model is very sensitive to the scale of the intruder. Therefore, the size of the intruder should be similar to that used to train the model. The other one is that the model is unable to estimate the objet in long distance since the pixels occupied by the intruder in the cropped image have no significant change and are not able to detect the distance of the intruder. Moreover, the real flight experiments conducted in this study are limited to above-the-horizon scenarios. In the future, below-the-horizon scenarios should be considered to prevent the mid-air collision of the intruder from a lower altitude, and the long-distance estimation is also required to improve the distance estimation model for high-speed UAVs.

Author Contributions

Conceptualization, Y.-C.L. and Z.-Y.H.; methodology, Y.-C.L.; software, Z.-Y.H.; validation, Y.-C.L.; formal analysis, Y.-C.L.; investigation, Y.-C.L. and Z.-Y.H.; resources, Y.-C.L. and Z.-Y.H.; data curation, Z.-Y.H.; writing—original draft preparation, Y.-C.L. and Z.-Y.H.; writing—review and editing, Y.-C.L.; visualization, Z.-Y.H.; supervision, Y.-C.L. All authors have read and agreed to the published version of the manuscript.

Funding

This work is supported by Ministry of Science and Technology of Taiwan (MOST) under contract MOST 108-2221-E-006-071-MY3 and, in part, the Ministry of Education, Taiwan, Headquarters of University Advancement to the National Cheng Kung University (NCKU).

Conflicts of Interest

The authors declare no conflict of interest.

References

  1. Nex, F.; Remondino, F. UAV for 3D mapping applications: A review. Appl. Geomat. 2014, 6, 1–15. [Google Scholar] [CrossRef]
  2. Xu, S.; Savvaris, A.; He, S.; Shin, H.-S.; Tsourdos, A. Real-time implementation of YOLO + JPDA for small scale UAV multiple object tracking. In Proceedings of the 2018 International Conference on Unmanned Aircraft Systems (ICUAS), Dallas, TX, USA, 12–15 June 2018; pp. 1336–1341. [Google Scholar]
  3. Li, J.; Ye, D.H.; Chung, T.; Kolsch, M.; Wachs, J.; Bouman, C. Multi-target detection and tracking from a single camera in Unmanned Aerial Vehicles (UAVs). In Proceedings of the 2016 IEEE/RSJ International Conference on Intelligent Robots and Systems (IROS), Daejeon, Korea, 9–14 October 2016; pp. 4992–4997. [Google Scholar]
  4. Ammour, N.; Alhichri, H.; Bazi, Y.; Benjdira, B.; Alajlan, N.; Zuair, M. Deep learning approach for car detection in UAV imagery. Remote Sens. 2017, 9, 312. [Google Scholar] [CrossRef] [Green Version]
  5. Uto, K.; Seki, H.; Saito, G.; Kosugi, Y. Characterization of rice paddies by a UAV-mounted miniature hyperspectral sensor system. IEEE J. Sel. Top. Appl. Earth Obs. Remote Sens. 2013, 6, 851–860. [Google Scholar] [CrossRef]
  6. James, J.; Ford, J.J.; Molloy, T.L. Learning to Detect Aircraft for Long-Range Vision-Based Sense-and-Avoid Systems. IEEE Robot. Autom. Lett. 2018, 3, 4383–4390. [Google Scholar] [CrossRef] [Green Version]
  7. Fasano, G.; Accado, D.; Moccia, A.; Moroney, D. Sense and avoid for unmanned aircraft systems. IEEE Aerosp. Electron. Syst. Mag. 2016, 31, 82–110. [Google Scholar] [CrossRef]
  8. Yu, X.; Zhang, Y. Sense and avoid technologies with applications to unmanned aircraft systems: Review and prospects. Prog. Aerosp. Sci. 2015, 74, 152–166. [Google Scholar] [CrossRef]
  9. Carnie, R.; Walker, R.; Corke, P. Image processing algorithms for UAV “sense and avoid”. In Proceedings of the 2006 IEEE International Conference on Robotics and Automation (ICRA 2006), Orlando, FL, USA, 15–19 May 2006; pp. 2848–2853. [Google Scholar]
  10. Lai, J.; Ford, J.J.; Mejias, L.; O’Shea, P. Characterization of Sky-region Morphological-temporal Airborne Collision Detection. J. Field Robot. 2013, 30, 171–193. [Google Scholar] [CrossRef] [Green Version]
  11. Nussberger, A.; Grabner, H.; Van Gool, L. Aerial object tracking from an airborne platform. In Proceedings of the 2014 International Conference on Unmanned Aircraft Systems (ICUAS), Orlando, FL, UAS, 27–30 May 2014; pp. 1284–1293. [Google Scholar]
  12. Zhu, Q.; Yeh, M.-C.; Cheng, K.-T.; Avidan, S. Fast human detection using a cascade of histograms of oriented gradients. In Proceedings of the 2006 IEEE Computer Society Conference on Computer Vision and Pattern Recognition (CVPR’06), New York, NY, USA, 17–22 June 2006; pp. 1491–1498. [Google Scholar]
  13. Lowe, D.G. Object recognition from local scale-invariant features. In Proceedings of the Seventh IEEE International Conference on Computer Vision, Kerkyra, Greece, 20–27 September 1999; pp. 1150–1157. [Google Scholar]
  14. Viola, P.; Jones, M. Rapid object detection using a boosted cascade of simple features. In Proceedings of the 2001 IEEE Computer Society Conference on Computer Vision and Pattern Recognition (CVPR 2001), Kauai, HI, USA, 8–14 December 2001; p. I-I. [Google Scholar]
  15. Liu, C.; Chang, F.; Liu, C. Cascaded split-level colour Haar-like features for object detection. Electron. Lett. 2015, 51, 2106–2107. [Google Scholar] [CrossRef]
  16. Ye, D.H.; Li, J.; Chen, Q.; Wachs, J.; Bouman, C. Deep Learning for Moving Object Detection and Tracking from a Single Camera in Unmanned Aerial Vehicles (UAVs). Electron. Imaging 2018, 2018, 4661–4666. [Google Scholar] [CrossRef] [Green Version]
  17. Zhao, Z.-Q.; Zheng, P.; Xu, S.-T.; Wu, X. Object detection with deep learning: A review. IEEE Trans. Neural Netw. Learn. Syst. 2019, 30, 3212–3232. [Google Scholar] [CrossRef] [Green Version]
  18. Ren, S.; He, K.; Girshick, R.; Sun, J. Faster r-cnn: Towards real-time object detection with region proposal networks. In Proceedings of the Advances in Neural Information Processing Systems, Montreal, QC, Canada, 7–12 December 2015; pp. 91–99. [Google Scholar]
  19. He, K.; Gkioxari, G.; Dollár, P.; Girshick, R. Mask r-cnn. In Proceedings of the 2017 IEEE International Conference on Computer Vision (ICCV), Venice, Italy, 22–29 October 2017; pp. 2961–2969. [Google Scholar]
  20. Liu, W.; Anguelov, D.; Erhan, D.; Szegedy, C.; Reed, S.; Fu, C.-Y.; Berg, A.C. Ssd: Single shot multibox detector. In Proceedings of the European Conference on Computer Vision, Amsterdam, The Netherlands, 11–14 October 2016; pp. 21–37. [Google Scholar]
  21. Redmon, J.; Divvala, S.; Girshick, R.; Farhadi, A. You only look once: Unified, real-time object detection. In Proceedings of the IEEE Conference on Computer Vision and Pattern Recognition, Las Vegas, NV, USA, 26 June–1 July 2016; pp. 779–788. [Google Scholar]
  22. Saqib, M.; Khan, S.D.; Sharma, N.; Blumenstein, M. A study on detecting drones using deep convolutional neural networks. In Proceedings of the 2017 14th IEEE International Conference on Advanced Video and Signal Based Surveillance (AVSS), Lecce, Italy, 29 August–1 September 2017; pp. 1–5. [Google Scholar]
  23. Schumann, A.; Sommer, L.; Klatte, J.; Schuchert, T.; Beyerer, J. Deep cross-domain flying object classification for robust UAV detection. In Proceedings of the 2017 14th IEEE International Conference on Advanced Video and Signal Based Surveillance (AVSS), Lecce, Italy, 29 August–1 September 2017; pp. 1–6. [Google Scholar]
  24. Opromolla, R.; Fasano, G.; Accardo, D. A vision-based approach to UAV detection and tracking in cooperative applications. Sensors 2018, 18, 3391. [Google Scholar] [CrossRef] [PubMed] [Green Version]
  25. Jin, R.; Jiang, J.; Qi, Y.; Lin, D.; Song, T. Drone detection and pose estimation using relational graph networks. Sensors 2019, 19, 1479. [Google Scholar] [CrossRef] [PubMed] [Green Version]
  26. Wu, M.; Xie, W.; Shi, X.; Shao, P.; Shi, Z. Real-time drone detection using deep learning approach. In Proceedings of the International Conference on Machine Learning and Intelligent Communications, Hangzhou, China, 6–8 July 2018; pp. 22–32. [Google Scholar]
  27. Rezaei, M.; Terauchi, M.; Klette, R. Robust vehicle detection and distance estimation under challenging lighting conditions. IEEE Trans. Intell. Transp. Syst. 2015, 16, 2723–2743. [Google Scholar] [CrossRef]
  28. Monajjemi, M.; Mohaimenianpour, S.; Vaughan, R. UAV, come to me: End-to-end, multi-scale situated HRI with an uninstrumented human and a distant UAV. In Proceedings of the 2016 IEEE/RSJ International Conference on Intelligent Robots and Systems (IROS), Daejeon, Korea, 9–14 October 2016; pp. 4410–4417. [Google Scholar]
  29. Bauer, P.; Hiba, A.; Bokor, J.; Zarandy, A. Three dimensional intruder closest point of approach estimation based-on monocular image parameters in aircraft sense and avoid. J. Intell. Robot. Syst. 2019, 93, 261–276. [Google Scholar] [CrossRef] [Green Version]
  30. Zhang, Y.; Wang, W.; Huang, P.; Jiang, Z. Monocular Vision-based Sense and Avoid of UAV Using Nonlinear Model Predictive Control. Robotica 2019, 37, 1582–1594. [Google Scholar] [CrossRef]
  31. Wang, Y.; Wang, C.; Zhang, H.; Dong, Y.; Wei, S. Automatic ship detection based on RetinaNet using multi-resolution Gaofen-3 imagery. Remote Sens. 2019, 11, 531. [Google Scholar] [CrossRef] [Green Version]
  32. Luo, X.; Tian, X.; Zhang, H.; Hou, W.; Leng, G.; Xu, W.; Jia, H.; He, X.; Wang, M.; Zhang, J. Fast Automatic Vehicle Detection in UAV Images Using Convolutional Neural Networks. Remote Sens. 2020, 12, 1994. [Google Scholar] [CrossRef]
  33. Ophoff, T.; Puttemans, S.; Kalogirou, V.; Robin, J.-P.; Goedemé, T. Vehicle and Vessel Detection on Satellite Imagery: A Comparative Study on Single-Shot Detectors. Remote Sens. 2020, 12, 1217. [Google Scholar] [CrossRef] [Green Version]
  34. Ponce, H.; Brieva, J.; Moya-Albor, E. Distance estimation using a bio-inspired optical flow strategy applied to neuro-robotics. In Proceedings of the 2018 International Joint Conference on Neural Networks (IJCNN), Rio, Brazil, 8–13 July 2018; pp. 1–7. [Google Scholar]
  35. Haseeb, M.A.; Guan, J.; Ristić-Durrant, D.; Gräser, A. DisNet: A novel method for distance estimation from monocular camera. In Proceedings of the 10th Planning, Perception and Navigation for Intelligent Vehicles (PPNIV18), Madrid, Spain, 1 October 2018. [Google Scholar]
  36. Redmon, J.; Farhadi, A. Yolov3: An incremental improvement. arXiv 2018, arXiv:1804.02767. [Google Scholar]
  37. Jensen, M.B.; Nasrollahi, K.; Moeslund, T.B. Evaluating state-of-the-art object detector on challenging traffic light data. In Proceedings of the IEEE Conference on Computer Vision and Pattern Recognition Workshops, Honolulu, HI, USA, 21–26 July 2017; pp. 9–15. [Google Scholar]
  38. Lin, T.-Y.; Maire, M.; Belongie, S.; Hays, J.; Perona, P.; Ramanan, D.; Dollár, P.; Zitnick, C.L. Microsoft coco: Common objects in context. In Proceedings of the European Conference on Computer Vision, Zurich, Switzerland, 5–12 September 2014; pp. 740–755. [Google Scholar]
  39. Simonyan, K.; Zisserman, A. Very deep convolutional networks for large-scale image recognition. arXiv 2014, arXiv:1409.1556. [Google Scholar]
  40. Agarap, A.F. Deep learning using rectified linear units (relu). arXiv 2018, arXiv:1803.08375. [Google Scholar]
  41. Opromolla, R.; Inchingolo, G.; Fasano, G. Airborne visual detection and tracking of cooperative UAVs exploiting deep learning. Sensors 2019, 19, 4332. [Google Scholar] [CrossRef] [PubMed] [Green Version]
Figure 1. Flow chart of research process.
Remotesensing 12 03035 g001
Figure 2. Synthetic image made by Blender.
Remotesensing 12 03035 g002
Figure 3. Labeling image of the training dataset.
Remotesensing 12 03035 g003
Figure 4. Detection results of the custom you only look once (YOLO)v3 detector on synthetic images.
Remotesensing 12 03035 g004
Figure 5. Detection results of the custom YOLOv3 detector from real images.
Remotesensing 12 03035 g005
Figure 6. The architecture of the convolutional neural network (CNN) distance estimation system.
Remotesensing 12 03035 g006
Figure 7. Feature extraction network architecture of the CNN distance model.
Remotesensing 12 03035 g007
Figure 8. The architecture of the distance regression network.
Remotesensing 12 03035 g008
Figure 9. Evaluation results of the models with different amounts of fully connected (FC) layers.
Remotesensing 12 03035 g009
Figure 10. Using Blender to collect images to train the model.
Remotesensing 12 03035 g010
Figure 11. Synthetic image rendered by Blender.
Remotesensing 12 03035 g011
Figure 12. Examples of the cropped images with different distances and orientations for model training.
Remotesensing 12 03035 g012
Figure 13. Training results of 150 epochs.
Remotesensing 12 03035 g013
Figure 14. The architecture of the deep neural network (DNN) distance estimation system.
Remotesensing 12 03035 g014
Figure 15. Process to rectify the bounding box given by the YOLOv3 detector.
Remotesensing 12 03035 g015
Figure 16. Architecture of the DNN distance network.
Remotesensing 12 03035 g016
Figure 17. Comparison of CNN and DNN distance regression models: (a,b) the distance range of the intruder flying from 60 to 30 m; (c) the distance ranges from 50 to 35 m.
Remotesensing 12 03035 g017
Figure 18. Synthetic videos for model evaluation. The red box indicates the crossing case, and the yellow box indicates the head-on case.
Remotesensing 12 03035 g018
Figure 19. Distance estimation from six different synthetic videos. (a,c,d) are crossing cases, and (b,e,f) are head-on cases.
Remotesensing 12 03035 g019aRemotesensing 12 03035 g019b
Figure 20. Flight path of the intruder in Experiment 1.
Remotesensing 12 03035 g020
Figure 21. Measurements of global positioning system (GPS) data to evaluate the model in Experiment 1.
Remotesensing 12 03035 g021
Figure 22. Result of model evaluation in Experiment 1.
Remotesensing 12 03035 g022
Figure 23. Flight path of the intruder in Experiment 2.
Remotesensing 12 03035 g023
Figure 24. Measurements of GPS data for model evaluation in Experiment 2.
Remotesensing 12 03035 g024
Figure 25. Result of model evaluation in Experiment 2.
Remotesensing 12 03035 g025
Figure 26. Flight path of the intruder in Experiment 3.
Remotesensing 12 03035 g026
Figure 27. Measurements of GPS data for model evaluation in Experiment 3.
Remotesensing 12 03035 g027
Figure 28. Result of model evaluation in Experiment 3.
Remotesensing 12 03035 g028
Figure 29. Flight path of the intruder in Experiment 4.
Remotesensing 12 03035 g029
Figure 30. Measurements of GPS data for model evaluation in Experiment 4.
Remotesensing 12 03035 g030
Figure 31. Result of model evaluation in Experiment 4.
Remotesensing 12 03035 g031
Table 1. Information regarding the training dataset.
InformationSize
Image shape before being cropped3840 × 2160 × 3
Cropped image shape100 × 100 × 3
AttitudeRotation Range
Roll angle range 15 ° ~ 15 °
Pitch angle range 15 ° ~ 15 °
Yaw angle range 75 ° ~ 75 °
Table 2. Image augmentation parameters.
AugmentationParameter
Width shift range0.35
Height shift range0.35
Rotation range3
Fill modenearest
Table 3. Information regarding the synthetic videos.
Video TypeCaseWeather Condition
SyntheticHead-onClear/Cloudy
CrossingClear/Cloudy
Table 4. Estimated distance vs. ground truth.
SetFigureWeatherCaseDistance RangeRMSERMSE_K
I(a)Clearcrossing60 m~30 m1.580 m0.651 m
(b)head-on60 m~33 m1.301 m0.726 m
(c)crossing50 m~35 m1.641 m1.224 m
II(d)Cloudycrossing80 m~50 m2.243 m1.753 m
(e)head-on80 m~50 m1.379 m1.435 m
(f)head-on80 m~40 m1.652 m1.338 m
Table 5. Specifications regarding the imaging system of the ownership.
Sensor1/2.4″ Complementary Metal-Oxide-Semiconductor (CMOS)
LensASPH (Low-dispersion aspherical lens)
Aperture: f/2.4
Focal Length: 26–78 mm (video)
Depth of field: 1.5 m – ∞
Video resolution4K Cinema 4096 × 2160 24 fps
4K Ultra High Definition 3840 × 2160 24/25/30 fps
Video horizontal field of view: 69°
Table 6. Experiment 1 (estimation vs. GPS measurement).
CaseHead-OnWeather ConditionMisty
PointMEAS (m)EST (m)PointMEAS (m)EST (m)
162.6858.67741.246.24
259.1558.35837.2342.4
355.5255.41933.5339.35
451.7853.341029.8132.55
54848.391125.7424.52
64447.241222.0518.68
RMSE3.369 m
Table 7. Experiment 2 (estimation vs. GPS measurement).
CaseCrossingWeather ConditionMisty
PointMEAS (m)EST (m)PointMEAS (m)EST (m)
161.5363.68940.3643.03
258.8562.31037.8240.95
356.1658.661135.338.93
453.5158.281232.836.26
550.8354.991330.3532.86
648.1952.641427.9830
745.5549.151525.7126.73
842.9448.33
RMSE3.445 m
Table 8. Experiment 3 (estimation vs. GPS measurement).
CaseHead-OnWeather ConditionCloudy
PointMEAS (m)EST (m)PointMEAS (m)EST (m)
170.9170.66945.1944.86
267.6770.141041.9941.41
364.4561.471138.838.53
461.2555.731235.5834.26
558.0458.041332.3628.75
654.8354.851429.1426.01
751.651.41525.8820.65
848.448.81
RMSE2.559 m
Table 9. Experiment 4 (estimation vs. GPS measurement).
CaseHead-OnWeather ConditionCloudy
PointMEAS (m)EST (m)PointMEAS (m)EST (m)
171.2071.15842.4243.91
267.169.9938.3239.47
362.9964.781034.1835.29
458.8859.971130.0731.19
554.7655.61225.9326.96
650.6451.531321.8223.92
746.5447.64
RMSE1.423 m

