Article

Assessing the Influence of UAV Altitude on Extracted Biophysical Parameters of Young Oil Palm

1
Faculty of Environmental Earth Science, Hokkaido University, Sapporo 060-0810, Japan
2
Graduate School of Environmental Earth Science, Hokkaido University, Sapporo 060-0810, Japan
3
Faculty of Plantation and Agrotechnology, Universiti Teknologi MARA (UiTM), Shah Alam, Selangor 40450, Malaysia
4
Faculty of Plantation and Agrotechnology, Universiti Teknologi MARA (UiTM) Sabah Branch, Kota Kinabalu, Sabah 88997, Malaysia
5
Center for Climate Change Adaptation, National Institute for Environmental Studies, Tsukuba, Ibaraki 305-8506, Japan
*
Author to whom correspondence should be addressed.
Remote Sens. 2020, 12(18), 3030; https://doi.org/10.3390/rs12183030
Submission received: 27 August 2020 / Revised: 10 September 2020 / Accepted: 14 September 2020 / Published: 17 September 2020

Abstract

:
The information on biophysical parameters—such as height, crown area, and vegetation indices such as the normalized difference vegetation index (NDVI) and normalized difference red edge index (NDRE)—are useful to monitor health conditions and the growth of oil palm trees in precision agriculture practices. The use of multispectral sensors mounted on unmanned aerial vehicles (UAV) provides high spatio-temporal resolution data to study plant health. However, the influence of UAV altitude when extracting biophysical parameters of oil palm from a multispectral sensor has not yet been well explored. Therefore, this study utilized the MicaSense RedEdge sensor mounted on a DJI Phantom–4 UAV platform for aerial photogrammetry. Three different close-range multispectral aerial images were acquired at a flight altitude of 20 m, 60 m, and 80 m above ground level (AGL) over the young oil palm plantation area in Malaysia. The images were processed using the structure from motion (SfM) technique in Pix4DMapper software and produced multispectral orthomosaic aerial images, digital surface model (DSM), and point clouds. Meanwhile, canopy height models (CHM) were generated by subtracting DSM and digital elevation models (DEM). Oil palm tree heights and crown projected area (CPA) were extracted from CHM and the orthomosaic. NDVI and NDRE were calculated using the red, red-edge, and near-infrared spectral bands of orthomosaic data. The accuracy of the extracted height and CPA were evaluated by assessing accuracy from a different altitude of UAV data with ground measured CPA and height. Correlations, root mean square deviation (RMSD), and central tendency were used to compare UAV extracted biophysical parameters with ground data. Based on our results, flying at an altitude of 60 m is the best and optimal flight altitude for estimating biophysical parameters followed by 80 m altitude. The 20 m UAV altitude showed a tendency of overestimation in biophysical parameters of young oil palm and is less consistent when extracting parameters among the others. The methodology and results are a step toward precision agriculture in the oil palm plantation area.

Graphical Abstract

1. Introduction

The oil palm (Elaeis guineensis) is an important industrial cash crop for major producer countries such as Indonesia, Malaysia, and Thailand, which provide sizeable economic benefits both from employment and income through exports [1]. Malaysia is the second-largest producer of oil palm and employs more than 600,000 high- and low -skilled laborers. In the next few years, over 66,000 new jobs are expected to be created through continued research and innovation [2]. According to the Department of Statistics in Malaysia, oil palm is a significant contributor to the gross domestic product (GDP) of the agriculture sector by 46% in 2017 [3]. Oil palm is the most significant source of vegetable oil because of its high yield and extended productivity with a lifespan up to 25 years [4]. Currently, 4.49 million hectares of land in Malaysia is planted with oil palm, which produced 17.73 million tons of oil palm [5]. More land areas for expansion of oil palm plantations are controversial and not sustainable; hence, there is a need to optimize and maximize oil palm yield and production [6]. Moreover, the yield of oil palm plantation depends mostly on plant health. In addition, the corresponding market price depends heavily on the quality of oil palm [1]. However, oil palm growth is susceptible to the effects of climate change through a range of expected biotic (e.g., pests, diseases, pollinators, associated crops) and abiotic (e.g., temperature, rainfall, soil moisture, soil pH) stresses [7].
Information on oil palm plantation health conditions provides valuable inputs for the oil palm companies for planning, decisions, and management strategies. Information technology plays a vital role in increasing the cost-effectiveness of agriculture practices in precision agriculture. Precision agriculture implements management activities, both spatially and temporally. These include pre-planting, planting, fertilizing, crop protection, harvesting, and irrigation [8]. Remote sensing is one of the main tools that supports precision agriculture as the spatial data provider with its spectral capability to detect some variables, including soil properties, plant health, and crop yields [9]. In the case of oil palm plantations, plant health detection at an early stage is crucial to curb future losses from underperforming trees. There could be several reasons for low yields, such as diseases, pest attacks, weak quality seedlings, fertilizers, climatic, and edaphic factors that require further investigations. Previous studies reported that early monitoring of oil palm health not only promotes appropriate and effective remedial measures but also extends oil palm lifespan and increases productivity [10]. The health of oil palm can be monitored by studying the biophysical parameters such as height, crown size, and vegetation vigor. Spectral reflectance-based vegetation indices are effective in monitoring vegetation vigor and phenological parameters [11]. Several biophysical parameters such as leaf area index (LAI), crown diameter, crown projection area (CPA), vigor, and tree height are positively correlated with the plant growth stage [12]. Real-time quantification of these parameters can be useful for detecting the health of a tree, which allows the selection of appropriate remedial measures such as the use of fertilizer, insecticides, and irrigation to improve tree health. Meng et al. studied real-time detection of ground objects using unmanned aerial vehicle (UAV) and deep learning methods in China [13].
The recent development in UAV techniques made it possible to apply low altitude photogrammetric techniques in precision agriculture due to their flexibility and low cost [14]. In the oil palm industry, UAV-based imaging provides low cost flexible data acquisition with less weather constraints and higher spatial/temporal resolution, as compared to high-resolution satellite data [15]. There are various applications of UAV, such as monitoring canopy structure and condition, mapping biomass, and precision agriculture [16,17]. There are ground-based sensors available for precision agriculture applications, but UAV-based monitoring is advantageous in generating smaller ground sample distances, instantaneous calibration to reflectance, and point cloud construction [18]. The structure from motion (SfM) technique is useful to characterize individual trees [17]. Díaz-Varela et al. and Zarco-Tejada et al. used the SfM technique to estimate olive tree height and crown diameter in Spain [19,20]. Previous studies showed that UAV-based SfM derived canopy cover of oil palm showed 20-50% overestimation as compared to ground-based measurement [21]. Usually, before conducting aerial surveys, several parameters need to be optimized. These include flight altitude, image overlap, speed, resolution, and area of coverage [22]. Logically, higher flight altitude captures a smaller number of images with lower ground sample distance (GSD) because of the broad field of view of the camera sensors onboard the UAV. High flight altitude can influence the accuracy of information derived for an object due to the decline of the image detail [23]. Hence, lower altitude UAV flight (15–30 m) can provide more accurate and detailed image information [22]. However, it has been reported that there is no significant difference in the normalized difference vegetation index (NDVI) value between two objects (weed and crop) in images taken from 60 m, 80 m, and 100 m above ground level [24]. Moreover, the reconstruction of 3D point clouds is sensitive to the movement of twigs and leaves induced by wind [22]. As the UAV flies lower, the camera captures more images so that the possibility of the object movement becomes greater. In addition, more images require more storage capacity and more computing power for processing.
Oil palm plantations generally cover a large area. However, UAV data collected at low flight altitudes can only cover a small area in a given time. There is a trade-off between flight altitude and area covered during the flight [22]. Some aerial surveys conducted over oil palm considered using 80 m, 100 m, and 150 m flight height [1,23,25]. See et al. found that 80 m altitude aerial images produced a fair amount of accuracy in individual tree identification and tree crown delineation in matured oil palm plantations [1]. A previous study on the comparison between fixed-wing and multi-rotor UAVs suggests that flying altitude below 150 m is suitable for environmental mapping for better representation of vegetation features. Multi-rotor UAV systems are more accurate and better suited for small areas than fixed-wing drones [22]. The flight altitude can directly influence the details and quality of the derived biophysical vegetation parameters. There is a lack of studies about the influence of low flight altitude on the extraction of biophysical parameters of young oil palm. Only a few studies noticed the impact of flight altitude on data acquisition and processing time [26]. Furthermore, Torres-Sanchez et al. investigated the influence of UAV collected image overlap on computation and DSM accuracy in olive orchards in Calancha, Spain [27]. Therefore, it is necessary to understand the influence of flight altitude on derived biophysical parameters of young oil palm for precision agriculture studies. This study attempts to compare the influence of different flight altitudes to derive biophysical parameters of young oil palm using the SfM technique.

2. Study Area

The study site lies between latitude 5°8′8.368″N to 5°8′4.852″N and longitude 118°24′26.299″E to 118°24′35.717″E in the Lahad Datu district of the Eastern coast of Sabah, Malaysia. The area of interest (AOI) covers 5.2 acres of young oil palm planted trees (Figure 1). In total, 241 young oil palm trees with the age of 3 to 4 years were present in the study area. All the oil palm trees were planted with a fixed tree spacing of approximately 8 × 8 m. The climate of the study area is tropical, with an average annual temperature of 26.9 °C and an average rainfall of 2063 mm [28]. Figure 1 shows the location of the study area and individual oil palm trees in the inset aerial images of the AOI.
Besides oil palm trees, the ground area is covered with Mucuna Bracteata, a type of land cover crop purposely planted to protect the soil from weeds. Mucuna Bracteata in oil palm plantations also helps to maintain soil moisture content, supply organic matter, and protect from soil erosion [29]. Some of the trees were affected by Rhinoceros beetle (Oryctes rhinoceros L.) and other pests in the study area. Hence, some of the trees were showing damaged fronts and dying leaves. Rhinoceros beetles (RB) destroy the young oil palm trees by burrowing into the shoots and young fronts. Figure 2a,b show a healthy and diseased oil palm tree, respectively. Figure 2c shows a variety of damages caused by RB and other pests. Overall, the affected oil palm trees show biological and physical damages such as dying leaves, stunted growth, and irregular crowns. Therefore, the detection of these diseased trees is essential to follow up treatment and control over the spreading to other healthy oil palm trees.

3. Materials and Methods

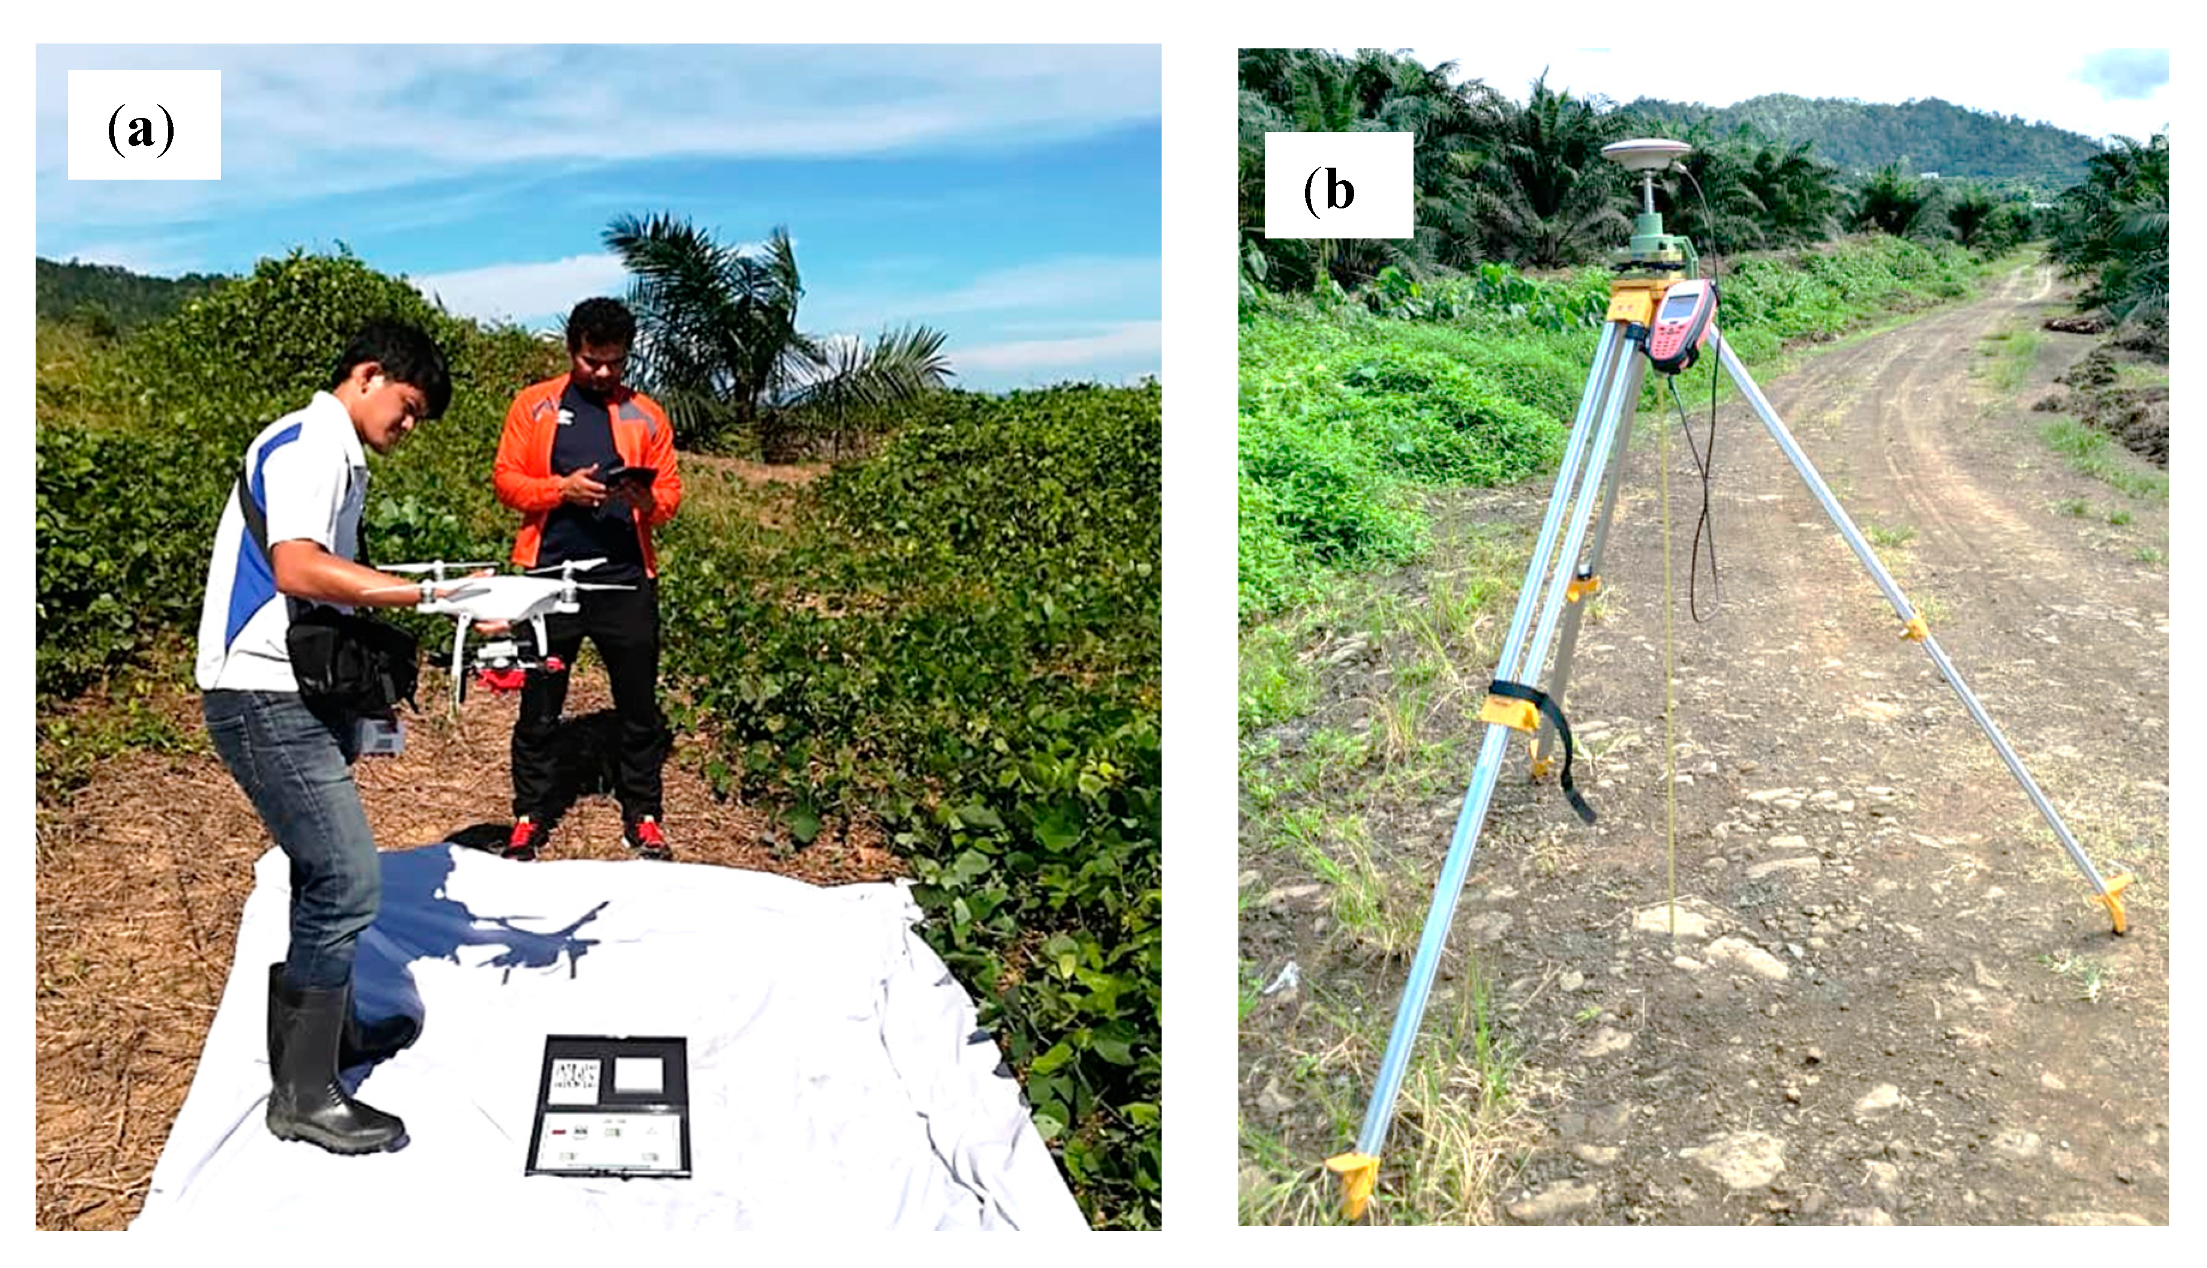
3.1. Aerial Imaging Tools and Data Collections

For the aerial surveys, DJI Phantom–4 mounted with a MicaSense RedEdge multispectral sensor at downward-facing/nadir was used. A multi-rotor UAV platform was chosen for this study because it is capable of capturing images at low altitudes for close-range photogrammetry. Phantom–4 is a quadcopter, which enables vertical take-off and landing, as well as slow flight speed to provide a stable platform for the multispectral camera. The MicaSense RedEdge camera was mounted with a GPS device to acquire geotagged images with 2–3 m accuracy [30]. It captures information in five spectral bands within the visible to red-edge and infrared spectrum. A downwelling light sensor (DLS) and calibrated reflectance panel were used to calibrate the images according to ambient light (Figure 3a). The MicaSense RedEdge Multispectral sensor was calibrated on-site before each flight using the reference panel for accurate ground reflectance calibration (Figure 3a). Table 1 and Table 2 show the specifications of MicaSense RedEdge sensor and details about the spectral bands with wavelength and bandwidth, respectively. Ground control points (GCPs) were collected using Leica GS20 real-time differential GPS base and rover system with sub-meter accuracy (Figure 3b). Handheld Garmin GPSMAP 60CSx and GoPro Hero-6 Action Camera were used to record location points and capture images of oil palm tree conditions. Oil palm tree height and crown diameter samples were also measured at the ground using the measuring tape and a height stick.
The UAV surveys were conducted on 29 and 30 August 2018 between 10–12 a.m. The weather conditions during the data acquisitions were adequate with enough solar illumination, calm wind with a slight breeze, and no clouds. The flight missions were planned using the DJI flight planner and executed by Pix4DCapture apps. A single grid type flight plan was deployed in an automatic mode at three different flight altitudes of 20 m, 60 m, and 80 m above ground level (AGL). The UAV flight speed of each flight altitude was at 5 m/s. The MicaSense RedEdge camera was programmed using Bluetooth connection to capture every 2 seconds and preview the initial test images every time before take-off. This was to ensure image capturing was started with the right exposure setting, which was calibrated before every flight missions. Images were captured with a flight path setting of 80% front overlap and 75% side lap. The ground sampling distance (GSD) varies with the flight altitude. The time required for the processing of aerial images at different flight altitudes with the same workstation was also recorded and summarized in Section 4.1.

3.2. Data Processing

The flowchart of the proposed method is summarized in Figure 4. The overall aim is to investigate the influence of UAV altitude using MicaSense RedEdge Multispectral sensor on the extracted oil palm’s biophysical parameters. Therefore, a suitable spatial scale of data collection could be determined, which will be useful for precision agriculture applications. The collected multispectral images at altitude 20 m, 60 m, and 80 m were processed using the structure from motion (SfM) technique in PiX4D mapper software running in a workstation with an Intel Core i7–(9700) processor and with 16 GB random access memory (RAM). Standard image processing steps in the Pix4Dmapper software were followed. In the initial processing, the individual bands (B, G, R, R-Edge, and NIR) of the aerial images were radiometrically corrected using reference images of the calibration panel, which were also collected in the field before every flight. Then, followed by key point extraction, matching, camera optimization, and geolocations of GCPs occurred. The coordinate system used in this study is the local coordinate system of a Borneo rectified skew orthomorphic (BRSO) Timbalai 1948 in meters measurement unit. The processing was then followed by steps of creating point clouds with scale constraint defined setting and meshing in Pix4Dmapper with settings selected at high resolution. The final steps of the processing were the generation of outputs of multispectral orthomosaic (B, G, R, R-Edge, and NIR) in GeoTIFF format, point clouds in LAS format, and digital surface model (DSM) in GeoTIFF format.
The point clouds were used to produce DEM and to subtract the DSM for canopy height models (CHM) production and subsequently to delineate individual oil palm tree crowns for generating the CPA (details in Section 3.2.1, Section 3.2.2 and Section 3.2.3). The orthomosaics were used for the transformations to vegetation indices of NDVI and normalized difference red edge index (NDRE). Figure 5 shows the images in true color composite with the orthomosaics combination of RGB bands at a flight altitude of 20 m, 60 m, and 80 m. Figure A1 and Figure A2 illustrate the output of 3D point clouds and 3D DSM for the three flights altitude, respectively. Statistical information of the biophysical parameters of CPA, height, including vegetation indices (NDVI and NDRE) of individual oil palm trees, were extracted and analyzed. The statistical analysis was performed with the help of central tendencies and histogram of difference to see the deviation of biophysical parameters at different flight altitudes.

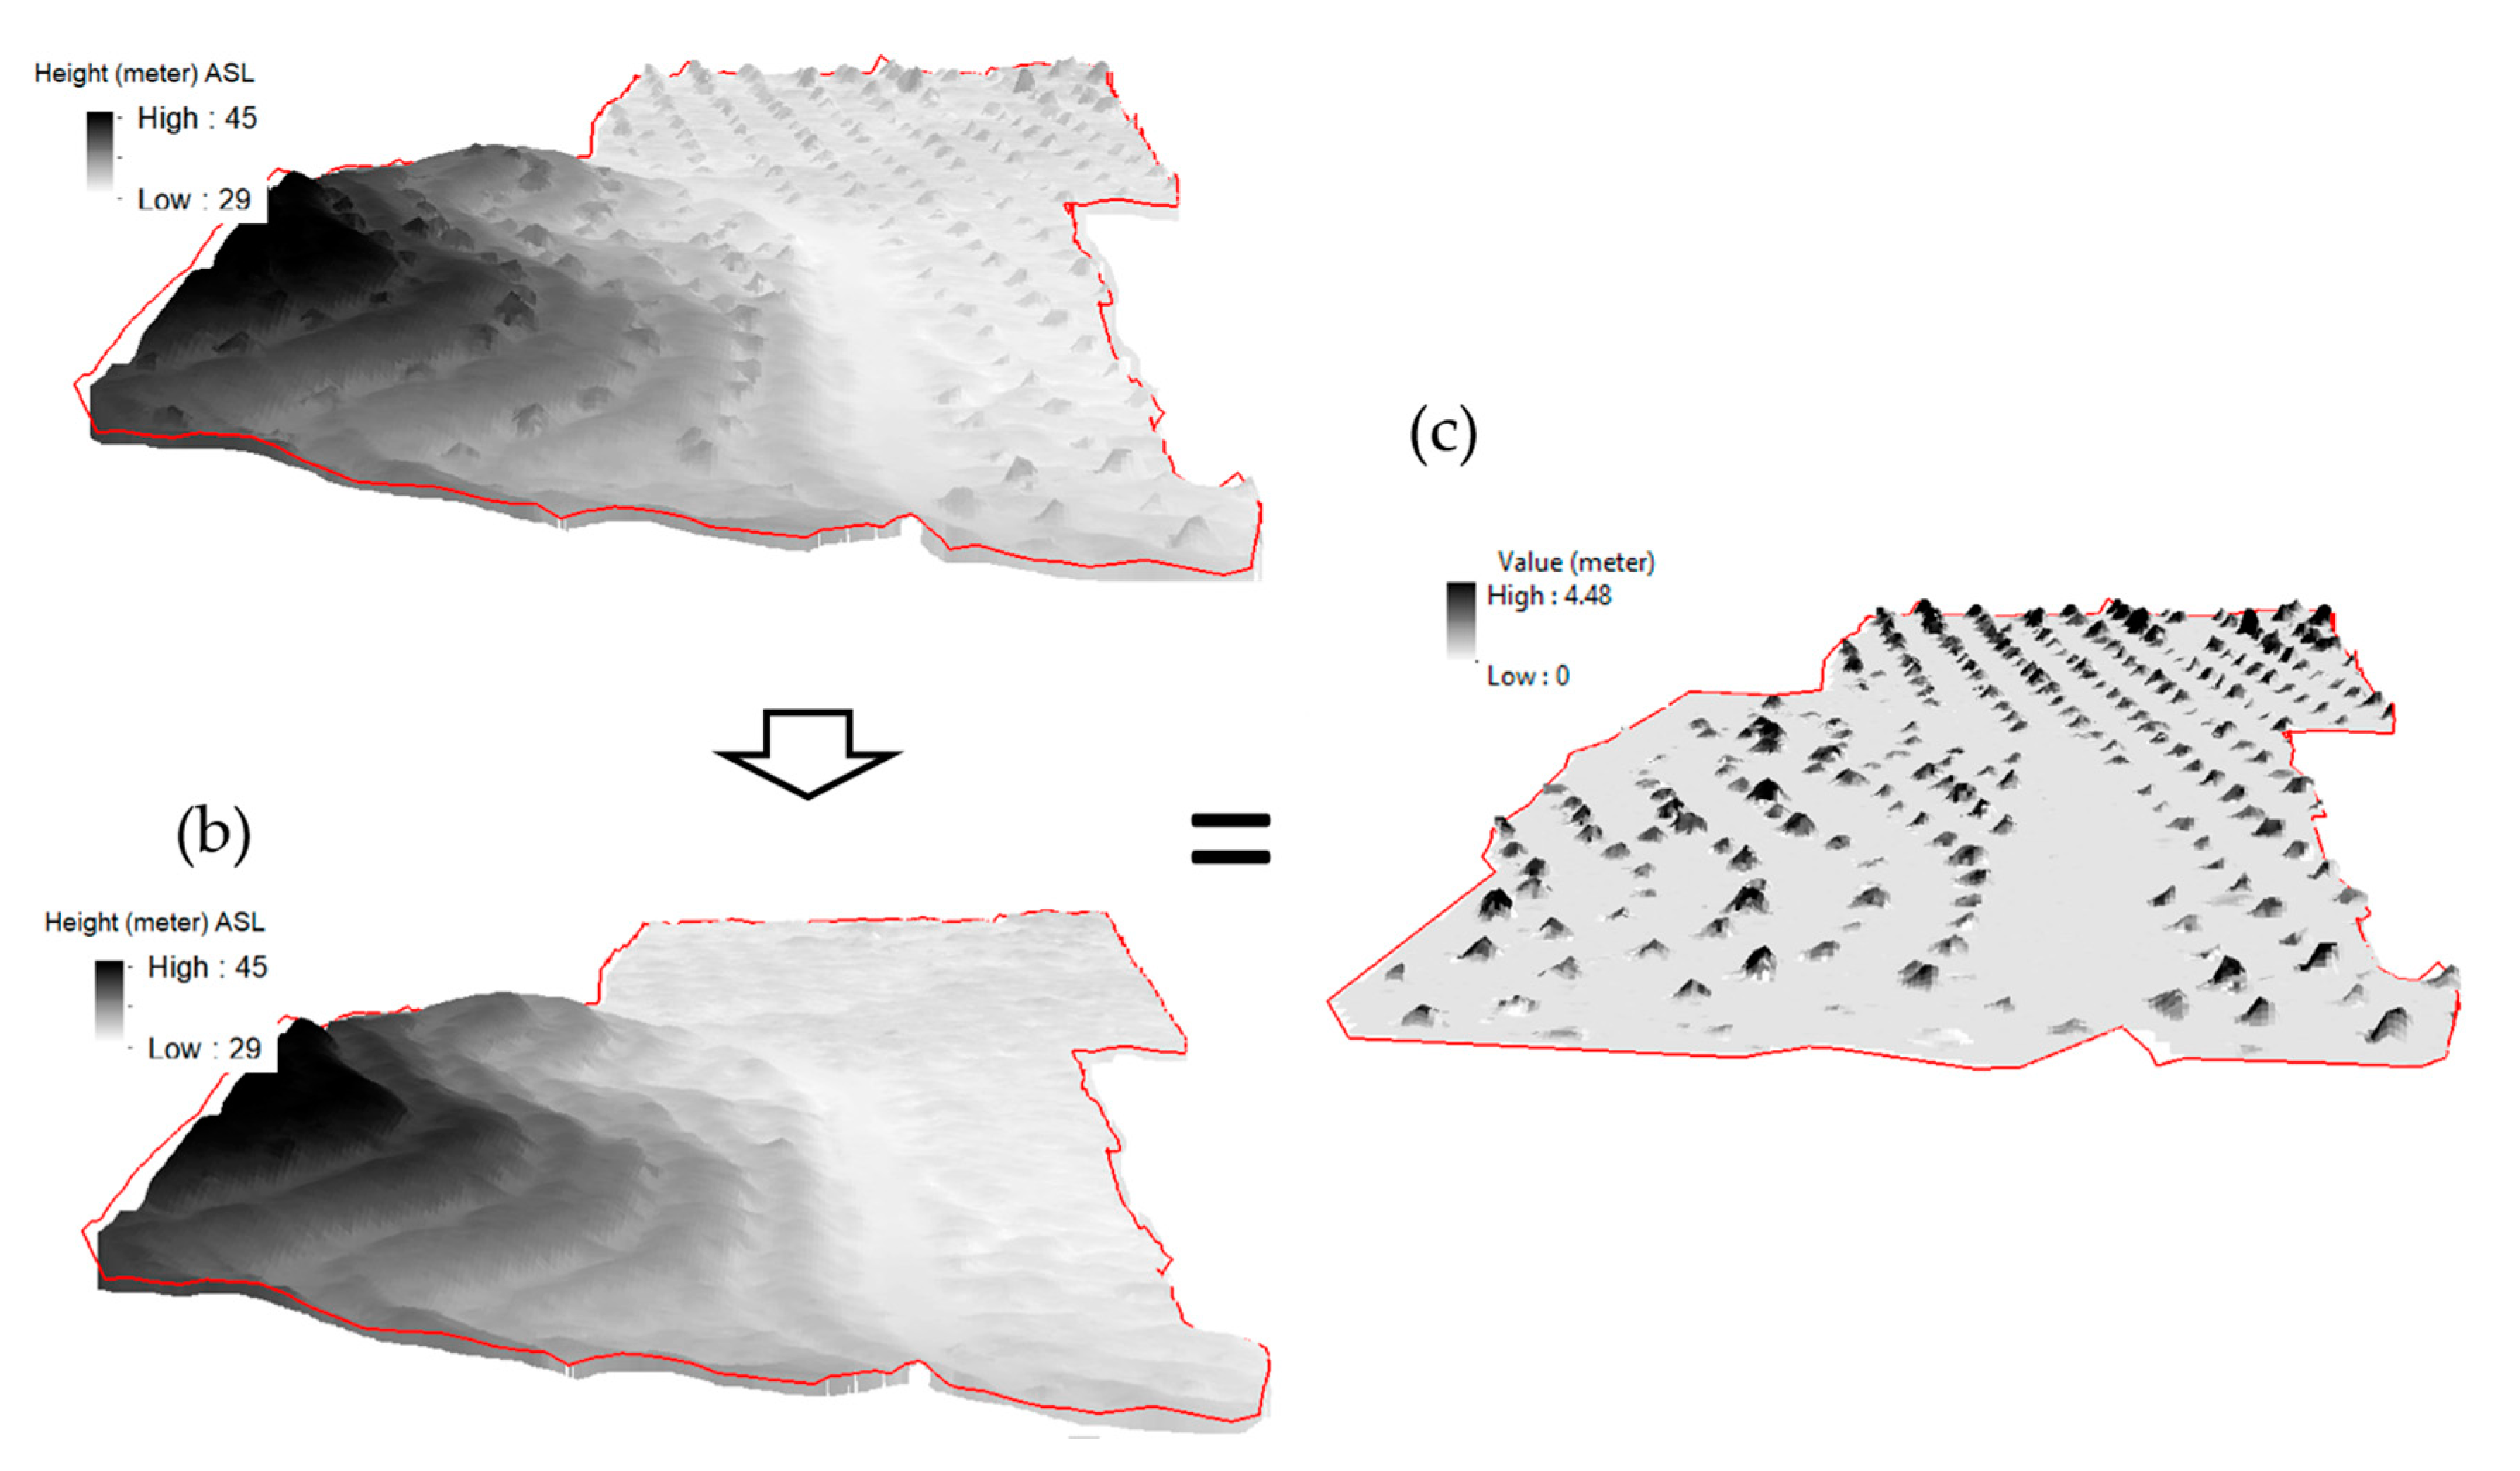
3.2.1. Classifications of Point Clouds and Production of DSM and DEM

The point clouds were classified to separate oil palm trees (off-ground points) and ground elevations (ground points) using automatic cloth simulation filter (CSF) in CloudCompare software. However, automatic CSF classification was not sufficient; some remaining off-ground points in the ground class were cleaned manually. It was observed that CSF was unable to totally clean off ground point clouds because of the inability to detect independent non-grouped off ground points. Cleaned ground point clouds were used to produce the digital elevation model (DEM) of the study area while the original was for productions of DSM directly. The term DEM was employed because the ground points did not indicate real bare ground. The ground was covered by the legume crop Mucuna Bracteata at a height of approximately less than 25 cm. Figure 6a,b illustrate the original point clouds and classification operations to extract ground elevation, respectively.

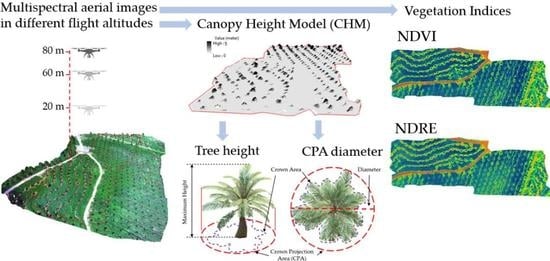
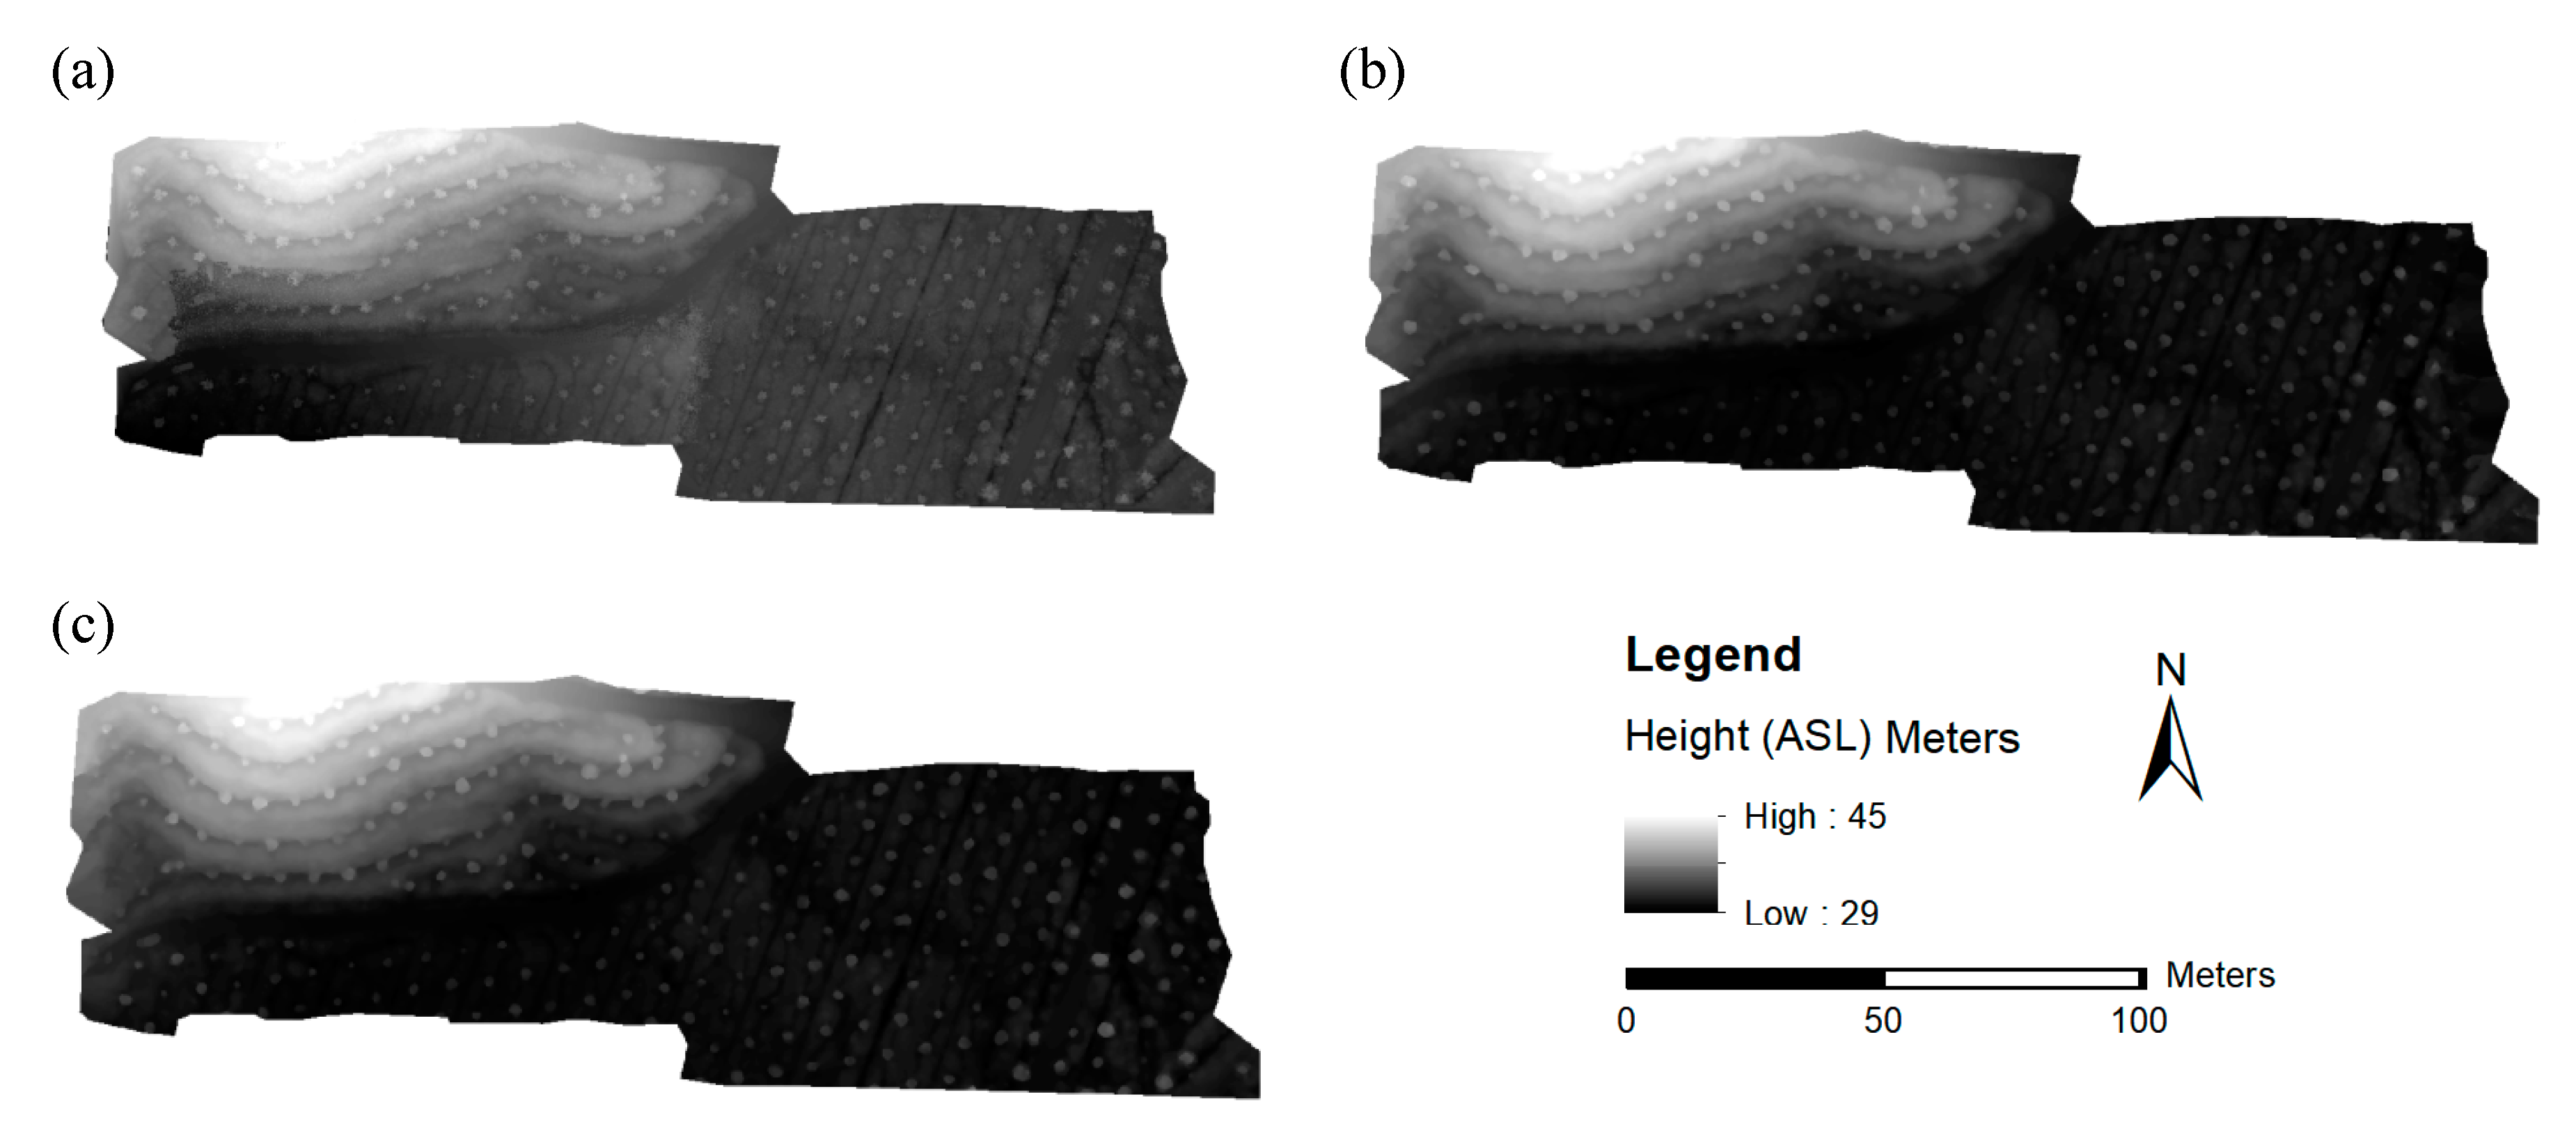
3.2.2. Production of Canopy Height Model (CHM)

The canopy height model (CHM) was derived by simple subtraction of the DEM from the DSM (i.e., CHM = DSM − DEM) computed in ArcMap using the Raster Calculator tools. The CHM process is illustrated in Figure 7, with all DEM, DSM, and CHM showed from 3D perspectives. It can be observed in the CHM that individual oil palm tree canopies with crown and height were depicted in black to white color height gradient.

3.2.3. Height, Crown Area, and Crown Projection Area (CPA)

The crown area of individual trees were extracted into vector format by generating contours at a specified height of crown edges of CHM for each altitude in Global Mapper software. In CHM, the pixels with high values represent the presence of the oil palm trees, as compared to the surrounding CHM, which has zero value after the terrain was completely removed (Figure 7c). The extracted individual tree crown area vectors were filtered to remove small polygons that did not represent oil palm trees. Subsequently, information of individual oil palm tree height was derived from the CHM-based on crown area maximum height using zonal statistics in ArcMap software. As a result, individual oil palm tree height was stored in a tabular format. Additionally, the CPA was generated using “minimum bounding geometry” in a circle that represents the generalized size of the area covered by the crown. Figure 8 represents the biophysical parameters of individual oil palm trees. Height, crown area, and CPA information were combined into the attribute table of individual trees.

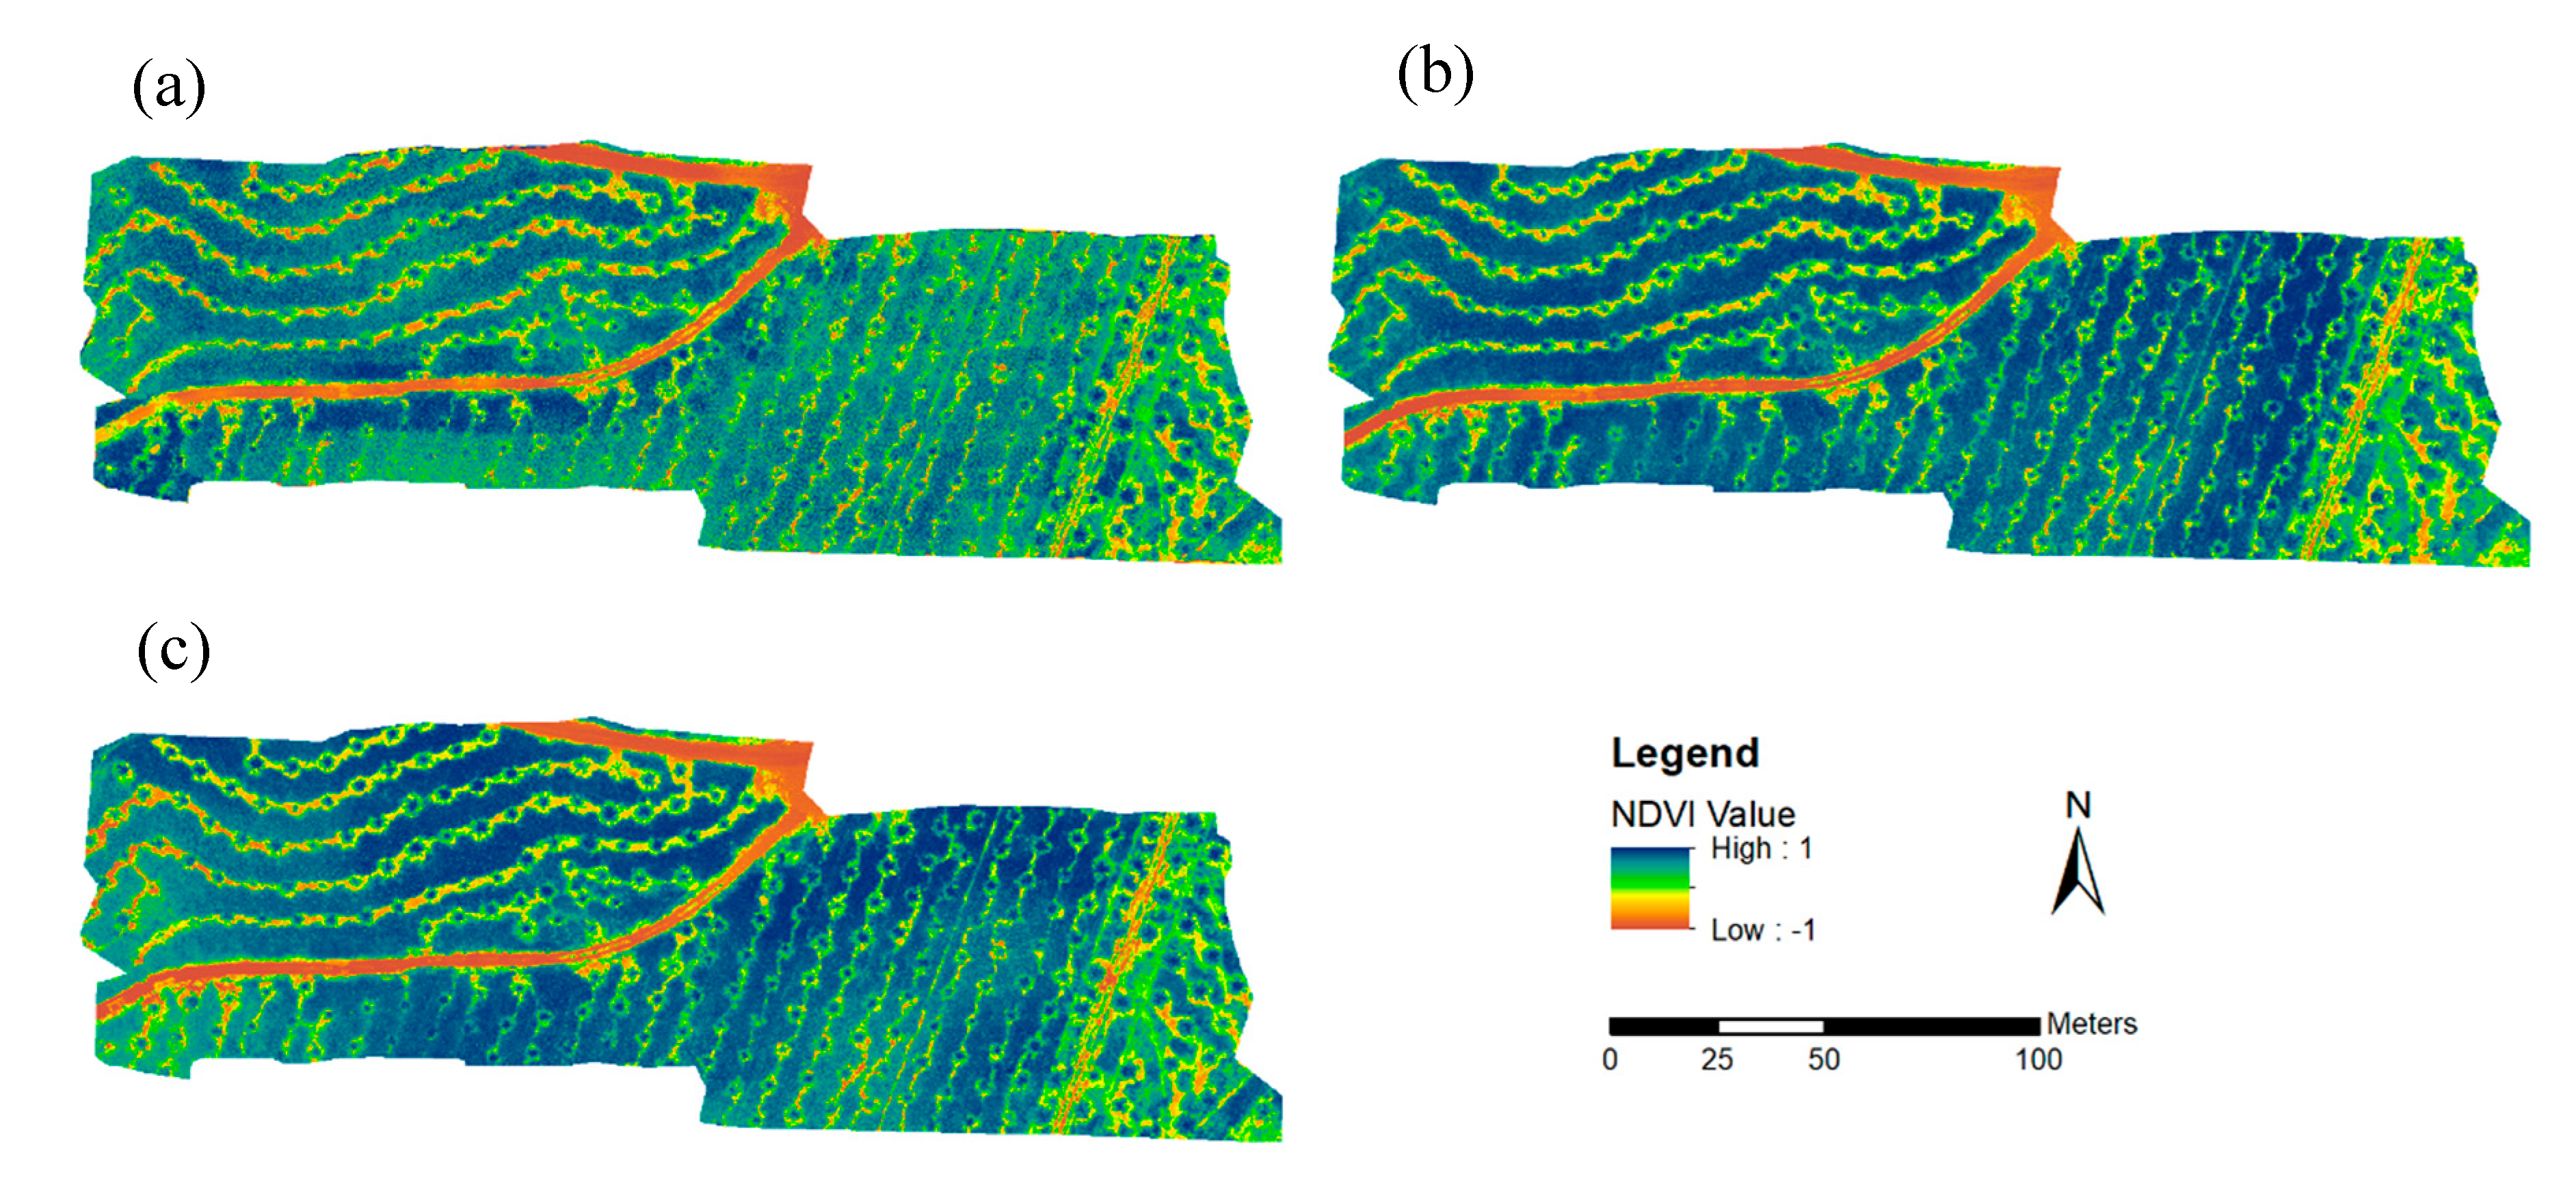
3.2.4. Vegetation Indices (NDVI and NDRE) Transformations

The land use and land cover in the study site are mainly oil palm trees, Mucuna Bracteata, and exposed soil. Previous studies have used various vegetation indices based on UAV acquired data to delineate information about various vegetation parameters [31,32,33]. These vegetation indices have been widely used to identify vegetation and soil properties. Basically, plants interact with incident solar radiation by absorbing, transmitting, and/or reflecting electromagnetic radiation. The reflected radiation contained information about the plants’ biophysical composition and physiological status and is measured with multispectral sensors [34]. In this study, NDVI and NDRE were computed using ArcMap software. NDVI is a standard spectral transformation technique used for monitoring vegetation health [35,36]. NDVI shows a strong sensitivity to the vegetation as compared to the background soil. The equation for calculation of NDVI is given below:
N D V I = N I R R e d N I R + R e d
where red represents reflectance in red band and NIR is the reflectance in the near-infrared band of the acquired data.
Meanwhile, NDRE is used to measure the stress and chlorophyll content in leaves [37]. It is more suitable to detect early stress as compared to NDVI [38]. NDRE is the ratio measurement between the near-infrared band with the red edge band. The equation to calculate NDRE is given below:
N D R E = N I R R e d   E d g e N I R + R e d   E d g e
Both NDVI and NDRE were computed using the multispectral orthomosaic aerial images in ArcMap software for the 20 m, 60 m, and 80 m flight altitudes. Figure A3 and Figure A4 show the NDVI and NDRE images of the study area at UAV altitude 20 m, 60 m, and 80 m, respectively. NDVI and NDRE show a variation in the vegetative and soil areas. The NDVI and NDRE values of individual oil palm trees were extracted using the vector file of the crown area in ArcMap.

3.3. Data Analysis

The biophysical parameters (CPA diameter, tree height, including vegetation indices of NDVI, and NDRE) were statistically analyzed to evaluate the influence of flight altitudes. Firstly, we compared biophysical parameters extracted from different flight altitudes using central tendencies from histogram analysis. Histograms were used to see the tendency of value differences resulting from the deviation of each parameter between different flight altitudes. The central tendency of subtraction values was assessed by calculating mean and median values. Ground measured CPA diameter and tree height were used to validate UAV derived parameters. Standard error of estimation (SE) with a 95% confidence level was used to assess the accuracy of UAV extracted CPA diameter and tree height with the ground information [39,40]. For NDVI and NDRE, root mean squared deviation (RMSD) was calculated to determine the absolute difference between each UAV altitude [41]. The formula of RMSD is given as follows:
R M S D = i = 1 N y 1 i y 2 i 2 N
where y1 denotes the value of parameter obtained from “1” UAV altitude, while y2 from “2” UAV altitude. N represents the total number of samples and i represents a specific tree sample.

4. Results

UAV collected data were processed to extract various biophysical parameters and transformations of vegetation indices from oil palm trees. Table 3 summarized the areal coverage, duration, ground sampling distance (GSD), and processing time (total and per acres) of images for different UAV flight altitude acquisition. Higher altitude flight of 60 m and 80 m yielded much larger areal coverage (12 and 22 acres) in just one flight as compared to the 20 m altitude, which required 4 flight missions to cover just 5.7 Acres. This is mainly because it was not possible to perform the whole flight mission with only one battery.
On the other hand, a lower altitude (20 m) gathered more than three times the number of aerial images (8800) compared to 60 m (2350) and 80 m (2195). The processing time required for 20 m, 60 m, and 80 m altitude flight missions was about 4 hours 22 minutes, 56 minutes, and 1 hour 6 minutes, respectively (Table 3). The 60 m altitude required less processing time compared to the 80 m because the areal coverage was only about half of that obtained during the 80 m altitude flights. Nevertheless, the image acquired at 20 m flight altitude produced GSD of 1.37 cm, whereas 60 m and 80 m flight resulted in 5.16 cm and 5.68 cm GSD, respectively. A lower GSD (higher resolutions) implies that more ground details and, therefore, dense point clouds are available for the subsequent SfM analysis and DSM generation. There is a positive relationship between dense point cloud reconstruction and processing time, which agrees with the studies that reported the relationship between flight altitude and point cloud density [42]. In general, a higher flight altitude causes a decrease in processing time [27]. The results of the biophysical parameters extracted from different flight altitude missions are discussed in the following sections.

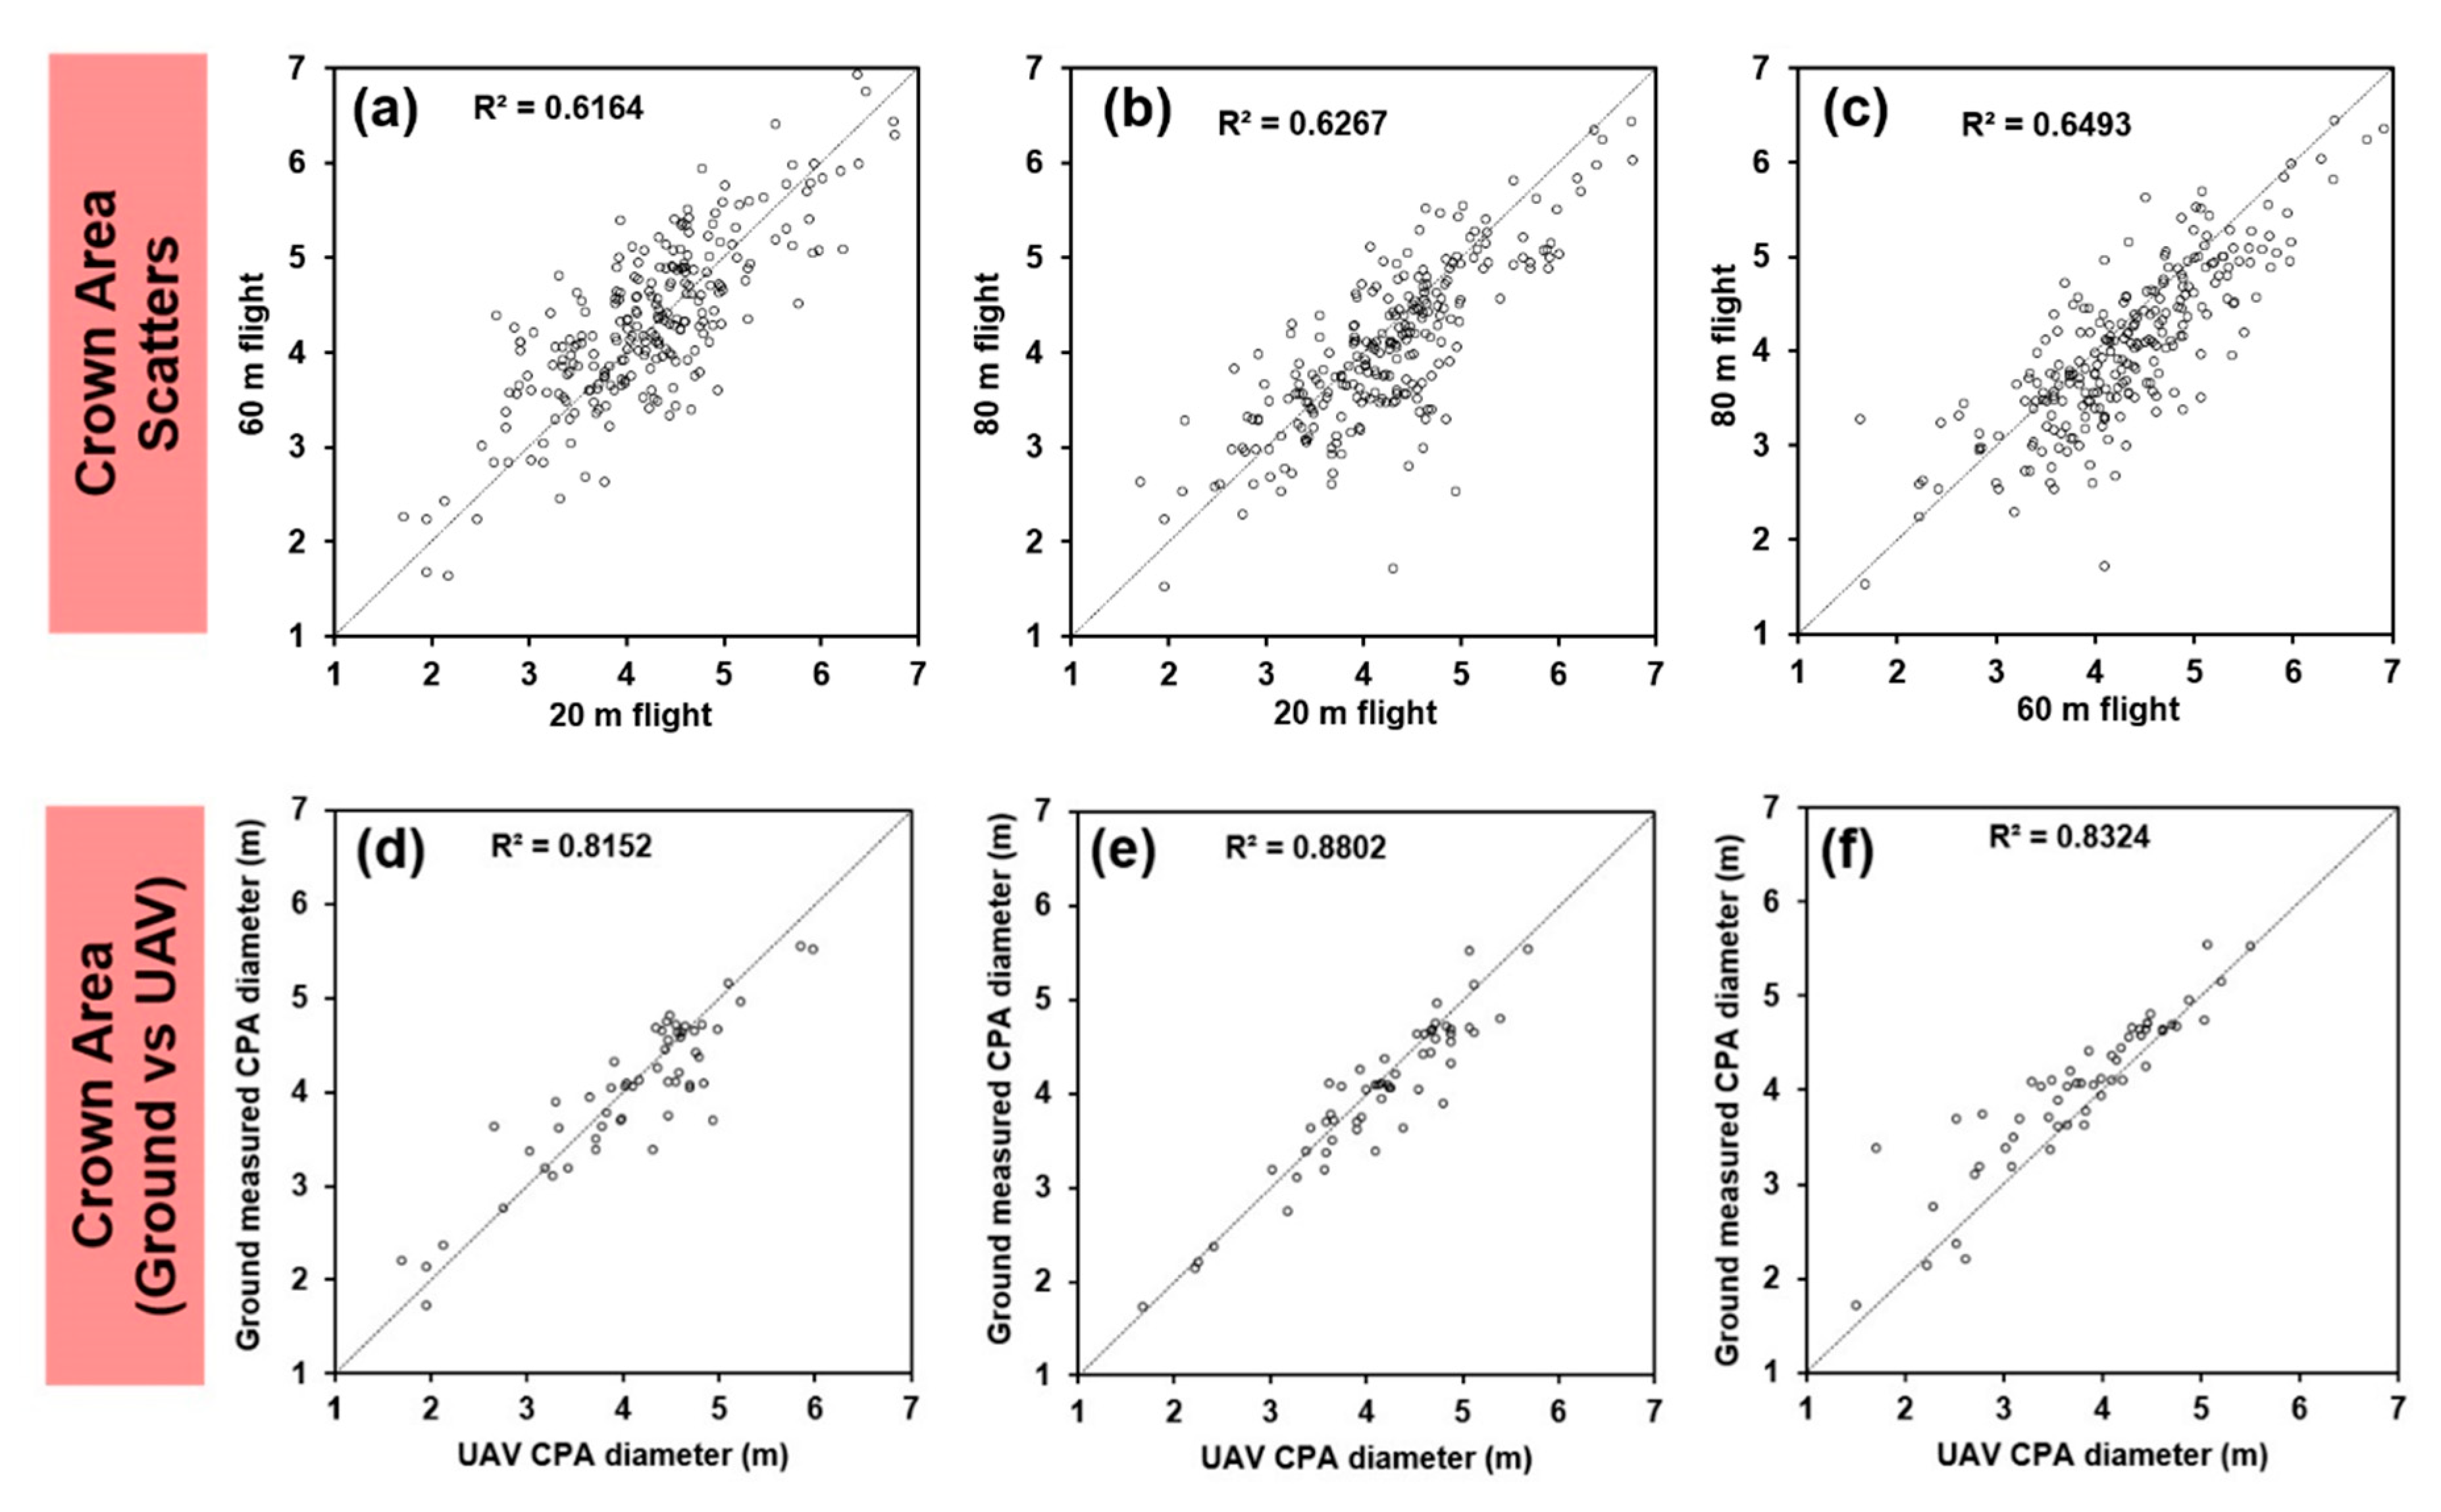
4.1. Crown Projection Area (CPA) Diameter

The crown area of individual oil palm trees was generated from the canopy height model (CHM); subsequently, the crown projection area (CPA) was generated using the “minimum bounding geometry” of the crown area (see Figure 8). The CPA is indeed a generalization representing the crown rather than the crown area itself, which has complex-shaped morphometry. It is worth noting that there are certain difficulties in obtaining uniform diameter measurements from the complex shaped crown. Estimating crown diameter based on CPA may result in under- or overestimation. Yet, CPA size variations within a uniform age oil palm plantation may provide insight into underlying health issues when combined with vegetation indices [43]. Therefore, deriving tree diameter from the CPA is suitable for this study.
The derived CPA diameters were statistically analyzed for the three different flight altitudes. The CPA diameter values were plotted on the x and y-axis (Figure 9a–c). From the results, it can be observed that the scatterplots exhibit normal distributions with all CPA values are clustered around the 1:1 line. Despite the difference in the altitudes, the derived CPA values have a strong linear relationship indicated by the high correlations with the value of the coefficient of determination (R2) more than 0.61. The CPA derived from 20 m and 60 m altitudes show a weaker relationship (R2 = 0.616), while CPA derived from 60 m and 80 m show a high correlation (R2 = 0.649).
Figure 10 shows the histogram of the difference for CPA to see the tendency at different altitudes. Difference values are the result of subtraction between the compared flight altitudes. It can be observed in the graphs that the CPA values derived from 80 m flight are generally less than 20 m and 60 m flight altitudes (see Figure 10b,c). CPA values at 60 m UAV altitude are higher among the others as the central tendency of histograms (Figure 10a,b) skewing towards 60 m altitudes.

Validation of CPA Diameter

The UAV derived CPA diameters were validated with the ground measured CPA diameters collected randomly in the field. The comparison of UAV derived CPA diameters with field data is given in Figure 9d–f, as well as Table 4. As shown in Table 4, all three flights show high correlations to the ground data, but the strongest correlation is observed from the 60 m altitude data (0.938). A high correlation indicates that the UAV derived CPA diameter has a good agreement with the ground data. In addition, to assess the accuracy, SE for three UAV altitude were also calculated. The 60 m flight altitude produced the highest accuracy of 92.47%, among other altitudes (Table 4).

4.2. Tree Height Model

Unlike the tree crown relationships, the tree height scatterplots yielded a low correlation coefficient between different altitudes. As shown in Figure 11a–c, only the scatterplots of 60 m: 80 m had a good correlation (R2 = 0.568). A lower coefficient obtained for 20 m: 60 m and 20 m:80 m suggest that the tree height measured from 20 m flight produced a large difference in tree height values compared to 60 m and 80 m flight. Histograms of difference also show that the tree heights at 20 m flight are generally higher than 60 m and 80 m, and that of 60 m is higher than 80 m flight (Figure 12).

Validation of Tree Height Model

Similar to CPA diameter, the tree heights derived from UAV were validated with ground measured tree heights as shown in Figure 11d–f. Based on the correlation and accuracy value (Table 5), our results showed that 20 m flight data has the lowest accuracy, reaching 78.10%. The 60 m UAV altitude had the highest accuracy (86.52%) among all three flight altitude missions (Table 5).

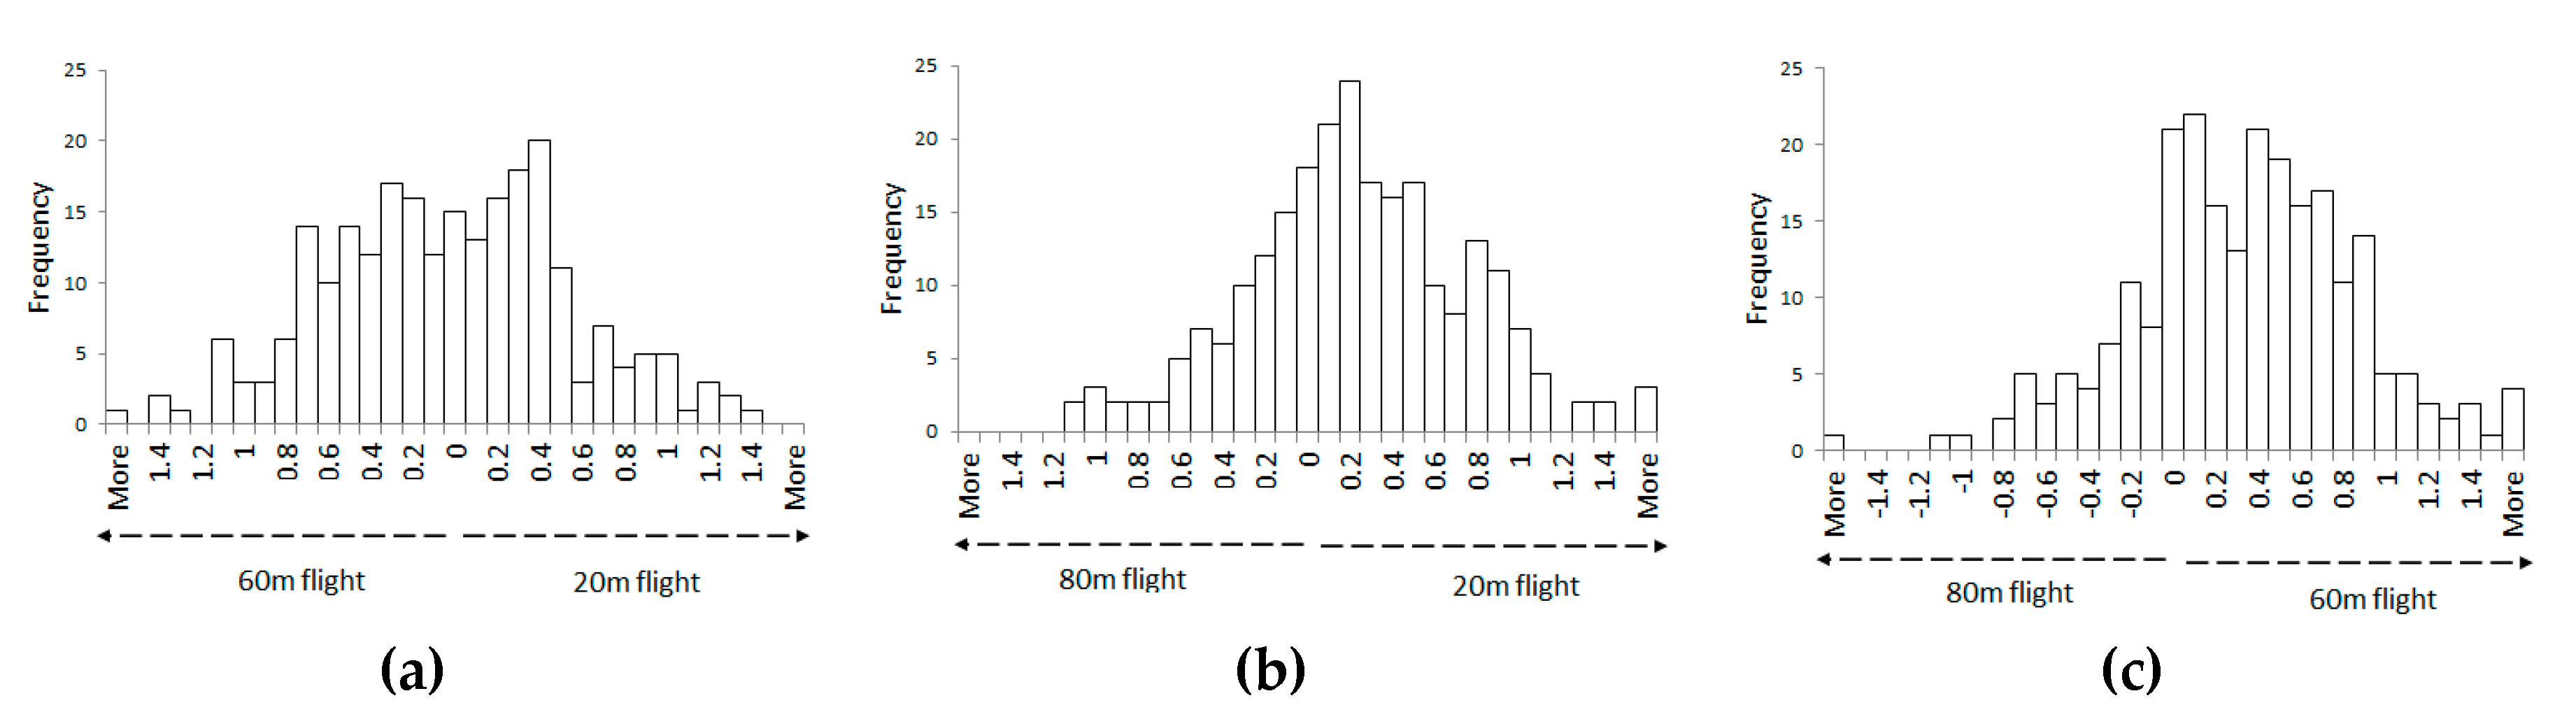
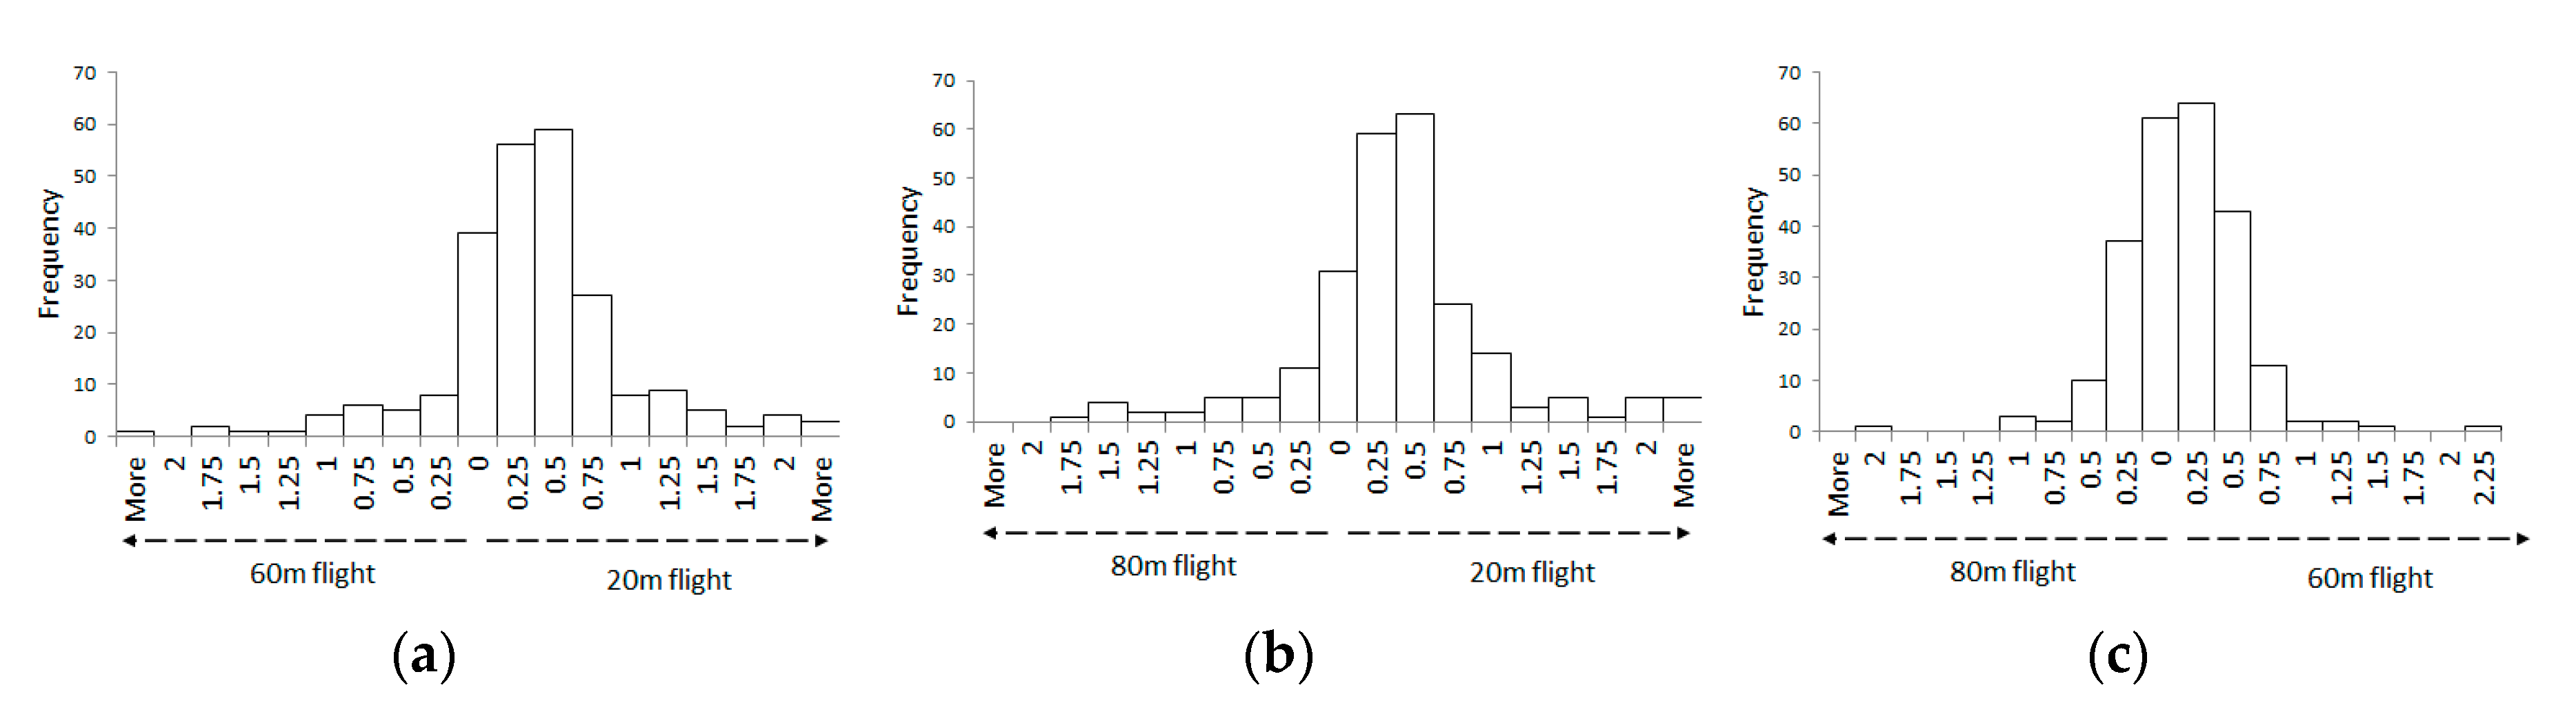
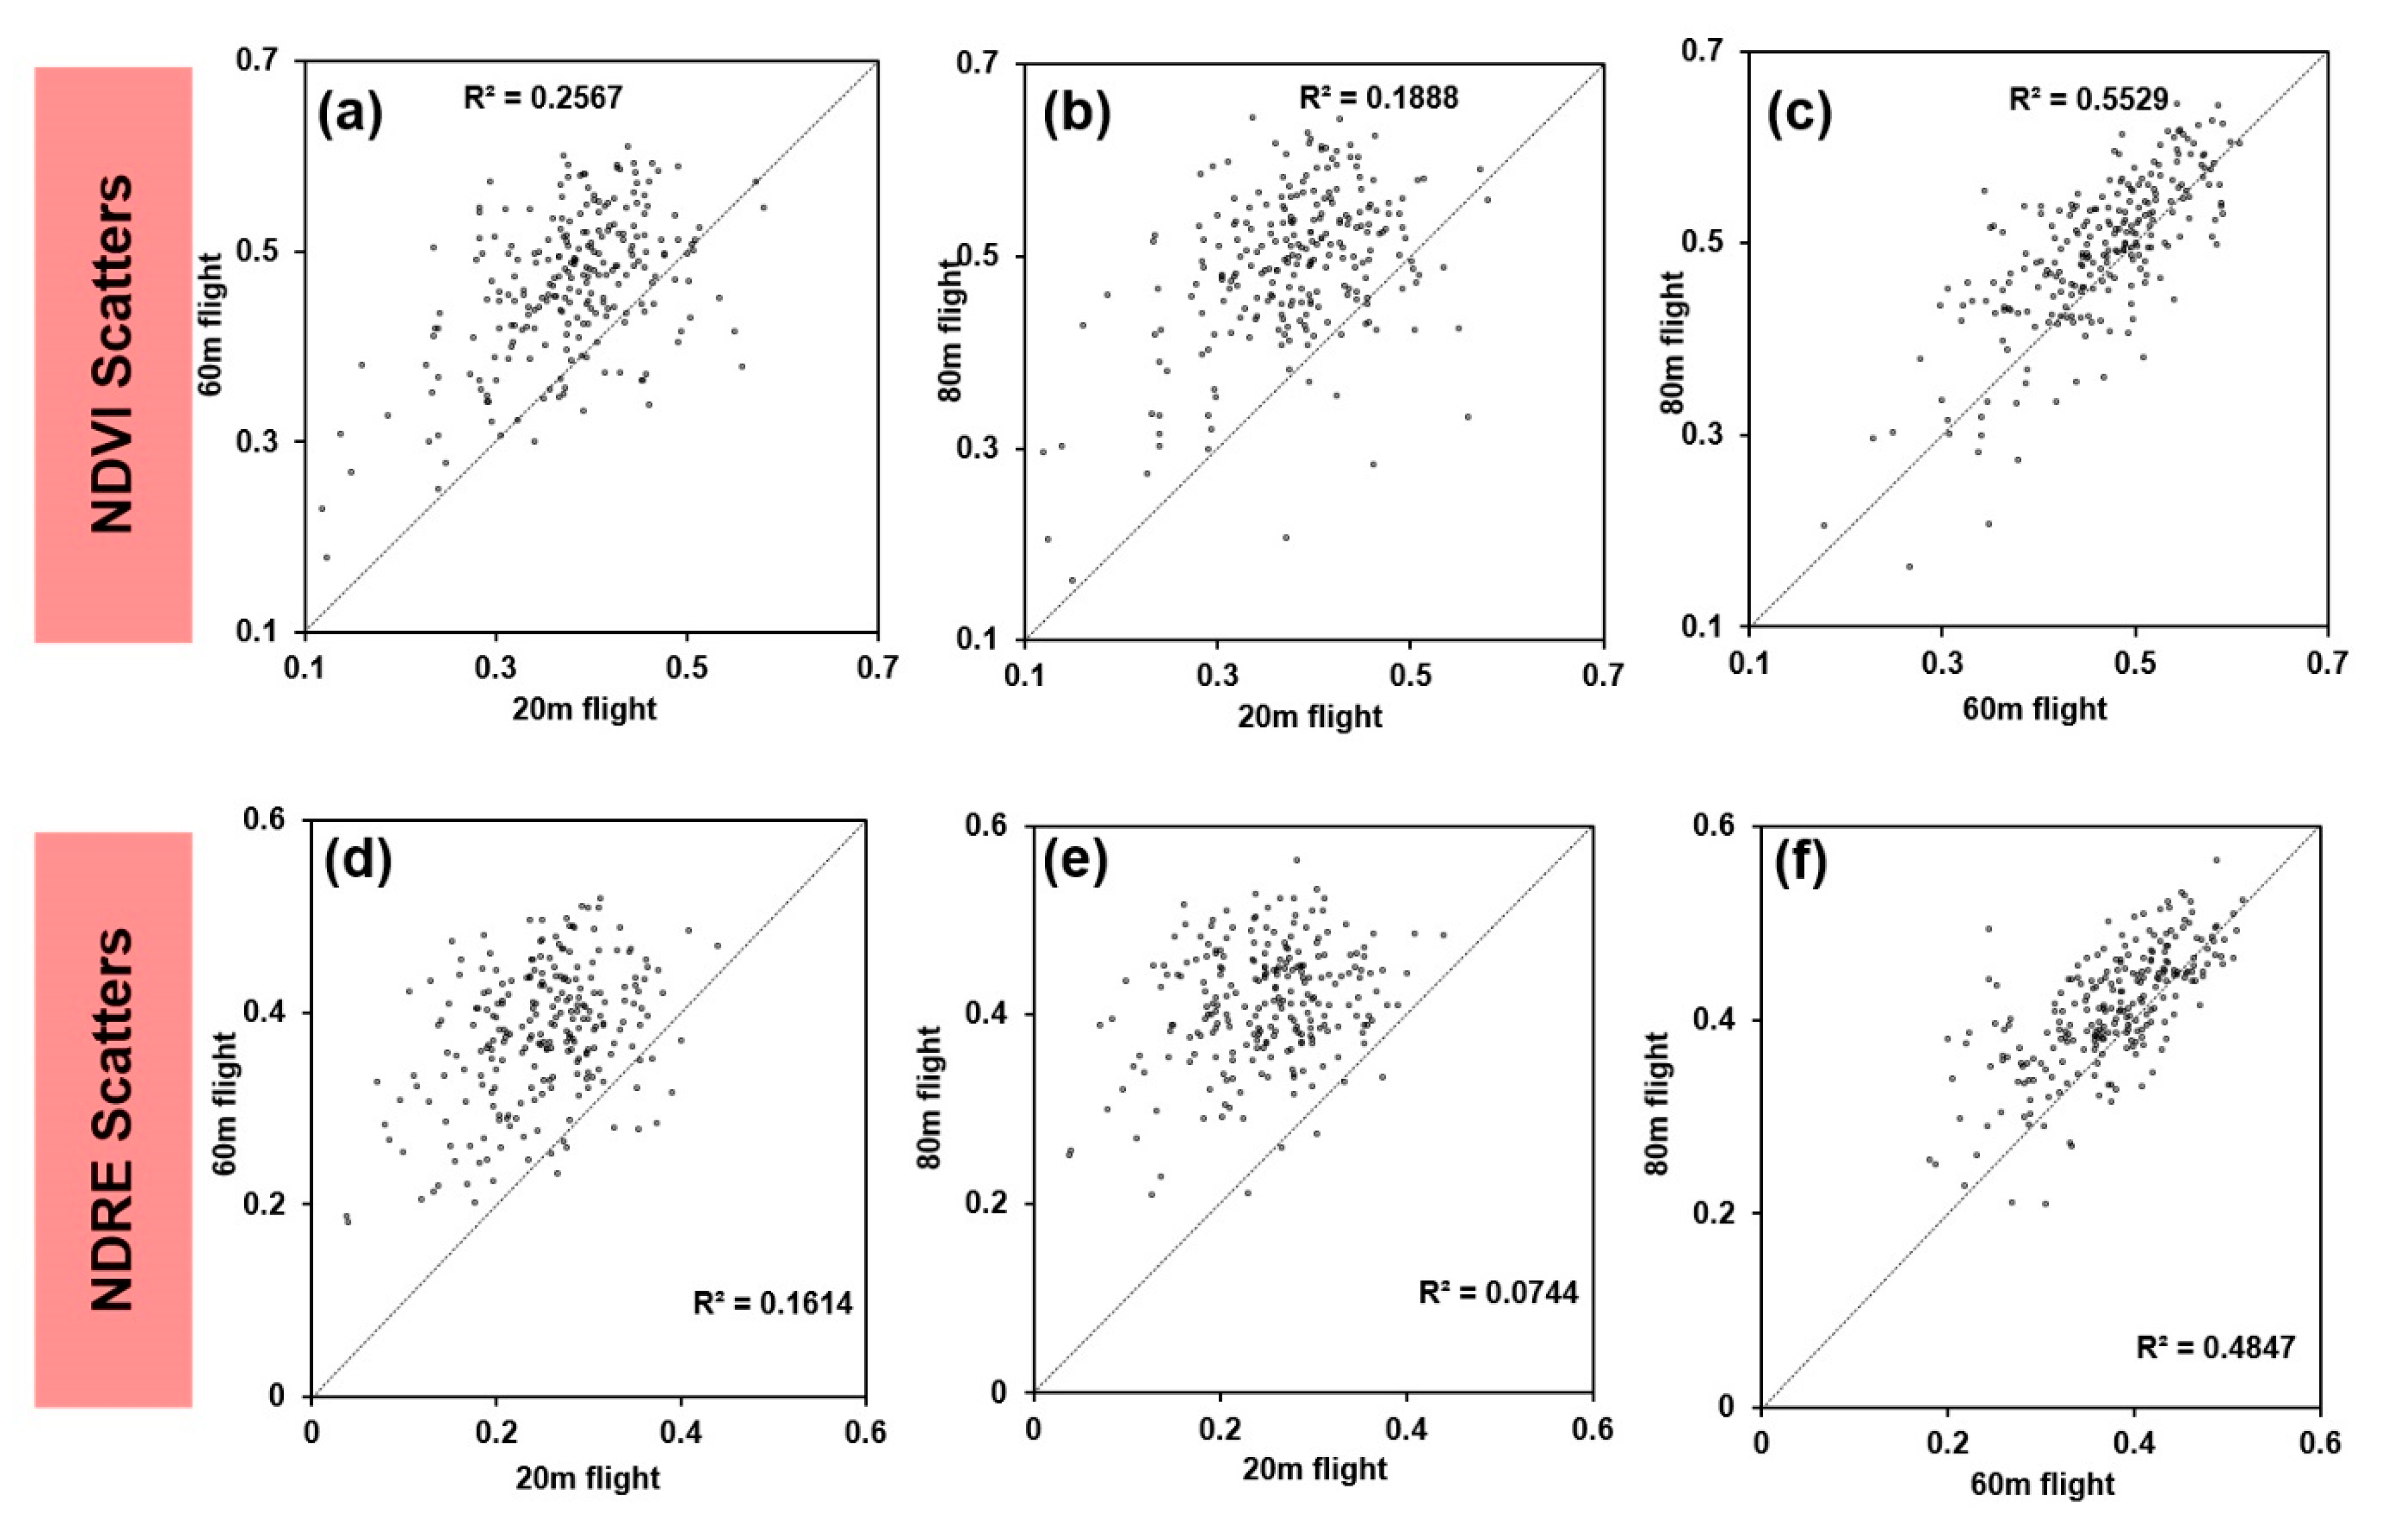
4.3. Vegetation Indices (NDVI and NDRE) Comparison

Figure 13 illustrates the scatterplots to compare extracted NDVI and NDRE values from different flight altitudes. Only for the scatterplot of 60 m: 80 m were close to the 1:1 line for NDVI and NDRE (Figure 13c,f). The 60 m: 80 m also had the highest correlations for NDVI (r = 0.774) and NDRE (r = 0.696). The second highest correlation is observed for 20 m: 60 m with (r = 0.507) and (r = 0.402), respectively. The flight comparison of NDVI value at 20 m: 80 m shows the least correlation with a value of 0.435. The correlation value of NDRE at 20 m: 80 m is very low, reaching only 0.273 (p-value = 0.000018). Although having the same pattern, the relationship of each flight comparison on NDVI is stronger than that of NDRE. Similarly, the RMSD follows the same results as the scatterplots (Figure 14). Observation of scatterplots and RMSD reveals that numerous tree plots extracted from 20 m have a big difference in vegetation indices value when compared to 60 m and 80 m flight. Least RMSD value was observed between 60 m and 80 m flight altitudes.
Since the scatterplots are similar between NDVI and NDRE, the histograms of difference value provide the same pattern (Figure 15). The histograms in Figure 15c,f show that the small deviations were observed between measurements made at 60 m and 80 m, suggesting a better match between them.

4.4. Evaluation of Flight Altitude

We analyzed the optimal flight height by assessing the accuracy of CPA diameter and tree height, as well as RMSD value of NDVI and NDRE, as discussed in Section 4.1, Section 4.2 and Section 4.3. Furthermore, we also assessed the consistency of biophysical parameter extraction for each flight. With the growth of oil palm trees, there is growth in biophysical parameters such as crown diameter, tree height, etc. [43,44,45]. Hence, crown diameter and tree height should grow linearly. Since both parameters were generated from point clouds, we examined the relationship and observed whether flight altitude affects consistency. Table 6 shows a strong relationship between CPA diameter and tree height with a value of correlation coefficient is 0.568 and 0.583 at 60 m and 80 m flight altitude, respectively. The flight altitude at 20 m shows a low correlation of 0.277. Similarly, the relationship between vegetation indices (NDVI and NDRE) was also assessed. All flight altitudes showed a strong relationship between NDVI and NDRE, with correlations of more than 0.85. The 20 m flight maintained produces the weakest relationship for both comparisons, which means having the lowest consistency. On the contrary, 60 m and 80 m were highly consistent for extracting the biophysical parameter.

5. Discussion

This study demonstrates a systematic analysis of the influence of different UAV altitudes to extract biophysical parameters of the young oil palm plantation area in Malaysia. It provides a methodological approach to extract various biophysical parameters from UAV data. These parameters can be useful indicators to monitor plant growth and health. The objective of this study was to evaluate the suitable flying height to extract crown diameter and height using UAV-based aerial images. Obtaining the tree heights and crown diameter from satellite-based surface models have limitations due to their low spatial resolution. Further, obtaining tree height values with a GNSS device is difficult in denser forest areas [19,43]. Terrestrial light detection and ranging (LiDARs) and UAV-LiDARs, on the other hand, produce accurate results, but long processing time and heavier payload limit the gathering of base data [44]. Therefore, a low-weight DJI Phantom–4 UAV device mounted with the MicaSense RedEdge Multispectral sensor were used for obtaining the tree height and crown diameter at 20 m, 60 m, and 80 m flight altitudes. Since the RedEdge camera has the capability to obtain information in the NIR and RedEdge spectrum, we also calculated NDVI and NDRE in this study.
The important finding of this was that flight altitude at 60 m can provide more accurate results as compared to 20 m and 80 m. The highest accuracy to extract CPA diameter and height was produced at 60 m altitudes. UAV data at low altitude (20 m) with an increased number of point clouds can provide better height estimation, but it was not true in this study. The findings of this study is in contrast to Whitehead et al. [23] and Seifert et al. [22]. Whitehead et al. reported that the probability of detection of objects is better with higher point clouds data [23]. However, a higher spatial resolution is not necessary to obtain the desired accuracy, as noticed in this study. Seifert et al. [22] reported that low flight altitude could produce more details in forest areas. The reason might be that the authors also used high forward overlaps, which is not explored in this study. Even though 20 m flight altitude produced more point clouds than 60 m and 80 m, the systematic error propagation may also be higher while employing denser point clouds. However, this condition is not correct to extract CPA diameter. In this study, flights at all altitudes produced high accuracy for CPA measurements. This is mainly because the extraction of CPA diameter is not as sensitive as tree height, which relies on the maximum height value of the point clouds. According to Section 4.2, many errors (overestimations) are produced at 20 m flight altitudes, which makes the accuracy lower than tree height estimated at 60 m and 80 m flight altitudes.
To produce accurate point clouds, capturing UAV aerial images closer to objects is not always necessary. At a low flight altitude, the UAV captures many images because of the smaller field of view of the sensor. However, even though producing more point clouds, the images-alignment from many images at lower altitudes can result in an additional error. Tree structures (twigs and leaf) may change due to wind-induced movement. This shifts the relative position of objects between images, which causes mismatching in image alignment [22]. Therefore, more images captured may lead to more errors in image alignment. An additional consideration when capturing aerial images is the height of objects in the area of interest. For example, the maximum oil palm height in our study area was around 5 m and therefore only 15 m difference from the sensor. Moreover, the topography was not flat, which meant some trees would be captured less than 15 m from the UAV. These conditions also make the less consistent for biophysical parameters extraction was observed at 20 m height.
Based on our results, we determined that the NDVI and NDRE are best extracted from 60 m followed by 80 m flight altitudes. Mesas-Carrascosa et al. reported that the NDVI value is not significantly affected by the different flight altitudes [24]. Contrary to their observation, we found that the low flight altitude (20 m) produced larger RMSD values than 60 m and 80 m flight. This is probably because, at the highest pixel size (1.37 cm), more noise may also be captured when compared to the coarser pixel sizes. The higher altitude can maintain the spectral accuracy as it is observed that NDVI and NDRE values of 60 m and 80 m flight are well correlated. During field measurement, the UAV speed for all altitudes were at 5 m/s. Therefore, the closer sensor to the objects, the faster its relative speed to the object even the drone speed remains the same. As a result, some images were not clear and had to be eliminated. To overcome the limitations of the distance between objects and sensors, the use of a GNSS onboard system like Phantom4 RTK is useful. It can provide real-time, centimeter-level positioning data for improved absolute accuracy on image metadata. The use of real-time detection of young oil palm biophysical parameters using UAV is advantageous because at the young stage, there is a rapid growth of biophysical parameters and it can be helpful to monitor the health of oil palm in case of pest infestation [13].
This study examined different flight altitudes, but all flights were lower than 100 m above the ground. To cover a larger area, flights at higher altitudes are needed for higher efficiency, and, in this case, 60 m altitude and 80 m altitude flights will be more efficient than flights at 20 m altitudes. It is challenging to provide an optimum value of UAV and sensors parameters since each combination of sensors and drone parameters produce different results. Nonetheless, we attempted to consider only a few parameters in this study. Thus, we need to optimize these combinations based on our requirement by considering various trade-offs such as: altitudes, sensors resolution, point clouds, processing time, side and forward overlaps, etc. A further investigation of the effects of sensors and overlaps would be desirable to better understand their impact.
This study is focused on young oil palm plantation areas with limited coverage, while the old oil palm plantation area was not considered. Fawcett et al. reported that 100 m UAV altitude is the best for estimating the height of seven-year old oil palm trees [25]. Therefore, we can suggest that flight altitude should be increased in tall trees to minimize the high relative speed, as mentioned earlier. Moreover, the crowns of young oil palm plantations are still in the growing stage, which makes the gaps between individual trees are apparent in this study. Therefore, the estimation of crown size at the young stage is more accurate as compared to the old stage because at the old stage, there is a possibility of overlaps between the crowns of old trees. This challenge can be further explored to determine optimal flight altitudes for different growth stages of oil palm in the future.

6. Conclusions

This research was undertaken to evaluate the influence of UAV flight altitude on the extraction of biophysical parameters of oil palm plantations. Multispectral UAV aerial images over oil palm plantations were processed to produce multispectral orthomosaic, DSM, and point clouds. The study involved (i) detection of individual oil palm trees and extraction of biophysical parameters; (ii) comparison of biophysical parameters with ground data; and (iii) evaluation of UAV altitude for obtaining the most accurate biophysical parameters. CHM was generated by subtraction of DSM with DEM. Individual oil palm trees were segmented from the CHM, which was used for extractions of biophysical parameters such as tree height, crown diameter also vegetation indices of NDVI, and NDRE. Statistical methods were used for comparison of biophysical parameters at different UAV altitudes. The results of the statistical analysis show that 60 m altitude is best for measuring CPA diameter and extracting oil palm height. Moreover, NDVI and NDRE show good vigor at 60 m and followed by 80 m UAV altitudes. Based on the results presented in this study, flying at 60 m altitudes is suitable for extracting biophysical parameters of oil palm. However, 20 m UAV altitude tends to overestimate the biophysical parameters even though visually, it shows the best visual detail. The 60 m followed by 80 m altitudes are suitable for UAV aerial images collection, since biophysical parameters can be accurately measured at these altitudes and larger areas can be covered more efficiently. This is also important for commercial applications. The findings of this study can be useful for future research because the generation of DSMs from UAV is rapidly increasing. This study can contribute to finding optimal flight altitudes to extract biophysical parameters accurately and efficiently. In the future, real-time processing of UAV data can help in plant disease detection and fast response to support timely remediation.

Author Contributions

Conceptualization, R.A., S.A.S., and A.K.; methodology, R.A., S.A.S., and D.A.U.; software, R.A., S.A.S., and M.S.S.; validation, S.A.S. and M.S.S., and A.K.; formal analysis, R.A., S.A.S., and D.A.U.; investigation, R.A., M.S.S., and A.K.; resources, M.S.S., A.K., and R.A.; writing—original draft preparation, R.A., S.A.S., A.K., M.S.S., D.A.U., and A.P.Y.; writing—review and editing, S.A.S., R.A., M.S.S., D.A.U., and A.P.Y.; funding acquisition, R.A. and A.K. All authors have read and agreed to the published version of the manuscript.

Funding

This research received no external funding.

Acknowledgments

The authors would like to thank the management and staff, especially the managers, Asrif Mahmud and Henry Jubair of Ladang Sabahmas, Lahad Datu, Sabah, Malaysia, for the cooperation and logistics support which enabled this research to be done. The authors would also like to thank Hokkaido University L-station and SOUSEI support for Young Researchers.

Conflicts of Interest

The authors declare no conflict of interest.

Appendix A

Figure A1. Point Clouds of the AOI at UAV altitude of (a) 20 m, (b) 60 m and (c) 80 m.
Remotesensing 12 03030 g0a1
Figure A2. Digital Surface Model (DSM) of the AOI at UAV altitude of (a) 20 m, (b) 60 m and (c) 80 m.
Remotesensing 12 03030 g0a2
Figure A3. Normalized Difference Vegetation Index (NDVI) for (a) 20 m, (b) 60 m and (c) 80 m altitude.
Remotesensing 12 03030 g0a3
Figure A4. Normalized Difference Red Edge (NDRE) for (a) 20 m, (b) 60 m and (c) 80 m altitude.
Remotesensing 12 03030 g0a4

References

  1. See, B.D.; Hashim, S.J.; Shafri, H.Z.M.; Azrad, S.; Hassan, M.R. A new rapid, low-cost and GPS-centric unmanned aerial vehicle incorporating in-situ multispectral oil palm trees health detection. J. Agric. Sci. Bot. 2018, 2, 12–16. [Google Scholar]
  2. The Oil Palm. Economic Contribution. Available online: https://theoilpalm.org/economic-contribution/ (accessed on 10 January 2019).
  3. Department of Statistics, Malaysia. Available online: https://bit.ly/3hubR5h (accessed on 30 May 2019).
  4. Woittiez, L.S.; van Wijk, M.T.; Slingerland, M.; van Noordwijk, M.; Giller, K.E. Yield gaps in oil palm: A quantitative review of contributing factors. Eur. J. Agron. 2017, 83, 57–77. [Google Scholar] [CrossRef]
  5. Malaysia Palm Oil Council (MPOC). The Oil Palm Tree. Available online: http://mpoc.org.my/the-oil-palm-tree/ (accessed on 21 November 2019).
  6. Toh, C.M.; Ewe, H.T.; Tey, S.H.; Tay, Y.H. A study on the influence of oil palm biophysical parameters on backscattering returns with ALOS-PALSAR2 image. In Proceedings of the IGARSS 2018–2018 IEEE International Geoscience and Remote Sensing Symposium, Valencia, Spain, 22–27 July 2018; pp. 8236–8239. [Google Scholar]
  7. Rival, A. Breeding the oil palm (Elaeis guineensis Jacq.) for climate change. OCL 2017, 24, 1–7. [Google Scholar] [CrossRef] [Green Version]
  8. Robert, P.C. Precision agriculture: A challenge for crop nutrition management. Plant Soil 2002, 247, 143–149. [Google Scholar] [CrossRef]
  9. Friedl, M.A. Remote Sensing of Croplands; Elsevier: Amsterdam, The Netherlands, 2018. [Google Scholar]
  10. Priwiratama, H.; Susanto, A. Utilization of Fungi for the Biological Control of Insect Pests and Ganoderma Disease in the Indonesian Oil Palm Industry. J. Agric. Sci. Technol. 2014, 4, 103–111. [Google Scholar]
  11. Avtar, R.; Yunus, A.P.; Saito, O.; Kharrazi, A.; Kumar, P.; Takeuchi, K. Multi-temporal remote sensing data to monitor terrestrial ecosystem responses to climate variations in Ghana. Geocarto Int. 2020, 0, 1–17. [Google Scholar] [CrossRef]
  12. Avtar, R.; Ishii, R.; Kobayashi, H.; Fadaei, H.; Suzuki, R.; Herath, S. Efficiency of multi-frequency, multi-polarized SAR data to monitor growth stages of oilpalm plants in Sarawak, Malaysia. In Proceedings of the 2013 IEEE International Geoscience and Remote Sensing Symposium-IGARSS, Melbourne, Australia, 21–26 July 2013; pp. 2137–2140. [Google Scholar]
  13. Meng, L.; Peng, Z.; Zhou, J.; Zhang, J.; Lu, Z.; Baumann, A.; Du, Y. Real-time detection of ground objects based on unmanned aerial vehicle remote sensing with deep learning: Application in excavator detection for pipeline safety. Remote Sens. 2020, 12, 182. [Google Scholar] [CrossRef] [Green Version]
  14. Maes, W.H.; Steppe, K. Perspectives for Remote Sensing with Unmanned Aerial Vehicles in Precision Agriculture. Trends Plant Sci. 2019, 24, 152–164. [Google Scholar] [CrossRef]
  15. Bansod, B.; Singh, R.; Thakur, R.; Singhal, G. A comparision between satellite based and drone based remote sensing technology to achieve sustainable development: A review. J. Agric. Environ. Int. Dev. 2017, 111, 383–407. [Google Scholar]
  16. Suab, S.A.; Avtar, R. Unmanned Aerial Vehicle System (UAVS) Applications in Forestry and Plantation Operations: Experiences in Sabah and Sarawak, Malaysian Borneo; Springer: Cham, Germany, 2020. [Google Scholar]
  17. Dong, X.; Zhang, Z.; Yu, R.; Tian, Q.; Zhu, X. Extraction of Information about Individual Trees from High-Spatial-Resolution UAV-Acquired Images of an Orchard. Remote Sens. 2020, 12, 133. [Google Scholar] [CrossRef] [Green Version]
  18. Hunt, E.R.; Daughtry, C.S.T. What good are unmanned aircraft systems for agricultural remote sensing and precision agriculture? Int. J. Remote Sens. 2018, 39, 5345–5376. [Google Scholar] [CrossRef] [Green Version]
  19. Díaz-Varela, R.A.; de la Rosa, R.; León, L.; Zarco-Tejada, P.J. High-resolution airborne UAV imagery to assess olive tree crown parameters using 3D photo reconstruction: Application in breeding trials. Remote Sens. 2015, 7, 4213–4232. [Google Scholar] [CrossRef] [Green Version]
  20. Zarco-Tejada, P.J.; Diaz-Varela, R.; Angileri, V.; Loudjani, P. Tree height quantification using very high resolution imagery acquired from an unmanned aerial vehicle (UAV) and automatic 3D photo-reconstruction methods. Eur. J. Agron. 2014, 55, 89–99. [Google Scholar] [CrossRef]
  21. Khokthong, W.; Zemp, D.C.; Irawan, B.; Sundawati, L.; Kreft, H.; Hölscher, D. Drone-Based Assessment of Canopy Cover for Analyzing Tree Mortality in an Oil Palm Agroforest. Front. For. Glob. Chang. 2019, 2, 1–10. [Google Scholar] [CrossRef] [Green Version]
  22. Seifert, E.; Seifert, S.; Vogt, H.; Drew, D.; van Aardt, J.; Kunneke, A.; Seifert, T. Influence of drone altitude, image overlap, and optical sensor resolution on multi-view reconstruction of forest images. Remote Sens. 2019, 11, 1252. [Google Scholar] [CrossRef] [Green Version]
  23. Whitehead, K.; Hugenholtz, C.H.; Myshak, S.; Brown, O.; LeClair, A.; Tamminga, A.; Barchyn, T.E.; Moorman, B.; Eaton, B. Remote sensing of the environment with small unmanned aircraft systems (UASs), part 2: Scientific and commercial applications. J. Unmanned Veh. Syst. 2014, 2, 86–102. [Google Scholar] [CrossRef] [Green Version]
  24. Mesas-Carrascosa, F.J.; Torres-Sánchez, J.; Clavero-Rumbao, I.; García-Ferrer, A.; Peña, J.M.; Borra-Serrano, I.; López-Granados, F. Assessing optimal flight parameters for generating accurate multispectral orthomosaicks by uav to support site-specific crop management. Remote Sens. 2015, 7, 12793–12814. [Google Scholar] [CrossRef] [Green Version]
  25. Fawcett, D.; Azlan, B.; Hill, T.C.; Kho, L.K.; Bennie, J.; Anderson, K. Unmanned aerial vehicle (UAV) derived structure-from-motion photogrammetry point clouds for oil palm (Elaeis guineensis) canopy segmentation and height estimation. Int. J. Remote Sens. 2019, 40, 7538–7560. [Google Scholar] [CrossRef] [Green Version]
  26. Nex, F.; Remondino, F. UAV for 3D Mapping Applications: A Review. Appl. Geomatics 2013, 6, 1–15. [Google Scholar] [CrossRef]
  27. Torres-Sánchez, J.; López-Granados, F.; Borra-Serrano, I.; Peña, J.M. Assessing UAV-collected image overlap influence on computation time and digital surface model accuracy in olive orchards. Precis. Agric. 2018, 19, 115–133. [Google Scholar] [CrossRef]
  28. Climate data org. Lahad Datu Climate. Available online: https://bit.ly/32ozhoi (accessed on 31 May 2019).
  29. Wawan, W.; Dini, I.R.; Hapsoh, H. The effect of legume cover crop Mucuna bracteata on soil physical properties, runoff and erosion in three slopes of immature oil palm plantation. IOP Conf. Ser. Earth Environ. Sci. 2019, 250. [Google Scholar] [CrossRef]
  30. MicaSense. What Is the Accuracy of the Included GPS for RedEdge? Available online: https://support.micasense.com/hc/en-us/articles/115005911207-What-is-the-accuracy-of-the-included-GPS-for-RedEdge (accessed on 30 June 2020).
  31. Tucker, J.C. Red and photographic infrared linear combinations for monitoring vegetation. Remote Sens. Environ. 1979, 8, 127–150. [Google Scholar] [CrossRef] [Green Version]
  32. Bendig, J.; Yu, K.; Aasen, H.; Bolten, A.; Bennertz, S.; Broscheit, J.; Gnyp, M.L.; Bareth, G. Combining UAV-based plant height from crop surface models, visible, and near infrared vegetation indices for biomass monitoring in barley. Int. J. Appl. Earth Obs. Geoinf. 2015, 39, 79–87. [Google Scholar] [CrossRef]
  33. Avtar, R.; Suab, S.A.; Yunus, A.P.; Kumar, P. Applications of UAVs in Plantation Health and Area Management in Malaysia Chapter 7 Applications of UAVs in Plantation Health and Area Management in Malaysia; Springer: Cham, Germany, 2020. [Google Scholar]
  34. Segarra, J.; Buchaillot, M.L.; Araus, J.L.; Kefauver, S.C. Remote sensing for precision agriculture: Sentinel-2 improved features and applications. Agronomy 2020, 10, 641. [Google Scholar] [CrossRef]
  35. Stroppiana, D.; Pepe, M.; Boschetti, M.; Crema, A.; Candiani, G.; Giordan, D.; Baldo, M.; Allasia, P.; Monopoli, L. Estimating Crop Density From Multi-spectral UAV Imagery in Maize Crop. In Proceedings of the ISPRS Geospatial Week 2019, Enschede, The Netherlands, 10–14 June 2019; pp. 619–624. [Google Scholar]
  36. Wijitdechakul, J.; Sasaki, S.; Kiyoki, Y.; Koopipat, C. UAV-based multispectral image analysis system with semantic computing for agricultural health conditions monitoring and real-time management. In Proceedings of the 2016 International Electronics Symposium (IES), Denpasar, Indonesia, 29–30 September 2016; pp. 459–464. [Google Scholar]
  37. Barnes, E.M.; Clarke, T.R.; Richards, S.E.; Colaizzi, P.D.; Haberland, J.; Kostrzewski, M.; Waller, P.; Choi, C.; Riley, E.; Thompson, T.; et al. Coincident Detection of Crop Water Stress, Nitrogen Status and Canopy Density Using Ground Based Multispectral Data. In Proceedings of the Fifth International Conference on Precision Agriculture, Madison, WI, USA, 16–19 July 2000. [Google Scholar]
  38. Eitel, J.U.H.; Vierling, L.A.; Litvak, M.E.; Long, D.S.; Schulthess, U.; Ager, A.A.; Krofcheck, D.J.; Stoscheck, L. Broadband, red-edge information from satellites improves early stress detection in a New Mexico conifer woodland. Remote Sens. Environ. 2011, 115, 3640–3646. [Google Scholar] [CrossRef]
  39. Wicaksono, P.; Danoedoro, P.; Hartono, H.; Nehren, U.; Ribbe, L. Preliminary work of mangrove ecosystem carbon stock mapping in small island using remote sensing: Above and below ground carbon stock mapping on medium resolution satellite image. In Proceedings of the Remote Sensing for Agriculture, Ecosystems, and Hydrology XIII, Prague, Czech Republic, 7 October 2011. [Google Scholar]
  40. Umarhadi, D.A.; Danoedoro, P. The effect of topographic correction on canopy density mapping using satellite imagery in mountainous area. Int. J. Adv. Sci. Eng. Inf. Technol. 2020, 10, 1317–1325. [Google Scholar] [CrossRef]
  41. Zhang, X.; Zhang, T.; Zhou, P.; Shao, Y.; Gao, S. Validation analysis of SMAP and AMSR2 soil moisture products over the United States using ground-based measurements. Remote Sens. 2017, 9, 104. [Google Scholar] [CrossRef] [Green Version]
  42. Dandois, J.P.; Olano, M.; Ellis, E.C. Optimal altitude, overlap, and weather conditions for computer vision uav estimates of forest structure. Remote Sens. 2015, 7, 13895–13920. [Google Scholar] [CrossRef] [Green Version]
  43. Suab, S.A.; Syukur, M.S.; Avtar, R.; Korom, A. Unmanned Aerial Vehicle (UAV) Derived Normalised Difference Vegetation Index (NDVI) and Crown Projection Area (CPA) to Detect Health Conditions of Young Oil Palm Trees for Precision Agriculture. In Proceedings of the 2019 6th International Conference on Geomatics and Geospatial Technology, Kuala Lumpur, Malaysia, 1–3 October 2019; pp. 611–614. [Google Scholar]
  44. Tan, K.P.; Kanniah, K.D.; Cracknell, A.P. Use of UK-DMC 2 and ALOS PALSAR for studying the age of oil palm trees in southern peninsular Malaysia. Int. J. Remote Sens. 2013, 34, 7424–7446. [Google Scholar] [CrossRef]
  45. Chemura, A.; van Duren, I.; van Leeuwen, L.M. Determination of the age of oil palm from crown projection area detected from WorldView-2 multispectral remote sensing data: The case of Ejisu-Juaben district, Ghana. ISPRS 2015, 100, 118–127. [Google Scholar] [CrossRef]
Figure 1. Location of the study area in Lahad Datu, Sabah, Malaysian Borneo.
Remotesensing 12 03030 g001
Figure 2. Field photographs of Oil palm: (a) Healthy tree, (b) diseased tree, and (c) damaged tree due to the rhinoceros beetle (Oryctes Rhinoceros L.) and other pests.
Remotesensing 12 03030 g002
Figure 3. Equipment: (a) flight preparation and sensor calibration; and (b) ground control points (GCPs) collection.
Remotesensing 12 03030 g003
Figure 4. Flowchart of the methodology.
Remotesensing 12 03030 g004
Figure 5. Multispectral orthomosaic aerial images in (RGB) true color composites at a flight altitude of (a) 20 m, (b) 60 m, and (c) 80 m with AOI overlay.
Remotesensing 12 03030 g005
Figure 6. Point clouds: (a) original and (b) ground elevation after classification.
Remotesensing 12 03030 g006
Figure 7. 3D view of (a) DSM subtracted using (b) DEM to produce (c) CHM.
Remotesensing 12 03030 g007
Figure 8. Illustration of height, crown area, and CPA.
Remotesensing 12 03030 g008
Figure 9. Scatterplot to compare crown projected area (CPA) diameter measured from different altitudes: (a) 20 m and 60 m, (b) 20 m and 80 m, and (c) 60 m and 80 m. A plot between ground measured CPA and UAV estimated CPA at flight altitude of (d) 20 m, (e) 60 m, and (f) 80 m.
Remotesensing 12 03030 g009
Figure 10. Histogram of difference for CPA diameter between different flight altitudes: (a) 60 m and 20 m, (b) 80 m and 20 m, and (c) 80 m and 60 m.
Remotesensing 12 03030 g010
Figure 11. Scatterplot to compare tree height measured from different altitudes. Comparison between (a) 20 m and 60 m, (b) 20 and 80 m, and (c) 60 m and 80 m. Plots between ground measured tree height and UAV estimated tree height at flight altitude of (d) 20 m, (e) 60 m, and (f) 80 m.
Remotesensing 12 03030 g011
Figure 12. Histogram of difference for tree height between different flight altitudes: (a) 60 m and 20 m, (b) 80 m and 20 m, and (c) 80 m and 60 m.
Remotesensing 12 03030 g012
Figure 13. Scatterplot to compare NDVI and NDRE measured from different altitudes. Comparison between 20 m and 60 m (a,d), 20 m and 80 m (b,e), and 60 m and 80 m (c,f).
Remotesensing 12 03030 g013
Figure 14. RMSD value of NDVI (blue) and NDRE (green) for each compared flight altitude.
Remotesensing 12 03030 g014
Figure 15. Histogram of difference for NDVI and NDRE between different flight altitudes: (a,d) between 60 m and 20 m, (b,e) between 80 m and 20 m, and (c,f) between 80 m and 60 m.
Remotesensing 12 03030 g015
Table 1. Specifications of MicaSense RedEdge sensor.
ParameterSpecification
Spectral bandsBlue, green, red, red edge, near-infrared
Ground sample distance8.2 cm/Pixel (per band) at 120 m above ground level
Capture speedProgrammable by seconds interval for all bands
FormatRAW 12–bit camera
Foal length / field of view (FOV)5.5 cm/47.2 degrees (FOV)
Image resolution1280 × 960 pixels
Table 2. MicaSense RedEdge spectral bands with respective wavelength and bandwidth values.
BandCenter Wavelength (nm)Bandwidth (nm)
Blue (B)47532
Green (G)56027
Red (R)66816
Red edge (R–Edge)71712
Near-infrared (NIR)84257
Table 3. Summary of flight parameters and details of collected images. GSD: ground sampling distance.
Flight AltitudeArea Covered (Acres)Number of FlightsPlanned GSDProcessed GSDNumber of ImagesTotal Processing TimeProcessing Time per Acres
20 m5.7 41.39 cm1.37 cm88004h and 22 m46 m
60 m12.214.17 cm5.16 cm235056 m5 m
80 m22.015.56 cm5.68 cm21951h and 6 m3 m
Table 4. Correlation and accuracy value of CPA diameter.
Flight AltitudeCorrelation Coefficient (r)Accuracy (%)
20 m0.90390.35
60 m0.93892.47
80 m0.91289.69
Table 5. Correlation and accuracy value of tree height.
Flight AltitudeCorrelation Coefficient (r)Accuracy (%)
20 m0.76578.10
60 m0.87586.52
80 m0.88385.70
Table 6. Correlation analysis between crown diameter and height, and NDVI and NDRE at different flight heights.
Variables of ComparisonFlight AltitudeCorrelation Coefficient (r)
CPA DiameterHeight20 m0.277
60 m0.568
80 m0.583
NDVINDRE20 m0.863
60 m0.910
80 m0.924

