Article

Recent Abnormal Hydrologic Behavior of Tibetan Lakes Observed by Multi-Mission Altimeters

1
Key Laboratory of Watershed Geographic Sciences, Nanjing Institute of Geography and Limnology, Chinese Academy of Sciences, Nanjing 210008, China
2
University of Chinese Academy of Sciences, Beijing 100049, China
3
Department of Geography and Geospatial Sciences, Kansas State University, Manhattan, KS 66506, USA
4
Key Laboratory of Meteorological Disaster, Ministry of Education (KLME), Joint International Research Laboratory of Climate and Environment Change (ILCEC), Collaborative Innovation Center on Forecast and Evaluation of Meteorological Disasters (CIC-FEMD), Nanjing University of Information Science & Technology, Nanjing 210044, China
5
State Key Laboratory of Hydrology—Water Resources and Hydraulic Engineering, Hohai University, Nanjing 210098, China
6
College of Hydrology and Water Resources, Hohai University, Nanjing 211100, China
*
Author to whom correspondence should be addressed.
Remote Sens. 2020, 12(18), 2986; https://doi.org/10.3390/rs12182986
Submission received: 28 July 2020 / Revised: 8 September 2020 / Accepted: 11 September 2020 / Published: 14 September 2020

Abstract

:
Inland lakes in the Tibetan Plateau (TP) with closed catchments and minimal human disturbance are an important indicator of climate change. However, the examination of changes in the spatiotemporal patterns of Tibetan lakes, especially water level variations, is limited due to inadequate access to measurements. This obstacle has been improved by the development of satellite altimetry observations. The more recent studies revealed that the trend of central TP to grow decreased or reversed between 2010 and 2016. However, thus far, this trend has not been investigated to determine whether this pattern would last for the following years. This study aims to combine the traditional (launched before 2010, e.g., TOPEX/POSEIDON, ERS-1, ERS-2, Jason-1/-2, and Envisat) and recently advanced (launched after 2010, e.g., SARAL and Sentinel-3) altimetry observations to understand the Tibetan lake changes further in recent years. Therefore, we acquired information on the continuous lake level changes in Tibetan lakes using the lake level sequence integration method based on multisource altimetry satellites. The results revealed that water level changes in 22 examined lakes showed abrupt rises in 2016–2018, but the onsets and magnitudes of the rises varied among the lakes. During the study period, the water levels of the lakes (except Nam Co) revealed a drastic rising tendency with a mean rate of 0.74 m/a, which was remarkably higher than the average rate of water level rise over the period 2010–2015 (approximately 0.28 m/a). Specifically, the water level of the nine lakes in the Northern TP (NTP) displayed a significant rising trend, with an average rate of 0.82 m/a. In the Central TP (CTP), the lake level changes were generally divided into two categories. The water levels for the lakes in the Western CTP rose rapidly, while, in the Eastern CTP, the lake water levels rose slowly, with an average rising rate less than 0.40 m/a. The water levels for the lakes in the Northeastern TP (NETP) and Northwestern TP (NWTP) kept a stable rising tendency. According to the results of the climate analysis, the spatial differences of the lake level rise rates were primarily caused by the spatial and temporal changes of precipitation over the TP.

1. Introduction

Lakes are an important part of the global hydrological and biogeochemical cycles, as well as an essential resource for human societies [1,2,3]. These inland waterbodies are quite sensitive to climate changes and human activities. The last several decades have witnessed widespread and tremendous changes in lakes in the context of global changes at the regional and global scales [4,5,6,7,8]. Lake changes have profound effects on the regional water balance, ecosystems, biogeochemical cycles, exchange of energy, and tracing gases with the atmosphere and human water consumption. Therefore, the investigation of lake variability is critical for a wide range of socioeconomic, political, and scientific interests. Several recent efforts, such as Pekel et al. [9], Donchyts et al. [10], Yao et al. [11], and Busker et al. [12], elucidated the lake dynamics at the global scale using multitemporal satellite optical and altimetry observations. The prominent characteristics revealed in these studies suggest that many large lakes, such as the Caspian Sea, Aral Sea, and Urmia Lake in the endorheic basins of the Eurasian hinterlands, shrank remarkably in recent decades [13]. In contrast, widespread lake growths have been observed in Earth’s highest plateau, the Tibetan Plateau (TP).
The TP is characterized by vast distributions of glaciers and lakes. There are approximately 1200 lakes (lakes with sizes ≥1 km2), with a total area of about 46,500 km2, according to recent investigations [14,15]. The lack of historical in-situ data in the remote and sparsely populated TP has greatly limited the investigations of the hydrological and climate responses of the lakes to the changing climate. However, this obstacle has been reduced by the rapidly emerging satellite observations from various sensors. Many prior studies employed optical satellite images to examine lake changes across space and time in the TP [14,15,16,17,18,19,20,21,22,23,24]. However, the acquisition of high-quality optical images is usually impeded by unfavorable weather conditions, which limit the monitoring of interannual and seasonal changes in the lake area. Moreover, derived lake area variations only indirectly indicate the lake water volume changes. Therefore, increasing satellite altimetry measurements have been synergized for the investigation of the lake dynamics across the TP.
Phan et al. [25], Song et al. [18], Wang et al. [26], and Zhang et al. [27] examined the changes in the lake water levels in the TP using the Ice, Cloud and land Elevation Satellite (ICESat) laser altimetry data and found that most Tibetan lakes experienced rapid water level rises during 2003–2009. However, the long revisit cycle and sparse sampling of the ICESat mission is insufficient for tracing continuous and real-time changes in the water levels, thereby making it difficult to explore the trends and spatial differences of lake changes in the TP. Favorably, the height measurements of satellite radar altimeters that have been launched continuously since the early 1990s can extend the lake-level observations to a longer temporal coverage. The advantages are applications that are not affected by the weather and a reasonable high frequency of revisits from monthly to ten-day time scales so that we can better solve the spatial and temporal patterns of the water level changes and driving mechanisms in the TP. The combination of multi-radar altimetry missions, including TOPEX/POSEIDON, ERS-1/-2, Envisat, Cryosat-2, and Jason-1/-2/-3, at the height accuracy ranging from decimeters to centimeters have been used to investigate the decadal water level changes of the lakes in the TP [28,29,30]. However, these radar altimeters are only suitable for large water bodies, and many lakes are only accessible by one or two satellites because of their large-size footprints and along-track/cross-track spacing.
The recent advances in satellite altimeters, such as CryoSat-2 (2010−), SARAL/AltiKa (2013−), Jason-3 (2016−), and Sentinel-3 (2016−), provide alternative options of measuring relatively smaller water bodies (relative to the lakes observed by traditional radar altimetry satellites). For example, compared with the previous altimetry satellites, the improvement of SARAL/AltiKa was that it was the first altimeter to measure in the Ka band, with higher spatial resolutions. In addition, the enhanced bandwidth of AltiKa (500 MHz) resulted in a higher vertical resolution and higher pulse repetition frequency [31]. Therefore, the more recent studies benefiting from the longer and finer observations revealed that the growth tendency of the lakes in the Central TP were decelerated or reversed during the period 2010–2016 [32,33,34,35]. However, whether the deceleration or hiatus has lasted in the following years remains unclear. Although there have been studies that update the lake level changes in the TP [34,36,37], the focus has mostly been on extending the lake level observation times. However, there has been no systematic analysis of abnormal lake level changes in recent years. Thus, this study aims to combine the traditional and recently advanced radar altimetry measurements to update our understanding of the changing characteristics of Tibetan lakes in the recent past several years. Furthermore, we will explore the potential climate-driving mechanisms of the recent varying tendency of lake changes in the TP.

2. Materials and Methods

2.1. Study Region

The TP, located in Central Eurasia, has a geographic area about 3 million km2 [18] and mean altitude of approximately 4000 m. The climate in the TP is marked by low temperatures and strong solar radiation [38]. Precipitation in the TP is characterized by strong seasonality. Most of the precipitation (60–90% of the annual total precipitation) occurs between June and September, while the rainfall from November to February is less than 10%. [39]. The TP and its surroundings are sometimes known as “Earth’s Third Pole” and the “Water Tower of Asia” because of the abundant water resources. It is the birthplace of many large rivers (Yangtze River, Yellow River, Mekong River, etc.) in China and throughout Asia. In addition, the region is densely distributed with many lakes, which are currently undergoing significant changes due to the impacts of climate changes [40]. In this study, a total of 22 lakes (with sizes from 111.93 km2 to 4493.52 km2) in the TP were selected for analysis based on the altimetry data coverage. The characteristics of the studied 22 TP lakes covered by satellite altimetry are presented in Figure 1.

2.2. Study Data

2.2.1. LEGOS Hydroweb and DAHITI Altimetry Data Archives

Observation data provided by altimetry satellites, including TOPEX/POSEIDON(T/P), ERS-1, ERS-2, Jason-1/-2/-3, Envisat, and Cryosat-2, have been gradually increased since the early 1990s (Table 1). The combination of different altimetry satellites can increase the spatial coverage of altimetry measurements and extend the temporal span to nearly thirty years. At present, the long-term lake-level changes reconstructed by many institutions are based on the altimetry satellite data of different service years. As a data source of our analyzed water levels, we obtained lake levels from the Laboratoire d Etudes en Géophysique et Océanographie Spatiales (LEGOS) Hydroweb altimetry data archive and the Hydrological Time Series of Inland Waters (DAHITI) altimetry data archive. The LEGOS Hydroweb altimetry data archive was derived from merged Topex/Poseidon, Jason, Envisat, and Sentinel data [41,42]. All background rectifications have been used to produce this data archive. Since different altimetry satellites are used for the same lake, the water level calculation is mainly divided into three steps. First, each satellite data was processed separately to obtain the altimetry measurement data of different satellites, and then, Topex/Poseidon data was used as the reference standard to minimize potential radar instrument deviations and geoid differences between different satellites. Finally, lake levels from the different satellites were merged. The DAHITI data archive was launched by the Deutsches Geodätisches Forschungsinstitut (DGFI, now DGFI-TUM) in 2013. The processing procedure of the DAHITI database in detail can be referred to in Schwatke et al. [43], which was based on an extended outlier detection and a Kalman filtering of multisource-merged altimetry measurements. In this study, because the algorithms adopted by the two data archives were different, we only used one of them for a lake. When a lake was covered by the two data archives at the same time, the Hydroweb data archive was selected as the priority.
Both data archives cover a certain number of lakes in the TP (Table 2). The long-term water level change information of 16 lakes was obtained based on the Hydroweb and DAHITI data archives. However, the number of lakes cannot fully meet the needs of our lake-level monitoring (refer back to Figure 1). Therefore, in this study, SARAL and Sentinel-3 altimetry data were used to supplement the missing observations from the LEGOS Hydroweb and DAHITI data archives. We interpreted and combined SARAL and Sentinel-3 altimetry data to obtain a total of 12 lake-level time series during the period 2013–2018. Six of them, covering the same lakes as the Hydroweb and DAHITI data archives, were used to verify the reliability of SARAL and Sentinel-3 altimetry data. Others were used as the data supplement.

2.2.2. Supplementary Altimetry Data

SARAL/AltiKa Data

SARAL is a common mission of the Indian Space Research Organization (ISRO) and the France space agency [31]. The mission, launched on 25 February 2013, is a continuation of the ERS series and Envisat missions. The orbit and revisit cycle of SARAL satellite were the same as Envisat, but after July 2016, the SARAL satellite was then transformed to drifting ground track mode. We downloaded the SARAL data (spanning from March 2013 to June 2016) from ftp://avisoftp.cnes.fr.

Sentinel-3/SRAL Data

The Surface Topography Mission uses the Synthetic Aperture Radar Altimeter (SRAL) instrument, which transmits pulses occasionally at Ku band for altimeter range measurements and is supplemented by a C-band frequency to correct range delay errors. The SRAL instrument acquires data in two measurement modes: the low-resolution mode (LRM), which is useful over homogeneous open-ocean surfaces, and the synthetic aperture radar (SAR) mode, which achieves high along-track resolution over relatively flat surfaces. Sentinel-3 satellite has multiple new functions and modes with the dual-frequency SAR radar altimeter (SRAL) [44]. Among them, the tracking mode is the most critical characteristic. We downloaded the needed data from March 2016 to December 2018 through https://sentinel.esa.int/web/sentinel/ sentinel-data-access.

2.2.3. Climate Data

The annual and monthly precipitation data from 10 stations in the TP were collected from the China Meteorological Network (http://data.cma.cn) to investigate the climate impacts of the lake water level changes in 1990–2018. The locations of the ten stations are shown in Figure 1. In addition, we analyzed the changes of water vapor transport modes over the TP and its surroundings based on ERA-interim reanalysis data with a spatial resolution of 0.75° × 0.75° [45].

2.3. Methods

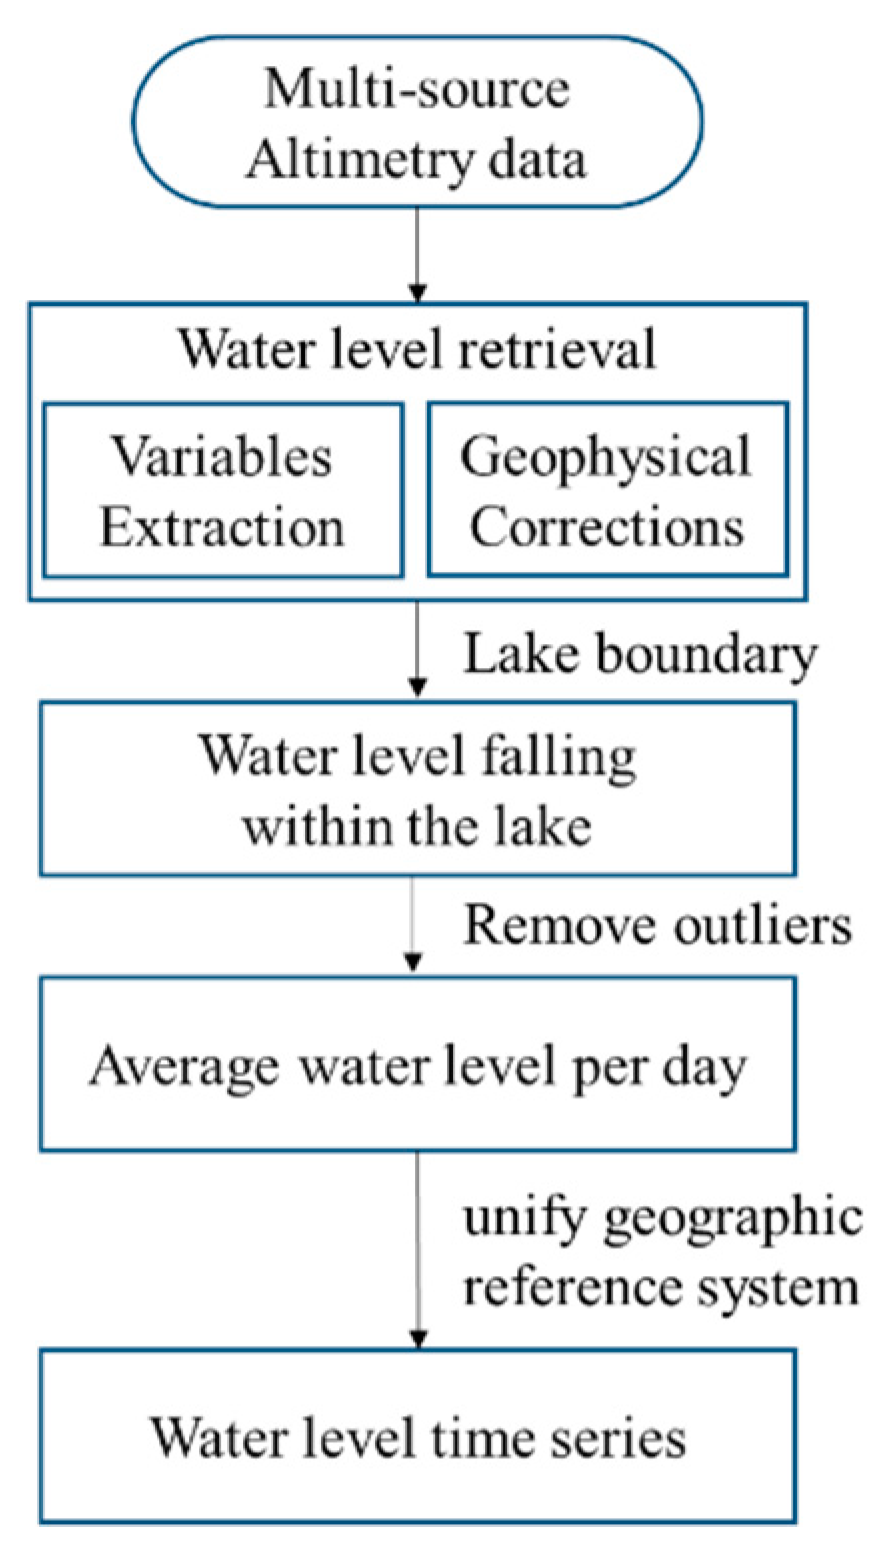
2.3.1. Altimetry Water Level Processing

We retrieved important variables, such as time, latitude, longitude, water level elevation, and geoid, from the collected raw data files. Since the parameter information contained in each altimeter satellite was not completely consistent, the water level calculations needed to refer to the data manual for each altimeter satellite.

2.3.2. Removal of Measurement Outliers

For all lakes, the original tracks of the satellite are observed as they pass through the lake, and then, the track data falling within the lake will be selected. As the observations contain outliers, it is necessary to eliminate them for subsequent work. Outlier elimination for the selected orbit data was divided into two steps [35,46]:
Step 1:
We removed the outliers that were more than 3 standard deviations from the median for all the measurements.
Step 2:
We removed the data other than twice the standard deviation for single-day measurements.

2.3.3. Unifying the Reference System of Different Altimetry Sources

In order to reduce the differences caused by different altimeter instruments, all lake levels from multisource altimetry satellites were first converted to the same geographic reference system. The system biases calculated by the data from different altimetry satellites at the same period were subtracted from the elevation measurements for each lake [47,48].
The specific procedures are shown in Figure 2.

3. Results

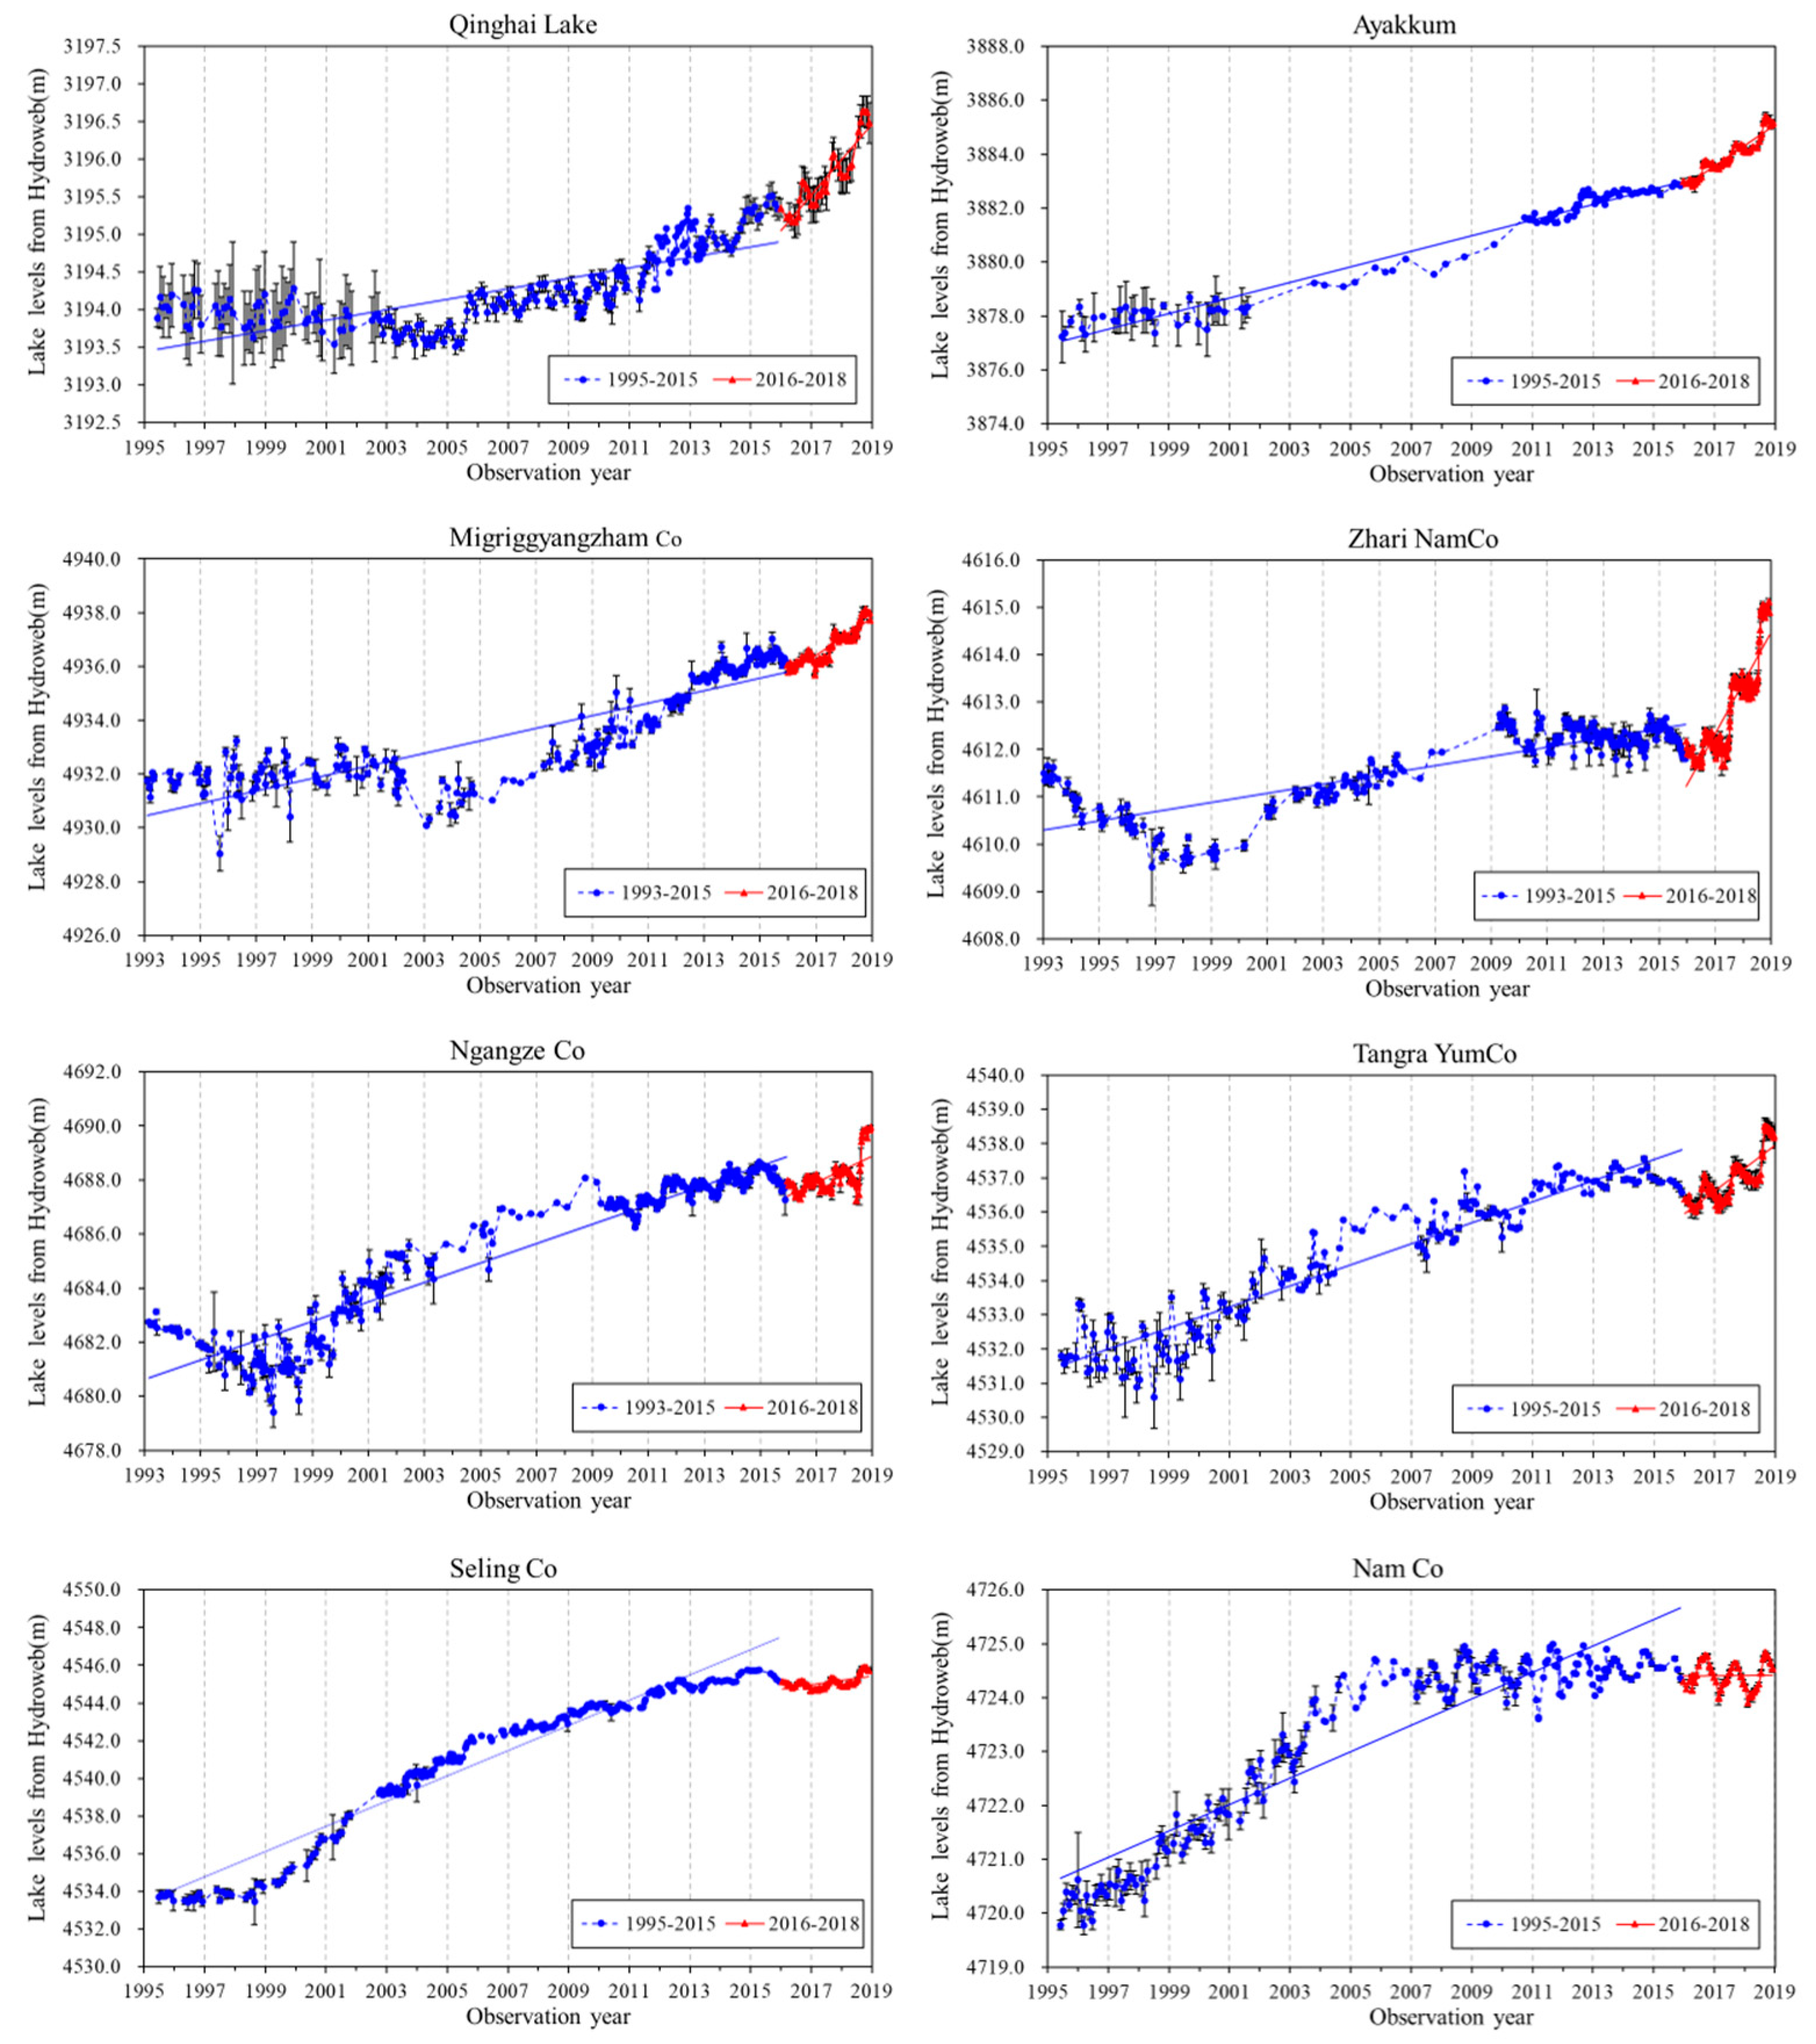
3.1. Long-Term Lake Level Variations Based on the Hydroweb and DAHITI Data Archives

The best way of altimetry data validation is to compare the altimeter-derived lake level with the in-situ data. At present, only a few lakes, such as Qinghai Lake and Nam Co, have long-term continuous water level observations in the TP, which are extremely limited compared with more than 1200 lakes (>1 km2) across the TP [49]. The altimetry data archives, such as Hydroweb and DAHITI, play a critical role in verifying the lake level changes obtained by other satellite altimetry data. In order to verify the reliability of the Hydroweb and DAHITI altimetry data archives, the annual means of the water level for Qinghai Lake were validated against the in-situ water levels measured by the hydrological station. As shown in Figure 3, the altimetry levels demonstrate a robust linear correlation with in-situ measurements, with an R2 value of 0.90. This agreement indicates that the lake level time series obtained from Hydroweb and DAHITI have a high reliability and, therefore, were used as a reference for validating our level time series processed from the SARAL and Sentinel-3 altimeters.
Figure 4 presents the time series of water levels for eight large TP lakes from the Hydroweb and DAHITI data archives from the 1990s to 2018. All of the eight lakes showed rapid water level increases since around 2000. By comparison, the abrupt changing points varied with different lakes. For example, the lake levels for Seling Co, Nam Co, Ngangze Co, and Tangra Yumco began to rise rapidly before 2000, while Migriggyangzham Co and Qinghai Lake began to grow rapidly after 2003 and 2005, respectively. The most significant expansion occurred in Seling Co in Central Tibet. From May 1998 to December 2010, the lake level for Seling Co rose from 4533.66 m to 4543.77 m, with an increasing rate exceeding 0.80 m/a. However, for these lakes, the increasing trends became weaker or even reversed after 2010. The findings were consistent with other previous studies [32,33,34,35,50]. However, the lake levels for some lakes, such as Qinghai Lake, Zhari Namco, Tangra Yumco, Ngangze Co, and Migriggyangzham Co, began to increase significantly again after 2016. Among them, the abrupt rise of Zhari Namco was the most remarkable, with a water level increase during 2016–2018 of more than the total during the previous 16 years (2000–2016). By contrast, the lake level for Nam Co showed interannual fluctuations without an evident trend during the recent several years. The level time series of other lakes are provided in the Supplementary Materials (Figure S1).

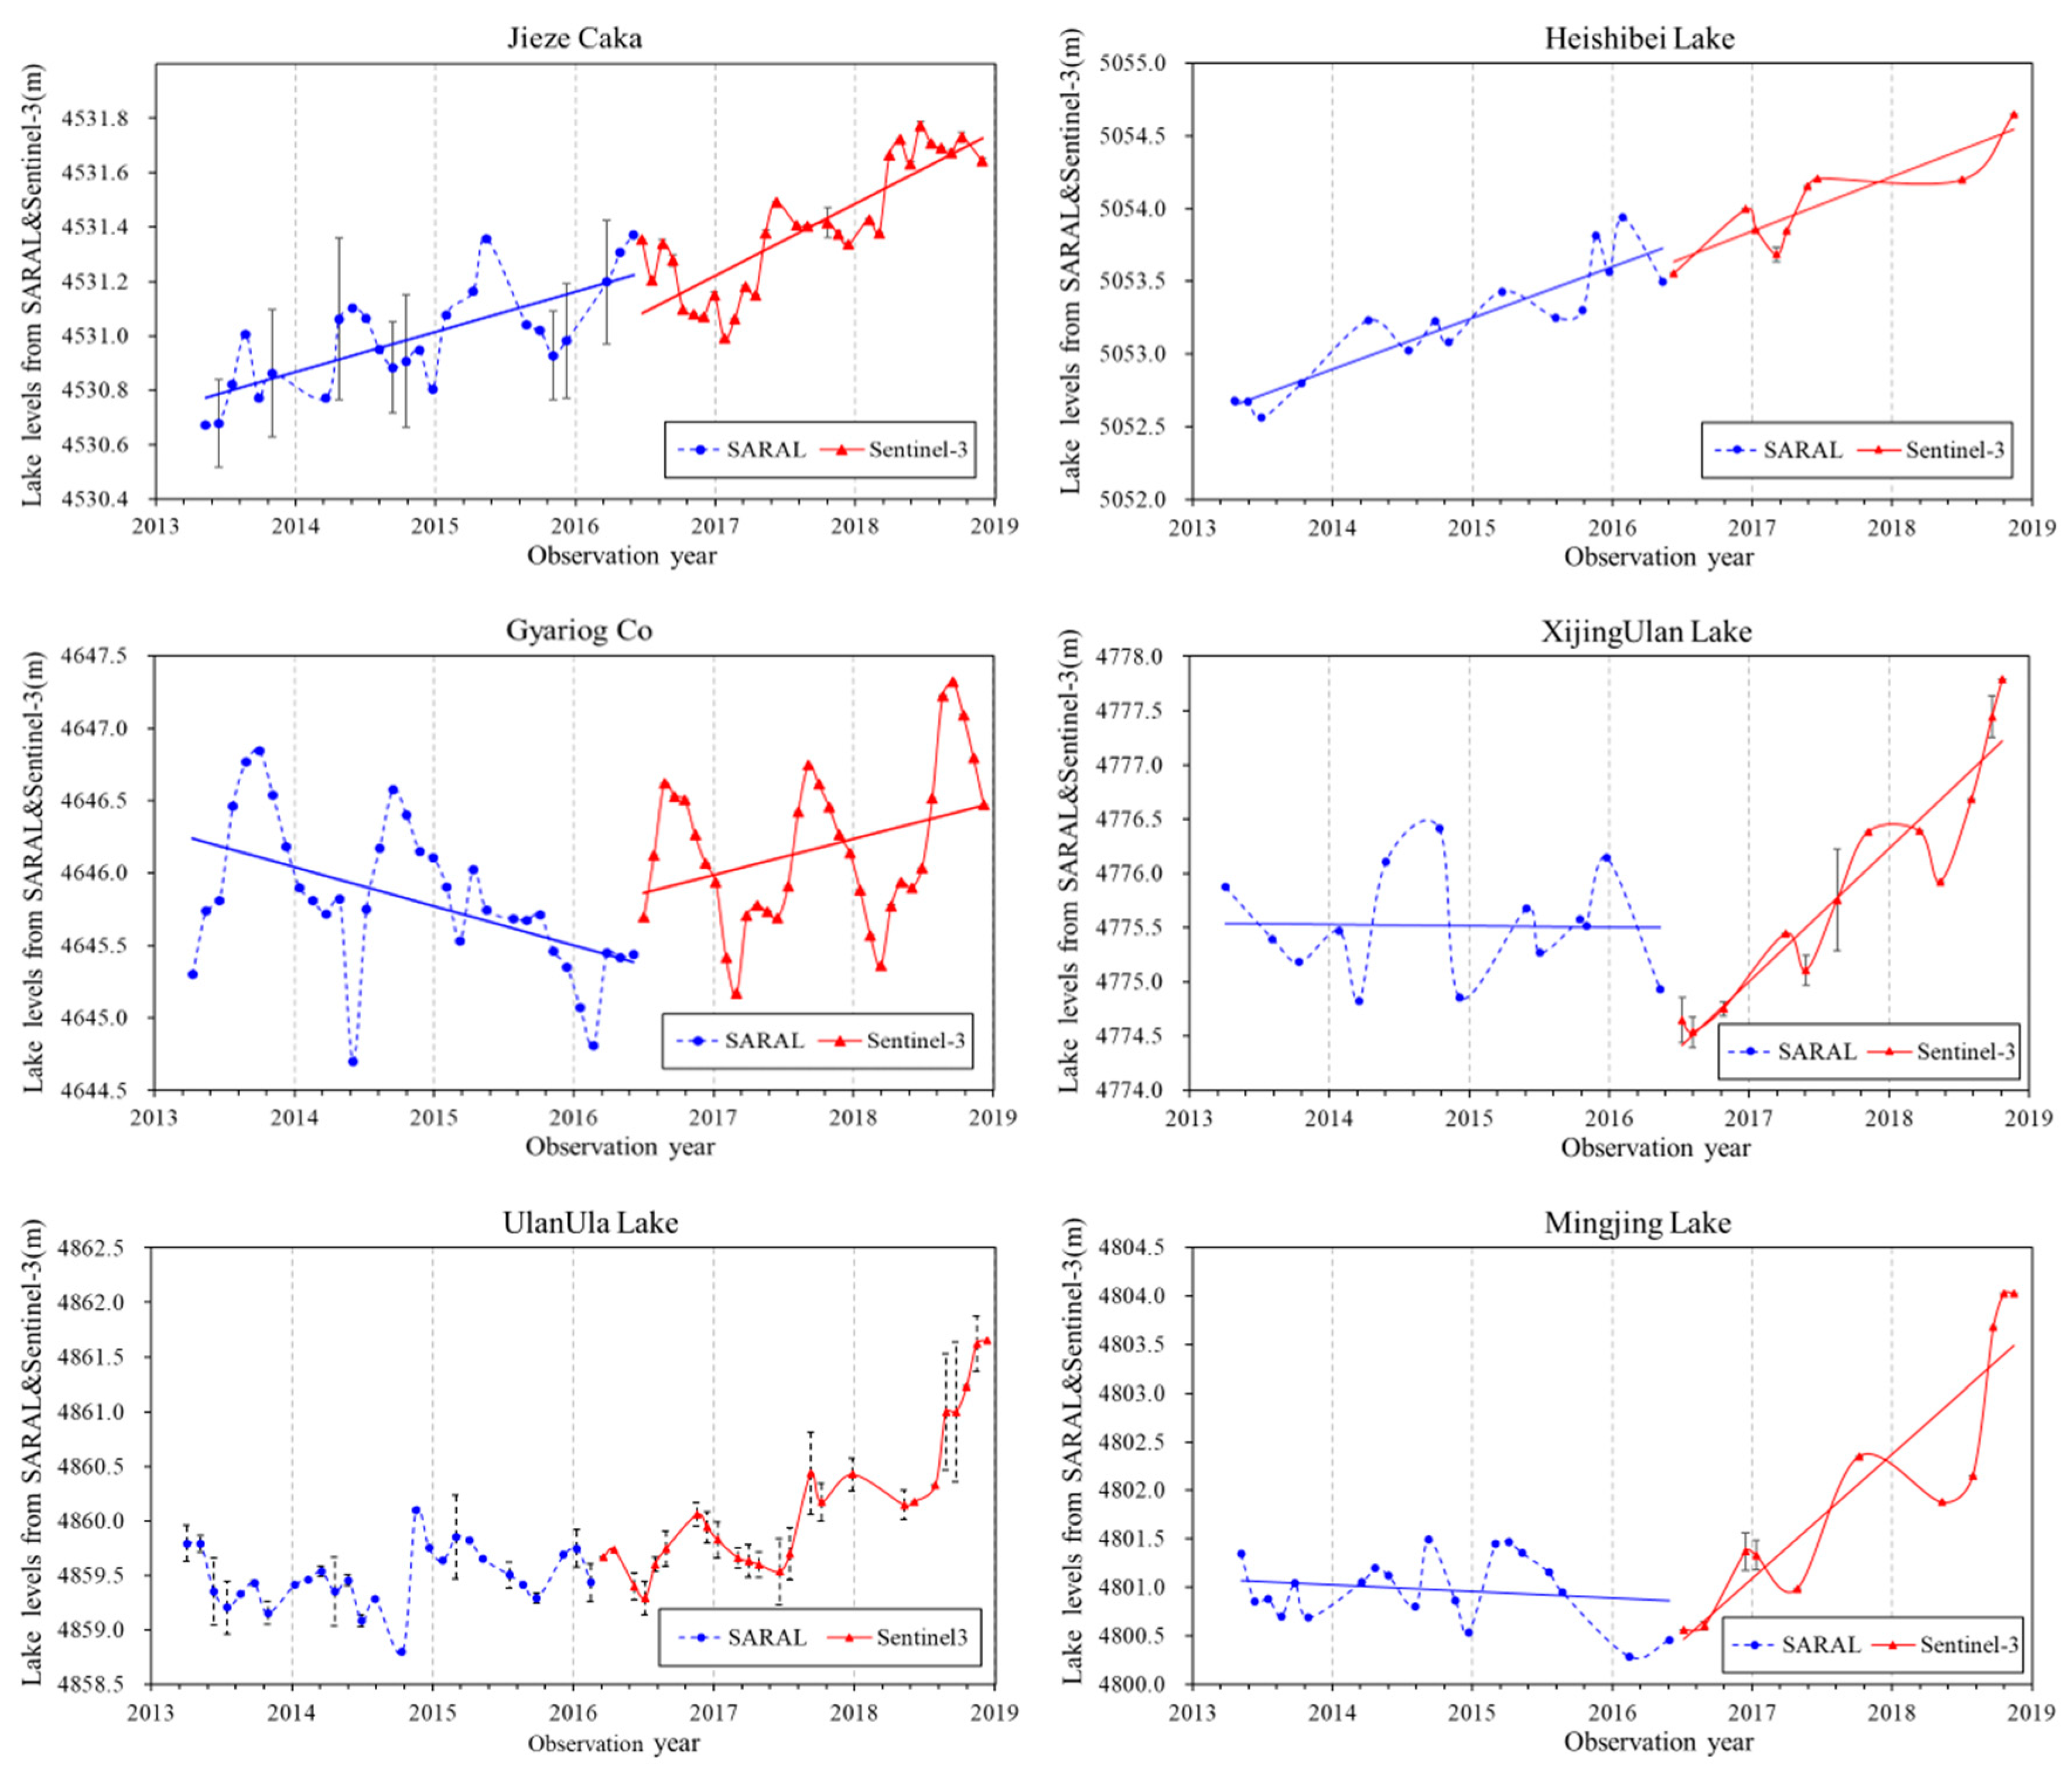
3.2. Lake Level Variations Based on SARAL and Sentinel-3 Altimetry Data

In order to examine whether abrupt water level increases during 2016–2018 occurred similarly in other Tibetan lakes, we investigated the water level changes of a total of 12 lakes from 2013 to 2018 by combining SARAL and Sentinel-3 altimetry data. Six of them were aimed to intercompare with the Hydroweb and DAHITI altimetry data. Figure 5 presents the comparisons of the water-level time series from the Hydroweb/DAHITI data archives and SARAL/Sentinel-3 data between 2013 and 2018 for Qinghai Lake, Nam Co, Ayakkum, Migriggyangzham Co, Zhari Namco, and Tangra Yumco. The water level time series for all the lakes indicated that general trends derived from two data sources are comparable, and abrupt changes and intra-annual variations of the lake levels are generally consistent. For example, both data sources clearly depicted a sudden increase of about 1.0 m during the wet season (July–September) of 2017 for Zhari Namco. The characteristics of the water levels rises in the wet seasons and declines in the dry seasons are also in good agreement for all the lakes, suggesting that SARAL and Sentinel-3 data have reliable results.
Based on the above validation, the SARAL and Sentinel-3 data were used to monitor the lakes larger than 100 km2 in the TP, and the water level time series are shown in Figure 6. The six lakes display an evident trend of water level increases at varying rates during 2016–2018. For example, the alpine lakes between the Tanggula and Kunlun Mountains, including the Xijin Ulan Lake, Mingjing Lake, and Ulan Ul Lake, showed a significant rise (exceeding 1 m/a). By contrast, the lake level for Gyariog Co showed an interannual fluctuation.

3.3. Spatial Distribution of Lake Level Changing Rates During 2016–2018

Our results of the lake level changing rates are shown in Figure 7 and Table 3. Obviously, most lakes experienced a significant increase during the period 2016–2018. To be specific, except the lake level of Nam Co (remained relatively stable, with little fluctuations), the water level time series of the other lakes revealed a rising tendency with a mean rate of 0.74 m/a. The three lakes in the Northwestern TP: Jieze Caka, Lumajangdong Co, and Heishibei Lake showed significant differences in water level rising rates, with the level for Heishibei Lake increasing the fastest at 1.39 m/a. The northern part of the TP is located in the Hoh Xil Region, which is known for a complex and harsh geographical environment. A large number of endorheic lakes are distributed in this region. As listed in Table 3, most of the lakes have expanded, with an average level increase of larger than 0.82 m/a. The level for Xijin Ulan Lake increased at the greatest rate of 1.52 m/a. Ayakkum, the largest lake in this region, also exhibited a significant increase of 0.83 m/a. The average increasing rate was 0.66 m/a in the central part of the TP. The lake levels for Dagze Co and Zhari Namco experienced a rapid rise, exceeding 1 m/a. In Qinghai Province, the level for Qinghai Lake maintained a steady increasing trend of 0.47 m/a. Overall, most lakes in the Northern Tibetan Plateau experienced relatively faster rates of water level rises compared to those in the Northeastern TP (NETP) and Eastern CTP.

4. Discussion

4.1. The Driving Factors of Abnormal Lake Level Changes

Since the late 1990s, the expansion of Tibetan lakes has been mainly affected by regional climate changes, such as an increased water vapor content, potential evaporation reduction, and significantly enhanced air convection [51,52]. Most of the previous studies only analyzed the correlation between the lakes and climate changes from a qualitative perspective. However, which driving factors dominate the lake dynamics is still under debate. Favorably, benefiting from research based on quantitative analyses in recent years, it has become a consensus that precipitation variations play a leading role in lake water storage [53,54]. Therefore, with the acceleration of climate warming and humidification, the precipitation could be also gradually increase [52], which supports the observation of the rapid lake expansion in the TP.
As shown in Figure 4 and the Supplementary Materials (Figure S1), the trends of lake level changes since 1990 are generally consistent with previous studies. Our findings revealed that the drastic water level changes in Tibetan lakes since 2016 are a result of continued precipitation increases after a relatively dry period from 2012 to 2016. This suggested that precipitation remains to be a first-order driver of Tibetan lake dynamics. It was found that the drastic increase of lake levels in 2017–2018 was consistent with the increase of precipitation in the recent past several years, so the monthly precipitation data in recent years was selected and compared with the lake level. According to the study, the monthly precipitation and the lake water levels during the period 2013–2018 were selected to study the influence of specific monthly precipitations on the lake water levels. The most prominent feature was the good correspondence between lake level increases and the summer precipitations. In addition, we can find that the decrease of water levels in individual years (e.g., 2015) corresponded to less summer precipitations. The amplitude of wet season lake level increases showed a good relationship with the precipitation amount. For example, the drastic lake level rises between 2016 and 2018 in the TP corresponded to high precipitation, as shown in Figure 8. This suggested that the excessive precipitation during the wet season played a crucial role in the recent lake level increases. Although the lake level changes and precipitation do not correspond well for some lakes in individual years, meteorological stations only represent the meteorological characteristics of a local region and cannot indicate water volume variations in the whole watershed. The station data can only relatively show the trend of regional precipitation changes due to the obvious spatial heterogeneity of rainfall. Moreover, we calculated the total annual precipitation at the Gaize and Tuotuohe Meteorological Stations. We can find that the summer precipitation in 2018 was not as significant as that in 2017 at the Gaize Meteorological Station, but the total annual precipitation was still significantly higher than in ordinary years (2013–2015).
The rise of lake levels is not only affected by precipitation but, also, by glacier mass loss and permafrost thawing. However, limited by the in-situ data availability in the TP, the current quantitative studies on Tibetan lakes only focus on individual lakes. For the causes of lake changes such as climate (precipitation and temperature) or cryosphere (glacier and permafrost), qualitative analyses have been the norm [54]. However, this was implied when warming-induced melting did not reverse the slow-down or hiatus of lake expansions before 2016 (when precipitation was less), and the reoccurrence of precipitation increases eventually triggered another round of lake level increases.

4.2. Spatial Linkage of Increased Precipitation to Enhanced Water Vapor Circulations

Previous studies have identified the main sources of moisture for precipitation in the TP, including regions from the Indian subcontinent to the Southern Hemisphere, the Bay of Bengal, and the northwestern part of the TP [55,56]. It is proven that these circulation changes in the increase or decrease of different moisture sources provide favorable water vapor conditions for rainfall in the TP [57]. Thus, the changes in moisture sources contributed to different precipitation changes across the entire TP during different periods. As indicated in the preceding results, the lake water levels increased rapidly during the period 2016–2018 relative to the previous stage. The phenomenon was analyzed with the distribution of water vapor transport in the TP. Although the water vapor transport began to change in 2016 (Figure 9C), the changes in 2017/2018 were more significant. Therefore, the water levels of lakes in only some regions rose rapidly in 2016, unlike the general drastic rises in lake levels in 2017/2018.
The differences can be observed during the four years when the water vapor is transported by abnormal northwesterly and southeast wind and south wind in 2015, 2016, 2017, and 2018, respectively (Figure 9B–E). By comparison, the total water vapor increased, with the most significant anomaly in 2017–2018. In this study, precipitation in the Northern TP (NTP) was more obviously influenced by the East Asian monsoon and the Indian summer monsoon. From Figure 9D, we can also find that there is a phenomenon of internal water vapor circulation and retention, which might cause water vapor subsidence and significant rainfall over the Western CTP. In general, the change in water vapor transport during the study period supports the changing characteristics of the precipitation and lake level for the TP, as analyzed above.
Figure 7 and Table 3 present the differences in the rising rates of the lake levels at different parts of the TP in this study. The water level rising rates for some typical lakes, such as Xijin Ulan Lake, Mingjing Lake, Lexiewudan, and Ayakkum, exceed 0.80 m/a in the Northern TP. There are some glaciers distributed in the Northern TP, and there is rich rainfall in the rainy season. Therefore, the rapid increase of the water level is affected by both rainfall and glacial meltwater. The rising rate of the lake levels in Central TP is mainly divided into two categories. For example, the rising rates of Zhari Namco and Dagze Co in the Western CTP are 1.34 and 1.43 m/a, respectively. The rising rates of the lakes in the Central and Eastern CTP are slower, generally less than 0.40 m/a. The reason for this difference may be because the phenomenon of internal water vapor circulation and retention mainly occur in the Western CTP. The Northwestern TP (NWTP) was mainly affected by the westerlies, and the distinction in the water vapor transport distribution in different years led to a significant difference in the water level rising rates. As indicated in the previous sections, the differences in the water level rise rates are caused by various water vapor transport patterns and main sources in different regions.

5. Conclusions

The more recent studies benefiting from the longer and finer observations revealed that the growth tendencies of lakes in the Central TP were decelerated or reversed during the period 2010–2016. However, whether the deceleration or hiatus would last in the following years remains unclear. It has not been systematically investigated thus far. Thus, in this study, 22 large inland lakes were investigated to understand the changing characteristics of Tibetan lakes further during the period 2016–2018 by combining the traditional and recently advanced radar altimetry measurements. Furthermore, we explored the potential climate-driving mechanisms of the recent varying tendencies of lake changes in the TP. For most lakes in the TP, the lake levels showed an abrupt rise during 2016–2018, compared with the earlier stage during 2010–2016, but the onsets and magnitudes of the water level rises varied with the subzones and lakes.
Our results revealed that the lake water levels in the NTP displayed a sharp rise, with an average rate of 0.90 m/a, except Kusai Lake (outburst of its upstream lake). In the Central TP, the lake level changes were divided into two categories during the period 2016–2018, which was different from the dramatic increasing pattern for lakes in the Northern TP. The water level for Qinghai Lake in the Northeastern TP kept a stable growth tendency during the recent years at 0.47 m/a. The water level rising rates for the three lakes in the Northwestern TP (Lumajangdong Co, Jieze Caka, and Heishibei Lake) are extremely different from each other. The spatial differences of the lake level rise rates are primarily caused by the changes in precipitation over the TP, which may be related to large-scale atmospheric circulation. Although this study could be beneficial for our understanding of the driving mechanisms of the rapid water level rises of Tibetan lakes and the hydrological cycle under future climate change conditions, more comprehensive investigations of the precise physical processes are required to clarify the climate-driven mechanisms of Tibetan lake level changes in further studies.

Supplementary Materials

The following are available online at https://www.mdpi.com/2072-4292/12/18/2986/s1, Figure S1: Long-term lake level variations of the other eight large lakes in the TP during 1995–2018 based on the Hydroweb and DAHITI altimetry data archives. Figure S2: Comparison of the data distribution between the in-situ water level observations and satellite altimetry observations (from Hydroweb and DAHITI) for Qinghai Lake.

Author Contributions

Conceptualization, C.S. and P.Z.; data curation, P.Z., L.K., W.L., and C.S.; formal analysis, P.Z., C.S., W.L., and J.W.; funding acquisition, C.S. and J.W.; investigation, P.Z., J.W., and L.K.; methodology, P.Z., C.S., and L.K.; project administration, C.S.; resources, P.Z., C.S., and L.K.; software, P.Z., L.K., and J.W.; supervision, C.S. and J.W.; validation, P.Z., C.S., J.W., K.L., and T.C.; visualization, P.Z. and C.S.; writing—original draft, P.Z. and C.S.; and writing—review and editing C.S., J.W., L.K., P.Z., K.L., and T.C. All authors have read and agreed to the published version of the manuscript.

Funding

This work was partly funded by the Strategic Priority Research Program of the Chinese Academy of Sciences (Grant No. XDA23100102); the Second Tibetan Plateau Scientific Expedition and Research (2019QZKK0202); the National Key Research and Development Program of China (Grant No. 2019YFA0607101, 2018YFD0900804, and 2018YFD1100101); the Thousand Young Talents Program in China (Grant No. Y7QR011001); and the National Natural Science Foundation of China (No. 41971403 and 41801321).

Acknowledgments

We are also grateful to the Laboratoire d’Etudes en Géophysique et Océanographie Spatiales (LEGOS), the Hydrological Time Series of Inland Waters (DAHITI), the NASA EOSDIS Physical Oceanography Distributed Active Archive Center (PO.DAAC), Centre National d’Etudes Spatiales (CNES), the China Meteorological Data Sharing Service System, and the European Centre for Medium-Range Weather Forecasts for providing satellite altimetry data and meteorological data for this study.

Conflicts of Interest

The authors declare no conflict of interest.

References

  1. Lehner, B.; Döll, P. Development and validation of a global database of lakes, reservoirs and wetlands. J. Hydrol. 2004, 296, 1–22. [Google Scholar] [CrossRef]
  2. Palmer, S.C.; Kutser, T.; Hunter, P.D. Remote sensing of inland waters: Challenges, progress and future directions. Remote Sens. Environ. 2015, 157, 1–8. [Google Scholar] [CrossRef] [Green Version]
  3. Sheng, Y.; Song, C.; Wang, J.; Lyons, E.A.; Knox, B.R.; Cox, J.S.; Gao, F. Representative lake water extent mapping at continental scales using multi-temporal Landsat-8 imagery. Remote Sens. Environ. 2016, 185, 129–141. [Google Scholar] [CrossRef] [Green Version]
  4. Shi, K.; Zhang, Y.; Liu, X.; Wang, M.; Qin, B. Remote sensing of diffuse attenuation coefficient of photosynthetically active radiation in Lake Taihu using MERIS data. Remote Sens. Environ. 2014, 140, 365–377. [Google Scholar] [CrossRef]
  5. Smith, L.C.; Sheng, Y.; MacDonald, G.; Hinzman, L. Disappearing arctic lakes. Science 2005, 308, 1429. [Google Scholar] [CrossRef] [Green Version]
  6. Song, C.; Huang, B.; Ke, L. Modeling and analysis of lake water storage changes on the Tibetan Plateau using multi-mission satellite data. Remote Sens. Environ. 2013, 135, 25–35. [Google Scholar] [CrossRef]
  7. Vörösmarty, C.J. Global water assessment and potential contributions from Earth Systems Science. Aquat. Sci. 2002, 64, 328–351. [Google Scholar] [CrossRef]
  8. Wang, J.; Sheng, Y.; Tong, T.S.D. Monitoring decadal lake dynamics across the Yangtze Basin downstream of Three Gorges Dam. Remote Sens. Environ. 2014, 152, 251–269. [Google Scholar] [CrossRef]
  9. Pekel, J.-F.; Cottam, A.; Gorelick, N.; Belward, A.S. High-resolution mapping of global surface water and its long-term changes. Nature 2016, 540, 418–422. [Google Scholar] [CrossRef]
  10. Donchyts, G.; Eilander, D.; Schellekens, J.; Winsemius, H.; Gorelick, N.; Erickson, T.; Van De Giesen, N. Monitoring Earth’s reservoir and lake dynamics from space. In Proceedings of the AGU Fall Meeting Abstracts, San Francisco, CA, USA, 12–16 December 2016. [Google Scholar]
  11. Yao, F.; Wang, J.; Wang, C.; Crétaux, J.-F. Constructing long-term high-frequency time series of global lake and reservoir areas using Landsat imagery. Remote Sens. Environ. 2019, 232, 111210. [Google Scholar] [CrossRef]
  12. Busker, T.; de Roo, A.; Gelati, E.; Schwatke, C.; Adamovic, M.; Bisselink, B.; Pekel, J.-F.; Cottam, A. A global lake and reservoir volume analysis using a surface water dataset and satellite altimetry. Hydrol. Earth Syst. Sci. 2019, 23, 669–690. [Google Scholar] [CrossRef] [Green Version]
  13. Wang, J.; Song, C.; Reager, J.T.; Yao, F.; Famiglietti, J.S.; Sheng, Y.; MacDonald, G.M.; Brun, F.; Schmied, H.M.; Marston, R.A. Recent global decline in endorheic basin water storages. Nat. Geosci. 2018, 11, 926–932. [Google Scholar] [CrossRef] [PubMed] [Green Version]
  14. Qiao, B.; Zhu, L.; Yang, R. Temporal-spatial differences in lake water storage changes and their links to climate change throughout the Tibetan Plateau. Remote Sens. Environ. 2019, 222, 232–243. [Google Scholar] [CrossRef]
  15. Wan, W.; Long, D.; Hong, Y.; Ma, Y.; Yuan, Y.; Xiao, P.; Duan, H.; Han, Z.; Gu, X. A lake data set for the Tibetan Plateau from the 1960s, 2005, and 2014. Sci. Data 2016, 3, 160039. [Google Scholar] [CrossRef] [PubMed] [Green Version]
  16. Zhu, L.; Xie, M.; Wu, Y. Quantitative analysis of lake area variations and the influence factors from 1971 to 2004 in the Nam Co basin of the Tibetan Plateau. Chin. Sci. Bull. 2010, 55, 1294–1303. [Google Scholar] [CrossRef]
  17. Huang, S.; Dahal, D.; Young, C.; Chander, G.; Liu, S. Integration of Palmer Drought Severity Index and remote sensing data to simulate wetland water surface from 1910 to 2009 in Cottonwood Lake area, North Dakota. Remote Sens. Environ. 2011, 115, 3377–3389. [Google Scholar] [CrossRef] [Green Version]
  18. Song, C.; Huang, B.; Richards, K.; Ke, L.; Hien Phan, V. Accelerated lake expansion on the Tibetan Plateau in the 2000s: Induced by glacial melting or other processes? Water Resour. Res. 2014, 50, 3170–3186. [Google Scholar] [CrossRef] [Green Version]
  19. Lei, Y.; Yang, K.; Wang, B.; Sheng, Y.; Bird, B.W.; Zhang, G.; Tian, L. Response of inland lake dynamics over the Tibetan Plateau to climate change. Clim. Chang. 2014, 125, 281–290. [Google Scholar] [CrossRef]
  20. Lu, S.; Jia, L.; Zhang, L.; Wei, Y.; Baig, M.H.A.; Zhai, Z.; Meng, J.; Li, X.; Zhang, G. Lake water surface mapping in the Tibetan Plateau using the MODIS MOD09Q1 product. Remote Sens. Lett. 2017, 8, 224–233. [Google Scholar] [CrossRef]
  21. Mao, D.; Wang, Z.; Yang, H.; Li, H.; Thompson, J.R.; Li, L.; Song, K.; Chen, B.; Gao, H.; Wu, J. Impacts of climate change on Tibetan lakes: Patterns and processes. Remote Sens. 2018, 10, 358. [Google Scholar] [CrossRef] [Green Version]
  22. Zhang, G.; Luo, W.; Chen, W.; Zheng, G. A robust but variable lake expansion on the Tibetan Plateau. Sci. Bull. 2019, 64, 1306–1309. [Google Scholar] [CrossRef] [Green Version]
  23. Song, C.; Huang, B.; Ke, L.; Richards, K.S. Remote sensing of alpine lake water environment changes on the Tibetan Plateau and surroundings: A review. ISPRS J. Photogramm Remote Sens. 2014, 92, 26–37. [Google Scholar] [CrossRef]
  24. Zhu, J.; Song, C.; Wang, J.; Ke, L. China’s inland water dynamics: The significance of water body types. Proc. Natl. Acad. Sci. USA 2020, 117, 13876–13878. [Google Scholar] [CrossRef] [PubMed]
  25. Phan, V.; Lindenbergh, R.; Menenti, M. Seasonal trends in Tibetan lake level changes as observed by ICESat laser altimetry. ISPRS Ann. Photogramm. Remote Sens. Spat. Inf. Sci. 2012, 1, 237–242. [Google Scholar] [CrossRef] [Green Version]
  26. Wang, X.; Gong, P.; Zhao, Y.; Xu, Y.; Cheng, X.; Niu, Z.; Luo, Z.; Huang, H.; Sun, F.; Li, X. Water-level changes in China’s large lakes determined from ICESat/GLAS data. Remote Sens. Environ. 2013, 132, 131–144. [Google Scholar] [CrossRef]
  27. Zhang, G.; Xie, H.; Kang, S.; Yi, D.; Ackley, S.F. Monitoring lake level changes on the Tibetan Plateau using ICESat altimetry data (2003–2009). Remote Sens. Environ. 2011, 115, 1733–1742. [Google Scholar] [CrossRef]
  28. Gao, L.; Liao, J.; Shen, G. Monitoring lake-level changes in the Qinghai–Tibetan Plateau using radar altimeter data (2002–2012). J. Appl. Remote Sens. 2013, 7, 073470. [Google Scholar] [CrossRef]
  29. Kleinherenbrink, M.; Lindenbergh, R.; Ditmar, P. Monitoring of lake level changes on the Tibetan Plateau and Tian Shan by retracking Cryosat SARIn waveforms. J. Hydrol. 2015, 521, 119–131. [Google Scholar] [CrossRef]
  30. Song, C.; Ye, Q.; Cheng, X. Shifts in water-level variation of Namco in the central Tibetan Plateau from ICESat and CryoSat-2 altimetry and station observations. Sci. Bull. 2015, 60, 1287–1297. [Google Scholar] [CrossRef] [Green Version]
  31. Project, J.M.M. GHRSST Level 4 MUR Global Foundation Sea Surface Temperature Analysis. Available online: https://doi.org/10.5067/GHGDM-4FD02 (accessed on 19 December 2018).
  32. Song, C.; Ye, Q.; Sheng, Y.; Gong, T. Combined ICESat and CryoSat-2 altimetry for accessing water level dynamics of Tibetan lakes over 2003–2014. Water 2015, 7, 4685–4700. [Google Scholar] [CrossRef] [Green Version]
  33. Jiang, L.; Nielsen, K.; Andersen, O.B.; Bauer-Gottwein, P. Monitoring recent lake level variations on the Tibetan Plateau using CryoSat-2 SARIn mode data. J. Hydrol. 2017, 544, 109–124. [Google Scholar] [CrossRef] [Green Version]
  34. Lei, Y.; Zhu, Y.; Wang, B.; Yao, T.; Yang, K.; Zhang, X.; Zhai, J.; Ma, N. Extreme Lake Level Changes on the Tibetan Plateau Associated With the 2015/2016 El Niño. Geophys. Res. Lett. 2019, 46, 5889–5898. [Google Scholar] [CrossRef]
  35. Hwang, C.; Cheng, Y.-S.; Yang, W.-H.; Zhang, G.; Huang, Y.-R.; Shen, W.-B.; Pan, Y. Lake level changes in the Tibetan Plateau from Cryosat-2, SARAL, ICESat, and Jason-2 altimeters. Terr. Atmos. Ocean. Sci. 2019, 30, 1–18. [Google Scholar] [CrossRef] [Green Version]
  36. Kao, H.-C.; Kuo, C.-Y.; Tseng, K.-H.; Shum, C.K.; Tseng, T.-P.; Jia, Y.-Y.; Yang, T.-Y.; Ali, T.A.; Yi, Y.; Hussain, D. Assessment of Cryosat-2 and SARAL/AltiKa altimetry for measuring inland water and coastal sea level variations: A case study on Tibetan Plateau lake and Taiwan Coast. Mar. Geod. 2019, 42, 327–343. [Google Scholar] [CrossRef]
  37. Zhang, G.; Chen, W.; Xie, H. Tibetan Plateau’s lake level and volume changes from NASA’s ICESat/ICESat-2 and Landsat Missions. Geophys. Res. Lett. 2019, 46, 13107–13118. [Google Scholar] [CrossRef]
  38. Piao, S.; Cui, M.; Chen, A.; Wang, X.; Ciais, P.; Liu, J.; Tang, Y. Altitude and temperature dependence of change in the spring vegetation green-up date from 1982 to 2006 in the Qinghai-Xizang Plateau. Agric. For. Meteorol. 2011, 151, 1599–1608. [Google Scholar] [CrossRef]
  39. Xu, Z.; Gong, T.; Li, J. Decadal trend of climate in the Tibetan Plateau—Regional temperature and precipitation. Hydrol. Process. Int. J. 2008, 22, 3056–3065. [Google Scholar] [CrossRef]
  40. Ma, R.; Duan, H.; Hu, C.; Feng, X.; Li, A.; Ju, W.; Jiang, J.; Yang, G. A half-century of changes in China’s lakes: Global warming or human influence? Geophys. Res. Lett. 2010, 37. [Google Scholar] [CrossRef]
  41. Crétaux, J.-F.; Calmant, S.; Romanovski, V.; Shabunin, A.; Lyard, F.; Bergé-Nguyen, M.; Cazenave, A.; Hernandez, F.; Perosanz, F. An absolute calibration site for radar altimeters in the continental domain: Lake Issykkul in Central Asia. J. Geod. 2009, 83, 723–735. [Google Scholar] [CrossRef]
  42. Crétaux, J.-F.; Jelinski, W.; Calmant, S.; Kouraev, A.; Vuglinski, V.; Bergé-Nguyen, M.; Gennero, M.-C.; Nino, F.; Del Rio, R.A.; Cazenave, A. SOLS: A lake database to monitor in the Near Real Time water level and storage variations from remote sensing data. Adv. Space Res. 2011, 47, 1497–1507. [Google Scholar] [CrossRef]
  43. Schwatke, C.; Dettmering, D.; Bosch, W.; Seitz, F. DAHITI–an innovative approach for estimating water level time series over inland waters using multi-mission satellite altimetry. Hydrol. Earth Syst. Sci. 2015, 19, 4345–4364. [Google Scholar] [CrossRef] [Green Version]
  44. Donlon, C.; Berruti, B.; Buongiorno, A.; Ferreira, M.-H.; Féménias, P.; Frerick, J.; Goryl, P.; Klein, U.; Laur, H.; Mavrocordatos, C. The global monitoring for environment and security (GMES) sentinel-3 mission. Remote Sens. Environ. 2012, 120, 37–57. [Google Scholar] [CrossRef]
  45. Dee, D.P.; Uppala, S.M.; Simmons, A.; Berrisford, P.; Poli, P.; Kobayashi, S.; Andrae, U.; Balmaseda, M.; Balsamo, G.; Bauer, D.P. The ERA-Interim reanalysis: Configuration and performance of the data assimilation system. Q. J. R. Meteorol. Soc. 2011, 137, 553–597. [Google Scholar] [CrossRef]
  46. Hwang, C.; Cheng, Y.-S.; Han, J.; Kao, R.; Huang, C.-Y.; Wei, S.-H.; Wang, H. Multi-Decadal Monitoring of Lake Level Changes in the Qinghai-Tibet Plateau by the TOPEX/Poseidon-Family Altimeters: Climate Implication. Remote Sens. Basel 2016, 8, 446. [Google Scholar] [CrossRef] [Green Version]
  47. Crétaux, J.-F.; Calmant, S.; Romanovski, V.; Perosanz, F.; Tashbaeva, S.; Bonnefond, P.; Moreira, D.; Shum, C.; Nino, F.; Bergé-Nguyen, M. Absolute calibration of Jason radar altimeters from GPS kinematic campaigns over Lake Issykkul. Mar. Geod. 2011, 34, 291–318. [Google Scholar] [CrossRef]
  48. Jarihani, A.A.; Callow, J.N.; Johansen, K.; Gouweleeuw, B. Evaluation of multiple satellite altimetry data for studying inland water bodies and river floods. J. Hydrol. 2013, 505, 78–90. [Google Scholar] [CrossRef]
  49. Zhang, G.; Yao, T.; Xie, H.; Zhang, K.; Zhu, F. Lakes’ state and abundance across the Tibetan Plateau. Chin. Sci. Bull. 2014, 59, 3010–3021. [Google Scholar] [CrossRef]
  50. Yao, F.; Wang, J.; Yang, K.; Wang, C.; Walter, B.A.; Crétaux, J.-F. Lake storage variation on the endorheic Tibetan Plateau and its attribution to climate change since the new millennium. Environ. Res. Lett. 2018, 13. [Google Scholar] [CrossRef]
  51. Yang, K.; Ye, B.; Zhou, D.; Wu, B.; Foken, T.; Qin, J.; Zhou, Z. Response of hydrological cycle to recent climate changes in the Tibetan Plateau. Clim. Chang. 2011, 109, 517–534. [Google Scholar] [CrossRef]
  52. Yang, K.; Wu, H.; Qin, J.; Lin, C.; Tang, W.; Chen, Y. Recent climate changes over the Tibetan Plateau and their impacts on energy and water cycle: A review. Glob. Planet. Chang. 2014, 112, 79–91. [Google Scholar] [CrossRef]
  53. Song, C.; Sheng, Y. Contrasting evolution patterns between glacier-fed and non-glacier-fed lakes in the Tanggula Mountains and climate cause analysis. Clim. Chang. 2015, 135, 493–507. [Google Scholar] [CrossRef]
  54. Zhang, G.; Yao, T.; Xie, H.; Yang, K.; Zhu, L.; Shum, C.K.; Bolch, T.; Yi, S.; Allen, S.; Jiang, L.; et al. Response of Tibetan Plateau lakes to climate change: Trends, patterns, and mechanisms. Earth Sci. Rev. 2020, 208. [Google Scholar] [CrossRef]
  55. Chen, B.; Xu, X.-D.; Yang, S.; Zhang, W. On the origin and destination of atmospheric moisture and air mass over the Tibetan Plateau. Theor. Applied Climatol. 2012, 110, 423–435. [Google Scholar] [CrossRef]
  56. Zheng, G.; Bao, A.; Li, J.; Zhang, G.; Xie, H.; Guo, H.; Jiang, L.; Chen, T.; Chang, C.; Chen, W. Sustained growth of high mountain lakes in the headwaters of the Syr Darya River, Central Asia. Glob. Planet. Chang. 2019, 176, 84–99. [Google Scholar] [CrossRef] [Green Version]
  57. Sun, J.; Yang, K.; Guo, W.; Wang, Y.; He, J.; Lu, H. Why has the Inner Tibetan Plateau become wetter since the mid-1990s? J. Clim. 2020, 33, 8507–8522. [Google Scholar] [CrossRef]
Figure 1. Locations and satellite altimetry overpass of the selected lakes over the Tibetan Plateau (TP) and nearby meteorological stations.
Remotesensing 12 02986 g001
Figure 2. Flowchart of the combining multisource altimetry data.
Remotesensing 12 02986 g002
Figure 3. Correlation between in-situ water level observations and satellite altimetry observations (from Hydroweb and DAHITI) for Qinghai Lake.
Remotesensing 12 02986 g003
Figure 4. Long-term lake level variations of eight large lakes in the TP during 1995–2018 based on the Hydroweb and DAHITI altimetry data archives.
Remotesensing 12 02986 g004
Figure 5. Comparison of lake level changes based on the Hydroweb/DAHITI and SARAL/Sentinel-3 altimetry data (relative levels changes refer to lake levels relative to the beginning of the time series).
Remotesensing 12 02986 g005
Figure 6. Lake level changes during the period 2013–2018 based on SARAL and Sentinel-3 altimetry data.
Remotesensing 12 02986 g006
Figure 7. Spatial distribution of lake level changing rates in the Tibetan Plateau during 2016–2018 (red rectangles show the boundaries of different TP regions). NWTP: Northwestern TP, NTP: Northern TP, NETP: Northeastern TP, and CTP: Central TP.
Remotesensing 12 02986 g007
Figure 8. Observed lake level changes and precipitation variations for typical lakes between 2013 and 2018. The right Y-axis “lake increase” refers to level changes relative to the previous year (shown as red dots in the plot). The highest water level during the year is used as the annual lake level. Blue bars represent monthly precipitation at the Gaize and Tuotuohe meteorological stations, and the total annual precipitation was calculated. The light blue stripes indicate the corresponding changes in precipitation and lake levels.
Remotesensing 12 02986 g008
Figure 9. Anomaly distributions of the water vapor and its flux over the TP and its surrounding regions in 2014 (A), 2015 (B), 2016 (C), 2017 (D), and 2018 (E) and composite analysis of the water vapor relative to the years with rapid increases and decreases of precipitation (F).The black arrows represent the transport of water vapor by the horizontal movement of the atmosphere. The green rectangular boxes represent the location of the TP.
Remotesensing 12 02986 g009
Table 1. List of all altimeter missions used in this study, together with their main characteristics.
MissionAltimeterRevisit Cycle (Days)Along-Track SpacingFootprintOperational
Topex/PoseidonPoseidon-110~620 m2.2 km1992–2005
Jason-1Poseidon-210~294 m2.2 km2001–2013
Jason-2Poseidon-310~294 m2.2 km2008–active
Jason-3Poseidon-3B10~294 m2.2 km2016–active
ERS-2RA35~374 m1.7 km1995–2011
EnvisatRA235~374 m1.7 km2002–2010
Cryosat-2SIRAL369 (30)~173 m1.6 km2010–active
SARALAltika35~173 m8 km2013–2016
Sentinel-3SRAL27~300 m0.3 km2016–active
Table 2. Our studied lakes in the Tibetan Plateau (TP) measured by satellite altimetry.
Lake NameLatitudeLongitudeLake Area (km2)Data Source(s)Satellite(s)
Jieze Caka33.9580.89116.08SARAL/Sentinel-3SARAL; Sentinel-3
Lumajangdong Co34.0481.65389.95HydrowebEnvisat; SARAL; Sentinel-3
Heishibei Lake35.5882.77111.93SARAL/Sentinel-3SARAL; Sentinel-3
Ngangla Ringco31.5783.05493.09HydrowebEnvisat; SARAL; ERS2; Sentinel-3
Zhari Namco30.9485.57991.73HydrowebSARAL; Topex/Poseidon; Jason2; Jason 3; Sentinel-3
Tangra Yumco31.0286.55841.95HydrowebEnvisat; SARAL; ERS2; Sentinel-3
Ngangze Co31.0487.13491.67HydrowebEnvisat; SARAL; Topex/Poseidon; Jason2; Jason3; ERS2
Dagze Co31.90 87.52305.02HydrowebEnvisat; SARAL; Topex/Poseidon; Jason2; ERS2; Sentinel-3
Aqqikkol37.09 88.39537.63DAHITICryosat-2; Sentinel-3
Gyariog Co31.09 88.42474.56SARAL/Sentinel-3SARAL; Sentinel-3
Dogai Coring34.5688.99485.26HydrowebEnvisat; SARAL; Jason2; Jason3; ERS2
Seling Co31.8189.032393.53LEGOS HydrowebEnvisat; SARAL; Topex/Poseidon; Jason; ERS2; Sentinel-3
Dogaicoring QiangCo35.3289.25394.53HydrowebEnvisat; SARAL; ERS2; Sentinel-3
Ayakkum37.5489.43979.85HydrowebEnvisat; SARAL; ERS2; Sentinel-3
Lexiewudan35.7590.21270.95HydrowebEnvisat; SARAL; ERS2; Sentinel-3
Migriggyangzham Co33.3990.271066.43HydrowebSARAL; ERS2; Topex/Poseidon; Jason2; Jason3
Xijin Ulan Lake35.2190.32539.76SARAL/Sentinel-3SARAL; Sentinel-3
Ulan Ul Lake34.8490.42646.31SARAL/Sentinel-3SARAL; Sentinel-3
Nam Co30.7190.572010.60HydrowebEnvisat; SARAL; ERS2; Sentinel-3
Mingjing Lake35.06 90.58122.61SARAL/Sentinel-3SARAL; Sentinel-3
Kusai Lake35.7392.89327.79DAHITISARAL; Jason2; Jason3; Sentinel-3
Qinghai Lake36.92100.194493.52HydrowebEnvisat; SARAL; Topex/Poseidon; Jason; ERS2; Sentinel-3
Table 3. Statistics of lake level changing rates in the Tibetan Plateau from 2016 to 2018 (“Y” represents terminal lakes and “N” open lakes).
Lake NameLatitudeLongitudeElevation (m)Area (km2)Lake TypeChange Rate (m/a)
Jieze Caka33.9580.894531113.5Y0.20
Lumajangdongco34.0481.654817389.9Y0.86
Heishibei Lake35.5882.775054111.9Y1.39
Ngangla Ringco31.5783.054715493.1Y0.15
Zhari Namco30.9485.574613991.7Y1.34
Tangra Yumco31.0286.554537841.9Y0.70
Ngangze Co31.0487.134688462.2Y0.87
Dagze Co31.9087.524471305.0Y1.43
Aqqikkol37.0988.394251537.6Y0.58
Gyariog Co31.0988.424647474.6N0.40
Dogai Coring34.5688.995038485.3Y0.47
Seling Co31.8189.0345442393.5Y0.32
Dogaicoring Qiangco35.3289.254787394.5Y0.82
Ayakkum37.5489.433876979.8Y0.83
Lexiewudan35.7590.214870271.0Y0.90
Migriggyangzham Co33.3990.2749331066.4Y0.70
Xijin Ulan Lake35.2190.324772539.8Y1.52
Ulan Ul Lake34.8490.424855646.3Y0.61
Namco30.7190.574724200.6Y0.01
Mingjing Lake35.0690.584797122.6Y1.49
Kusai Lake35.7392.894475327.8Y0.17
Qinghai Lake36.92100.1931944228.3Y0.47

