Article

Understanding Ancient Landscapes in the Venetian Plain through an Integrated Geoarchaeological and Geophysical Approach

1
Department of Cultural Heritage, University of Padova, Piazza Capitaniato 7, 35139 Padova, Italy
2
Department of Geosciences, University of Padova, Via Gradenigo 6, 35129 Padova, Italy
*
Author to whom correspondence should be addressed.
Remote Sens. 2020, 12(18), 2973; https://doi.org/10.3390/rs12182973
Submission received: 29 July 2020 / Revised: 7 September 2020 / Accepted: 9 September 2020 / Published: 12 September 2020
(This article belongs to the Special Issue Remote Sensing in Applied Geophysics)

Abstract

:
This paper reports the results of the multidisciplinary study carried out in the SE area of Ceggia, in the eastern part of the Venetian Plain. The area has been characterized, since ancient times, by numerous morphological transformation, due to the presence of lagoon and marshes, and interested by repeated reclamation. Aerial and satellite images have identified many natural and anthropogenic traces. From a geophysical point of view, electrical resistivity tomography (ERT) combined with frequency-domain electromagnetic measurements (FDEM) can help to discriminate the spatial distribution of different buried structures in conductive systems. The electrical conductivity is, in fact, directly related to the soil moisture content. The multidisciplinary approach adopted in this context, with the results obtained thanks to the contribution of aerial and satellite images, historical cartography, archaeological survey, geophysical measurements, geomorphological characterization, and 14C dating, allow us to suggest a possible interpretation of the different traces highlighted in the studied area. This approach suggests a potentially useful and replicable methodology to study similar evidence, such as along the North Adriatic coast and in broad sectors of the Po Valley. The key issue, in this kind of system, lies, in fact, in the possibility to date and compare traces visible on the surface by remote sensing, establishing their interest from an archaeological and geomorphological point of view using an integration of field measurements. At the end of this research, the classification of the different anomalies found in this hydraulic variable context, thanks to the multidisciplinary approach here adopted, suggest new hypotheses for reading the complex history of this understudied area.

Graphical Abstract

1. Introduction

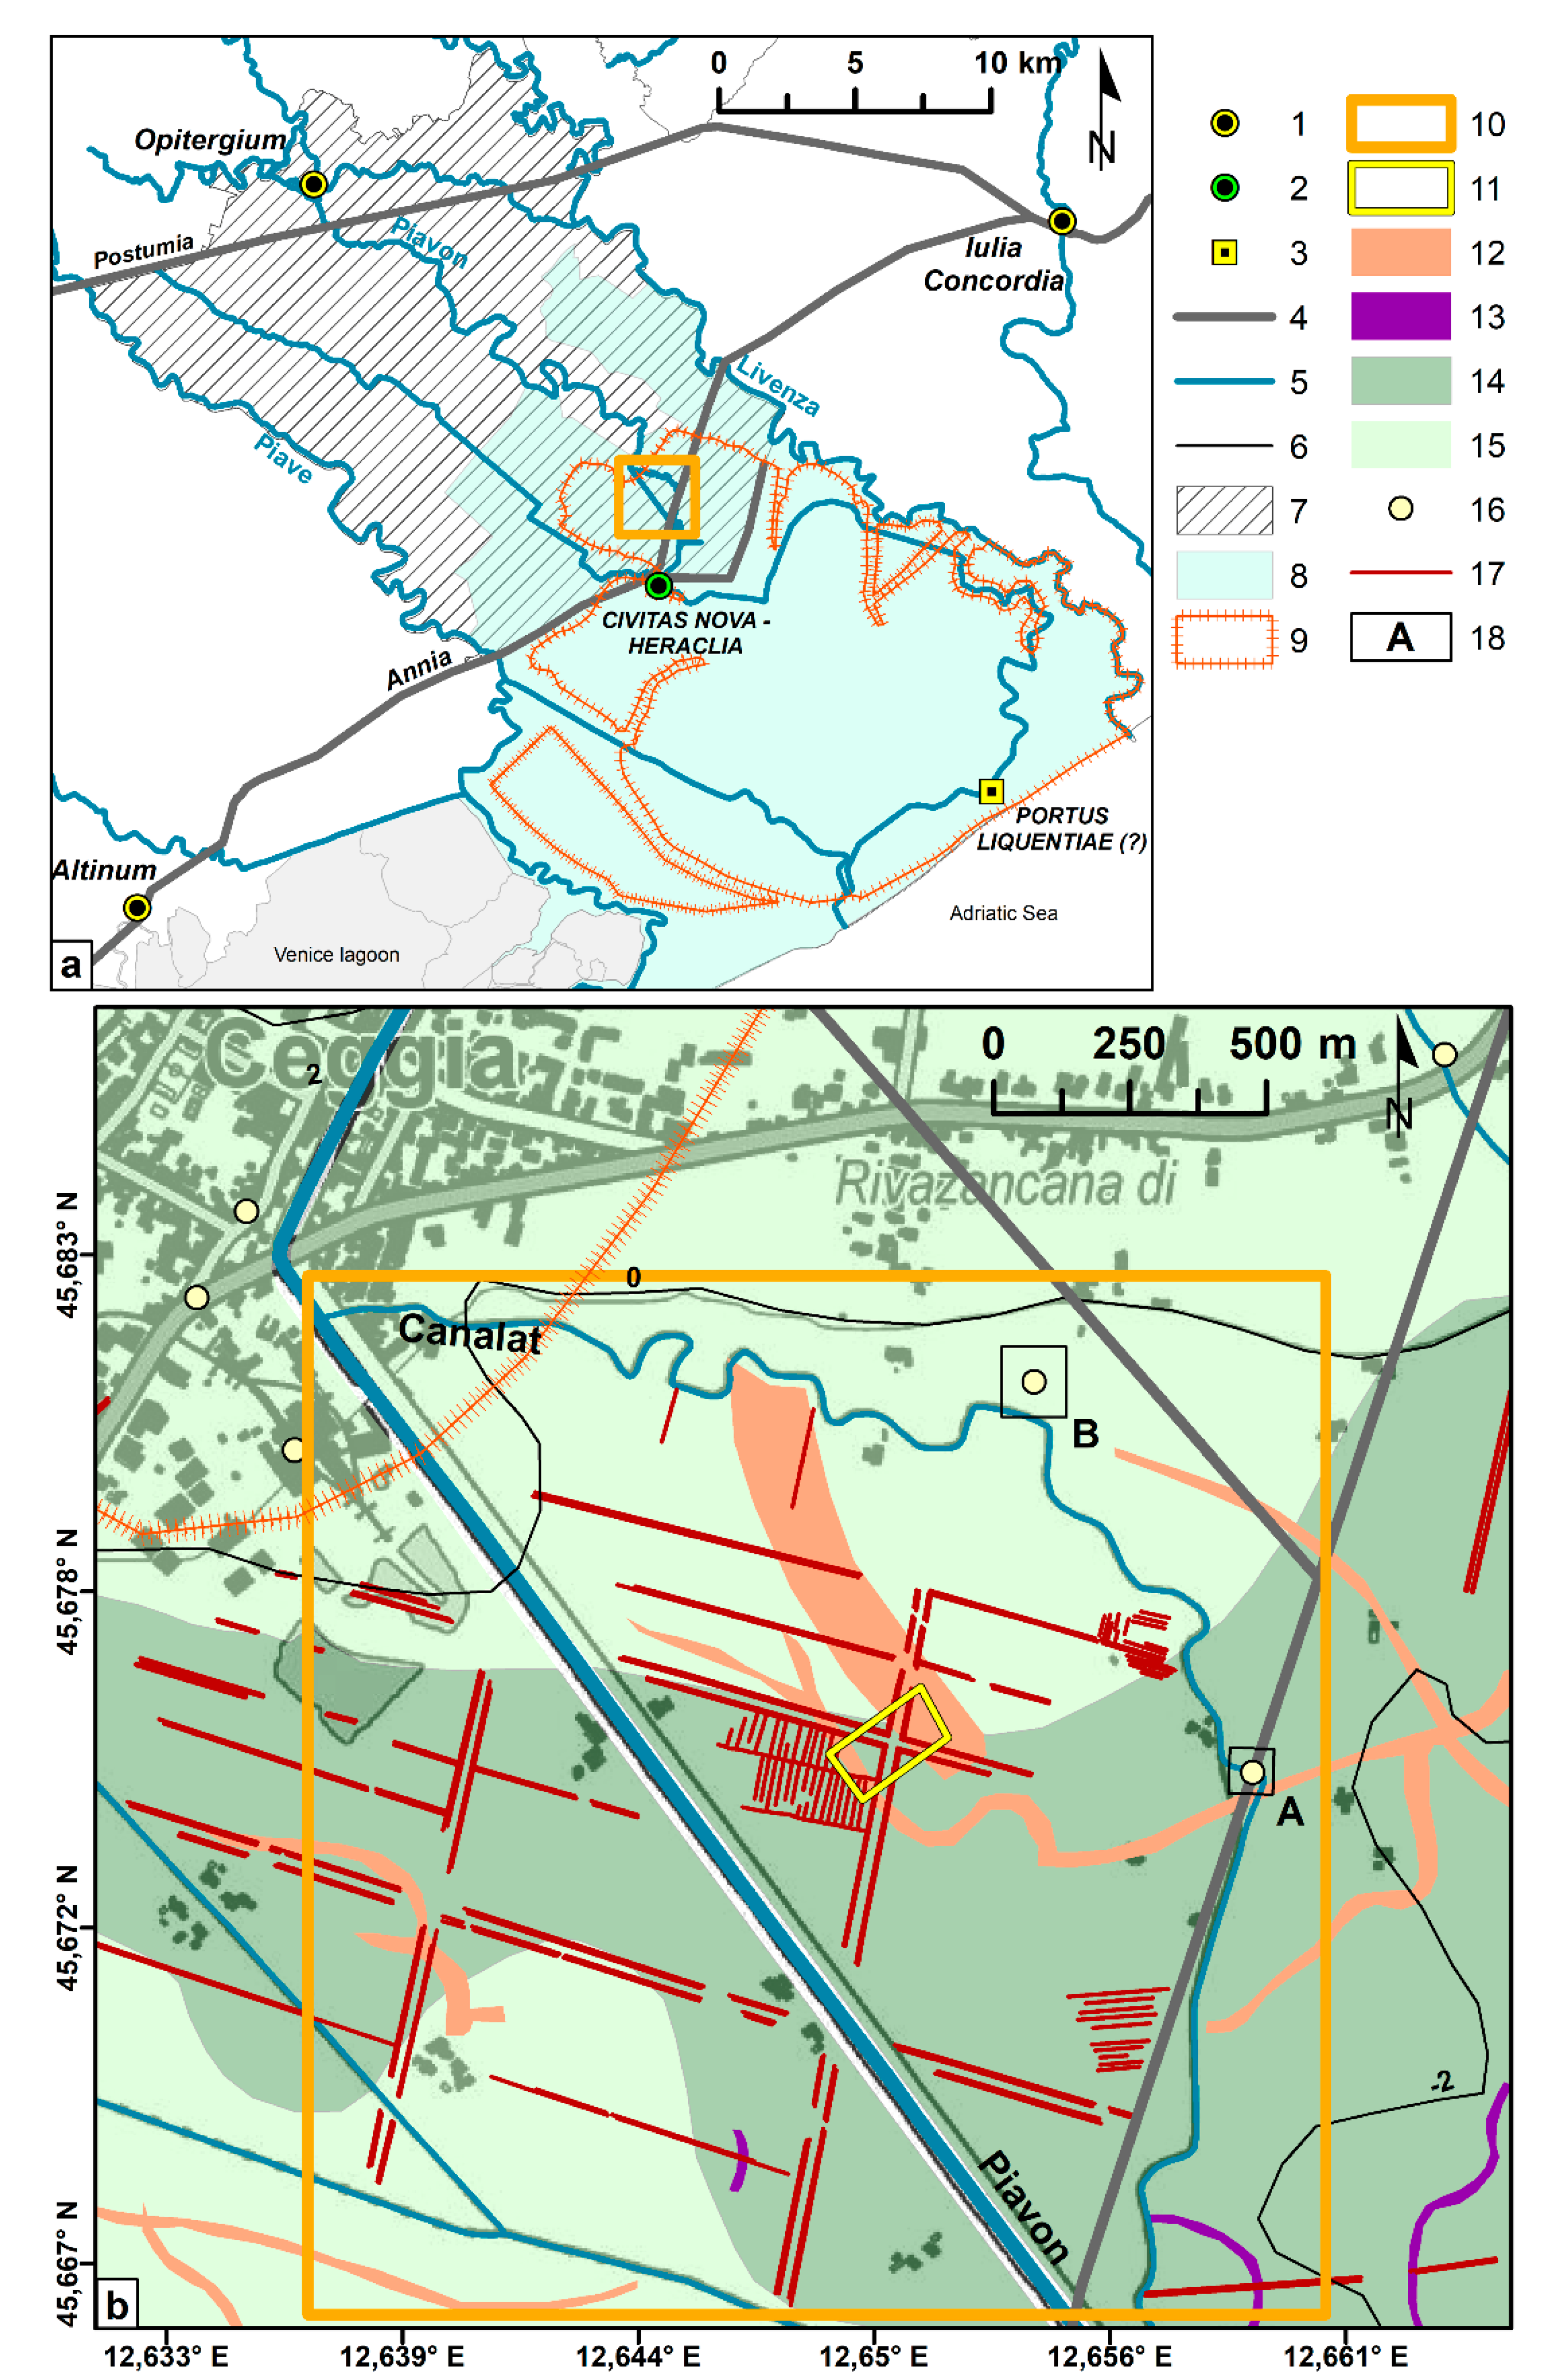
The study area (Figure 1 and Figure 2) lies in the fine-grained, low-gradient alluvial plain of the Piave River [1,2], which is part of the Piave megafan that has been forming between the Last Glacial Maximum and the Late Holocene [3]. Fluvial activity by the Piave River (a major Alpine river with a catchment in the Dolomites) and the Livenza River (a minor Prealpine river) ended here before the Roman Age [4], so in this time, the area corresponded to a stable alluvial plain. Due to relative sea-level rise in the Middle Ages, the area became part of an extensive system of coastal wetlands that was completely reclaimed only between the 19th and the 20th century. The current topographic surface, artificially drained, is 2 m below the sea level.
In Roman times, the area of Ceggia was included in the southern part of the “ager” of Opitergium (currently Oderzo), not far from the inner edge of a sizeable lagoon-marsh extended in the vast plain between the ancient river courses of the Piave and Livenza (Figure 2a). The Roman road so-called Via Annia [5,6,7] represented the principal axis of communication on the eastern coast, marking the limit among different landscapes. The Via Annia crossed the territory connecting the Roman centers of Altinum and Iulia Concordia up to Aquileia. Different archaeological findings during the times in the area (Figure 2b) testify to its Roman occupation [8,9,10]. No details about the population or the layout of these landscapes are registered. The only information available is related to the so-called stream Piavon-Canalat that flows in this sector, and probably representing from ancient times one of the routes of communication and commerce [11,12] between Opitergium, the lagoon, and the Roman harbor to the sea, the so-called Portus Liquentiae (Figure 2a).
In the early Middle Ages, Ceggia was once again a marginal reality or rather a borderland, if we consider that it must have been on the boundary between the Byzantine territories of the coast and the Longobard hinterland, as well as between the mainland and spaces dominated by marshy and lagoon waters. Different studies conducted in the area disagree about the position of this limit, in part recognized in the route of the Via Annia [13], according to others, it should be searched further north [14]. Of the latter opinion were the scholars who, basing on the photo-interpretation of some aerial images, recognized in some anomalies visible in Ceggia and in the neighboring territories the result of hydraulic-agricultural interventions to be related to the nearby settlement of Civitas Nova/Heraclia (a center developed starting from the 7th century AD in a Byzantine lagoon environment) (Figure 2a), though not excluding a possible Renaissance origin [14,15]. The question, therefore, is now open. At the current state of knowledge, it is not possible to establish which sphere of influence falls this area or define its ancient environmental configuration.
Moving from previous considerations, we started to analyze some undefined artificial and natural evidence visible in multitemporal aerial images. Similar traces are identified in the Venetian plain [1,14], and their analysis could reveal important archeological infrastructures and sites [5,6,16,17]. More in general, these systems of anthropogenic traces are generally found in alluvial and coastal plains and often related to ancient settlements [18,19]. For this study, with the specific aim of defining the nature, chronology, and function of these undefined buried structures, in particular, we integrated multi-temporal aerial photo interpretation, geophysical measurements, core sample analysis, 14C dating, analysis of historical cartography, and archaeological survey [20].
From a geophysical point of view, the specific characteristics of the current area and the open questions related to wet soils suggested the application of FDEM and ERT methods to identify both natural and anthropogenic features visible from aerial and satellite images.
Electromagnetic methods in the frequency domain, known as FDEM or electromagnetic induction methods (EMI), are widely used for soil mapping in order to obtain a quick overview of the possible heterogeneity of a given conductive system [21,22,23,24,25,26,27]. One of the main variables that characterize soils, determining both vertical and horizontal variability within them, beyond the grain size and composition, is undoubtedly the water content. The measurement of the electrical conductivity of soils is, in fact, closely related and dependent on their water content/moisture content. The variation in the composition of a given soil, on the other hand, determines the ability to retain the moisture content differently. In general, apart from clayey soils, whose electrical response of high conductivity is inherent like the material, the different grain size of the soil and the water content (saturated or unsaturated), determines the different electrical response of the investigated system [28,29,30,31,32]. In particular, soils with smaller grain size will be more conductive than those with larger ones. The possibility of detecting fast, non-direct information on these characteristics with EM methods is, therefore, at the basis of their growing popularity in contexts where these data can contribute, for example, to the optimization of cultivation practices [21,33,34].
The main advantage offered by techniques able to indirectly measure the electrical conductivity of the investigated systems, such as low-frequency EM measurements (FDEM or EMI) and electrical resistivity tomography (ERT), is inherent in the ability to establish the spatial distribution and output of bodies characterized by a different electrical conductivity (or its inverse resistivity) in an indirect way and with a different degree of detail (resolution) and at different depths. In particular, the strength of the FDEM technique lies undoubtedly in the speed of acquisition of the data of apparent conductivity of soils, made possible by the fact that direct contact with the measurement system is not necessary and therefore, the operator or the motorized vehicle carrying the instrument, connected to a GPS, can map quite quickly even large extensions giving general information on the heterogeneity of the system. The ERT method instead allows us to define in detail the exact depth and the relationship between the different buried structures in the same system. The possibility to combine these two geophysical methods through comparable measurements allow to identify targets and systems of interest. This data integration is being increasingly used in the context of geomorphological and archaeological studies. This combination, in fact, allows to identify and describe both in a timely manner with FDEM methods natural structures related to the presence of water (e.g., paleo-environment), where the ERT method helps to better detail those and to recognize the presence of anthropogenic remains, whose exact identification requires a higher resolution than that offered by EM methods [35,36,37,38,39,40,41,42,43].
The more general objective of this study is to set up and suggest a workflow reproducible in other contexts to allow the proper identification, valorization, and protection of complex archaeological landscapes similar to this here analyzed.

2. Materials and Methods

2.1. Analysis of Historical Documents and Archaeological Field Data

A review of the published and unpublished material kept at the Archive of the Soprintendenza Archeologia, Belle Arti e Paesaggio (SABAP) for the metropolitan area of Venice and the provinces of Padua, Belluno, and Treviso was firstly carried out.
On the other hand, between 2014 and 2017, new data was collected in the area [20,44] through systematic archaeological surface surveys [45,46,47].
This data was then gathered within a GIS platform, correctly structured to manage archaeological information; and the geomorphological picture, historical cartography, and aerial image traces were analyzed.

2.2. Multitemporal Analysis of Historical Aerial Photographs

Historical aerial photographs often represent a significant resource to identify the transformations that affected the landscapes during the times, changing their original or ancient asset. The visibility of interesting potential traces on the surface linked to the past by these supports is undoubtedly conditioned by many factors as, for example, the light, the vegetation, the ground humidity, the altitude of the flight, the land use, etc. [48,49].
For our purposes, we use these materials to:
-
analyze previous works to evaluate possible integration of the photo interpretations;
-
obtain metric indications;
-
gather the modifications in the organization of the territory, to acquire useful data to interpret the traces, eventually excluding a modern origin linked to the recent reclamations and hydraulic-agricultural interventions.
The first step of the survey consisted of the identification of the aerial photographs preserved in the archives of various entities present on the national territory (Military Geographic Institute-IGM; Centre for Cartography of the Veneto Region-ReVen).
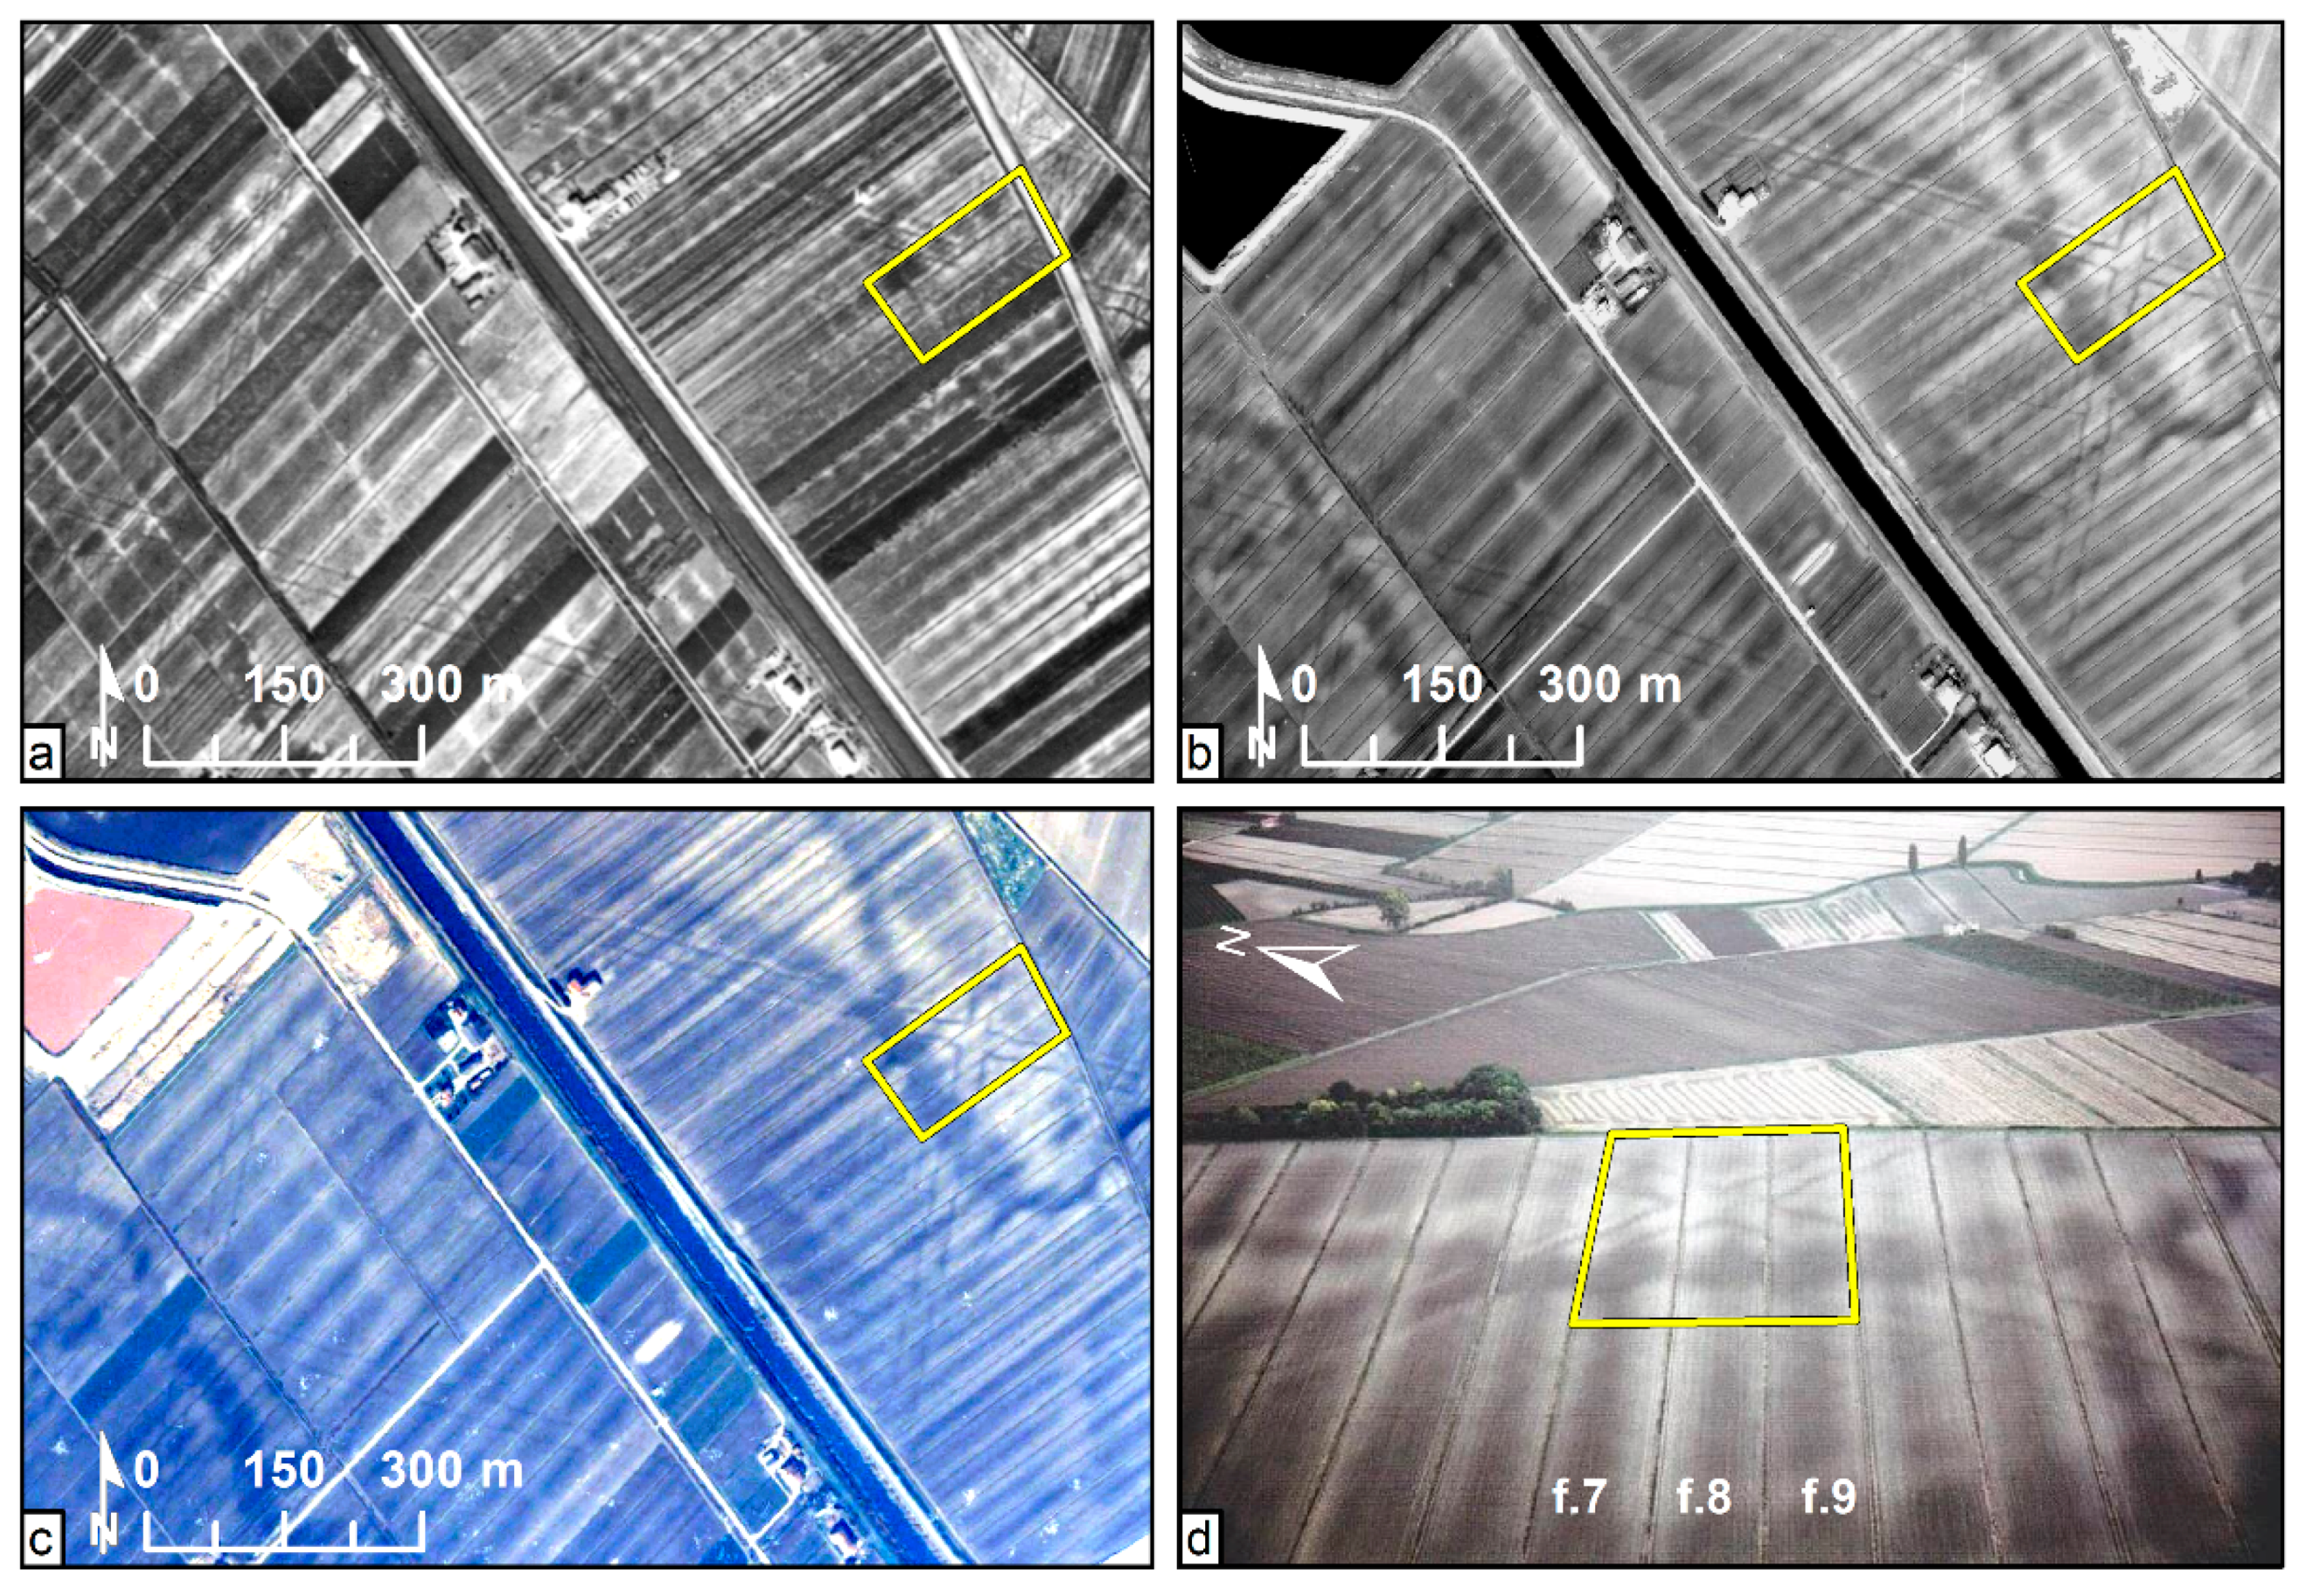
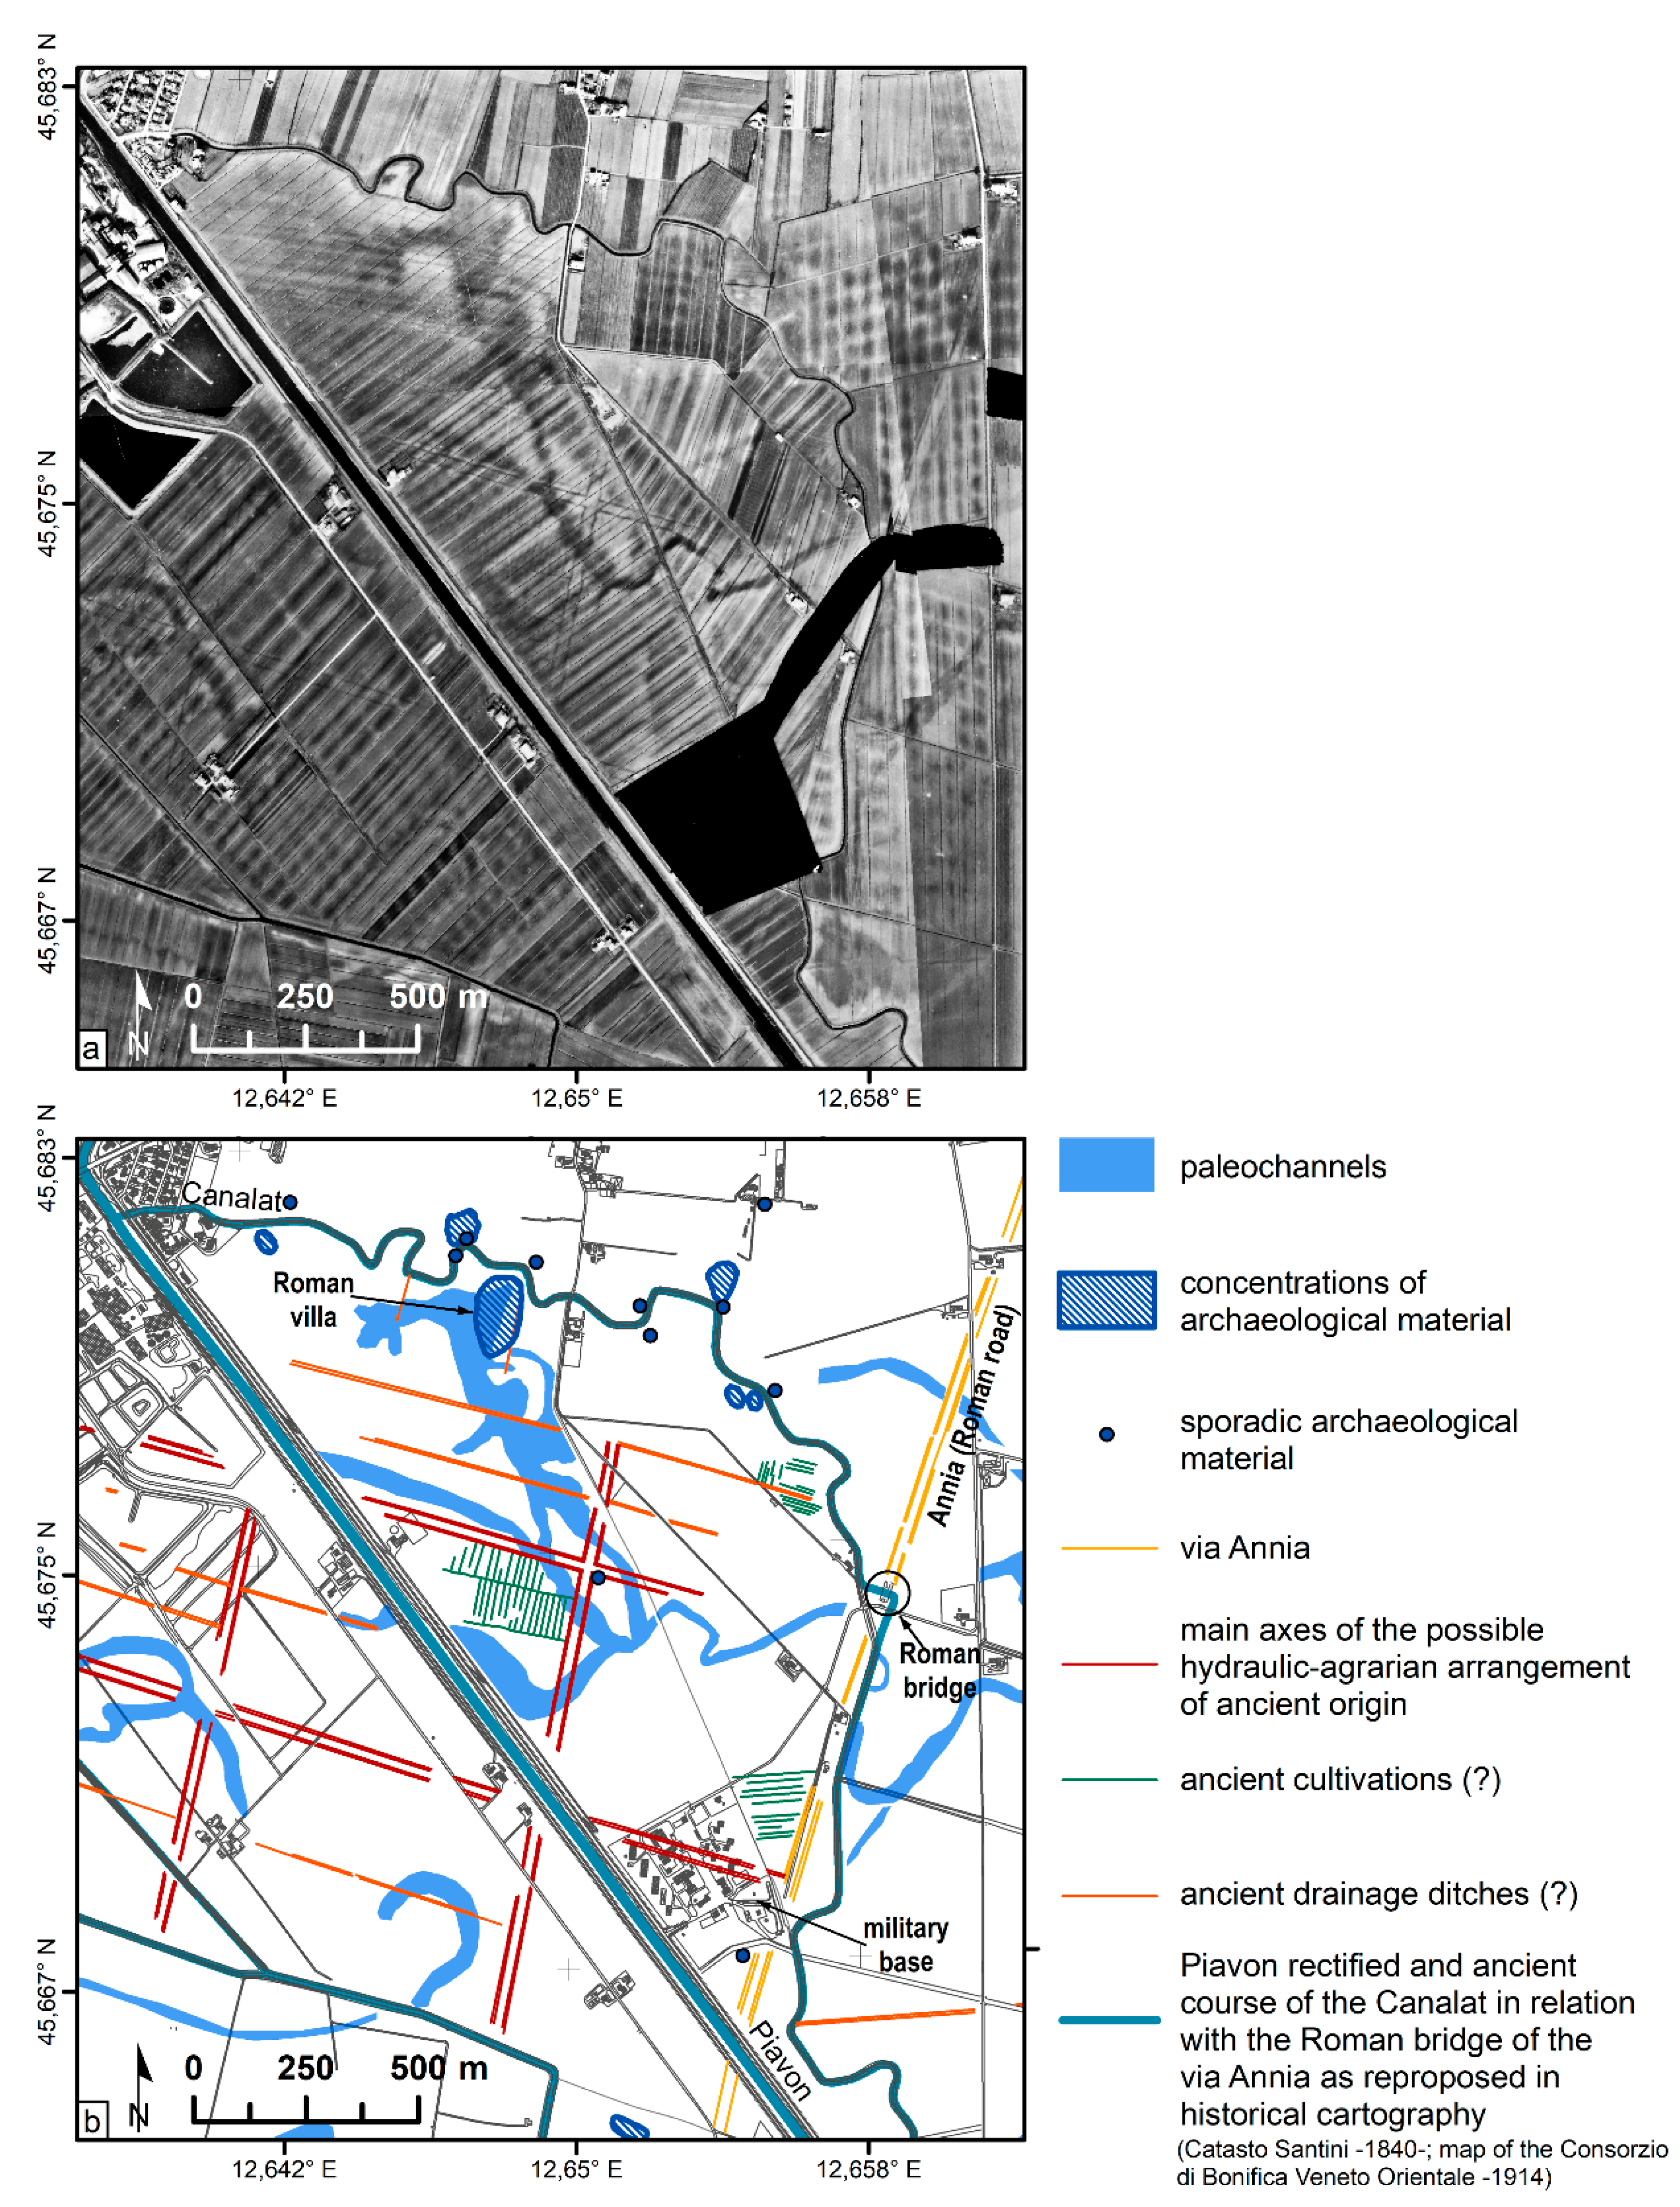
For the above reasons and purposes, the choice of the photos (Table 1) consider the number and quality of visible anomalies, and the temporal coverage, to allow a multitemporal analysis of the landscape. The most significant images, in this sense, result in the ReVen 1983, ReVen 1990, and GAI 1954 flights (Figure 3 and Figure 4a), while the ReVen 1999 flight returned fewer details while confirming the presence of the most relevant evidence. Even the oldest images of the IGM 1937 flight reveal the anomalies but cover only a portion of the study area.
When digitalized, the frames of different flights have been geo-referenced in GIS in order to proceed with the identification of the anomalies and to compare with other data, (e.g., vector and raster types) available for the study area (geomorphological, archaeological, geophysical, cartographic, etc.).
The visible traces in the different temporal images were then divided into different layers, from the most recent (ReVen 1999) to the most dated (IGM 1937).
The information about the location, the source used to identify the anomaly, type of anomaly, and, when it possible, the interpretation and chronology have been associated.

2.3. Multitemporal Analysis of Historical Cartography

Historical cartography provides information on the shapes and conditions of the areas, their nature, but also on works planned realized or not realized. In our case, these instruments help to obtain information useful to interpret the traces visible in aerial images. These materials were mainly searched at the Archives of the Consorzio di Bonifica Veneto Orientale (CBVO) and the Archivio di Stato of Venice (ASVE), considering that the area of interest insists in a reclamation zone and that, since the Republic of Venice, it has been affected by operations aimed at regulating the waters. In the first case, project drawings, cadastral maps, and plans with sporadic indications about the use of defined sectors of the study area and on specific interventions concerning the hydrographic network were found [50]. The Archives of Venice, on the other hand, provide a part of the historical cartography make from the 16th century, by specialized institutes set up within the Republic of Venice to deal with the regulation of water, but also with reclamation, irrigation, and land culture. The same archive also contains maps of the Austrian Land Registry containing the description and use of the different areas. A detailed representation of the nineteenth-century natural characteristics and anthropogenic structure of the area is provided by the map of the Second Military Survey and the Kriegskarte. Other significant detailed and geometrically correct restitution of the territory between 1890–1952 has been recovered by the cartography of the IGM, that has been mapping the entire Italian territory since the second half of the 19th century.
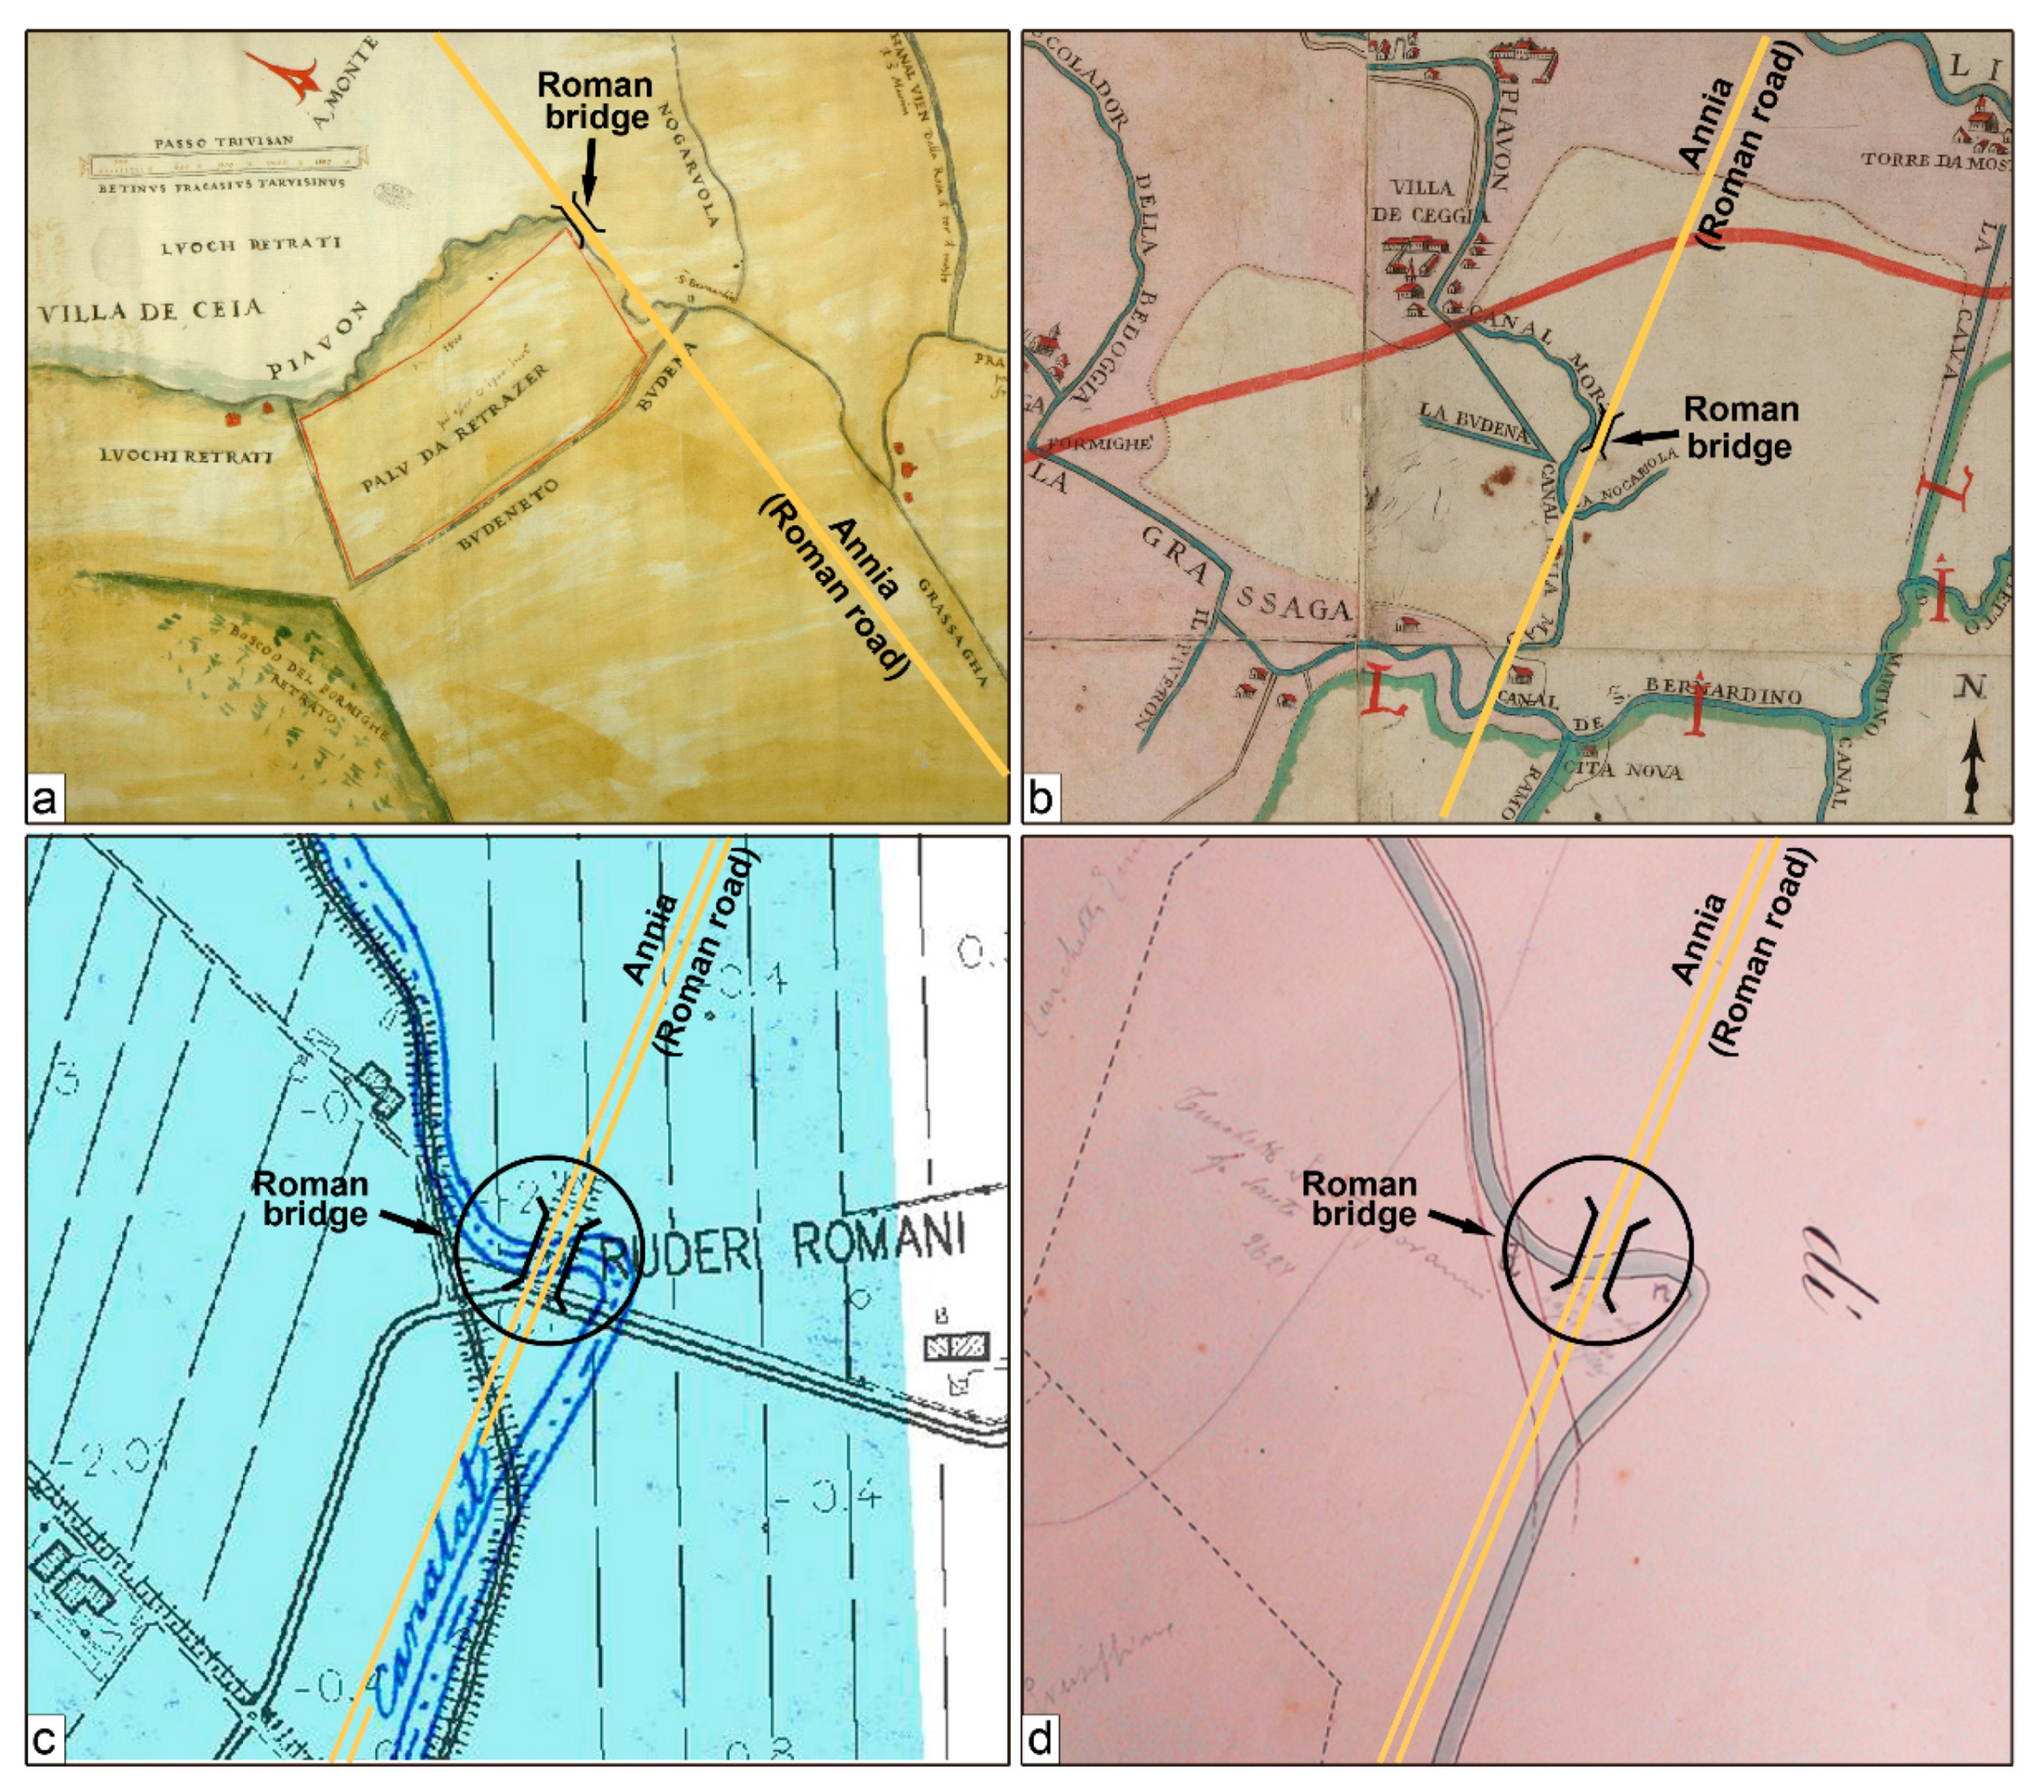
Different cartographic products (Table 2) have then been inserted and georeferenced in a GIS project for the analysis and comparison with aerial photographs (Figure 5).
We used the geographical coordinates of the IGM tablets to identify clear ground control points (GCP) useful to geo-refer the historical cartography.
At the end of this process, we produced a multi-temporal sequence of images with a window of the transformations in the area of study from the mid-16th century to the present.

2.4. Geophysical Measurements

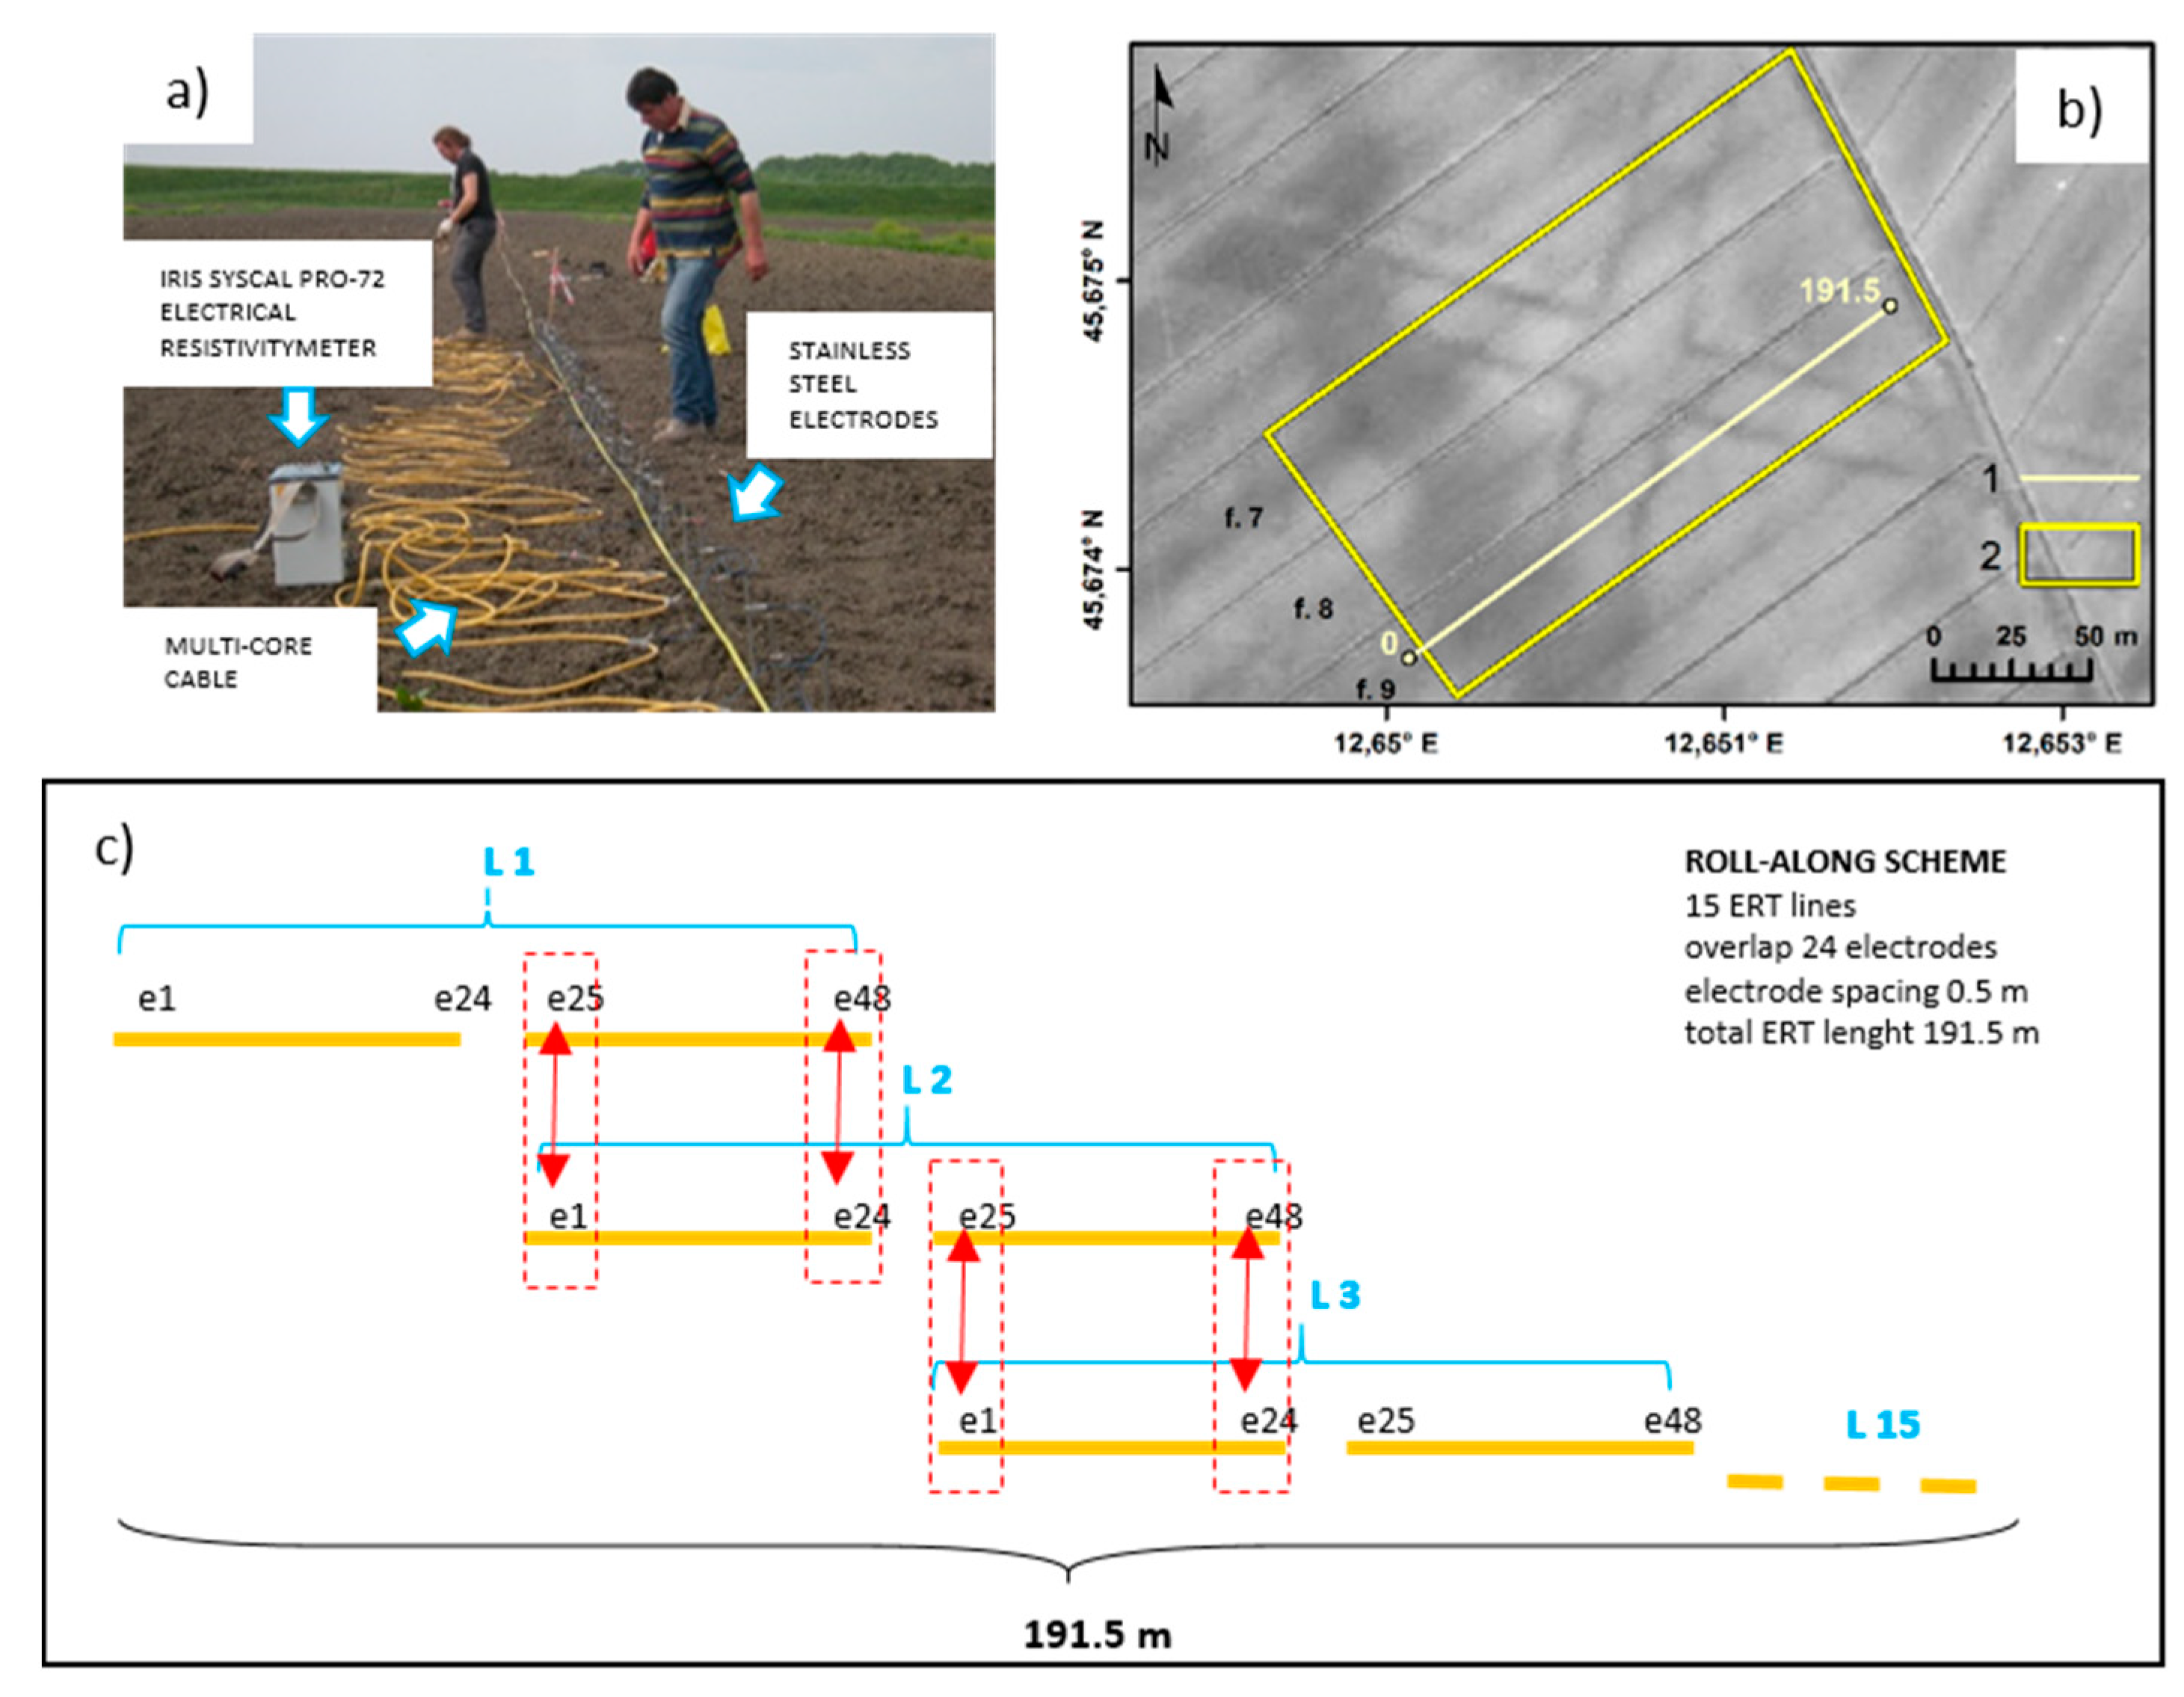
In February 2015, we planned an FDEM field campaign to easily and quickly identify the main buried structures visible in the aerial and satellite images. Starting from these pieces of evidence, we selected a representative area, with some natural and artificial features, useful to collect field geophysical data. For the acquisition of FDEM data, we used a CMD electromagnetic conductivity meter (from GF Instruments s.r.o. Brno, Czech Republic) with a CMD-1 single-depth probe, setting high depth configuration, corresponding to −1.5 m full depth range. The resolution of the used instrument is 0.1 mS/m, where the accuracy corresponds to ±4% at 50 mS/m. The CMD-1 probe was manually moved on the ground in GPS continuous acquisition mode, connecting the instrument with a Trimble 5800 GPS receiver to register the right position of the acquisition lines. The FDEM data was collected on the field f.9 (Figure 6b) every meter, in a rectangular area, along parallel lines NE-SW oriented, for a total length of about 210 m. The entire width of the investigation area in the NW-SE direction was about 100 m. Due to the presence of small drainage channels, NE-SW oriented, the survey area has been divided into three main parts with a width of about 33 m for each (Figure 6). The conductivity values, during the processing, were converted in resistivity and then together plotted using the Surfer 10 Golden Software to obtain a map of the mean distribution of this parameter in the entire investigated area.
In the middle of the same field (f.9 in Figure 6), an electrical resistivity tomography (ERT) was acquired in the SW-NE direction. The electrical resistivity tomography (ERT) was performed by means of 15 lines, using for each line 48 electrodes spaced 0.5 m apart, overlapping line by line of 24 electrodes (roll-along) over a total length of 191.5 m. Direct and reciprocal measurements for each ERT line were acquired, by swapping current with potential electrodes, to estimate the errors in the dataset [51]. A difference between different cycle results (quality factor “Q”) equal to 5% was imposed. The ERT inversion was performed using a regularized weighted least squares approach, according to the Occam’s rule [52] as proposed by LaBrecque et al. [53]. The smoothness of the resistivity distribution here obtained strictly depends on the errors in each dataset.
According to Binley et al. [54], the best evaluation of errors might be obtained thanks to direct and reciprocal measurements, where these measurements shall be equal, providing the same resistance value. The possible deviation may be interpreted as an error estimate useful for the inversion. In this case study, the errors were smaller than 5%. The visualization of the inverted ERT lines was done using Surfer 10 Golden Software.

2.5. Core Sample Analysis and Radiocarbon Dating

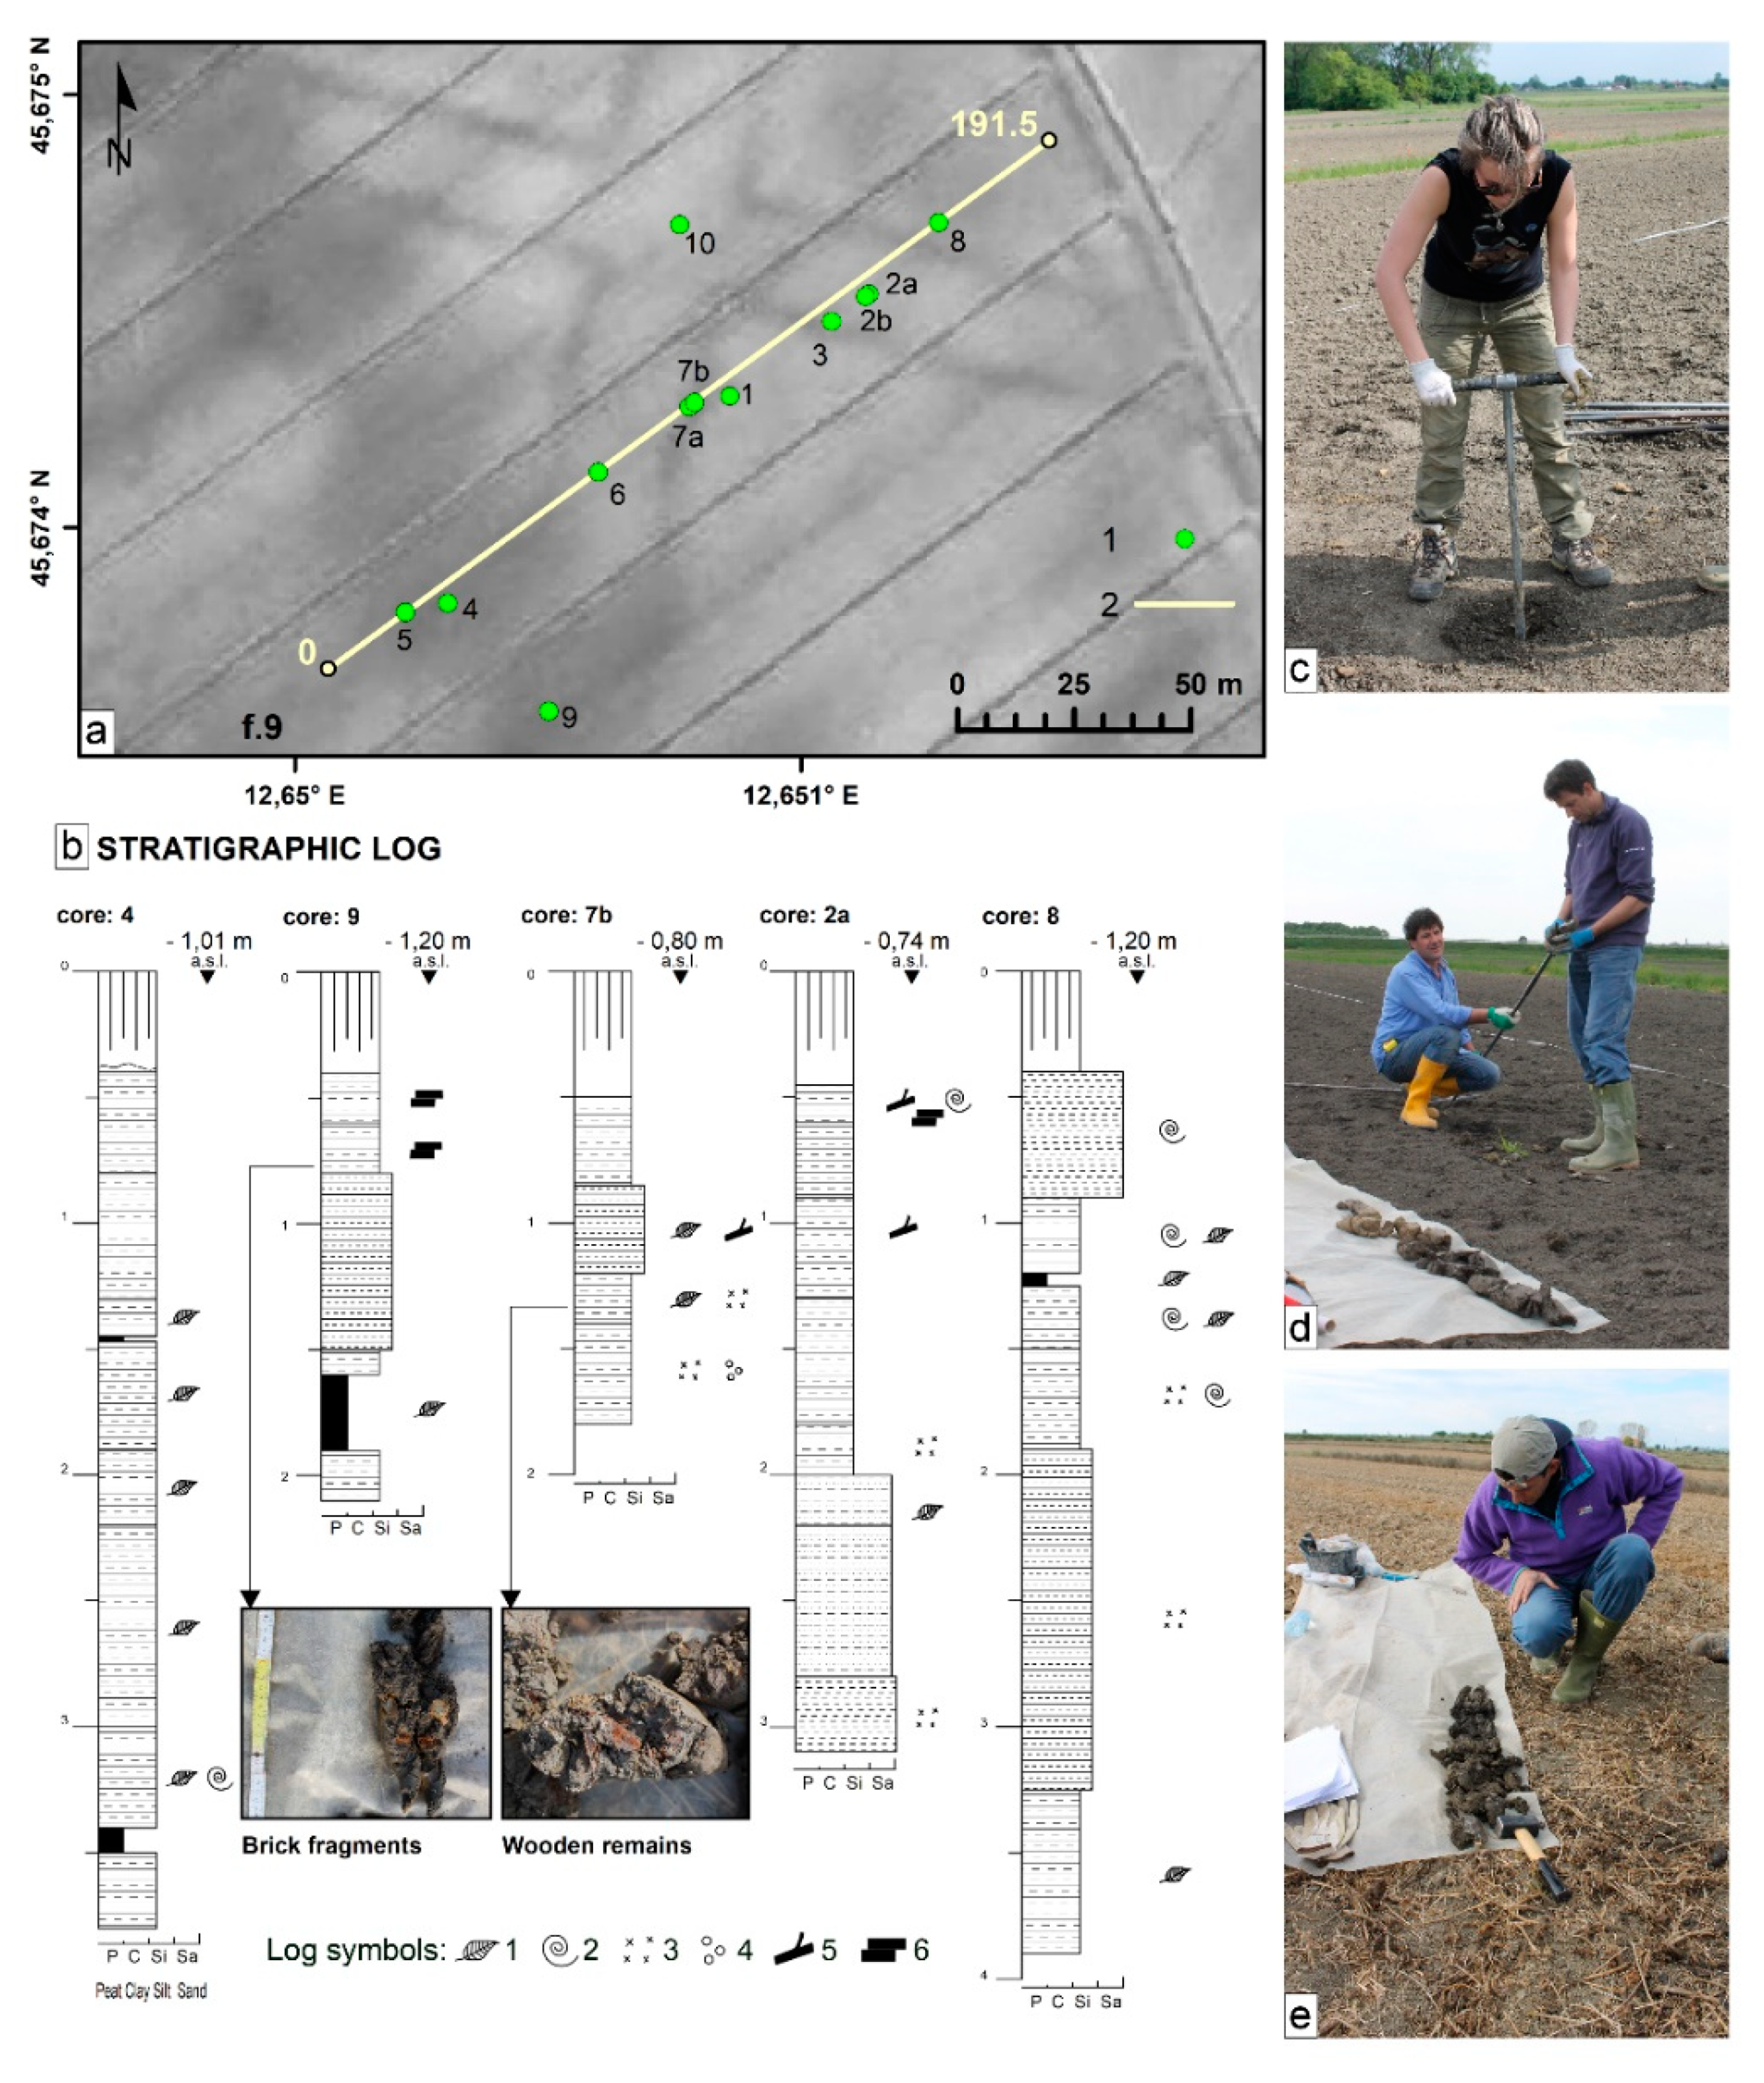
Different core samples were carried out using an Edelman combination-type hand auger. Sediment description included grain size, sedimentary structures, Munsell Charts color, presence, size and abundance of pedologenic nodules and mottles, paleontological content (shells, plant remains, wood, charcoal), archaeological content (sherds, bricks etc.). The data were compiled in stratigraphic logs and sections (Figure 7 and Figure 8). An AMS radiocarbon date was obtained from a wood fragment (Table 3) that was collected from the undisturbed inner part of core CEG 7b and stored in aluminum foil after extraction in order to avoid contamination. The radiocarbon date was calibrated using software OxCal 4.3 [55] and applying the calibration curve IntCal13 [56].

2.6. Visual Evaluation of Exposed Section

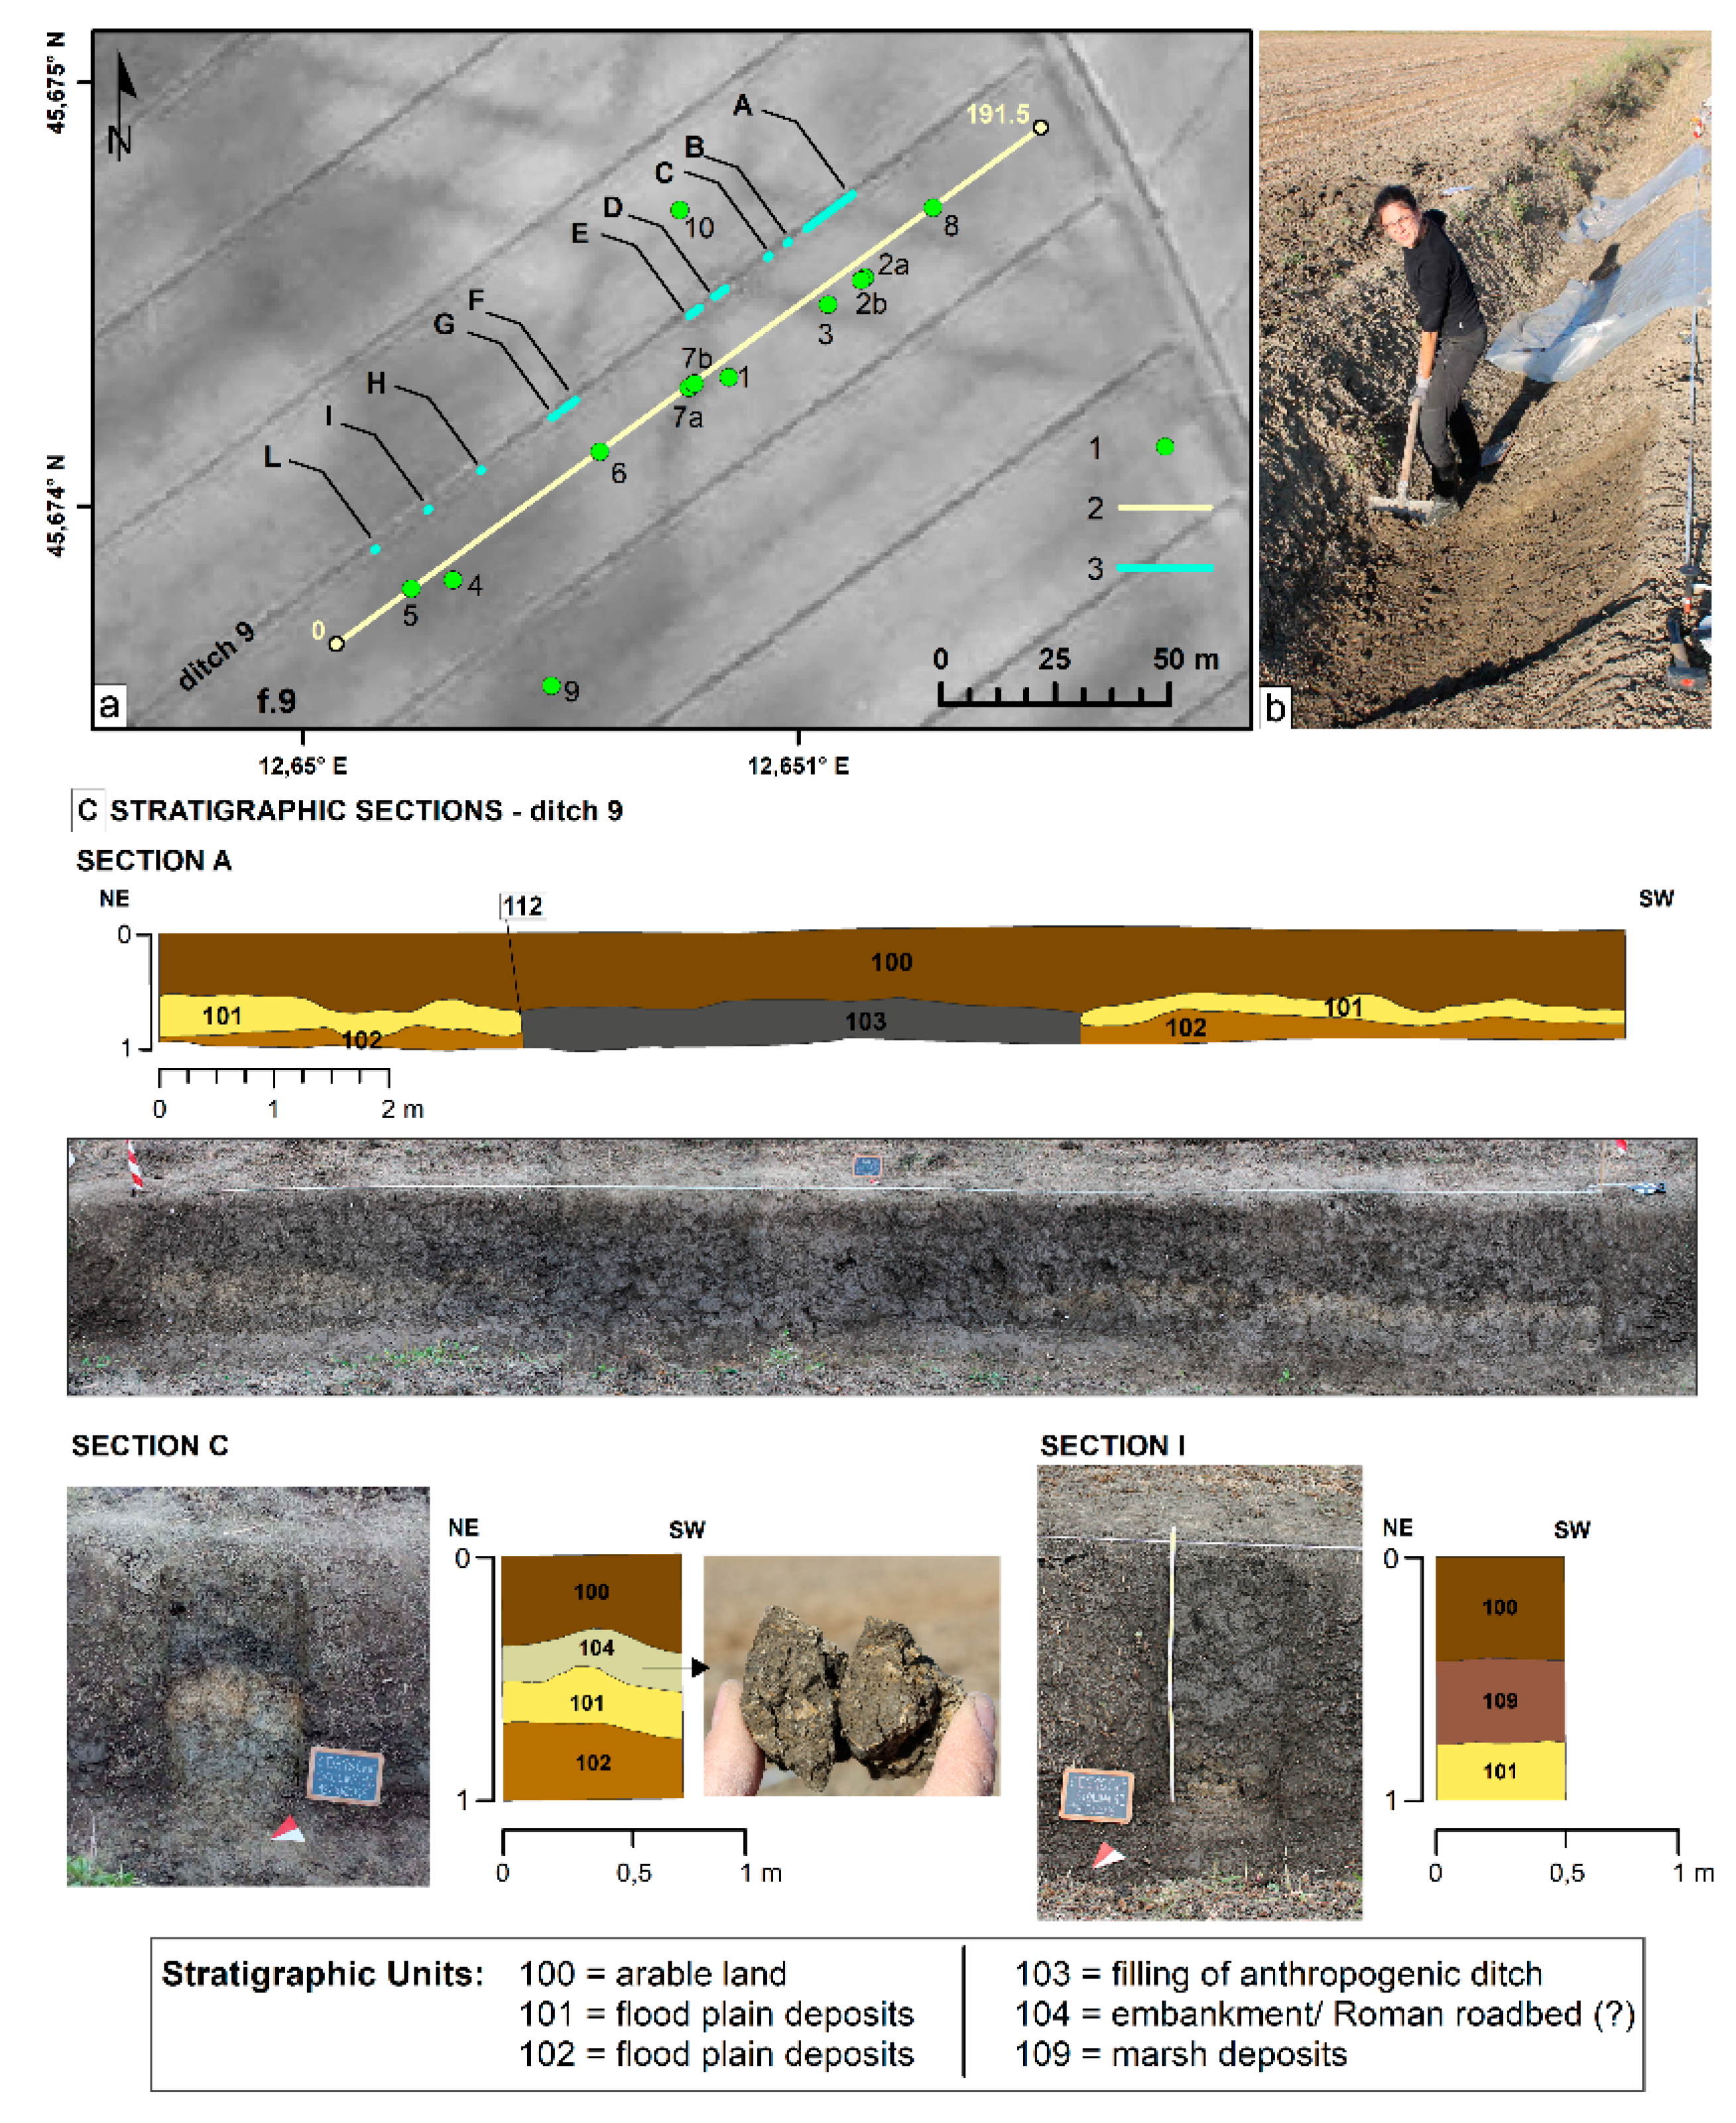
The exposed section of the southern side of the drainage channel that limits the field f.9, where geophysical prospecting and the cores drilling were realized, allowed us to analyze the correspondent section of the traces visible in the aerial photo (Figure 9a). Thanks to this activity, we documented the stratigraphic sequence [57] of the deposits and obtained detailed information about the different soil marks revealed in the aerial photos (e.g., potential road axes, drainage ditches, and paleochannel). The position of the sections of interest were identified thanks to the georeferenced images of the area stored in the GIS platform, where their coordinates were collected using a differential GPS and positioned on the field with several material references (i.e., pickets). The section is documented by photos, drawings, and stratigraphic units, interested up to 0.9 m depth from the ground level.

3. Results

The analysis of the pieces of evidence and documents currently available for the area, although not reported in any classical source, testifies to the Roman frequentation of the SE territory of Ceggia.
In addition to the well-known Via Annia (Figure 2b) and its Roman bridge (Figure 2b.A) [58] crossing a waterway active at Roman age, in the area have been discovered the remains of an apparent rural settlement, with some wall structures and a pit along the left side of the Canalat water channel (Figure 2b.B) [10], about 800 m NW to the Roman bridge. The archaeological field survey also made it possible to collect new data useful for a better knowledge of the area, never before analyzed by similar archaeological research. The survey permits the localization of the remains of the Roman road and the identification of sporadic pieces of pottery in correspondence with the linear traces visible in aerial photographs, and a significant concentration of materials of archaeological interest along the Canalat (Figure 4b). These materials are pertinent to sites from the Roman Age (1st century BC–2nd century AD), several of which were continuously used up to the Late Antiquity (IV/V AD). In some cases, it testified to the presence of Renaissance pottery (14th–16th centuries AD), while no evidence of the medieval period was registered. All the new sites identified by the survey are located near the Canalat (Figure 4b), i.e., the watercourse that crossed the study area in Roman times and that, in correspondence with the Via Annia, flowed under the Annia bridge. Among these sites, it is worth mentioning, in particular, an apparent Roman villa along the right side of the Canalat (Figure 4b), both for the valuable materials found and for its position respect to the traces visible in the aerial photos. The site is located, in fact, on the trace of the riverbed that continues towards the Roman bridge of the Via Annia, probably related to a minor axis of the system of artificial lines visible from aerial photos. The multitemporal analysis of the historical frames allowed the first discrimination between traces of hydrography and modern hydraulic infrastructures, as the result of interventions carried out in the second half of the twentieth century, and others of older origin found in all the aerial photos here analyzed (Figure 3). The comparison carried out was also very useful to better outline the picture of ancient traces because some images revealed particular features not visible in others, thus contributing to the formulation of a more detailed reconstruction than that proposed by previous studies. For example, in Figure 4, there is clear evidence that affects the eastern sector of the study area, represented by a white band edged by two dark lines that follow its course. This is Via Annia, clearly identifiable in aerial photos and on the ground, due to the dispersion on the surface of pebbles and brick fragments, as well as the presence of the remains of a bridge over a waterway. Different clear anomalies in the aerial photos document the ancient natural hydrography of the area, characteristic for their dark color, the morphology, and the meandering course further downstream. Their shape suggests the presence of a local drainage network probably linked to the channels in the marshes covering the area in the Middle Ages until the modern reclamation. Very similar traces of wetland palaeo-hydrography are reported about 10 km NE of Ceggia, beyond the Livenza river [1,4]. The central portion of the study area is crossed by one of this branched system of marshy canals, mixed with some artificial lines between the Piavon and Canalat channels, before the union in a single meander that seems to join the Canalat just upstream of the Annia Roman bridge. The artificial alignments just mentioned are also clearly recognizable in the whole area of investigation. By shape, these are not very different from a Roman road, appearing as light bands between dark lines, although organized in a system. These axes, about 28 m wide, including the lateral ditches, appear as a primary grid of a hydraulic-agrarian layout, which seems to insist on the Annia route. In the aerial photos GAI 1954 (Table 1), it is visible that one of the WNW-ESE axes extends up to the route connecting to a military base. Among the main axes of this system, some aerial photos show the presence of dark lines, probably related to minor ditches, and other very close lines that would suggest the existence of ancient cultivations. Furthermore, the bearing axes of the system are not entirely orthogonal to each other and delimit non-regular portions of land (e.g., the long side measures approximately 730 m, the short side 500 m). The contribution provided by the historical maps appeared fundamental to define the nature of the area, the modification over the centuries, and to limit the possible time range of the interesting anomalies visible in the aerial photos. The multi-temporal analysis of the cartography revealed, in fact, that the area was affected by reclamation from at least the middle of the 16th century until the end of the 19th century when an important reclamation and hydraulic-agricultural reorganization interventions profoundly transformed its asset. However, no relation appears between these recent interventions and the alignments visible in the aerial photos, placing the realization of the second ones before the presence of the marshes in the area. This evidence made by the multi-temporal analysis of the aerial photos highlights an ancient organization of the area, probably due to its hydraulic instability. The historical representations of the territory between the mid-16th and 18th centuries have also provided information on the drainage system in the area and on the interventions implemented to improve it, as well as a valuable indirect reference for the interpretation of the aerial photos. For example, the maps of the 17th and 18th centuries testify that the excavation of the straight section of Piavon is related to the burial of the same old river (today’s Canalat), historically the so-called “Piavon a monito” or “Canal Morto” (Figure 5b). The comparison of these maps with a drawing of the area in 1568 (Figure 5a) dated this intervention between the end of the 16th and the beginning of the 17th century, probably during a reclamation. For our study, this information is extremely interesting because the system visible in the aerial images is crossed by the straight section of the Piavon, which suggests that it already existed at the time of the excavation of the canal (late 16th–early 17th century), also defining a timeline for the asset of the area as well as are visible in the aerial photos. The same multitemporal analysis suggests that the watercourse in the area in Roman times probably was the Canalat, a link to the Annia bridge at least until the beginning of the 20th century, when the interventions slightly modified its original course (Figure 5c,d).
The resistivity map obtained from the FDEM measurements made using the CMD 1 probe (Figure 10b), referring to the ground condition recorded between the surface and the maximum depth of 1.5 m, returns a pattern perfectly consistent with the anomalies visible from aerial photo. In particular, the chromatic scale that associates blue to the most conductive areas allows immediate visualization of the two paleochannels that intercept the road and the drainage ditches in the latter. Note a greater resistivity (Figure 10b) in the central part of the map corresponding to field f.10, probably linked to the greater drainage of this field compared to the two lateral ones. The result of the electrical resistivity tomography performed at the center of field f.9 (Figure 10a,c), better defines the nature and relationship between the various anomalies. It should be noted that the ERT measurement allows us to analyze the real extension of the two paleochannels, and in particular, as witnesses that the paleochannel to the east is more extended in-depth than what can be assumed by the trace visible on the surface. Another interesting fact is the extension in depth of the most resistive area of the section on which the two arms of the road axis visible from the aerial photo are set and perfectly detected even with FDEM measurements. These data testify that the road was probably crossing an area with greater resistivity than the two nearby paleochannels, perhaps indicating not only coarser materials, but also a morphologically higher area.
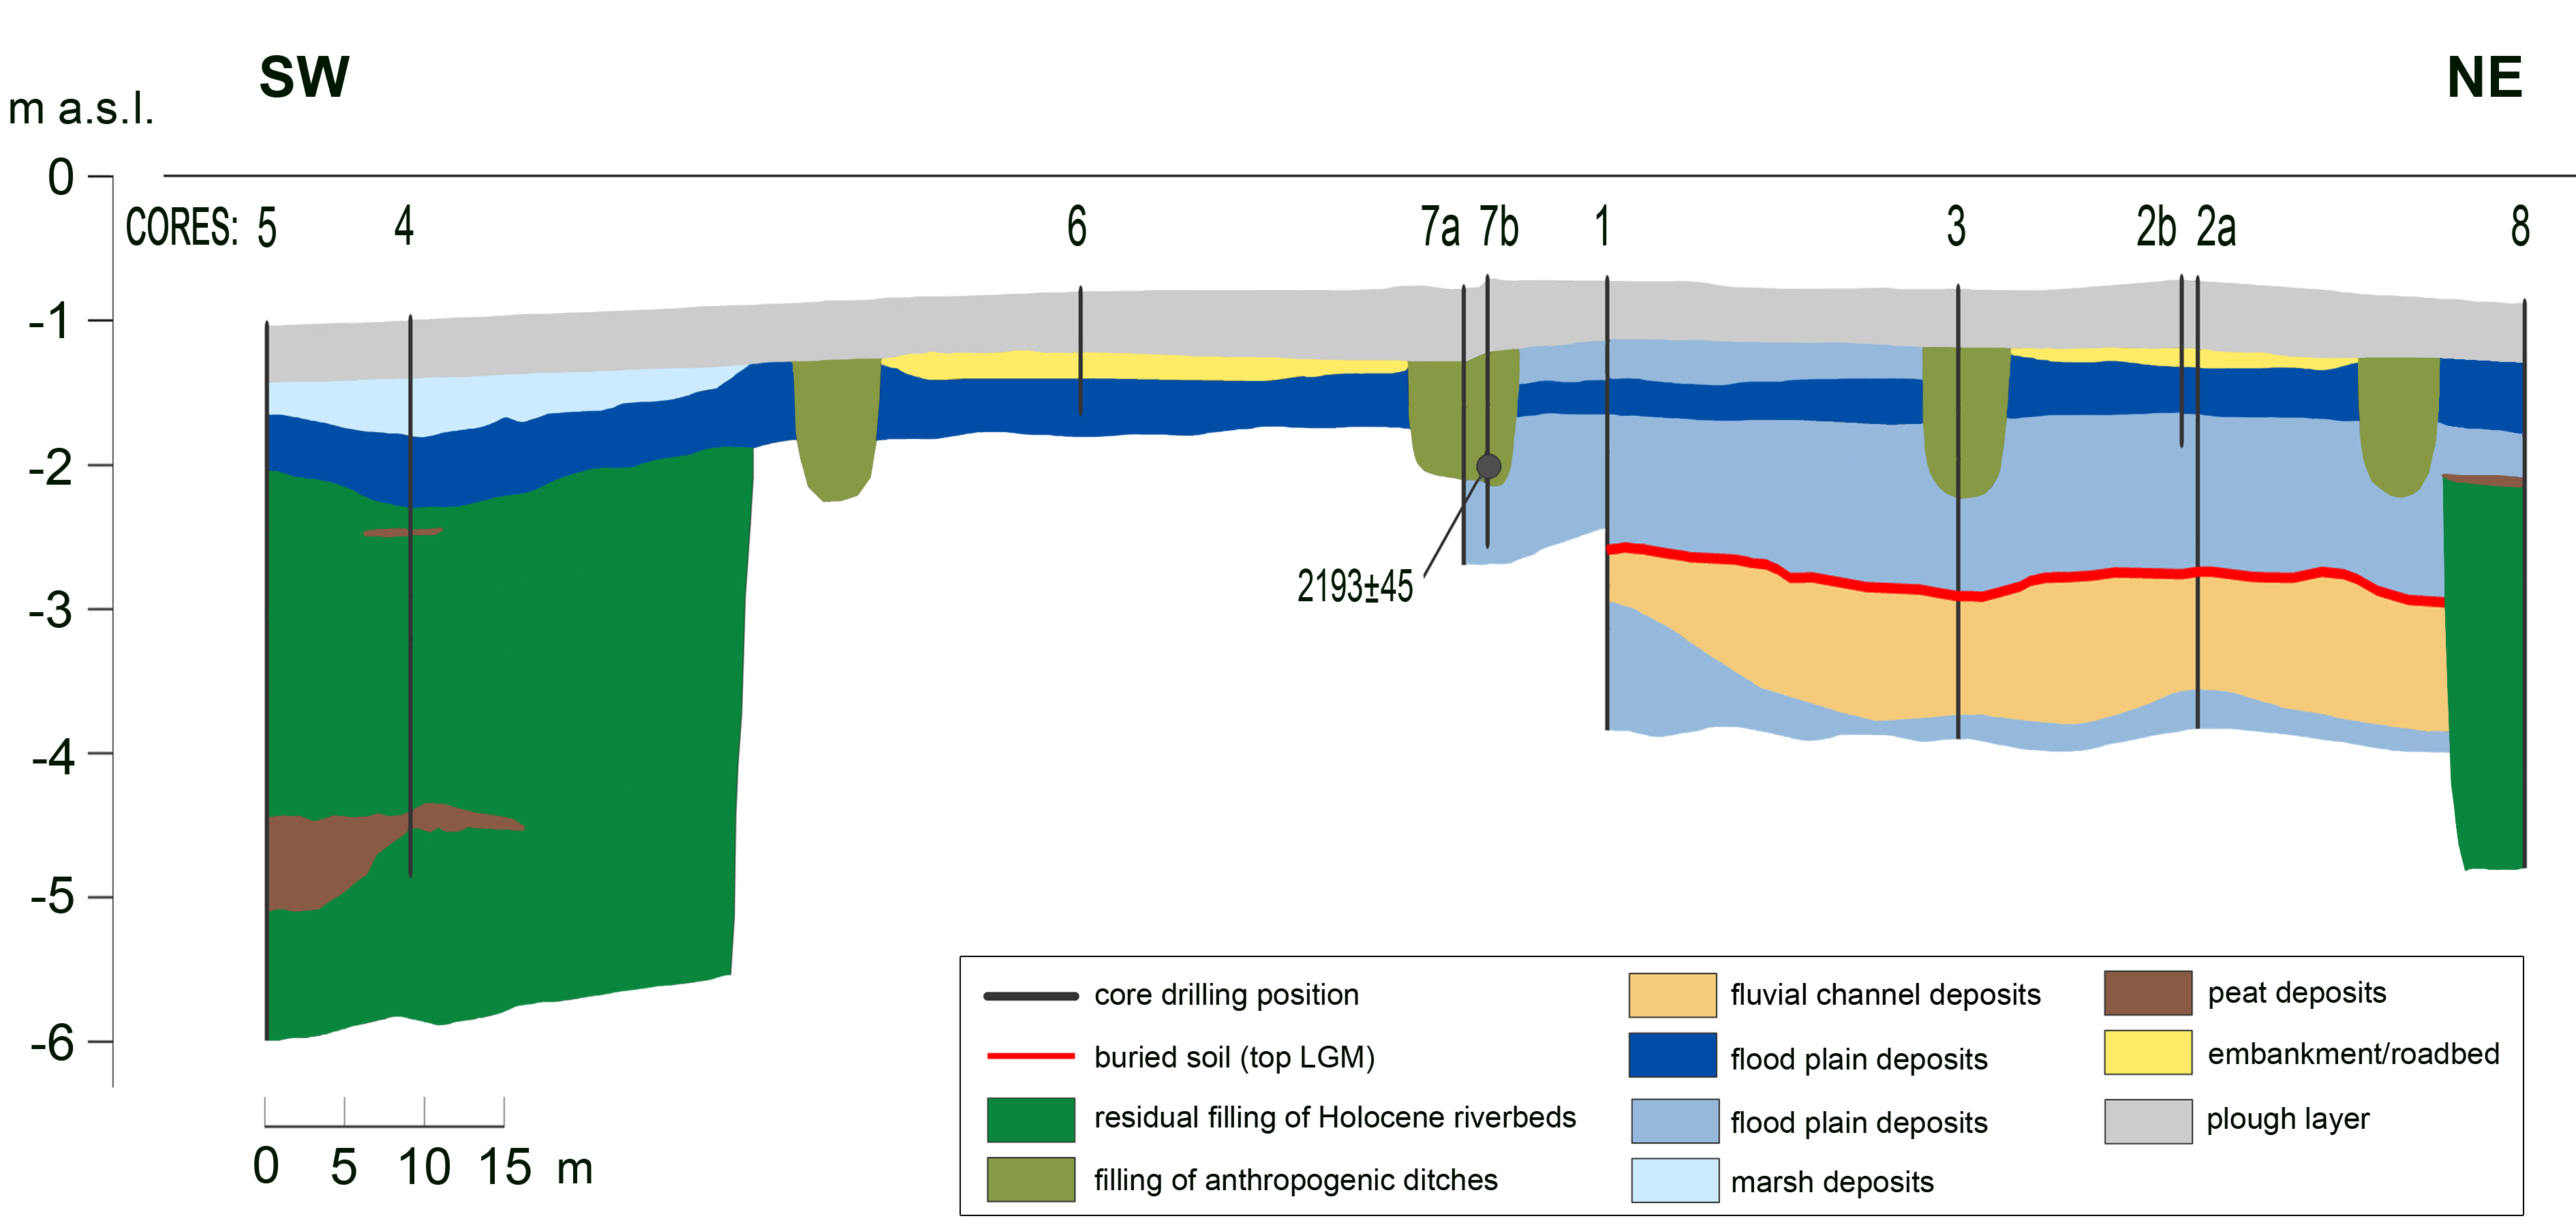
The cores, distributed along a SW-NE section across the study site, allowed to reconstruct the stratigraphy of the deposits to a maximum depth of almost 4 m (Figure 7a). In Figure 7b are reported the stratigraphic logs of the most significant cores in terms of length of the investigated succession and/or relation with the detected archaeological features. The lithostratigraphic correlation between cores is shown in Figure 8.
The alluvial succession investigated through coring is mostly alluvial silty-clay, with only a tabular body of fine silty sand with maximum thickness of 0.8 m that extends in the central part of the section, between cores 1 and 2. The top of this sand body lies at about −3 m asl and is covered by a few-decimetres-thick layer of light olive-brown (2.5Y 5/4) silty clay with abundant pedogenetic carbonate nodules (dimensions up to 2 cm, presence 10–15%) and gray mottles that evidence the occurrence of soil formation in a probably ABk horizon (after [59]). Levels rich in carbonate nodules and mottles are also present in the underlying sand body. This buried soil is covered by 1.5–2 m of olive-brown (2.5Y 4/3) silty clay up to the surface.
At the SW and NE extremes of the section, the alluvial stratigraphy is markedly different, due to the presence of two clay lenses with maximum investigated thickness of 4 m and apparently steep sides (cores 4 and 8). These soft clays have dark gray (5Y 3/1) to greenish-gray (GLEY 6/10Y) colors and contain common fragments of reeds, wood, fresh-water mollusks, and peat layers. They are buried by a laterally-continuous light yellowish brown (2.5Y 6/3) layer of silt and clay that covers the whole investigated area. Only in correspondence of the SW end, this layer is buried by about 0.5 m of very dark grey (2.5Y 3/1) clay.
Concerning the remote sensing archaeological traces, cores 3 and 7a,b were carried out in the dark linear traces. Each core shows the presence of a silty clay sedimentary body between 0.5 (just below the plough horizon) and 1.4 m depth, grayish brown (2.5Y 5/2) color with black laminae, containing common charcoal, reworked carbonate nodules, few wood fragments and just one brick sherd of few millimeters found in core 3. One wood fragment in core 7b was 14C-dated at 384–156 BC (Table 3).
Cores 2a,b, 6, 9, and 10 were positioned between the dark linear traces, with the purpose of verifying the possible presence of anthropogenic strata related to a road. These cores show the presence of a 10–40 cm thick layer just below the surface plough horizon, consisting of compact silty clay with charcoals and fragments of terrestrial gastropods. This is the only stratigraphic evidence of the road, as below is an apparently natural and undisturbed alluvial succession.
The analysis of the exposed section, in the drainage channel of the field f.9, highlighted the presence of some interesting anomalies, just below the agricultural soil thickness of about 0.55 m. In particular, the section allowed us to identify the head of the drainage ditches on the sides of the visible remains of the bottom of the road. The total size of the road is about 28 m to 29 m, including the lateral drainage ditches with a variable size from about 2.8 m to 4.0 m. No evidence has been registered about the bottom of the drainage ditches as well as about the paleochannel, because of their depth, identified respectively by the sample cores at 1.35 m and 1.5 m below the surface. More in general, no structural materials (e.g., stones, wood, etc.) were identified in the section, excepting some, not relevant, small brick fragments. It should be noted that an extensive yellow clayey-loamy level, probably an alluvial deposit, of about 0.2 m in thickness (US 101 in Figure 9c) was detected. Apparently, this represents the bottom of the linear structures visible in the aerial photos, where the upper part of these structures has been probably cut by agricultural modern cultivation practices. The yellow clayey-loamy level (US 101 in Figure 9c) also covers the big paleochannel. In this position, the US 101 is deeper than in other parts of the section (0.7 m below the surface), and is covered by a grey clayey-loamy layer (US 109 in Figure 9c), of about 0.2 m of thickness, probably related to a swamping phase of the area (Figure 9c—section I) and here preserved because of its depth.

4. Discussion

The study here presented about the SE area of Ceggia, where several buried traces, potentially interesting from a geological and archaeological point of view, have been identified by aerial and satellite images, demonstrated the high value of the multidisciplinary approach to understanding, in similar contexts, the evolution of a territory.
In particular, the multitemporal combined analysis of aerial images and historical cartography of Ceggia demonstrated that the linear systems visible in the aerial photos (Figure 1) do not pertain to the modern reclamation (end of the 19th and 20th centuries), and it is not previously documented by the available historical cartography (until the middle of the 16th century), which represent only the marshes in the area. The same analysis highlighted that the artificial section of the Piavon, realized between the end of the 16th and the beginning of the 17th century, cuts this relict system, suggesting its earlier existence.
On the contrary of the hypothesis of Dorigo [15], therefore, these lines evident on the field cannot be attributable to possible interventions made during the Republic of Venice in the second half of the sixteenth century. The evidence collected in this study, thanks to the sporadic fragments of Renaissance material found along the exposed section in the analyzed drainage channel, demonstrates that the area has been undoubtedly frequented in that period but, most probably, only for hunting, fishing, and to provide natural materials.
It can, therefore, be assumed that the system visible in the photos is older than the 16th century and probably even older than the 14th century, considering two different Medieval documents [15,60] which describe the area occupied by marshes.
The preliminary information made by the multi-temporal analysis described before is then completed and validated by the new data provided by the field non-direct and direct measurements.
Starting from the buried anomalies visible in the aerial photos, the geophysical FDEM and ERT acquisitions better defined the localization and spatial relation among these different structures, driving for the sample core positioning. The geophysical data also integrated the information about the system in-depth, only partially directly investigated by the exposed section and the sample cores.
The buried soil at about 2 m depth in the central part of the stratigraphic cross-section (Figure 7 and Figure 8) indicates the existence of a major depositional hiatus in the alluvial succession, probably related to the so-called post-Last Glacial Maximum (post-LGM) unconformity, well known in the whole Venetian-Friulian plain (e.g., [61,62,63,64,65]). This unconformity is associated with soil formation in the interfluves (the “caranto palaeosoil”) and the development of incised valleys along with the concentrated streamflow, as a dynamic reaction of the fluvial system to the deglaciation of the mountain catchments at the end of the LGM. In this framework, the tabular sandy body below the buried soil is attributed to the LGM aggradation of the alluvial plain. The two clay lenses at the SW and NE extremes of the cross-section should represent the top portion of the infilling of post-LGM incised valleys of the Piave River, whose existence has already been reported in this distal sector of the Piave megafan (e.g., [4,66]).
The overlying tabular silty-clay layers were probably deposited by eastern branches of the Piave River before Roman times and after the 2nd millennium BC (Piavon Unit in [4]). The topmost, thin layer of gray mud deposits preserved under the plough horizon in the SW extreme of the section (i.e., US 109) probably corresponds to the so-called Ceggia unit, a thin (<2 m) sedimentary unit that was deposited in fresh-water coastal swamps during the Holocene up to modern times on wide areas of the Piave coastal plain [4]. The preservation of these deposits in the study area was probably possible thanks to the fact that its deposition took place in a depression that, in turn, was created by the higher subsidence in the organic clay fill of the incised valley in respect to the nearby interfluve (a common process in the Venetian plain, e.g., [67]). The sinuous paleochannel evident in aerial photographs is probably related to local drainage along with this elongated depression, that is used to follow the buried Holocene incised valley and debouched in the Canalat just upstream of the Roman bridge (Figure 4).
The core samples and the exposed section have, therefore, highlighted that the paleochannel visible in the aerial photos is more recent than the Roman bridge, on the contrary to as hypothesized in previous studies [68]. These data, therefore, exclude that this river branch flowed in the Roman age, at the same time making possible a hydraulic-agricultural arrangement of the area at that time. In this hypothetical scenario, the river that crossed the area flowing below the Annia three-arched bridge probably corresponds to the current Canalat. This hypothesis can be proved by the large amount of Roman archaeological materials found along the channel (Figure 4b) and by the remains of the Roman villa just close to it. The characteristics and geometry of sediments corresponding to the dark linear traces allow their interpretation as the infilling of couples of artificial ditches running in pairs and converging perpendicularly at the junction. The time window bracketed by the radiocarbon date spans from the beginning of the 4th century to the first half of the 2nd century BC. This confirms that the ditches are not medieval, nor modern. Considering the possibility that the dated wood pertained to a large timber of mature age, this date is not in contrast with the deforestation and installation of a pre-Roman route before the building of the Via Annia, attributed to the second half of the 2nd century BC, possibly as early as 153 BC [5,6]. If we take into account, moreover, that from the photos of the GAI 1954 flight, one of the axes with WNW-ESE trend delimited by these ditches seems to detach from the Annia at the height of the site occupied by the military base, then we have another good reason to assume that the system dates back to a phase in which the road layout was evident on the surface and possibly in use.
More scant is the subsurface evidence of the road that supposedly runs in between each pair of ditches. The relative sediments have probably been largely beheaded by ploughing and other modern agricultural activities. The US 104 is a possible remain of the lower foundation of the road; nevertheless, considering known examples of the Via Annia road investigated in archeological excavation (e.g., Ca’ Tron Michelini; Vigoni [6]), it has to be considered that even such a major consular road outside the main cities was just a dirt road, with faint archaeological evidence. Examples of similar structures have been highlighted in Villadose in the ager Atrianus [69,70,71], but also in the territory north of Padua [72], in the Altinate [72], and in the Valli Grandi Veronesi [69,73]. If we consider, in fact, the hydraulic instability of the sector, it is likely that a system of roads on elevated embankments and ditches like the one found was the most obvious solution to be adopted to ensure the drainage of water from the fields as well as access to the area even in periods when water stagnation could still occur. Moreover, it is not to be excluded that, in Roman times, these banks were also used for seasonal grazing of sheep, in relation to the phenomenon of transhumance, which involved the wintering of flocks coming from mountain areas in the coastal plains. This practice, found in various areas of the Roman Veneto, is well documented, especially in the nearby Altinate territory [74]. Regardless of the use to which the accommodation could have been put, it should be pointed out that the mesh of the buried evidence is not perfectly orthogonal, and the surface of the plots cannot be traced back to the Roman actus. Such a finding, combined with the location of the Roman sites along the river Canalat, leads us to hypothesize that these spaces were not organized according to a centurial model, although they were equipped with hydraulic arrangements that probably guaranteed their seasonal exploitation [75,76].
As it has been pointed out for the plain of Lugo [77], during the Roman Republic, several areas exposed to hydrogeological risk were not regularly divided for the agricultural practices, probably due to the environmental constrains (e.g., presence of swamps or ponds). The conditioning by the environmental context, in terms of population and territorial structure, is also underlined by another recent study which, analyzing the southern centuriated landscape of Padua, focuses on the undefined eastern limit of the agro (coinciding with the coastline of the Roman age), assuming the presence of settlements and cultivated areas also in the area of coastal marshes mentioned by ancient authors [78].
Finally, it is not to be excluded, even if it seems less probable, that the important layout given by the Romans in the area of Ceggia, after a phase of abandonment, was restored and readapted in the Early Middle Ages, losing its original shape. If the arrangement of the sector was, therefore, to be traced back to the Roman age, as the data examined so far would seem to suggest, its progressive defunctionalisation could instead be attributed to changed environmental and land-management conditions.
There are some signs of a worsening of the state of the coastal areas of the upper-Adriatic lagoon area, already from the 3rd–4th centuries AD, when the action was taken on the Annia to restore some stretches of the route ruined by the marshy waters [7]. However, it is from about the middle of the VI century AD, as suggested by the chronicle of Paul the Deacon [79], that a phase of strong hydraulic instability [80], characterized by alluvial phenomena and the swamping of vast portions of territory previously inhabited [1,81], seems to have begun.
This important environmental change, which perhaps led to the deterioration of the Roman land system, had to be favored by the concomitant rarefaction of the settlement typical of the Late Antique- Early Medieval period, as well as by the lack of both maintenance and capillary water control.
On the basis of the picture outlined, it is therefore not to be excluded that the failure to find medieval material on the surface in the SE area of Ceggia is to be associated precisely with this settlement decline, due to the establishment of new socio-political and economic balances and the occurrence of climatic and environmental changes mentioned above.
If we listen to the sources, it is likely that the area of Ceggia and those close to the settlement of Civitas Nova/Heraclia, were already affected at the time by marshy and wooded environments and uncultivated areas for pastoral and breeding activities [82]. The natural modifications occurred during the time provide the image of a variegated landscape, without the man intervention except in an occasional and unsystematic manner. It is difficult, therefore, to think that in such a context, it has been possible to create a system like the one object of this study.

5. Conclusions

The multidisciplinary study carried out in the SE area of Ceggia (VE), in the eastern part of the Venetian Plain, provides numerous details about the high hydraulic instability that affected the area during the times, with the alternation of stable phases (land inhabited and cultivated) with unstable phases (presence of marshes).
This condition probably defined the fertility of the soils and the consequent occupation of the area for its cultivation, despite the dependence from continuous works to force and regulate the flow of water. On the other hand, it is clear that only with the beginning of modern times, with new technologies, the management of the hydraulic problems have become fully solvable. It can be easily understood, however, thanks to the data collected here, that in more ancient times, until the Roman age, the management of this instability had to be not simple and, in any case, temporary.
The survey conducted has made it possible to identify the timing of landscape transformation and to outline, albeit still with some interpretative uncertainty, the different physiognomies that the sector has been acquiring.
Starting from aerial images, it was possible to detect ancient buried traces, and thanks to the comparison with cartographic documents, ancient sources, and data acquired in the field, it was possible to formulate a hypothetical interpretation of the evidence, as well as the transformations that have affected an environment poised between land and water.
It has been highlighted that the periods of hydraulic instability were followed by periods of relative stability conditioned by the incessant anthropic intervention of regulation and maintenance of the water system. Moreover, it has been noted that in these sectors, as climatic-environmental conditions vary and in the absence of water resource management, it is the natural element that has the upper hand.
In relation to the focus of our investigation, the reconstruction of the geomorphic evolution of the study area highlights the existence of a stable alluvial plain in the 2nd century BC, when most probably the ditches were dug, as part of field systems possibly in relation with the construction of the Via Annia and with the occupation of the sector highlighted by a series of productive-residential settlements.
In post-Roman times, as also demonstrated by the cartography, the alluvial plain was covered by wetlands with the sedimentation of a thin veneer of organic-rich swamp deposits. Higher subsidence in the compressible soft clays and peat lowered the topographic surface along the post-LGM incised valley, allowing larger accommodation space and better preservation of the swamp deposits.
After land reclamation and areal erosion by modern agriculture, the Roman infrastructures became again visible at the surface. Locally, the remnants of the swamp persisted, producing dark-tone soil marks in aerial photographs as well as highlighting the course of low-energy, minor channels of the post-Roman swamps.
As regards the hydraulic-agricultural arrangement visible in the trace, the data collected so far would suggest a Roman dating. However, there are still several doubts linked both to the modulus of this arrangement, which cannot be traced back to Roman measurements and to the large dimensions of the main axes of the ancient arrangement. Furthermore, there is some discussion about the imperfect orthogonality of the alignments and the different inclination they present with respect to the presumed limits of the centuriation south of Opitergium.
Although the alignments of Ceggia can be traced in shape and width to other Roman evidence brought to light in Veneto, it should be noted that most of these comparisons refer to embankments not organized in the system. Even the most stringent comparison, which could be established with the so-called “via di Villadose”, considered the decumanus maximus of the centuriationn of Adria, does not help for the moment to resolve the interpretative doubts, to which only further investigations can perhaps provide answers.

Author Contributions

A.V. contributes to the archaeological research, multitemporal analysis of aerial photos and cartography, R.D. contributes to the geophysical data acquisition, processing, and interpretation, P.M. contributes to geomorphological and geoarchaeological analysis, coring, and interpretation of the alluvial stratigraphy. All authors contributed to the conceptualization and writing of the paper. All authors have read and agreed to the published version of the manuscript.

Funding

This research received no external funding.

Acknowledgments

This paper is a part of the Ph.D. thesis of A.V. supervised by Guido Rosada (University of Padova) and Luisa Migliorati (University of Rome La Sapienza). The authors are grateful to the IGM for authorization to publish the image of Fg.39-Fight GAI 1954 str.14, n.182 (authorization number 7054, date: 27/04/2020) and to Luigi Vacilotto, Silvia Favaro and Guglielmo Strapazzon for their support during the field acquisitions. The use of the ReVen images follows the rules of “Italian Open Data License 2.0” (IODL 2.0 http://www.dati.gov.it/iodl/2.0/), which authorizes the free publication of the aerial photographs after quoting the source: “Regione del Veneto-L.R. n. 28/76 Formazione della Carta Tecnica Regionale”.

Conflicts of Interest

The authors declare no conflict of interest.

References

  1. Bondesan, A.; Meneghel, M. Geomorfologia della Provincia di Venezia. Collana: Il Mito e la Storia; Serie maggiore; Esedra: Padova, Italy, 2004. [Google Scholar]
  2. Ragazzi, F.; Zamarchi, P. Carta dei Suoli della Provincia di Venezia, Scala 1:50.000; LAC: Firenze, Italy, 2008. [Google Scholar]
  3. Carton, A.; Bondesan, A.; Fontana, A.; Meneghel, M.; Miola, A.; Mozzi, P.; Primon, S.; Surian, N. Geomorphological evolution and sediment transfer in the Piave River watershed (north-eastern Italy) since the LGM. Géomorphologie 2009, 3, 37–58. [Google Scholar]
  4. Bondesan, A.; Primon, S.; Bassan, V.; Vitturi, A. Carta Delle Unità Geologiche Della Provincia di Venezia; Cierre: Verona, Italy, 2008. [Google Scholar]
  5. Veronese, F. Via Annia. Adria, Padova, Altino, Concordia, Aquileia. Progetto di Recupero e Valorizzazione di Un’antica Strada Romana; Il Poligrafo: Padova, Italy, 2009. [Google Scholar]
  6. Veronese, F. Via Annia II. Adria, Padova, Altino, Concordia, Aquileia. Progetto di Recupero e Valorizzazione di Un’antica Strada Romana; Il Poligrafo: Padova, Italy, 2011. [Google Scholar]
  7. Rosada, G.; Frassine, M.; Ghiotto, A.R. Viam Anniam Influentibus Palustribus Aquis Eververatam Tradizione, Mito, Storia e Katastrophé di una Strada Romana; Canova: Treviso, Italy, 2010. [Google Scholar]
  8. CaVe. Carta archeologica del Veneto I; Capuis, L., Leonardi, G., Pesavento Mattioli, S., Rosada, G., Eds.; coord. scient. L.; Bosio: Modena, Italy, 1988. [Google Scholar]
  9. Croce Da Villa, P. Stele funeraria romana da Ceggia (VE). In Studi di Archeologia Della X Regio in Ricordo di Michele Tombolani; Scarfì, B.M., Ed.; Roma, Italy, 1994; pp. 339–343. [Google Scholar]
  10. Magarotto, M. L’ambiente Antropico Delimitato Dalla SS 14 e Dagli Attuali Corsi del Piave e del Livenza Dall’epoca Romana All’affermarsi di Civitas Nova. Bachelor’s Thesis, Fac. di Lettere e Filosofia, Università degli Studi di Padova, Padua, Italy, 1984–1985. [Google Scholar]
  11. Giovani, E.; Rigoni, A.N. L’agro Opitergino e i Paleoalvei alla Sinistra del Piave dai dati del Remote Sensing, in Quaderni di Archeologia del Veneto; CEDAM: Padova, Italy, 1986; Volume II, pp. 135–139. [Google Scholar]
  12. Rosada, G. I Fiumi e i Porti Della Venetia Orientale: Osservazioni Intorno ad un Famoso Passo Pliniano; Portus Liquentiae: I Dati e i Problemi, in Aquileia Nostra: Bollettino Dell’associazione Nazionale per Aquileia, L; Aquileia Nostra: Aquileia, Italy, 1979; pp. 174–216. [Google Scholar]
  13. Bosio, L.; Rosada, G. Le presenze insediative nell’arco dell’Alto Adriatico dall’epoca romana alla nascita di Venezia. Dati e problemi topografici. In Da Aquileia a Venezia; Una mediazione tra l’Europa e l’Oriente dal II secolo a.C. al 6VI secolo d.C.; Libri Scheiwiller: Milano, Italy, 1989; pp. 509–567. [Google Scholar]
  14. Tozzi, P.; Harari, M. Eraclea Veneta. Immagine di una città Sepolta; Compagnia Generale Ripreseaeree: Parma, Italy, 1984. [Google Scholar]
  15. Dorigo, W. Venezie Sepolte nella Terra del Piave. Duemila Anni fra il Dolce e il Salso. 1994. Available online: https://aleph.mpg.de/F/9JH8L2FKU1AHY3N29182VTYD9GPSKK3NYJ1H3NGYBHFETLH63L-60733?func=full-set-set&set_number=116613&set_entry=000001&format=999 (accessed on 11 September 2020).
  16. Mozzi, P.; Fontana, A.; Ferrarese, F.; Ninfo, A.; Campana, S.; Francese, R. The Roman city of Altinum, Venice lagoon, from remote sensing and geophysical prospection. Archaeolog. Prospect. 2016, 23, 27–44. [Google Scholar] [CrossRef]
  17. Ninfo, A.; Fontana, A.; Mozzi, P.; Ferrarese, F. The map of Altinum, ancestor of Venice. Science 2009, 325, 577. [Google Scholar] [CrossRef] [PubMed]
  18. Ferri, R.; Calzolari, M. Il Contributo Dell’indagine Aerofotogrammetrica all’individuazione di Antichi Tracciati Stradali: L’esempio della Viabilità di Epoca Romana le Valli Grandi Veronesi e la Bassa Modenese, Miscellanea di Studi Archeologici e di Antichità, 3nd ed.; Aedes Muratoriana: Modena, Italy, 1989; pp. 111–132. [Google Scholar]
  19. Vermeulen, F.; Antrop, M. Ancient Lines in the Landscape. A Geo-Archaeological Study of Protohistoric and Roman Roads and Fields Systems in: Northwestern Gaul; Babesch. Bulletin Antieke Beschaving. Annual Papers on Classical Archaeology; Peeters Publishers: Leuven, Belgium, 2001; (Suppl. 7). [Google Scholar]
  20. Vacilotto, A. Capire i segni antichi della terra per governarla. Il caso incognito dell’agro meridionale di Opitergium. In R. PERNA, R. CARMENATI; Giuliodori, M., Piccinini, J., Eds.; Roma ed il Mondo Adriatico. Dalla Ricerca Archeologica alla Pianificazione del Territorio, Atti del Convegno Internazionale, Macerata, 18–20 maggio 2017, Volume I; Carte archeologiche, gestione del patrimonio e parchi archeologici: Roma, Italy, 2020; pp. 33–51, in corso di stampa. [Google Scholar]
  21. Zare, E.; Arshad, M.; Zhao, D.; Nachimuthu, G.; Triantafilis, J. Two-dimensional time-lapse imaging of soil wetting and drying cycle using EM38 data across a flood irrigation cotton field. Agric. Water Manag. 2020, 241. [Google Scholar] [CrossRef]
  22. Boaga, J. The use of FDEM in hydrogeophysics: A review. J. Appl. Geophys. 2017, 139, 36–46. [Google Scholar] [CrossRef]
  23. Anderson-Cook, C.M.; Alley, M.M.; Roygard, J.K.F.; Khosla, R.; Noble, R.B.; Doolittle, J.A. Differentiating soil types using electromagnetic conductivity and crop yield maps. Soil Sci. Society Am. J. 2002, 66, 1562–1570. [Google Scholar] [CrossRef]
  24. Kitchen, N.R.; Sudduth, K.A.; Drummond, S.T. Mapping of sand deposition from 1993 midwest floods with electromagnetic induction measurements. J. Soil Water Conserv. 1996, 51, 336–340. [Google Scholar]
  25. Robert, P. Characterization of soil conditions at the field level for soil specific management. Geoderma 1993, 60, 57–72. [Google Scholar] [CrossRef]
  26. Saey, T.; Van Meirvenne, M.; de Smedt, P.; Neubauer, W.; Trinks, I.; Verhoeven, G.J.; Seren, S. Integrating multi-receiver electromagnetic induction measurements into the interpretation of the soil landscape around the school of gladiators at Carnuntum. Eur. J. Soil Sci. 2013, 64, 716–727. [Google Scholar] [CrossRef]
  27. De Smedt, P.; Delefortrie, S.; Wyffels, F. Identifying and removing micro-drift in ground-based electromagnetic induction data. J. Appl. Geophys. 2016, 131, 14–22. [Google Scholar] [CrossRef]
  28. Abdu, H.; Robinson, D.A.; Jones, S.B. Comparing bulk soil electrical conductivity determination using the DUALEM-1S and EM38-DD electromagnetic induction instruments. Soil Sci. Soc. Am. J. 2007, 71, 189–196. [Google Scholar] [CrossRef]
  29. Corwin, D.L.; Rhoades, J.D. An improved technique for determining soil electrical conductivity-depth relations from above-ground electromagnetic measurements. Soil Sci. Soc. Am. J. 1982, 46, 517–520. [Google Scholar] [CrossRef]
  30. Corwin, D.L.; Rhoades, J.D. Establishing soil electrical conductivity-depth relations from electromagnetic induction measurements. Commun. Soil Sci. Plant Anal. 1990, 21, 861–901. [Google Scholar] [CrossRef]
  31. Friedman, S.P. Soil properties influencing apparent electrical conductivity: A review. Comput. Electron. Agric. 2005, 46, 45–70. [Google Scholar] [CrossRef]
  32. Doolittle, J.A.; Brevik, E.C. The use of electromagnetic induction techniques in soils studies. Geoderma 2014, 223, 33–45. [Google Scholar] [CrossRef] [Green Version]
  33. Allred, B.J.; Daniels, J.J.; Ehsani, M.R. Handbook of Agricultural Geophysics; CRC Press, Taylor and Francis Group: Boca Raton, FL, USA, 2008. [Google Scholar]
  34. Koganti, T.; Van De Vijver, E.; Allred, B.; Greve, M.; Ringgaard, J.; Iversen, B. Mapping of Agricultural Subsurface Drainage Systems Using a Frequency-Domain Ground Penetrating Radar and Evaluating Its Performance Using a Single-Frequency Multi-Receiver Electromagnetic Induction Instrument. Sensors 2020, 20, 3922. [Google Scholar] [CrossRef]
  35. Elmahdy, S.I.; Mohamed, M.M. Remote sensing and geophysical survey applications for delineating near-surface palaeochannels and shallow aquifer in the United Arab Emirates. Geocarto Int. 2015, 30, 723–736. [Google Scholar] [CrossRef]
  36. Fitterman, D.V.; Menges, C.M.; Kamali, A.M.; Jama, F.E. Electromagnetic mapping of buried paleochannels in eastern Abu Dhabi Emirate, UAE. Geoexploration 1991, 27, 111–133. [Google Scholar] [CrossRef]
  37. Kemna, A.; Binley, A.; Ramirez, A.; Daily, W. Complex resistivity tomography for environmental applications. Chem. Eng. J. 2000, 77, 11–18. [Google Scholar] [CrossRef]
  38. Rudolph, S.; van der Kruk, J.; von Hebel, C.; Ali, M.; Herbst, M.; Montzka, C.; Weihermüller, L. Linking satellite derived LAI patterns with subsoil heterogeneity using large-scale ground-based electromagnetic induction measurements. Geoderma 2015, 241–242, 262–271. [Google Scholar] [CrossRef] [Green Version]
  39. Evans, R.L.; Law, L.K.; Louis, B.S.; Cheesman, S. Buried paleo-channels on the new jersey continental margin: Channel porosity structures from electromagnetic surveying. Mar. Geol. 2000, 170, 381–394. [Google Scholar] [CrossRef] [Green Version]
  40. Bates, M.R.; Bates, C.R.; Whittaker, J.E. Mixed method approaches to the investigation and mapping of buriedQuaternary deposits: Examples from southern England. Archaeol. Prospect. 2007, 14, 104–129. [Google Scholar] [CrossRef]
  41. De Smedt, P.; Van Meirvenne, M.; Herremans, D.; De Reu, J.; Saey, T.; Meerschman, E.; Crombé, P.; De Clercq, W. The 3-D reconstruction of medieval wetland reclamation through electromagnetic inductionsurvey. Sci. Rep. 2013, 3, 1517. [Google Scholar] [CrossRef] [PubMed] [Green Version]
  42. Deiana, R.; Bonetto, J.; Mazzariol, A. Integrated Electrical Resistivity Tomography and Ground Penetrating Radar Measurements Applied to Tomb Detection. Surv. Geophys. 2018, 39, 1081–1105. [Google Scholar] [CrossRef]
  43. Tsokas, G.N.; Tsourlos, P.I.; Stampolidis, A.; Katsonopoulou, D.; Soter, S. Tracing a major Roman road in the area of Ancient Helike by resistivity tomography. Archaeol. Prospect. 2009, 16, 251–266. [Google Scholar] [CrossRef]
  44. Vacilotto, A. I Segni Della Terra per la Storia Dell’assetto Agrario di Opitergium. Ph.D. Thesis, Università di Roma “La Sapienza”, Roma, Italy, 2017. [Google Scholar]
  45. Guaitoli, M. Nota sulla Metodologia della Raccolta, della Elaborazione e della Presentazione dei Dati, in TARTARA P.; Torrimpietra (IGM 149 I NO); Forma Italiae: Firenze, Italy, 1999; pp. 357–365. [Google Scholar]
  46. Cambi, F.; Terrenato, N. Introduzione All’archeologia dei Paesaggi. 1998. Available online: https://www.docsity.com/it/f-cambi-n-terrenato-introduzione-all-archeologia-dei-paesaggi-roma-1994/2409147/ (accessed on 11 September 2020).
  47. Corsi, C.; Slapšac, B.; Vermeulen, F. Good Practise in Archaeological Diagnostics. Non-invasive Survey of Complex Archaeological Sites; Springer: Berlin, Germany, 2013. [Google Scholar]
  48. Piccarretta, F. Manuale di Fotografia Aerea; Uso Archeologico; L’Erma di Bretschneider: Roma, Italy, 1987. [Google Scholar]
  49. Piccarretta, F.; Ceraudo, G. Manuale di Aerofotografia Archeologica. Metodologia, Tecniche e Applicazioni; Edipuglia: Bari, Italy, 2000. [Google Scholar]
  50. Vacilotto, A.; Codato, D.; Novello, E. La cartografia dei Consorzi di bonifica: Recupero, analisi e valorizzazione. In Proceedings of the XXI Conferenza Nazionale ASITA, Trieste, Italy, 21–23 November 2017; pp. 1033–1040. [Google Scholar]
  51. Daily, W.A.A.; Ramirez, A.; Binley, A.; LaBrecque, D. Electrical resistivity tomography. Lead. Edge 2004, 23, 438–442. [Google Scholar] [CrossRef]
  52. DeGroot-Hedlin, C.; Constable, S. Occam’s inversion to generate smooth, two-dimensional models from magnetotelluric data. Geophysics 1990, 55, 1613–1624. [Google Scholar] [CrossRef]
  53. LaBrecque, D.J.; Morelli, G.; Daily, W.; Ramirez, A.; Lundegard, P. Occam’s inversion of 3D ERT data. In Three-Dimensional Electromagnetics; Spies, B., Ed.; SEG: Tulsa, OK, USA, 1999; pp. 575–590. [Google Scholar]
  54. Binley, A.; Ramirez, A.; Daily, W. Regularised image reconstruction of noisy electrical resistance tomography data. In Proceedings of the 4th Workshop of the European Concerted Action on Process Tomography, Bergen, Norway, 6–8 April 1995; Beck, M.S., Hoyle, B.S., Morris, M.A., Waterfall, R.C., Williams, R.A., Eds.; pp. 401–410. [Google Scholar]
  55. Bronk Ramsey, C. Bayesian analysis of radiocarbon dates. Radiocarbon 2009, 51, 337–360. [Google Scholar] [CrossRef] [Green Version]
  56. Reimer, P.J.; Bard, E.; Bayliss, A.; Beck, J.W.; Blackwell, P.G.; Bronk Ramsey, C.; Buck, C.E.; Cheng, H.; Edwards, R.L.; Friedrich, M.; et al. IntCal13 and Marine13 radiocarbon age calibration curves 0–50,000 years cal BP. Radiocarbon 2013, 55, 1869–1887. [Google Scholar] [CrossRef] [Green Version]
  57. Harris, E.C. Principles of Archaeological Stratigraphy; Academic Press Limited: London, UK, 1989. [Google Scholar]
  58. Galiazzo, V. I Ponti Romani; Catalogo Generale, Ed.; Canova: Treviso, Italy, 1995. [Google Scholar]
  59. Jahn, R.; Blume, H.P.; Asio, V.B.; Spaargaren, O.; Schad, P.; Langohr, R.; Brinkman, R.; Nachtergaele, F.O.; Pavel Krasilnikov, R. Guidelines for Soil Description; FAO: Rome, Italy, 2006. [Google Scholar]
  60. Cornaro, M. Scritture sulla laguna. In Antichi Scrittori D’idraulica Veneta. Volume II Parte II. Scritture Sopra la Laguna di Alvise Cornaro e di Cristoforo Sabbadino, Off. grafiche C.; Ferrari: Venezia, Italy, 1919; pp. 1442–1464. [Google Scholar]
  61. Mozzi, P.; Bini, C.; Zilocchi, L.; Becattini, R.; Mariotti Lippi, M. Stratigraphy, palaeopedology and palinology of Late Pleistocene and Holocene deposits in the landward sector of the lagoon of Venice (Italy), in relation to the ‘caranto’ level. Il Quat. Ital. J. Quat. Sci. 2003, 16, 193–210. [Google Scholar]
  62. Mozzi, P.; Ferrarese, F.; Fontana, A. Integrating digital elevation models and stratigraphic data for the reconstruction of the post-LGM unconformity in the Brenta alluvial megafan (North-Eastern Italy). Alp. Med. Quat. 2013, 26, 41–54. [Google Scholar]
  63. Fontana, A.; Mozzi, P.; Marchetti, M. Alluvial fans and megafans along the southern side of the Alps. Sedim. Geol. 2014, 301, 150–171. [Google Scholar] [CrossRef]
  64. Rossato, S.; Mozzi, P. Inferring LGM sedimentary and climatic changes in the southern Eastern Alps foreland through the analysis of a 14C ages database (Brenta megafan, Italy). Quat. Sci. Rev. 2016, 148, 115–127. [Google Scholar] [CrossRef]
  65. Rossato, S.; Carraro, A.; Monegato, G.; Mozzi, P.; Tateo, F. Glacial dynamics in pre-Alpine narrow valleys during the Last Glacial Maximum inferred by lowland fluvial records (northeast Italy). Earth Surf. Dyn. 2018, 6, 809–828. [Google Scholar] [CrossRef] [Green Version]
  66. Fontana, A.; Mozzi, P.; Bondesan, A. Alluvial megafans in the Venetian–Friulian Plain (north-eastern Italy): Evidence of sedimentary and erosive phases during Late Pleistocene and Holocene. Quat. Int. 2008, 189, 71–90. [Google Scholar] [CrossRef]
  67. Floris, M.; Fontana, A.; Tessari, G.; Mulè, M. Subsidence zonation through satellite interferometry in coastal plain environments of NE Italy: A possible tool for geological and geomorphological mapping in urban areas. Remote Sens. 2019, 11, 165. [Google Scholar] [CrossRef] [Green Version]
  68. Schmedt, G. La prospezione aerea nella ricerca archeologica. In Proceedings of the Convegno Internazionale Sulla Tecnica e Diritto nei Problemi Della Odierna Archeologia, Venezia, Italy, 22–24 May 1962; pp. 66–93. [Google Scholar]
  69. Tozzi, P. Memoria della Terra. Storia Dell’uomo; La Nuova ItaliaFirenze: Firenze, Italy, 1987. [Google Scholar]
  70. Masiero, E. La strada “in levada” nell’agro nord-occidentale di Adria, in JAT, IX, Roma, Italy. 1999, pp. 107–120. Available online: https://www.gcss.it/easyweb/w7044/index.php?EW_T=M1&EW_FL=w7044/ew_limiti.html&EW4_DLL=10&EW4_DLP=10&EW4_NVR=&EW4_NVT=&EW4_NMI=&EW4_CJL=1&NOICONE=1&PHPMSG=1&lang=ita&REC1MEMO=1&EW4_PY=KW=MASIERO&EW_RM=10&EW_EP=KW=MASIERO&EW_RP=2&&EW_P=LSPHP&EW_D=W7044&EW=0002562 (accessed on 11 September 2020).
  71. Maragno, S. Rilievo topografico di un tratto del decumano massimo nella centuriazione fossile dell’ager Atrianus. In La Ricerca Archeologica di Superficie in Area Padana; Atti del workshop (Villadose, 1 ottobre 1994), a cura di E. Maragno, Stanghella (Padova); 1996; pp. 383–386. Available online: http://www.centuriazione.it/quaderni_win.asp?id=84 (accessed on 11 September 2020).
  72. Bonetto, J. Le vie Armentarie tra Patavium e la Montagna; Zoppelli: Dosson, Italy, 1997. [Google Scholar]
  73. De Guio, A. ii Progetto Alto-Medio Polesine–Basso Veronese: Sesto Rapporto, in Quaderni di Archeologia del Veneto, IX. 1993, pp. 170–186. Available online: https://culturaveneto.it/it/web/cultura/volumi-vi-x (accessed on 11 September 2020).
  74. Rosada, G. Altino e la via della transumanza nella Venetia centrale, In Proceedings of the Pecus. Man and Animal in Antiquity Conference, Swedish Institute, Rome, Italy, 9–12 September 2002; Santillo Frizell: Roma, Italy, 2004; pp. 71–83. [Google Scholar]
  75. Calzolari, M. Aspetti del territorio in epoca romana: Acque, bonifiche e insediamenti. In Da Palus Maior a S. Biagio in Padule. Uomini e Ambiente nella Bassa Modenese dall’Antichità al Medioevo; Dini: Modena, Italy, 1984; pp. 35–76. [Google Scholar]
  76. Frassine, M. Palus in Agro. Aree Umide, Bonifiche e Assetti Centuriali in Epoca Romana, Collana: Agri Centuriati. Supplementa; Fabrizio Serra, Ed.; Pisa-Roma: Roma, Italy, 2013. [Google Scholar]
  77. Franceschelli, C.; Marabini, S. Lettura di un Territorio Sepolto. La Pianura Lughese in età Romana; Collana “Studi e Scavi”, Dipartimento di Archeologia dell’Università di Bologna; AnteQuem: Bologna, Italy, 2007; p. 224. [Google Scholar]
  78. Matteazzi, M. Il paesaggio Centuriato a sud di Padova: Una Nuova Lettura Dallo Studio Archeomorfologico del Territorio. “Agri Centuriati”; Fabrizio Serra, Ed.; Pisa-Roma, 2014; pp. 9–29. [Google Scholar]
  79. Pauli Diaconi, Historial Langobardorum, III; Istituto Storico Italiano: Roma, Italy, 1918; pp. 23–24.
  80. Fontana, A.; Frassine, M.; Ronchi, L. Geomorphological and Geoarchaeological Evidence of the Medieval Deluge in the Tagliamento River (NE Italy). In Fontana A. and Herget J. Palaeohydrology; Springer: Cham, Switzerland, 2020; pp. 97–116. [Google Scholar]
  81. Pinna, M. Le Variazioni del Clima. Dall’ultima Grande Glaciazione alle Prospettive per il XXI Secolo; Franco Angeli: Milano, Italy, 1996. [Google Scholar]
  82. Pavanello, G. Di un’antica laguna scomparsa (la laguna Eracliana). In Arch. Veneto-Tridentino, 3nd ed.; Premiate officine grafiche C. Ferrari: Venice, Italy, 1923. [Google Scholar]
Figure 1. (a) Location of the study area. (b) Agea 2012 digital color orthophoto: (1) the study area; (2) the site investigated with geophysical prospections, core drilling, and stratigraphic analysis of the exposed sections.
Remotesensing 12 02973 g001
Figure 2. (a) Historical-topographical map; (b) Geoarchaeological map with traces from aerial photographs. Legend: (1) Roman cities; (2) Early Medieval towns; (3) probable site of the Roman port; (4) Roman roads; (5) main watercourses; (6) contour lines with equidistance 2 m; (7) southern countryside of Opitergium; (8) mechanical drainage areas; (9) extension of marshy-lagoon areas from 17th century cartography; (10) study area; (11) area studied with geophysical surveys, core drilling, and cleaning of the exposed sections; (12) paleochannels; (13) ancient lagoon canals; (14) loamy soils; (15) clayey soils; (16) archaeological findings known from the bibliography [8,10] and from data archive of the SABAP modified by the authors; (17) anthropic aerial photo lines; (18) sites of particular interest: A-Roman bridge; B-probable rustic settlement. The geomorphological elements (12), (13), (14), and (15) are taken from [1].
Remotesensing 12 02973 g002
Figure 3. Area SE of Ceggia: zoom on some evident soil marks visible in historical zenithal photos of different years and a recent oblique photo. In yellow, the area subject to geophysical investigations, core drilling, and cleaning of the exposed sections. (a) Photo GAI 1954. (b) Photo ReVen 1983. (c) Photo ReVen 1990. (d) Oblique photo [5].
Remotesensing 12 02973 g003
Figure 4. SE area of Ceggia. (a) System of traces visible in ReVen 1983 aerial frames. (b) Photorestitution on CTR 1:5000 of the signs detected through multitemporal analysis of historical aerial images (IGM 1937, GAI 1954, ReVen 1983 and Reven 1990) and new archaeological data deduced through surveys (2014–2017).
Remotesensing 12 02973 g004
Figure 5. Historical maps of the study area (in orange), and details of the route of the Via Annia (in yellow) and the Roman bridge (in black). (a) Drawing (1568) showing the sector to be reclaimed, i.e., the “retrazer palv”, south of the Piavon canal (today’s Canalat)-Archivio di Stato di Venezia, MP 42-55 (16); (b) Map (1639) depicting the marshes (in light yellow), ploughed and inhabited land (in pink), watercourses (in blue)-Archivio di Stato di Venezia, SEA, Piave, r.106, dis.15; (c) Detail of the map (1840) of the Santini Cadastre (in blue), superimposed on the CTR 1:10,000 (in black), which shows the relationship of the Canalat with the Annia Roman bridge; (d) Detail of a 1914 map showing the rectification of the Canalat bend in relation to the Roman bridge-Consorzio di Bonifica Veneto Orientale. The route of the Via Annia, the Canalat course and the location of the Roman bridge allow to identify the study area in the figures.
Remotesensing 12 02973 g005
Figure 6. Geophysical measurements: (a) Image of an ERT line acquisition; (b) Localization of geophysical measurements: blue line (1) ERT, yellow area (2) FDEM; (c) scheme of ERT acquisition.
Remotesensing 12 02973 g006
Figure 7. Drilling. (a) Location ofthe cores: (1) andERT alignment (2). (b) Stratigraphic logs of core drillings performed in correspondence of paleochannels (4, 9, 8), ditches (7b), and main axes of the presumed stractures of ancient origin (9, 2a). Log symbols: (1) fragments of plant remains; (2) continental mollusks; (3) carbonatic nodules; (4) nodules of iron-manganese oxides; (5) charcoal; (6) bricks fragments. On the right, from top to bottom, photos of the works: (c) execution of a core; (d) sampling of a core; (e) documentation of stratigraphic succession.
Remotesensing 12 02973 g007
Figure 8. Section across the study site.
Remotesensing 12 02973 g008
Figure 9. Cleaning of the exposed section. (a) Working area: (1) cores; (2) ERT line; (3) exposed sections. (b) Image documenting the field activity. (c) Stratigraphic sections detected in correspondence of some soil marks: the numbers correspond to the Stratigraphic Units (US) identified; the image shows the included angular US104 (hypothetical road/street base).
Remotesensing 12 02973 g009
Figure 10. Results of geophysical measurements: (a) localization of FDEM (yellow area) and ERT line (blue); (b) Map of resistivity measured from the surface to −1.5 m obtained by using FDEM; (c) result of ERT section.
Remotesensing 12 02973 g010
Table 1. List of aerial photographs analyzed for the study.
FlightArchiveDateType of RecordingFocal Length (mm)Flying Height (m)Average Frame Scale
ReVen 1999Veneto Region19 March 1999Analog b/w frame
(23 cm × 23 cm)
153, 3125001:16,000
ReVen 1990Veneto Region20 March 1990Analog color frame
(23 cm × 23 cm)
152, 8230001:20,000
ReVen 1983Veneto Region16–17 March 1983Analog b/w frame
(23 cm × 23 cm)
153, 1326001:17,000
GAI 1954IGM11 April 1954Analog b/w frame
(23 cm × 23 cm)
153, 154From 5000 to 10,000From 1:30,000 to 1:62,000
IGM 1937IGM1937Analog b/w frame
(13 cm × 18 cm)
n.a.From 1400 to 3400From 1:11,000 to 1:20,000
Table 2. List of historical cartography analyzed for the study.
DateConservation InstituteCartographic Code Title
1960 ca.CBVO—(Consorzio di Bonifica Veneto Orientale)Comune di Ceggia, FF. 2,4, 22Piano quotato
1952IGM F.39 III SE e F52 IV-NES. Stino di Livenza e Passarella
1938IGM F.39 III SE e F52 IV-NES. Stino di Livenza e Passarella
1924IGM F.39 III SE e F52 IV-NES. Stino di Livenza e Passarella
1920 ca.CBVO Settore Tecnico: Progetti-Consorzio di Bonifica Bella MadonnaComprensorio di bonifica
1914CBVO Settore Tecnico: Progetti-Consorzio di Bonifica Bella MadonnaBase catastale con indicazioni degli interventi da eseguire sulla rete scolante: rettifica ansa del Canalat
1890–1891IGM F.39 III SE e F52 IV-NES. Stino di Livenza e Passarella
1840 (ca.)CBVO Settore Catasto: Fossà Mappa del comune censuario di Fossà con Palazzetto, distretto VII di San Donà di Piave-Catasto Santini
1807–1852ASVE 74-Fossà con PalazzettoCatasto Austriaco
1818–1829Kriegsarchiv-Austrian State Archives---Second Military Survey
1798–1805Kriegsarchiv-Austrian State Archives---Topographisch-geometrische Kriegskarte von dem Herzogthum Venedig
1789CMC
(Civico Museo Correr)
Provenienze Diverse,
C 840.4
Topografia del corso delle acque del basso Trevigiano
1675ASVE Miscellanea Mappe, 1275Mappa delle terre comprese tra la Livenza e il Piavon
1641ASVE Savi ed Esecutori alle Acque, Piave, r.106, dis.16Piave (fiume). Il Piave da Ponte di Piave al suo sbocco a mare, con vasta zona di terre arative, pascolive, boschive, a vigneti e valli, prative e paludose ed estesa fascia litoranea da Sant’Erasmo al porto di Caorle
1639ASVE Savi ed Esecutori alle Acque, Piave, r.106, dis.15Piave ed altri fiumi. Regolazione del Piave, Livenza, Sile, Zero, ed altri fiumi minori nel territorio, confluenti nel mare.
1628ASVE Miscellanea Mappe, 1274Mappa di beni siti nelle adiacenze del Piavon e Magnadola
1607ASVE Beni Inculti
Treviso-Friuli, rot.414, m.10/B, dis.3
Trevigiano (territorio). Comprensorio tra Piave e Livenza
1568ASVE Mensa Patriarcale,
42-55(16)
Villa de Ceia-Palu da retrazer
Table 3. Details of the 14C dating of a wood sample from the core 7b (see Figure 7).
Core and Depth
(cm)
LabCodeRadiocarbon Age (yr BP)δ13C (‰)Calibrated Age B.C.
[Start-End] Probability %
MaterialElevation
(m a.s.l.)
LatitudeLongitude
Core 7b
135 cm
LTL1687A2193 ± 45−29.8 ±0.2[384,156] 93,5%
[134,115] 1,9%
wood−0,8045,6742° N12,6508° E