Very Local Subsidence Near the Hot Spring Region in Hakone Volcano, Japan, Inferred from InSAR Time Series Analysis of ALOS/PALSAR Data


Abstract
1. Introduction
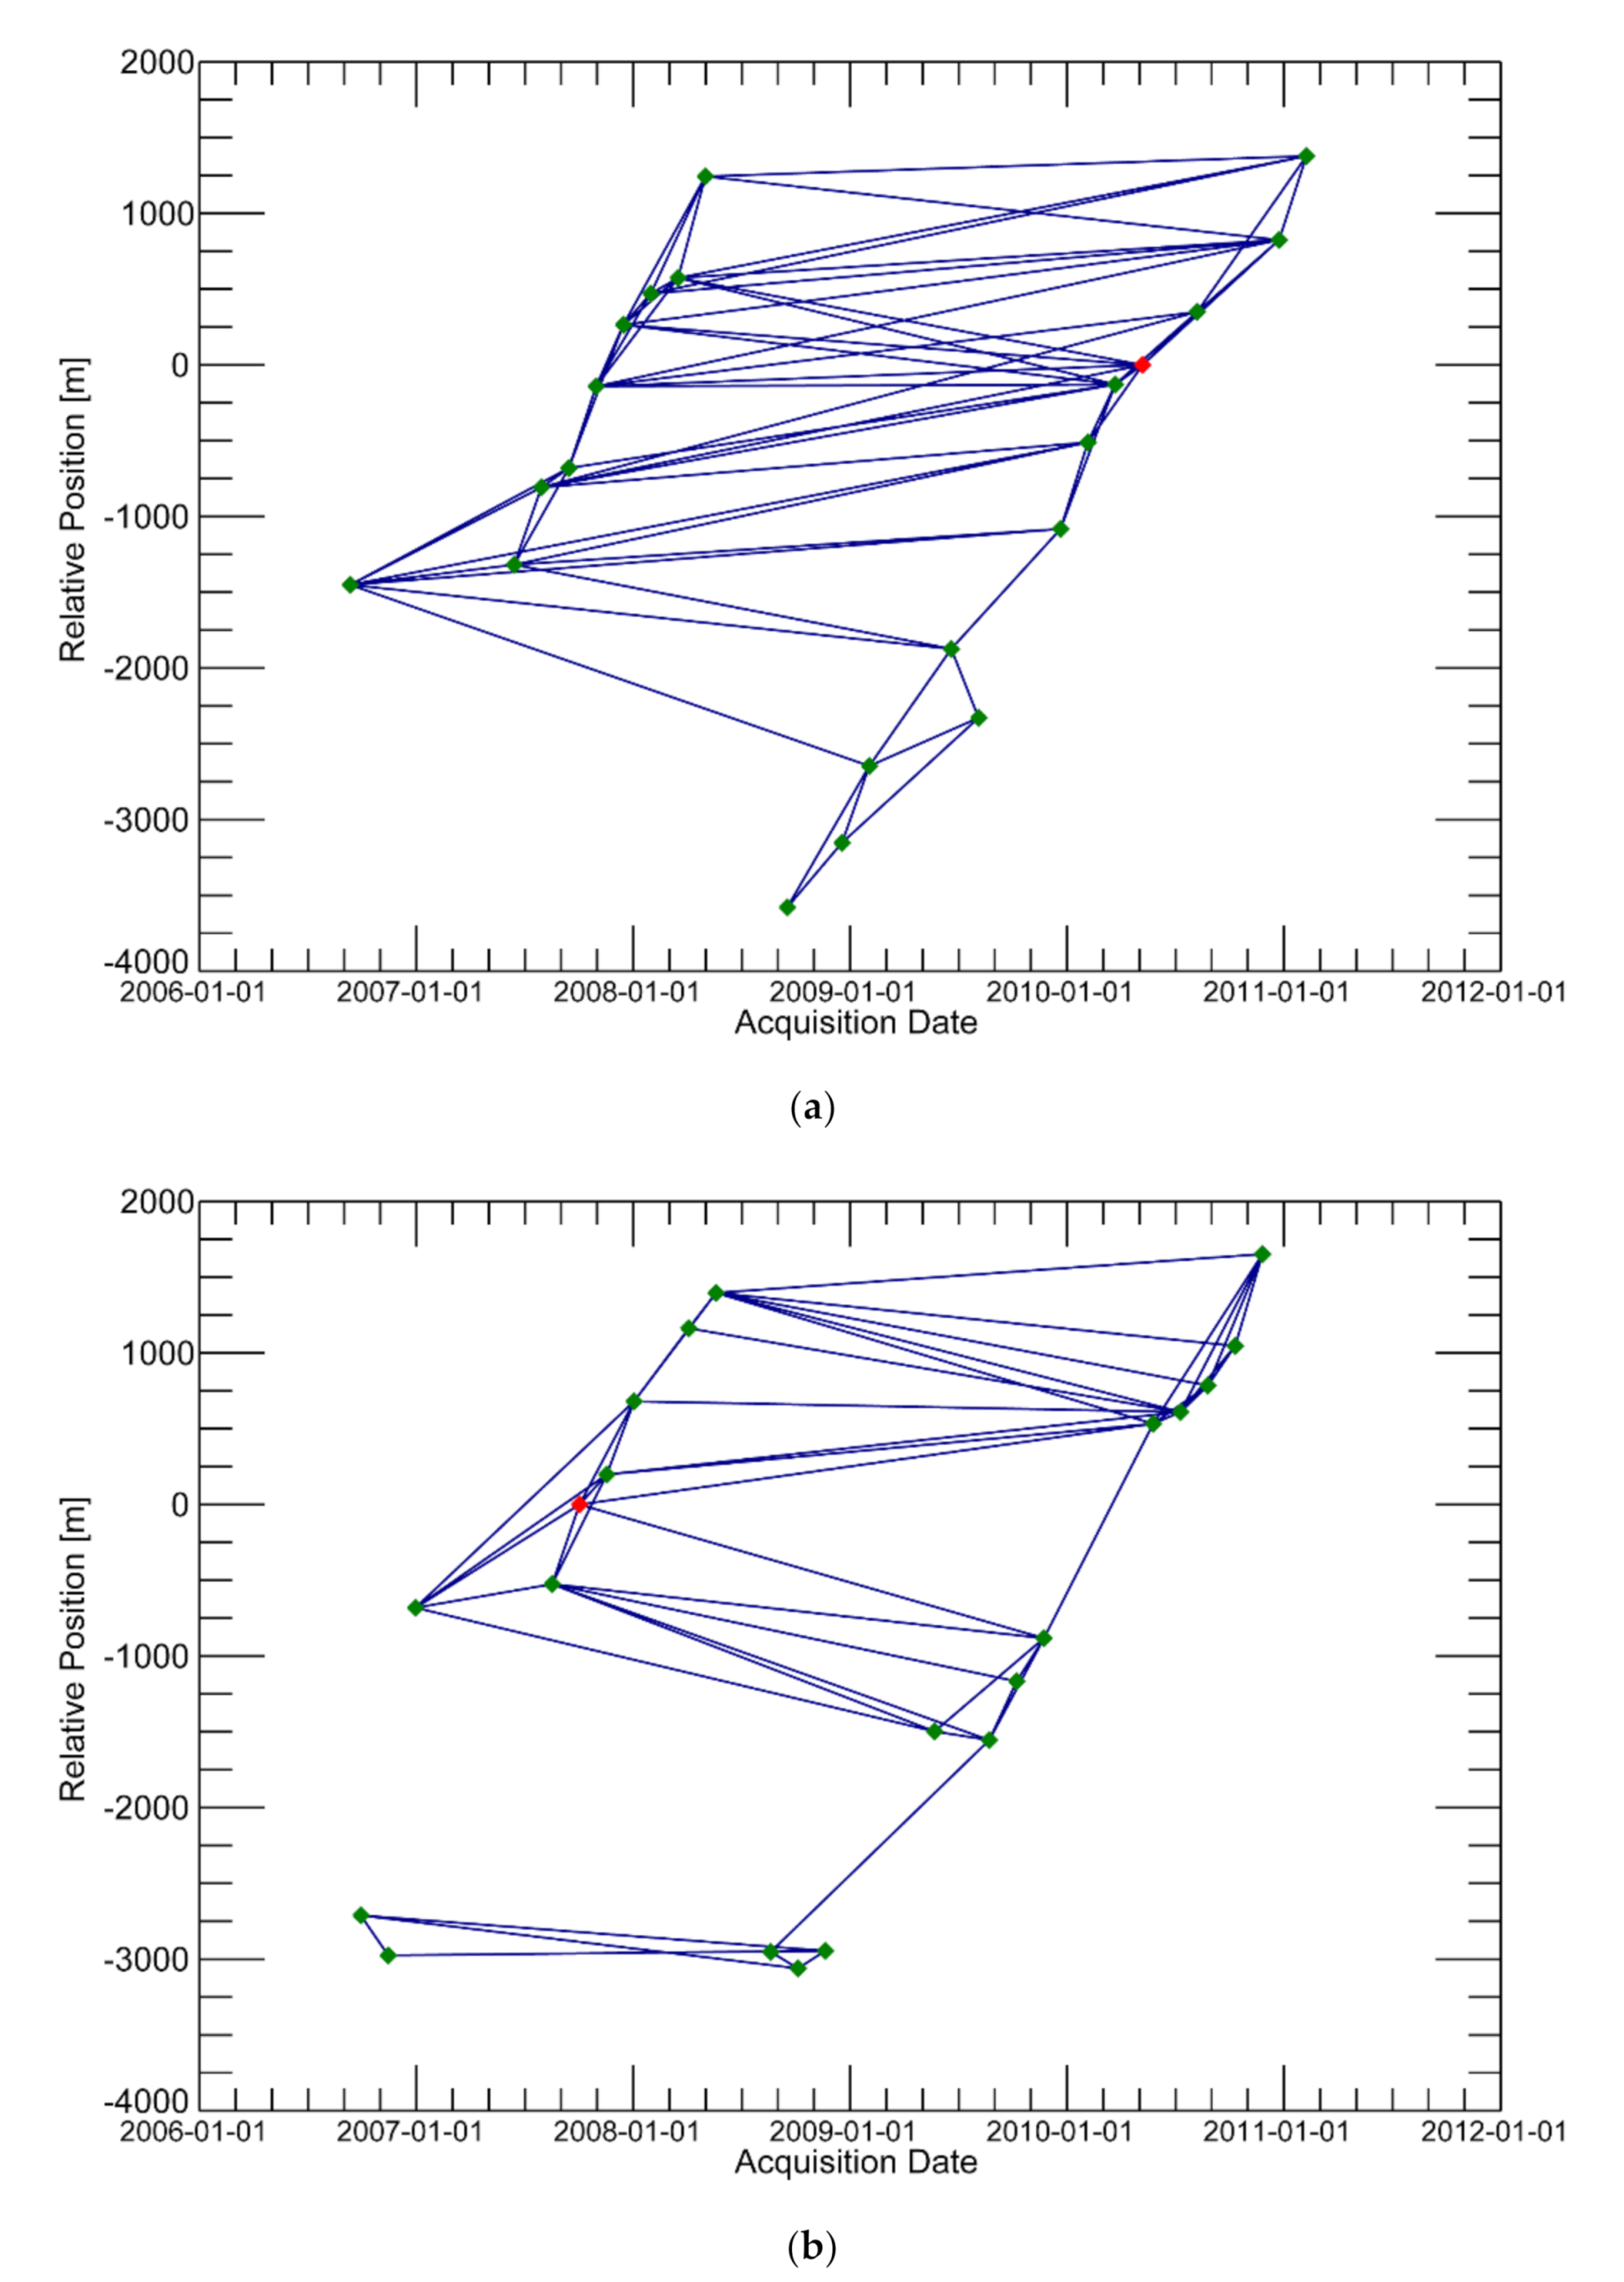
2. Materials and Methods
3. Results
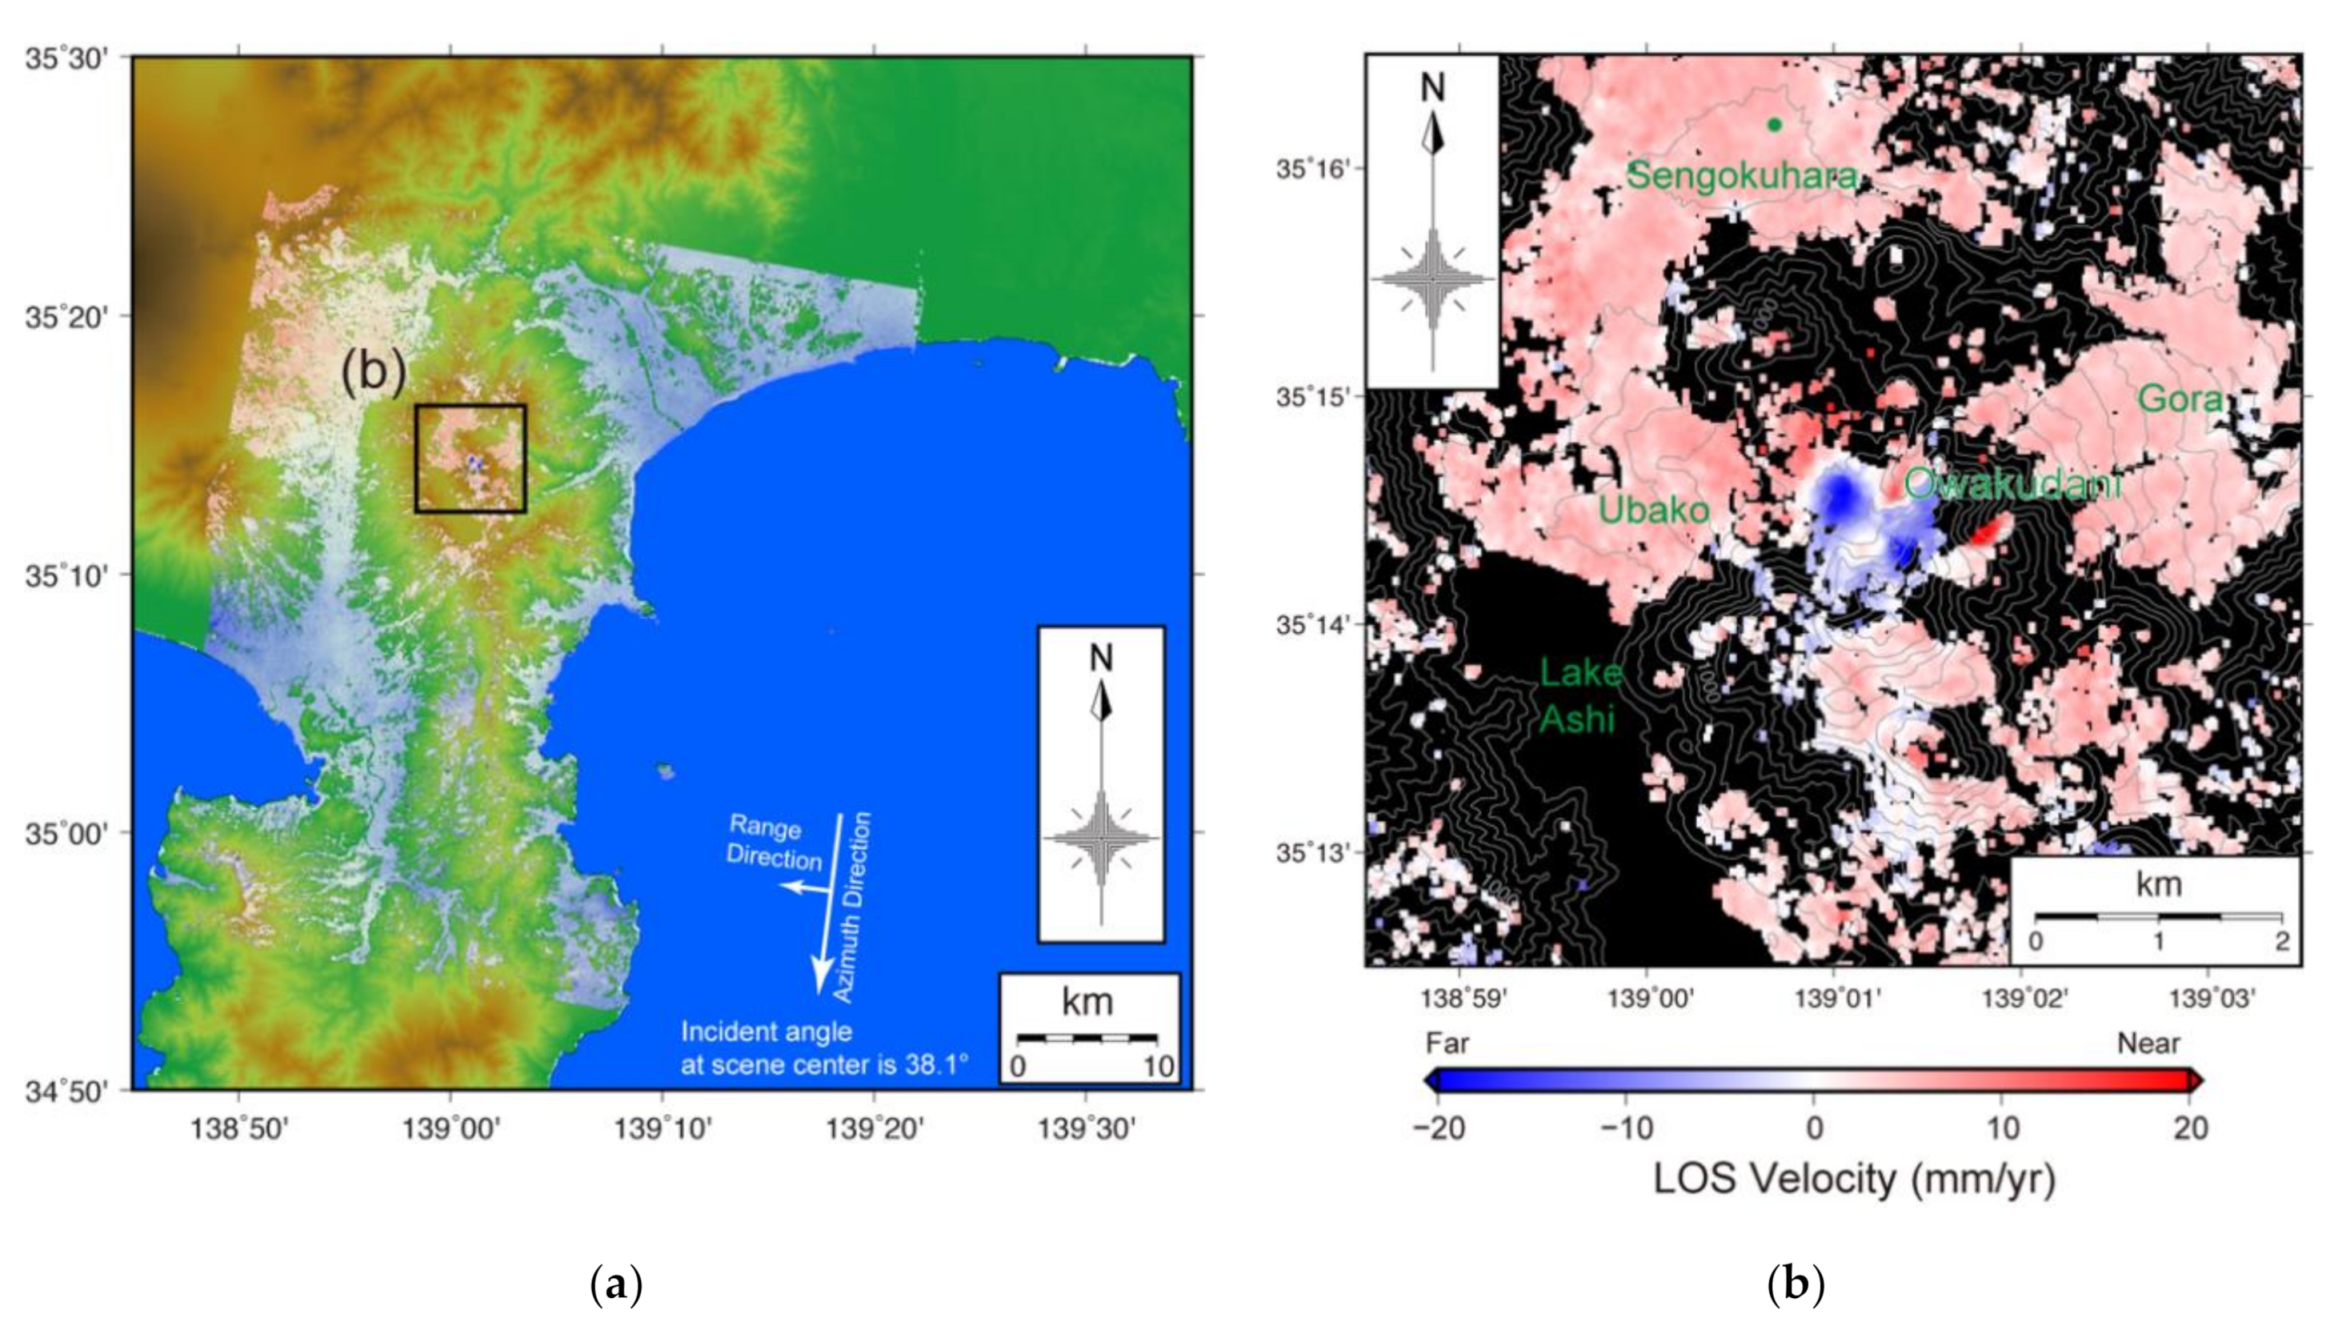
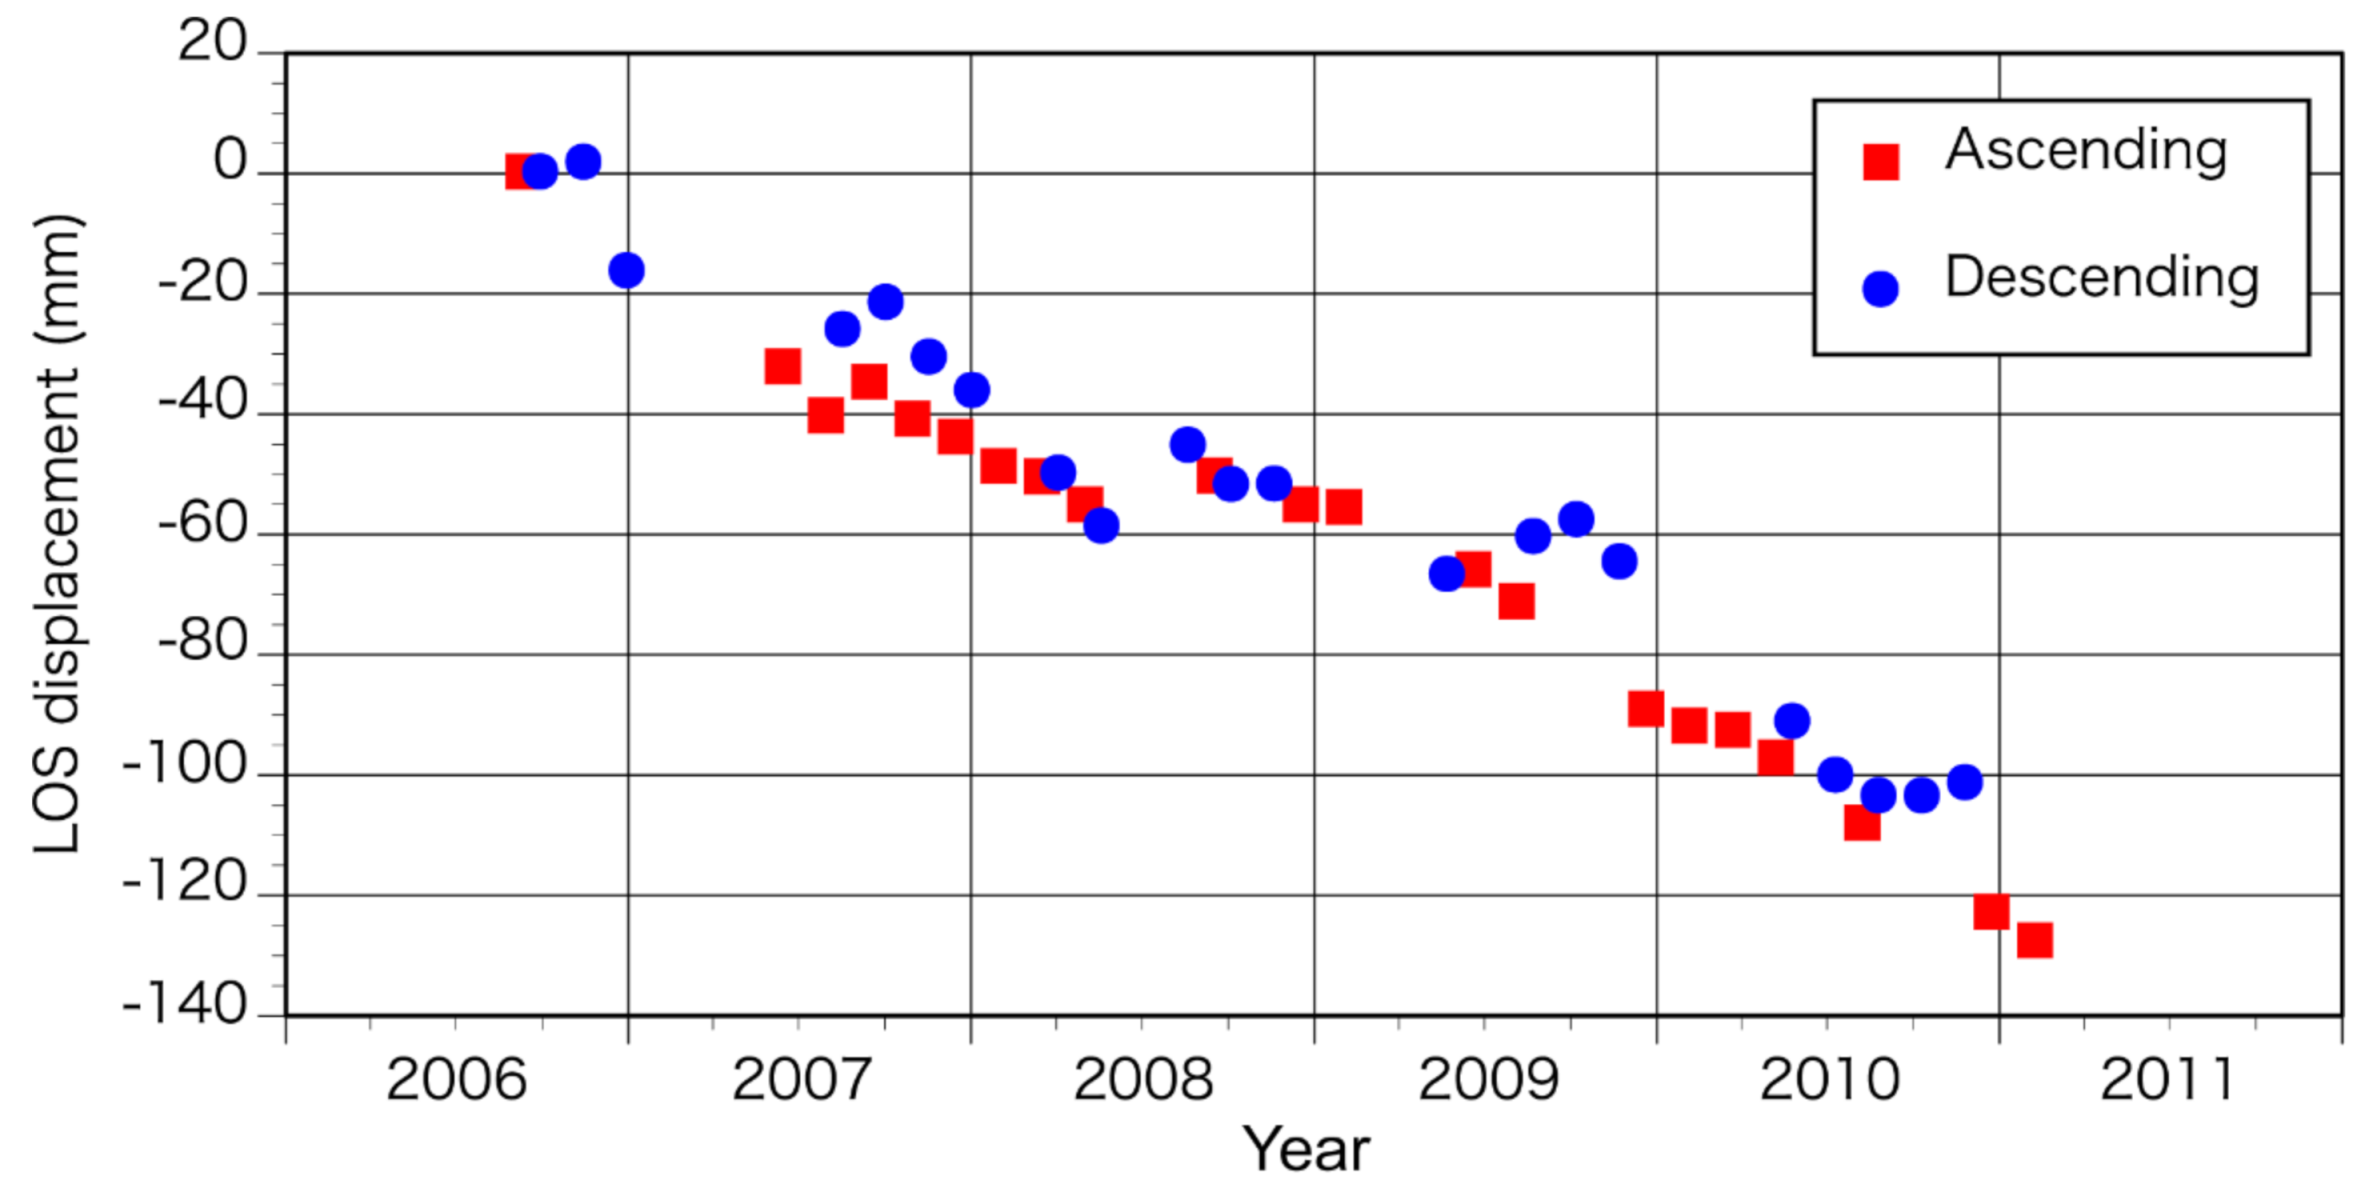
3.1. Ascending Orbit
3.2. Descending Orbit
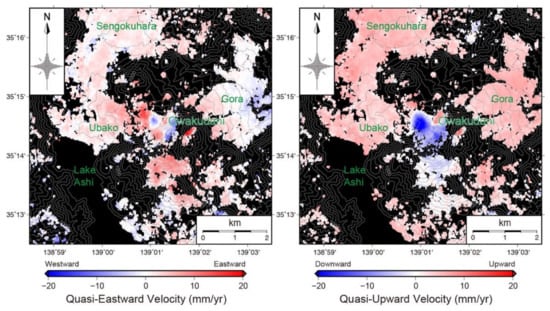
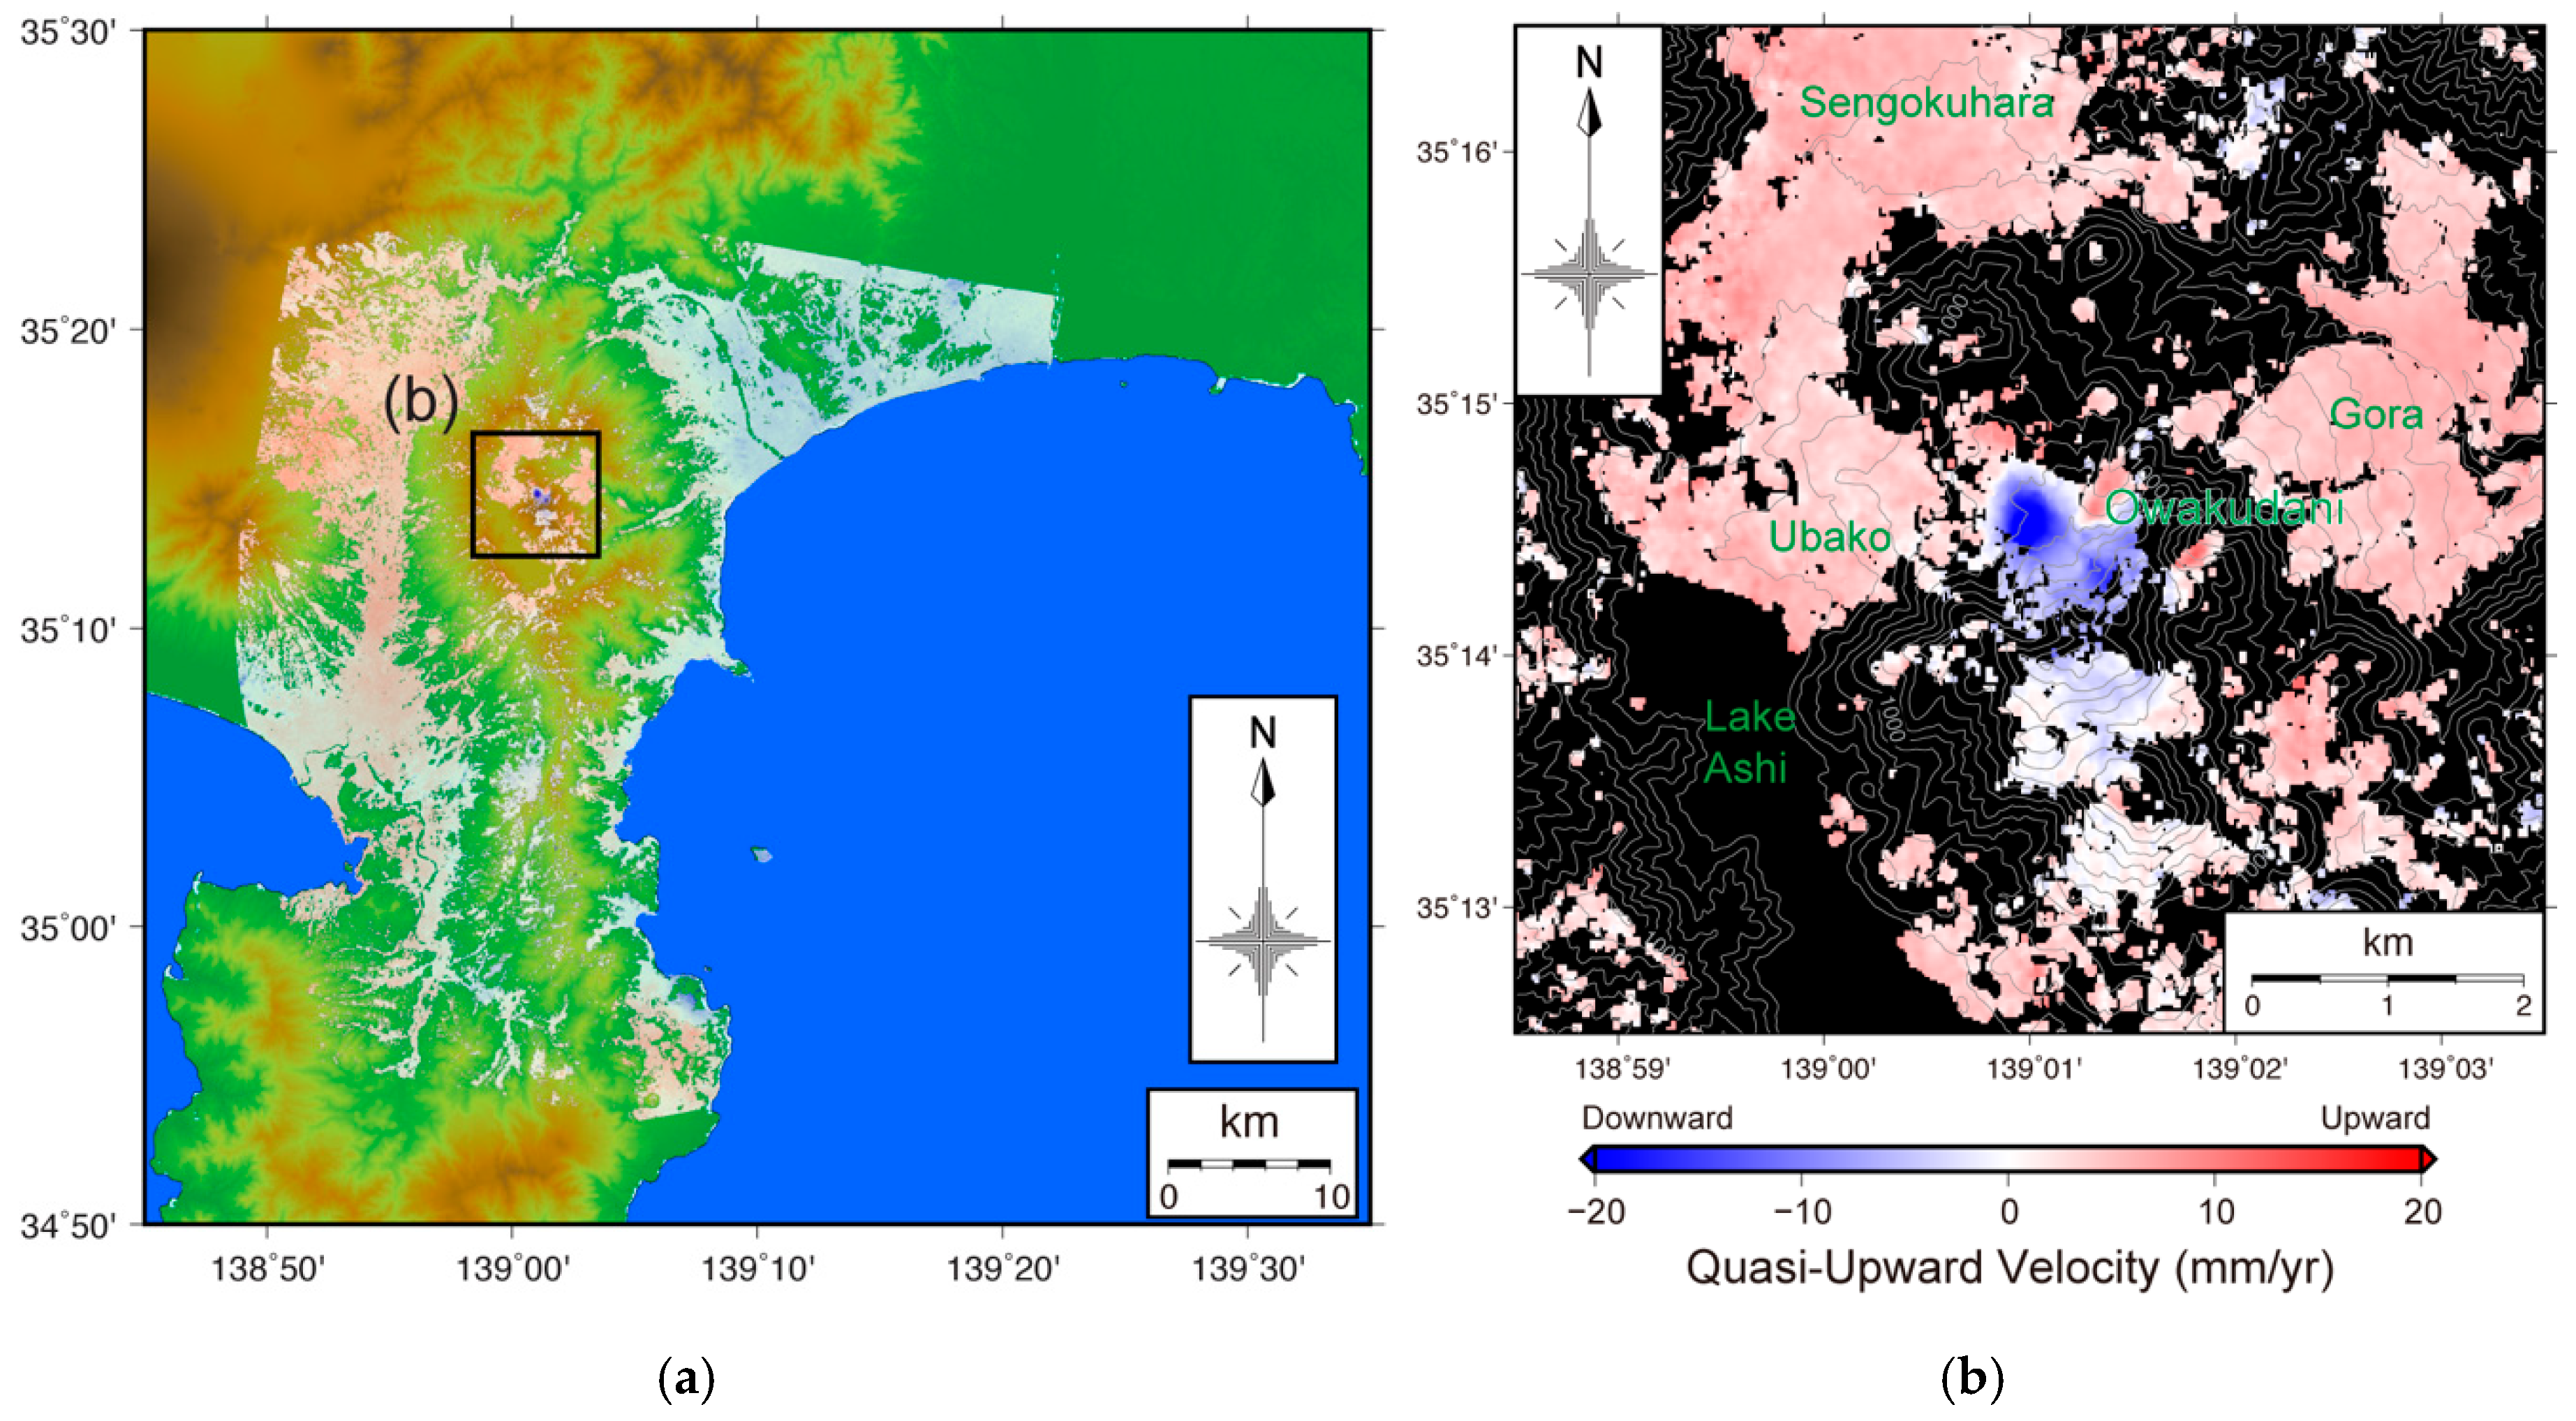
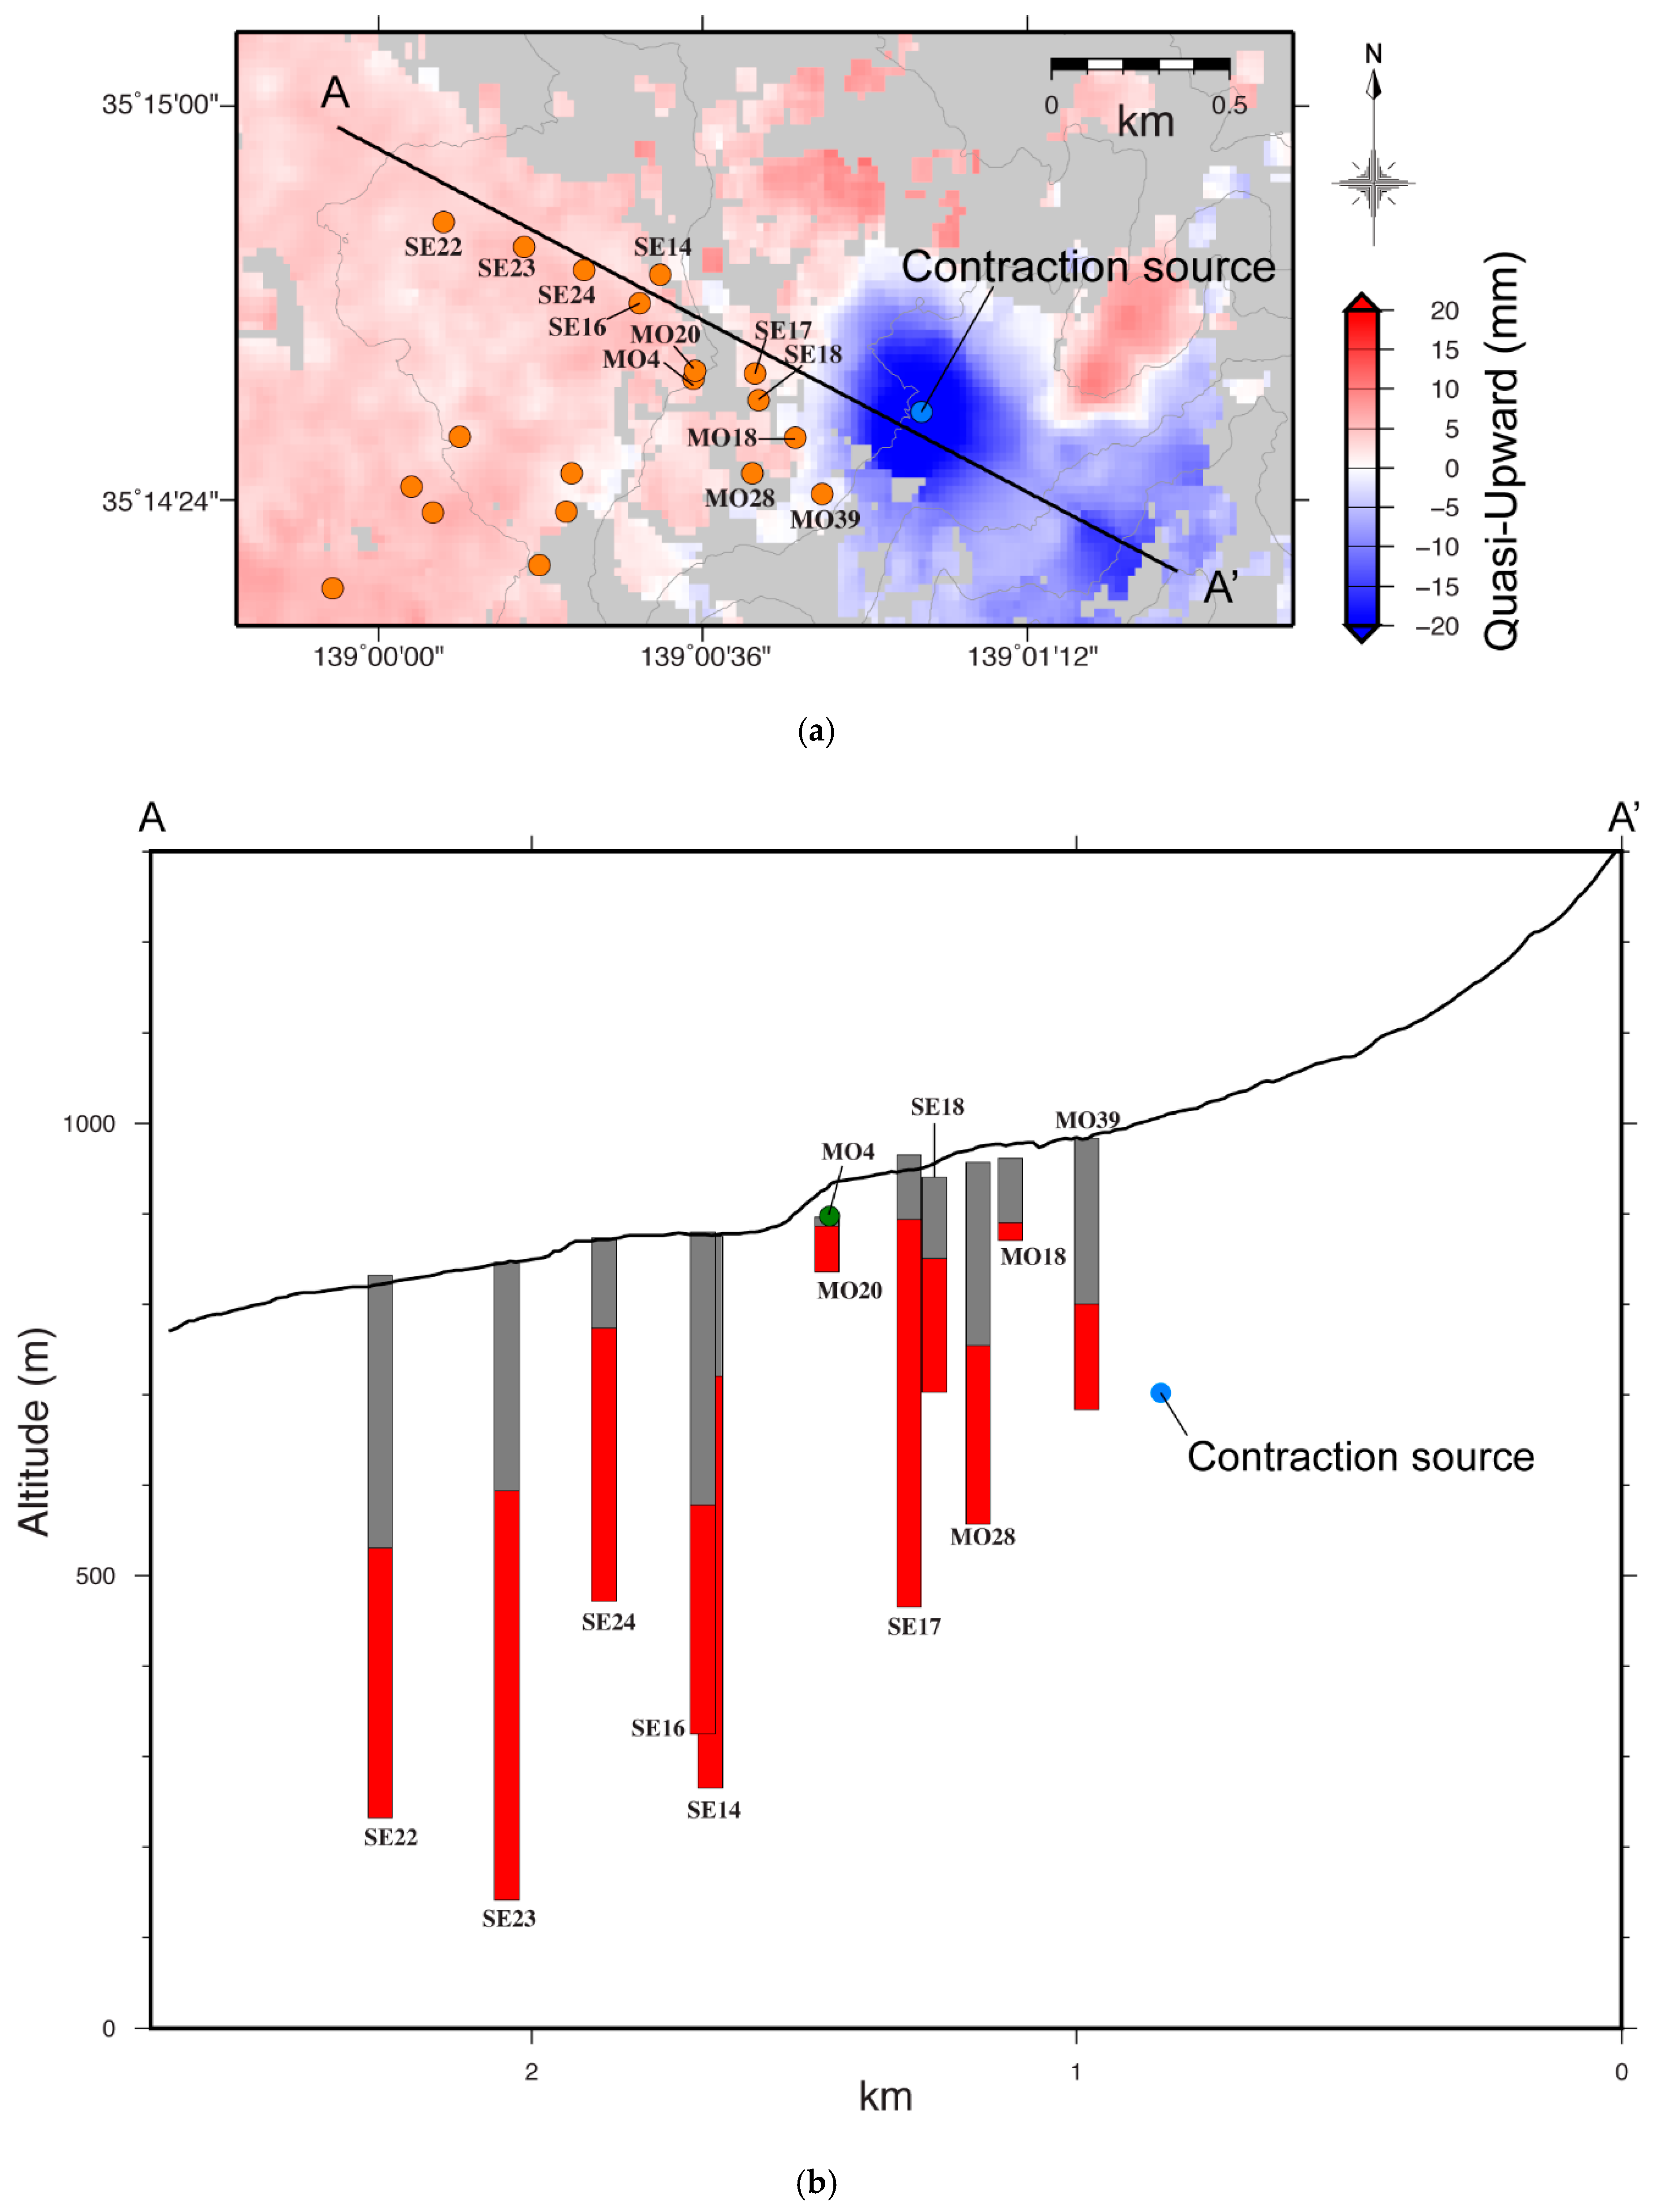
3.3. 2.5-D Analysis
3.4. Modeling
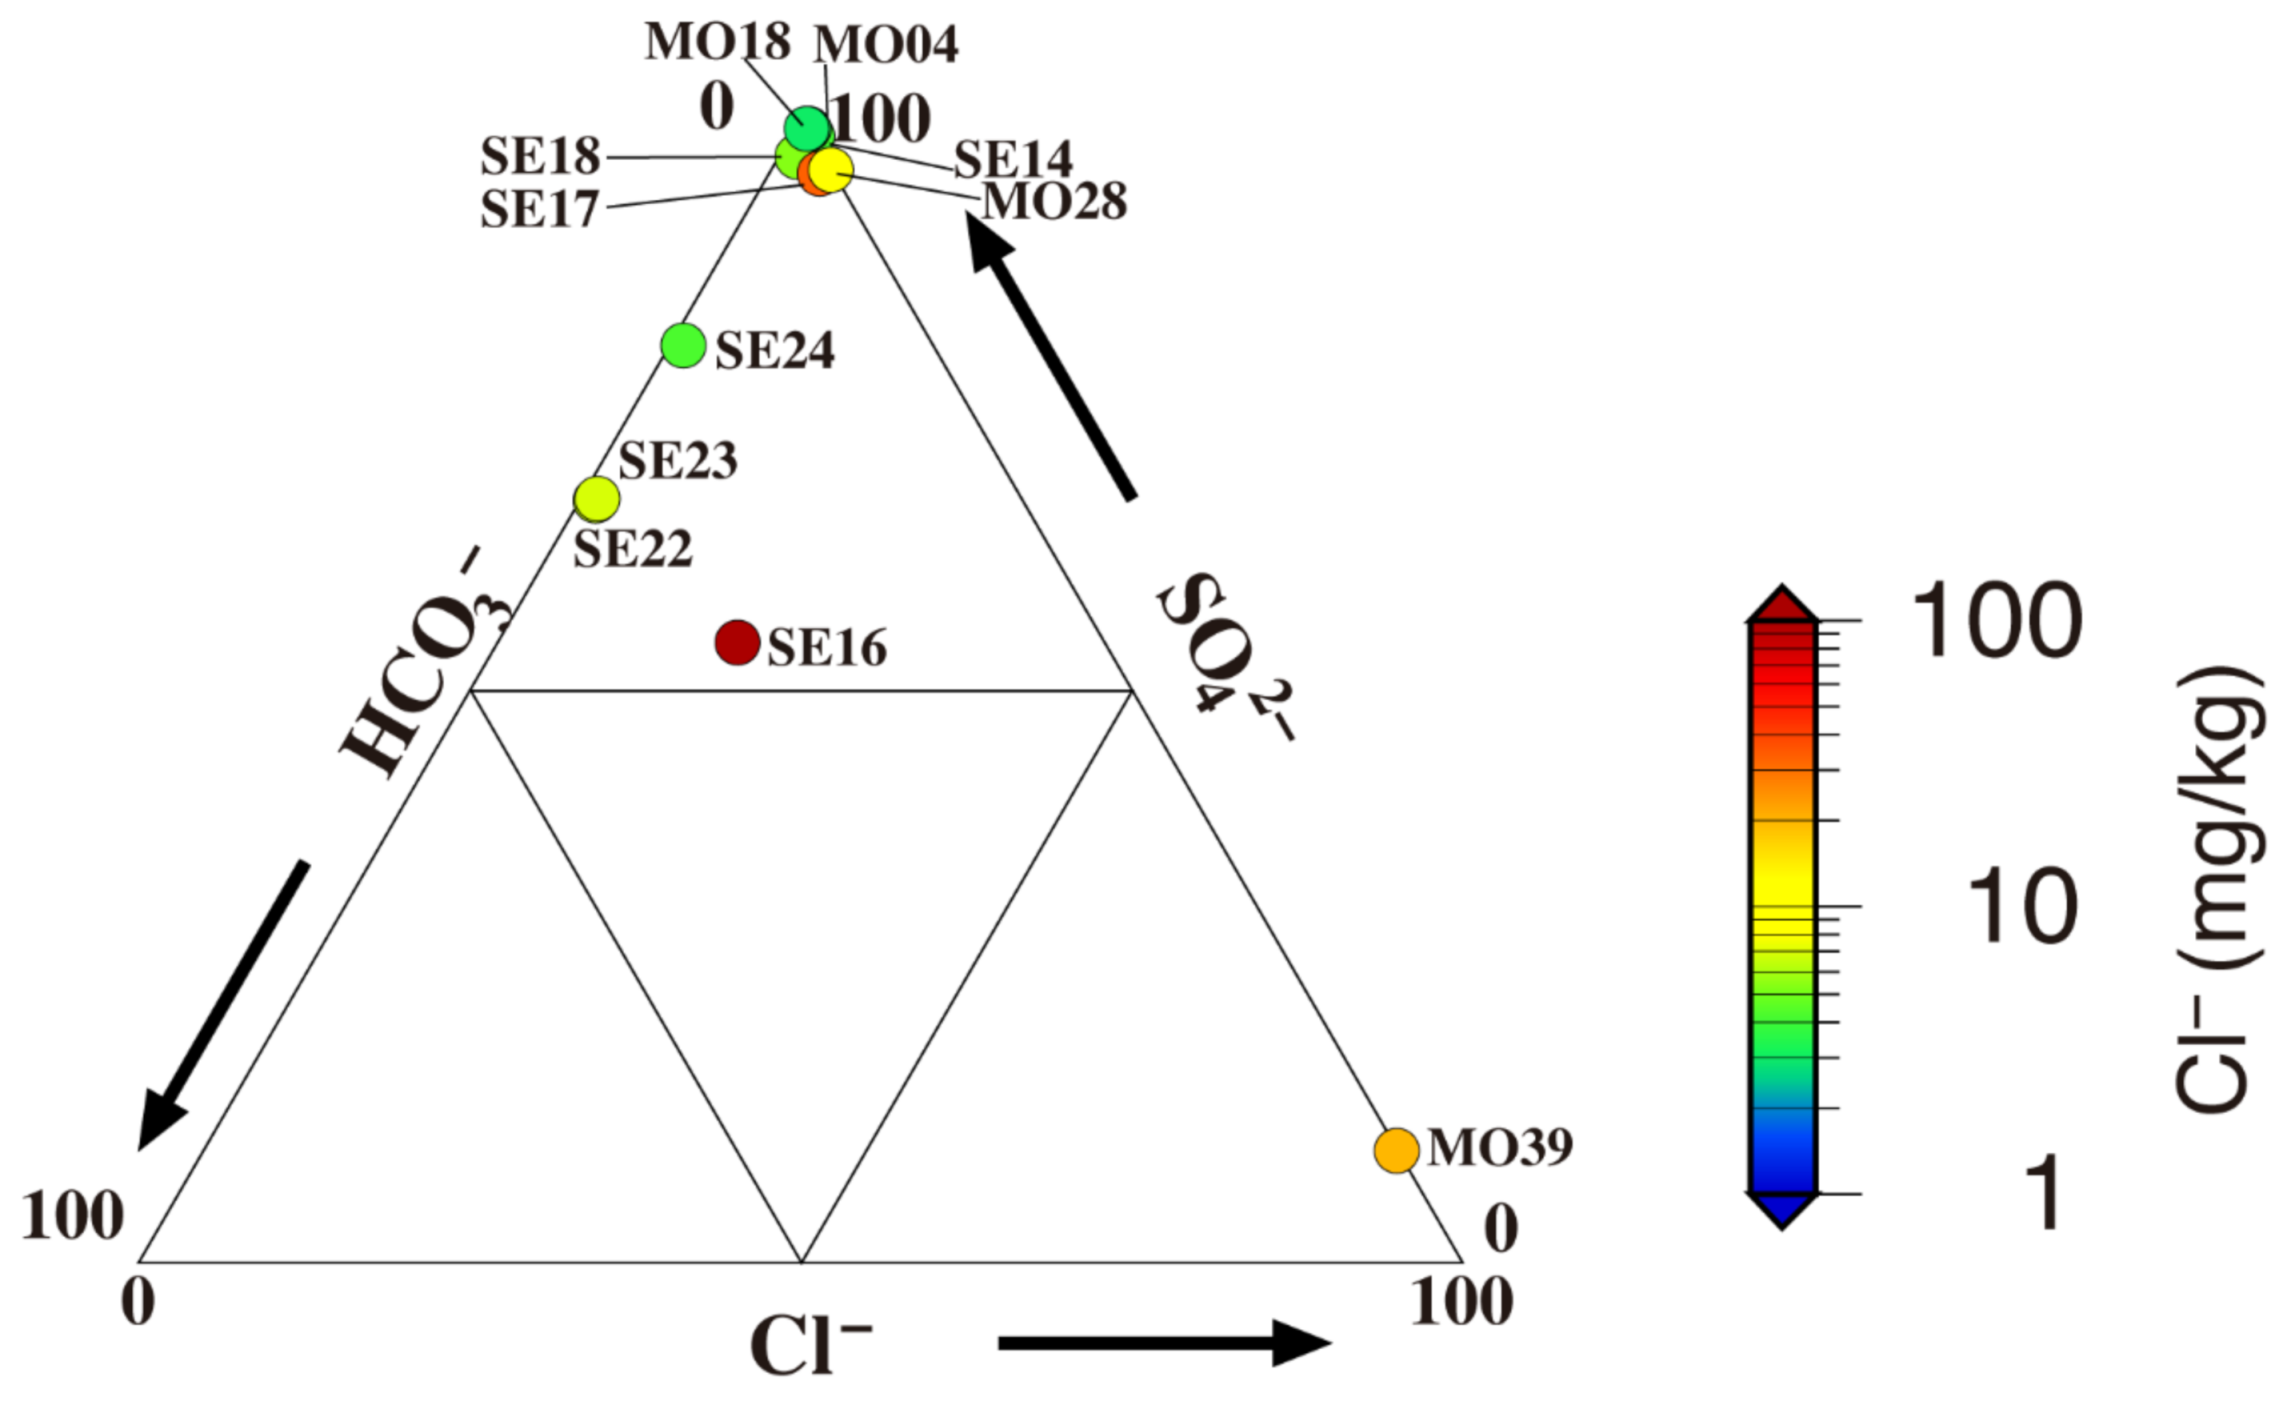
4. Discussion
5. Conclusions
Author Contributions
Funding
Acknowledgments
Conflicts of Interest
References
- Sato, C.; Haga, M.; Nishino, J. Land subsidence and groundwater management in Tokyo. Int. Rev. Environ. Strateg. 2006, 6, 403–424. [Google Scholar]
- Zhou, C.; Gong, H.; Chen, B.; Gao, M.; Cao, Q.; Cao, J.; Duan, L.; Zuo, J.; Shi, M. Land subsidence response to different land use types and water resource utilization in Beijing-Tianjin-Hebei, China. Remote Sens. 2020, 12, 457. [Google Scholar] [CrossRef]
- Matsuda, T. Collision of the Izu-Bonin Arc with Central Honshu: Cenozoic tectonics of the Fossa Magna, Japan. J. Phys. Earth 1978, 26, S409–S420. [Google Scholar] [CrossRef]
- Geological Society of Japan Eds. Geological leaflet 1 Hakone Volcano; Geological Society of Japan: Tokyo, Japan, 2007. (In Japanese) [Google Scholar]
- Mannen, K.; Yukutake, Y.; Kikugawa, G.; Harada, M.; Itadera, K.; Takenaka, J. Chronology of the 2015 eruption of Hakone volcano, Japan: Geological background, mechanism of volcanic unrest and disaster mitigation measures during the crisis. Earth Planets Space 2018, 70, 68. [Google Scholar] [CrossRef]
- Geological Survey of Japan, AIST Eds. Seamless Digital Geological Map of Japan 1: 200,000. May 29, 2015 Version; Geological Survey of Japan, National Institute of Advanced Industrial Science and Technology: Tukuba, Japan, 2015. [Google Scholar]
- Doke, R.; Harada, M.; Mannen, K.; Itadera, K.; Takenaka, J. InSAR analysis for detecting the route of hydrothermal fluid to the surface during the 2015 phreatic eruption of Hakone Volcano, Japan. Earth Planets Space 2018, 70, 63. [Google Scholar] [CrossRef]
- Yukutake, Y.; Ito, H.; Honda, R.; Harada, M.; Tanada, T.; Yoshida, A. Fluid-induced swarm earthquake sequence revealed by precisely determined hypocenters and focal mechanisms in the 2009 activity at Hakone volcano, Japan. J. Geophys. Res. 2011, 116, B4. [Google Scholar] [CrossRef]
- Oki, Y.; Hirano, T. The geothermal system of the Hakone volcano. Geothermics 1970, 2, 1157–1166. [Google Scholar] [CrossRef]
- Berardino, P.; Fornaro, G.; Lanari, R.; Sansosti, E. A new algorithm for surface deformation monitoring based on small baseline differential SAR interferograms. IEEE Trans. Geosci. Remote Sens. 2002, 40, 2375–2383. [Google Scholar] [CrossRef]
- Rosenqvist, A.; Shimada, M.; Ito, N.; Watanabe, M. ALOS PALSAR: A Pathfinder mission for global-scale monitoring of the environment. IEEE Trans. Geosci. Remote Sens. 2007, 45, 3307–3316. [Google Scholar] [CrossRef]
- Pavlis, N.K.; Holmes, S.A.; Kenyon, S.C.; Factor, J.K. The development and evaluation of the Earth Gravitational Model 2008 (EGM2008). J. Geophys. Res. Solid Earth 2012, 117, B4. [Google Scholar] [CrossRef]
- Goldstein, R.M.; Werner, C.L. Radar interferogram filtering for geophysical applications. Geophys. Res. Lett. 1998, 25, 4035–4038. [Google Scholar] [CrossRef]
- Costantini, M. A novel phase unwrapping method based on network programming. IEEE Trans. Geosci. Remote Sens. 1998, 36, 813–821. [Google Scholar] [CrossRef]
- Fujiwara, S.; Nishimura, T.; Murakami, M.; Nakagawa, H.; Tobita, M.; Rosen, P.A. 2.5-D surface deformation of M6.1 earthquake near Mt Iwate detected by SAR interferometry. Geophys. Res. Lett. 2000, 27, 2049–2052. [Google Scholar] [CrossRef]
- Sagiya, T. A decade of GEONET: 1994–2003—The continuous GPS observation in Japan and its impact on earthquake studies. Earth Planets Space 2004, 56, 8. [Google Scholar] [CrossRef]
- Hao, M.; Li, Y.; Zhuang, W. Crustal movement and strain distribution in East Asia revealed by GPS observations. Sci. Rep. 2019, 9, 16797. [Google Scholar] [CrossRef]
- Harada, M.; Hosono, K.; Kobayashi, A.; Yukutake, Y.; Yoshida, A. Extensional strains around Mt. Fuji and Hakone Volcano and low-frequency earthquakes. Bull. Volcanol. Soc. Jpn. 2010, 55, 193–199, (In Japanese with English abstract). [Google Scholar] [CrossRef]
- Mitsui, Y.; Kato, T. Magmatic inflation in 2008–2010 at Mt. Fuji, Japan, inferred from sparsity-promoting L1 inversion of GNSS data. J. Volcanol. Geotherm. Res. 2019, 378, 29–34. [Google Scholar] [CrossRef]
- Mogi, K. Relations between the eruptions of various volcanoes and the deformations of the ground surfaces around them. Bull. Earthq. Res. Inst. 1958, 36, 99–134. [Google Scholar]
- Marquardt, D.W. An algorithm for least-squares estimation of nonlinear parameters. J. Soc. Ind. Appl. Math. 1963, 11, 431–441. [Google Scholar] [CrossRef]
- Ohsawa, S.; Yusa, Y.; Oyama, M. Information of geothermal system beneath Hakone Volcano, Japan, obtained by chemical compositions of discharged gases. J. Hot Spring Sci. 2000, 49, 151–161, (In Japanese with English abstract). [Google Scholar]
- Yukutake, Y.; Honda, R.; Harada, M.; Arai, R.; Matsubara, M. A magma-hydrothermal system beneath Hakone volcano, central Japan, revealed by highly resolved velocity structures. J. Geophys. Res. Solid Earth 2015, 120, 3293–3308. [Google Scholar] [CrossRef]
- Kobayashi, T.; Morishita, Y.; Munekane, H. First detection of precursory ground inflation of a small phreatic eruption by InSAR. Earth Planet. Sci. Lett. 2018, 491, 244–254. [Google Scholar] [CrossRef]
- Sunaga, T. Vidal’s Hakone and Atami Onsen travelogue—A French doctor’s survey of the hot springs in 1872. Onsen 2003, 71, 4–12, (In Japanese and title was translated). [Google Scholar]
- Mannen, K. Overheated steams in Owakidani fumarolic area; history and cause of extinction. Bull. Hot Springs Res. Inst. Kanagawa Prefect. 2009, 41, 23–32, (In Japanese with English abstract). [Google Scholar]
- Wessel, P.; Smith, W.H.F.; Scharroo, R.; Luis, J.; Wobbe, F. Generic mapping tools: Improved version released. Eos Trans. Am. Geophys. Union 2013, 94, 409–410. [Google Scholar] [CrossRef]


| Ascending 407-690 | Descending 59-2910 |
|---|---|
| 27 July 2006 1 | 29 September 2006 |
| 11 September 2006 | 14 November 2006 |
| 14 June 2007 | 30 December 2006 |
| 30 July 2007 | 17 August 2007 |
| 14 September 2007 | 02 October 2007 2 |
| 30 October 2007 | 17 November 2007 |
| 15 December 2007 | 02 January 2008 |
| 30 January 2008 | 03 April 2008 |
| 16 March 2008 | 19 May 2008 |
| 01 May 2008 | 19 August 2008 |
| 16 June 2008 1 | 04 October 2008 |
| 01 August 2008 1 | 19 November 2008 |
| 16 September 2008 | 22 May 2009 |
| 17 December 2008 | 22 August 2009 |
| 01 February 2009 | 07 October 2009 |
| 19 June 2009 | 22 November 2009 |
| 04 August 2009 | 25 May 2010 |
| 20 December 2009 | 10 July 2010 |
| 04 February 2010 | 25 August 2010 |
| 22 March 2010 | 10 October 2010 |
| 07 May 2010 2 | 25 November 2010 |
| 07 August 2010 | 12 April 2011 1 |
| 23 December 2010 | |
| 07 February 2011 |
| Volume Variation (m3/year) | Altitude (m) 1 | East(°) 2 | North(°) 2 |
|---|---|---|---|
| −1.04 × 10⁴ | 701.6 | 139.016746 | 35.242233 |
© 2020 by the authors. Licensee MDPI, Basel, Switzerland. This article is an open access article distributed under the terms and conditions of the Creative Commons Attribution (CC BY) license (http://creativecommons.org/licenses/by/4.0/).
Share and Cite
Doke, R.; Kikugawa, G.; Itadera, K. Very Local Subsidence Near the Hot Spring Region in Hakone Volcano, Japan, Inferred from InSAR Time Series Analysis of ALOS/PALSAR Data. Remote Sens. 2020, 12, 2842. https://doi.org/10.3390/rs12172842
Doke R, Kikugawa G, Itadera K. Very Local Subsidence Near the Hot Spring Region in Hakone Volcano, Japan, Inferred from InSAR Time Series Analysis of ALOS/PALSAR Data. Remote Sensing. 2020; 12(17):2842. https://doi.org/10.3390/rs12172842
Chicago/Turabian StyleDoke, Ryosuke, George Kikugawa, and Kazuhiro Itadera. 2020. "Very Local Subsidence Near the Hot Spring Region in Hakone Volcano, Japan, Inferred from InSAR Time Series Analysis of ALOS/PALSAR Data" Remote Sensing 12, no. 17: 2842. https://doi.org/10.3390/rs12172842
APA StyleDoke, R., Kikugawa, G., & Itadera, K. (2020). Very Local Subsidence Near the Hot Spring Region in Hakone Volcano, Japan, Inferred from InSAR Time Series Analysis of ALOS/PALSAR Data. Remote Sensing, 12(17), 2842. https://doi.org/10.3390/rs12172842