Article

Preliminary Observations from the China Fengyun-4A Lightning Mapping Imager and Its Optical Radiation Characteristics

1
National Satellite Meteorological Center, China Meteorological Administration, Beijing 100081, China
2
State Key Laboratory of Severe Weather, Chinese Academy of Meteorological Sciences, Beijing 100081, China
3
School of Electrical Engineering and Automation, Harbin Institute of Technology, Harbin 150001, China
*
Author to whom correspondence should be addressed.
Remote Sens. 2020, 12(16), 2622; https://doi.org/10.3390/rs12162622
Submission received: 7 July 2020 / Revised: 5 August 2020 / Accepted: 11 August 2020 / Published: 14 August 2020
(This article belongs to the Special Issue Earth Observations in Asia-Oceania)

Abstract

:
The Fengyun-4A (FY-4A) Lightning Mapping Imager (LMI) is the first satellite-borne lightning imager developed in China, which can detect lightning over China and its neighboring regions based on a geostationary satellite platform. In this study, the spatial distribution and temporal variation characteristics of lightning activity over China and its neighboring regions were analyzed in detail based on 2018 LMI observations. The observation characteristics of the LMI were revealed through a comparison with the Tropical Rainfall Measuring Mission (TRMM)-Lightning Imaging Sensor (LIS) and World Wide Lightning Location Network (WWLLN) observations. Moreover, the optical radiation characteristics of lightning signals detected by the LMI were examined. Factors that may affect LMI detection were discussed by analyzing the differences in optical radiation characteristics between LMI and LIS flashes. The results are as follows. Spatially, the flash density distribution pattern detected by the LMI was similar to those detected by the LIS and WWLLN. High-flash density regions were mainly concentrated over Southeastern China and Northeastern India. Temporally, LMI flashes exhibited notable seasonal and diurnal variation characteristics. The LMI detected a concentrated lightning outbreak over Northeastern India in the premonsoon season and over Southeastern China in the monsoon season, which was consistent with LIS and WWLLN observations. LMI-observed diurnal peak flash rates occurred in the afternoon over most of the regions. There was a “stepwise” decrease in the LMI-observed optical radiance, footprint size, duration, and number of groups per flash, from the ocean to the coastal regions to the inland regions. LMI flashes exhibited higher optical radiance but lasted for shorter durations than LIS flashes. LMI observations are not only related to instrument performance but are also closely linked to onboard and ground data processing. In future, targeted improvements can be made to the data processing algorithm for the LMI to further enhance its detection capability.

Graphical Abstract

1. Introduction

Lightning is an ultra-long-distance electric discharge phenomenon in the atmosphere and is a product of a convective weather system at a certain development stage [1,2]. Lightning is generally formed in cumulonimbus clouds with strong convection. Dense lightning often accompanies disastrous weather events (e.g., rainstorms, hail, and gales). In addition, lightning activity also plays a vital role in maintaining the current balance between the ionosphere and the Earth, as well as the formation of nitrogen oxides in the global nitrogen cycle [3,4,5]. Therefore, effectively monitoring lightning signals is of great significance for studying lightning as an indicator of convective weather, as well as the effects of lightning on the atmospheric environment and climate [6,7,8,9].
In the 1970s, a breakthrough was made in ground-based lightning detection technology by capturing the electromagnetic radiation characteristics of cloud-to-ground (CG) lightning at the instant of its return strokes [10]. Later, very low frequency (VLF)/low frequency- and very high frequency (VHF)-based lightning detection methods were developed [11,12,13,14,15]. To date, several countries have established regional or global ground-based lightning location networks. The following networks are representative VLF/LF lightning location networks: the U.S. National Lightning Detection Network (NLDN; a regional network) [14,15], the European Lightning Detection Network (LINET; a regional network) [16], China’s Advanced Time of Arrival and Direction System (ADTD; a regional network) [17,18], the World Wide Lightning Location Network (WWLLN; a global network) [19,20], and the Global Lightning Dataset 360 (GLD360; a global network) [21,22]. The following networks are representative VHF lightning location networks: the Lightning Detection And Ranging (LDAR) network [23], the Lightning Mapping Array (LMA) [24], the Earth Networks Total Lightning Network (ENTLN) [25], and the Surveillance et Alerte Foudre par Interférometrie Radioélectrique (SAFIR) [26].
In the 1990s, optical imaging-based lightning detection technology was successfully tested on two low-orbit satellite-borne lightning imagers, namely, the MicroLab-1 Optical Transient Detector (OTD) and the Tropical Rainfall Measuring Mission (TRMM)-Lightning Imaging Sensor (LIS) [27,28,29]. Satellite-borne lightning imagers can detect total lightning, including cloud lightning, intracloud (IC) lightning, and CG lightning and are not limited by land surface conditions. Despite this, due to the limitations of the observation platform, a low-orbit satellite-borne lightning imager is highly limited in terms of view time for all locations. For example, the view time of the OTD is 1–270 s, while the view time of the LIS is approximately 90 s [30,31]. As a result, these imagers can only provide regional-average lightning distribution information, which has led to the development of geostationary satellite-based lightning detection technology. Geostationary satellite-borne lightning imagers can continuously monitor lightning activity within the field of view (FOV) in real time and are considered to be the most effective means for lightning detection [32,33,34]. Currently, the U.S., China, and the European Union are the primary developers of geostationary satellite-borne lightning imagers. The U.S. Geostationary Lightning Mappers (GLMs) are now in orbit onboard the Geostationary Operational Environmental Satellites (GOES)-16 and 17 [35,36,37,38,39,40], which were launched at the end of 2016 and in early 2018, respectively. China’s Lightning Mapping Imager (LMI) is onboard the Fengyun-4A (FY-4A) satellite [41,42,43,44], which was launched at the end of 2016. The Meteosat Third Generation (MTG) satellite of the European Organization for the Exploitation of Meteorological Satellites (EUMETSAT), carrying the Lightning Imager (LI), is slated to be launched in 2021 [45,46,47,48].
The FY-4A LMI is the first satellite-borne lightning imager developed in China and is designed to continuously observe lightning over China and its neighboring regions in real time to track and provide early warnings of strong convective weather. The detection efficiency (DE) greater than 90% and the false alarm rate (FAR) less than 10% are the design indices of the LMI [49,50]. After launch, the functions and performance of the LMI were tested in orbit for the whole year during 2017 [41,50]. In addition, the ground data processing algorithm for the LMI was also improved based on the preliminary test results. To effectively use LMI data, it is necessary to understand their characteristics more comprehensively, which is the focus of this study. In this study, the characteristics of lightning activity and the optical radiation characteristics of lightning signals over China and its neighboring regions were derived from relevant 2018 FY-4A LMI data. Moreover, factors that may affect LMI detection were also discussed through a comparison with TRMM LIS and WWLLN observations.

2. Materials and Methods

2.1. FY-4A LMI

The FY-4A LMI detects lightning flashes using spectral, spatial and temporal filtering, and background subtraction techniques [41,49]. The LMI uses ultranarrow bandpass filters with a central wavelength of 777.4 nm and a bandwidth of 1 nm. It constitutes two optical heads, each of which focuses the image on a 400 pixels × 300 pixels charge-coupled device (CCD) focal plane. FY-4A LMI has a spatial resolution of 7.8 km at nadir and a frame rate of 2 ms. Then, the signal is read out from the focal plane into the Real-Time Event Processor (RTEP) for lightning event detection and data compression. Since the FY-4A satellite platform needs to change its observation direction, the LMI observes the Northern Hemisphere from mid-March to mid-September each year, covering most land and sea regions of China and the neighboring regions [50], as shown in Figure 1. For the remainder of the year, the LMI observes the Southern Hemisphere, covering Western and central Australia and the neighboring waters.
FY-4A LMI products mainly include lightning event data and events clustering-formed group and flash data [41]. Events are the basic output units for lightning detection. The LMI Level 1 (L1) products are events after radiation calibration, geolocation, and preliminary filtering of the false lightning signals. LMI Level 2 (L2) products include events after filtering of the false lightning signals, groups, and flashes, which were used in this study. LMI L2 event data mainly provide information on the time of occurrence, location, and radiation intensity of events. LMI L2 group data mainly provide information on the time of occurrence, location, radiation intensity, and radiation areas of groups, as well as the number of inclusive events in the group. LMI L2 flash data mainly provide information on the time of occurrence, duration, location, radiation intensity, and radiation areas of flashes, as well as the number of inclusive groups in the flash.

2.2. TRMM LIS

The LIS on the TRMM observes lightning along the orbital track of the satellite poleward to 38° and views any ground location within its FOV for approximately 90 s [31,51]. The total FOV exceeds 580 km × 580 km by using a 128 × 128 CCD array. The LIS can extract weak and transient lightning signals from the bright background based on spatial, spectral, and temporal filtering techniques and a frame-by-frame background subtraction technique. For optimal sampling of the lightning signals, the LIS uses a 1-nm filter at 777.4 nm with a 4-km pixel FOV (nadir) and a 2-ms frame rate. Meanwhile, the optimal subtraction of background signals is processed at each pixel. The design specification of LIS proposed a 90% flash detection efficiency, although the variability in the related radiance threshold with time-of-day and across the FOV were not specified [28,52,53,54]. Boccippio et al. [29] modeled the instrument detection efficiency for the pulse radiance distributions and found that the flash detection efficiencies of the TRMM LIS were 93% ± 4% and 73% ± 11% for night and local noon, respectively. Moreover, its estimated location accuracy (LA) was 1 pixel [28].
In this study, the orbital LIS dataset was used. It not only provides lightning and orbit information but also provides the background image summaries. We mainly used the data of events, groups, and flashes. For each individual event, the time of occurrence, location, radiance, and footprint (i.e., the spatial extent) were given. For each individual group, its time of occurrence, location, radiance, footprint, and the number of events were given. For each individual flash, the time of occurrence, duration, location, radiance, footprint, and the number of events and groups were given. In addition, Albrecht et al.’s [31] method was employed to correct the LIS data for the view time.

2.3. WWLLN

WWLLN is a global very low frequency (VLF; 3–30 kHz) lightning location system, which was in operation in 2004 and comprised over 70 participating stations by January 2013 [20,55]. WWLLN locates real-time lightning strokes and is able to detect the CG and few strong IC flashes [56,57,58,59,60]. It works on the time of group arrival (TOGA) technique [61]. The precise time that the VLF signals arrive at each station is obtained by a global positioning system (GPS). Each station analyzes the measured waveforms and sends the arrival time to the central station in real time. When at least 5 stations in the station network detect the same VLF signal, the lightning stroke is located [62]. As of January 2013, the overall stroke DE of WWLLN is approximately 11% and the LA is 5 km [20]. The DE and LA are changing with the region because of the variable station coverage and the strong effect on VLF radio propagation from orography and ionospheric conditions along the great circle path of a wave [63]. In addition, the WWLLN performance can improve over time due to an increase in the number of sensors [19] and improvements in waveform processing algorithms [64].
The WWLLN dataset used in this study mainly provides the occurrence time, latitude, and longitude of the lightning strokes. A ground-based lightning location network always determines the geographical location of each stroke in a flash separately [65]. Therefore, the WWLLN strokes were grouped into flashes in this study to analyze the corresponding flash activities. The grouping algorithm is based on time and space criteria of 0.5 s and 30 km, respectively [66]. Here, a “WWLLN flash” is a collection of strokes that occur near each other in time and space and are not necessarily part of the same lightning flash.

2.4. Analysis Methods

To reduce the errors introduced by FOV edge distortion, the area encircled by the red solid line within the FOV of the FY-4A LMI in Figure 1 was selected as the study area. LIS and WWLLN data for the same area were selected. In this study, LMI and WWLLN data were examined for the period of 20 March–18 September 2018 (UTC)—the observation period of the LMI for the Northern Hemisphere in 2018. The observation mode of the LIS only allows it to provide lightning data for regions over which its orbit passes. A sufficiently large sample size of LIS data can produce statistically reliable analysis results that reflect the characteristics of lightning activity in terms of the average climate. Thus, LIS data for the period of 20 March–18 September in each year between 1998 and 2013 were selected correspondingly. The grid cell of the lightning rate density was 0.1° × 0.1°, with units of events/groups/strokes/flashes km−2 day−1. The units of the lightning rate are events/groups/strokes/flashes day−1. When comparing the data collected by the three observation systems, the FOV of the TRMM LIS was used as the reference, and only the data for the region south of 38° N were calculated for the LMI and the WWLLN.
Note that WWLLN data were used in this study for three main reasons. Firstly, although the WWLLN has a low DE, a large number of studies have shown that WWLLN data can clearly reflect the characteristics of lightning activity in regional and global thunderstorms and strong convections [67,68,69,70,71,72,73]. Secondly, the WWLLN tends to observe high peak current return stroke lightning discharges. A comparison of LMI and WWLLN data can show whether the detection capability of LMI is related to the lightning intensity. Thirdly, for the WWLLN primarily observing CG lightning, it can be inferred whether the LMI has a tendency to detect different types of lightning by comparing the LMI and WWLLN data.
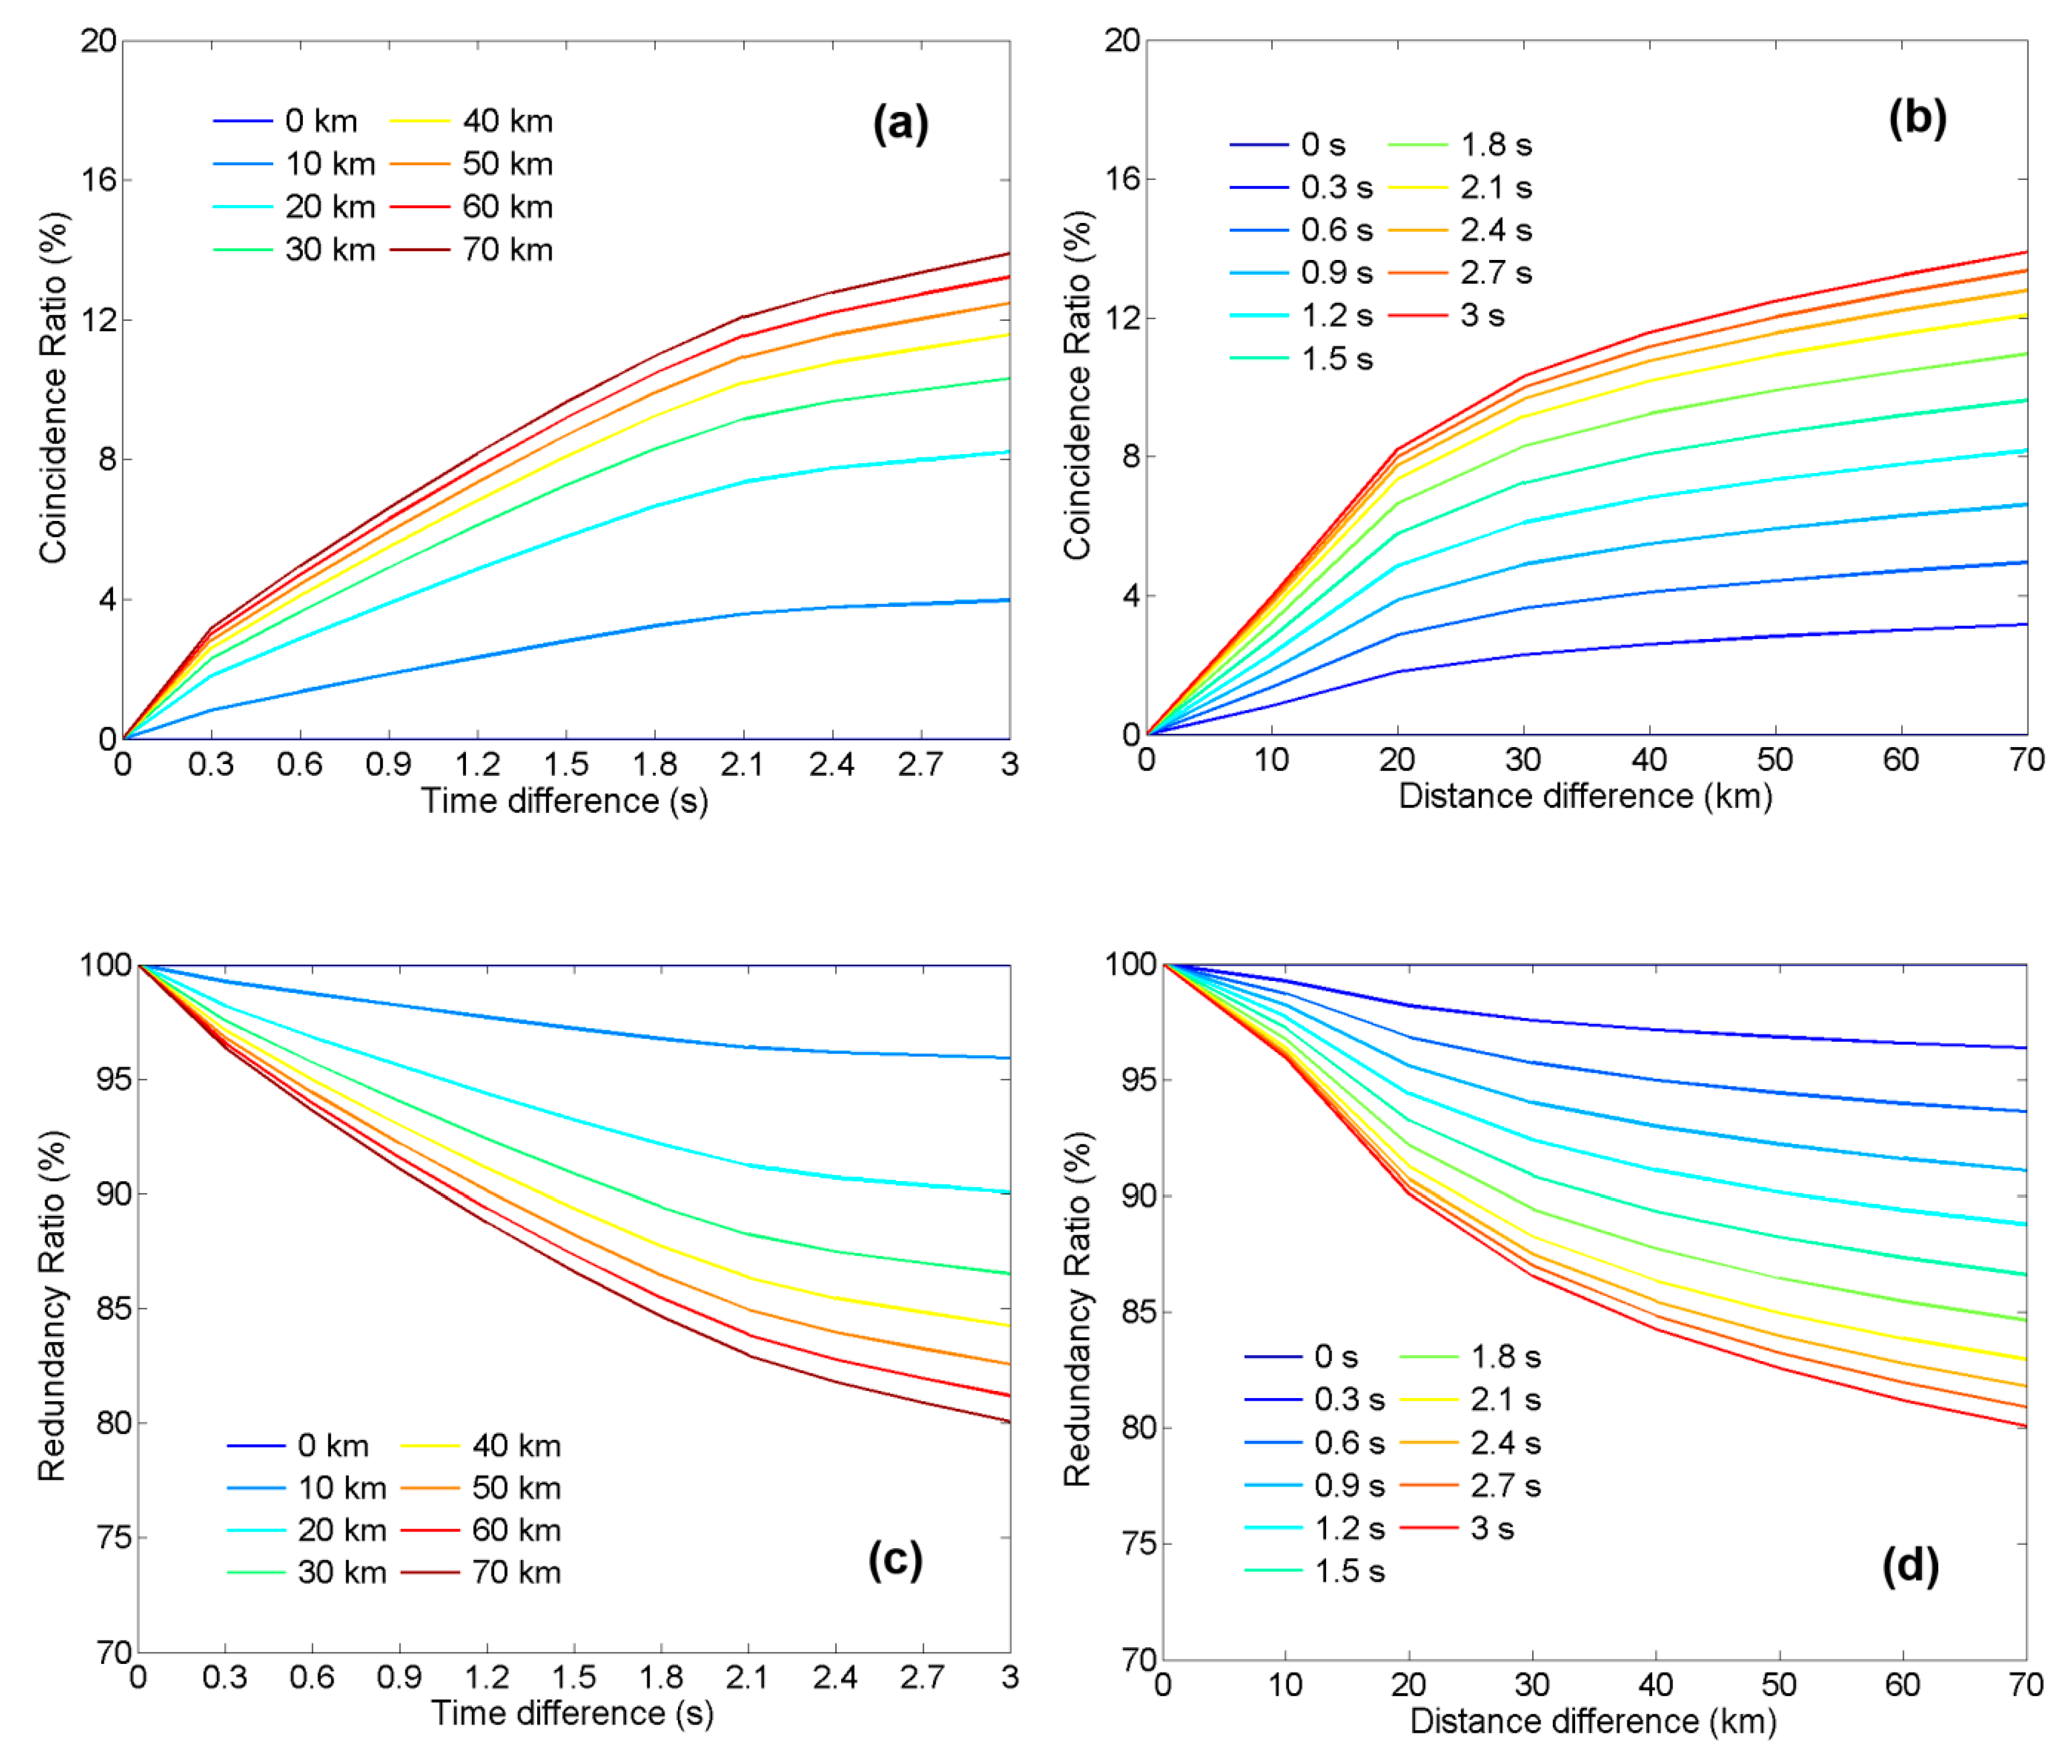
The coincidence ratio (CR) for the LMI groups and the WWLLN strokes is a measure of the degree of matching between the two systems and is defined as follows:
CR = N mat - sk N sk
where Nmat-sk is the number of WWLLN strokes that are coincident with LMI groups based on a specific time and space criteria, and Nsk is the total number of WWLLN strokes. Note that when a WWLLN stroke is coincident with more than one LMI group, Nmat-sk is set to 1. The CR is a numerical value that represents the ability of the LMI to detect WWLLN strokes and reflects the group DE to some extent.
The redundancy ratio (RR) for the LMI groups and the WWLLN strokes reflects the number of LMI groups missed by the WWLLN and is defined as follows:
RR = N r - gp N gp
where Nr-gp is the number of LMI groups that are not coincident with WWLLN strokes based on specific time and space criteria, and Ngp is the total number of LMI groups. The RR reflects the FAR of the LMI and the type of lightning detected by the LMI to a certain extent. Here, the CR and RR are inevitably affected by the DE of the WWLLN and are primarily used to directly compare the LMI and WWLLN data in Section 4.

3. Results

3.1. Spatial Distribution Characteristics of Lightning

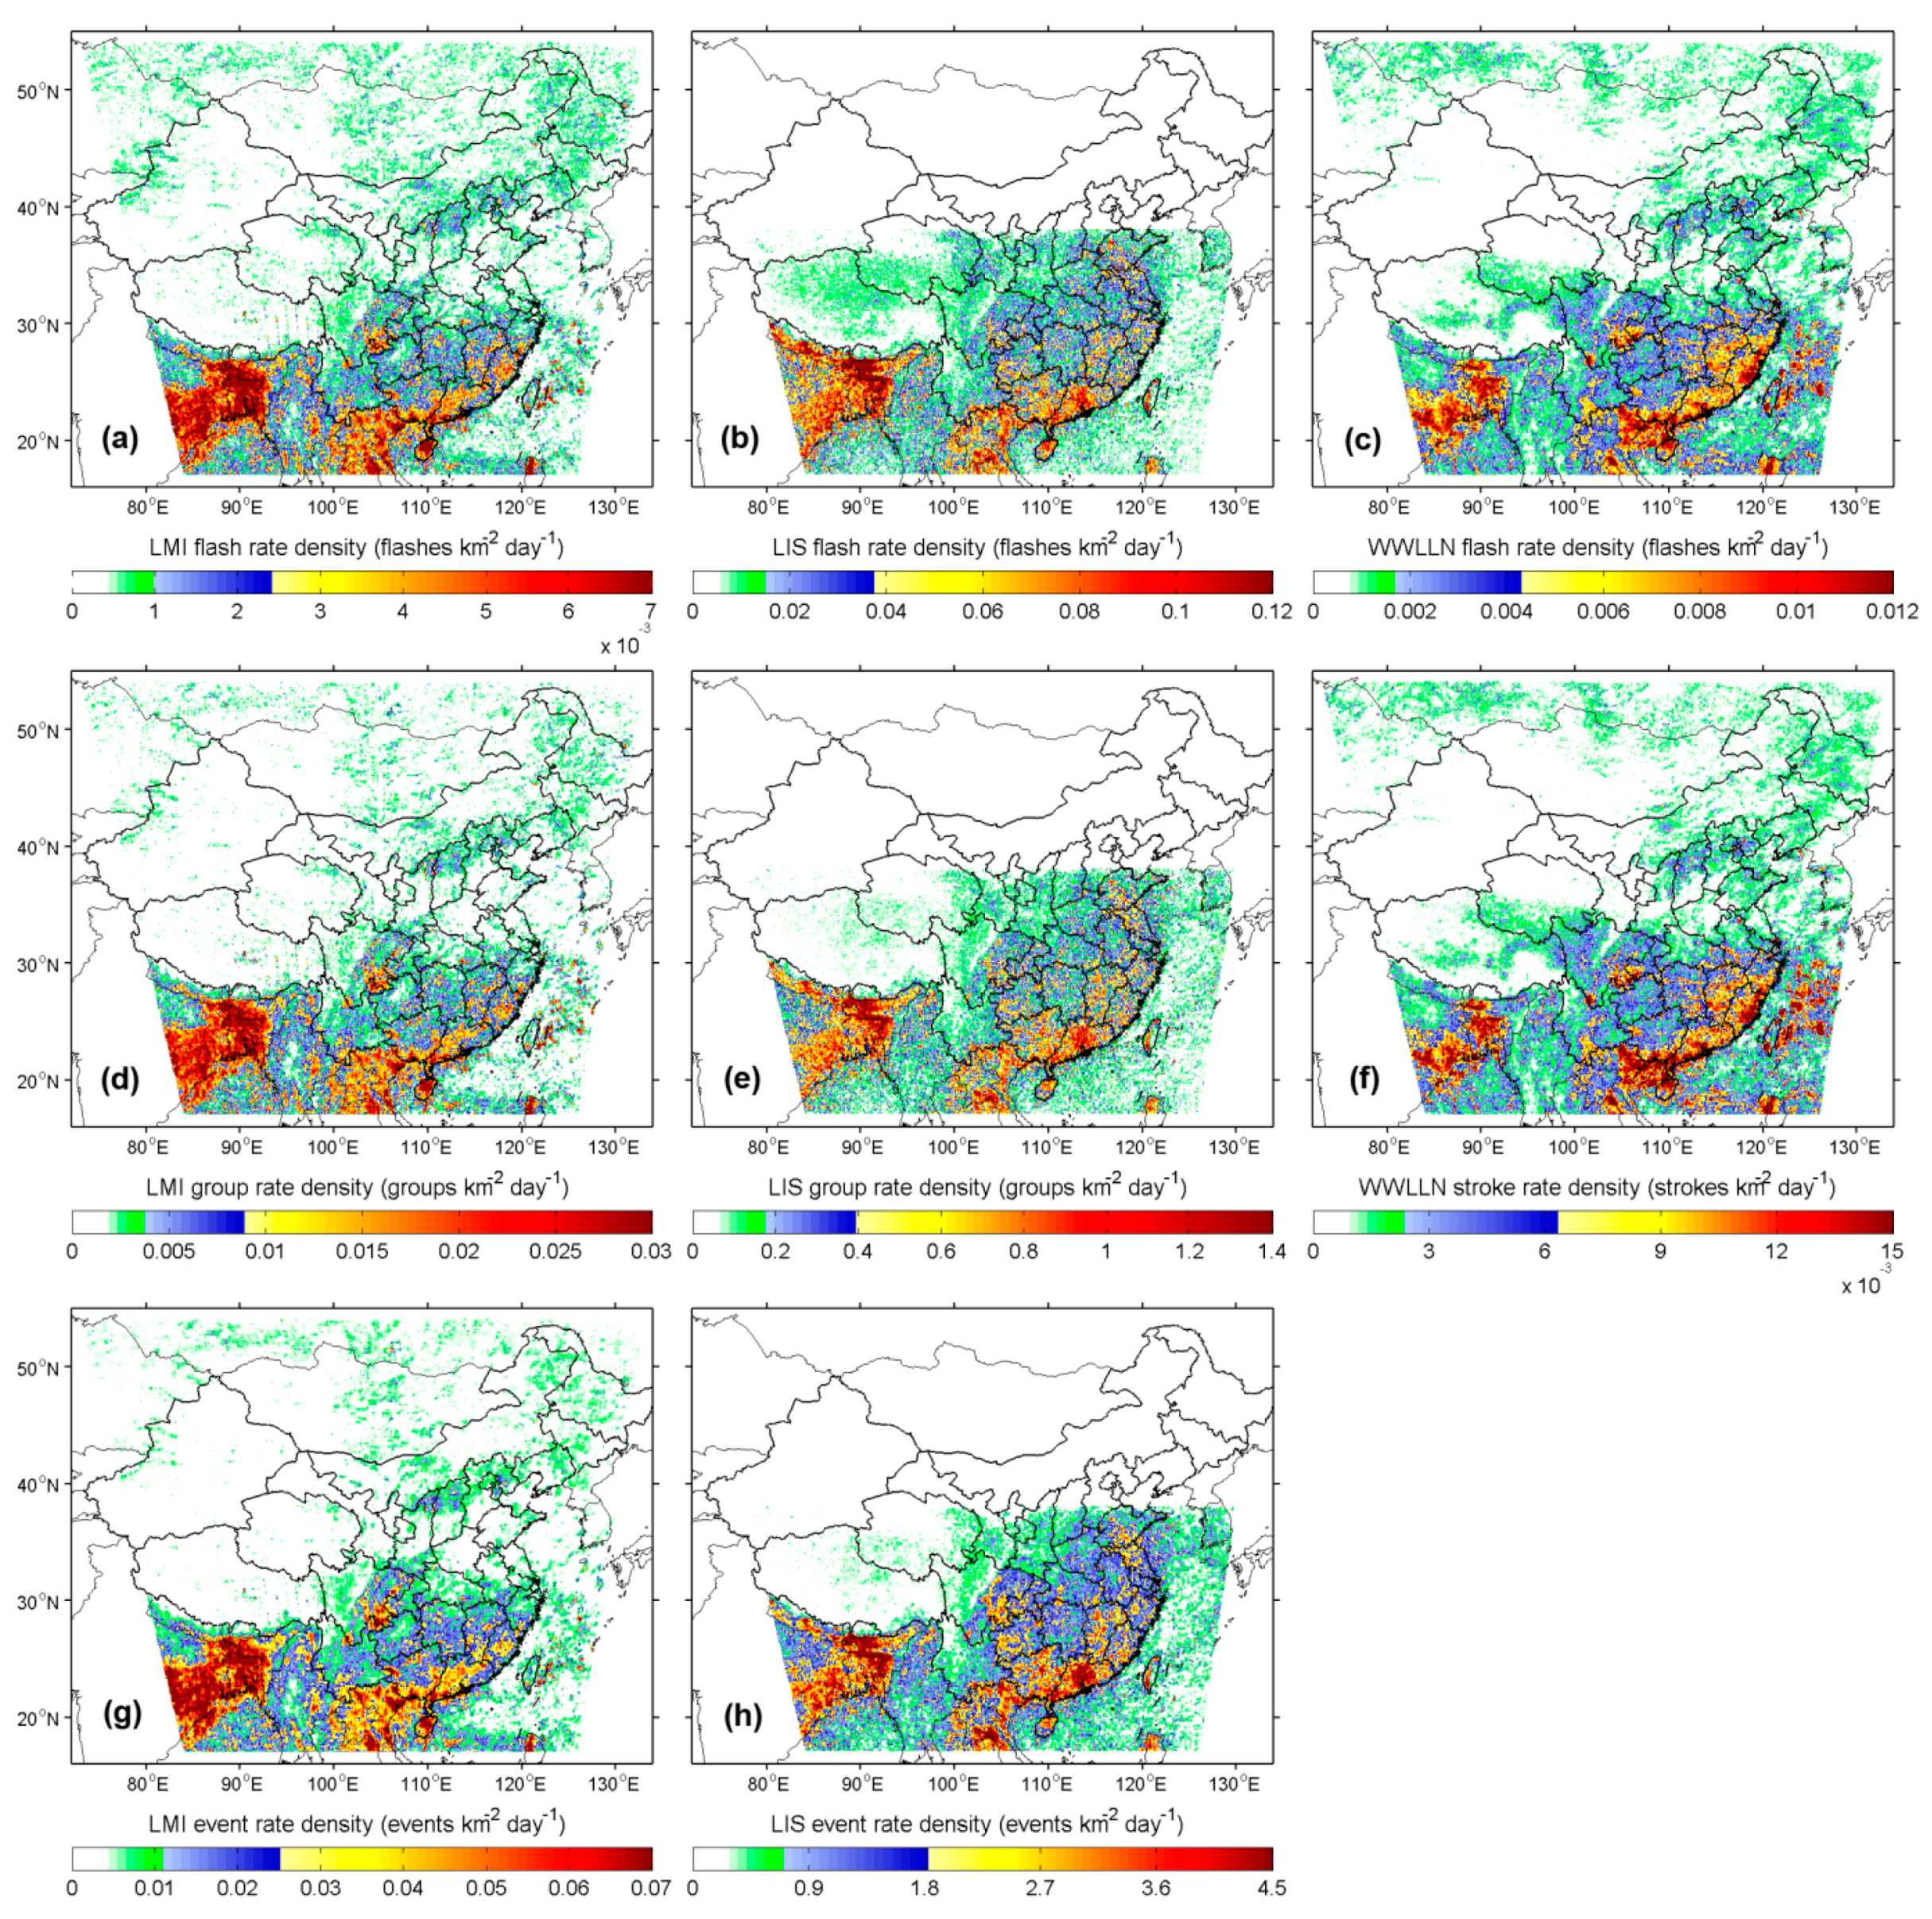
A flash detected by satellites can be regarded as a lightning flash process in nature [28]. Figure 2 shows the spatial distribution of lightning rate densities observed by the LMI, LIS, and WWLLN over China and its neighboring regions. LMI-observed high-flash density regions were mainly concentrated over Southern East China, Southern South China, Eastern Southwest China, Eastern Myanmar, Northern Thailand, Laos, and Vietnam, as well as the regions of India and Bangladesh at the southern foothills of the Himalayas (Figure 2a). LMI and LIS observations were similar in flash density distribution over most regions (Figure 2b) but somewhat different over some regions. Compared with LIS flashes, LMI flashes were more concentrated over Southern South China, Eastern Southwest China, and Northeastern India. The LMI observed several high-flash density regions over the waters off Eastern China, which were not observed by the LIS. LMI flashes were notably less concentrated than LIS flashes over Central and eastern China. Lightning activity was relatively weak over the Tibetan Plateau. However, LMI flashes were sparser than LIS flashes over this region. LMI and WWLLN observations were closer to one another (Figure 2c), compared with LIS observations. However, there was still a slight difference between LMI and WWLLN observations. Specifically, LMI flashes were more concentrated than WWLLN flashes over India, Bangladesh, Myanmar, Thailand, and Laos, whereas LMI flashes were less concentrated than WWLLN flashes over Southern East China, Southern South China, and the coastal waters of the East and South China Seas.
Lightning activity is relatively strongly correlated with water vapor in the upper troposphere [74,75]. In addition, lightning activity is also correlated with surface temperature, relative humidity, and convective available potential energy [76,77,78]. In the study area, the spatial distribution pattern of LMI flashes was basically consistent with those of the abovementioned environmental parameters [79,80,81,82,83]. According to the study by Hutchins et al. [20] on global lightning radiance, the differences between LMI and LIS observations may be because the LMI is more inclined to detect lightning with relatively high radiance. This concept will be further analyzed in Section 3.3. In addition to detection capability, the differences in spatial distribution between LMI and WWLLN flashes may also be related to the types of lightning observed by the two observation systems—the LMI observes total lightning, whereas the WWLLN primarily observes CG lightning.
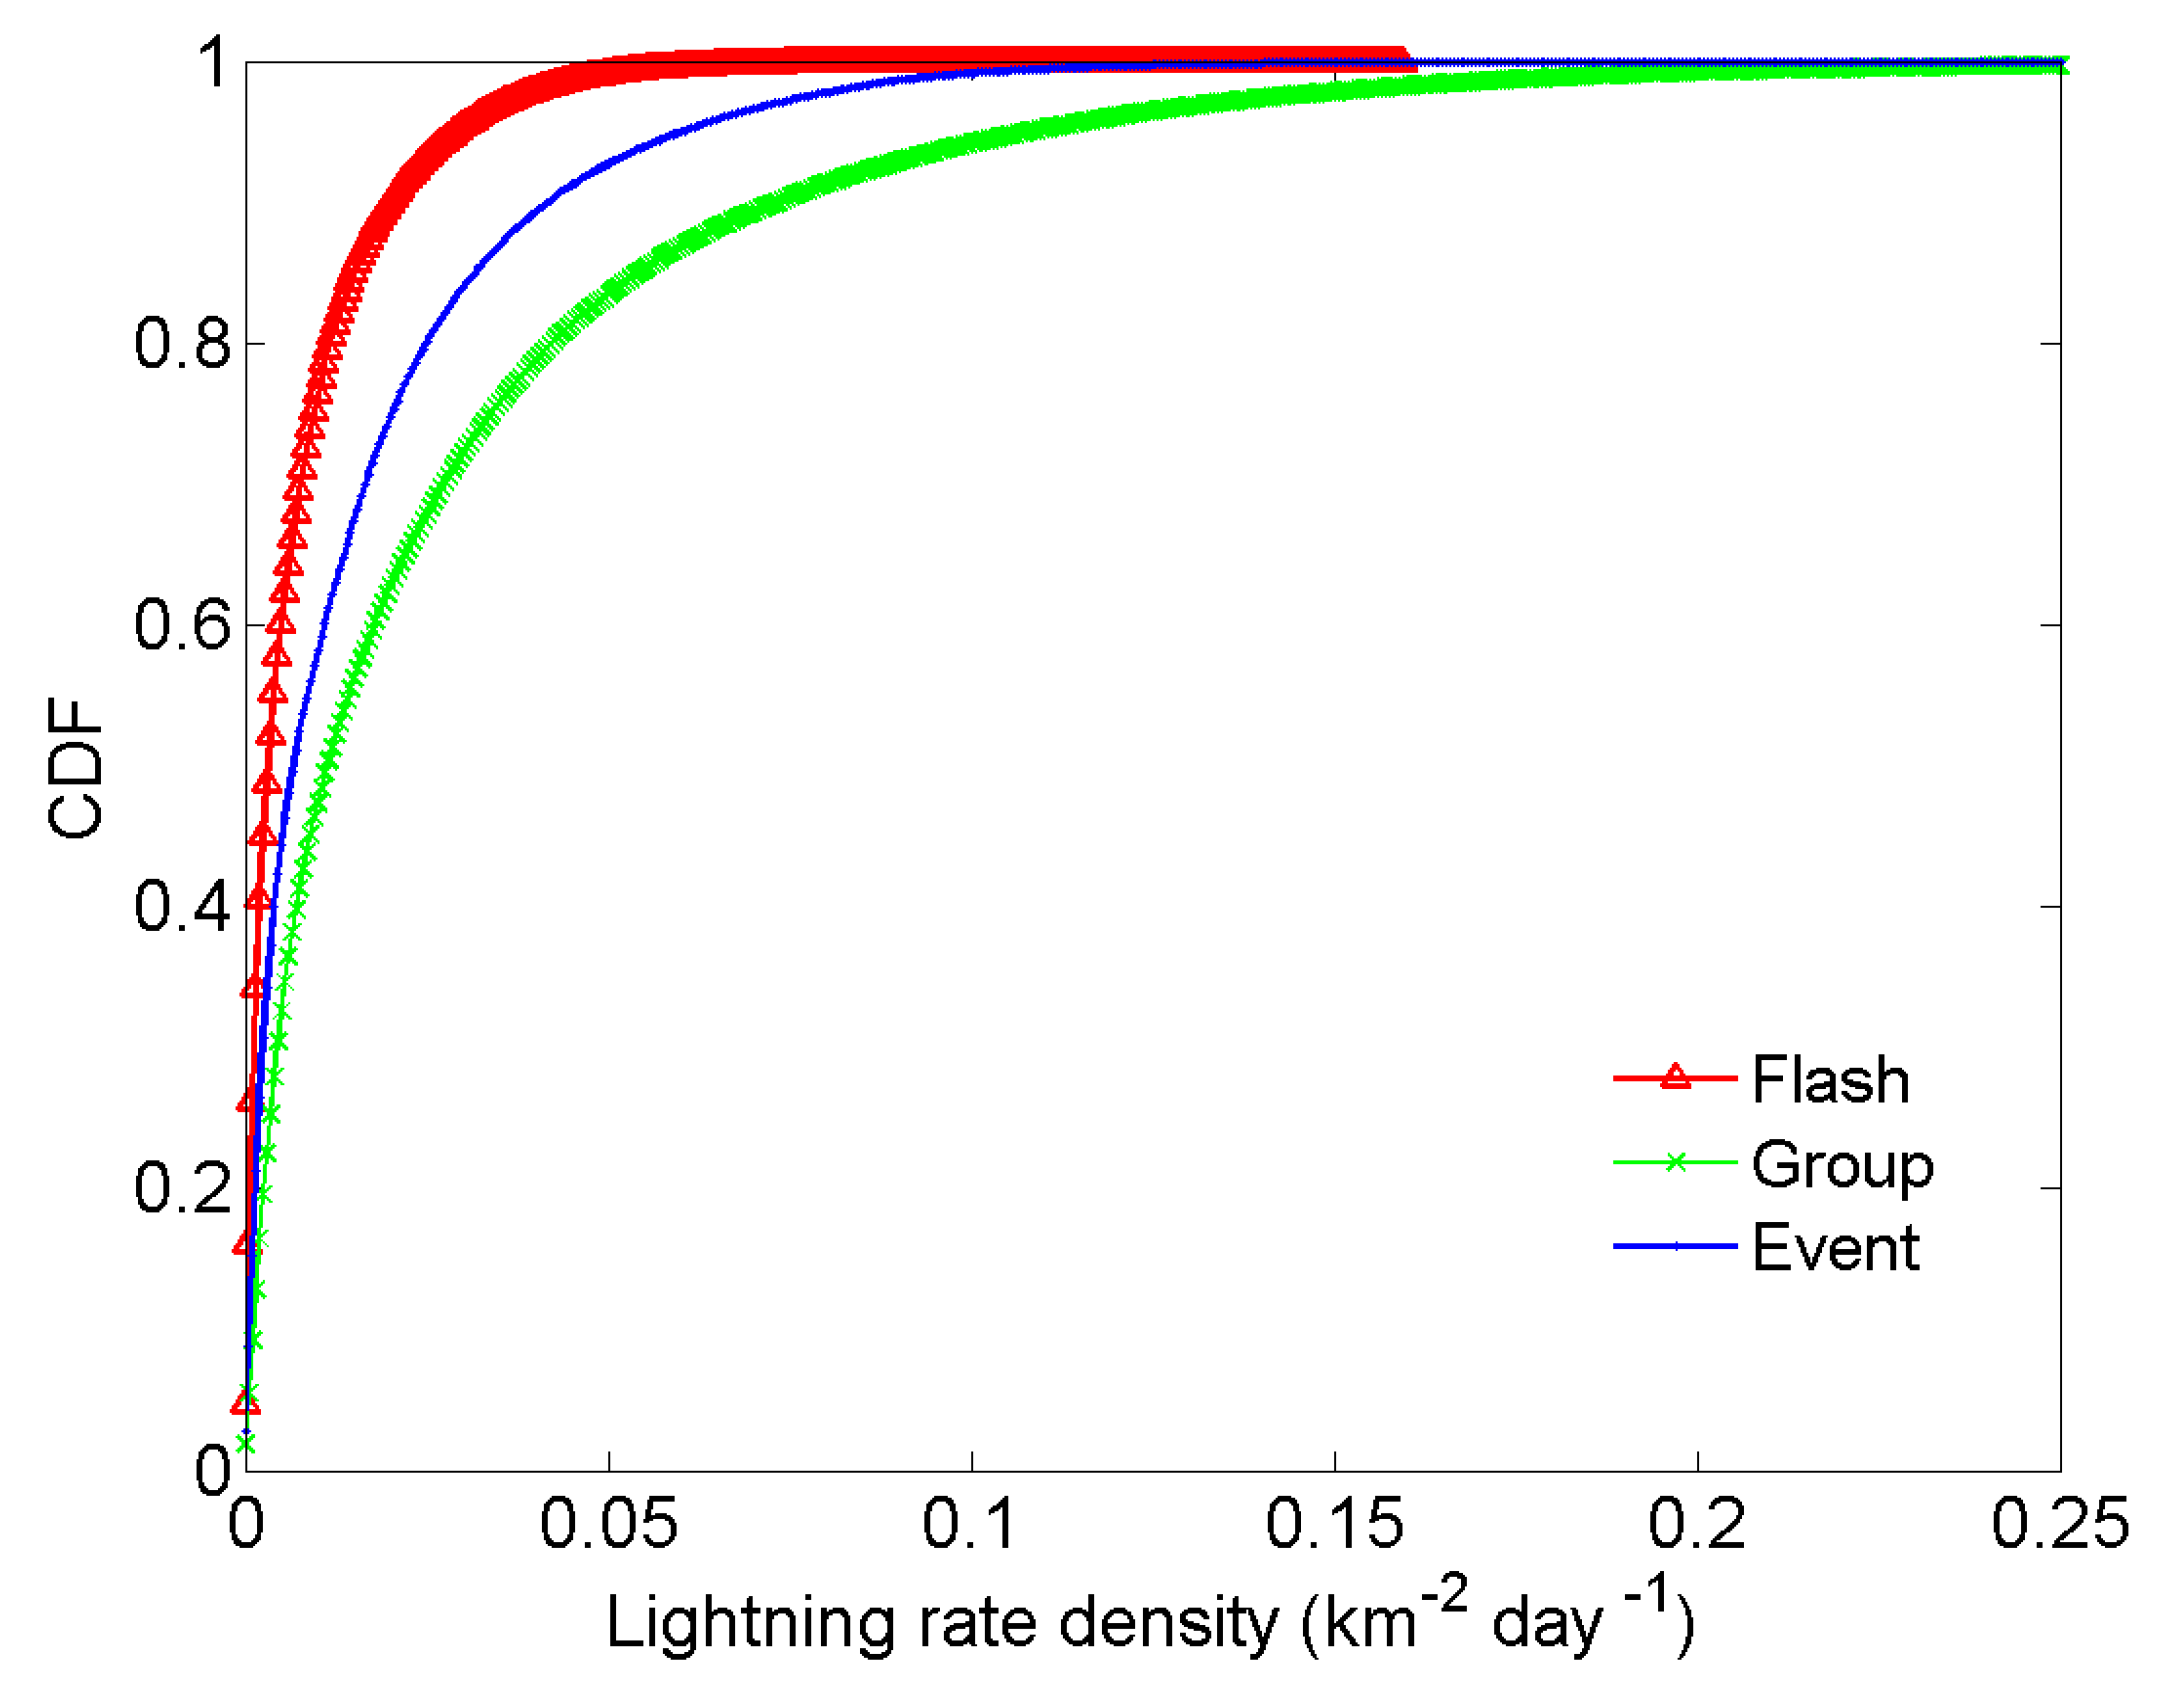
Events reflect the capability of a lightning imager to detect lightning pulses [28]. As the intermediate variable of events clustering into flashes, a group can be treated as a CG return stroke or an IC discharge in a certain sense [39]. As demonstrated in Figure 2, LMI events (Figure 2g), groups (Figure 2d), and flashes (Figure 2a) exhibited highly similar distribution patterns. This can also be observed in the LIS (Figure 2b,e,h) and WWLLN (Figure 2c,f) data. Figure 3 shows the cumulative distribution function (CDF) of lightning rate densities observed by LMI. The ratio of the number of LMI events to groups to flashes was 21:7:2. After hierarchical clustering, there was a similar extent of change in the number of lightning flashes. The LMI event density corresponding to a cumulative percentage tending to 1 was lower than the group density, which suggests that there were fewer event-dense regions than group-dense regions. The LMI group density corresponding to a cumulative percentage tending to 1 was higher than the flash density, indicating that there were more group-dense regions than flash-dense regions. For the LMI, both the event-to-group and group-to-flash clustering processes affect the spatial distribution characteristics of lightning flashes, with the group-to-flash clustering process having a greater impact.

3.2. Temporal Variation Characteristics of Lightning

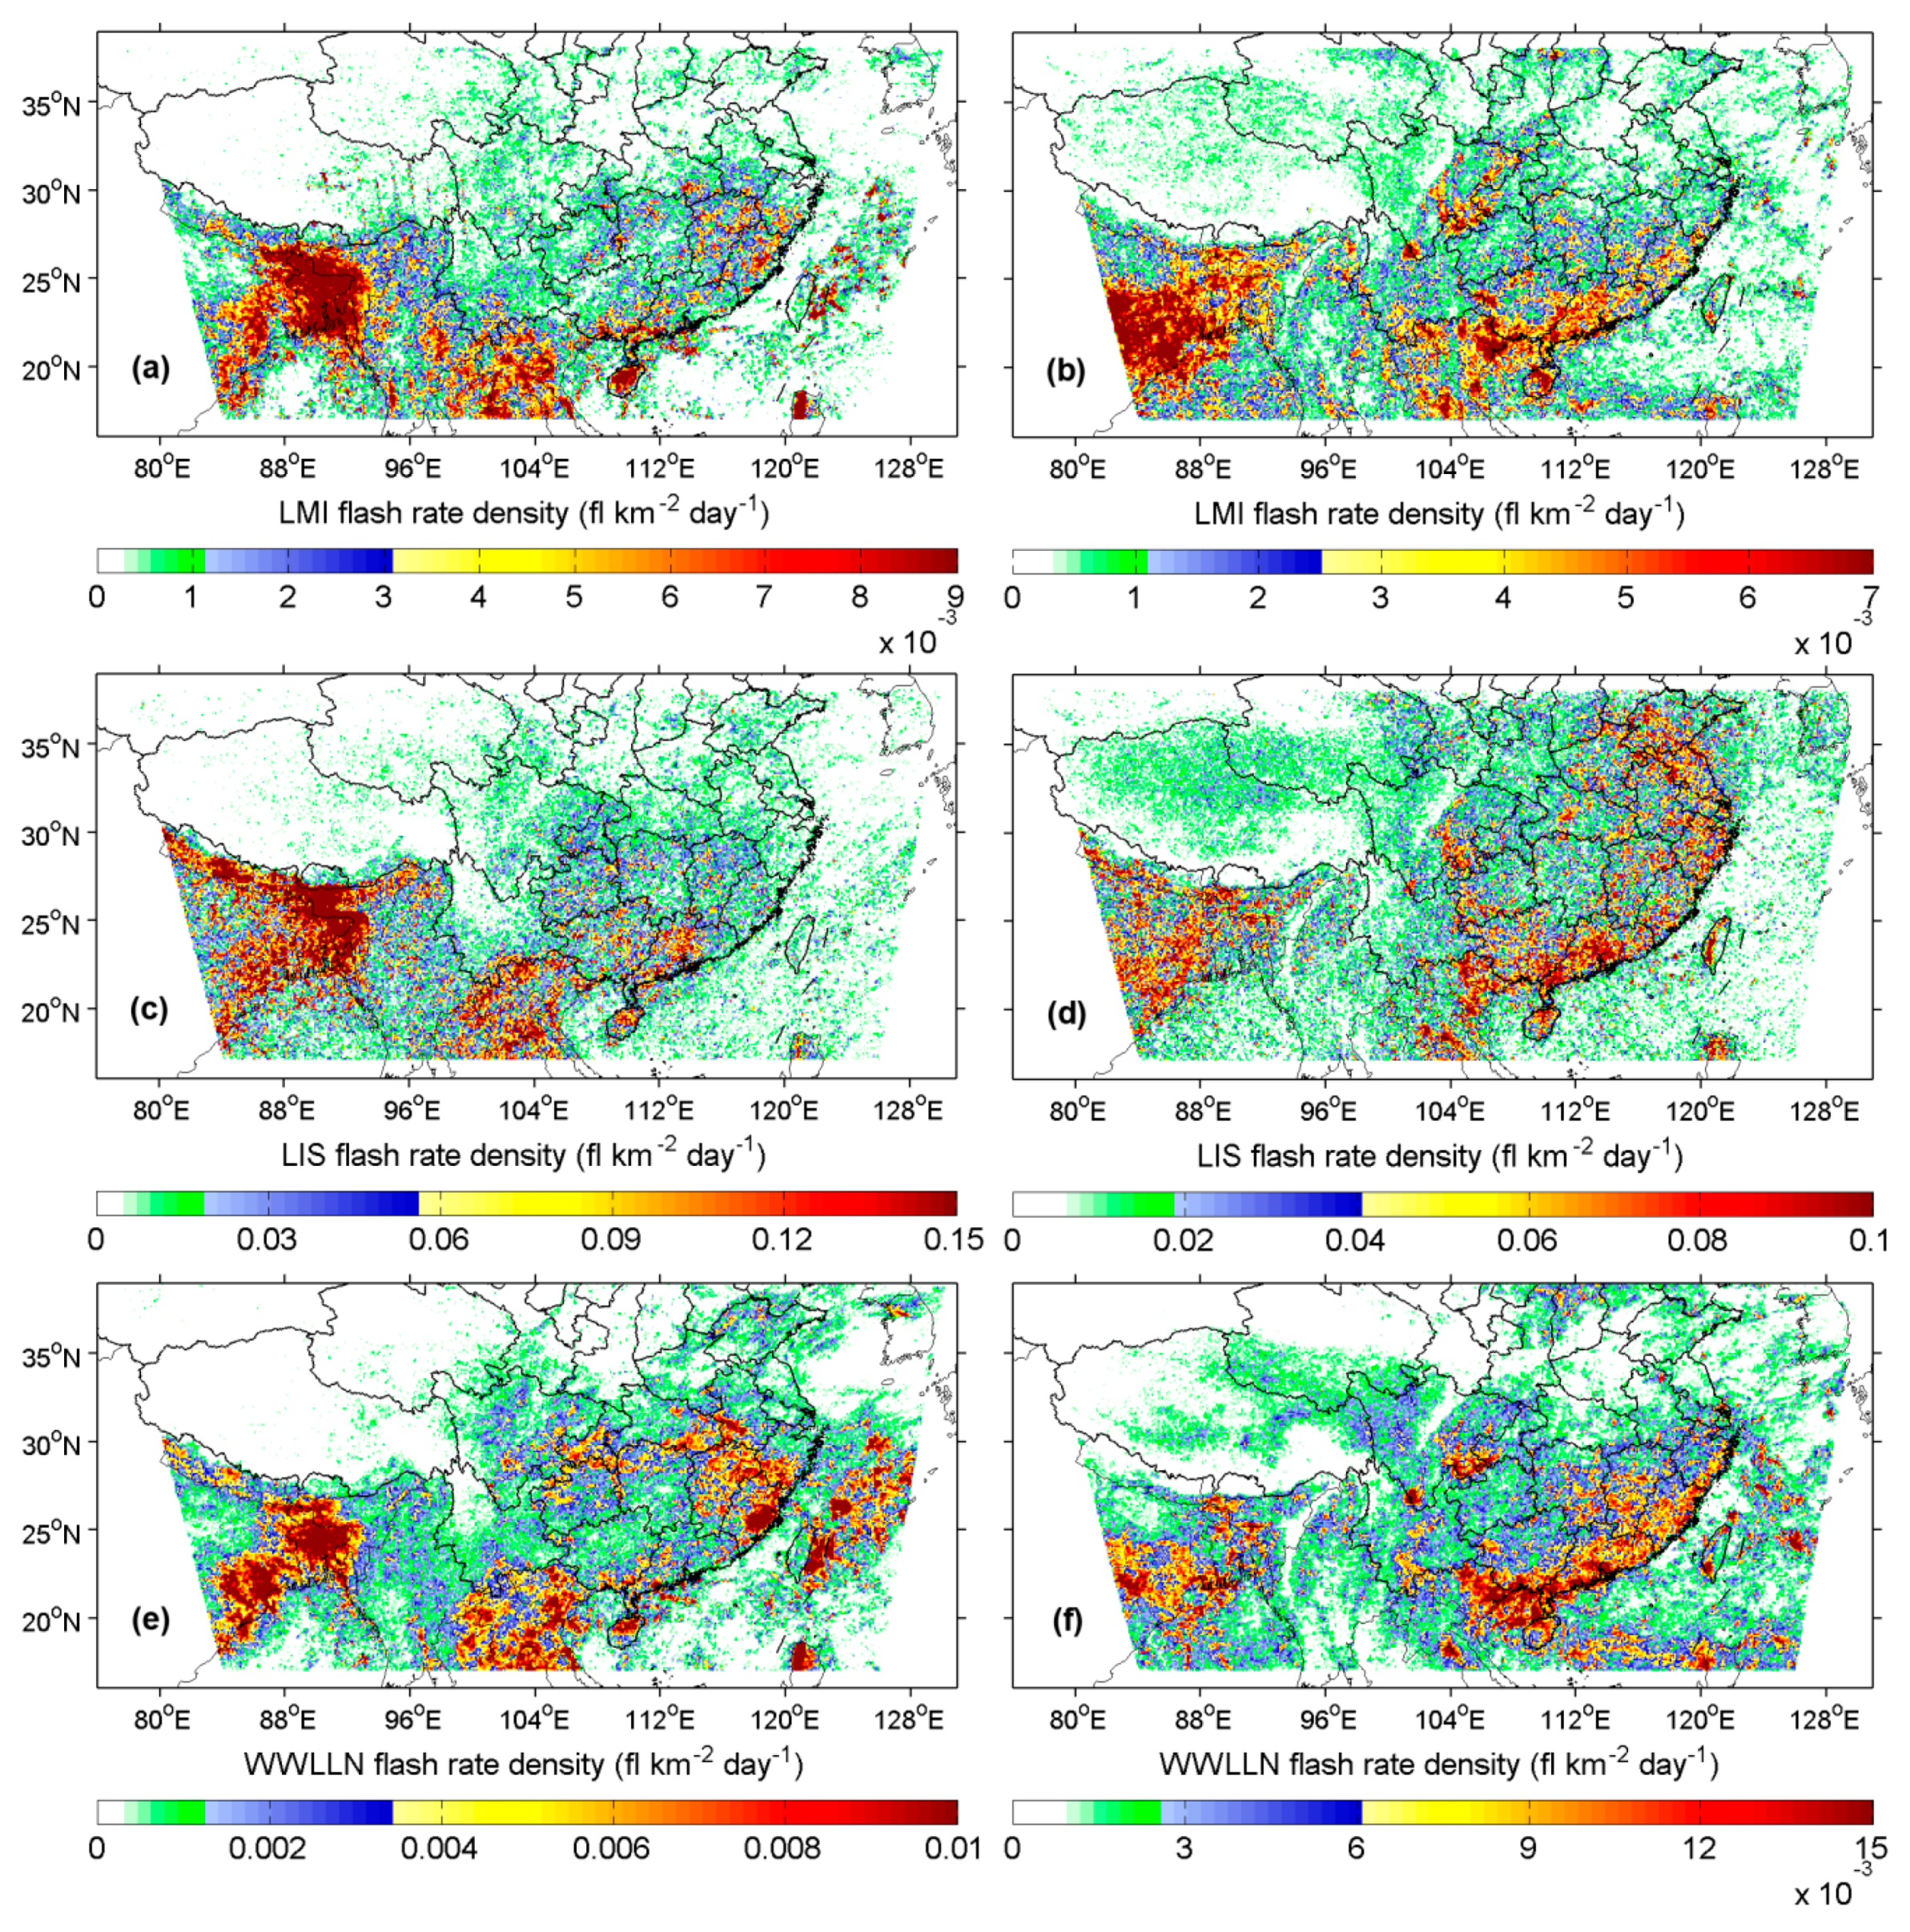
The Northwest Pacific Region is significantly affected by monsoons. Convective and lightning activity over this region exhibit notable seasonal variation characteristics [67,84,85]. Figure 4 shows the spatial distribution patterns of flashes observed by the LMI, LIS, and WWLLN in the premonsoon (March–May) and monsoon (June–September) seasons. Geographic topography is one of the major factors that affect regional lightning climate [18,86]. Flashes observed by the LMI differed in spatial distribution patterns in both seasons (Figure 4a,b). In the premonsoon season, LMI flashes were mainly concentrated over Northeastern India and Bangladesh. In the monsoon season, the LMI similarly observed a relatively large number of flashes over Northeastern India, albeit at a lower density compared with the premonsoon season. By contrast, there were notable flash-dense areas over Eastern Southwest China and the southeastern coastal region of China. Lightning activity varies with latitude and longitude. In Asia, March through August is the high-flash rate season. However, at relatively low latitudes (e.g., South Asia and Southeast Asia), flash rates are often higher between March and May [84]. Northeastern India is among the world’s regions with high flash rates. In this region, peak flash rates occur in April and May [31,87]. Intense solar radiation, a discontinuous wind field, and water vapor supply from the Bay of Bengal facilitate the formation of thunderstorms in large numbers over Northeastern India in the premonsoon season [88]. In June, ample water vapor supplied by the southwest monsoon plays an important role in the formation of a mesoscale convective system over Central and eastern China [89]. July and August often see peak CG lightning flash rates over Eastern Southwest China, East China, and South China [90].
The main difference between LMI and LIS observations occurred in the monsoon season (Figure 4b,d). Flash densities observed by the LMI over Central and eastern China were lower than those observed by the LIS. The current generated during the return stroke of a flash can reflect the discharge energy [91,92]. Research has found that the peak lightning current is sensitive to both latitude and temperature [93,94]. In the monsoon season, peak lightning currents were higher over lower latitudes. Therefore, the dense distribution of flashes observed by the LMI over lower latitudes in the monsoon season suggests that the detection capability of the LMI may be related to lightning radiance. The main difference between LMI and WWLLN observations also occurred in the monsoon season (Figure 4b,f). Flashes observed by the LMI over Northeastern India were denser than those observed by the WWLLN.
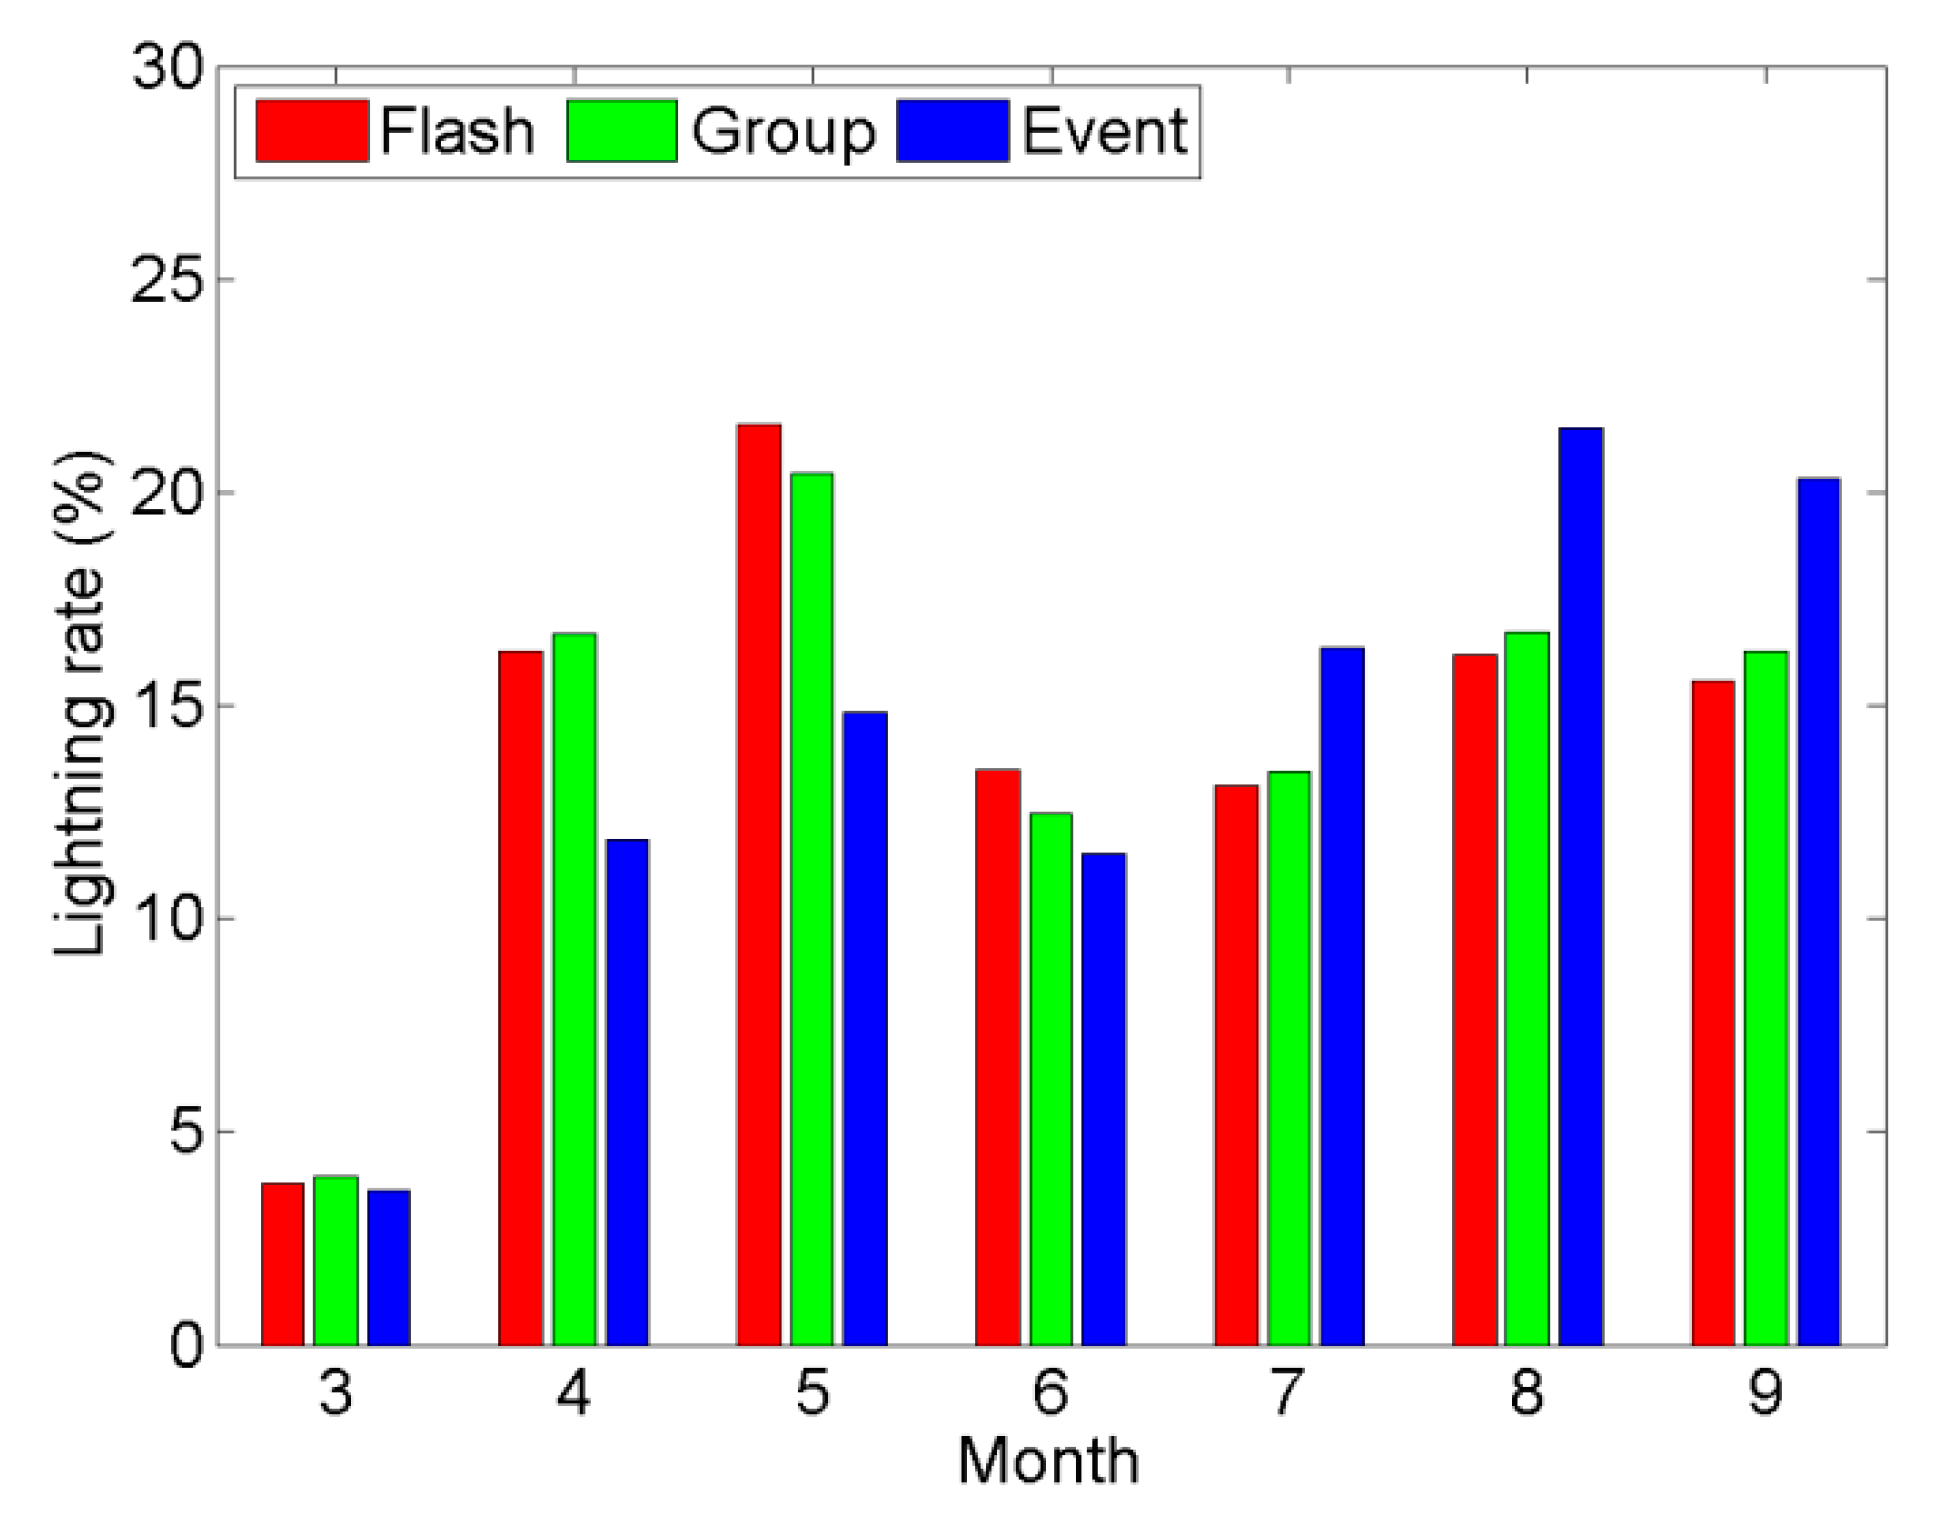
Figure 5 shows the monthly variations in flash rates observed by the LMI in the premonsoon and monsoon seasons. The flash rate observed by the LMI increased significantly in April, reached its peak in May, began to decrease in June, increased again in July and August, and reached its secondary peak in August. Both the premonsoon and monsoon seasons were active flash periods observed by the LMI, with basically similar monthly average flash rates. The LMI group and flash rates exhibited highly similar monthly variations. This result suggests that group-to-flash clustering exerts no significant impact on the seasonal variation characteristics of lightning. Different from the monthly variations in the flash and group rates observed by the LMI, the peak and secondary peak event rates observed by the LMI occurred in August and May, respectively. LMI events were more active in the monsoon season than in the premonsoon season. The monthly average event rate in the monsoon season was 1.7 times that in the premonsoon season, which suggests that there were more events contained in LMI flashes and groups in the monsoon season than in the premonsoon season. The cause of this phenomenon was verified by Beirle et al. [95] by studying OTD and LIS data. There were more events contained in flashes over Eastern Southwest China and the southeastern coastal region of China than over Northeastern India. Eastern Southwest China and the southeastern coastal region of China saw relatively concentrated flash rates in the monsoon season, while Northeastern India saw the most concentrated flash rates in the premonsoon season [31,67].
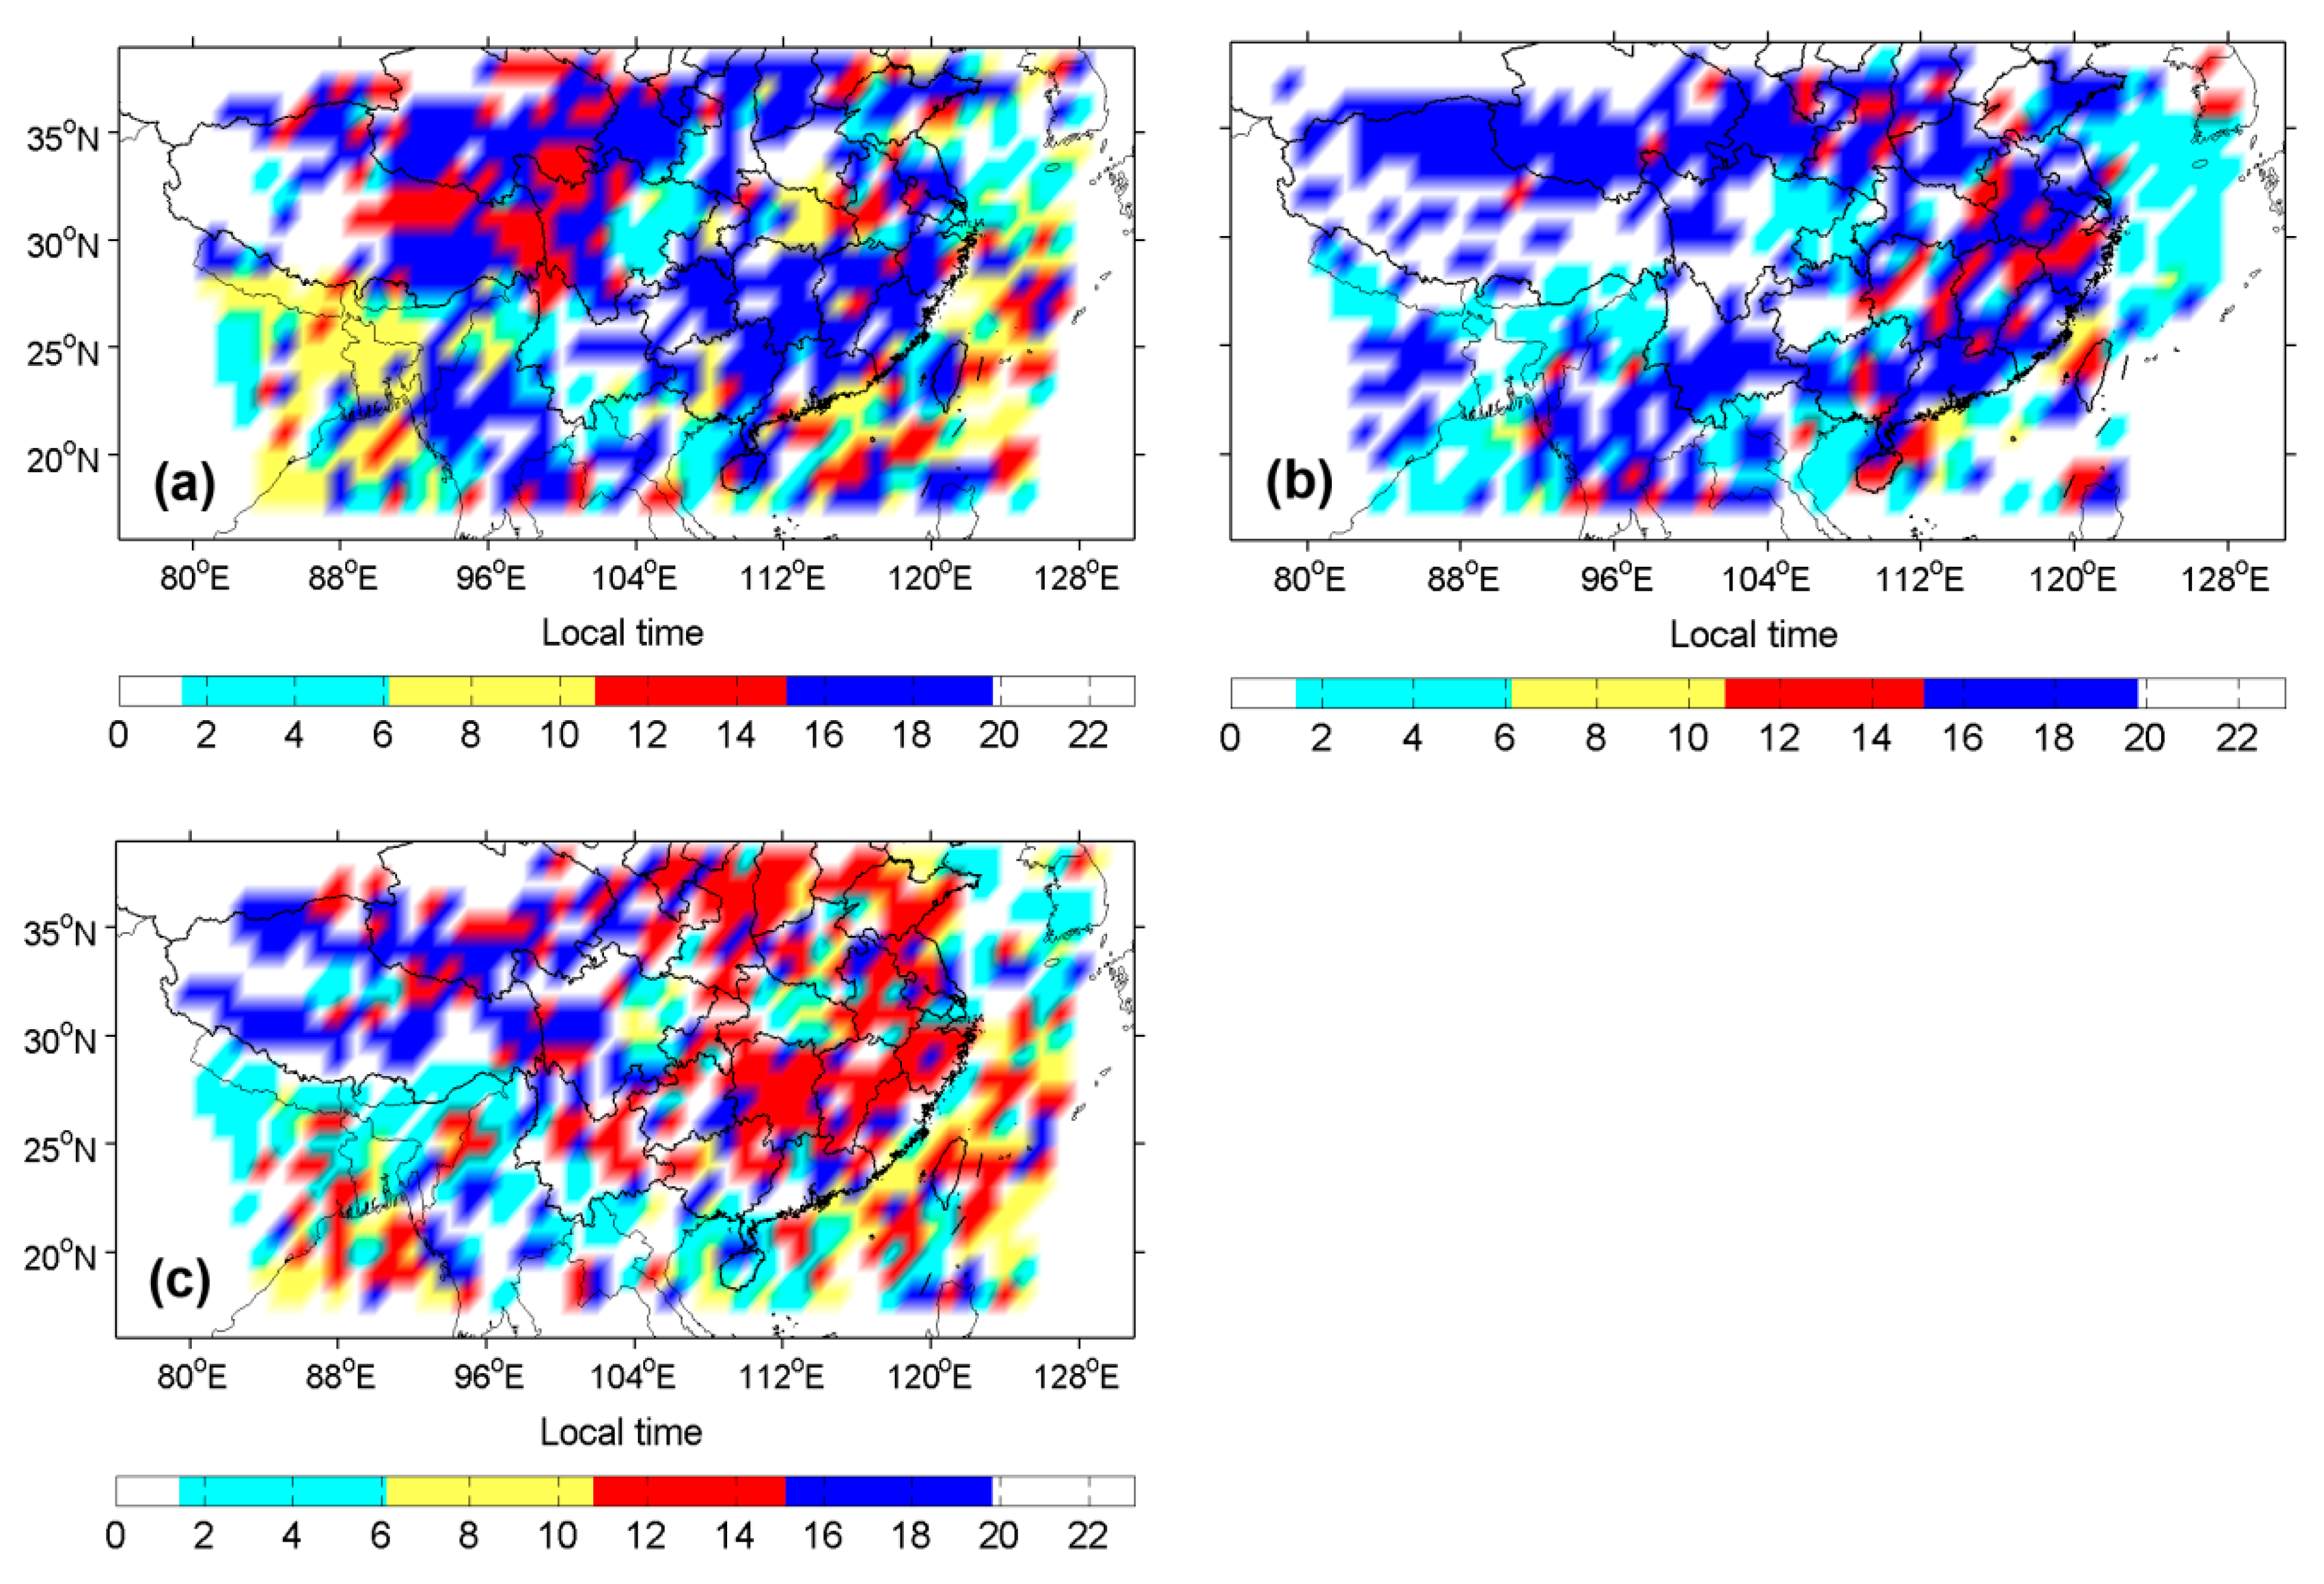
Figure 6 shows the spatial distribution of the flash rates observed by the LMI, LIS, and WWLLN during the diurnal peak period. The diurnal peak flash rates observed by the LMI occurred in the afternoon over most of the regions, while the diurnal peak flash rates over Northeastern India occurred in the morning (Figure 6a). As a result of the interactions of large-scale synoptic situations and complex terrain, there was a concentrated lightning outbreak over Northeastern India at night [31,87]. However, LMI flashes over this region were concentrated in the morning. This difference may be related to the relatively high radiance of lightning over this region during the day. The magnitude of energy transmitted during the return stroke of a flash can be reflected by the effect of current accumulation. The stage at which current rises to its peak contributes the most to the effect of current accumulation [96]. There is a positive correlation between current and optical signals at this stage [97]. According to You et al.’s [98] analysis of the optical radiance of lightning, the optical radiance of lightning over Northeastern India is slightly higher during the day than at night. Thus, it can be considered that LMI observations in this region are related to the relatively high radiance of lightning during the day. The diurnal peak-flash rate period observed by the LMI over Southeastern China was related to deep convection generated by surface heating, and to some extent, to orographic uplifting [90,99,100].
The difference in spatial distribution between LMI and LIS flash rates during the diurnal peak period mainly occurred over Northeastern India (Figure 6a,b). LMI flashes over this region were mainly concentrated in the morning, whereas LIS flashes occurred at dusk. This difference could be attributed to the higher radiance of lightning over this region during the day. In addition, there was also a certain difference between the LMI and LIS flash rates over Western China during the diurnal peak period. The difference between the LMI and WWLLN observations was mainly concentrated over Southeastern China and Northeastern India (Figure 6a,c). Southeastern China had a relatively significant contribution to the LMI flash rate at dusk and the WWLLN flash rate in the afternoon. Northeastern India had a relatively significant contribution to the LMI flash rate in the morning and the WWLLN flash rate at night.

3.3. Optical Radiation Characteristics of Lightning Signals

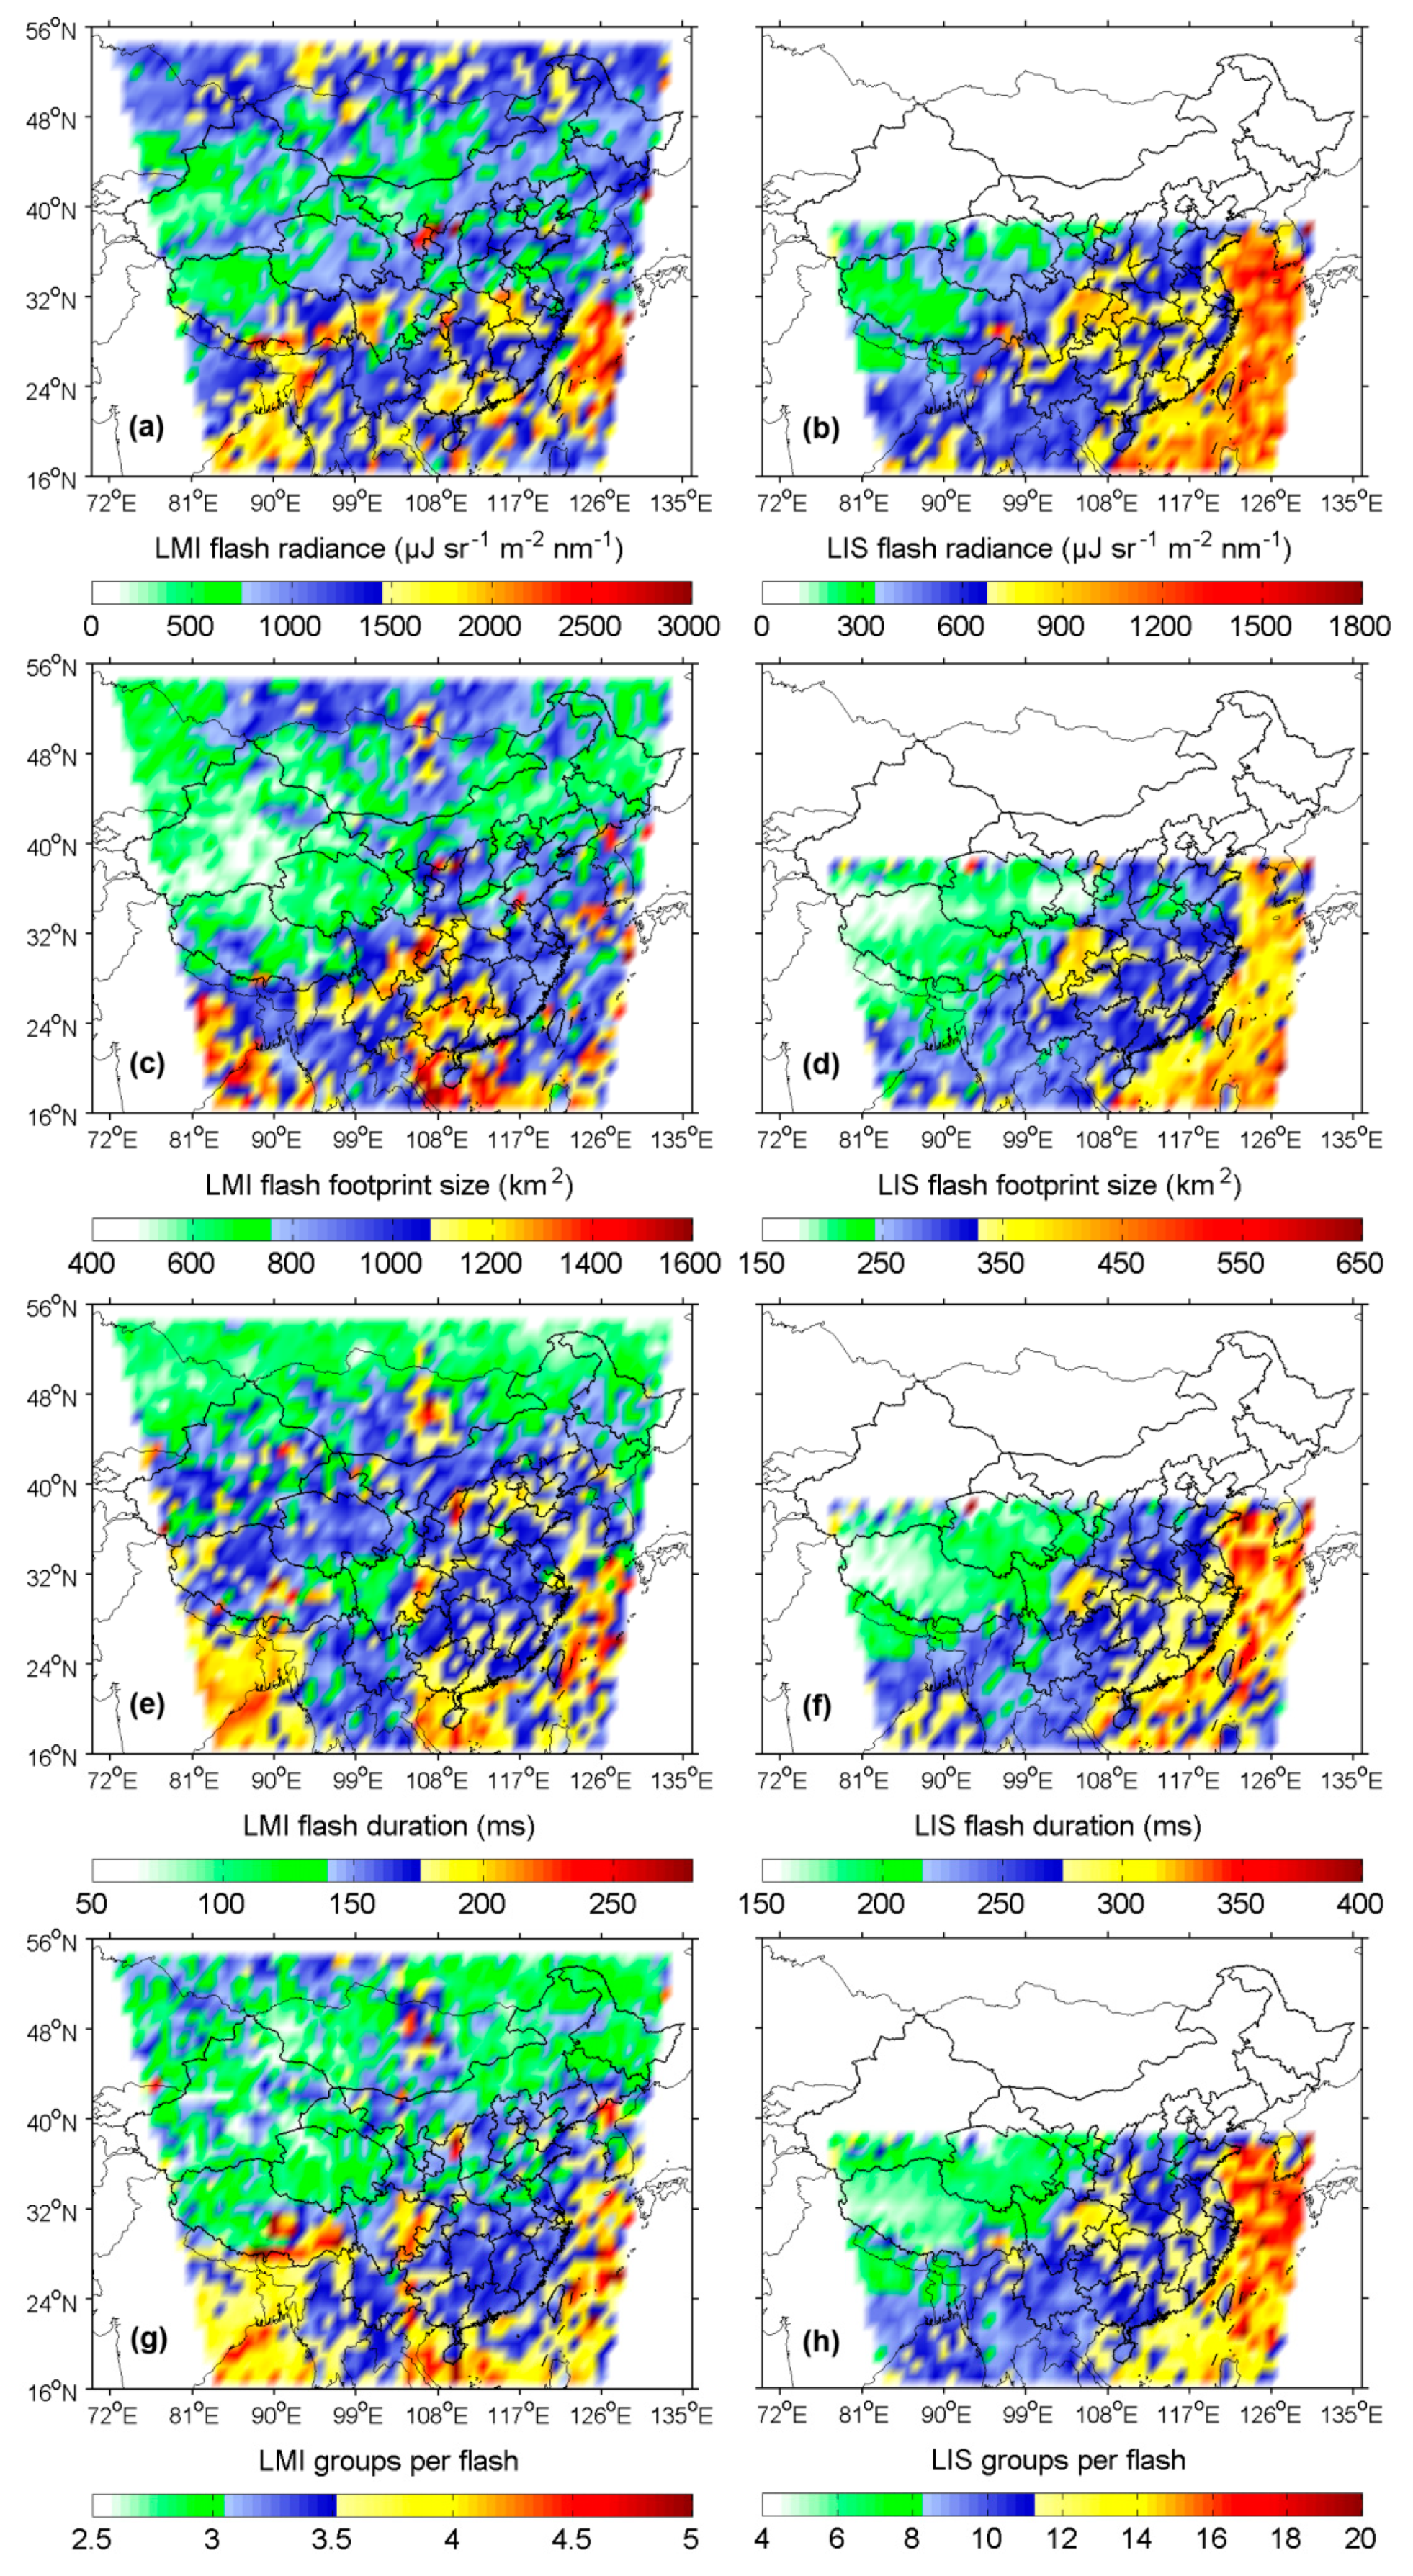
A satellite-borne lightning imager detects lightning based on the radiation characteristics of lightning signals [101]. The optical radiance, footprint size, and duration of flashes as well as the numbers of groups and events per flash can all be used as the characteristic parameters of radiation in the lightning signals, and to a certain extent, they can all reflect the discharge intensity of lightning [95,102]. Figure 7 shows the spatial distribution of the parameters (i.e., optical radiance, footprint size, duration, and number of groups per flash) of LMI and LIS flashes. There was a “stepwise” decrease in each of the LMI-observed parameters from southeast to northwest (Figure 7a,c,e,g). This distribution trend was consistent with that observed by the LIS (Figure 7b,d,f,h). The correlation coefficients between each of the LMI- and LIS-observed parameters were 86.04%, 54.27%, 93.40%, and 75.98%. The highest values of each parameter occurred over the ocean, followed by those over the coastal regions in Southeastern China and Northeastern India. Low values of each parameters occurred over Western and Northern China.
The difference between the LMI-observed values of each of the characteristic parameters of radiation over the ocean and land (Figure 7a,c,e,g) was caused by the systematic difference in lightning intensity between the ocean and land [103,104]. There are relatively low temperatures and relatively stable air over the ocean. It is generally difficult for convection to develop under these conditions. However, once convection develops, there will be a relatively intense lightning discharge [20,21,105]. For land regions, the shaping effect of the dynamic thunderstorm process on the charge distribution pattern can be used to explain the differences in the optical radiance (Figure 7a) and footprint size (Figure 7c) of flashes between regions [106,107,108,109]. Under intense convective turbulence and shear, in-cloud charge regions may be relatively small and distributed in a staggered pattern. Small effective charge regions limit the spatial scale of the lightning discharge and the quantity of charge that may be neutralized. Therefore, it is favorable to the discharge of high-rate, low-radiation intensity, and small-scale lightning. By contrast, under weak convective or non-convective conditions, charge regions are relatively large and exhibit relatively notable vertical stratification characteristics. It is favorable to the discharge of low-rate, high-radiation intensity, and large-scale lightning [105,110,111]. Boccippio et al. [103] also noted an indirect cause—for a cloud with a relatively low lightning rate, there is often a significant change in its electric dipole moment, which will allow the discharge channel to extend to a larger space. Table 1 summarizes the Pearson correlation coefficients between LMI-observed characteristic parameters of radiation. Compared with other characteristic parameters of radiation, there were more consistent changes in the optical radiance and footprint size of flashes observed by the LMI. This finding agrees with that obtained by You et al. [98] in their study of LIS data. This phenomenon can also be explained by the abovementioned causes.
Furthermore, the abovementioned causes also explain the inverse correspondence of the optical radiance and footprint size of flashes observed by the LMI with their density (Figure 2a,d,g). However, there were also exceptions regarding various land regions. A relatively typical exception is that flash densities were relatively low over the Tibetan Plateau in Western China, where flashes were also found to have relatively low optical radiance and small footprint sizes. Unique thermodynamic and dynamic activities occur over the Tibetan Plateau. Over this region, convective clouds are relatively weakly developed, relatively thin, limited in quantity, and low in water content. As a result, severe convective weather events are relatively unlikely to occur over the Tibetan Plateau [112,113,114,115]. Moreover, convective clouds are mostly isolated convection cells. This limits the development scale of effective charge regions [116,117]. Consequently, lightning flashes over the Tibetan Plateau are characterized by low optical radiance and a small scale.
Flash duration is primarily determined by the number of return strokes per flash [118,119,120] and is also related to cloud cover [121]. A comparison of Figure 7e,g finds that the durations of LMI flashes and the numbers of groups in LMI flashes were similar in spatial distribution, with a Pearson correlation coefficient of 0.53 (Table 1). This finding is in line with the correlation between flash duration and number of return strokes per flash. By observing the discharge of IC flashes during a thunderstorm event, Montanyà et al. [122] found a decrease in both the number of return strokes and the number of VHF radiation sources in single IC flashes within the life cycle of the thunderstorm. By the end of the discharge of an IC flash, most of the positive and negative charges in the clouds have yet to neutralize one another, and instead, they have formed a new spatial distribution pattern. This pattern leads to a significant change in the electric potential and field distribution in the cloud environment, as well as rapid consumption of electric energy. As a result, the discharge ends rapidly [123], which can explain the decrease in the number of VHF radiation sources and shows that the IC flash duration and the number of return strokes per IC flash exhibited similar variation trends. It is worth noting that the number of return strokes per flash was not the only factor that explains the flash duration. Changes in the electric field and current intensity will also affect the flash duration [86,124].
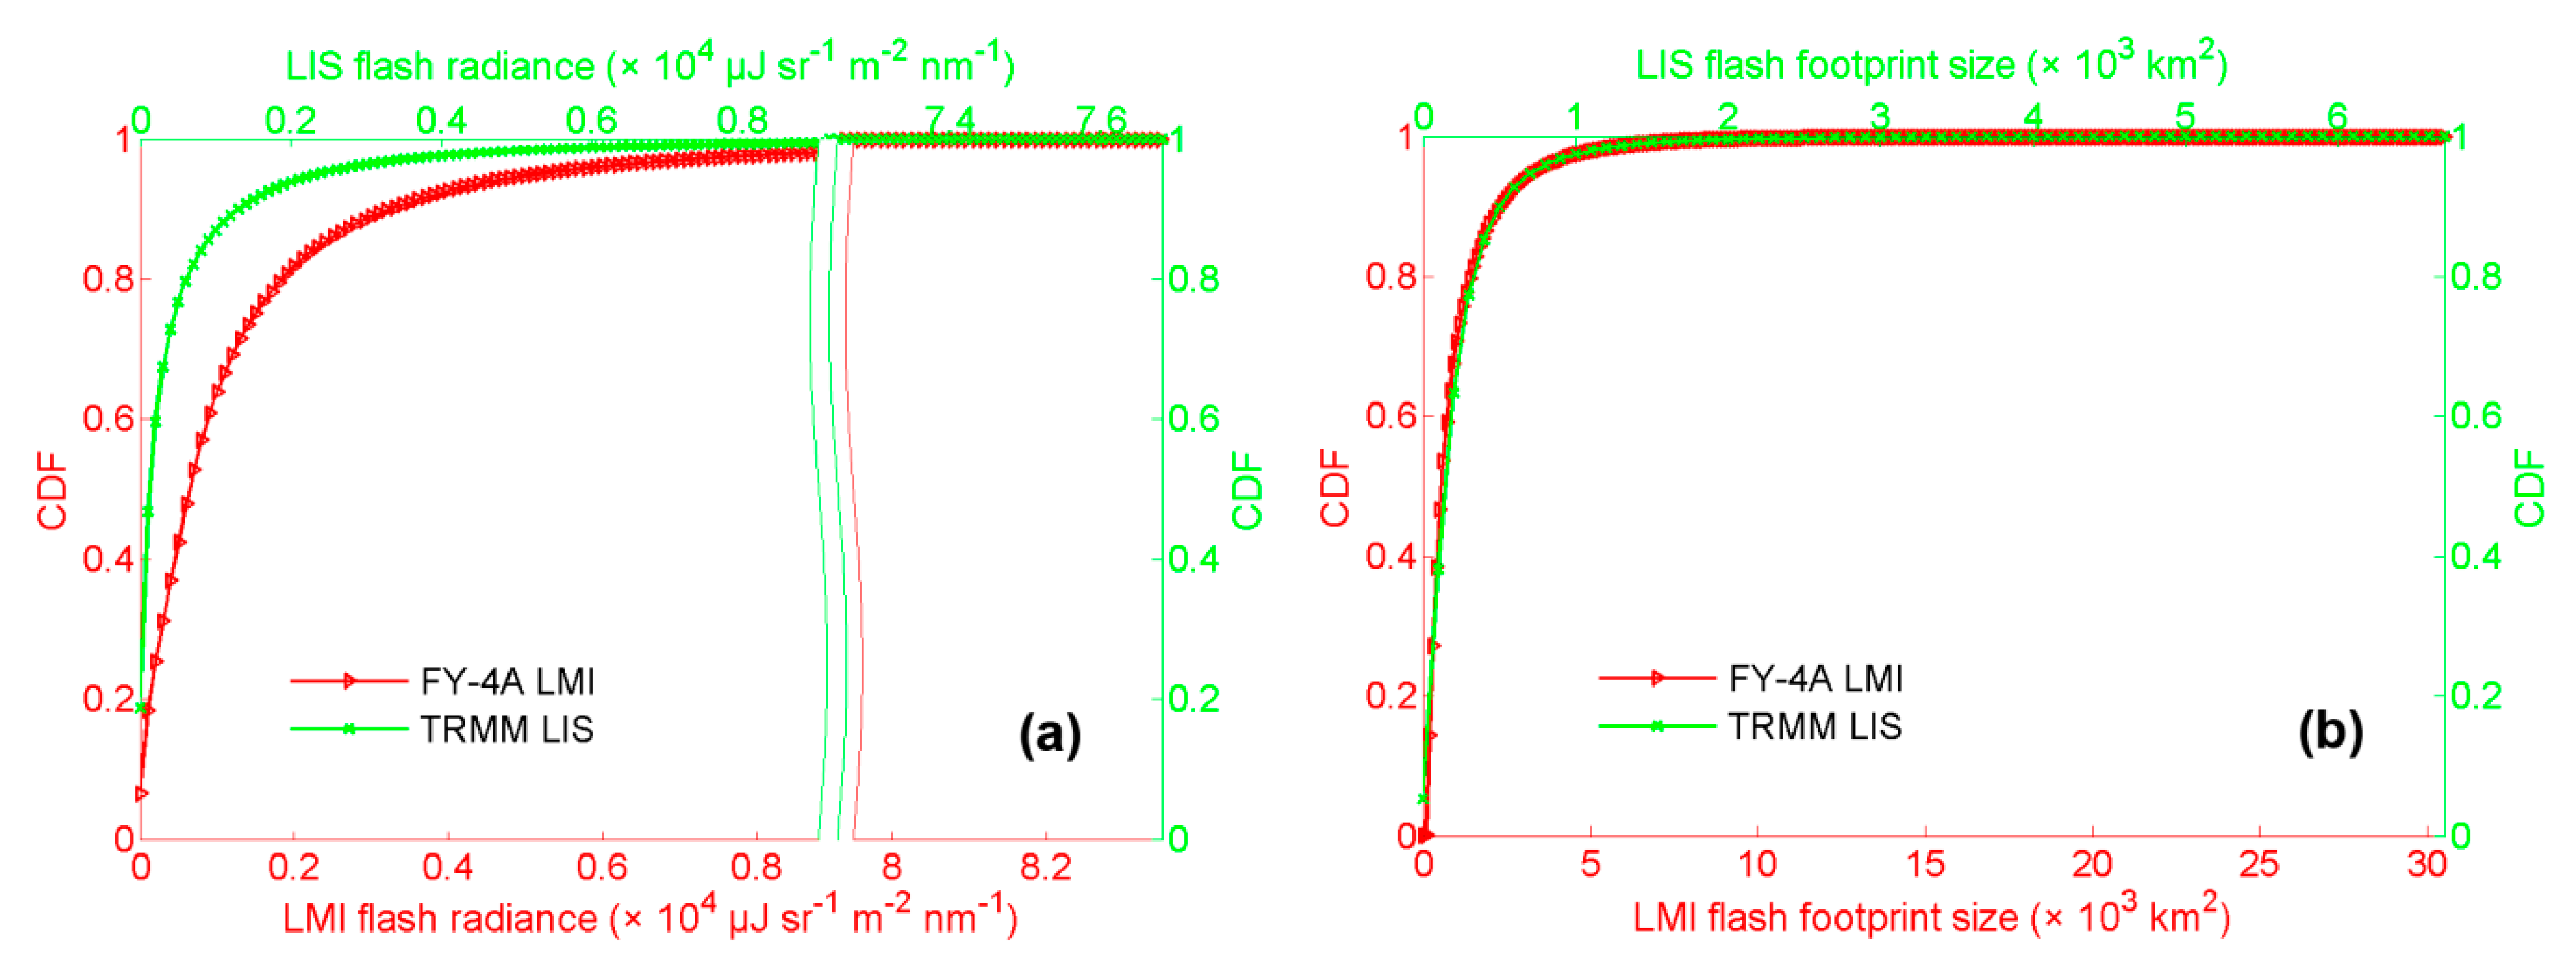
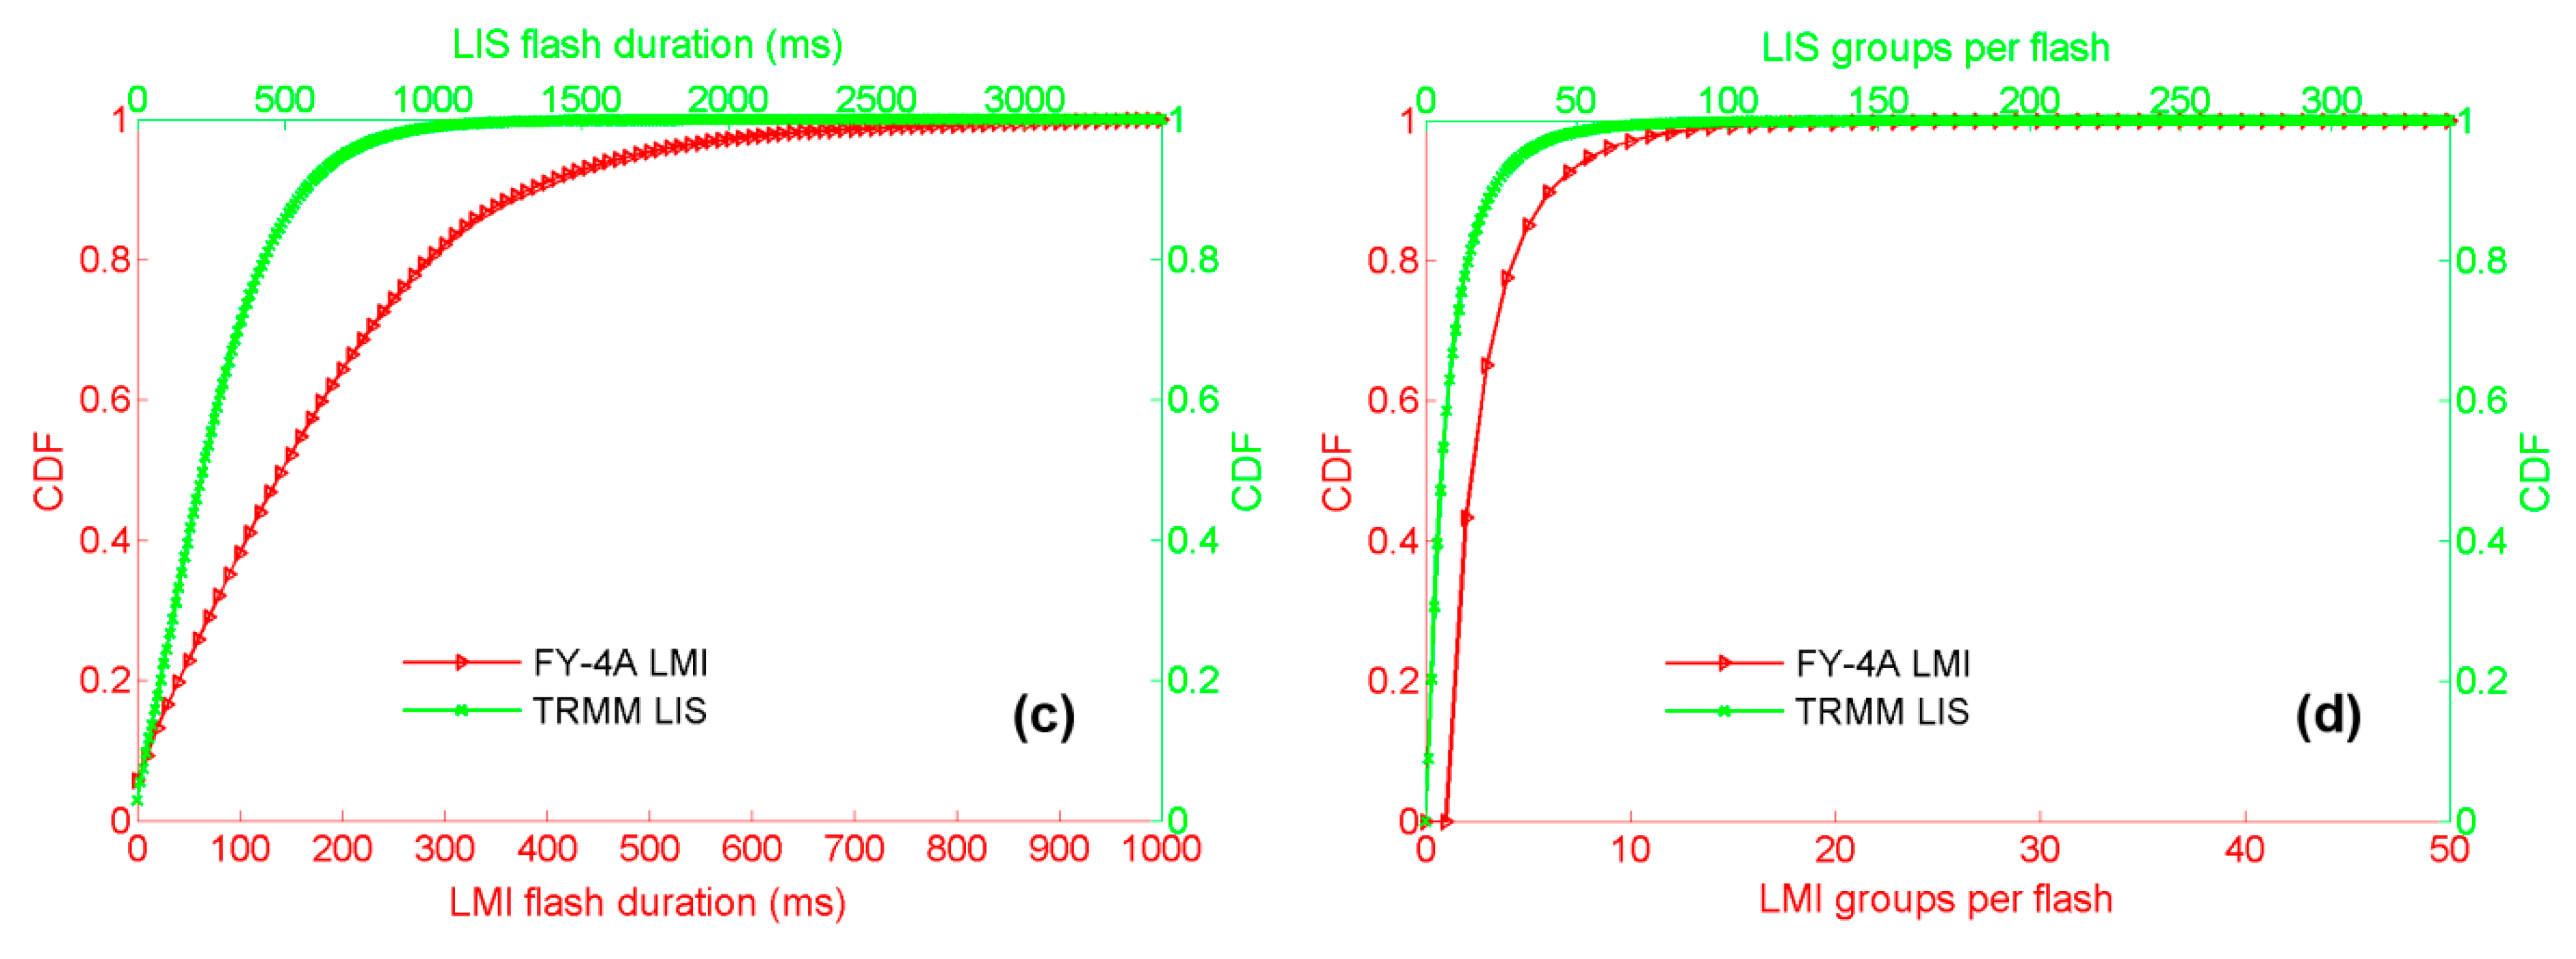
Figure 8 shows a comparison of the statistical results for the characteristic parameters of radiation in the LMI and LIS flashes. The optical radiance of LMI flashes was higher than that of LIS flashes (Figure 8a). In addition, the optical radiance of LMI flashes corresponding to a cumulative percentage tending to 1 was also higher than that of LIS flashes, i.e., the LMI observed more flashes with relatively high optical radiance than the LIS. The optical radiance of the lightning signals observed by the LMI is related to the LMI calibration result. The radiation calibration process for the LMI and LIS involve different problems, mainly cloud scattering and satellite observation geometry. In addition, variations in the radiation response of the CCD array while a lightning imager is in orbit may cause deviations in the calibration results. This explanation will be further analyzed in Section 4.2. The footprint sizes of LMI and LIS flashes exhibited almost the same probability distribution pattern (Figure 8b), except that LMI flashes were greater overall than the LIS flashes in terms of footprint size. This difference is related to the higher spatial resolution of the LMI than the LIS. However, in this case, LMI flashes had higher optical radiance, meaning that the LMI flashes were higher in radiation intensity. The numbers of groups in LMI flashes were lower than those in LIS flashes (Figure 8d). Correspondingly, the durations of LMI flashes were also shorter than those of LIS flashes (Figure 8c). However, the LMI observed more flashes that contained a relatively large number of groups than the LIS. Similarly, the LMI observed more flashes with longer durations than the LIS. This suggests that some individual LMI flashes contained an excessively small number of groups, resulting in an overall short duration of LMI flashes. This phenomenon may be related to the clustering of LMI groups into flashes.

4. Discussion

4.1. Coincidence between LMI Groups and WWLLN Strokes

The difference between satellite- and ground-based lightning detection methods produces differences between the LMI and WWLLN observations. Nevertheless, a direct comparison between the LMI groups and the WWLLN strokes can provide several important insights into the characteristics of the LMI data.
As the group rate observed by the LMI peaked in May (Figure 5), we used the May data as an example to directly compare the LMI groups and the WWLLN strokes for the study area. Figure 9 shows how the CR and the RR change with the time-space threshold. When the time and space differences between a LMI group and a WWLLN stroke reached 2.1 s and 40 km, respectively, the CR and RR were relatively stable. Based on a time/space coincidence window of 2.1 s/40 km, there were a total of 2,729,512 LMI groups and 1,265,849 WWLLN strokes. There were 129,073 WWLLN strokes coincident with LMI groups, and 2,357,069 LMI groups missed WWLLN strokes. Thus, the CR and RR were found to be 10.20% and 86.35%, respectively.
There are four main reasons for the inconsistency in the data between the LMI groups and the WWLLN strokes. Firstly, as mentioned when defining the CR and RR, these two values reflect the DE and FAR of the LMI to some extent. Some WWLLN strokes have no accompanying LMI groups, that is, the LMI may miss some lightning. Some LMI groups missed by the WWLLN could be false signals. Secondly, the LMI detects total lightning, whereas the WWLLN primarily observes CG lightning. Inconsistencies in the detection results may reflect the tendency of the LMI to detect IC and cloud lightning. A similar conclusion was drawn in a previous case study [44]. Thirdly, the DE of a ground-based lightning location network is affected by the number of stations. The relatively small number of WWLLN stations in Asia [19] impacts the WWLLN DE. Therefore, lightning signals may be detected by the LMI but not the WWLLN. Fourthly, although a group can be conceptualized as a CG return stroke or an IC discharge [39], there is no one-to-one correspondence between a group and a stroke. The preliminary comparison between the LMI and WWLLN data shows that a variety of simultaneous observation data can be used to cross-validate the LMI observations.

4.2. Influence of LMI Data Processing on Observations

The analysis in Section 3 shows that LMI observations were not only related to instrument performance but also closely related to the processing of detection data.
Based on the flash pulse duration, the integration time per frame was set to 2 ms for satellite-based lightning detection. To reduce the data transmission load caused by a frame rate of 500 frames/s, a satellite-borne lightning imager estimates and filters out the background in real time on the satellite and only transmits lightning signals down to the ground [28,32,125]. In Section 3.1, a difference is found in the spatial distribution pattern between LMI and LIS flashes (Figure 2a,b,d,e,g,h). One possible cause of this difference is that the threshold for background estimation was set too high for the LMI, which led to the filtering-out of some lightning signals as the background. Based on the analysis of the LMI-observed characteristic parameters of radiation in Section 3.3 (Figure 7a,c,e,g), the LMI observed high values for the characteristic parameters of radiation over the coastal regions in Southeastern China and Northeastern India. In addition, the LMI also observed denser flashes over these regions than other regions (Figure 2a,d,g). By contrast, low values of the characteristic parameters of radiation were observed over Western and Northern China. In addition, LMI flash densities were also notably lower over Western and Northern China. LMI flash densities were lower over regions with relatively low flash radiance, which may be due to the larger background estimation errors of the LMI for these regions. Moreover, according to the analysis in Section 3.2, there were differences between LMI and LIS observations during the monsoon season and the diurnal peak period (Figure 4b,d and Figure 6a,b). Similarly, this difference was also correlated with flash radiance, meaning that the background estimation errors of the LMI might have been greater during these periods of time. Thus, for the onboard background filtering algorithm for the LMI, on the one hand, the effect of the cloud background brightness can be further analyzed based on the scattering of radiation by clouds. On the other hand, it is also possible to consider the uniformity of CCD area arrays [126], more finely distinguish the radiation characteristics of lightning signals and the intensity characteristics of the background over various regions, and set a more flexible, adaptive extraction threshold for lightning events.
The detection capability of a lightning imager depends strongly on the radiation response characteristics of its CCD array. During prelaunch radiometric calibration, the LMI calibration coefficients were computed using a lightning scenario simulation [50]. The radiometric calibration included characterizing the pixel response to steady and transient optical sources, the sensor FOV, and the sensor spectral response. There is always some change in the pixel response during the initial stage of operation of a satellite-borne remote sensor. It is difficult to perform on-board calibration because a lightning imager cannot carry on-board calibration source. Some indirect methods are under exploration. These calibration issues impact the optical radiance of lightning signals observed by the LMI, which may explain the difference between the LMI and LIS observations shown in Figure 7a,b and Figure 8a. Changes in the radiation response will also shift the threshold for LMI background estimation, resulting in detection errors, which may explain the differences among the temporal and spatial lightning distributions observed by the LMI, LIS, and WWLLN shown in Figure 2, Figure 4 and Figure 6.
Original lightning data downloaded from satellite often contain many non-lightning pixels, which are referred to as false lightning signals. These signals are predominantly formed because of instrumental factors or external interference [28,127,128]. These signals are specifically filtered out during ground data processing for the LMI [41]. However, based on the analytical results obtained in the study, there are still some phenomena that may be related to false lightning signals. Some linearly distributed dense event pixels can be found over the Central and eastern Tibetan Plateau (Figure 2a,d,g). Event densities in these pixels are far higher than those in the adjacent pixels. This phenomenon is particularly notable in the premonsoon season in Figure 4a. In addition, flash durations in these pixels are also longer than those in the adjacent pixels (Figure 7e). No similar flash distribution patterns can be found from the LIS and WWLLN observations (Figure 2b,e,h,c,f). Moreover, misidentification of true lightning signals is another possible cause of the difference in the spatial distribution pattern between LMI and LIS flashes (Figure 2a,b,d,e,g,h). False lightning signals of LMI can be identified and filtered out by identifying known noises based on the geometric and shape features of images and based on the temporal and spatial extensibility of flashes.
The results in Section 3.1 and Section 3.2 show that for the LMI, clustering of events into groups significantly affected the temporal variation characteristics of lightning activity, while clustering of groups into flashes significantly affected the spatial variation characteristics of lightning activity. In addition, based on the analytical results in Section 3.3, the radiation characteristics of flashes observed by the LMI were also related to the clustering process. The relatively short durations of LMI flashes may be a result of the overly small numbers of groups contained in some flashes. A clustering algorithm similar to that for the TRMM LIS is adopted for the LMI [41]. Clustering of events into groups is based on the spatial distribution of event pixels in single image frames. Testing of the clustering algorithm for the LIS [129] has found that the number of groups in proximity to one another in the spatial domain will eventually reach a relatively stable value. Thus, for event-to-group clustering, adjusting the threshold in the spatial domain requires that the effect on the number of flashes in the temporal domain be considered. Clustering of LMI groups into flashes involves the extraction of group distribution patterns in the temporal and spatial domains, which is not only dictated by the physical process of lightning but is also related to the temporal and spatial resolutions of the instrument and the actual mode of observation. Thus, the characteristics of current hierarchical clustering processes can be considered to optimize the LMI flash clustering algorithm to increase its robustness.

5. Conclusions

In this study, the characteristics of lightning activity and the optical radiation characteristics of lightning signals observed by FY-4A LMI over China and its neighboring regions were analyzed in detail based on 2018 LMI observations of the Northern Hemisphere. In addition, factors that may affect LMI detection were discussed through a comparison with TRMM LIS and WWLLN observations. The results of this study are summarized as follows:
  • High-flash density regions observed by the LMI were mainly concentrated over Southern East China, Southern South China, Eastern Southwest China, and Northeastern India. LMI flash densities were low over Western China. The flash density distribution pattern observed by the LMI was similar to those observed by the LIS and WWLLN over most regions but different over a small number of regions. LMI events, groups, and flashes exhibited similar spatial distribution patterns. Clustering of LMI groups into flashes more significantly affects the spatial distribution of flashes than clustering of events into groups.
  • The outbreak of flashes observed by the LMI was concentrated in the premonsoon and monsoon seasons. LMI observations were similar to LIS observations, except that the LMI observed denser flashes over lower latitudes in the monsoon season. In addition, LMI and WWLLN flashes also exhibited similar distribution patterns in the premonsoon and monsoon seasons, except that the LMI observed denser flashes over Northeastern India in the monsoon season. For the LMI, event-to-group clustering more significantly affected the seasonal variation characteristics of flashes than group-to-flash clustering.
  • LMI-observed peak flash rates over most regions occurred in the afternoon. LMI observations differed from LIS observations mainly over northeastern India. LMI flashes over this region were mainly concentrated in the morning, whereas LIS flashes over this region occurred at dusk. LMI observations differed from WWLLN observations mainly over Southeastern China and Northeastern India. The LMI-observed diurnal peak-flash rate period was slightly behind the WWLLN-observed diurnal peak-flash rate period.
  • There was a “stepwise” decrease in each of the LMI-observed characteristic parameters of radiation in the lightning signals, namely, optical radiance, footprint size, duration, and number of groups per flash, from the ocean to the coastal regions to the inland regions, which was consistent with the LIS observations. In addition, there was an inverse correspondence between the distribution of each characteristic parameter of radiation and the density distribution of flashes observed by the LMI, which can explain the difference in flash density between regions. LMI flashes exhibit higher optical radiance and larger footprint sizes but lasted for shorter periods of time than LIS flashes. The optical radiance of the LMI flashes is related to the LMI calibration result. The larger footprint size of the LMI flashes is related to the higher spatial resolution of the LMI compared to that of the LIS. The shorter durations of the LMI flashes corresponded to the smaller number of groups per flash for the LMI than for the LIS, which is related to the LMI flash clustering algorithm.
  • Onboard and ground data processing has an important impact on LMI detection. To filter out the background on the satellite, it is possible to more finely distinguish the background intensity over various regions based on the characteristics of the cloud background and the uniformity of CCD area arrays and set a more flexible, adaptive extraction threshold for lightning events. The LMI calibration results can be adjusted based on continuous monitoring of the radiation response characteristics of the CCD array. False lightning signals can be identified and filtered out by identifying known noises based on the geometric and shape features of images and based on the temporal and spatial extensibility of flashes. More stable flash clustering results can be obtained based on the characteristics of hierarchical clustering processes.
Currently, the FY-4A LMI is the only geostationary satellite-borne lightning imager for the Northwest Pacific Region and can continuously and effectively detect total lightning within its FOV. In future work, based on the effects of various factors on LMI detection, targeted improvements can be made to the data processing algorithm for the LMI to increase the application value of LMI data.

Author Contributions

Conceptualization, W.H. and W.Z.; methodology, W.H. and W.Z.; software, W.H. and P.L.; formal analysis, W.H. and W.Z.; writing—original draft preparation, W.H.; writing—review and editing, W.Z., W.H. and W.L.; supervision, W.L. All authors have read and agreed to the published version of the manuscript.

Funding

This research was funded by the Open Grants of State Key Laboratory of Severe Weather (2020LASW-B07) and the National Key Research and Development Program of China (2019YFC1510103).

Acknowledgments

The authors wish to thank the NASA Global Hydrology Resource Center (GHRC) Data Analysis and Archive Center (DAAC) for providing the orbital data and the climatology data of the TRMM LIS. The WWLLN lightning data were provided by the World Wide Lightning Location Network (http://wwlln.net/), a collaboration among over 50 universities and institutions. The FY-4A LMI data were provided by the National Satellite Meteorological Center, China Meteorological Administration.

Conflicts of Interest

The authors declare no conflict of interest.

References

  1. Williams, E.R. The global electrical circuit: A review. Atmos. Res. 2009, 91, 140–152. [Google Scholar] [CrossRef]
  2. Bruning, E.C.; Weiss, S.A.; Calhoun, K.M. Continuous variability in thunderstorm primary electrification and an evaluation of inverted-polarity terminology. Atmos. Res. 2014, 135–136, 274–284. [Google Scholar] [CrossRef]
  3. Williams, E.R.; Heckman, S.J. The local diurnal variation of cloud electrification and the global diurnal variation of negative charge on the Earth. J. Geophys. Res. Atmos. 1993, 98, 5221–5234. [Google Scholar] [CrossRef]
  4. Bond, D.W.; Steiger, S.; Zhang, R.; Tie, X.; Orville, R.E. The importance of NOx production by lightning in the tropics. Atmos. Environ. 2002, 36, 1509–1519. [Google Scholar] [CrossRef]
  5. Tie, X.; Zhang, R.; Brasseur, G.; Lei, W. Global NOx production by lightning. J. Atmos. Chem. 2002, 43, 61–74. [Google Scholar] [CrossRef]
  6. Reeve, N.; Toumi, R. Lightning activity as an indicator of climate change. Q. J. R. Meteorol. Soc. 1999, 125, 893–903. [Google Scholar] [CrossRef]
  7. Price, C. Evidence for a link between global lightning activity and upper tropospheric water vapour. Nature 2000, 406, 290–293. [Google Scholar] [CrossRef]
  8. Williams, E.R. Lightning and climate: A review. Atmos. Res. 2005, 76, 272–287. [Google Scholar] [CrossRef]
  9. Aich, V.; Holzworth, R.; Goodman, S.; Kuleshov, Y.; Price, C.; Williams, E. Lightning: A new essential climate variable. Eos 2018, 99. [Google Scholar] [CrossRef]
  10. Krider, E.P.; Noggle, R.C.; Uman, M.A. A gated, wideband magnetic direction finder for lightning return strokes. J. Appl. Meteorol. 1976, 15, 301–306. [Google Scholar] [CrossRef] [Green Version]
  11. Richard, P.; Auffray, G. VHF-UHF interferometric measurements, applications to lightning discharge mapping. Radio Sci. 1985, 20, 171–192. [Google Scholar] [CrossRef]
  12. Altaratz, O.; Levin, Z.; Yair, Y.; Ziv, B. Lightning activity over land and sea on the eastern coast of the Mediterranean. Mon. Wea. Rev. 2003, 131, 2060–2070. [Google Scholar] [CrossRef] [Green Version]
  13. Rhodes, C.T.; Shao, X.M.; Krehbiel, P.R.; Thomas, R.J.; Hayenga, C.O. Observations of lightning phenomena using radio interferometry. J. Geophys. Res. 1994, 99, 13059–13082. [Google Scholar] [CrossRef] [Green Version]
  14. Cummins, K.L.; Murphy, M.J.; Bardo, E.A.; Hiscox, W.L.; Pyle, R.B.; Pifer, A.E. A combined TOA/MDF technology upgrade of the U.S. national lightning detection network. J. Geophys. Res. Atmos. 1998, 103, 9035–9044. [Google Scholar] [CrossRef]
  15. Biagi, C.J.; Cummins, K.L.; Kehoe, K.E.; Krider, E.P. National lightning detection network (NLDN) performance in southern Arizona, Texas, and Oklahoma in 2003–2004. J. Geophys. Res. 2007, 112, 1435–1440. [Google Scholar] [CrossRef] [Green Version]
  16. Betz, H.D.; Schmidt, K.; Laroche, P.; Blanchet, P.; Oettinger, W.P.; Defer, E.; Dziewit, Z.; Konarski, J. LINET—An international lightning detection network in Europe. Atmos. Res. 2009, 91, 564–573. [Google Scholar] [CrossRef]
  17. Yao, W.; Zhang, Y.; Meng, Q.; Wang, F.; Lu, W. A comparison of the characteristics of total and cloud-to-ground lightning activities in hailstorms. Acta Meteorol. Sin. 2013, 27, 282–293. [Google Scholar] [CrossRef]
  18. Yang, X.; Sun, J.; Li, W. An analysis of cloud-to-ground lightning in China during 2010–2013. Weather Forecast. 2015, 30, 1537–1550. [Google Scholar] [CrossRef]
  19. Abarca, S.F.; Corbosiero, K.L.; Galarneau, T.J. An evaluation of the worldwide lightning location network (WWLLN) using the national lightning detection network (NLDN) as ground truth. J. Geophys. Res. 2010, 115, D18206. [Google Scholar] [CrossRef]
  20. Hutchins, M.L.; Holzworth, R.H.; Virts, K.S.; Wallace, J.M.; Heckman, S. Radiated VLF energy differences of land and oceanic lightning. Geophys. Res. Lett. 2013, 40, 2390–2394. [Google Scholar] [CrossRef]
  21. Said, R.K.; Cohen, M.B.; Inan, U.S. Highly intense lightning over the oceans: Estimated peak currents from global GLD360 observations. J. Geophys. Res. Atmos. 2013, 118, 6905–6915. [Google Scholar] [CrossRef] [Green Version]
  22. Rudlosky, S.D.; Peterson, M.J.; Kahn, D.T. GLD360 performance relative to TRMM LIS. J. Atmos. Ocean. Technol. 2017, 34, 1307–1322. [Google Scholar] [CrossRef]
  23. Boccippio, D.J.; Heckman, S.; Goodman, S.J. A diagnostic analysis of the Kennedy Space Center LDAR network: 1. Data characteristics. J. Geophys. Res. Atmos. 2001, 106, 4769–4786. [Google Scholar] [CrossRef] [Green Version]
  24. Rison, W.; Thomas, R.J.; Krehbiel, P.R.; Hamlin, T.; Harlin, J. A GPS-based three-dimensional lightning mapping system: Initial observations in central New Mexico. Geophys. Res. Lett. 1999, 26, 3573–3576. [Google Scholar] [CrossRef] [Green Version]
  25. Liu, C.; Heckman, S. Using total lightning data in severe storm prediction: Global case study analysis from north America, Brazil and Australia. In Proceedings of the 2011 International Symposium on Lightning Protection, Fortaleza, Brazil, 3–7 October 2011; IEEE: Fortaleza, Brazil, 2011; pp. 20–24. [Google Scholar]
  26. Wu, F.; Cui, X.; Zhang, D.; Liu, D.; Zheng, D. SAFIR-3000 lightning statistics over the Beijing metropolitan region during 2005–2007. J. Appl. Meteorol. Clim. 2016, 55, 2613–2633. [Google Scholar] [CrossRef]
  27. Boccippio, D.J.; Koshak, W.; Blakeslee, R.; Driscoll, K.; Mach, D.; Buechler, D.; Boeck, W.; Christian, H.J.; Goodman, S.J. The optical transient detector (OTD): Instrument characteristics and cross-sensor validation. J. Atmos. Ocean. Technol. 2000, 17, 441–458. [Google Scholar] [CrossRef]
  28. Christian, H.J.; Blakeslee, R.J.; Goodman, S.J.; Mach, D.M. Algorithm Theoretical Basis Document (ATBD) for the Lightning Imaging Sensor (LIS); NASA Technical Report; NASA: Washington, DC, USA, 2000.
  29. Boccippio, D.J.; Koshak, W.J.; Blakeslee, R.J. Performance assessment of the optical transient detector and lightning imaging sensor. Part I: Predicted diurnal variability. J. Atmos. Ocean. Technol. 2002, 19, 1318–1332. [Google Scholar] [CrossRef]
  30. Finke, U.; Kreyer, O. Detect and Locate Lightning Events from Geostationary Satellite Observations. Report Part I. Review of Existing Lightning Location Systems; EUMETSAT Report, EUM/CO/02/1016/SAT; EUMESTAT: Darmstadt, Germany, 2002. [Google Scholar]
  31. Albrecht, R.I.; Goodman, S.J.; Buechler, D.E.; Blakeslee, R.J.; Christian, H.J. Where are the lightning hotspots on earth? Bull. Am. Meteorol. Soc. 2016, 97, 2051–2068. [Google Scholar] [CrossRef]
  32. Christian, H.J.; Blakeslee, R.J.; Goodman, S.J. The detection of lightning from geostationary orbit. J. Geophys. Res. 1989, 94, 13329–13337. [Google Scholar] [CrossRef]
  33. Chauzy, S.; Coquillat, S.; Soula, S. On the Relevance of Lightning Imagery from Geostationary Satellite Observation for Operational Meteorological Applications; EUMETSAT Technical Report EUM/COL/LET/02/1562; EUMESTAT: Darmstadt, Germany, 2002. [Google Scholar]
  34. Chen, S.B.; Yang, Y.; Cui, T.F. Study of the cloud effect on lightning detection by geostationary satellite. Chin. J. Geophys. 2012, 55, 797–803. [Google Scholar] [CrossRef]
  35. Goodman, S.J.; Blakeslee, R.J.; Koshak, W.J.; Mach, D.; Bailey, J.; Buechler, D.; Carey, L.; Schultz, C.; Bateman, M.; McCaul, E.; et al. The GOES-R geostationary lightning mapper (GLM). Atmos. Res. 2013, 125–126, 34–49. [Google Scholar] [CrossRef] [Green Version]
  36. Rudlosky, S.D.; Goodman, S.J.; Koshak, W.J.; Blakeslee, R.J.; Buechler, D.E.; Mach, D.M.; Bateman, M. Characterizing the GOES-R (GOES-16) geostationary lightning mapper (GLM) on-orbit performance. In Proceedings of the 2017 IEEE International Geoscience and Remote Sensing Symposium (IGARSS), Fort Worth, TX, USA, 23–28 July 2017; IEEE: Fort Worth, TX, USA, 2017; pp. 279–282. [Google Scholar]
  37. Bateman, M.; Mach, D.; Blakeslee, R.J.; Koshak, W.J. Preliminary assessment of detection efficiency for the Geostationary Lightning Mapper using intercomparisons with ground-based systems. In Proceedings of the 2018 American Meteorological Society Annual Meeting, Austin, TX, USA, 7–11 January 2018; AMS: Austin, TX, USA, 2020. [Google Scholar]
  38. Rudlosky, S.D.; Goodman, S.J.; Virts, K.S.; Bruning, E.C. Initial geostationary lightning mapper observations. Geophys. Res. Lett. 2019, 46, 1097–1104. [Google Scholar] [CrossRef]
  39. Marchand, M.; Hilburn, K.; Miller, S.D. Geostationary lightning mapper and earth networks lightning detection over the contiguous united states and dependence on flash characteristics. J. Geophys. Res. Atmos. 2019, 124, 11552–11567. [Google Scholar] [CrossRef]
  40. Peterson, M. Research applications for the geostationary lightning mapper operational lightning flash data product. J. Geophys. Res. Atmos. 2019, 124, 10205–10231. [Google Scholar] [CrossRef]
  41. Yang, J.; Zhang, Z.; Wei, C.; Lu, F.; Guo, Q. Introducing the new generation of Chinese geostationary weather satellites, Fengyun-4. Bull. Am. Meteorol. Soc. 2017, 98, 1637–1658. [Google Scholar] [CrossRef]
  42. Liu, R.-X.; Liu, T.; Pessi, A.; Hui, W.; Cheng, W.; Huang, F.-X. Preliminary study on the influence of FY-4 lightning data assimilation on precipitation predictions. J. Trop. Meteorol. 2019, 25, 528–541. [Google Scholar] [CrossRef]
  43. Hui, W.; Huang, F.; Liu, R. Characteristics of lightning signals over the Tibetan Plateau and the capability of FY-4A LMI lightning detection in the Plateau. Int. J. Remote Sens. 2020, 41, 4605–4625. [Google Scholar] [CrossRef]
  44. Zhang, W.; Hui, W.; Lyu, W.; Cao, D.; Li, P.; Zheng, D.; Fang, X.; Zhang, Y. FY-4A LMI observed lightning activity in super Typhoon Mangkhut (2018) in comparison with WWLLN data. J. Meteorol. Res. 2020, 34, 336–352. [Google Scholar] [CrossRef]
  45. Grandell, J.; Finke, U.; Stuhlmann, R. The EUMETSAT meteosat third generation lightning imager (MTG-LI): Applications and product processing. In Proceedings of the 9th EMS Annual Meeting, Toulouse, France, 28 September–2 October 2009. [Google Scholar]
  46. Defer, E.; Bovalo, C.; Coquillat, S.; Pinty, J.-P.; Farges, T.; Krehbiel, P.; Rison, W. Learning from concurrent lightning imaging sensor and lightning mapping array observations in preparation for the MTG-LI mission. In Proceedings of the EGU General Assembly Conference, Vienna, Austria, 17–22 April 2016. [Google Scholar]
  47. Dobber, M.; Kox, S. Meteosat Third Generaton (MTG) Lightning Imager (LI) calibration and 0–1b data processing. In Proceedings of the 25th CALCON Technical Conference, Loveland, CO, USA, 23 August 2016. [Google Scholar]
  48. Kokou, P.; Willemsen, P.; Lekouara, M.; Arioua, M.; Mora, A.; Van den Braembussche, P.; Neri, E.; Aminou, D.M.A. Algorithmic chain for lightning detection and false event filtering based on the MTG lightning imager. IEEE Trans. Geosci. Remote Sens. 2018, 56, 5115–5124. [Google Scholar] [CrossRef]
  49. Bao, S.; Li, Y.; Tang, S.; Liang, H.; Zhao, X. Instantaneous real-time detection technology of GLI on FY-4 geostationary meteorological satellite. Aerosp. China 2017, 18, 23–30. [Google Scholar]
  50. Liang, H.; Bao, S.; Chen, Q.; Zhao, X.; Li, Y. Design and implementation of FY-4 geostationary lightning imager. Aerosp. Shanghai 2017, 34, 43–51. [Google Scholar]
  51. Cecil, D.J.; Buechler, D.E.; Blakeslee, R.J. Gridded lightning climatology from TRMM-LIS and OTD: Dataset description. Atmos. Res. 2014, 135–136, 404–414. [Google Scholar] [CrossRef] [Green Version]
  52. Christian, H.J.; Blakeslee, R.J.; Goodman, S.J. Lightning Imaging Sensor (LIS) for the Earth Observing System; NASA Technical Memorandum 4350; NASA: Washington, DC, USA, 1992.
  53. Christian, H.J.; Blakeslee, R.J.; Boccippio, D.J.; Koshak, W.J.; Goodman, S.J.; Mach, D.M. Science Data Validation Plan for the Lightning Imaging Sensor (LIS); NASA Technical Report; NASA: Washington, DC, USA, 2000.
  54. Buechler, D.E.; Koshak, W.J.; Christian, H.J.; Goodman, S.J. Assessing the performance of the lightning imaging sensor (LIS) using deep convective clouds. Atmos. Res. 2014, 135–136, 397–403. [Google Scholar] [CrossRef]
  55. Virts, K.S.; Wallace, J.M.; Hutchins, M.L.; Holzworth, R.H. Highlights of a new ground-based, hourly global lightning climatology. Bull. Am. Meteorol. Soc. 2013, 94, 1381–1391. [Google Scholar] [CrossRef] [Green Version]
  56. Lay, E.H.; Holzworth, R.H.; Rodger, C.J.; Thomas, J.N.; Pinto, O.; Dowden, R.L. WWLL global lightning detection system: Regional validation study in Brazil. Geophys. Res. Lett. 2004, 31, L03102. [Google Scholar] [CrossRef] [Green Version]
  57. Rodger, C.J.; Brundell, J.B.; Dowden, R.L. Location accuracy of VLF world-wide lightning location (WWLL) network: Post-algorithm upgrade. Ann. Geophys. 2005, 23, 277–290. [Google Scholar] [CrossRef] [Green Version]
  58. Jacobson, A.R.; Holzworth, R.; Harlin, J.; Dowden, R.; Lay, E. Performance assessment of the world wide lightning location network (WWLLN), using the Los Alamos Sferic Array (LASA) as ground truth. J. Atmos. Ocean. Technol. 2006, 23, 1082–1092. [Google Scholar] [CrossRef]
  59. Rodger, C.J.; Werner, S.; Brundell, J.B.; Lay, E.H.; Thomson, N.R.; Holzworth, R.H.; Dowden, R.L. Detection efficiency of the VLF world-wide lightning location network (WWLLN): Initial case study. Ann. Geophys. 2006, 24, 3197–3214. [Google Scholar] [CrossRef] [Green Version]
  60. Lay, E.H.; Jacobson, A.R.; Holzworth, R.H.; Rodger, C.J.; Dowden, R.L. Local time variation in land/ocean lightning flash density as measured by the world wide lightning location network. J. Geophys. Res. Atmos. 2007, 112, D13111. [Google Scholar] [CrossRef] [Green Version]
  61. Dowden, R.L.; Brundell, J.B.; Rodger, C.J. VLF lightning location by time of group arrival (TOGA) at multiple sites. J. Atmos. Sol. Terr. Phys. 2002, 64, 817–830. [Google Scholar] [CrossRef]
  62. Rodger, C.J.; Brundell, J.B.; Dowden, R.L.; Thomson, N.R. Location accuracy of long distance VLF lightning locationnetwork. Ann. Geophys. 2004, 22, 747–758. [Google Scholar] [CrossRef] [Green Version]
  63. Hutchins, M.L.; Holzworth, R.H.; Brundell, J.B.; Rodger, C.J. Relative detection efficiency of the world wide lightning location network. Radio Sci. 2012, 47, RS6005. [Google Scholar] [CrossRef]
  64. Rodger, C.J.; Brundell, J.B.; Holzworth, R.H.; Lay, E.H. Growing detection efficiency of the world wide lightning location network. AIP Conf. Proc. 2009, 1118, 15–20. [Google Scholar] [CrossRef]
  65. Segundo, H.S.; López, J.A.; Pineda, N.; Altube, P.; Montanyà, J. Sensitivity analysis of lightning stroke-to-flash grouping criteria. Atmos. Res. 2020, 242, 105023. [Google Scholar] [CrossRef]
  66. Fan, P.; Zheng, D.; Zhang, Y.; Gu, S.; Zhang, W.; Yao, W.; Yan, B.; Xu, Y. A performance evaluation of the world wide lightning location network (WWLLN) over the Tibetan Plateau. J. Atmos. Ocean. Technol. 2018, 35, 927–939. [Google Scholar] [CrossRef]
  67. Zhang, W.; Zhang, Y.; Zheng, D.; Xu, L.; Lyu, W. Lightning climatology over the northwest Pacific region: An 11-year study using data from the world wide lightning location network. Atmos. Res. 2018, 210, 41–57. [Google Scholar] [CrossRef]
  68. Abarca, S.F.; Corbosiero, K.L.; Vollaro, D. The World Wide Lightning Location Network and convective activity in tropical cyclones. Mon. Weather Rev. 2011, 139, 175–191. [Google Scholar] [CrossRef] [Green Version]
  69. Price, C.; Asfur, M.; Yair, Y. Maximum hurricane intensity preceded by increase in lightning frequency. Nat. Geosci. 2009, 2, 329–332. [Google Scholar] [CrossRef]
  70. Thomas, J.N.; Solorzano, N.N.; Cummer, S.A.; Holzworth, R.H. Polarity and energetics of inner core lightning in three intense North Atlantic hurricanes. J. Geophys. Res. Atmos. 2010, 115, A00E15. [Google Scholar] [CrossRef] [Green Version]
  71. DeMaria, M.; DeMaria, R.T.; Knaff, J.A.; Molenar, D. Tropical cyclone lightning and rapid intensity change. Mon. Weather Rev. 2012, 140, 1828–1842. [Google Scholar] [CrossRef]
  72. Stevenson, S.N.; Corbosiero, K.L.; Molinari, J. The convective evolution and rapid intensification of Hurricane Earl (2010). Mon. Weather Rev. 2014, 142, 4364–4380. [Google Scholar] [CrossRef]
  73. Solorzano, N.N.; Thomas, J.N.; Hutchins, M.L.; Holzworth, R.H. WWLLN lightning and satellite microwave radiometrics at 37 to 183 GHz: Thunderstorms in the broad tropics. J. Geophys. Res. Atmos. 2016, 121, 12298–12318. [Google Scholar] [CrossRef]
  74. Price, C.; Asfur, M. Can lightning observations be used as an indicator of upper-tropospheric water vapor variability? Bull. Am. Meteorol. Soc. 2006, 87, 291–298. [Google Scholar] [CrossRef]
  75. Zhang, Y.; Ma, M.; Lu, W.; Tao, S. Review on climate characteristics of lightning activity. Acta Meteorol. Sin. 2010, 24, 137–149. [Google Scholar]
  76. Qie, X.; Toumi, R.; Zhou, Y. Lightning activity on the central Tibetan Plateau and its response to convective available potential energy. Chin. Sci. Bull. 2003, 48, 296–299. [Google Scholar] [CrossRef]
  77. Tinmaker, M.I.R.; Aslam, M.Y.; Chate, D.M. Lightning activity and its association with rainfall and convective available potential energy over Maharashtra, India. Nat. Hazards 2015, 77, 293–304. [Google Scholar] [CrossRef]
  78. Li, W.; Qie, X.; Fu, S.; Su, D.; Shen, Y. Simulation of quasi-linear mesoscale convective systems in northern China: Lightning activities and storm structure. Adv. Atmos. Sci. 2016, 33, 85–100. [Google Scholar] [CrossRef]
  79. Hegerl, G.C.; Wallace, J.M. Influence of patterns of climate variability on the difference between satellite and surface temperature trends. J. Clim. 2002, 15, 2412–2428. [Google Scholar] [CrossRef] [Green Version]
  80. Thapliyal, P.K.; Vinayak, M.; Ajil, K.S.; Shah, S.; Pal, P.K.; Joshi, P.C. Estimation of upper tropospheric humidity from water vapour channel of very high-resolution radiometer onboard INSAT-3A and Kalpana satellites. In Proceedings of the Remote Sensing of the Atmosphere and Clouds, Goa, India, 8 December 2006; SPIE: Goa, India, 2006; p. 640807. [Google Scholar]
  81. Kahn, B.H.; Gettelman, A.; Fetzer, E.J.; Eldering, A.; Liang, C.K. Cloudy and clear-sky relative humidity in the upper troposphere observed by the A-train. J. Geophys. Res. 2009, 114, D00H02. [Google Scholar] [CrossRef] [Green Version]
  82. Riemann-Campe, K.; Fraedrich, K.; Lunkeit, F. Global climatology of convective available potential energy (CAPE) and convective inhibition (CIN) in ERA-40 reanalysis. Atmos. Res. 2009, 93, 534–545. [Google Scholar] [CrossRef]
  83. Dewan, A.; Ongee, E.T.; Rafiuddin, M.; Rahman, M.M.; Mahmood, R. Lightning activity associated with precipitation and CAPE over Bangladesh. Int. J. Climatol. 2018, 38, 1649–1660. [Google Scholar] [CrossRef]
  84. Christian, H.J.; Blakeslee, R.J.; Boccippio, D.J.; Boeck, W.L.; Buechler, D.E.; Driscoll, K.T.; Goodman, S.J.; Hall, J.M.; Koshak, W.J.; Mach, D.M.; et al. Global frequency and distribution of lightning as observed from space by the Optical Transient Detector. J. Geophys. Res. 2003, 108, 4005. [Google Scholar] [CrossRef]
  85. Cecil, D.J.; Buechler, D.E.; Blakeslee, R.J. TRMM LIS climatology of thunderstorm occurrence and conditional lightning flash rates. J. Clim. 2015, 28, 6536–6547. [Google Scholar] [CrossRef]
  86. Orville, R.E.; Huffines, G.R.; Burrows, W.R.; Cummins, K.L. The North American lightning detection network (NALDN)—Analysis of flash data: 2001–2009. Mon. Weather Rev. 2011, 139, 1305–1322. [Google Scholar] [CrossRef]
  87. Kandalgaonkar, S.S.; Tinmaker, M.I.R.; Kulkarni, J.R.; Nath, A. Diurnal variation of lightning activity over the Indian region. J. Geophys. Res. 2003, 30, 2022. [Google Scholar] [CrossRef]
  88. Kandalgaonkar, S.S.; Tinmaker, I.R.; Kulkarni, J.R.; Nath, A.; Kulkarni, M.; Trimbake, H.K. Spatio-temporal variability of lightning activity over the Indian region. J. Geophys. Res. 2005, 110, D11108. [Google Scholar] [CrossRef]
  89. Zheng, Y.G.; Chen, J.; Zhu, P. Climatological distribution and diurnal variation of mesoscale convective systems over China and its vicinity during summer. Sci. Bull. 2008, 53, 1574–1586. [Google Scholar] [CrossRef] [Green Version]
  90. Xia, R.; Zhang, D.-L.; Wang, B. A 6-yr cloud-to-ground lightning climatology and its relationship to rainfall over central and eastern China. J. Appl. Meteorol. Climatol. 2015, 54, 2443–2460. [Google Scholar] [CrossRef]
  91. Master, M.J.; Uman, M.A.; Lin, Y.T.; Standler, R.B. Calculations of lightning return stroke electric and magnetic fields above ground. J. Geophys. Res. 1981, 86, 12127–12132. [Google Scholar] [CrossRef]
  92. Quick, M.G.; Krider, E.P. Optical power and energy radiated by natural lightning. J. Geophys. Res. Atmos. 2013, 118, 1868–1879. [Google Scholar] [CrossRef]
  93. Orville, R.E. Peak-current variations of lightning return strokes as a function of latitude. Nature 1990, 343, 149–151. [Google Scholar] [CrossRef]
  94. Rudlosky, S.D.; Fuelberg, H.E. Seasonal, regional, and storm-scale variability of cloud-to-ground lightning characteristics in Florida. Mon. Weather Rev. 2011, 139, 1826–1843. [Google Scholar] [CrossRef] [Green Version]
  95. Beirle, S.; Koshak, W.; Blakeslee, R.; Wagner, T. Global patterns of lightning properties derived by OTD and LIS. Nat. Hazards Earth Syst. Sci. 2014, 14, 2715–2726. [Google Scholar] [CrossRef] [Green Version]
  96. Qu, H.; Yuan, P.; Zhang, T.; Chang, Z. Analysis on the correlation between temperature and discharge characteristic of cloud-to-ground lightning discharge plasma with multiple return strokes. Phys. Plasmas 2011, 18, 013504. [Google Scholar] [CrossRef]
  97. Wang, D.; Takagi, N.; Watanabe, T.; Rakov, V.A.; Uman, M.A.; Rambo, K.J.; Stapleton, M.V. A comparison of channel-base currents and optical signals for rocket-triggered lightning strokes. Atmos. Res. 2005, 76, 412–422. [Google Scholar] [CrossRef]
  98. You, J.; Zheng, D.; Zhang, Y.; Yao, W.; Meng, Q. Duration, spatial size and radiance of lightning flashes over the Asia-Pacific region based on TRMM/LIS observations. Atmos. Res. 2019, 223, 98–113. [Google Scholar] [CrossRef]
  99. He, H.; Zhang, F. Diurnal variations of warm-season precipitation over Northern China. Mon. Weather Rev. 2010, 138, 1017–1025. [Google Scholar] [CrossRef]
  100. Siingh, D.; Kumar, P.R.; Kulkarni, M.N.; Singh, R.P.; Singh, A.K. Lightning, convective rain and solar activity—Over the South/Southeast Asia. Atmos. Res. 2013, 120–121, 99–111. [Google Scholar] [CrossRef]
  101. Finke, U. Optical detection of lightning from space. In Lightning: Principles, Instruments and Applications; Betz, H.D., Schumann, U., Laroche, P., Eds.; Springer: Dordrecht, The Netherlands, 2009; pp. 271–286. [Google Scholar]
  102. Williams, E.; Rothkin, K.; Stevenson, D.; Boccippio, D. Global lightning variations caused by changes in thunderstorm flash rate and by changes in the number of thunderstorms. J. Appl. Meteorol. 2000, 39, 2223–2230. [Google Scholar] [CrossRef]
  103. Boccippio, D.J.; Goodman, S.J.; Heckman, S. Regional differences in tropical lightning distributions. J. Appl. Meteorol. 2000, 39, 2231–2248. [Google Scholar] [CrossRef]
  104. Williams, E.; Stanfill, S. The physical origin of the land–ocean contrast in lightning activity. C. R. Phys. 2002, 3, 1277–1292. [Google Scholar] [CrossRef]
  105. Zheng, D.; Zhang, Y.; Meng, Q.; Chen, L.; Dan, J. Climatological comparison of small- and large-current cloud-to-ground lightning flashes over Southern China. J. Clim. 2016, 29, 2831–2848. [Google Scholar] [CrossRef]
  106. Zhou, E.; Lu, W.; Zhang, Y.; Zhu, B.; Zheng, D.; Zhang, Y. Correlation analysis between the channel current and luminosity of initial continuous and continuing current processes in an artificially triggered lightning flash. Atmos. Res. 2013, 129–130, 79–89. [Google Scholar] [CrossRef]
  107. Bruning, E.C.; MacGorman, D.R. Theory and observations of controls on lightning flash size spectra. J. Atmos. Sci. 2013, 70, 4012–4029. [Google Scholar] [CrossRef]
  108. Zheng, D.; MacGorman, D.R. Characteristics of flash initiations in a supercell cluster with tornadoes. Atmos. Res. 2016, 167, 249–264. [Google Scholar] [CrossRef] [Green Version]
  109. Zhang, Z.; Zheng, D.; Zhang, Y.; Lu, G. Spatial–temporal characteristics of lightning flash size in a supercell storm. Atmos. Res. 2017, 197, 201–210. [Google Scholar] [CrossRef]
  110. Chronis, T.; Lang, T.; Koshak, W.; Blakeslee, R.; Christian, H.; McCaul, E.; Bailey, J. Diurnal characteristics of lightning flashes detected over the São Paulo lightning mapping array. J. Geophys. Res. Atmos. 2015, 120, 11799–11808. [Google Scholar] [CrossRef] [Green Version]
  111. Peterson, M.; Deierling, W.; Liu, C.; Mach, D.; Kalb, C. The properties of optical lightning flashes and the clouds they illuminate. J. Geophys. Res. Atmos. 2017, 122, 423–442. [Google Scholar] [CrossRef]
  112. Qie, X.; Toumi, R.; Yuan, T. Lightning activities on the Tibetan Plateau as observed by the lightning imaging sensor. J. Geophys. Res. 2003, 108, 1–10. [Google Scholar] [CrossRef]
  113. Xu, W. Precipitation and convective characteristics of summer deep convection over East Asia Observed by TRMM. Mon. Weather Rev. 2013, 141, 1577–1592. [Google Scholar] [CrossRef]
  114. Qie, X.; Wu, X.; Yuan, T.; Bian, J.; Lu, D. Comprehensive pattern of deep convective systems over the Tibetan Plateau–South Asian monsoon region based on TRMM data. J. Clim. 2014, 27, 6612–6626. [Google Scholar] [CrossRef]
  115. Chen, J.; Wu, X.; Yin, Y.; Huang, Q.; Xiao, H. Characteristics of cloud systems over the Tibetan Plateau and East China during Boreal Summer. J. Clim. 2017, 30, 3117–3137. [Google Scholar] [CrossRef]
  116. Li, Y.; Zhang, G.; Wen, J.; Wang, D.; Wang, Y.; Zhang, T.; Fan, X.; Wu, B. Electrical structure of a Qinghai–Tibet Plateau thunderstorm based on three-dimensional lightning mapping. Atmos. Res. 2013, 134, 137–149. [Google Scholar] [CrossRef]
  117. Wang, H.; Guo, X. Comparative analyses of vertical structure of deep convective clouds retrieved from satellites and ground-based radars at Naqu over the Tibetan Plateau. J. Meteorol. Res. 2019, 33, 446–462. [Google Scholar] [CrossRef]
  118. Orville, R.E.; Huffines, G.R. Cloud-to-ground lightning in the United States: NLDN results in the first decade, 1989–1998. Mon. Weather Rev. 2001, 129, 1179–1193. [Google Scholar] [CrossRef]
  119. Rakov, V.A.; Huffines, G.R. Return-stroke multiplicity of negative cloud-to-ground lightning flashes. J. Appl. Meteorol. 2003, 42, 1455–1462. [Google Scholar] [CrossRef]
  120. Yair, Y.; Shalev, S.; Erlich, Z.; Agrachov, A.; Katz, E.; Saaroni, H.; Price, C.; Ziv, B. Lightning flash multiplicity in eastern Mediterranean thunderstorms. Nat. Hazards Earth Syst. Sci. 2014, 14, 165–173. [Google Scholar] [CrossRef]
  121. Orville, R.E.; Huffines, G.R. Lightning ground flash measurements over the contiguous United States: 1995–1997. Mon. Weather Rev. 1999, 127, 2693–2703. [Google Scholar] [CrossRef]
  122. Montanyà, J.; Soula, S.; Pineda, N. A study of the total lightning activity in two hailstorms. J. Geophys. Res. Atmos. 2007, 112, D13118. [Google Scholar] [CrossRef]
  123. Tan, Y.-B.; Tao, S.-C.; Zhu, B.-Y.; Ma, M.; LÜ, W.-T. A simulation of the effects of intra-cloud lightning discharges on the charges and electrostatic potential distributions in a thundercloud. Chin. J. Geophys. 2007, 50, 916–930. [Google Scholar] [CrossRef]
  124. Zhang, D.; Cummins, K.L. Time evolution of satellite-based optical properties in lightning flashes, and its impact on GLM flash detection. J. Geophys. Res. Atmos. 2020, 125, e2019JD032024. [Google Scholar] [CrossRef] [Green Version]
  125. Koshak, W.J.; Stewart, M.F.; Christian, H.J.; Bergstrom, J.W.; Hall, J.M.; Solakiewicz, R.J. Laboratory calibration of the optical transient detector and the lightning imaging sensor. J. Atmos. Ocean. Technol. 2000, 17, 905–915. [Google Scholar] [CrossRef]
  126. Zhang, D.; Cummins, K.L.; Bitzer, P.; Koshak, W.J. Evaluation of the performance characteristics of the lightning imaging sensor. J. Atmos. Ocean. Technol. 2019, 36, 1015–1031. [Google Scholar] [CrossRef] [Green Version]
  127. Grandell, J. Algorithm Theoretical Basis Document (ATBD) for L2 Processing of the MTG Lightning Imager Data; EUMETSAT Technical Report EUM/MTG/DOC/11/0155; EUMESTAT: Darmstadt, Germany, 2011. [Google Scholar]
  128. Goodman, S.J.; Mach, D.; Koshak, W.; Blakeslee, R. GLM Lightning Cluster-Filter Algorithm; NOAA NESDIS Center for Satellite Applications and Research, Algorithm Theoretical Basis Document, Version 3.0; NOAA NESDIS STAR: College Park, MD, USA, 2012. [Google Scholar]
  129. Mach, D.M.; Christian, H.J.; Blakeslee, R.J.; Boccippio, D.J.; Goodman, S.J.; Boeck, W.L. Performance assessment of the optical transient detector and lightning imaging sensor. J. Geophys. Res. 2007, 112, D09210. [Google Scholar] [CrossRef]
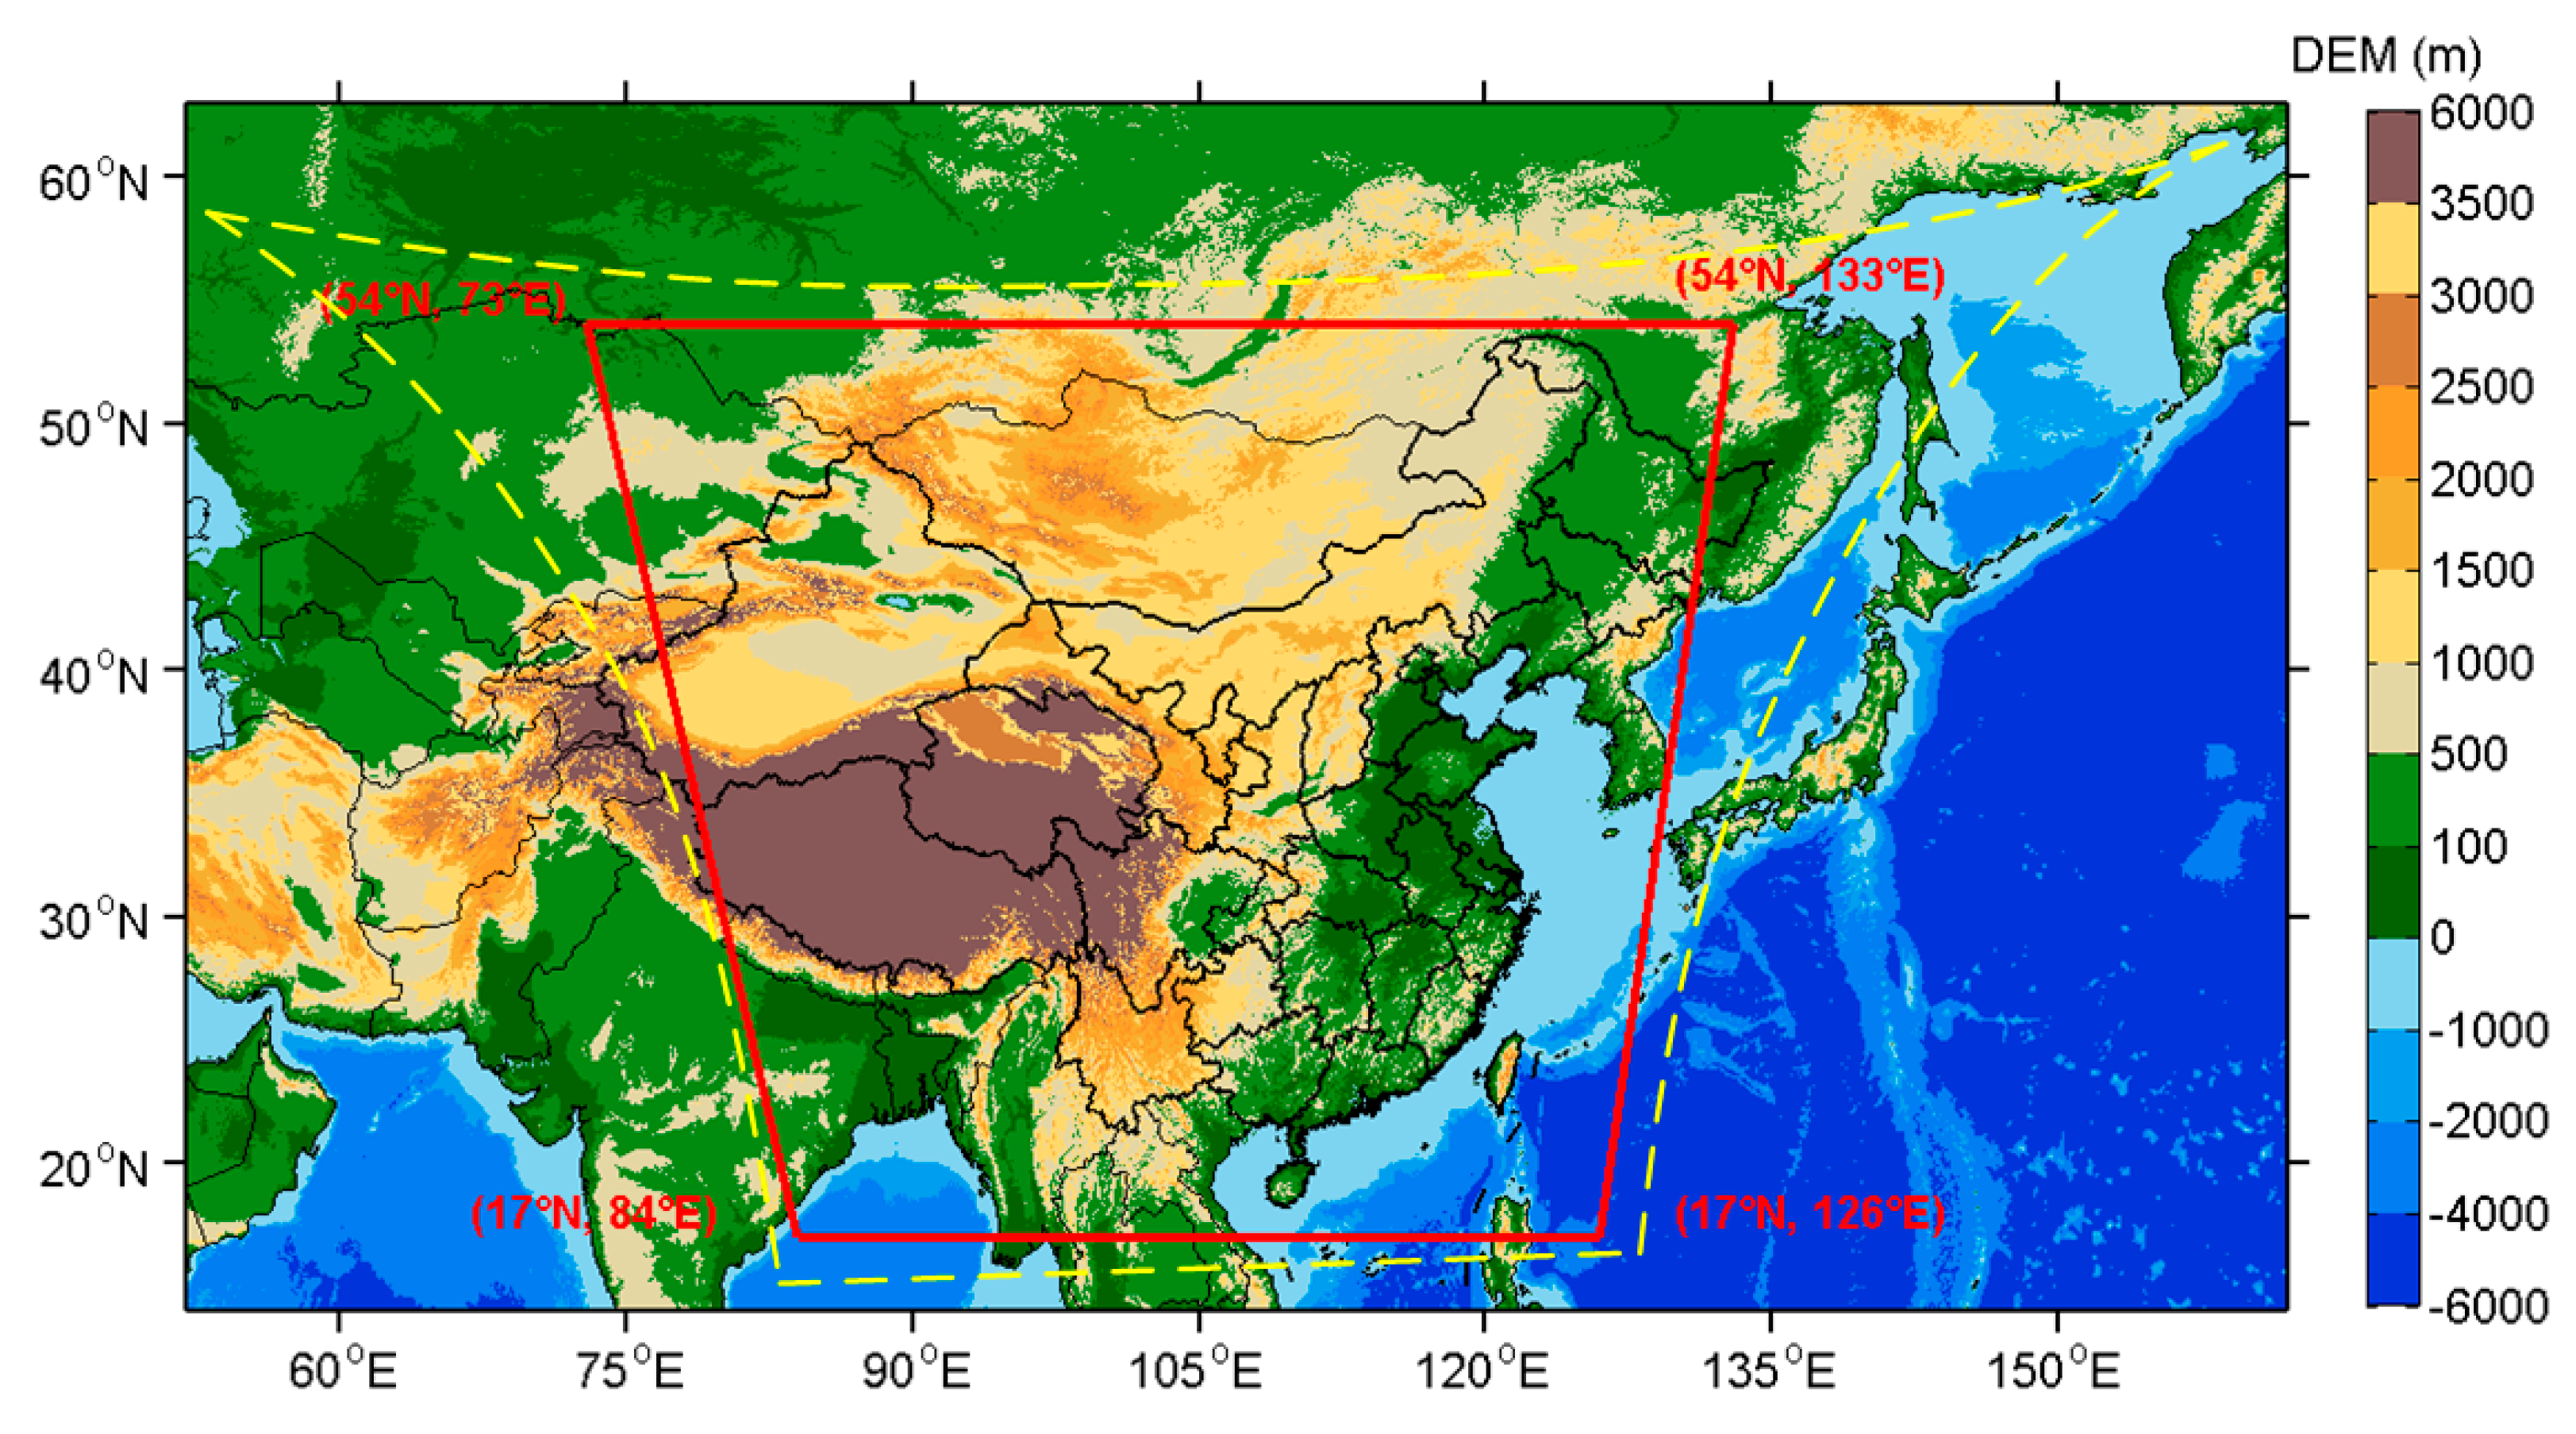
Figure 1. Field of view (FOV) of the FY-4A Lightning Mapping Imager (LMI; area encircled by the yellow dotted line) and the study area (area encircled by the red solid line).
Remotesensing 12 02622 g001
Figure 2. Lightning rate density for (a) LMI flashes, (b) Lightning Imaging Sensor (LIS) flashes, (c) World Wide Lightning Location Network (WWLLN) flashes, (d) LMI groups, (e) LIS groups, (f) WWLLN strokes, (g) LMI events, and (h) LIS events.
Remotesensing 12 02622 g002
Figure 3. Cumulative distribution function (CDF) of lightning rate densities observed by LMI.
Remotesensing 12 02622 g003
Figure 4. Variations in lightning flash rate density during the (left) premonsoon season and (right) monsoon season observed by (a,b) FY-4A LMI, (c,d) TRMM LIS, and (e,f) WWLLN.
Remotesensing 12 02622 g004
Figure 5. Monthly variations in lightning rates observed by FY-4A LMI.
Remotesensing 12 02622 g005
Figure 6. Spatial distributions of the diurnal peak of lightning flash rate observed by (a) FY-4A LMI, (b) TRMM LIS, and (c) WWLLN. Grid cell is 1° × 1°.
Remotesensing 12 02622 g006
Figure 7. Mean (a,b) optical radiance, (c,d) area, and (e,f) duration of lightning flashes, and (g,h) number of groups in flashes in a 1° × 1° grid cell. Left: FY-4A LMI; right: TRMM LIS.
Remotesensing 12 02622 g007
Figure 8. CDF of (a) optical radiance, (b) area, (c) duration of lightning flashes, and (d) number of groups in a flash.
Remotesensing 12 02622 g008aRemotesensing 12 02622 g008b
Figure 9. Relationship between (a) coincidence ratio (CR) and time threshold, (b) CR and space threshold, (c) redundancy ratio (RR) and time threshold, and (d) RR and space threshold.
Remotesensing 12 02622 g009
Table 1. Pearson correlation coefficients between the characteristic parameters of radiation of flashes observed by FY-4A LMI.
Footprint Size (km2)Duration (ms)Groups per Flash
Radiance
(μJ sr−1 m−2 nm−1)
0.730.440.23
Footprint size (km2)-0.440.33
Duration (ms)--0.53