Abstract
In this study, a new moving amplification matching algorithm was proposed, and then the temporal and spatial differences and correlation were analysed and evaluated by comparing the FengYun-4A Lightning Mapping Imager (FY-4A LMI) data and the China Meteorological Administration Lightning Detection Network Advanced TOA and Direction (CMA-LDN ADTD) system data of southwest China in July 2018. The results are as follows. Firstly, the new moving amplification matching algorithm could effectively reduce the number of invalid operations and save the operation time in comparison to the conventional ergodic algorithms. Secondly, LMI has less detection efficiency during the daytime, using ADTD as a reference. The lightning number detected by ADTD increased from 5:00 AM UTC (13:00 PM BJT, Beijing Time) and almost lasted for a whole day. Thirdly, the trends of lightning data change of LMI and ADTD were the same as the whole. The average daily lightning matching rate of the LMI in July was 63.23%. The average hourly lightning matching rate of the LMI in July was 75.08%. Lastly, the mean value of the spherical surface distance in the matched array was 35.49 km, and roughly 80% of the matched distance was within 57 km, indicating that the spatial threshold limit was relatively stable. The correlation between LMI lightning radiation intensity and ADTD lighting current intensity was low.
1. Introduction
The relationship between regional lightning activities and weather, climate change [1] and long-term lightning activities plays an important role in maintaining the global circuit balance between the earth and the ionosphere, global water redistribution, NOx generation and so on [2,3,4]. Many scholars have been interested in these research topics relentlessly [5,6,7,8]. The optical radiation characteristics, including optical radiance, duration and radiation area, of the Tibetan Plateau were compared with those over the central and eastern land region of China at the same latitude based on data acquired by the Lightning Imaging Sensor (LIS) on board the Tropical Rainfall Measuring Mission (TRMM) satellite [9]. The ground observation network can record and analyse the arrival time and position of the waveform feature points continuously and in real time; however, conducting the overall high-precision coverage is difficult due to the constraints of the underlying surfaces (mountains, oceans, lakes and other areas) [10,11] and because the accuracy and stability of the lightning’s location in the cloud are relatively poor [12]. Since the 1960s [13], the lightning detection technology based on optical imaging satellites has developed rapidly, which is marked by the lightning characteristic spectrum obtained from the lightning observation experiment of U-2 aircraft [14,15,16]. In 1995 and 1997, the U.S. successively launched the low earth orbit microlab-1 satellite and the TRMM satellite, and carried two kinds of optical detection instruments, Optical Transient Detector (OTD) [17,18,19] and Lightning Imaging Sensor (LIS), respectively [20,21].
Boccipio et al. [18] used the data of the OTD and the National Lightning Detection Network (NLDN) to discuss the preliminary verification of lightning data from the NLDN to data from the OTD. Hui et al. [22] analysed the observation characteristics of the Lightning Mapping Imager (LMI) through a comparison with the TRMM-LIS and the World Wide Lightning Location Network (WWLLN) observations. Ushio et al. [23] verified the detection process of the LIS by combining the Lightning Detection and Ranging (LDAR) system of the NLDN with the Kennedy Space Centre (KSC). Thomas et al. [24] compared the 3D lightning mapping observation results obtained by Lightning Mapping Array (LMA) with the optical observation results of spatial discharge obtained by LIS data, and found that the two groups of observation data have good temporal and spatial correlation. Heckman et al. [25] studied Intra-cloud (IC) lightning and cloud to ground (CG) lightning, pointing out that the correlation between IC lightning and storm intensity is better than CG lightning, which can greatly enhance the timeliness of early warnings of disastrous weather. Sloop et al. [26] compared the lightning observed by the LIS and the Earth Networks Total Lightning Network (ENTLN), studied the detection efficiency of the ENTLN, and analysed the influence of the change in detection efficiency on the derivative products, such as rainstorm P, prediction and radar. Rudlosky et al. [27] evaluated the data of the World Wide Lightning Location Network (WWLLN) by using the observation data of the LIS on the TRMM satellite. Mach et al. [28] conducted a series of research on the clustering algorithms of the LIS, OTD sensors and so on.
The low-orbit satellite detection instrument cannot continuously monitor lightning in a fixed area. Therefore, it is necessary to develop lightning detectors mounted on a new generation of geostationary orbit meteorological satellites. With the maturity of global space exploration technology, the U.S. and China successfully launched the GOES-R geospatial lightning mapper (GLM) and the FY-4A LMI [29] at the end of 2016. The LMI on FY-4A satellite is one of the main payloads and the first space optical remote sensing instrument in China to detect lightning. The FY-4A LMI provides a comprehensive and broad perspective for China’s regional lightning observation, providing necessary scientific data for lightning disaster warning and prevention, strong convective weather phenomena observation and global atmospheric circulation research in Mainland China and its surrounding areas. Given the short operation time of the FY-4A satellite, only a few studies on the research of FY-4A LMI lightning data exist. Cao [30] explained the working principle and product algorithm of the FY-4A LMI. Hu and Huang [31] used the Monte Carlo method to simulate the lightning radiation observation in the optical band of the satellite, which belongs to the calibration study of the lightning radiation observation in the optical band of the laboratory satellite. Chen et al. [31] converted FY-4A lightning data into maximum FY-4A proxy reflectivity based on a logarithmic relationship between FY-4A lightning density and maximum radar reflectivity, in order to improve the assimilation and forecasting for severe rainfall storms. Especially, studies about the matching and fusion algorithm direction of FY-4A LMI lightning data and ground China Meteorological Administration Lightning Detection Network Advanced TOA and Direction (CMA-LDN ADTD) lightning data remain limited. On the basis of these two kinds of observation data, this study attempts to perform the following two main works. Firstly, this study proposes a moving amplification matching algorithm for the mutual inspection of the lightning data of the FY-4A LMI and CMA-LDN ADTD. The moving amplification matching algorithm is suitable for the comparative analysis of the large amount of initial multi-source lightning data, and it can reduce the time complexity and computational complexity of the data matching and comparison. Secondly, this study analyses the multi-scale characteristics and multi-type correlation of multi-source lightning data on the basis of the moving amplification matching algorithm. Ultimately, this study can provide the reference for developing multi-source lightning data fusion models and improving the overall quality of lightning data.
2. Research Data and Regions
2.1. FY-4A LMI
The FY-4A LMI is the first lightning imager developed and successfully operated in China. The LMI is one of the first two geostationary meteorological satellite lightning imagers in orbit worldwide. It uses Charge Coupled Device (CCD) array and optical imaging technology. It has the advantages of unrestricted terrain, a wide observation range, reliable quality and high space resolution. This study observed the total lightning in the observation area, including IC lightning and CG lightning, to realise real-time and continuous monitoring and tracking of the thunderstorm system. Compared with the new generation of geostationary orbit meteorological satellite GOES-R, which carries the lightning imager GLM to observe the American region in the Western Hemisphere, the FY-4A LMI has realised the first continuous observation of geostationary orbit lightning in Asia and Oceania. The FY-4A satellite lightning imager observes China from spring to autumn yearly, which is the season with higher lightning frequency in China. At other times, the FY-4A LMI observes the Indian Ocean and Western Australia, providing lightning data services for these regions [32,33].
2.2. Lightning Data and Regions
The study area is southwest China, as shown in Figure 1 (green line), with latitude and longitude ranging from 22–32° N and 99–109° E. Southwest China belongs to subtropical monsoon climate, which is hot and rainy in summer with complex terrain. In this case, the region is a lightning-prone area and collecting lightning data is easy. It can be seen in Figure 2 that the red line is a sub-satellite track (104.7° E) with a spatial resolution of approximately 7.8 km. Around the sub-satellite track, LMI lens distortion is small and the lightning observation accuracy is high. Given that the ground application system of FY-4A was officially in operation on 1 May 2018, the sample of LMI lightning in this study is from 1 July 2018–31 July 2018. The sample of ADTD lightning from CMA-LDN is in the same period and region. The detection time resolution of ADTD is 1 μs, and its measurement data mainly include date, time, longitude and latitude and intensity level parameters.
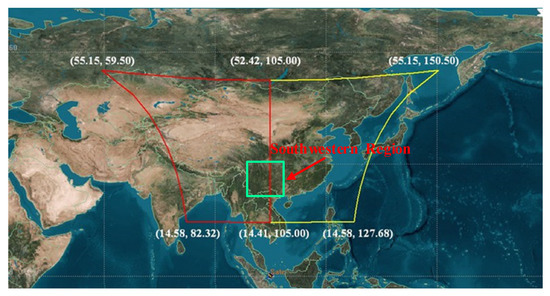
Figure 1.
Overall observation area of the FY-4A Lightning Mapping Imager (LMI) and regional marking line of southwest China [34].
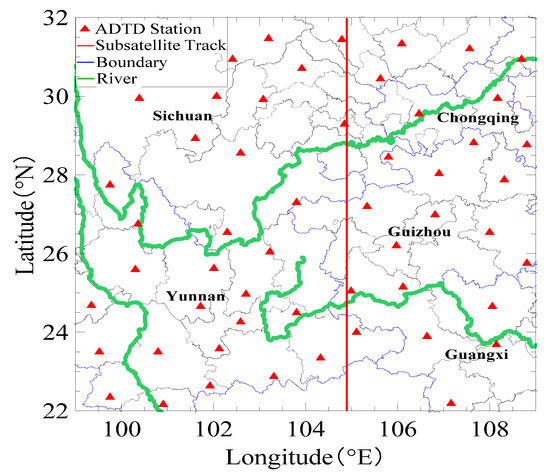
Figure 2.
Distribution of ADTD lightning locator stations in southwest China (excluding the proposed stations).
3. Lightning Detection Principle and Matching Fusion Method
3.1. Lightning Optical Detection and Clustering Principle
The algorithm of the FY-4 lightning imager product takes the L1B data detected by the CCD array of the lightning imager, including the occurrence time, location, radiation brightness and other information of the cloud top lightning ‘luminous event’, as the input data. Through false signal filtering and clustering analysis of L1B data [30,35], the L2 lightning imaging product with “Event”, “Group” and “Flash” information is generated, as shown in Figure 3.
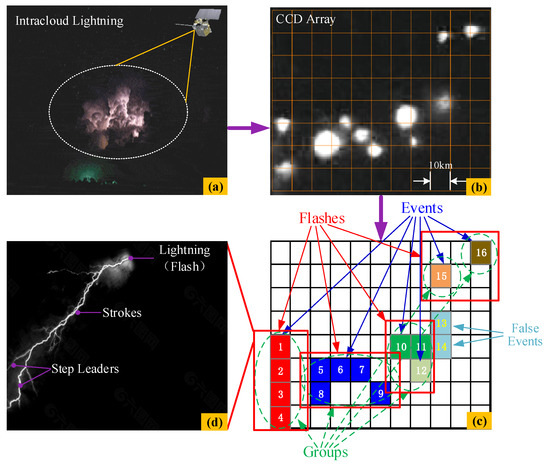
Figure 3.
Schematic diagram of the FY-4A LMI lightning optical detection and lightning clustering process [36] (a) Schematic diagram of lightning physical phenomena (b) Schematic diagram of lightning light signal detected on CCD array of LMI (c) Schematic diagram of lightning multi-layer clustering algorithm (d) Schematic diagram of physical structure of a lightning discharge process.
“Event”: when the radiance of lightning radiation detected by a single pixel of the CCD array of the lightning imager is higher than the background threshold, it is defined as a lightning “event”. That is, the “event” is a luminous phenomenon caused by the light radiation of lightning in the observation area of the pixel through the clouds. Event product parameters mainly include radiance value, row and column number, longitude and latitude and time of occurrence. Events are the basic output units for lightning detection. “Group”: lightning “events” detected by multiple adjacent tiny pixels on the same frame of CCD image form a “group”. Group product parameters mainly include longitude and latitude of centre position, time of occurrence and coverage area. “Flash”: corresponding to a return stroke of a cloud-to-ground lightning or a K change of a cloud lightning, multiple “groups” meeting certain threshold conditions are defined as a real “lightning” process.
Flash product parameters mainly include longitude and latitude of centre position, start time and coverage area. The hierarchical clustering of event-group-flash is necessary. Firstly, in nature, with the triggering of the downward leader of lightning, a lightning process may contain multiple return strokes [37,38,39,40]. The difference of the current value of each return stroke can lead to different spectral radiation values of various intensities, and then various digital numbers (DN) [35] may be produced. The lightning size in a lightning thunderstorm cloud does not correspond to one pixel size of the lightning imager LMI successively. A lightning pulse may illuminate multiple pixels and generate multiple events, as shown in Figure 3d. The events are not necessarily continuous, because the radiation of a lightning pulse signal is often lost in transmission due to the high background threshold or cloud cover. Secondly, the time resolution of the radiation data detected by the CCD array of LMI is fixed, whereas the occurrence time and duration of the lightning pulse signal are random and uncertain, which leads to incomplete lightning in a frame image. All of the above conditions can lead to the difference between the event or group detection results and the actual occurrence value of lightning in time and space. Therefore, flash hierarchical clustering is a good clustering result for events that are sensitive to space interval parameters and groups that are sensitive to time interval parameters.
3.2. Matching Algorithm and Process
The traditional calculation method of data matching usually adopts the matching rule of ergodic search. With multiple constraints as the framework, the data are filtered separately, which will lead to the failure of efficient data matching and may increase the number of operations and ultimately escalate the memory burden and increase the requirements of the computer processors.
The restrictive elements of the lightning data matching algorithm are temporal dimension and spatial dimension, as shown in Figure 4. In this study, a moving amplification matching algorithm is mainly proposed to try to match various lightning data very quickly, and finally change the various lightning data into one kind of lightning data. Then, the consistency and relevance of lightning data before and after matching are evaluated. The algorithm structure is shown in Figure 5. Firstly, the matching range is determined according to the time constraints, and then the matching is carried out according to the spatial constraints in the region. Amongst them, the next matching value uses the upper limit of the target time range corresponding to the previous matching value as the starting point and searches downward in order. Meanwhile, the parameters are transformed, transferred and recorded in the parallel computing to maintain the dynamic characteristics of the matching time window. Taking the calculated result in this study as an example, the lifting rate of the moving amplification matching algorithm is about 150 times (time: 98 s/15,448 s), and the operation frequency is reduced by roughly 350 times (times: 2.2 × 10⁶/7.07 × 108) to effectively reduce the number of invalid operations. According to the constraints of matching time and space [11], no requirement for the uniqueness of matching persists, which will lead to multiple data in the target matching sequence meeting the value to be matched. In this case, the original matching rate of the two kinds of data will be increased. Considering that no strict matching restrictions exist for reference at present, this study temporarily takes a matching principle [11]: |ΔLon| ≤ 0.6°, |ΔLat| ≤ 0.6°, |Δt| ≤ 60 s. As shown in Figure 6, the main flow of data matching processing includes three main aspects: data pre-processing, data matching and data subsequent evaluation processing.
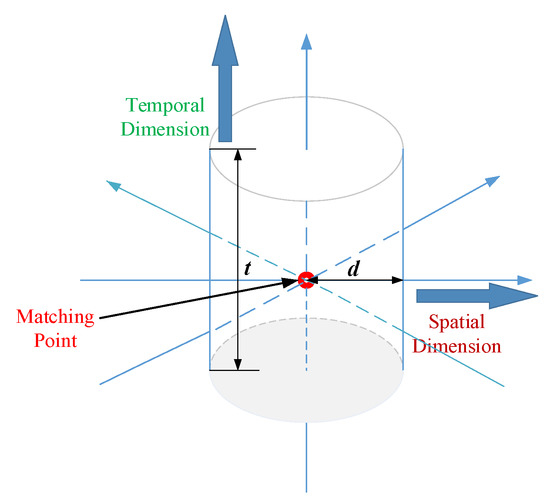
Figure 4.
Schematic diagram of spatiotemporal matching condition parameters.
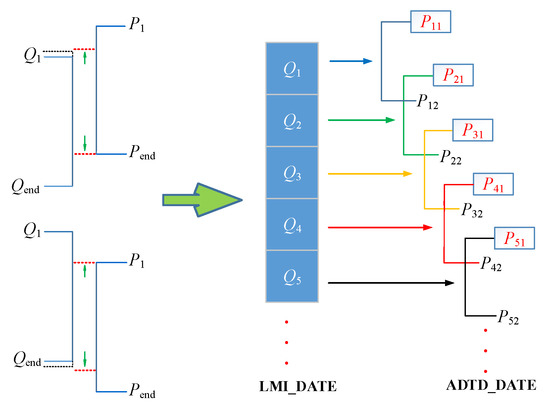
Figure 5.
Schematic diagram of the moving amplification matching algorithm.
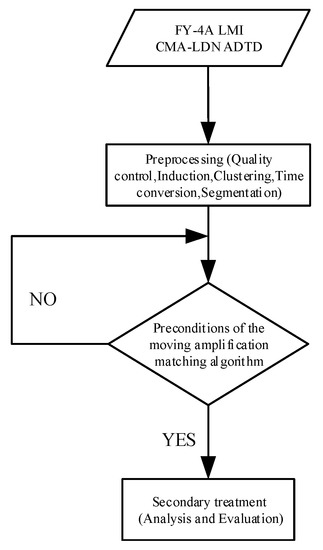
Figure 6.
Framework of the lightning data matching process.
4. Initial Processing and Spatiotemporal Analysis of Lightning Data
4.1. Lightning Clustering and Induction Result Analysis and Partial Data Deviation Analysis
From Table 1, it can be seen that the number of initial events detected by the LMI is 4.9 times the number of strokes detected by ADTD. After the multi-layer clustering process, the number of LMI lightning decreases by approximately 13 times and the total number of ADTD lightning is roughly 1.7 times greater than that of the LMI. However, this conclusion is different from the results of many studies. Prentice and Mackerras [41] observed that the ratio of IC lightning to CG lightning was 3.6 in the subtropical region (27–37° N), and the ratio of IC lightning to CG lightning in different regions published by distinct research results ranged from 1.5–5.5. According to Yao et al. [42], the ratio of IC lightning to CG lightning in the Three Gorges Area in Western Hubei Province is greater than 1. Wang et al. [43] found that 12,900 IC lightning and CG lightning events were observed in Pingliang city in 1998 and 1999, of which 1728 were CG lightning, accounting for 13.4% of the total lightning. Wu et al. [44] found that 299 thunderstorm days and 241,666 lightning events occurred in Beijing from 2005–2007, in which IC lightning and CG lightning accounted for 81% and 19% of the total lightning, respectively. Therefore, the real reason why the number of IC lightning events is less than that of CG lightning in this paper must be further discussed. This study only performs the approval processing.

Table 1.
Lightning data number detected by the ADTD and LMI from 1–31 July 2018.
To maintain matching data consistency, the strokes data detected by ADTD must be summarised into flash according to statistical principles, that is, a complete CG lightning process usually includes several high current pulse processes [40]. The statistical principles used in this study are as follows: the space radius is 10 km (about 0.1°), the interval between two foundation strokes is 500 ms, the duration of one flash is no more than 1 s, the number of continuous strokes is not more than 14 and the two station positioning is excluded [45]. Figure 7 presents the stroke inductive analysis of ADTD in July 2018, which is mainly composed of three variables. The three variables are the daily number of return strokes, the daily number of flashes and the average return stroke number of a single lightning event. The average number of return strokes for each lightning event is 1.57 in terms of the statistics. The LMI flash is generated by transforming events according to the principle of two rounds clustering. The clustering principles [30,36] are as follows. Firstly, events on adjacent CCD array pixels in the same frame (2 ms) are clustered into groups. Secondly, groups clustering with a time interval threshold of less than 330 ms and a spatial interval threshold of less than 16.5 km can obtain a flash.
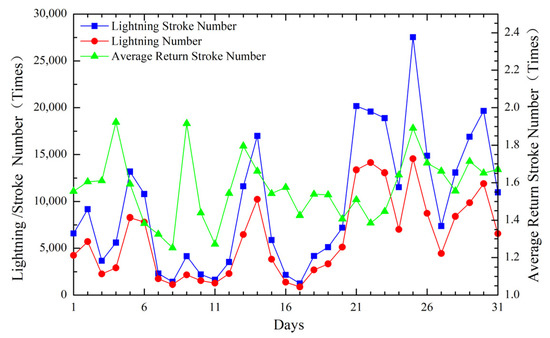
Figure 7.
Lightning strokes inductive analysis curve of ADTD detection data in July 2018 (Left Unit: Times per day; Right Unit: Times per lightning).
4.2. Spatiotemporal Characteristics of Lightning Data before Matching
In a temporal perspective, a thermal diagram is a common display method in a data and time visualisation project. This study analysed the statistical analysis of lightning data in July 2018 in the form of grid thermal map. Figure 8a reveals that two high-value areas exist (a_h4, a_h5), three middle or low value areas exist (a_h1, a_h2, a_h3), and the distribution is relatively concentrated. Figure 8b displays that two high-value areas exist (b_h4, b_h5), four middle or low value areas exist (b_h1, b_h2, b_h3, b_h6), and the duration of each stage of ADTD was longer using the LMI as a reference. The lightning number detected by the LMI was consistently low before 8:00 AM UTC (16:00 PM BJT), and then it increased gradually. The lightning number detected by ADTD increased from 4:00 AM UTC (12:00 PM BJT) and almost lasted for a whole day. These may indicate that the LMI detection was relatively less efficient during the daytime due to the strong background light. Meanwhile, the ADTD detection efficiency was higher using the method of capturing electromagnetic pulse signals during the daytime.
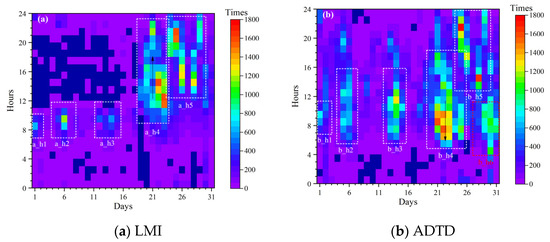
Figure 8.
Grid heat map of LMI lightning data and ADTD lightning data temporal changing in July 2018 (Unit: Times per hour).
In a spatial perspective, in order to obtain the spatial distribution of the original lightning data of the LMI and ADTD, this study analysed the lightning density in July 2018 in the form of isoline. Figure 9a,b shows the isograms of spatial density change of the initial data of the LMI and ADTD (density unit: flashes 100 km−2 Mon−1). The distribution of lightning data in July 2018 of the LMI and ADTD is consistent. However, the distribution area of lightning data in Figure 9b is larger than that in Figure 9a. In a way, the spatial distribution result (Figure 8a,b) is consistent with the temporal distribution (Figure 9a,b) result in terms of distribution area.
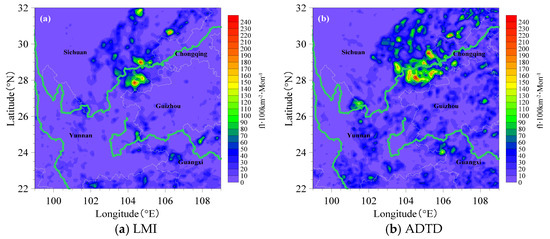
Figure 9.
Spatial density distribution of initial lightning data of the LMI and ADTD in July 2018(fl·100 km−2·Mon−1).
5. Matching Analysis of Lightning Data Detected by LMI and ADTD
5.1. Analysis of Temporal Change
This study focuses on the lightning data detected by the LMI as the main target, that is, to search for the value from the ADTD lightning data that can match the LMI lightning data with the matching principle. Figure 10a,b presents the daily variation of lightning data and Figure 10c,d gives the hourly variation of lightning data. It can be seen that with the increase in lightning number in late July, the matching number between the LMI and ADTD is also increasing, and the matching rate during this period also presents a high level. The average daily matching rate of the LMI in July is 63.23% and the range is [19.89%, 90.05%]. The average hourly lightning matching rate of the LMI in July is 75.08%, and the range is [51.01%, 89.06%]. Although the whole change trends of cumulative probability (green line) in Figure 10a,b or in Figure 10c,dare the same, the independent daily change in Figure 10a,b or the independent hourly change in Figure 10c,d are not strictly the same. In the process of matching with the LMI lightning data, a certain proportion of ADTD lightning data is repeatedly matched over twice (n ≥ 2), as shown in the yellow columns in Figure 10b,d. The red columns in Figure 10b,d mean that only one match exists between the ADTD and LMI lightning data. The reason is that the unique ADTD data cannot be determined when several ADTD data meet the matching principle. If the matching uniqueness of ADTD lightning data is implemented in matching with the LMI lightning data, the matching rate of the LMI lightning data may be further reduced. This unique hypothesis is an important point for future research.
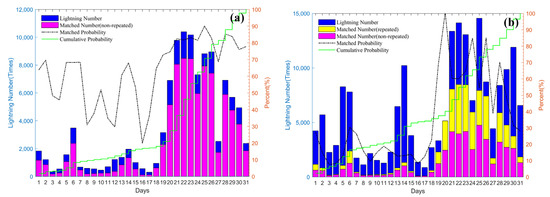
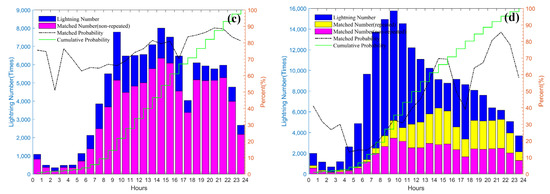
Figure 10.
Variation in the lightning matching number between the LMI and ADTD in southwest China in July 2018 (a) LMI daily lightning data change statistics (unit: day) (b) ADTD daily lightning data change statistics (c) LMI hourly lightning data change statistics (unit: hour) (d) ADTD hourly lightning data change statistics.
5.2. Spatial Variation Analysis of Matching Density
Figure 11a,b exhibits that the lightning matching density contour maps of the LMI and ADTD (density unit: flashes 100 km2 Mon−1) are shown, respectively, and that a good consistency exists between them. However, the central value of the number of matches in Figure 11b is large, which is because no unique restriction exists on the ADTD data in the downward search statistics with the LMI as the target matching object after using the moving amplification matching algorithm. Thus, under the matching algorithm, one ADTD lightning datum may correspond to multiple LMI lightning data, and it is repeatedly accumulated and counted. This study further explains that the moving amplification matching algorithm can be used as a significant test mark, whether it is necessary to conduct further research in the future.
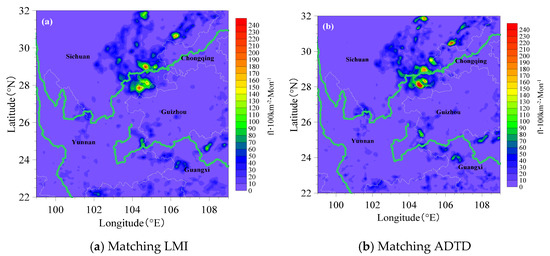
Figure 11.
Spatial density distribution of matched lightning data of the LMI and ADTD in July 2018(fl·100 km−2·Mon−1).
5.3. Feature Analysis of Matching Distance
To explore the spatial distance between the LMI and ADTD lightning matching data, this study uses the Haversine formula to calculate the spherical surface distance of the lightning matching data of the LMI and ADTD under the matching principle, as is shown in Figure 12. The results show that the average spherical surface distance of the matching data is 35.49 km. About 80% of the matching distance is within 57 km, indicating that the principle of spatial threshold is relatively stable. Since the moving amplification matching algorithm selects the first value that meets the matching principle, the statistics of the spherical surface distance between the LMI and ADTD matching data array are only for reference.
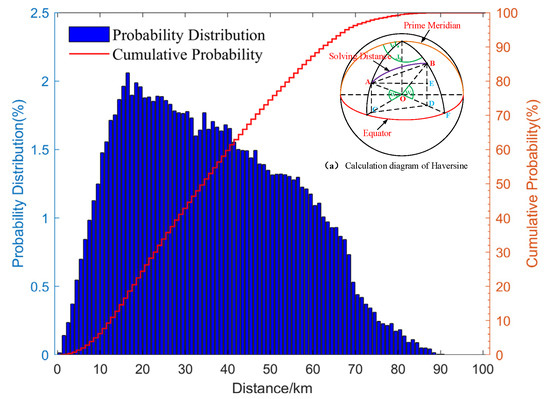
Figure 12.
Feature analysis of matching spherical distance of Lightning Array Data.
5.4. Correlation Analysis between LMI Lightning Radiation Intensity and ADTD Lightning Current Intensity
The discharge (return stroke) current at the moment of a lightning event can heat the lightning channel to tens of thousands of K, which makes the whole lightning channel present a plasma state. The particles in the transition from a high-energy state to a low-energy state can produce spectral radiation. Under the combined action of compound radiation and bremsstrahlung, OI 777.4 nm is the central peak wavelength in the infrared spectrum, which is the detection characteristic band of the LMI CCD array. Therefore, the spectral radiance in the LMI lightning data should also be positively correlated with lightning channel temperature. This inference is in good agreement with the current and integral brightness.
Pearson correlation is the main method to measure the similarity of parameters. Therefore, the correlation and significance level of two main parameters (radiation value and current intensity) in the matching data of daily lightning data and hourly lightning data are analysed. Figure 13 shows that the specific parameters are the current intensity value of ADTD and the lightning optical radiation value of the LMI. In theory, the significance level test is needed for correlation analysis, so the cases that fail to pass the significance test (p > 0.05) are ignored. Figure 13 reveals the significance result analysis. The correlation coefficient R (Pearson correlation coefficient, R) with significant significance (p < 0.05) is marked with a red box, and the blue circle is the significance level value corresponding to the coefficient. Considering that the CCD array of the LMI is used to measure the intensity of the brightness value after eliminating background light, the radiation value is positive. Therefore, it is added to make absolute value processing for the corresponding ADTD lightning current intensity value, and then conduct correlation analysis. Figure 13b,d displays that the proportion of the positive correlation coefficient between the correlation number R and the time correlation coefficient r increases. On the whole, the daily correlation coefficient r at the significant level of p < 0.05 is in the range of [−0.4, 0.4], and the value of time-dependent value r is in the range of [−0.2, 0.2], and both of them showed a low correlation.
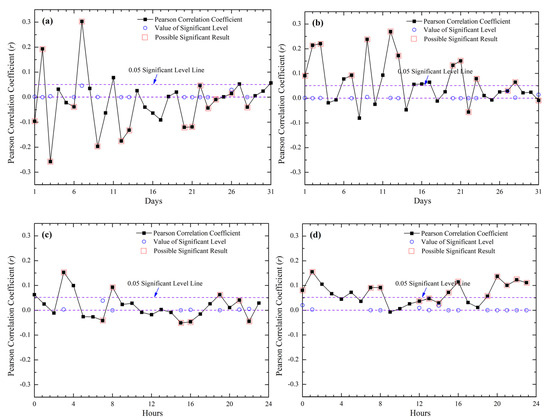
Figure 13.
Analysis of correlation and significance between the LMI lightning radiation intensity and ADTD lightning current intensity (a) Daily analysis chart of lightning intensity without absolute value treatment (b) Daily analysis chart of lightning intensity absolute value treatment (c) Time analysis chart of lightning intensity without absolute value treatment (d) Time analysis chart of lightning intensity absolute value treatment.
5.5. Characteristic Analysis of Matching Index
With the increase in the number of daily matching lightning, firstly, the daily lightning matching rate of the LMI also increases, secondly, the average number of ADTD lightning data, which is matched by at least one LMI lightning datum, also shows an increasing trend, and thirdly, the ratio of a single LMI lightning datum matching the multiple ADTD lightning data (n ≥ 2) increases. The overall change trends of the above three parameters are consistent in the three main intervals (green box in Figure 14).
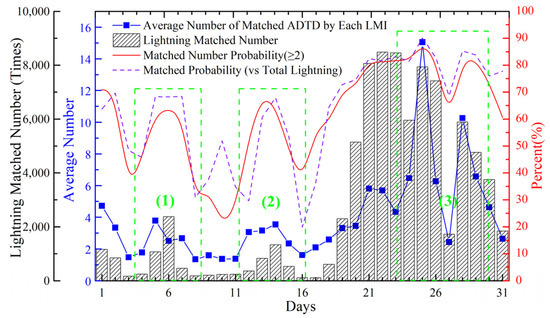
Figure 14.
Trend analysis chart of various lightning matching results.
Figure 15 exhibits that the cumulative distribution diagram of the number of ADTD lightning data can be matched by a single LMI lightning datum. Further analysis of the matching data shows that the probability of a unique matching relationship between the LMI lightning data and ADTD lightning data is 22.79%, the probability that a single LMI lightning datum can match multiple ADTD lightning data (1 ≤ n ≤ 10) is 83.62%, and the probability that a single LMI lightning datum can match multiple ADTD lightning data (1 ≤ n ≤ 20) is 95.08%. When the number of ADTD lightning data matched by a single LMI lightning datum reaches over one (n ≥ 1), the average ratio of the daily matching rate is 63.23%.
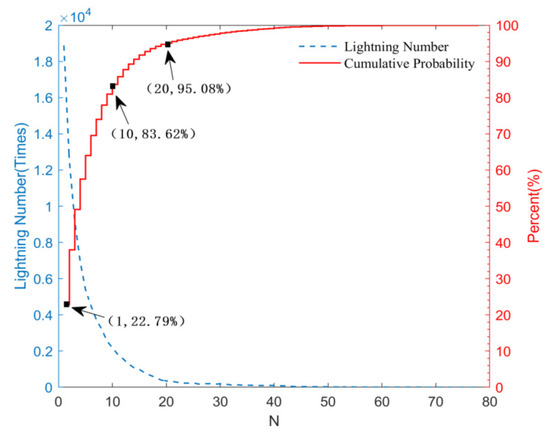
Figure 15.
Cumulative probability diagram of quantity distribution of a single LMI lightning datum and its matching ADTD lightning data.
If it is expected to accurately verify the matching between the LMI and ADTD daily lightning data, there may be some difficulties. The main reasons are the difference in detection principle between the two kinds of lightning detection equipment and the influence of their detection accuracy. The LMI cannot measure polarity and it is more sensitive to IC lightning (cloud top brightness). ADTD can measure the polarity and intensity of lightning and it is more sensitive to CG lightning. The detection efficiency of ADTD will decrease with the increase in altitude, which leads to the unsatisfactory detection effect of electromagnetic radiation generated by IC lightning at high altitude. Generally speaking, random results will be produced with the change of matching principle and space lightning density for two kinds of detection data with different emphasis on targets. In that case, if there is a requirement for the accurate location of a single lightning event, the matching conclusions can only be used for reference.
ADTD is sensitive to CG lightning, which occurs mostly in the mature and dissipation stages of thunderstorms and less in the development stage. The LMI is sensitive to IC lightning, and this accounts for a larger proportion of total lightning, especially in its early development stage. Both of them focus on the application of severe weather warnings [34,46,47,48]. According to the results in this study, we hold the view that the overall statistical results of the ADTD and LMI lightning detection data have long-standing good consistency at a large spatial scale. Further analysis of the data at a narrow spatial scale is required, warranting the accurate verification of the feasibility of the two results from different equipment and methods. The two detection results can be cross referenced and supplemented to a certain extent.
6. Conclusions and Prospect Discussions
Using the FY-4A LMI lightning data and CMA-LDN ADTD lightning data in July 2018 as sample data, this study proposed a new moving amplification matching algorithm to compare the temporal and spatial differences and correlation between LMI lightning and ADTD lightning from multiple perspectives. The main results of this study are summarized as follows:
- This study proposed a new moving amplification matching algorithm and described the basic idea of the algorithm. The application results showed that, compared with the conventional ergodic algorithm, the new moving amplification matching algorithm could significantly reduce the time complexity and operation frequency with the increase in data volume.
- The lightning number detected by the LMI was consistently low before 8:00 AM UTC (16:00 PM BJT), and then it increased gradually. The lightning number detected by ADTD increased from 4:00 AM UTC (12:00 PM BJT) and almost lasted for a whole day. These indicated that the LMI detection was relatively less efficient during the daytime due to the strong background light. Meanwhile, ADTD detection efficiency was higher using the method of capturing electromagnetic pulse signals during the daytime.
- The average daily matching rate of the LMI in July was 63.23% and the range was [19.89%, 90.05%]. The average hourly lightning matching rate of the LMI in July was 75.08%, and the range was [51.01%, 89.06%]. Although the whole change trends of daily or hourly cumulative probability of ADTD and LMI were the same, the independent daily change of ADTD and LMI or the independent hourly change of ADTD and LMI were not strictly the same.
- In the matching array, the average surface distance of the matching data was 35.49 km. About 80% of the matching results were within 57 km, indicating that the principle of spatial threshold was relatively stable. Within the two time scales, the correlation between the LMI lightning radiation intensity and ADTD lightning current intensity was weak. The results showed that there was a good consistency between the four parameters: the matching rate of LMI daily lightning data; the average number of ADTD lightning data, which was matched by at least one LMI lightning datum; the number of LMI daily lightning and the ratio of a single LMI lightning datum matching the multiple ADTD lightning data (n ≥ 2). However, only 22.79% of the daily matching results of the LMI lightning data and the ADTD lightning data had a one-to-one matching relationship.
In this study, a moving matching algorithm is proposed. The detection characteristics of the LMI on FY-4A and the comparison results between the LMI and ADTD data in Southwest China are preliminarily revealed, which provides observation facts and a basis for the fusion and utilization of the lightning data of ADTD and LMI in the future. However, due to the short on-orbit time and limited data of the LMI, our understanding of the LMI is still lacking. Therefore, with the accumulation and diversification of observation data, these problems will be solved.
Author Contributions
Data curation, W.P. and W.H.; investigation, W.Z., J.C. and P.L.; methodology, W.P., W.Z. and P.L.; writing—original draft preparation, P.L. and L.Z.; supervision, W.P. and G.Z. All authors have read and agreed to the published version of the manuscript.
Funding
This research was supported by the Heilongjiang Provincial Natural Science Foundation of China, LH2019E120. Development and Application of Key Technologies for the Comprehensive Integration of Surface Meteorological Observation, GYHY201306070.
Acknowledgments
The authors wish to thank the National Satellite Meteorological Center, China Meteorological Administration, for providing the FY-4A LMI data. The ADTD data were provided by the Meteorological Observation Center, China Meteorological Administration.
Conflicts of Interest
The authors declare no conflict of interest.
References
- Reeve, N.; Toumi, R. Lightning activity as an indicator of climate change. Q. J. R. Meteorol. Soc. 1999, 125, 893–903. [Google Scholar] [CrossRef]
- Bond, D.W.; Steiger, S.; Zhang, R.Y.; Tie, X.X.; Orville, R.E. The Importance of NOx Production by Lightning in the Tropics. Atmos. Environ. 2002, 36, 1509–1519. [Google Scholar] [CrossRef]
- Markson, R.; Muir, M. Solar Wind Control of the Earth’s Electric Field. Science 1980, 208, 979–990. [Google Scholar] [CrossRef] [PubMed]
- Schumann, U.; Huntrieser, H. The global lightning-induced nitrogen oxides source. Atmos. Chem. Phys. 2007, 7, 3823–3907. [Google Scholar] [CrossRef]
- Heckman, S.; Er, W.; Boldi, B. Total global lightning inferred from Schumann resonance measurements. J. Geophys. Res. 1998, 1033, 31775–31780. [Google Scholar] [CrossRef]
- Labrador, L.; Vaughan, G.; Heyes, W.; Waddicor, D.; Volz-Thomas, A.; Pätz, H.W.; Höller, H. Lightning-produced NOx during the Northern Australian monsoon; results from the ACTIVE campaign. Atmos. Chem. Phys. 2009, 9, 7419–7429. [Google Scholar] [CrossRef]
- Miyahara, H.; Higuchi, C.; Terasawa, T.; Kataoka, R.; Sato, M.; Takahashi, Y. Solar 27-day rotational period detected in wide-area lightning activity in Japan. Ann. Geophys. 2017, 35, 583–588. [Google Scholar] [CrossRef]
- Sato, M.; Fukunishi, H. New evidence for a link between lightning activity and tropical upper cloud coverage. Geophys. Res. Lett. 2005, 32, L12807. [Google Scholar] [CrossRef]
- Hui, W.; Huang, F.X.; Liu, R.X. Characteristics of lightning signals over the Tibetan Plateau and the capability of FY-4A LMI lightning detection in the Plateau. Int. J. Remote Sens. 2020, 41, 4603–4623. [Google Scholar] [CrossRef]
- Albrecht, R.; Goodman, S.; Buechler, D.; Blakeslee, R.; Christian, H. Where are the lightning hotspots on Earth? Bull. Am. Meteorol. Soc. 2016, 97, 2051–2068. [Google Scholar] [CrossRef]
- Hui, W.; Huang, F.X.; Guo, Q. Combine application of lightning detection adta from satellite and groud-based observations. Opt. Precis. Eng. 2018, 26, 218–229. (In Chinese) [Google Scholar] [CrossRef]
- Finke, U.; Kreyer, O. Detect and Locate Lightning Events from Geostationary Satellite Observations; Technical Report EUM/CO/02/1016/SAT; EUMESTAT: Darmstadt, Germany, 2002; Volume 23, pp. 102–130. [Google Scholar]
- Herman, J.R.; Caruso, J.A.; Stone, R.G. Radio Astronomy Explorer (RAE)—I. Observations of terrestrial radio noise. Planet. Space Sci. 1973, 21, 443–461. [Google Scholar] [CrossRef]
- Brook, M.; Rhodes, C.; Vaughan, O.H., Jr.; Orville, R.E.; Vonnegut, B. Nighttime observations of thunderstorm electrical activity from a high altitude airplane. J. Geophys. Res. Atmos. 1985, 90, 6111–6120. [Google Scholar] [CrossRef]
- Christian, H.; Frost, R.; Gillaspy, P.; Goodman, S.; Vaughan, O., Jr.; Brook, M.; Vonnegut, B.; Orville, R. Observations of Optical Lighting Emissions from above Thunderstorms Using U-2 Aircraft. Bull. Am. Meteorol. Soc. 1983, 64, 120–123. [Google Scholar] [CrossRef][Green Version]
- Heymsfield, G.; Fulton, R. Comparison of High-Altitude Remote Aircraft Measurements with the Radar Structure of an Oklahoma Thunderstorm: Implications for Precipitation Estimation from Space. Mon. Weather Rev. 1988, 116, 1157–1174. [Google Scholar] [CrossRef]
- Blakeslee, R.; Driscoll, K.; Buechler, D.; Boccippio, D.; Boeck, W.; Christian, H.; Goodman, S.; Hall, J.; Koshak, W.; Mach, D.; et al. Diurnal Lightning Distribution as Observed by the Optical Transient Detector (OTD). In Proceedings of the 11th International Conference on Atmospheric Electricity, Huntsville, AL, USA, 1 June 1999; NASA Marshall Space Flight Center: Huntsville, AL, USA, 1999; pp. 742–745. [Google Scholar]
- Boccippio, D.; Koshak, W.; Blakeslee, R.; Driscoll, K.; Mach, D.; Buechler, D.; Boeck, W.; Christian, H.; Goodman, S. The Optical Transient Detector (OTD): Instrument Characteristics and Cross-Sensor Validation. J. Atmos. Ocean. Technol. 2000, 17, 441–458. [Google Scholar] [CrossRef]
- Christian, H.; Blakeslee, R.; Boccippio, D.; Boeck, W.; Buechler, D.; Driscoll, K.; Goodman, S.; Hall, J.; Koshak, W.; Mach, D.; et al. Global Frequency and Distribution of Lightning as Observed from Space by the Optical Transient Detector. J. Geophys. Res. 2003, 108, 4005. [Google Scholar] [CrossRef]
- Thompson, K.; Bateman, M.; Carey, L. A Comparison of Two Ground-Based Lightning Detection Networks against the Satellite-Based Lightning Imaging Sensor (LIS). J. Atmos. Ocean. Technol. 2014, 31, 2191–2205. [Google Scholar] [CrossRef]
- Ushio, T.; Driscoll, K.; Heckman, S.; Boccippio, D.; Koshak, W.; Christian, H. Initial Comparison of the Lightning Imaging Sensor (LIS) with Lightning Detection and Ranging (LDAR). In Proceedings of the 11th International Conference on Atmospheric Electricity, Guntersville, AL, USA, 7–11 June 1999; pp. 738–741. Available online: https://ntrs.nasa.gov/search.jsp?R=19990108787 (accessed on 14 September 2020).
- Hui, W.; Zhang, W.J.; Lyu, W.T.; Li, P.F. Preliminary Observations from the China Fengyun-4A Lightning Mapping Imager and Its Optical Radiation Characteristics. Remote Sens. 2020, 12, 2622. [Google Scholar] [CrossRef]
- Ushio, T.; Heckman, S.; Driscoll, K.; Boccippio, D.; Christian, H.; Kawasaki, Z.I. Cross-sensor comparison of the Lightning Imaging Sensor (LIS). Int. J. Remote Sens. 2002, 23, 2703–2712. [Google Scholar] [CrossRef]
- Thomas, R.; Krehbiel, P.; Rison, W.; Hamlin, T.; Boccippio, D.; Goodman, S.; Christian, H. Comparison of ground-based 3-dimensional lightning mapping observations with satellite-based LIS observations in Oklahoma. Geophys. Res. Lett. 2000, 27, 1703–1706. [Google Scholar] [CrossRef]
- Heckman, S.; Liu, C. The application of total lightning detection and cell tracking for severe weather prediction. In Proceedings of the International Conference on Grounding and Earthing & 4th International Conference on Lightning Physics and Efficiency, Salvador, Brazil, 7 November 2010. [Google Scholar] [CrossRef]
- Sloop, C. Analysis of Earth Networks Total Lightning Detection Efficiency versus LIS for 2011 through 2013 in North America; AGU Fall Meeting Abstracts; American Geophysical Union: Washington, DC, USA, December 2013. [Google Scholar] [CrossRef]
- Rudlosky, S.D. Evaluating Ground-Based Lightning Detection Networks using TRMM/LIS Observations. In Proceedings of the 23rd International Lightning Detection Conference, Tucson, AZ, USA, 18–21 March 2014; Available online: https://www.vaisala.com/sites/default/files/documents/Rudlosky-Evaluating%20Ground-Based%20Lightning%20Detection%20Networks%20using%20TRMM%20and%20LIS%20Observations-2014-ILDC-ILMC.pdf (accessed on 15 September 2020).
- Mach, D.; Christian, H.; Blakeslee, R.; Boccippio, D.; Goodman, S.; Boeck, W. Performance assessment of the Optical Transient Detector and Lightning Imaging Sensor. J. Geophys. Res. (Atmos.) 2007, 112, 9210. [Google Scholar] [CrossRef]
- Liu, R.X.; Lu, Q.F.; Min, C.; Zhang, Y.; Li, X.Q. Quality Assessment of FY-4A Lightning Data in Inland China. J. Trop. Meteorol. 2020, 3, 286–299. [Google Scholar] [CrossRef]
- Cao, D.J. The Development of Product Algorithm of the Fengyun-4 Geostationary Lightning Mapping Imager. Adv. Meteorol. Sci. Technol. 2016, 6, 94–98. (In Chinese) [Google Scholar] [CrossRef]
- Chen, Y.D.; Yu, Z.; Han, W.; He, J.; Chen, M. Case Study of a Retrieval Method of 3D Proxy Reflectivity from FY-4A Lightning Data and Its Impact on the Assimilation and Forecasting for Severe Rainfall Storms. Remote Sens. 2020, 12, 1165. [Google Scholar] [CrossRef]
- Liu, Y.; Li, Z.; Wang, H.B. Comparison and Analysis of Lightning Occurrence Characteristics Based on Data Obtained by Fengyun-4A Satellite and ADTD Three-Dimensional Lightning Monitoring Network in Jiangsu Province. In Proceedings of the 11th Asia-Pacific International Conference on Lightning (APL), Hong Kong, China, 12–14 June 2019; pp. 1–4. [Google Scholar] [CrossRef]
- Liu, Y.; Wang, H.B.; Li, Z.; Wang, Z.H. A verification of the lightning detection data from FY-4A LMI as compared with ADTD-2. Atmos. Res. 2020, 248, 105163. [Google Scholar] [CrossRef]
- Zhang, W.J.; Hui, W.; Lv, W.T.; Cao, D.J.; Li, P.F.; Zheng, D.; Fang, X.; Zhang, Y.J. FY-4A LMI Observed Lightning Activity in Super Typhoon Mangkhut (2018) in Comparison with WWLLN Data. J. Meteorol. Res. 2019, 34, 1–17. [Google Scholar] [CrossRef]
- Christian, H.J.; Blakeslee, R.J.; Goodman, S.J.; Douglas, M.M. Algorithm Theoretical Basis Document (ATBD) for the Lightning Imaging Sensor (LIS). NASA-MSFC; Earth Science Department: Washington, DC, USA, 2000. [Google Scholar]
- Cao, D.J.; Fang, X.; Huang, F.X. Detection Principle and Application Prospect of Lightning Imaging Sensor on FY-4 Meteorological Satellite; Technical Report; National Satellite Meteorological Center: Beijing, China, 2017; p. 4. (In Chinese)
- Rousseau, A.; Zang, X.Y.; Tao, M. Multiple shots on SPDs—Additional tests. In Proceedings of the 2014 International Conference on Lightning Protection (ICLP), Shanghai, China, 11–18 October 2014; pp. 997–1001. [Google Scholar] [CrossRef]
- Rakov, V.A.; Uman, M.A.; Rambo, K.J. A review of ten years of triggered-lightning experiments at Camp Blanding, Florida. Atmos. Res. 2005, 76, 503–517. [Google Scholar] [CrossRef]
- Heidler, F.; Flisowski, Z.; Zischank, W.; Bouquegneau, C. Parameters of Iightningcurrent given on IEC62305-Backgroud, experimental outlook. In Proceedings of the 2008 International Conference on Lightning Protect (ICLP), Uppsala, Sweden, 23–26 June 2008; pp. 1–22. [Google Scholar]
- Zhang, C.L.; Xing, H.Y.; Li, P.F.; Li, C.Y.; Lv, D.B.; Yang, S.J. An Experimental Study of the Failure Mode of ZnO Varistors Under Multiple Lightning Strokes. Electronics 2019, 8, 172. [Google Scholar] [CrossRef]
- Prentice, S.; MacKerras, D. The Ratio of Cloud to Cloud-Ground Lightning Flashes in Thunderstorms. J. Appl. Meteorol. 1977, 16, 545–550. [Google Scholar] [CrossRef]
- Yao, Y.; Ruan, L.; Zhou, S.P.; Zhou, W.J.; Chen, J.H.; Li, H. Comparison of lightning location system observation with satallite lightning observa-tion in Three Gorges area within western Hubei. High Volt. Eng. 2011, 37, 2990–2996. (In Chinese) [Google Scholar]
- Wang, H.B.; Qie, X.S.; Zhang, Y.J.; Zhang, C.H. Detecting and Processing Waveform from C-G and Cloud Lighting Discharge and It’s Preliminary Application. Plateau Meteorol. 2002, 74–78. (In Chinese) [Google Scholar] [CrossRef]
- Wu, F.; Cui, X.P.; Zhang, D.L.; Liu, D.X.; Zheng, D. Statistical characteristics of CG and IC flashes in Beijing in 2005-07. In Proceedings of the 33rd Annual Meeting of China Meteorological Society, Xi’an, China, 2–4 November 2016; (In Chinese). Available online: http://cpfd.cnki.com.cn/Article/CPFDTOTAL-ZGQX201611019103.htm (accessed on 15 September 2020).
- Cummins, K.; Murphy, M.; Bardo, E.A.; Hiscox, W.L.; Pyle, R.B.; Pifer, A.E. A combined TOA/MDF technology upgrade of the US National Lightning Detection Network. J. Geophys. Res. Atmos. 1998, 103, 9035–9044. [Google Scholar] [CrossRef]
- Soula, S.; Sauvageot, H.; Molinié, G.; Mesnard, F.; Chauzy, S. The CG lightning activity of a storm causing a flash-flood. Geophys. Res. Lett. 1998, 25, 1181–1184. [Google Scholar] [CrossRef]
- Williams, E.; Weber, M.; Orville, R. The relationship between lightning type and convective state of thunderclouds. J. Geophys. Res. 1989, 94, 13213–13220. [Google Scholar] [CrossRef]
- Yao, W.; Zhang, Y.J.; Meng, Q.; Wang, F.; Lv, W. A comparison of the characteristics of total and cloud-to-ground lightning activities in hailstorms. J. Meteorol. Res. 2013, 27, 282–293. [Google Scholar] [CrossRef]
Publisher’s Note: MDPI stays neutral with regard to jurisdictional claims in published maps and institutional affiliations. |
© 2020 by the authors. Licensee MDPI, Basel, Switzerland. This article is an open access article distributed under the terms and conditions of the Creative Commons Attribution (CC BY) license (http://creativecommons.org/licenses/by/4.0/).