Article

Foliar Spectra and Traits of Bog Plants across Nitrogen Deposition Gradients

1
Institut de Recherche en Biologie Végétale, Université de Montréal, 4101 Sherbrooke Est, Montréal, QC H1X 2B2, Canada
2
Applied Remote Sensing Lab, Department of Geography, McGill University, 805 Sherbrooke Ouest, Montréal, QC H3A 0B9, Canada
*
Author to whom correspondence should be addressed.
Remote Sens. 2020, 12(15), 2448; https://doi.org/10.3390/rs12152448
Submission received: 22 June 2020 / Revised: 23 July 2020 / Accepted: 27 July 2020 / Published: 30 July 2020
(This article belongs to the Special Issue Hyperspectral Remote Sensing for Biodiversity Mapping)

Abstract

:
Bogs, as nutrient-poor ecosystems, are particularly sensitive to atmospheric nitrogen (N) deposition. Nitrogen deposition alters bog plant community composition and can limit their ability to sequester carbon (C). Spectroscopy is a promising approach for studying how N deposition affects bogs because of its ability to remotely determine changes in plant species composition in the long term as well as shorter-term changes in foliar chemistry. However, there is limited knowledge on the extent to which bog plants differ in their foliar spectral properties, how N deposition might affect those properties, and whether subtle inter- or intraspecific changes in foliar traits can be spectrally detected. The objective of the study was to assess the effect of N deposition on foliar traits and spectra. Using an integrating sphere fitted to a field spectrometer, we measured spectral properties of leaves from the four most common vascular plant species (Chamaedaphne calyculata, Kalmia angustifolia, Rhododendron groenlandicum and Eriophorum vaginatum) in three bogs in southern Québec and Ontario, Canada, exposed to different atmospheric N deposition levels, including one subjected to a 18-year N fertilization experiment. We also measured chemical and morphological properties of those leaves. We found detectable intraspecific changes in leaf structural traits and chemistry (namely chlorophyll b and N concentrations) with increasing N deposition and identified spectral regions that helped distinguish the site-specific populations within each species. Most of the variation in leaf spectral, chemical, and morphological properties was among species. As such, species had distinct spectral foliar signatures, allowing us to identify them with high accuracy with partial least squares discriminant analyses (PLSDA). Predictions of foliar traits from spectra using partial least squares regression (PLSR) were generally accurate, particularly for the concentrations of N and C, soluble C, leaf water, and dry matter content (<10% RMSEP). However, these multi-species PLSR models were not accurate within species, where the range of values was narrow. To improve the detection of short-term intraspecific changes in functional traits, models should be trained with more species-specific data. Our field study showing clear differences in foliar spectra and traits among species, and some within-species differences due to N deposition, suggest that spectroscopy is a promising approach for assessing long-term vegetation changes in bogs subject to atmospheric pollution.

Graphical Abstract

1. Introduction

Human activities are strongly altering the global nitrogen (N) cycle [1]. In particular, emissions of biologically active N increased by 120% between 1860 and 2008 [2]. The emission of N has significant impacts on natural ecosystems since its deposition on lands and seas increases the availability of this major plant growth-limiting nutrient [1]. Ombrotrophic bogs are peatlands that are particularly sensitive to N deposition because they develop in nutrient-limited, acidic, and waterlogged peaty soils where atmospheric inputs are the main source of plant nutrients. These edaphic conditions lead to very low decomposition rates [3], making bogs major atmospheric C sinks. Bogs cover large parts of the globe, especially in the northern hemisphere, and store roughly a third of the global soil C [4]. In Canada alone, they cover 1136 × 103 km2, or 13% of the land surface [5]. Therefore, it is important to understand how increased N deposition in bogs is affecting plant community composition and C storage in their deep organic soils.
Field studies of N deposition impacts on bogs report an initial stimulation in plant productivity and/or C accumulation following a moderate increase in N availability [6,7]. However, long-term (10 to 15 years) N fertilization decreases the C sink capacity of bogs [8] by increasing decomposition rates [8,9,10], or by increasing the productivity and cover of vascular plant species at the expense of Sphagnum mosses, whose recalcitrant plant material contribute to much of the C accumulation in peat [11]. The short-term effects of increased N deposition on bogs—before it starts significantly impacting ecosystem function and C sequestration potential—are linked to changes in plant functional traits and the composition of plant communities. For example, after five years of experimental fertilization in a bog, biomass and leaf area index of vascular plants increased [11]. Changes in plant community composition can therefore act as an early warning signal of ecosystem change due to N deposition in bogs. Monitoring these changes in bogs is critical because of the important ecosystem functions and services these ecosystems provide, particularly with regard to soil C storage.
Peatlands are vulnerable to trampling and often located in remote areas inaccessible by motorized vehicles. Therefore, ground surveys using traditional field sampling techniques can be challenging. Remote sensing, particularly imaging spectroscopy, is emerging as a promising approach for monitoring the foliar chemistry and vegetation composition of bogs at high spatial and temporal resolutions and over large spatial scales [12,13,14]. Indeed, studies conducted in various types of ecosystems found promising results with regard to spectroscopic predictions of foliar traits [15,16,17]. Moreover, spectroscopy could help distinguish plant species, since foliar spectral signatures strongly depend on taxonomic identity [17,18,19]. A number of remote sensing studies of peatlands have been conducted, often on community assemblage, plant functional types, and peatland classification [20,21,22,23,24]. To our knowledge, however, leaf-level studies evaluating the potential of remote detection of short-term trait variations and long-term community changes through species turnover have not been conducted in peatlands. As a result, we do not know how environmental changes such as N deposition alters foliar traits and spectra of bog plants, nor the extent to which bog plant species from different environments differ inter- and intra-specifically in their spectral signatures. Such fine-scale, leaf-level studies are critically important to interpret imaging spectroscopy data collected at broader spatial scales.
The goal of this study was to determine how N deposition affects foliar spectra and traits within and among the most abundant vascular plant species in bog ecosystems. Our specific research objectives were to (1) quantify the effects of N deposition on foliar traits and spectra across natural and experimental gradients of N deposition; (2) determine the degree to which the potential variation in leaf traits within and among species along N deposition gradients can be predicted from foliar spectra; and (3) evaluate whether species can be reliably identified across these gradients, using foliar spectra. To do so, we measured foliar spectra and a range of foliar traits influencing the spectral signal of four vascular plant species across different N levels. We used a long-term bog fertilization experiment and three natural bogs featuring different environmental conditions and positioned along a natural gradient of N deposition. We hypothesized that N-related foliar traits (e.g., total N and chlorophyll concentrations) would increase with increasing N availability across all species, and that these changes could be accurately predicted from leaf spectra. We also hypothesized that foliar spectra would accurately predict most foliar traits based on previous studies in other ecosystems (e.g., [12,16,17,25]). Finally, we hypothesized that interspecific spectral variation would exceed intraspecific variation, such that species could be accurately identified with foliar spectra.

2. Materials and Methods
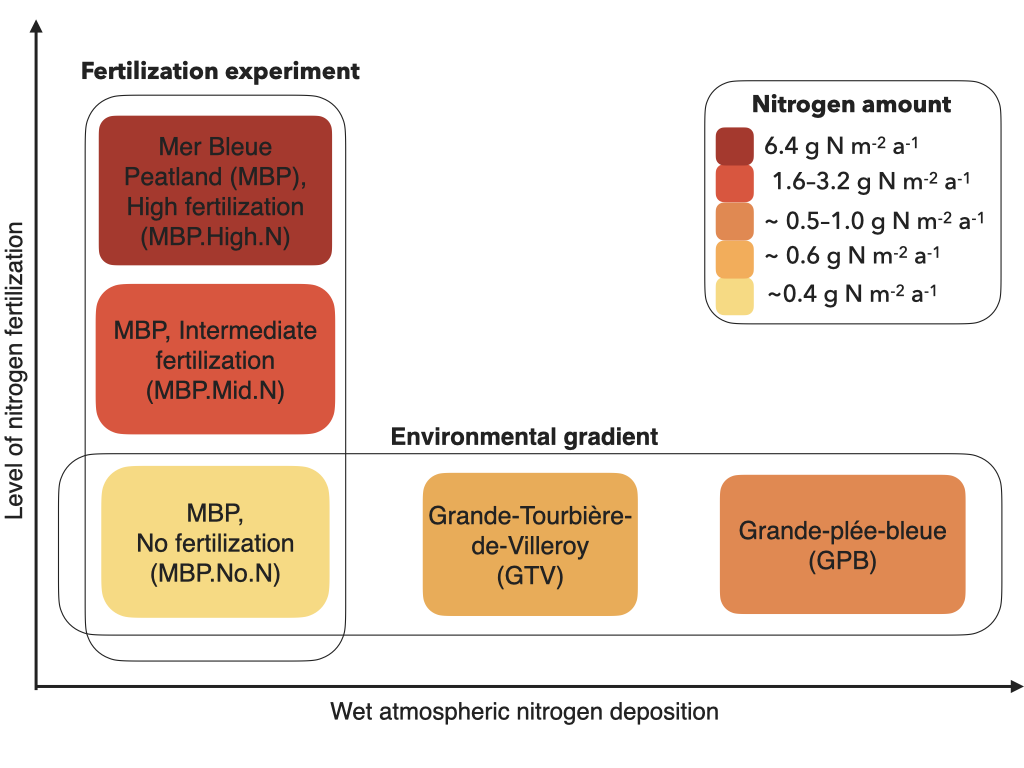
2.1. Study Sites

Field sampling was conducted in three bogs (sites; Figure 1) from 5 July to 2 August 2018, in an effort to minimize phenology and seasonal effects. The three sites were the Mer Bleue peatland (MBP; [26]), La Grande-Tourbière-de-Villeroy (GTV), and La Grande-plée-Bleue (GPB; Figure S1). These sites are positioned along an environmental gradient of atmospheric N deposition (Figure 1), which was based on an environmental characterization of peat and peat water (see Section 2.2 and Section 2.3 for details).
The ~35 km2 Mer Bleue ombrotrophic bog is situated in the Ottawa River Valley, approximately 10 km east of Ottawa (Ontario, Canada; 45°24′36″ N; 75°31′01″ W) in the Saint-Lawrence Lowlands region. Mean annual temperature is 6.6 °C, ranging from −10.2 °C in January and 21.2 °C in July. Mean annual precipitation is 919.5 mm with a mean rainfall of 347.5 mm between May and August [29]. Peat depth ranges between 1–2 m at the edge of the bog area, and 5–6 m in the center [30]. The Grande-Tourbière-de-Villeroy (46°22′53″ N; 71°49′58″ W) ~16 km2 bog system is situated in the Appalachian region of Québec. The bog lies within the city boundaries of Villeroy, Notre-Dame-de-Lourdes and Val-Alain (Québec, Canada). The depth of organic matter in the sampling area is between 3.7 and 4.9 m with sand or till underneath [31]. Mean annual temperature is 4.8 °C, ranging from −11.9 °C in January and 19.3 °C in July. Mean annual precipitation in the area is 1193.6 mm with a mean rainfall of 475 between May and August [29]. The Grande-plée-Bleue bog (46°46′24″ N; 71°03′60″ W) is located in Lévis (Québec, Canada) on the south shore of the Saint-Laurent river in the Appalachian region. This ~15 km2 peatland encompasses a variety of peaty habitats, including 650 ponds and open areas dominated by Ericaceae on a hummock–hollow microtopography [32]. Mean annual temperature is 4.6 °C, ranging from −12 °C in January and 19.3 °C in July. Mean annual precipitation in the area is 1178.7 mm with a mean rainfall of 461.9 mm [29]. The depth of the organic matter reaches 4.5 m in the central zone [32].
In all sites along the natural gradient in N deposition, plots were established at distances of 10 m from each other and >60 m from the bog edge. These plots were used for foliar sampling (see Section 2.2 for details). In addition, at the Mer Bleue peatland (MBP; Figure 1) experimental site [26], we sampled plants growing in three levels of N addition from a long-term fertilization experiment. The three levels of N addition from the experiment are referred to as MBP.No.N (background deposition), MBP.Mid.N, and MBP.High.N (Figure 1; Table 1). Briefly, the experimental plots are fertilized in soluble form, with NH4NO3 dissolved in 18 L distilled water (equivalent to the application of 2 mm of water on each 3 m × 3 m plots). Fertilizer was applied at three-week intervals from early May to late August each summer. Control plots were treated with distilled water (see [11] and [33] for complete description of the experimental design).
The environmental gradient of atmospheric N deposition was based on N content in peat and atmospheric N deposition data ([27]; Table 2; see Figure S2 for details). Fertilization levels of the experiment and estimations of atmospheric N deposition at the bogs are summarized in Figure 1. The environmental gradient receives N within the range of deposition observed in Canada (0.2–1.2 g N m−2 a−1; [1,11]). The experimental treatment MBP.Mid.N represents levels of fertilization as seen in some parts of Europe (>2 g N m−2 a−1; [1]) whereas MBP.High.N represents levels projected to occur in parts of Asia by 2050 (>5 g N m−2 a−1; [1]).
The selected natural and experimental sites were similar in plant community composition and hydrological conditions (e.g., no drainage channel). Sphagnum species and ericaceous shrubs dominated the selected sites, including the sampled species Rhododendron groenlandicum (Oeder) Kron & Judd, Chamaedaphne calyculata (L.) Moench, and Kalmia angustifolia L. Various Vaccinium species as well as Eriophorum vaginatum L. (Cyperaceae) were also present at all sites. Picea mariana (Miller) Britton, Sterns & Poggenburgh and Larix laricina (Du Roi) K. Koch were present, although scattered, at all sites. Sampling was conducted in the raised part of the bogs, characterized by a microtopography of hummocks and hollows.

2.2. Sampling Design

We established circular plots (3 m diameter), in each bog, for foliar sampling of the four most abundant vascular plant species: R. groenlandicum, C. calyculata, K. angustifolia (all in the Ericaceae family), and E. vaginatum (Cyperaceae). Within the circular plots, we only selected plants growing on hummocks for foliar sampling because of known differences in N interception [34], hydrology [34,35], and decomposition [7,34], between hummocks and hollows. We collected peat and peat water samples at 5–15 cm depth for laboratory measurements. Peat and water characteristics were measured at least 24 h after any rainfall. At each site, we dug six holes reaching the water table to determine water table depth. At the MBP site, for the experimental treatments (MBP.Mid.N and MBP.High.N), we used triplicate 3 m × 3 m plots that were already established (starting year: 2001–2005) in areas of homogenous vegetation [11]. In these experimental plots from the MBP, we sampled for leaves only but could not collect peat samples (i.e., no environmental sampling) to prevent soil disturbance in this long-term experiment (Table 1).

2.3. Environmental Gradient in Atmospheric N Deposition

Environmental characterization of peat and peat water for the determination of the environmental gradient included measurements of total nitrogen (N; %), nitrate (NO3; mg kg−1) and ammonium concentration (NH4+; mg kg−1) in peat; and peat water pH and electrical conductivity (EC; µS/cm). Measurements of peat and peat water pH and conductivity were conducted using a multiparameter water quality meter (HI 9298194; Hanna instruments, Smithfield, RI, USA). Conductivity measures of peat water were corrected for pH and temperature (°C). Total nitrogen (% dry mass) was measured using an elemental analyzer (CHNOS Elemental Analyzer Vario Micro Select; Elementar Analyze system GmbH, Hanau, Germany). NO3 and NH4+ concentration of the peat and peat water were measured following extraction with potassium chloride (KCl).

2.4. Leaf Collection and Preparation

We sampled foliar traits and spectra for a total of 94 plants. We selected first-year, fully expanded, healthy, and fully sunlit leaves. We immediately sealed the leaf samples in plastic bags to minimize water loss [36]. We measured leaf spectra within 15 min after collection (see Section 2.5 for details). We then punched out leaf disks from the same leaves used for spectral measurements and stored them in a cooler on ice before transferring the disks to a −80 °C freezer when back in the laboratory. We weighed the other leaves from the bulk sample in the field, within 15 min after collection. These leaves were then rehydrated for >6 h, weighed again, and scanned for leaf area. We used a CanoScan LIDE 220 scanner (Canon, Brampton (Ontario) Canada) and the software WinFOLIA Reg 2016b (Regent Instruments Inc., Québec (Québec) Canada) for measurement of total leaf area [37]. We oven-dried (72 h at 65 °C) and weighed the scanned leaves. Leaf dry matter and leaf water content were calculated based on rehydrated and dry weights (see [37] for details). The remainder of the bulk sample was ground to a fine powder using a cyclone mill (2 mm mesh) for chemical analyses.

2.5. Spectral Measurements

Foliar spectral reflectance measurements were performed using a Spectra Vista Corporation (SVC) DC-R/T Integrating Sphere fitted to an HR-1024i spectroradiometer (SVC, Poughkeepsie, NY, USA), using a protocol for narrow leaves [38] adapted from Noda et al. [39]. Leaf arrays were arranged on a custom sample mount, covering the majority of the leaf port area and each separated by approximately 1 mm to prevent light scattering among leaves [39] (Figure S3). The spectra were corrected for stray light and referenced against a calibrated Spectralon® 99% reflectance standard disk (Labsphere, North Sutton, NH, USA). Absolute adaxial reflectance of leaf array adjusted for gap fractions were calculated using equations from Laliberté and Soffer [38] and the six reflectance spectra for an individual plant were averaged. Overlap regions among the three detectors of the SVC were removed and a linear interpolation was applied to obtain one mean reflectance curve per plant at 1 nm spectral resolution for wavelengths 400–2400 nm. A Savitzky–Golay filter was used for smoothing the foliar spectra, using different parameters for each region (Figure S4).

2.6. Leaf Chemical Analyses

Photosynthetic pigments (chlorophyll a, chlorophyll b, and carotenoids) were extracted from leaf disks with methanol and measured with a spectrophotometer (SPECTROstar® Nano, BMG LABTECH, Guelph, ON, Canada) at wavelengths 470, 652, and 665 nm on a microplate [40,41]. The path length (i.e., the height of the solution column in the microplate well) was estimated following Warren [40]. The concentrations of soluble C, hemicellulose, cellulose, and lignin (% dry weight) were determined by sequential digestion of ground leaf samples [42] (Fiber Analyzer 2000; ANKOM Technology, Macedon, NY, USA). Total N and C concentration (% dry mass) were measured from ground leaf samples using an elemental analyzer [43] (CHNOS Elemental Analyzer Vario Micro Select; Elementar Analyse systeme GmbH, Hanau, Germany).

2.7. Statistical Analyses

Differences in environmental properties among sites and foliar traits among species and sites were tested using linear mixed models (LMM). Plots were treated as random factors in these analyses. Linear mixed models were also used to evaluate differences in trait values. Measured (not predicted) trait values are reported, and significant differences among the groups are reported based on post-hoc Tukey tests performed among sites or species when one or both of these factors were significant in the LMMs. We partitioned the total variation of traits among plants using species identity and site as random effects. We also partitioned the total variation of spectra among plants using species identity and site as random effects.
To examine the wavelength regions with the greatest differences among species growing in different environmental conditions we carried out a forward feature selection (FFS) using the nearest neighbor criterion [44] decreasing the total 2000 dimensions (bands) to a smaller subset which maximizes separability between the classes of interest. Forward feature selection begins with an empty set, selects the single best feature (band) and iteratively adds those that most improve separation between the classes. The result of an FFS differs from transformations such as principal component analysis (PCA) because FFS selects components (i.e., bands) from the full set of bands retaining the original units of the data (i.e., reflectance). Dimensionality reduction through FFS has been shown to lead to higher classification accuracies than PCA for vegetation spectra [45,46].
To predict foliar traits from spectral reflectance data, we used partial least squares regression (PLSR). PLSR is specifically designed for high-dimensional datasets in which explanatory variables are multicollinear [47], as it is the case for spectral measurements. Spectral measurements were separated into training (calibration) and testing (validation) subgroups (70% and 30% of the data, respectively). We selected the region of the spectra used for the modeling of each traits based on the literature ([16,48,49,50]; Table S1). The PLSR models were trained with 100 iterations, using leaf traits as the response and spectral data as the explanatory variables, respectively. We used the prediction residual error sum of squares (PRESS), a coefficient that helps prevent overfitting [51], to identify the optimal number of PLSR components and tested for significant differences in the PRESS criterion using Tukey tests. We assessed model accuracy using the root mean square standard error of prediction (RMSEP; original units), normalized RMSEP (NRMSEP; RMSEP/mean of measured values; %), and the coefficient of determination (R2), averaged over all model iteration.
We used partial least squares discriminant analysis (PLSDA) to assess the ability of leaf spectra to distinguish plant species [52]. Data were iteratively separated into training (calibration) and testing (validation) samples, using a 70:30 data split per species for model calibration and validation, respectively. We ran 50 model iterations and chose the optimal number of components based significant differences in the kappa score using Tukey tests.
Gap fraction correction for narrow-leaved species could influence the amplitude of reflectance in the spectral data. Vector-normalization [53] reduces differences in amplitude in the spectra and focuses instead on the shape of the curve, more relevant of the structure and chemistry of the leaves. Species classification analyses (PLSDA and FFS) were conducted on vector-normalized spectra, because we considered differences in the shape of spectra to be more relevant for the identification of the species than differences in amplitude. All other analyses were conducted without spectra being normalized.
For all statistical tests, we used α = 0.05 as the significance level. We used the following R [54] packages for data processing and statistical analyses: vegan [55]; caret [56]; emmean [57]; spectrolab [58]; signal [59]; nlme [60]. R (R Foundation for Statistical Computing, Vienna, Austria) scripts for all of our analyses are available at https://github.com/AlizeeGirard3.

3. Results

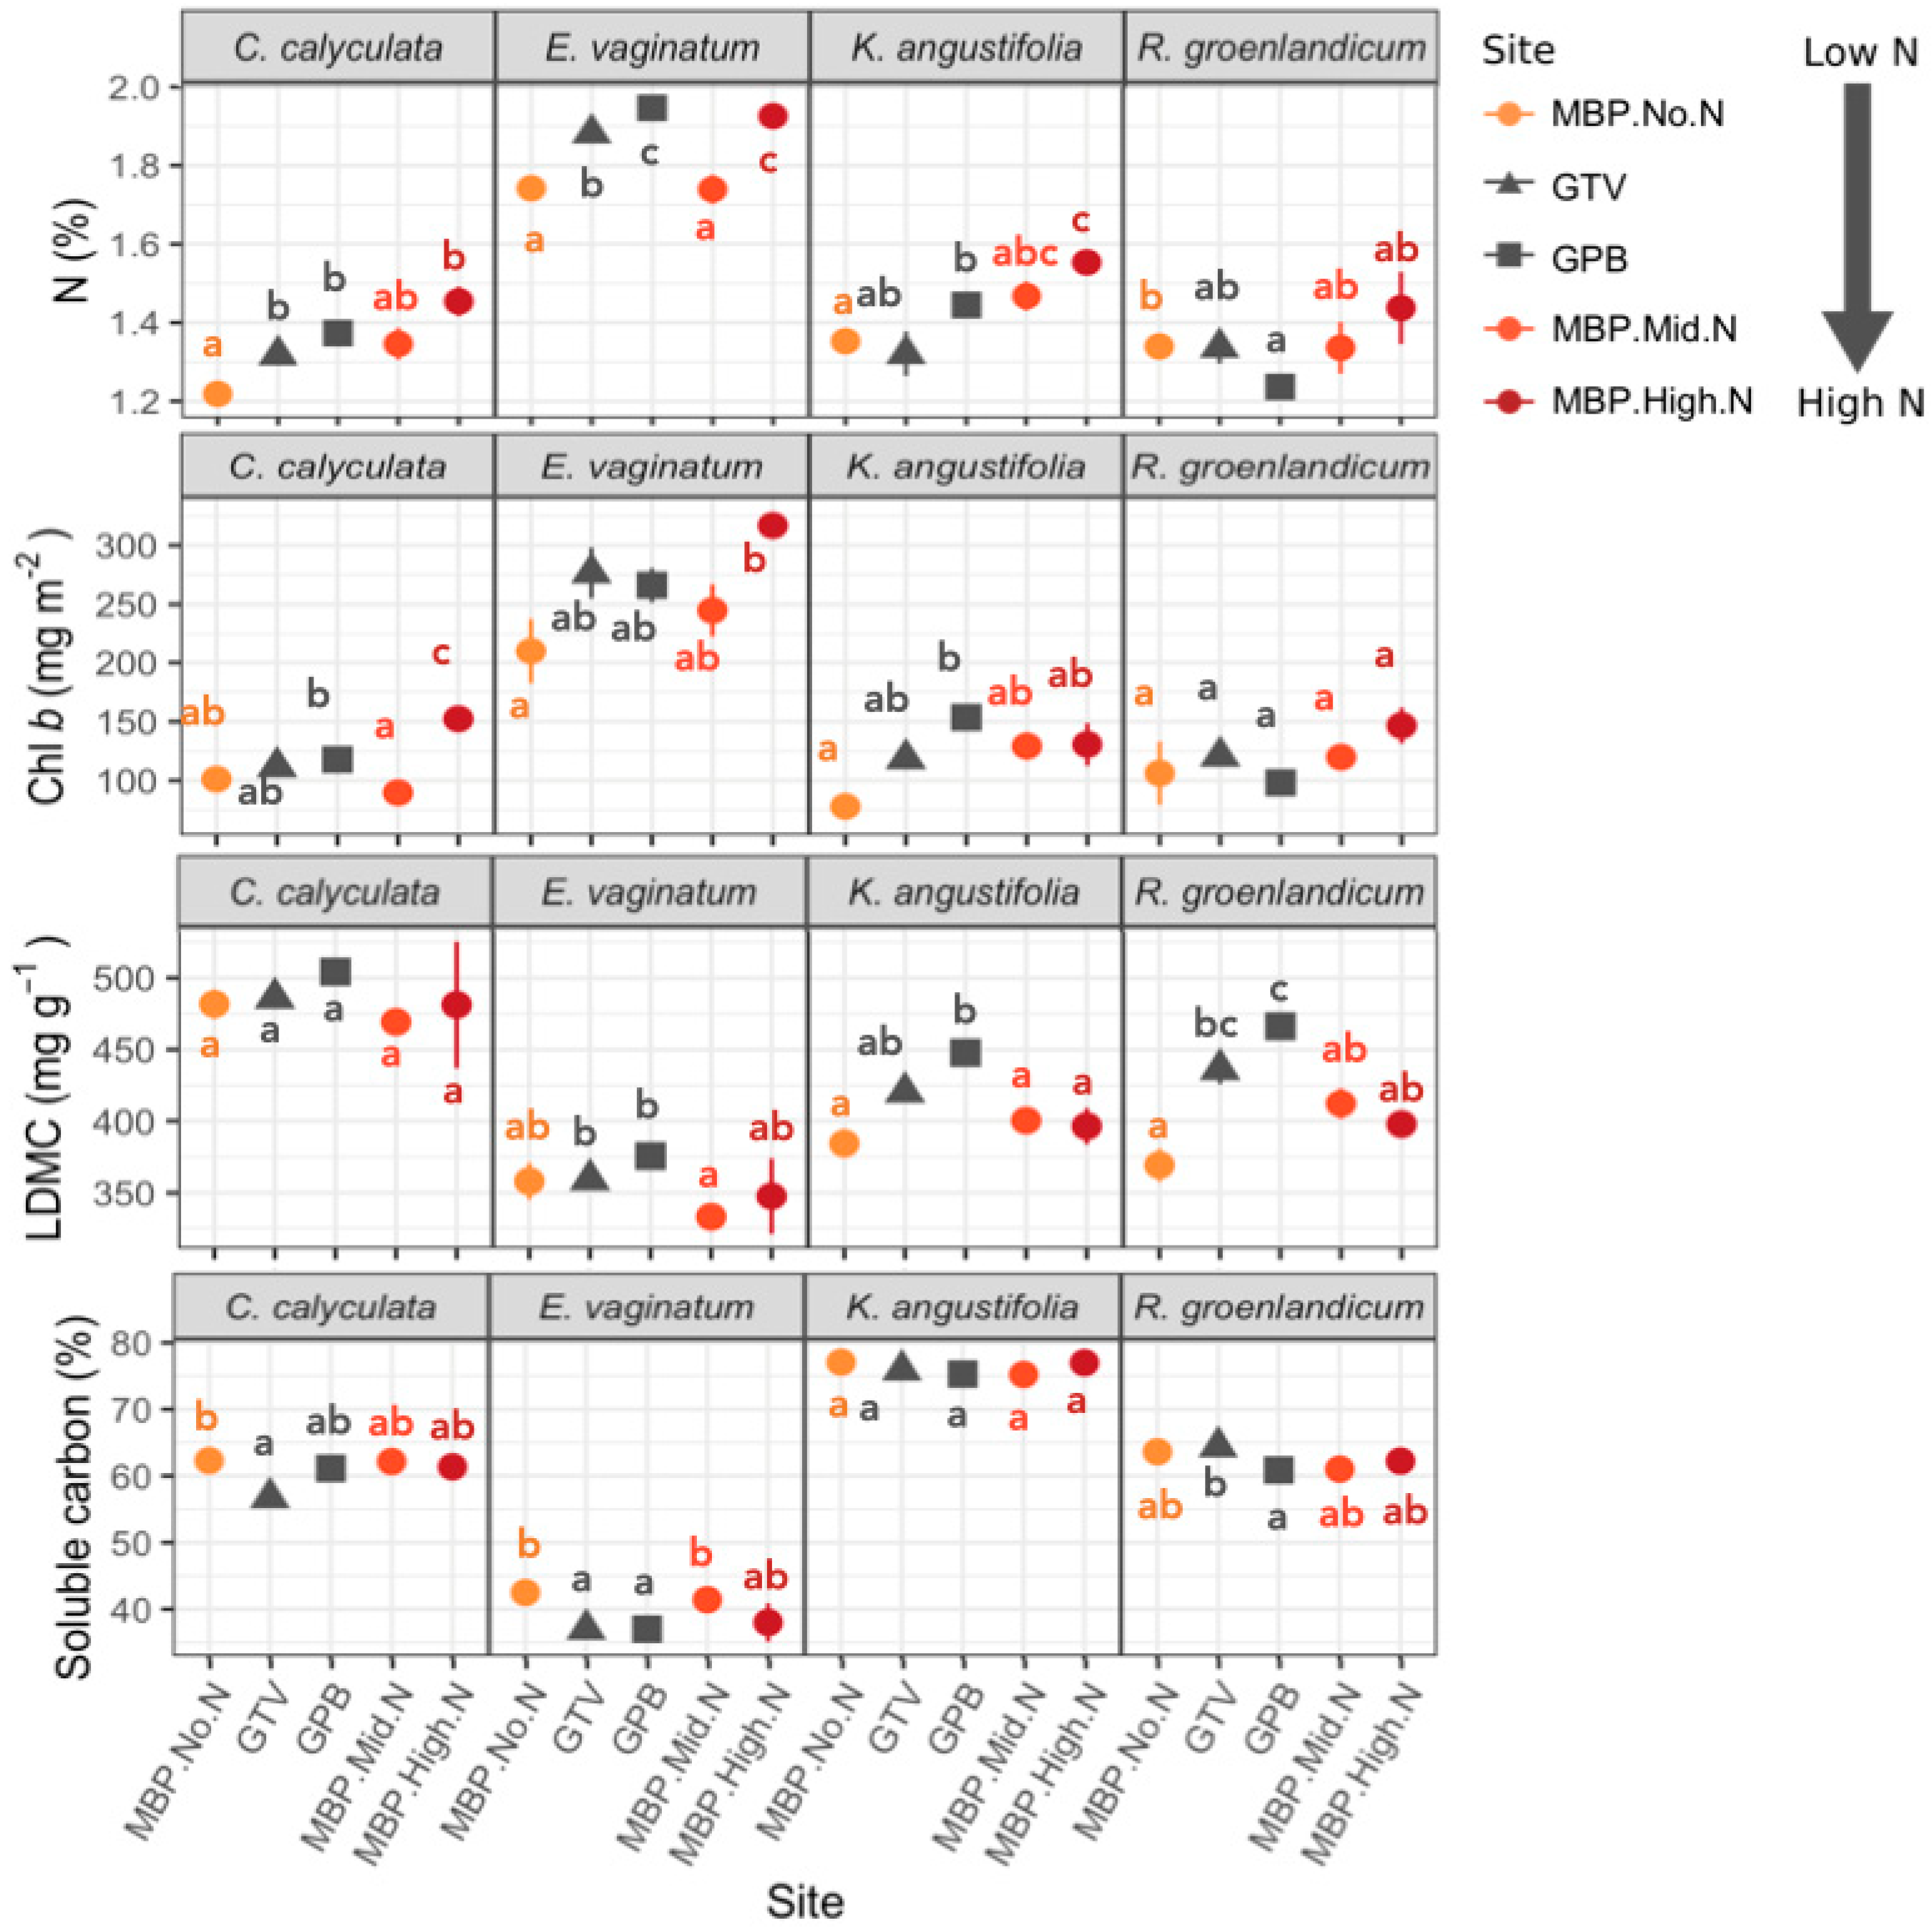
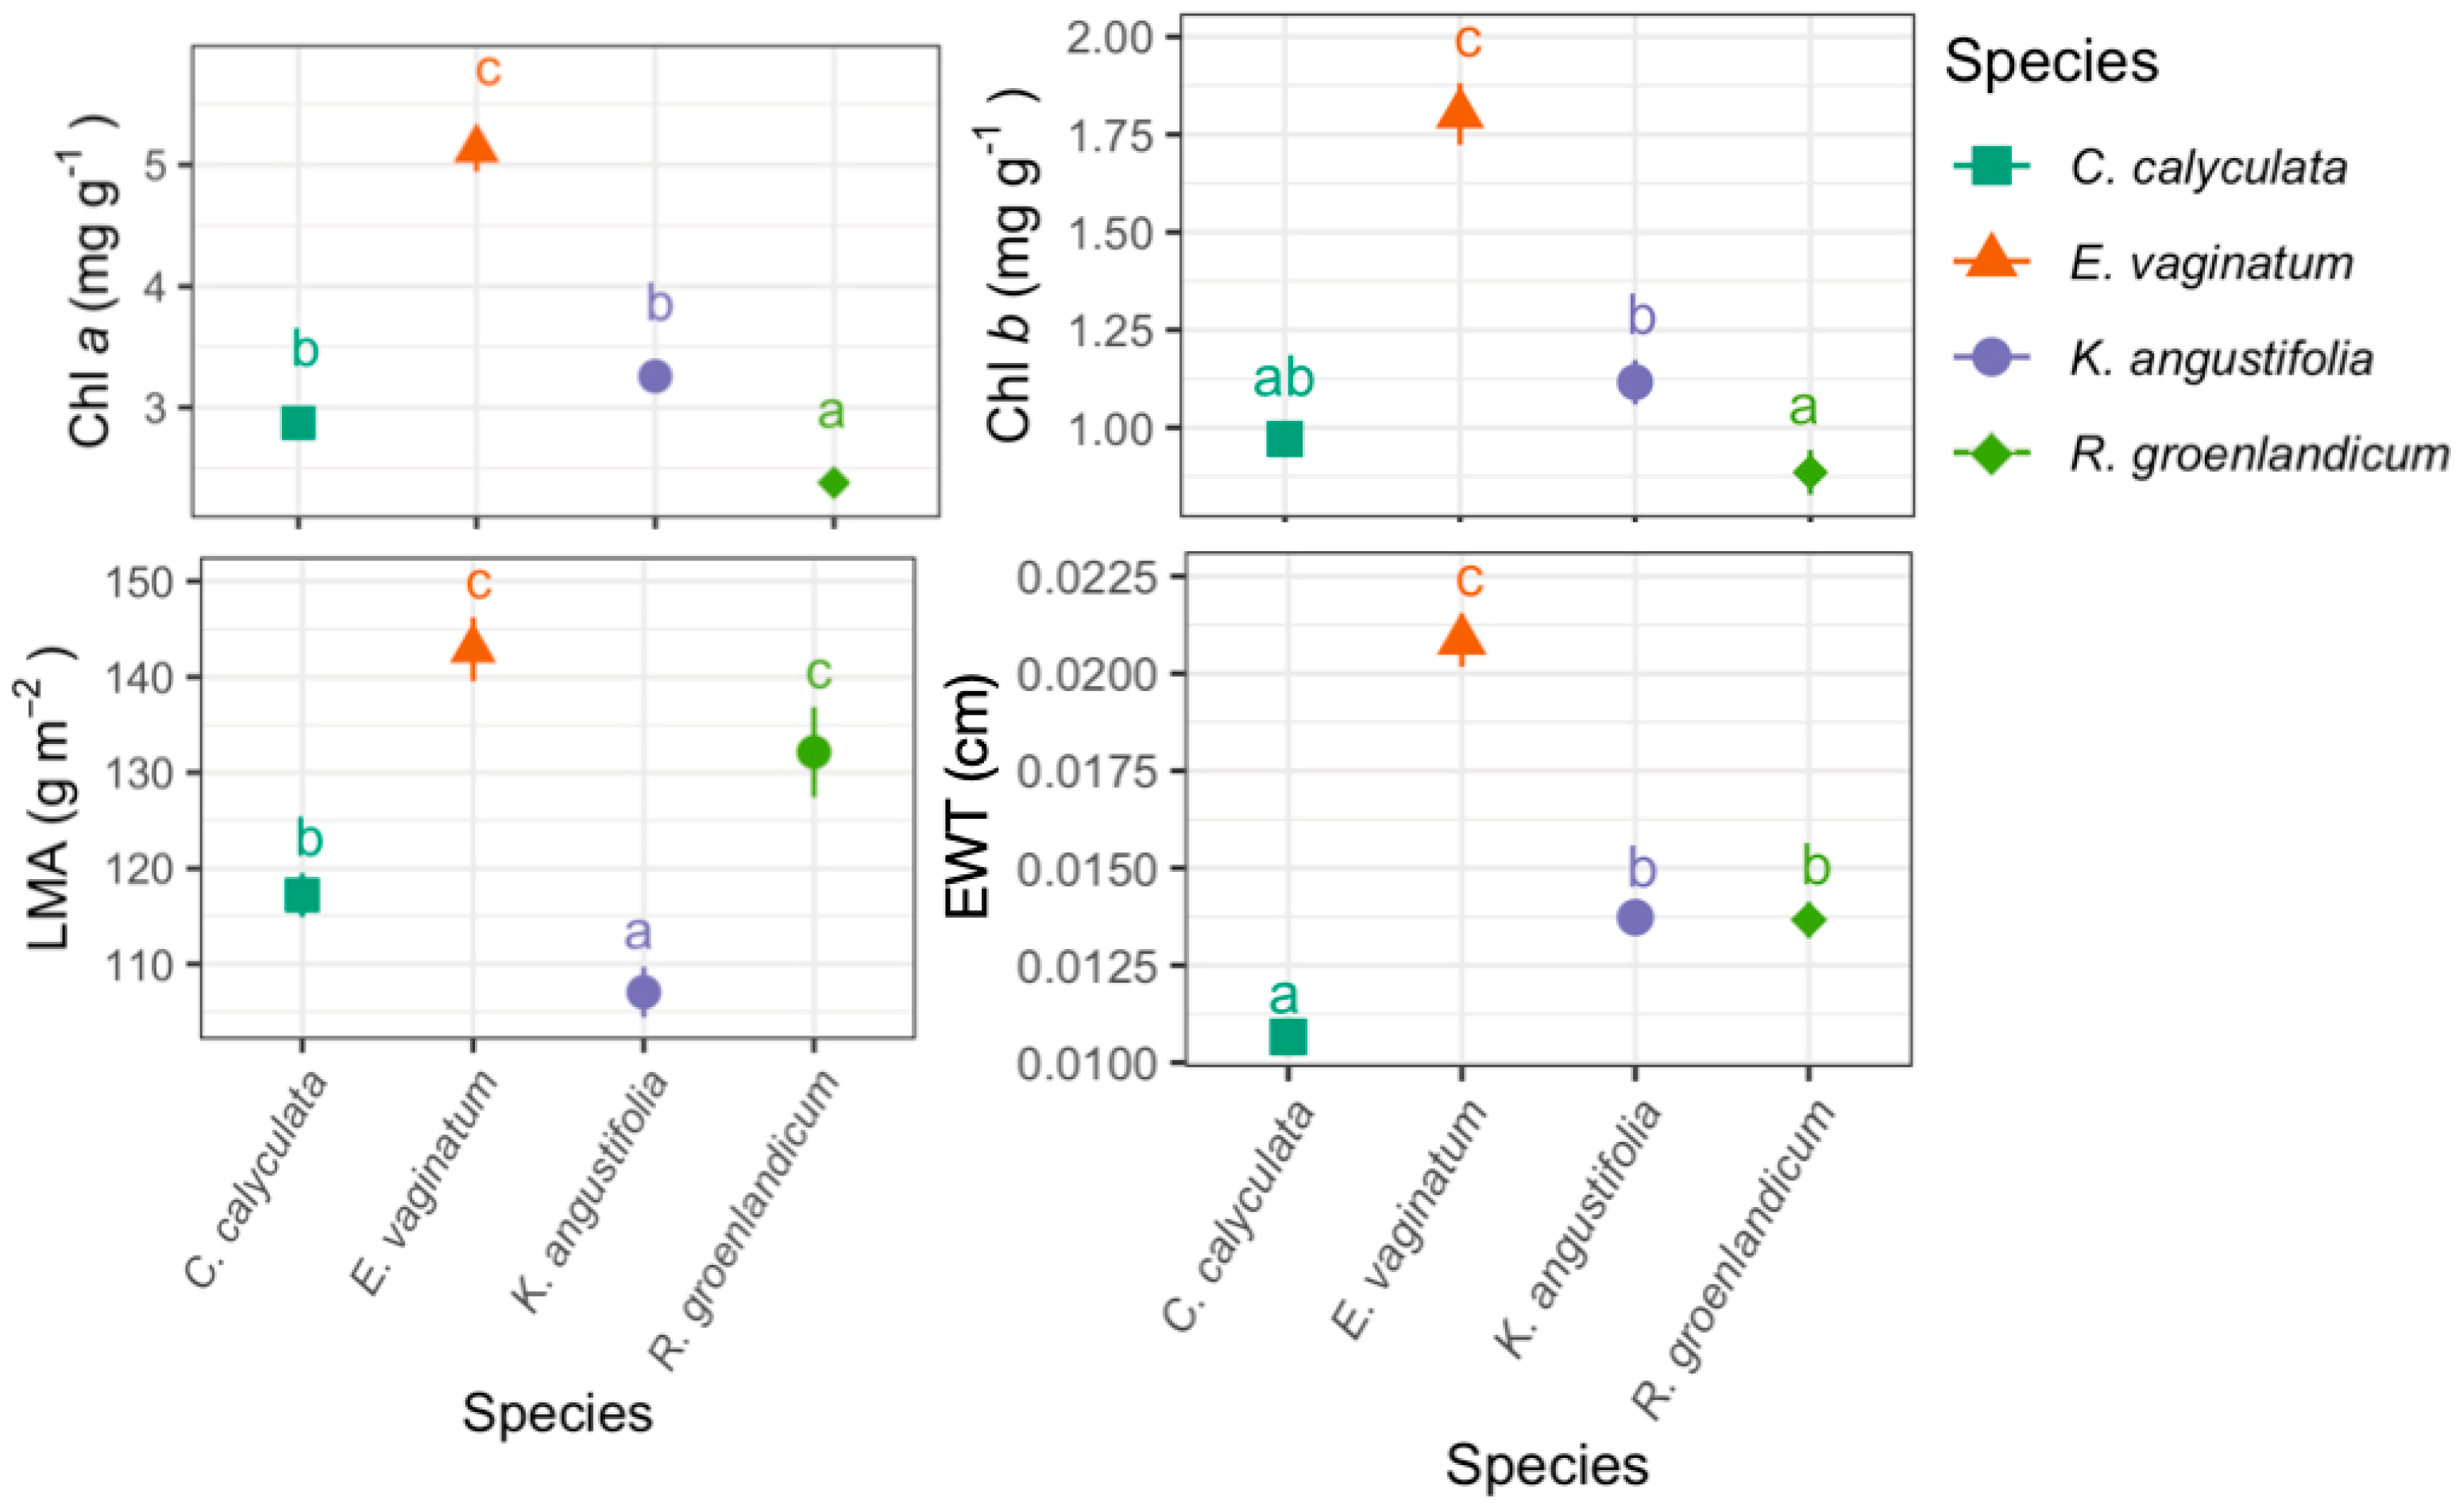
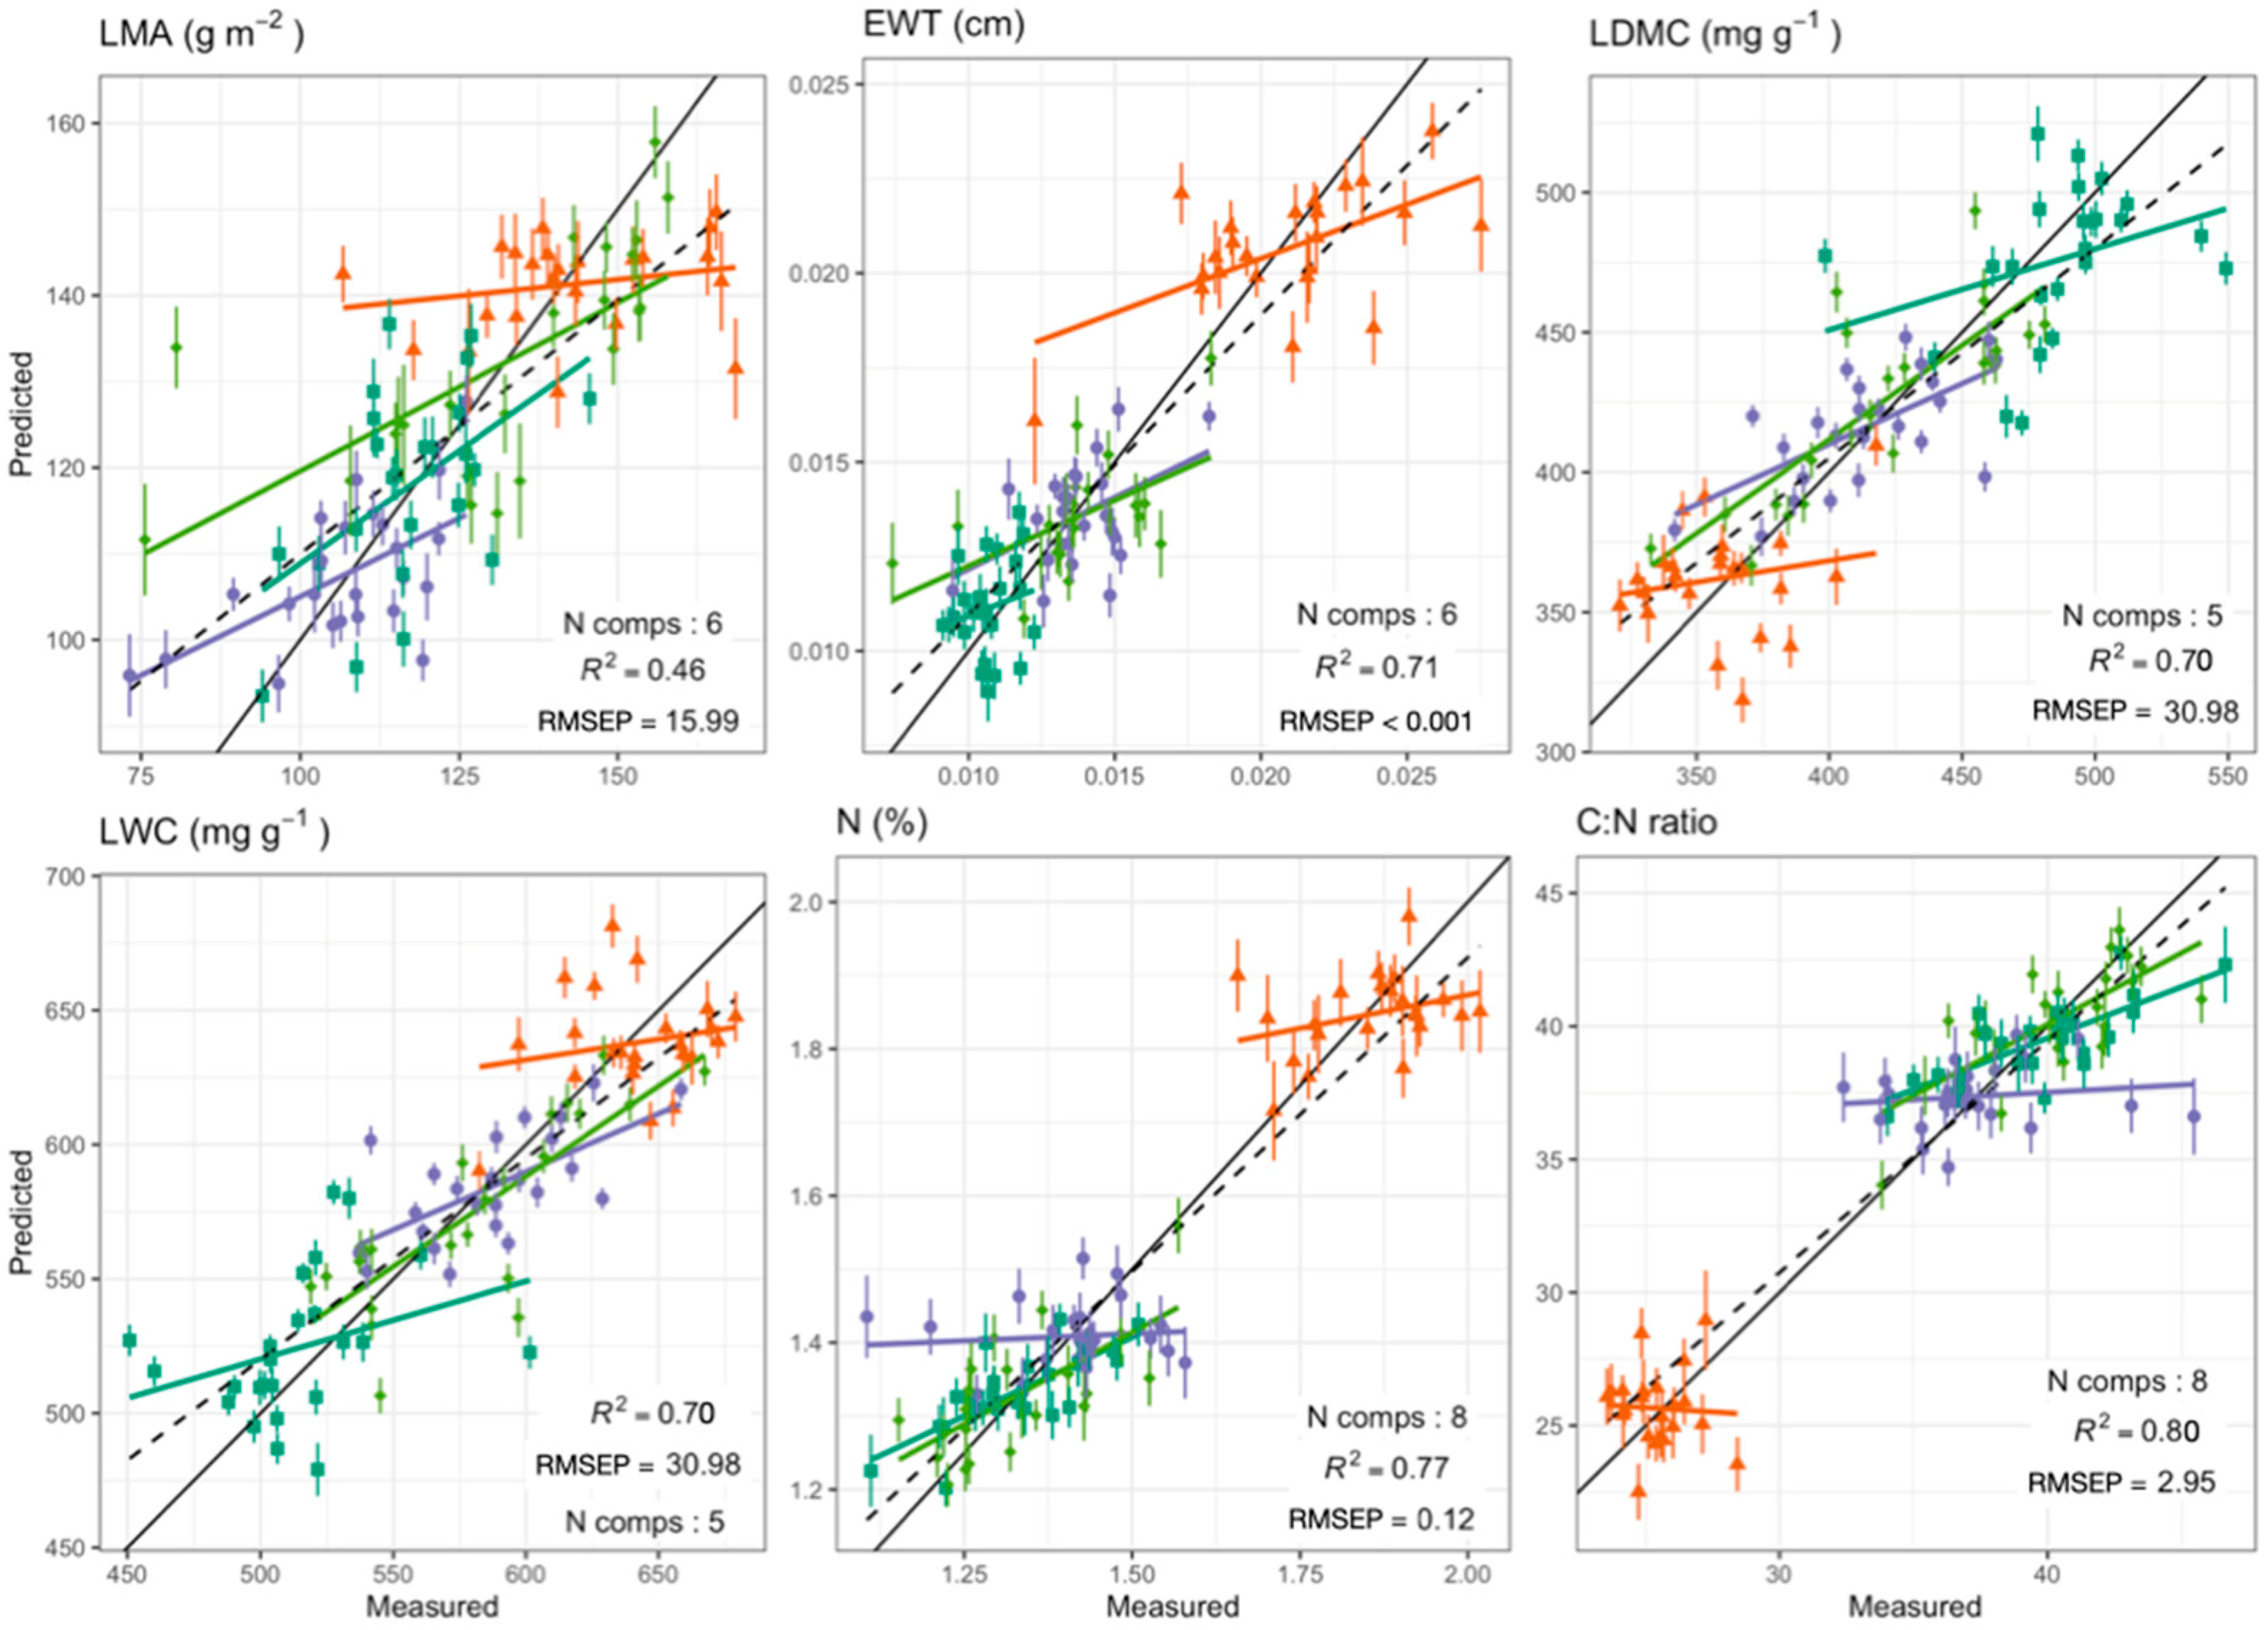
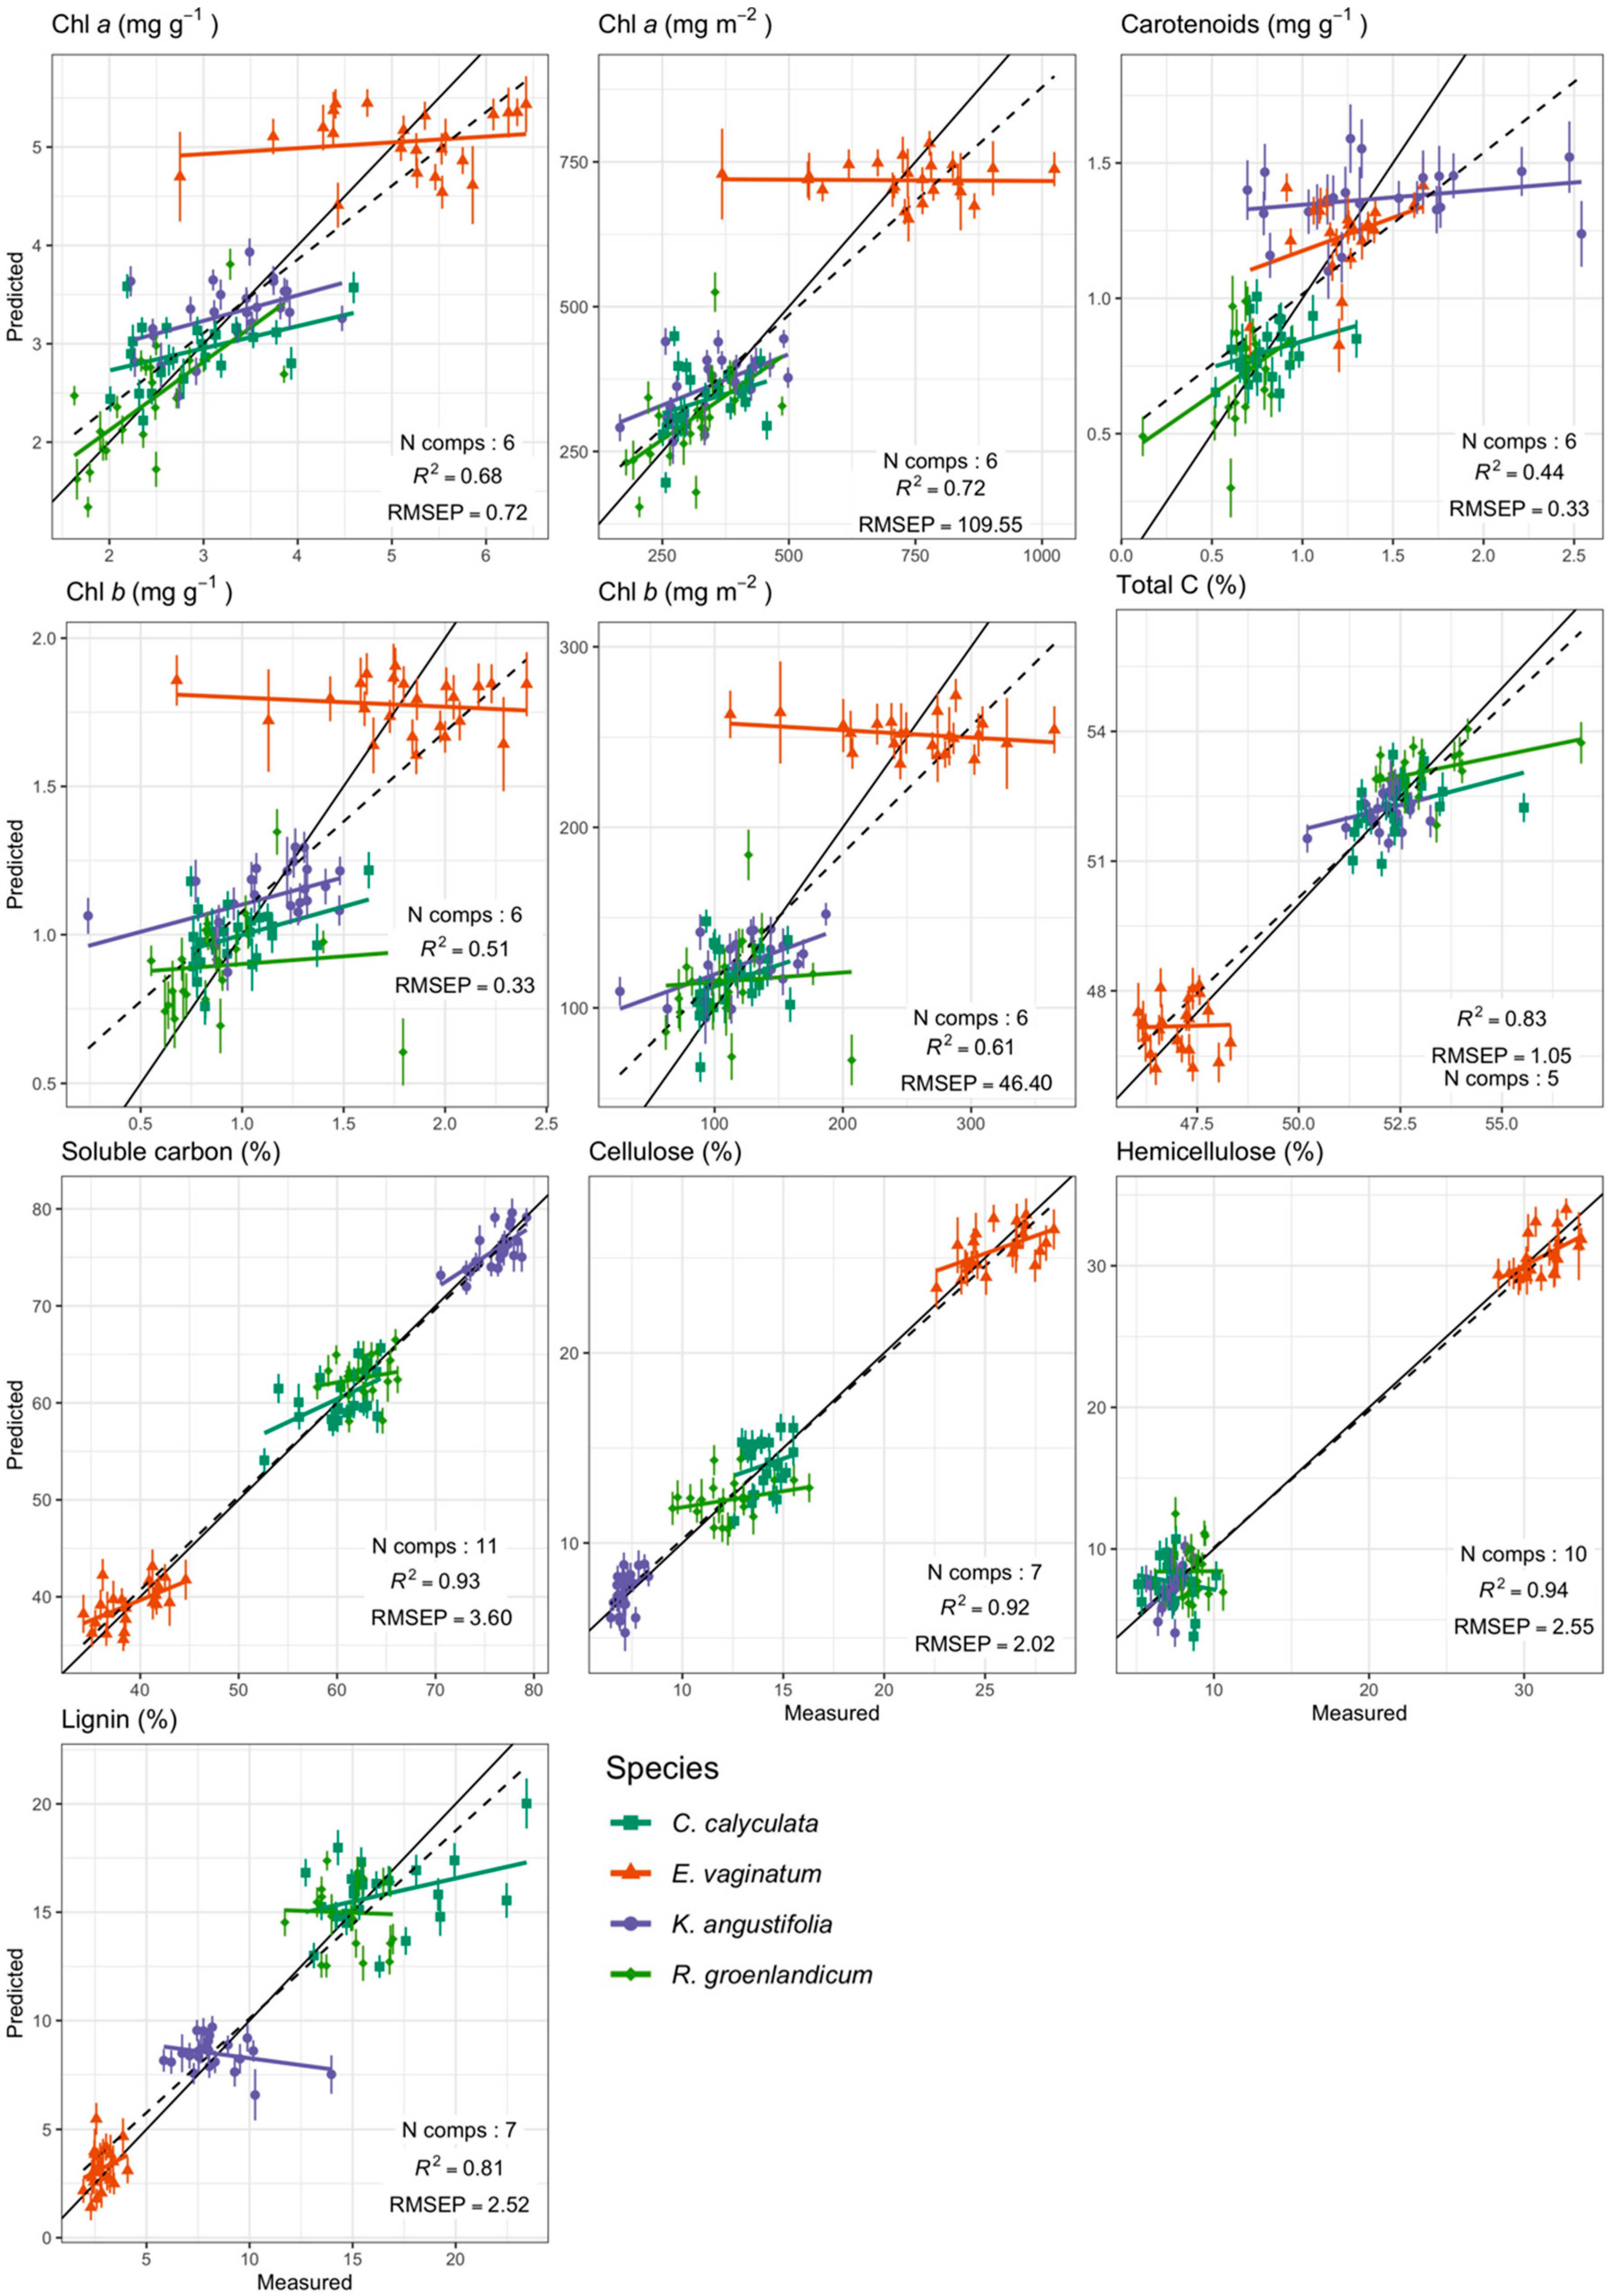
3.1. Foliar Functional Traits

Most functional traits varied among species, but the magnitude of those species differences was site-specific (site by species interaction; p ≤ 0.05; Table S2). Exceptions to this pattern were chlorophyll a (Chl a; mg g−1 and mg m−2), Chl b (mg g−1), EWT, and LMA. Indeed, these traits differed among species and sites, in an additive but not in interactive manner (Table S2). Species traits differed more among species (representing 72.8% of variation) than among sites (representing only 0.4% of variation). Unexplained variation accounted for 26.9% of the variation in among species. In particular, foliar traits of E. vaginatum markedly differed from those of the three ericaceous species (Figure 2, Figure 3 and Figure S5).
Foliar N concentrations varied among sites for all four species (Figure 2), with higher foliar N concentrations at sites with greater soil N content (Table 1 and Table 2, Figure S2). We found similar results for Chl b (mg m−2; Figure 2), whereas the opposite pattern was found for the C:N ratio (Figure S5a). E. vaginatum had the highest foliar N concentration of all species (Figure 2). LDMC was generally highest at the GPB site, except for C. calyculata for which there were no significant differences among sites (Figure 2).
All C fractions (soluble C, hemicellulose, cellulose, and lignin) differed among species (Figure 2; Figure S5a) but did not vary much within species (Figure S5a). E. vaginatum had the highest hemicellulose and cellulose concentrations, and the lowest soluble C and total C concentrations. That species also showed the highest water content (EWT) and LMA (Figure 3).

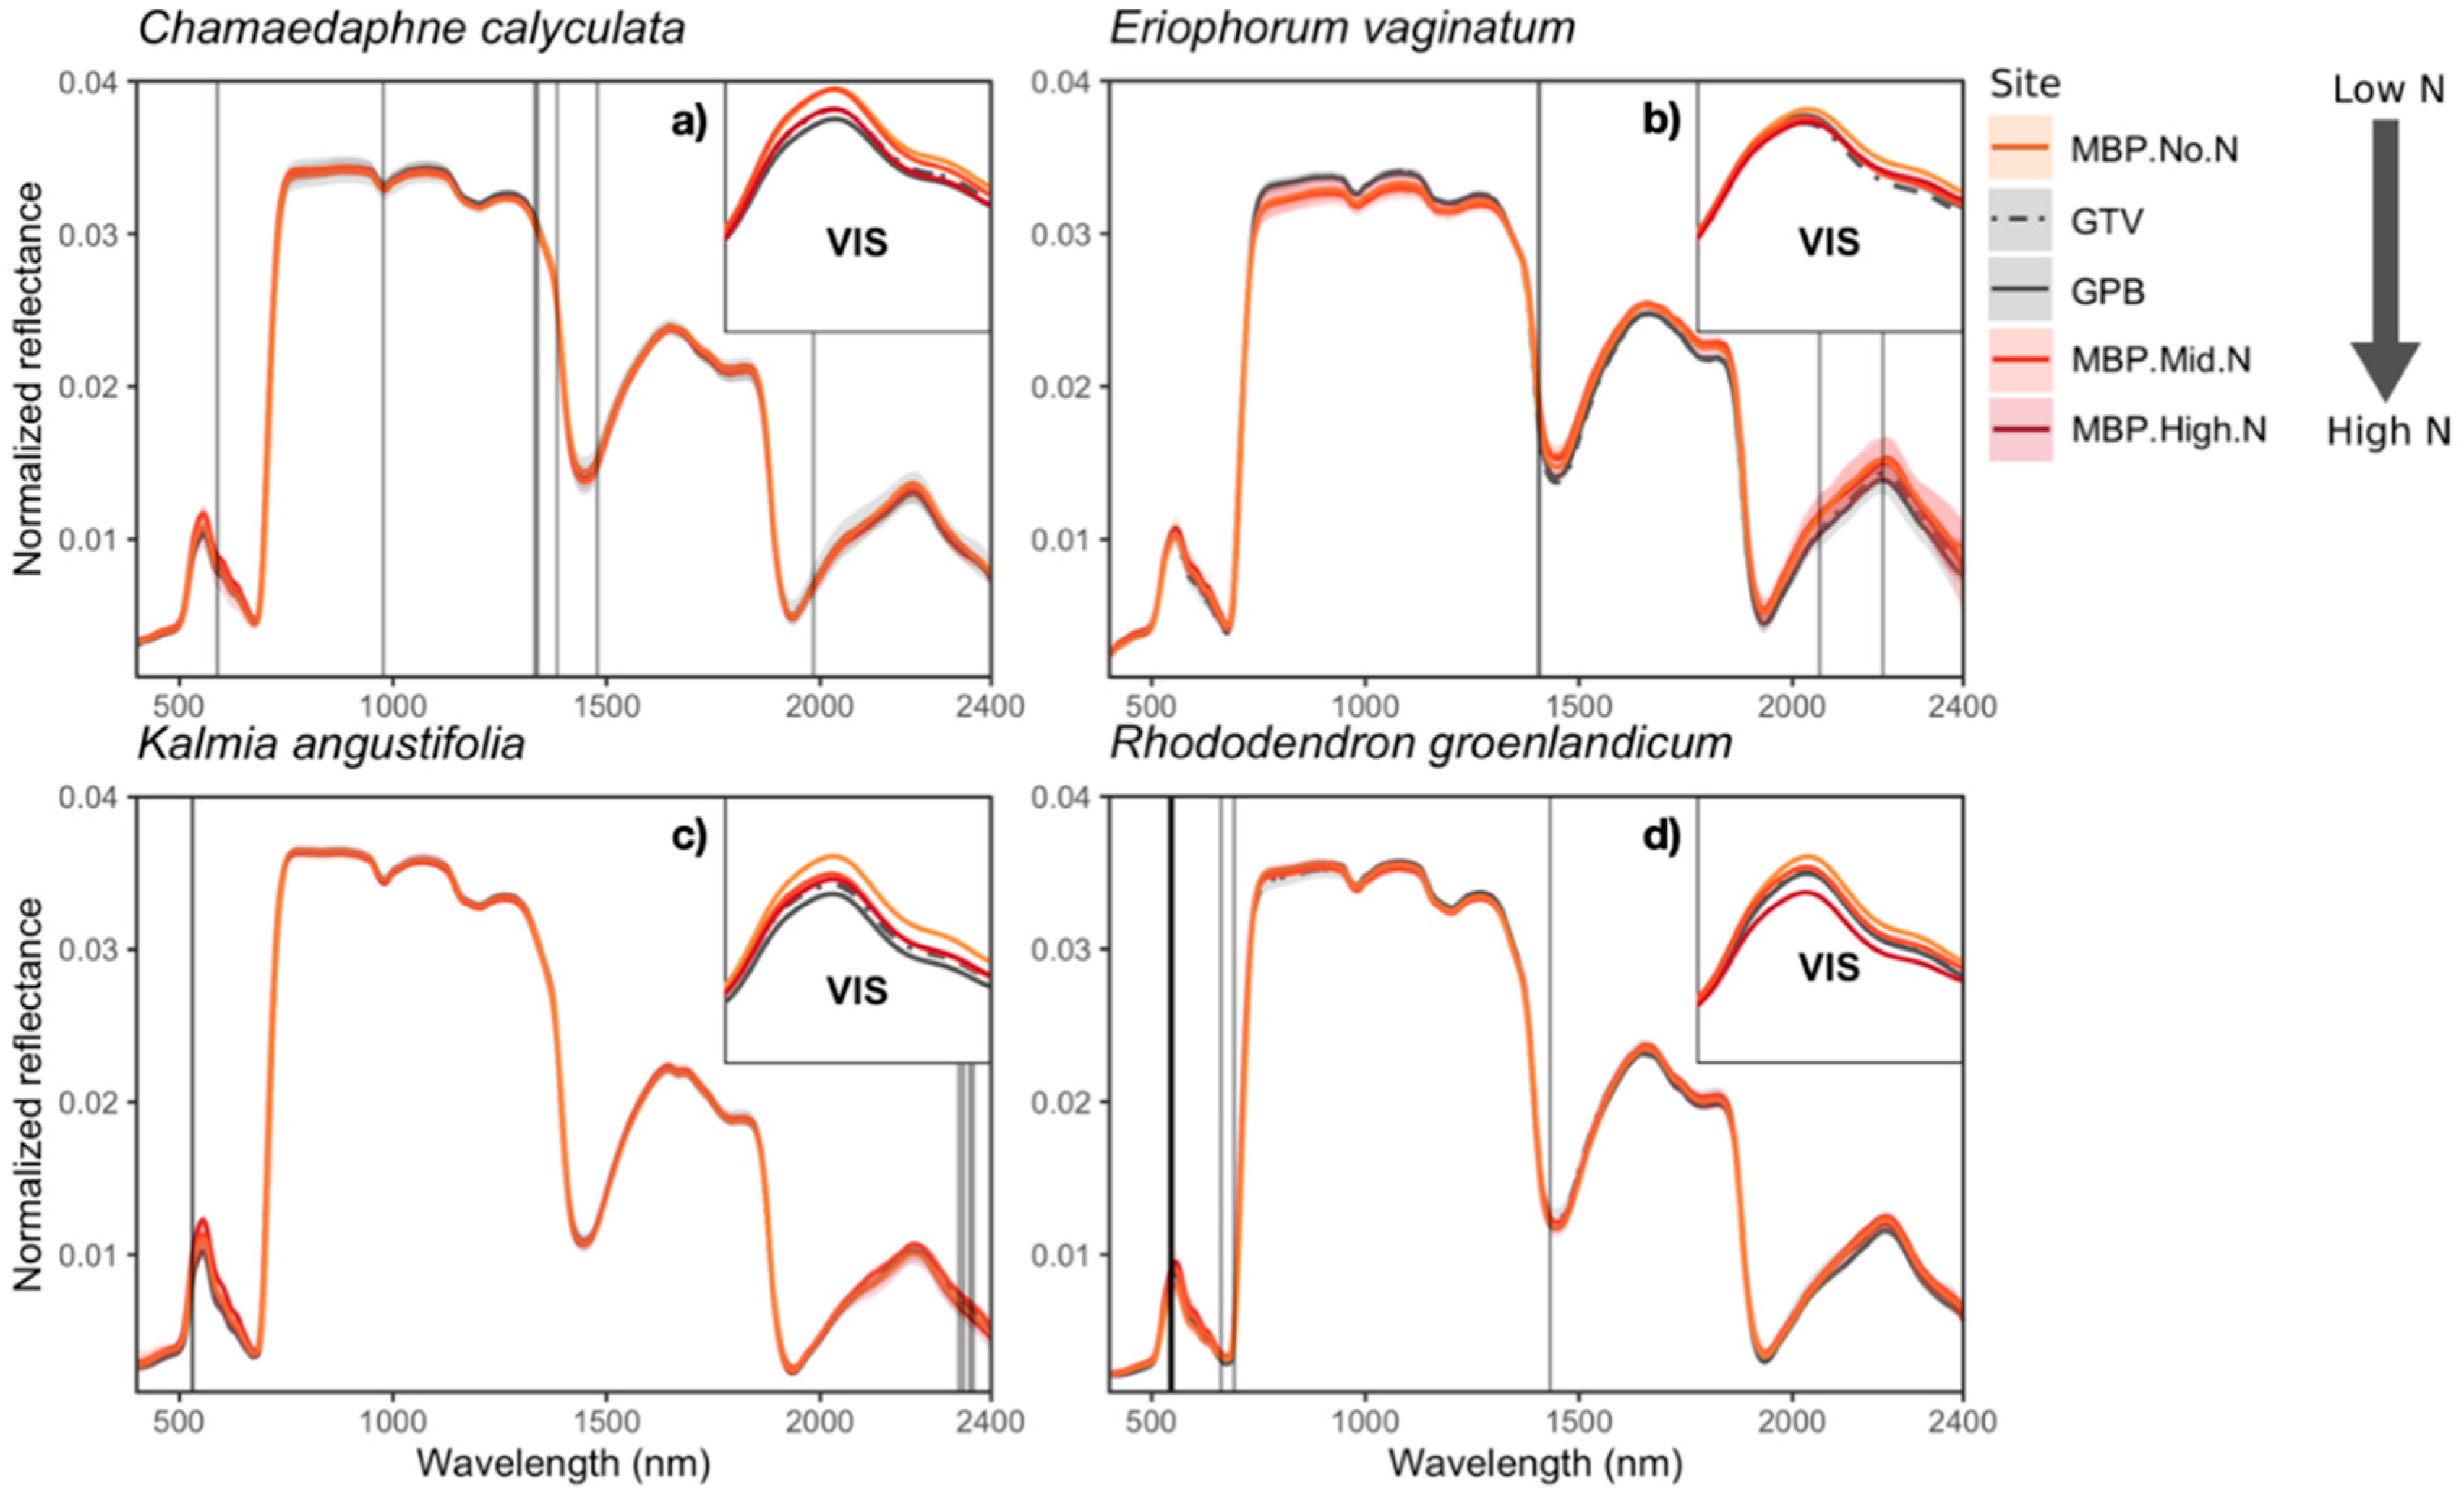
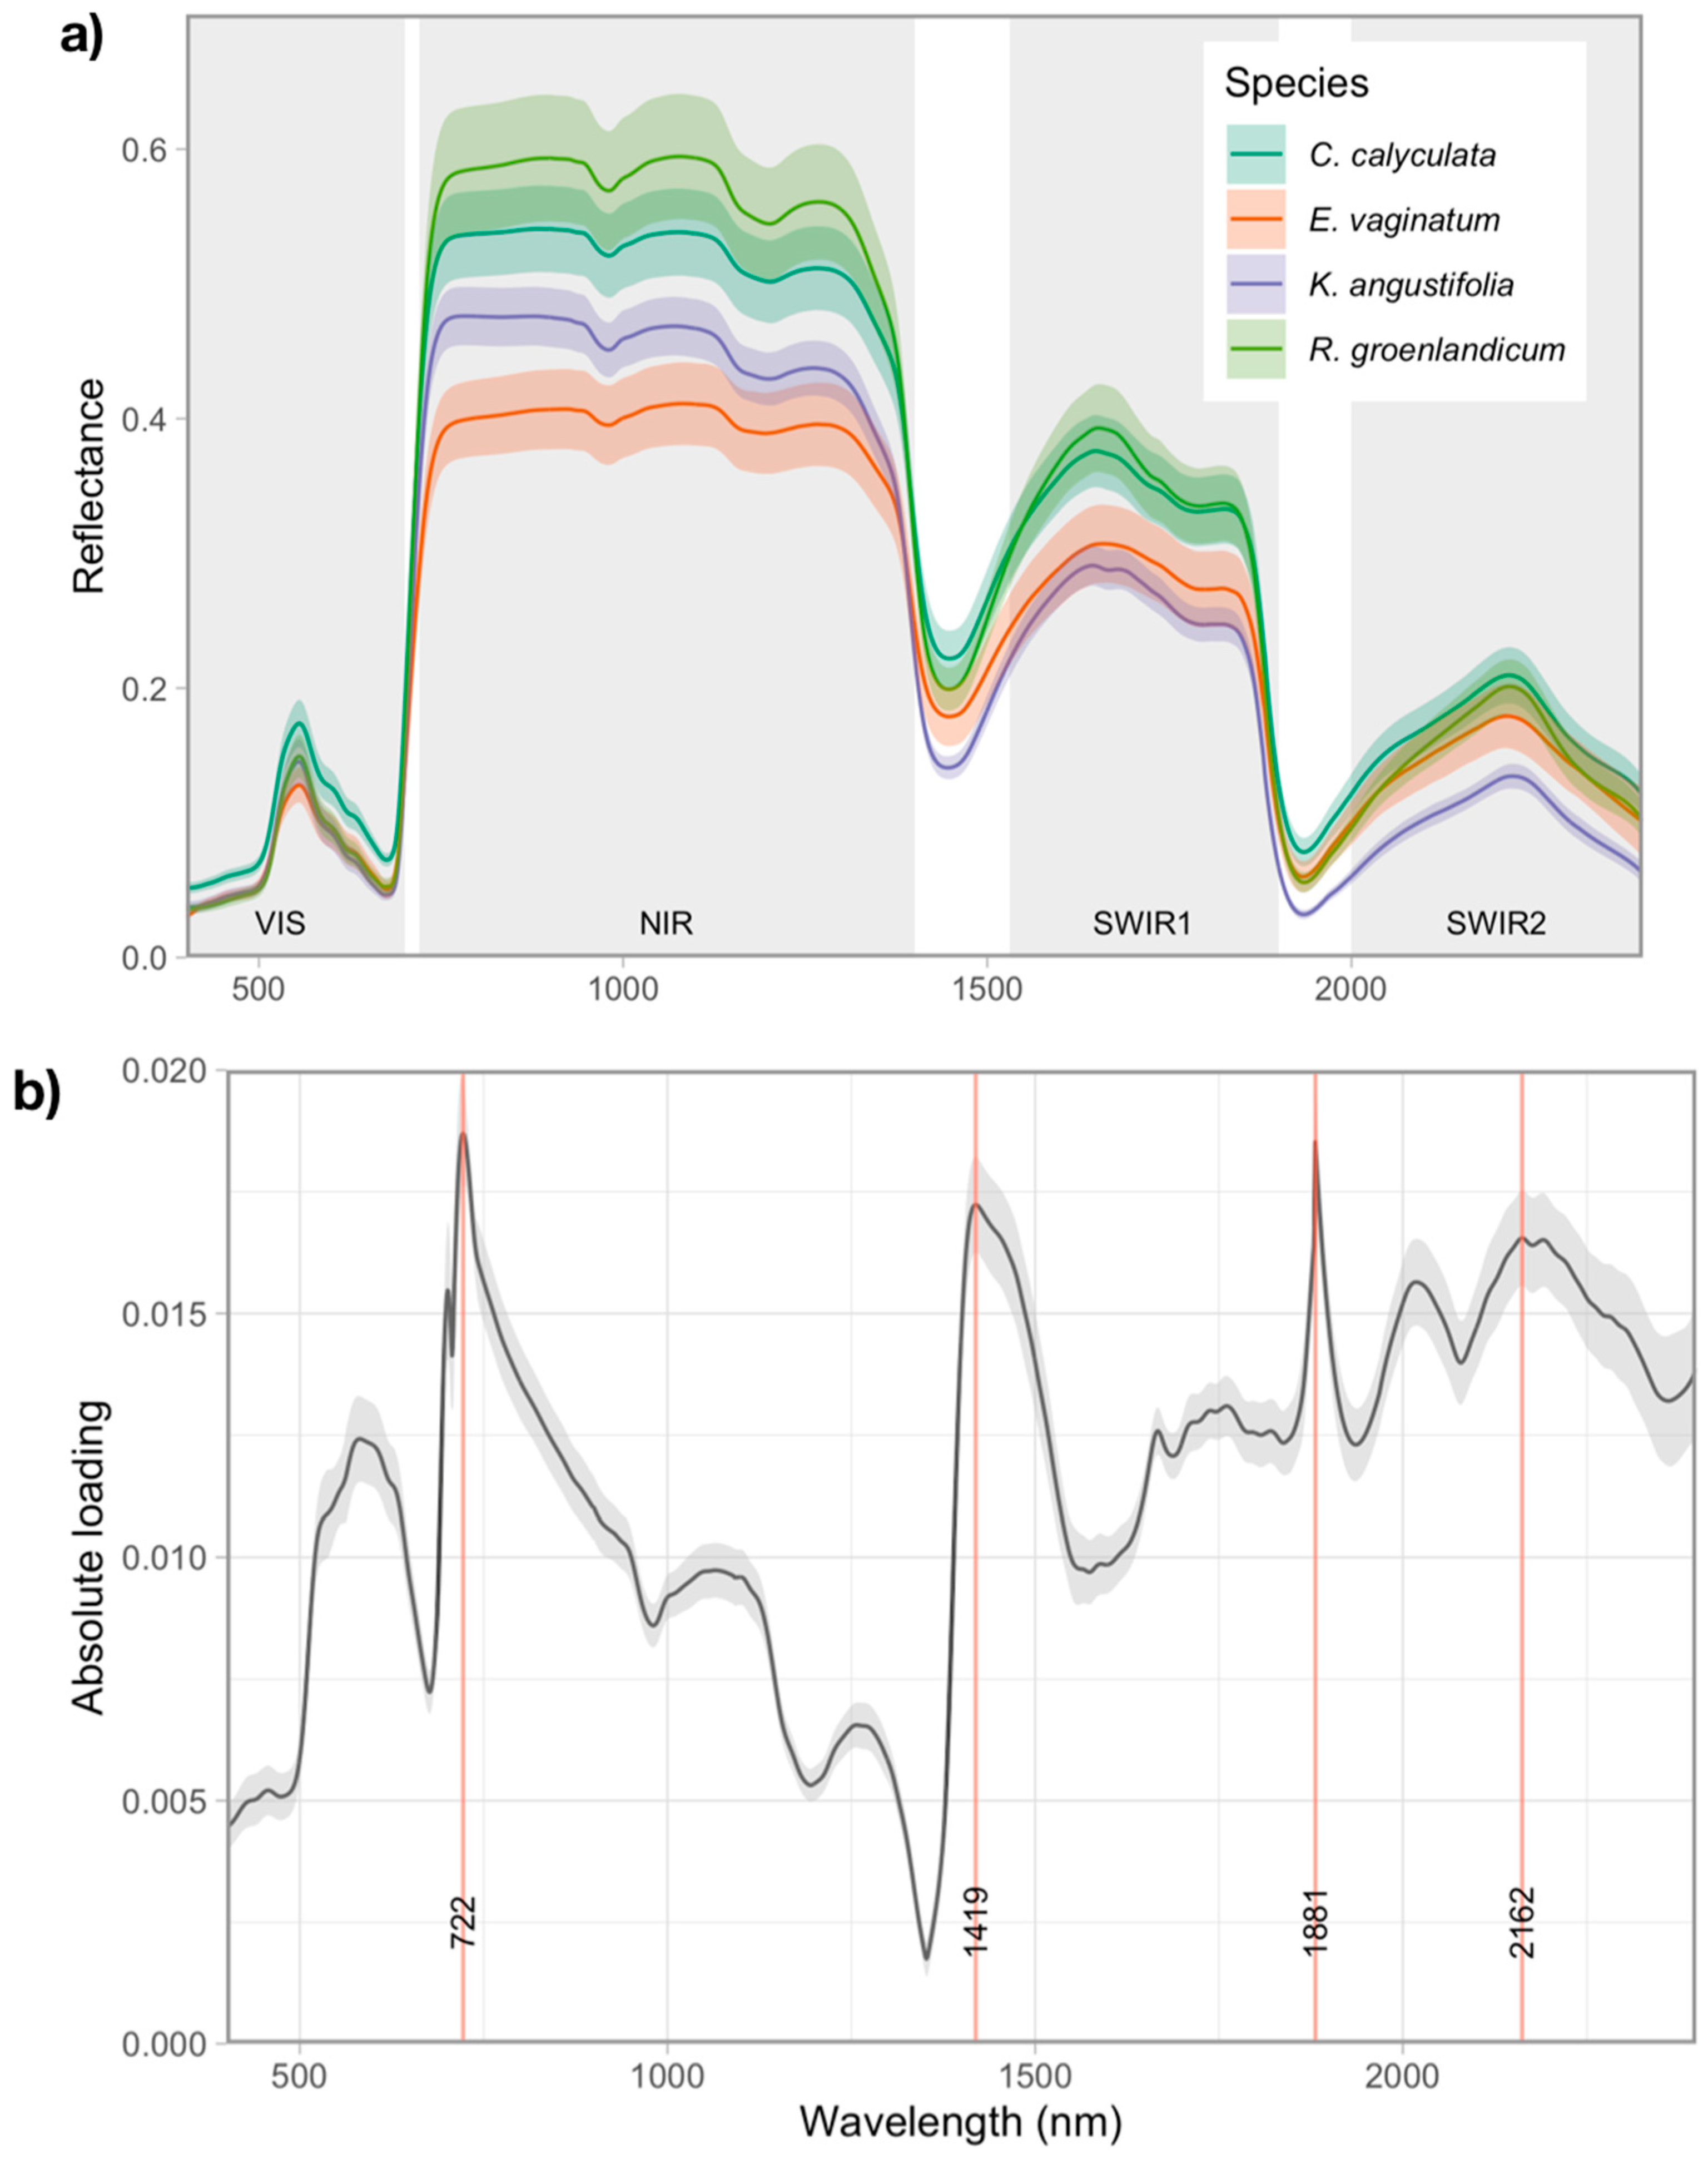
3.2. Variation in Foliar Spectra

A variance partitioning analysis attributed 84% of the variation in foliar spectra to species identity. By contrast, among-site variation (all species considered) in spectra was minor (0.5%), whereas 17.5% of the variation was unexplained.
The FFS identified the spectral bands that helped to distinguish site-specific populations within individual species, indicating spectral variations due to the environment and N deposition. The most important bands varied among species (Figure 4). For C. calyculata, seven bands distributed across the entire spectral range resulted in the highest nearest-neighbor (NN) criterion value (0.67). In order of importance, these bands were 1478, 589, 1338, 1984, 1332, 1384, and 977 nm. E. vaginatum showed the highest spectral variation across sites (as indicated by the standard-deviation) especially in the near infrared (NIR; 720–1400 nm), short-wave infrared 1 (SWIR1; 1530–1900 nm), and SWIR2 (1900–2400 nm). The four bands contributing most to differentiating E. vaginatum among sites were 2212, 1408, 2064, and 1405 nm, (NN criterion = 0.70). Six bands contributed most to differentiating K. angustifolia spectra among sites (NN criterion = 0.67); 530, 2335, 2358, 531, 2325, and 2350 nm. Finally, ten bands, predominantly in the visible (VIS; 400–720 nm) part of the spectrum, were optimal for separating R. groenlandicum spectra among sites (NN criterion = 0.65); 547, 693, 541, 550, 543, 546, 1433, 544, 545, and 662 nm.
A closer examination of spectra of all species in the visible region (Figure 4a–d) revealed covariations with Chl b (mg m−2; see Figure 3). This was most likely caused by higher Chl b content (mg m−2) leading to lower reflectance in the VIS (due to pigment absorption [33]) and vice versa.

Foliar Spectra in Relation to Functional Traits

Most foliar functional traits were well predicted by spectra in PLSR models (Table 3, Figure 5). R2 validation coefficients of PLSR models ranged between 44% and 94% (Table 3). The models with highest predictive power were those for C fractions, C:N ratio, and foliar N concentration, whereas the worst-predicted trait was total carotenoid concentration (NRMSEP; 31.82%; Table 3). The NRMSEP validation values were under 10% for LMA, LDMC, LWC, C:N, C and N concentration, and soluble C. The difference in R2 for calibration and validation models varied between 3% and 16%. Generally, trait predictions within species were overestimated for low values and underestimated for high values (as shown by species-specific regression lines; Figure 5); as were global model predictions (dashed black lines).
Bands of particular importance for foliar trait predictions (Figure S6) were consistent with known absorption features for these traits ([16,48,49,50]; Table S1). For instance, LDMC and LWC, as well as EWT, were best predicted by water absorption bands (wavelengths around 1470 nm and 1927 nm). By contrast, predictions of total N were based on many peaks across the spectrum.

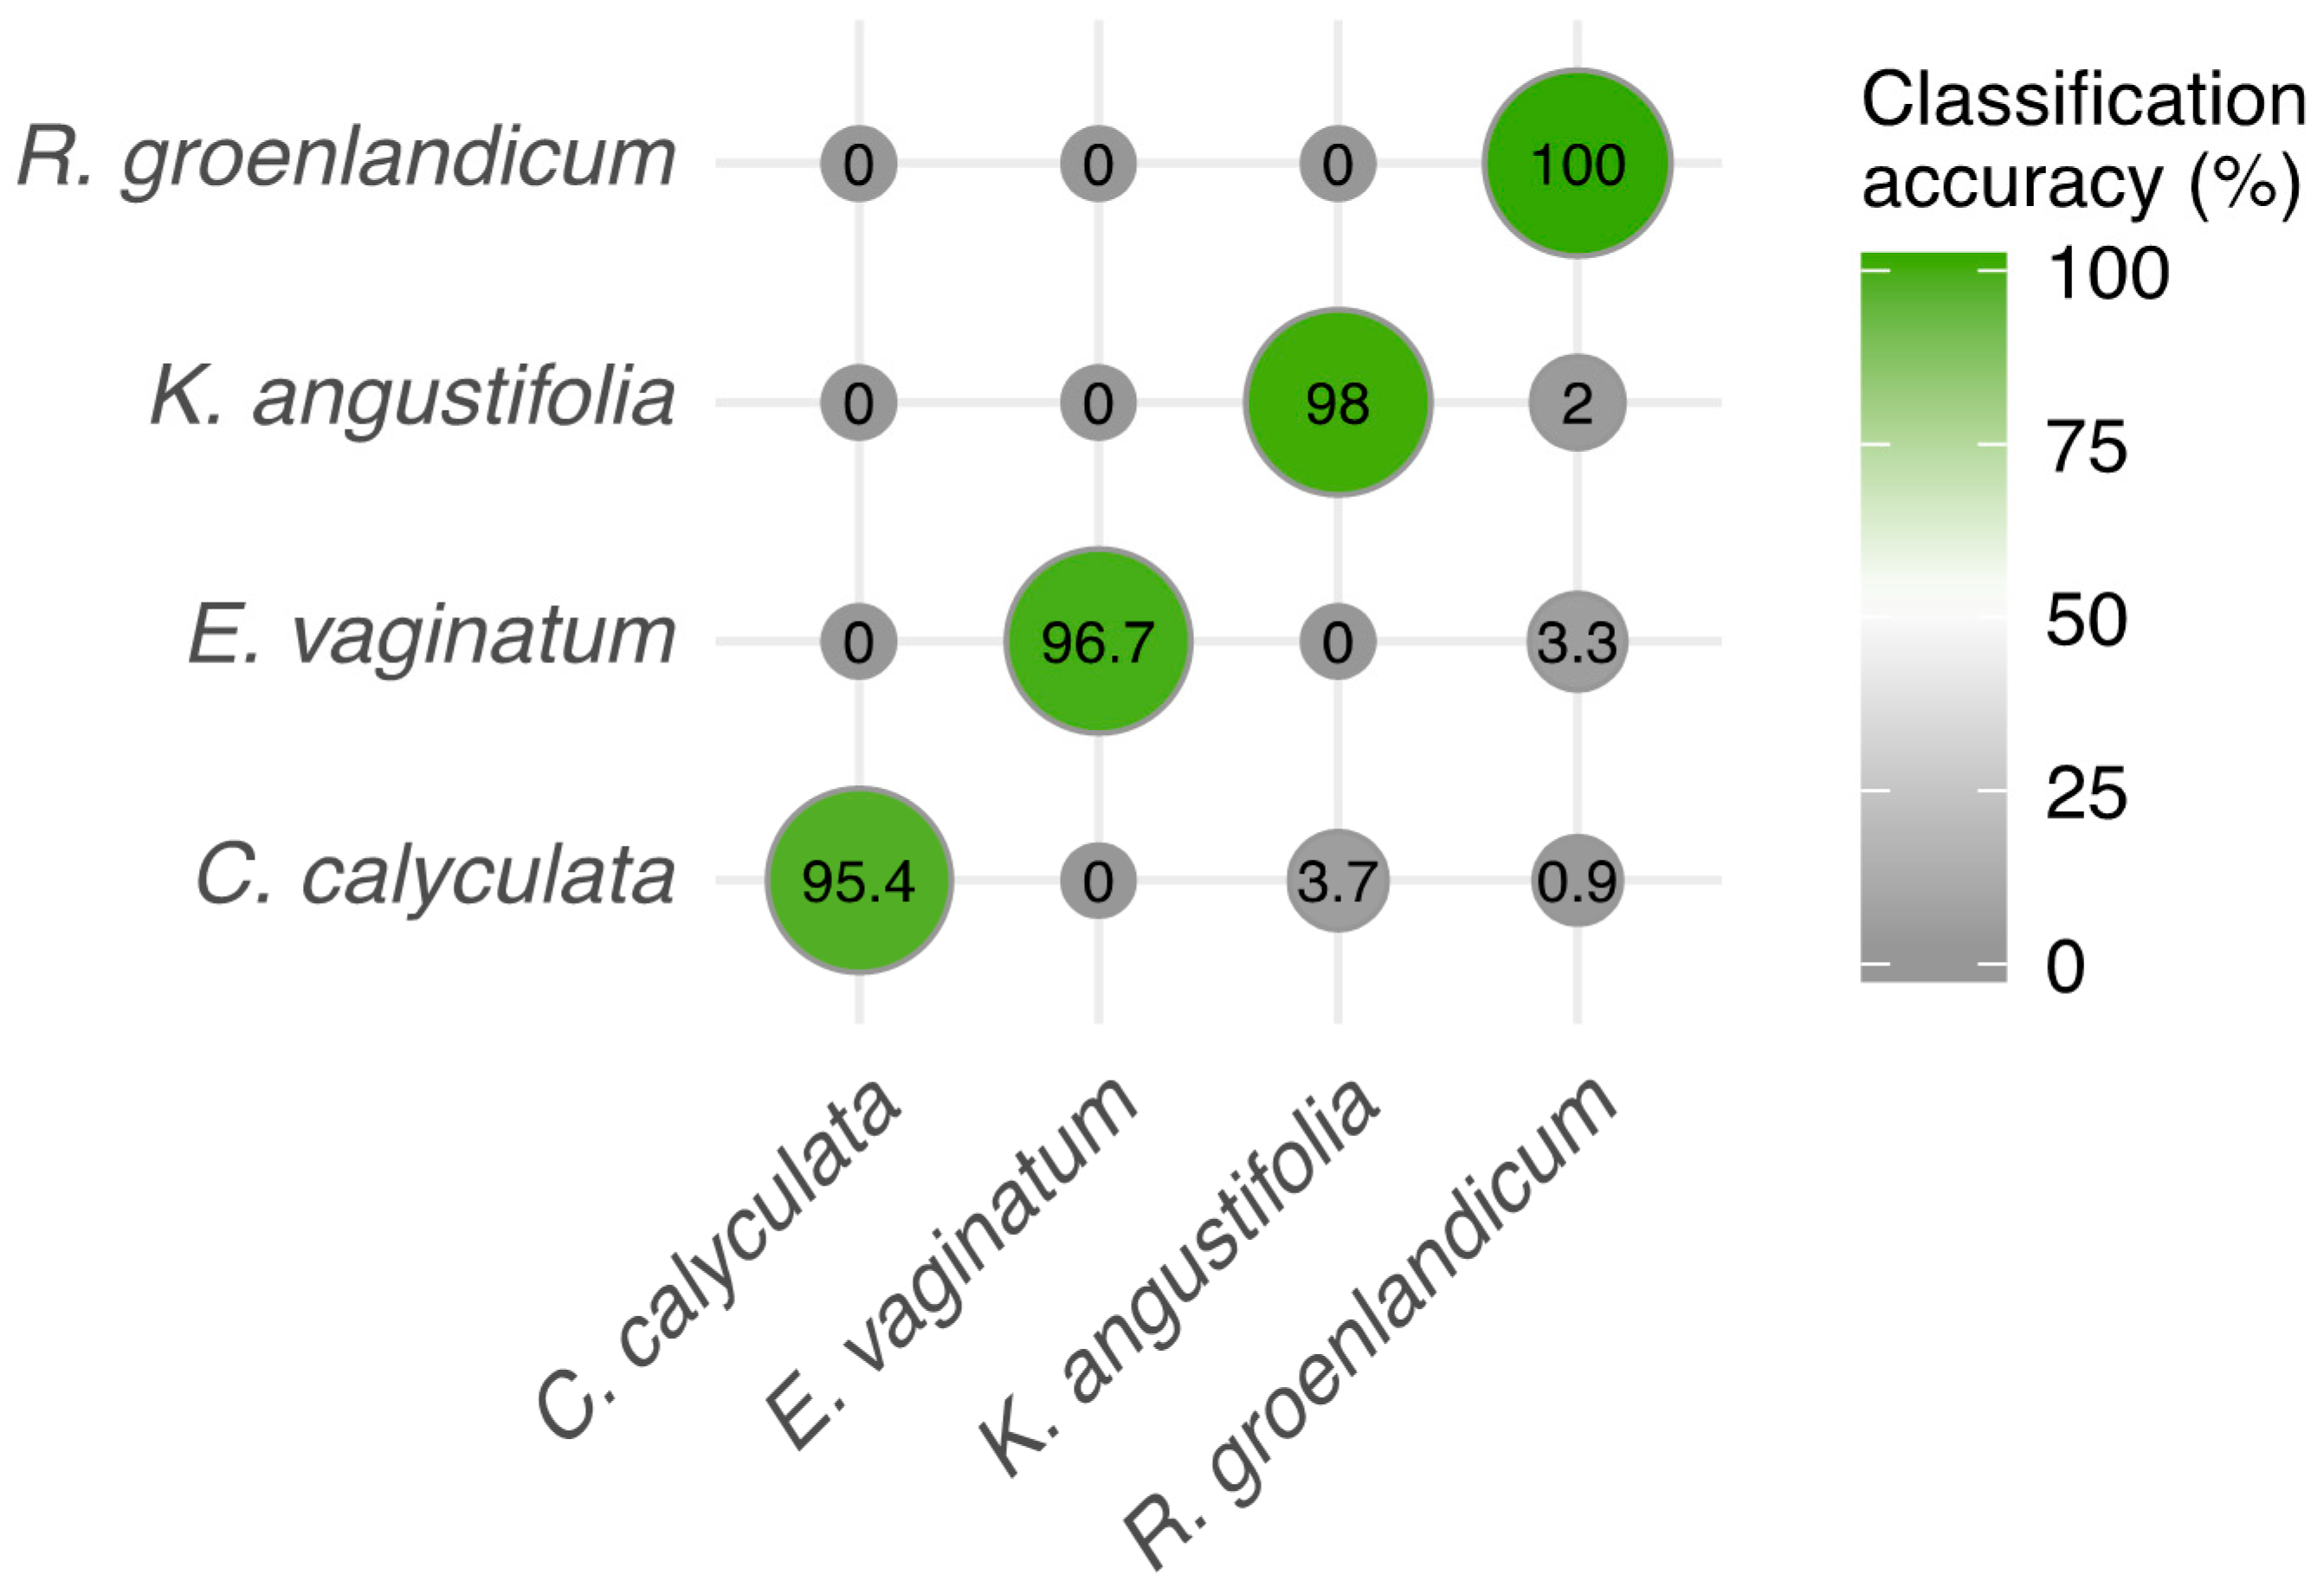
3.3. Species Discrimination Using Spectra

Foliar spectral signatures of the four species differed across much of the spectral range (Figure 6a).
Despite the environmentally-driven intraspecific variation in spectra (Figure 4), species classification based on normalized foliar spectra was highly accurate (Figure 7). Indeed, our PLSDA model resulted in perfect classification accuracy of R. groenlandicum, and excellent classification accuracy (>95% correctly classified) for the other species. K. angustifolia and E. vaginatum were respectively mistaken as R. groenlandicum in 2% and 3.3% of cases, and C. calyculata was mistaken as K. angustifolia or R. groenlandicum in 4.6% of cases. Although all wavelengths contributed to species classification (as shown by the relative loadings of bands in Figure 6b), we found peaks of particular importance around 722 nm, 1419 nm, and 1881 nm. In addition, we found that the SWIR2 region (1900–2400 nm) was of particular importance for species classification.

4. Discussion

Our study highlights important differences in foliar traits and spectra among vascular plant species in bogs spanning a wide range of environmental conditions, particularly with regard to soil N availability. Consistent with our first hypothesis, we found that within-species variation in N-related foliar traits, namely N concentration and Chl b content (mg m−2), tracked differences in N availability across sites. We also found that most foliar traits measured could be accurately predicted from spectra. However, intraspecific trait predictions were far less accurate. Despite the fact that intraspecific variation in some N-related traits was related to N deposition, the largest amount of spectral variation was found among and not within species, and we were able to accurately classify species from spectra despite broad environmental variation among our sampled sites. Our leaf-level results show promise for future applications of imaging spectroscopy to monitor ecosystem changes due to N deposition in bogs, but suggest that spectroscopy in the optical range is better suited to detect changes in vascular plant species composition rather than intraspecific differences in foliar chemistry. They also suggest that remote sensing of vascular plant species and plant biodiversity in bogs using spectroscopy is feasible across variable environments. However, further investigation is needed to accurately scale our results to imaging spectroscopy from low altitude platforms (e.g., unmanned aerial vehicle, UAV) since additional complications of plant structural, atmospheric, and illumination variables impact plant spectra at those scales.
The majority of foliar spectral variation was linked to species identity, despite the fact that we sampled across a wide range of environmental conditions. This finding suggests that environmental variation has a much smaller effect on foliar spectra than does species identity, which is consistent with studies in other ecosystem types that have found large spectral differences among species [25,61,62,63]. Different spectral bands in the VIS region of the three ericaceous shrubs allowed to distinguish site-specific populations, corresponding with an increase in pigment (i.e., Chl b, mg m−2) across the N deposition gradient. For E. vaginatum, we found that its foliar Chl a and b concentrations (both area and mass-based) was higher than that of the three ericaceous shrubs, and that its Chl b content (mg m−2) varied across the N deposition gradient. However, the VIS region did not allow site differentiation for this species. Féret and Asner [61] found that spectral variations are not directly proportional to trait variations, since those correlations depend on the relative content of a chemical in the leaf. They suggest that saturation in light absorption can occur if a given constituent of the leaf is in high concentration. Therefore, small changes in a leaf trait related to a constituent in high concentration might not be noticeable in the foliar spectra. By contrast, more variation in spectra can be detected if a given leaf constituent is at lower concentrations. This might explain why no bands in the VIS region contributed to differentiate E. vaginatum populations among sites. On the other hand, the increase in foliar N concentration across the gradient might help to differentiate E. vaginatum populations growing on sites with varying soil N availability. For instance, the wavelength 2064 nm, which is associated with absorption by foliar proteins (2060 nm; [48]) was identified by the FFS analysis. Still, further work is needed to better understand the link between trait and spectral variation within species, and to better quantify the extent of environmentally-induced variation.
Remote plant species identification gives the opportunity to create species-level vegetation maps, offering new possibilities for large-scale biodiversity surveys. In our study, we found high accuracy in species classification based on foliar spectra using PLSDA. This was due to the relatively small within-species spectral variation—in response to the environment—as opposed to the large interspecific variation in plant traits. The high classification accuracy we obtained could possibly be due to the fact that our models included a small number of species. However, a lower classification accuracy was found when including fewer species [62], indicating that low species numbers does not guarantee high classification accuracy. Moreover, Schweiger et al. [52] found high classification accuracies for a PLSDA model with 14 grassland species. On the other hand, if intraspecific variation is high and interspecific spectral variation is low, misclassification tends to be higher [61]. Here, this was shown by the tendency of our models to classify many unknown spectra as being R. groenlandicum, the species showing the highest intraspecific spectral variability (absolute reflectance). Other studies also found promising species classification accuracy using imaging spectroscopy in bogs [22,23,24] and other ecosystems [52,64,65]. Overall, our results show that species identification using spectral information is reliable, even when data are collected under diverse environmental conditions. In particular, the fact that we were able to distinguish three vascular plant species in the same family (Ericaceae) is noteworthy, because foliar spectra have been shown to be phylogenetically structured [17,18,19,62].
The PLSDA analyses not only classified species accurately, but also indicated the contribution of different spectral bands to the classification. These specific regions of importance in the spectra are linked to traits that differ among the species [62]. In this study, all spectral regions contributed to the classification, as found by Cavender-Bares et al. [62]. However, some regions were of particular importance; the VIS region was important suggesting that pigment concentration was of high importance for species discrimination [66]. In addition, the red edge (peak at 722 nm) contributed strongly to species discrimination. Other regions (especially around 1419 and 1881 nm) were also important for the classification of species due to two factors. First, rapid changes in reflectance just before 1500 nm and 2000 nm were likely caused by variation in water content among the species [48]. A second factor underlying the importance of these regions could be the existence of significant differences in C fractions in the leaves of the four species. Indeed, Curran [48] associated absorption peaks of about 1420, 1450, and 1890 nm with lignin, starch, sugar (soluble C), and cellulose. All of these traits (C fractions and water content) have absorption features that broadly overlap with each other around those regions, explaining their importance in species classification models. Finally, the regions around 2130 and 2180 nm are associated with absorption by proteins, which might be explained by the important differences in foliar N concentrations between the Ericaceae and the Cyperaceae. Remote identification of vascular peatland species would help to monitor changes in plant community composition, a frequently reported consequence of the many disturbances that occur in these ecosystems. Here, we show that many spectral features differentiate these four abundant and very common bog species. Furthermore, because ombrotrophic systems show relatively low vascular plant species diversity, but relatively high functional diversity [12], we are confident that accurate maps of plant community composition are within reach, with sufficiently high spectral and spatial resolution (e.g., UAV imaging spectroscopy [12]).
The links between foliar spectra and environmental variation is not yet fully understood. Here, we show that a gradient in N deposition in bogs, be it experimental or natural, leads to increases in foliar N-related trait values. In particular, an increase in N availability for vascular plants was associated with an increase in Chl b content (mg m−2), a result consistent with previous studies (e.g., [33]). It is well known that photosynthetic pigments absorb the main proportion of incoming solar radiation in the VIS (e.g., [48]). Consistently, a decrease in VIS reflectance (in line with an increase in pigment concentrations) was detectable in our spectral data, for all species. Our future goal being to apply these in situ findings to remotely sensed data, it is interesting to note that the four species in this study reacted similarly in the VIS, as they all showed a diminution in the VIS reflectance along an increasing N deposition gradient. Generally, informative leaf-level water-absorption bands (regions around 1400 and 1900 nm) are being lost when upscaling from leaf-level spectroscopy to remote sensing, since they are masked by atmospheric water absorption [61,67]. Here, we show that the variations in the VIS are similar among the four species, revealing a potential indicator for detecting temporal or spatial differences in N depositions, with high-resolution remote sensing data such as those captured by UAV’s. Imaging spectrometers mounted on UAV’s measure spectral reflectance at spatial resolution (pixel size) in the cm range [13]. However, in bog ecosystems these image pixels would in most cases exceed the size of individual leaves and plants, potentially leading to more than one species influencing the spectral information in each pixel [68]. More work is needed to find solutions to such spatial scaling problems [69].
Our results show high accuracy in multi-species trait predictions for several traits, demonstrating the potential of spectroscopy to determine large-scale plant functional variation through non-destructive approaches. For example, C:N ratio, total C and N concentrations, leaf water and dry matter contents and soluble C were predicted with high accuracy (NRMSEP < 10%). In fact, the magnitude of errors was similar to those obtained by traditional sampling techniques [15]. The capacity of multi-species trait prediction is important as scaling up to airborne sensed data means a loss in spatial resolution, meaning that many species might influence the spectral information captured within one pixel [12,68]. In contrast, species-specific PLSR models performed less well, probably due to little intraspecific trait variation and thus small ranges of measured values. The most obvious examples for this are Chl a and b predictions (both mass and area-based); regression lines within a species predicted values were almost flat, meaning that for a range of measured values, the model always predicts approximately the same value. Our multi-species PLSRs were not sufficiently accurate to allow for estimates of traits within a small range of values (e.g., for a species), for which species-specific models trained with more data would be needed [12].

5. Conclusions

Our study provided new insights about foliar spectral and trait variations in ombrotrophic bogs along a natural and experimental gradient in N deposition. Despite broad environmental variation across the sampled bogs, we found that species identity was the main factor influencing leaf spectral and trait variation. However, intraspecific variation in some traits, notably foliar N concentration and Chl b (mg m−2), suggests that spectroscopy shows potential to monitor N deposition across bogs, since these traits could also be accurately predicted from spectra, even in the absence of changes in plant species composition. Further studies on the sources of spectral and trait variation in other important bog species, notably Sphagnum mosses, should be carried out in order to get a better representation of bog vegetation. Overall, our study shows a strong potential for spectroscopy for foliar trait prediction and plant species identification in bog ecosystems, which could be used as a tool to monitor environmental changes such as atmospheric N deposition.

Supplementary Materials

The following are available online at https://www.mdpi.com/2072-4292/12/15/2448/s1; Figure S1. Location of the three ombrotrophic bogs in southern Québec and Ontario (Canada): La Mer Bleue Peatland, La Grande-Tourbière-de-Villeroy, and La Grande-plée-Bleue); Figure S2. Mean values and standard error of (a) peat N concentration (%), (b) pH in the peat water, (c) Corrected electrical conductivity (EC) in the peat water, and (d) water table depth (cm) for each bog at moment of sampling; Figure S3. Custom sample mount for sampling leaf spectra of small leaves; Figure S4. Parameters (n: filter length; p: filter order) and regions (colored background) used for the Savitzky–Golay filter on leaf spectra; Table S1. References for determination of wavelength ranges used in PLSR analyses for leaf functional traits; Table S2. Statistical significance of site, species and their interactive (site:species) effect in linear mixed effect models for foliar traits from E. vaginatum, K. angustifolia, C. calyculata, and R. groenlandicum; Figure S5. Mean (±standard error) functional traits in relation to localization and species (a) and species (b); and Figure S6. Variable importance of the predictors (VIP) of wavelengths indicating their contribution to the prediction of foliar traits.

Author Contributions

E.L. and A.G. developed the ideas and designed the methodology. A.G. collected the data. All authors helped to analyze the data. A.G. prepared the original draft of the manuscript and all authors contributed to the writing of subsequent versions. All authors have read and agreed to the published version of the manuscript.

Funding

A.G., A.K.S. and M.K. were supported by the Canadian Airborne Biodiversity Observatory (CABO), a project led by E.L. that was funded by a Discovery Frontiers grant from Natural Sciences and Engineering Research Council of Canada (NSERC; grant number 509190-2017). A.C. was supported by NSERC Discovery grants to E.L. (RGPIN-2014-06106, RGPIN-2019-04537) and by a PhD scholarship from Fonds de recherche du Québec sur la Nature et technologies (FRQNT).

Acknowledgments

We would like to thank Tim Moore for information about the Mer Bleue fertilization experiment, the National Capital Commission (NCC) for access to Mer Bleue, and our lab colleagues for their help and for the discussions that fed our thoughts. We would also like to thank the many field and lab assistants and lab technicians for their effort and patience during this research.

Conflicts of Interest

The authors declare no conflict of interest. The funders had no role in the design of the study; in the collection, analyses, or interpretation of data; in the writing of the manuscript, or in the decision to publish the results.

References

  1. Galloway, J.N.; Dentener, F.J.; Capone, D.G.; Boyer, E.W.; Howarth, R.W.; Seitzinger, S.P.; Asner, G.P.; Cleveland, C.C.; Green, P.A.; Holland, E.A. Nitrogen cycles: Past, present, and future. Biogeochemistry 2004, 70, 153–226. [Google Scholar] [CrossRef]
  2. Galloway, J.N.; Townsend, A.R.; Erisman, J.W.; Bekunda, M.; Cai, Z.; Freney, J.R.; Martinelli, L.A.; Seitzinger, S.P.; Sutton, M.A. Transformation of the nitrogen cycle: Recent trends, questions, and potential solutions. Science 2008, 320, 889–892. [Google Scholar] [CrossRef] [PubMed] [Green Version]
  3. Van Breemen, N. How Sphagnum bogs down other plants. Trends Ecol. Evol. 1995, 10, 270–275. [Google Scholar] [CrossRef]
  4. Gorham, E. Northern peatlands: Role in the carbon cycle and probable responses to climatic warming. Ecol. Appl. 1991, 1, 182–195. [Google Scholar] [CrossRef]
  5. Tarnocai, C.; Kettles, I.; Lacelle, B. Peatlands of Canada. In Geological Survey of Canada, Open File 6551; Natural Resources Canada: Ottawa, ON, Canada, 2011; Volume 10. [Google Scholar]
  6. Vitt, D.H.; Wieder, K.; Halsey, L.A.; Turetsky, M. Response of Sphagnum fuscum to nitrogen deposition: A case study of ombrogenous peatlands in Alberta, Canada. Bryologist 2003, 106, 235–246. [Google Scholar] [CrossRef]
  7. Turunen, J.; Roulet, N.T.; Moore, T.R.; Richard, P.J.H. Nitrogen deposition and increased carbon accumulation in ombrotrophic peatlands in eastern Canada. Glob. Biogeochem. Cycles 2004, 18, GB3002. [Google Scholar] [CrossRef] [Green Version]
  8. Moore, T.R.; Knorr, K.-H.; Thompson, L.; Roy, C.; Bubier, J.L. The effect of long-term fertilization on peat in an ombrotrophic bog. Geoderma 2019, 343, 176–186. [Google Scholar] [CrossRef]
  9. Bragazza, L.; Freeman, C.; Jones, T.; Rydin, H.; Limpens, J.; Fenner, N.; Ellis, T.; Gerdol, R.; Hájek, M.; Hájek, T. Atmospheric nitrogen deposition promotes carbon loss from peat bogs. Proc. Natl. Acad. Sci. USA 2006, 103, 19386–19389. [Google Scholar] [CrossRef] [Green Version]
  10. Bubier, J.L.; Moore, T.R.; Crosby, G. Fine-scale vegetation distribution in a cool temperate peatland. Botany 2006, 84, 910–923. [Google Scholar] [CrossRef]
  11. Bubier, J.L.; Moore, T.R.; Bledzki, L.A. Effects of nutrient addition on vegetation and carbon cycling in an ombrotrophic bog. Glob. Chang. Biol. 2007, 13, 1168–1186. [Google Scholar] [CrossRef] [Green Version]
  12. Kalacska, M.; Lalonde, M.; Moore, T.R. Estimation of foliar chlorophyll and nitrogen content in an ombrotrophic bog from hyperspectral data: Scaling from leaf to image. Remote Sens. Environ. 2015, 169, 270–279. [Google Scholar] [CrossRef]
  13. Arroyo-Mora, J.P.; Kalacska, M.; Inamdar, D.; Soffer, R.; Lucanus, O.; Gorman, J.; Naprstek, T.; Schaaf, E.S.; Ifimov, G.; Elmer, K. Implementation of a UAV–hyperspectral pushbroom imager for ecological monitoring. Drones 2019, 3, 12. [Google Scholar] [CrossRef] [Green Version]
  14. Arroyo-Mora, J.; Kalacska, M.; Soffer, R.; Ifimov, G.; Leblanc, G.; Schaaf, E.; Lucanus, O. Evaluation of phenospectral dynamics with Sentinel-2A using a bottom-up approach in a northern ombrotrophic peatland. Remote Sens. Environ. 2018, 216, 544–560. [Google Scholar] [CrossRef]
  15. Asner, G.P.; Martin, R.E. Spectral and chemical analysis of tropical forests: Scaling from leaf to canopy levels. Remote Sens. Environ. 2008, 112, 3958–3970. [Google Scholar] [CrossRef]
  16. Yang, X.; Tang, J.; Mustard, J.F.; Wu, J.; Zhao, K.; Serbin, S.; Lee, J.-E. Seasonal variability of multiple leaf traits captured by leaf spectroscopy at two temperate deciduous forests. Remote Sens. Environ. 2016, 179, 1–12. [Google Scholar] [CrossRef] [Green Version]
  17. Schweiger, A.K.; Cavender-Bares, J.; Townsend, P.A.; Hobbie, S.E.; Madritch, M.D.; Wang, R.; Tilman, D.; Gamon, J.A. Plant spectral diversity integrates functional and phylogenetic components of biodiversity and predicts ecosystem function. Nat. Ecol. Evol. 2018, 2, 976–982. [Google Scholar] [CrossRef] [PubMed]
  18. McManus, K.M.; Asner, G.P.; Martin, R.E.; Dexter, K.G.; Kress, W.J.; Field, C.B. Phylogenetic structure of foliar spectral traits in tropical forest canopies. Remote Sens. 2016, 8, 196. [Google Scholar] [CrossRef] [Green Version]
  19. Meireles, J.E.; Cavender-Bares, J.; Townsend, P.A.; Ustin, S.L.; Gamon, J.A.; Schweiger, A.K.; Schaepman, M.E.; Asner, G.P.; Martin, R.E.; Singh, A.; et al. Leaf reflectance spectra capture the evolutionary history of seed plants. New Phytol. 2020. [Google Scholar] [CrossRef]
  20. Middleton, M.; Närhi, P.; Arkimaa, H.; Hyvönen, E.; Kuosmanen, V.; Treitz, P.; Sutinen, R. Ordination and hyperspectral remote sensing approach to classify peatland biotopes along soil moisture and fertility gradients. Remote Sens. Environ. 2012, 124, 596–609. [Google Scholar] [CrossRef]
  21. Thomas, V.; Treitz, P.; Jelinski, D.; Miller, J.; Lafleur, P.; McCaughey, J.H. Image classification of a northern peatland complex using spectral and plant community data. Remote Sens. Environ. 2003, 84, 83–99. [Google Scholar] [CrossRef]
  22. Schmidtlein, S.; Zimmermann, P.; Schüpferling, R.; Weiss, C. Mapping the floristic continuum: Ordination space position estimated from imaging spectroscopy. J. Veg. Sci. 2007, 18, 131–140. [Google Scholar] [CrossRef]
  23. Harris, A.; Charnock, R.; Lucas, R.M. Hyperspectral remote sensing of peatland floristic gradients. Remote Sens. Environ. 2015, 162, 99–111. [Google Scholar] [CrossRef] [Green Version]
  24. Cole, B.; McMorrow, J.; Evans, M. Empirical modelling of vegetation abundance from airborne hyperspectral data for upland peatland restoration monitoring. Remote Sens. 2014, 6, 716–739. [Google Scholar] [CrossRef] [Green Version]
  25. Asner, G.P.; Martin, R.E. Airborne spectranomics: Mapping canopy chemical and taxonomic diversity in tropical forests. Front. Ecol. Environ. 2009, 7, 269–276. [Google Scholar] [CrossRef] [Green Version]
  26. Larmola, T.; Bubier, J.L.; Kobyljanec, C.; Basiliko, N.; Juutinen, S.; Humphreys, E.; Preston, M.; Moore, T.R. Vegetation feedbacks of nutrient addition lead to a weaker carbon sink in an ombrotrophic bog. Glob. Chang. Biol. 2013, 19, 3729–3739. [Google Scholar] [CrossRef] [PubMed]
  27. Ouimet, R. Programme de Surveillance de la Qualité des Précipitation du Ministère des Forêts, de la Faune et des Parcs du Québec; Ministère des Forêts, de la Faune et des Parcs: Québec, QC, Canada, 2018. [Google Scholar]
  28. Pinsonneault, A.J.; Moore, T.R.; Roulet, N.T. Effects of long-term fertilization on peat stoichiometry and associated microbial enzyme activity in an ombrotrophic bog. Biogeochemistry 2016, 129, 149–164. [Google Scholar] [CrossRef]
  29. Government of Canada. Canadian Climate Normals 1981–2010; Government of Canada: Ottawa, ON, Canada, 2011.
  30. Goud, E.M.; Moore, T.R.; Roulet, N.T. Predicting peatland carbon fluxes from non-destructive plant traits. Funct. Ecol. 2017, 31, 1824–1833. [Google Scholar] [CrossRef] [Green Version]
  31. Larocque, M.; Colpron-Tremblay, J.; Lavoie, M.; Tremblay, L. Écohydrologie de la Grande Tourbière de Villeroy; Rapport d’activités; Ministère du Développement durable, de l’Environnement, de la Faune et des Parcs: Montréal, QC, Canada, 2013. [Google Scholar]
  32. Lavoie, M.; Colpron-Tremblay, J.; Robert, É.C. Développement d’une vaste tourbière ombrotrophe non perturbée en contexte périurbain au Québec méridional. Ecoscience 2012, 19, 285–297. [Google Scholar] [CrossRef]
  33. Bubier, J.L.; Smith, R.; Juutinen, S.; Moore, T.R.; Minocha, R.; Long, S.; Minocha, S. Effects of nutrient addition on leaf chemistry, morphology, and photosynthetic capacity of three bog shrubs. Oecologia 2011, 167, 355–368. [Google Scholar] [CrossRef]
  34. Malmer, N.; Wallén, B. The dynamics of peat accumulation on bogs: Mass balance of hummocks and hollows and its variation throughout a millennium. Ecography 1999, 22, 736–750. [Google Scholar] [CrossRef]
  35. Kalacska, M.; Arroyo-Mora, J.; Soffer, R.; Roulet, N.; Moore, T.; Humphreys, E.; Leblanc, G.; Lucanus, O.; Inamdar, D. Estimating peatland water table depth and net ecosystem exchange: A comparison between satellite and airborne imagery. Remote Sens. 2018, 10, 687. [Google Scholar] [CrossRef] [Green Version]
  36. Foley, S.; Rivard, B.; Sanchez-Azofeifa, G.A.; Calvo, J. Foliar spectral properties following leaf clipping and implications for handling techniques. Remote Sens. Environ. 2006, 103, 265–275. [Google Scholar] [CrossRef]
  37. Laliberté, E. Measuring Specific Leaf Area and Water Content V.1. Available online: https://www.protocols.io/view/measuring-specific-leaf-area-and-water-content-p3tdqnn (accessed on 16 June 2019).
  38. Laliberté, E.; Soffer, R. Measuring Spectral Reflectance and Transmittance (350–2500 nm) of Small and/or Narrow Leaves Using the Spectra Vista Corporation (SVC) DC-R/T Integrating Sphere V.3. Available online: https://www.protocols.io/view/measuring-spectral-reflectance-and-transmittance-3-q56dy9e (accessed on 3 July 2019).
  39. Noda, H.M.; Motohka, T.; Murakami, K.; Muraoka, H.; Nasahara, K.N. Accurate measurement of optical properties of narrow leaves and conifer needles with a typical integrating sphere and spectroradiometer. Plant Cell Environ. 2013, 36, 1903–1909. [Google Scholar] [CrossRef]
  40. Warren, C.R. Rapid measurement of chlorophylls with a microplate reader. J. Plant Nutr. 2008, 31, 1321–1332. [Google Scholar] [CrossRef]
  41. Ritchie, R.J. Consistent sets of spectrophotometric chlorophyll equations for acetone, methanol and ethanol solvents. Photosynth. Res. 2006, 89, 27–41. [Google Scholar] [CrossRef] [PubMed]
  42. Jocelyne Ayotte, E.L. Measuring Leaf Carbon Fractions with the ANKOM2000 Fiber Analyzer. 2019. Available online: https://www.protocols.io/view/measuring-leaf-carbon-fractions-with-the-ankom2000-yinfude (accessed on 20 June 2019). [CrossRef]
  43. Ayotte, J.; Guilbeault-Mayers, X.; Laliberté, E. Measuring CN Content in Leaf Samples Using Elementar Vario MICRO Cube. 2019. Available online: https://www.protocols.io/view/measuring-cn-content-in-leaf-samples-using-element-udces2w (accessed on 20 June 2019). [CrossRef]
  44. Van Der Heijden, F.; Duin, R.P.; De Ridder, D.; Tax, D.M. Classification, Parameter Estimation and State Estimation: An Engineering Approach Using MATLAB; John Wiley & Sons: Hoboken, NJ, USA, 2005. [Google Scholar]
  45. Castro-Esau, K.L.; Sánchez-Azofeifa, G.A.; Rivard, B.; Wright, S.J.; Quesada, M. Variability in leaf optical properties of Mesoamerican trees and the potential for species classification. Am. J. Bot. 2006, 93, 517–530. [Google Scholar] [CrossRef] [PubMed]
  46. Castro-Esau, K.L.; Sánchez-Azofeifa, G.; Caelli, T. Discrimination of lianas and trees with leaf-level hyperspectral data. Remote Sens. Environ. 2004, 90, 353–372. [Google Scholar] [CrossRef]
  47. Wold, S.; Ruhe, A.; Wold, H.; Dunn, I.I.I. The collinearity problem in linear regression. The partial least squares (PLS) approach to generalized inverses. SIAM J. Sci. Stat. Comput. 1984, 5, 735–743. [Google Scholar] [CrossRef] [Green Version]
  48. Curran, P.J. Remote sensing of foliar chemistry. Remote Sens. Environ. 1989, 30, 271–278. [Google Scholar] [CrossRef]
  49. Garden, D.M. Physical and physiological properties of plants. In Remote Sensing with Special Reference to Agriculture and Forestry: With Special Reference to Agriculture and Forestry; National Academy of Sciences: Washington, DC, USA, 1970; Volume 224. [Google Scholar]
  50. Asner, G.P.; Martin, R.E.; Tupayachi, R.; Emerson, R.; Martinez, P.; Sinca, F.; Powell, G.V.N.; Wright, S.J.; Lugo, A.E. Taxonomy and remote sensing of leaf mass per area (LMA) in humid tropical forests. Ecol. Appl. 2011, 21, 85–98. [Google Scholar] [CrossRef]
  51. Asner, G.P.; Martin, R.E.; Carranza-Jiménez, L.; Sinca, F.; Tupayachi, R.; Anderson, C.B.; Martinez, P. Functional and biological diversity of foliar spectra in tree canopies throughout the Andes to Amazon region. New Phytol. 2014, 204, 127–139. [Google Scholar] [CrossRef] [PubMed]
  52. Schweiger, A.K.; Cavender-Bares, J.; Townsend, P.A.; Hobbie, S.E.; Madritch, M.D.; Kothari, S.; Grossman, J.J.; Gholizadeh, H.; Wang, R.; Gamon, J.A. Spectral niches reveal taxonomic identity and complementarity in plant communities. bioRxiv 2020. [Google Scholar] [CrossRef] [Green Version]
  53. Feilhauer, H.; Asner, G.P.; Martin, R.E.; Schmidtlein, S. Brightness-normalized partial least squares regression for hyperspectral data. J. Quant. Spectrosc. Radiat. Transf. 2010, 111, 1947–1957. [Google Scholar] [CrossRef]
  54. R Core Team. R: A Language and Environment for Statistical Computing; R Core Team: Vienna, Austria, 2013. [Google Scholar]
  55. Oksanen, J.; Kindt, R.; Legendre, P.; O’Hara, B.; Stevens, M.H.H.; Oksanen, M.J.; Suggests, M. The vegan package. Community Ecol. Package 2007, 10, 631–637. [Google Scholar]
  56. Williams, C.K.; Engelhardt, A.; Cooper, T.; Mayer, Z.; Ziem, A.; Scrucca, L.; Tang, Y.; Candan, C.; Hunt, T.; Kuhn, M.M. Package ‘Caret’. 2019. Available online: https://pbil.univ-lyon1.fr/CRAN/web/packages/caret/caret.pdf (accessed on 11 August 2019).
  57. Lenth, R. Emmeans: Estimated Marginal Means, aka Least-Squares Means; R Package Version 1.4. 2019. Available online: https://cran.r-project.org/web/packages/emmeans/index.html (accessed on 13 October 2019).
  58. Meireles, J.E.; Schweiger, A.K.; Cavender-Bares, J. Spectrolab: Class and Methods for Hyperspectral Data. R Package Version 0.0.8. 2018. Available online: https://cran.r-project.org/web/packages/spectrolab/index.html (accessed on 10 October 2019).
  59. Developers, S. Signal: Signal Processing. 2013. Available online: http://r-forge.r-project.org/projects/signal (accessed on 16 November 2019).
  60. Pinheiro, J.; Bates, D.; DebRoy, S.; Sarkar, D.; R Core Team. nlme: Linear and Nonlinear Mixed Effects Models. R Package Version 3.1-140. 2019. Available online: https://cran.r-project.org/web/packages/nlme/index.html (accessed on 16 November 2019).
  61. Féret, J.-B.; Asner, G.P. Spectroscopic classification of tropical forest species using radiative transfer modeling. Remote Sens. Environ. 2011, 115, 2415–2422. [Google Scholar] [CrossRef]
  62. Cavender-Bares, J.; Meireles, J.E.; Couture, J.J.; Kaproth, M.A.; Kingdon, C.C.; Singh, A.; Serbin, S.P.; Center, A.; Zuniga, E.; Pilz, G. Associations of leaf spectra with genetic and phylogenetic variation in oaks: Prospects for remote detection of biodiversity. Remote Sens. 2016, 8, 221. [Google Scholar] [CrossRef] [Green Version]
  63. Hestir, E.L.; Khanna, S.; Andrew, M.E.; Santos, M.J.; Viers, J.H.; Greenberg, J.A.; Rajapakse, S.S.; Ustin, S.L. Identification of invasive vegetation using hyperspectral remote sensing in the California Delta ecosystem. Remote Sens. Environ. 2008, 112, 4034–4047. [Google Scholar] [CrossRef]
  64. Lin, W.-S.; Yang, C.-M.; Kuo, B.-J. Classifying cultivars of rice (Oryza sativa L.) based on corrected canopy reflectance spectra data using the orthogonal projections to latent structures (O-PLS) method. Chemom. Intell. Lab. Syst. 2012, 115, 25–36. [Google Scholar] [CrossRef]
  65. Madritch, M.D.; Kingdon, C.C.; Singh, A.; Mock, K.E.; Lindroth, R.L.; Townsend, P.A. Imaging spectroscopy links aspen genotype with below-ground processes at landscape scales. Philos. Trans. R. Soc. B Biol. Sci. 2014, 369, 20130194. [Google Scholar] [CrossRef]
  66. Govender, M.; Govender, P.; Weiersbye, I.; Witkowski, E.; Ahmed, F. Review of commonly used remote sensing and ground-based technologies to measure plant water stress. Water SA 2009, 35, 741–772. [Google Scholar] [CrossRef] [Green Version]
  67. Laliberté, E.; Schweiger, A.K.; Legendre, P. Partitioning plant spectral diversity into alpha and beta components. Ecol. Lett. 2020, 23, 370–380. [Google Scholar] [CrossRef] [PubMed] [Green Version]
  68. Kellner, J.R.; Albert, L.P.; Burley, J.T.; Cushman, K.C. The case for remote sensing of individual plants. Am. J. Bot. 2019, 106, 1139–1142. [Google Scholar] [CrossRef] [PubMed] [Green Version]
  69. Wang, R.; Gamon, J.A.; Cavender-Bares, J.; Townsend, P.A.; Zygielbaum, A.I. The spatial sensitivity of the spectral diversity–biodiversity relationship: An experimental test in a prairie grassland. Ecol. Appl. 2018, 28, 541–556. [Google Scholar] [CrossRef] [PubMed] [Green Version]
Figure 1. Representation of the study design following an “Environmental gradient” (x-axis) and a “Fertilization gradient” (y-axis). For La Grande-Tourbière-de-Villeroy (GTV) and La Grande-plée-Bleue (GPB), wet atmospheric N deposition is estimated from nearby monitoring stations (Ouimet [27], personal communication). Levels of fertilization (Mer Bleue peatland (MBP).Mid.N and MBP.High.N) are described in Larmola et al. [26]. Wet atmospheric N deposition for MBP.No.N is mentioned in Pinsonneault et al. [28]. Other sources of environmental variation among the three bogs include differences in climate, pH, electrical conductivity, as well as variations in soil nutrient concentrations. See Table 1 and Table 2 for more details.
Remotesensing 12 02448 g001
Figure 2. Mean (±standard error) functional traits per plant species and sites. N: nitrogen, LDMC: leaf dry matter content, Chl b: chlorophyll b. Colored points are from the Mer Bleue Peatland. Different shapes indicate measurements from different bogs, and different letters indicate significant differences. N content in the soil increases among sites along the x-axis. Letters indicate differences among groups within each panel (p ≤ 0.05). Sample size for MBP.No.N = 23, GTV = 24, GPB = 24, MBP.Mid.N = 12, and MBP.High.N = 11 (see Figure 1 for description of site acronyms).
Remotesensing 12 02448 g002
Figure 3. Mean (±standard error) functional traits per species. Sample size for E. vaginatum = 23, K. angustifolia = 24, C. calyculata = 24 and R. groenlandicum = 23. LDMC: leaf dry matter content, Chl: chlorophyll, LMA: leaf mass per area, and EWT: equivalent water thickness. See Figure 1 for description of site acronyms. Letters indicate significant differences among species (p ≤ 0.05).
Remotesensing 12 02448 g003
Figure 4. Normalized reflectance foliar spectra (mean ± standard deviation) and visible regions (VIS). Light grey vertical bands indicate the wavelengths contributing most to the separability of populations of species among sites based on the nearest-neighbor criterion in forward feature selection analyses. (ad) Inlets for each species’ spectra, showing the VIS region in more precision.
Remotesensing 12 02448 g004
Figure 5. Relationships between predicted and measured leaf chemical and structural properties using leaf-level spectral data. Solid line indicates a 1:1 relationship, black dashed lines are the linear relationship between predicted and measured values for all species combined, colored solid lines are the linear relationship between predicted and measured values per species. Error bars indicate the mean SD of PLSR predictions based on 100 iterations. N comps is the number of components per model. RMSEP is the mean root mean square error of prediction in original units.
Remotesensing 12 02448 g005aRemotesensing 12 02448 g005b
Figure 6. (a) Mean (±standard deviation) of absolute reflectance spectra per species and spectral regions (VIS: visible, NIR: near-infrared, and SWIR: short-wave infrared). (b) Absolute wavelength loadings revealing their contribution to species discrimination through PLSDA analysis.
Remotesensing 12 02448 g006
Figure 7. Classification accuracy per species using PLSDA on normalized leaf spectra based on 50 iterations, for which 70% of data were randomly selected to train the model and 30% were used to test the model. Number of PLSDA components: 4.
Remotesensing 12 02448 g007
Table 1. Nitrogen fertilization rates and background wet nitrogen deposition at the Mer Bleue peatland experimental site. MBP: Mer Bleue Peatland. Treatment names are based on [26].
SiteReplicatesTreatment NameSampled SpeciesGrouping NameStarting Year of the ExperimentNitrogen Content of Treatment
MBP
(Mer Bleue Peatland)
6— (background deposition only)allMBP.No.N20050 g m−2 a−1
35Nall except Eriophorum vaginatumMBP.Mid.N20011.6 g m−2 a−1
310NE. vaginatum20053.2 g m−2 a−1
320NallMBP.High.N20056.4 g m−2 a−1
Table 2. Environmental properties measured along the environmental gradient. MBP: Mer Bleue, GTV: Grande-Tourbière-de-Villeroy, GPB: Grande-plée-Bleue. MBP.No.N: no fertilization (background deposition only). EC: electrical conductivity.
SiteReplicatesPeat NO3 (mg kg−1)Peat NH4 (mg kg−1)Peat N (%)Water pHWater Corrected EC (µS cm−1)Water Table Depth (cm)Nitrogen Atmospheric Depositions (g m−2 a−1)
GPB61.45 (0.78)258.5 (147.24)0.93 (0.25)3.73 (0.05)0.77 (0.99)35.5 (2.51)~0.5–1.0 [27]
GTV62.89 (0.24)77.83 (18.63)0.81 (0.14)3.9 (0.08)3.35 (4.43)50.17 (4.58)~0.6 [27]
MBP.No.N62.59 (0.7)131.67 (61.76)0.79 (0.1)4.02 (0.15)26.71 (23.64)39.33 (2.25)~0.4 [26]
Table 3. Statistics for partial least square regression (PLSR) models predicting functional traits from spectra.
Functional TraitRangeMean (±SD)Wavelength Range (nm)Number of ComponentsR2RMSEPNRMSEP (%) *
calvalcalval
Total C (%)46.05–56.9551.24 (2.52)1200–240050.90.830.81.052.06
LWC (mg g−1)450.84–679.03579.49 (55.38)800–240050.760.726.6930.985.35
Soluble carbon (%)34.23–79.2459.96 (13.48)1200–2400110.970.932.223.66.01
LDMC (mg g−1)320.97–549.16420.51 (55.38)800–240050.760.726.6930.987.37
N (%)1.1–2.021.47 (0.24)400–240080.870.770.080.127.99
C:N ratio23.57–46.6235.85 (6.47)400–240080.890.82.112.958.23
LMA (g m−2)73.21–168.53124.55 (21.13)800–240060.620.4612.8715.9912.84
Cellulose (%)6.45–28.4114.6 (6.83)1200–240070.970.921.252.0213.85
EWT (cm)0.01–0.030.01 (0)800–240060.820.710.00180.002516.66
Hemicellulose (%)5.12–33.6913.19 (10.06)1200–2400100.970.941.582.5519.33
Chl a (mg g−1)1.63–6.423.4 (1.23)400–76060.760.680.60.7221.19
Lignin (%)1.94–23.4410.72 (5.65)1200–240070.880.811.932.5223.48
Chl a (mg m−2)166.2–1024.3429.81 (196.32)400–76060.80.7287.07109.5525.49
Chl b (mg g−1)0.24–2.41.19 (0.46)400–76060.630.510.280.3328.11
Chl b (mg m−2)26.2–364.86150.25 (71.47)400–76060.720.6137.2946.430.88
Carotenoids (mg g−1)0.12–2.541.03 (0.42)400–76060.550.440.280.3331.82
* Model NRMSE is calculated from validation model statistics. SD: standard deviation, cal: calibration, val: validation, C: carbon, LWC: leaf water content, LDMC: leaf dry matter content, N: nitrogen, LMA: leaf mass per area, EWT: equivalent water thickness, Chl: chlorophyll.

