Letter

Effects of CO2 Changes on Hyperspectral Infrared Radiances and Its Implications on Atmospheric Temperature Profile Retrieval and Data Assimilation in NWP

1
Collaborative Innovation Center on Forecast and Evaluation of Meteorological Disasters, Nanjing University of Information Science and Technology, Nanjing 210044, China
2
Key Laboratory for Aerosol-Cloud-Precipitation, China Meteorological Administration, School of Atmospheric Physics, Nanjing University of Information Science and Technology, Nanjing 210044, China
3
Institute of Atmospheric Physics, Chinese Academy of Sciences, Beijing 100029, China
4
Cooperative Institute for Meteorological Satellite Studies, University of Wisconsin-Madison, Madison, WI 53706, USA
5
National Satellite Meteorological Center, China Meteorological Administration, Beijing 100081, China
*
Author to whom correspondence should be addressed.
Remote Sens. 2020, 12(15), 2401; https://doi.org/10.3390/rs12152401
Submission received: 15 June 2020 / Revised: 19 July 2020 / Accepted: 22 July 2020 / Published: 27 July 2020
(This article belongs to the Special Issue Application of Remote Sensing to the Weather Prediction)

Abstract

:
Although atmospheric CO2 is a trace gas, it has seasonal variations and has increased over the last decade. Its seasonal variation and increase have substantial radiative effects on hyperspectral infrared (IR) radiance calculations in both longwave (LW) and shortwave (SW) CO2 absorption spectral regions that are widely used for weather and climate applications. The effects depend on the spectral coverage and spectral resolution. The radiative effect caused by the increase of CO2 has been calculated to be greater than 0.5 K within 5 years, whereas a radiative effect of 0.1–0.5 K is introduced by the seasonal variation in some CO2 absorption spectral regions. It is important to take into account the increasing trend and seasonal variation of CO2 in retrieving the atmospheric temperature profile from hyperspectral IR radiances and in the radiance assimilation in numerical weather prediction (NWP) models. The simulation further indicates that it is very difficult to separate atmospheric temperature and CO2 information from hyperspectral IR sounder radiances because the atmospheric temperature signal is much stronger than that of CO2 in the CO2 absorption IR spectral regions.

Graphical Abstract

1. Introduction

Radiance measurements from high spectral resolution (or hyperspectral) infrared (IR) sounders in polar orbit such as the Atmospheric Infrared Sounder (AIRS), the Infrared Atmospheric Sounding Interferometer (IASI), the Cross-track Infrared Sounder (CrIS), and the Hyperspectral Infrared Atmospheric Sounder (HIRAS) have been widely used in weather analysis, nowcasting, forecasting, numerical weather prediction (NWP), and environmental and climate applications [1]. More recently, a hyperspectral IR sounder, the Geostationary Interferometric Infrared Sounder (GIIRS), was placed into geostationary orbit for continuous observations of the vertical structure and moisture distribution of the atmosphere [2,3]. One important application of measurements from various hyperspectral sounders is assimilating the IR radiance measurements into global and regional NWP models for improving short- and middle-range weather forecasts. Most radiances assimilated are from the longwave (LW) CO2 absorption region. Assimilation of radiances with an observation operator (or the radiative transfer model-RTM) assumes that the CO2 is fixed in the three-dimensional or four-dimensional variational (3DVAR, 4DVAR)-based data assimilation (DA) systems. Another application is real-time or near real-time (NRT) weather monitoring, situation awareness and nowcasting using atmospheric temperature and moisture profiles retrieved from hyperspectral IR sounders [4,5,6]. Moreover, the retrieved temperature profiles are important for generating the atmospheric temperature climate data record (TCDR) for climate monitoring and studies, which is similar to generating the upper tropospheric humidity CDR from geostationary satellites [7] for climate studies [8,9]. Such temperature profiles are typically derived using a one-dimensional variational (1DVAR) method [10], and the amount of CO2 in the atmosphere is usually fixed in the retrieval process although the CO2 can be a variable for input in the RTM.
Although the main topic revolved around inverse of radiances and DA is the extraction of atmospheric temperature information using CO2 absorption regional IR radiances, CO2 concentration retrieval has also been attempted in some studies [11,12,13,14,15,16,17,18]. The primary challenge in CO2 retrieval using IR radiances is that IR measurements in CO2 spectral regions are sensitive to both atmospheric temperature change and CO2 variation. Independent information about the atmospheric temperature profile is needed for accurately estimating CO2. There are roughly three types of methods to separate the CO2 absorption signals from temperature. The first method obtains independent temperature information by including microwave sounding radiances. For example, Chédin et al. [11] used a neural network (NN) approach for retrieving CO2 from the TIROS Operational Vertical Sounder (TOVS) IR observations and Microwave Sounding Unit (MSU) radiances. Also, a similar algorithm has been used to derive tropospheric CO2 content from AIRS and IASI, by combining measurements from the Advanced Microwave Sounding Unit (AMSU) sounder [12,13]. For this technique, the limited vertical temperature resolution from microwave sounders degrades the precision of the CO2 retrieval. The second method derives atmospheric temperature information from the retrieved products or the meteorological analysis. For example, Chahine et al. [14,15] applied the Vanishing Partial Derivatives (VPD) method to derive the mid-troposphere CO2 content from the AIRS radiance spectrum using the retrieved temperature profile. Ota and Imasu [17] used the Maximum a Posteriori (MAP) algorithm to derive the upper troposphere CO2 concentration from the Interferometric Monitor for Greenhouse gases (IMG) by including the temperature information from the ECMWF (European Centre for Medium-Range Weather Forecasts) analysis. Because this method relies on retrieved product or meteorological analysis, the uncertainty in atmospheric temperature significantly impacts the precision of the retrieved CO2. The third method is to simultaneously obtain atmospheric temperature and CO2 profiles from the hyperspectral IR radiance spectrum based on the optimal estimation (OE) techniques [18]. In this method, the CO2 retrieval relies heavily on the choice of the first guess temperature profile, making the impact of the atmospheric temperature profile on the retrieved CO2 difficult to assess. The major limitation of all these CO2 retrieval methods from IR radiances is that they rely on the accuracy of the atmospheric temperature information. Therefore, separating atmospheric temperature and CO2 from hyperspectral IR radiances in CO2 absorption spectral regions remains a topic to be investigated.
Within this context, it is important to understand the radiative effects of CO2 changes on atmospheric temperature retrieval and radiance assimilation in NWP models. Although atmospheric CO2 is a trace gas, it has increased in the last decade and exhibits a significant seasonal variation [11,19]. Figure 1 shows the time series of CO2 monthly mean measured at Waliguan (upper) and Key Biscayne (lower) between 2009 and 2018 [20,21]. The global mean CO2 concentration in the atmosphere is increasing, with an accelerating growth rate of about 2 ppmv/year [19]. The seasonal pattern has also been demonstrated as the CO2 concentrations reach a peak at the beginning of spring in the northern Hemisphere, and then decline to a minimum near the end of the growing season [19]. CO2 concentrations at both stations show an increasing trend with an annual fluctuation: the minimum usually occurs in the summer or early fall and the maximum in April–May. Waliguan (36.3°N, 100.9°E) is a high-altitude station located in northwestern China. The CO2 annual growth rate for this site is approximately 2.2 ppmv, and the seasonal variation is approximately 8.3 to 14.3 ppmv during this period. The station at Key Biscayne, Florida (25.7°N, 80.1°W) shows a CO2 annual growth rate of about 2.3 ppmv and the seasonal amplitude about 5.7 to 8.7 ppmv during the 10 years for this site.
To understand the radiative effect of CO2 changes including the long-term trend and seasonal variation on hyperspectral IR radiances, the following scientific questions must be addressed:
  • How do the CO2 changes affect the hyperspectral IR radiance simulation?
  • How to take into account the CO2 changes in profile retrieval and DA in NWP models using hyperspectral IR sounder radiance measurements?
  • Is it possible to retrieve CO2 amount or profile from a hyperspectral IR sounder? If yes, what spectral resolution and signal-to-noise-ratio are needed for retrieving CO2 from hyperspectral IR sounder radiance measurements?
  • Is it possible to separate CO2 and atmospheric temperature information from a hyperspectral IR sounder radiance spectrum?
In order to address the above questions, the line-by-line radiative transfer model (LBLRTM) [22,23,24,25] has been used to simulate the hyperspectral IR radiances with different spectral resolutions.
Section 2 describes the methodologies. Section 3 describes the influence of radiative effects due to CO2 changes on hyperspectral IR radiances and its implications on atmospheric temperature profile retrieval and radiance assimilation for NWP models. Discussions are given in Section 4, and conclusions are summarized in Section 5.

2. Methodologies

The first hyperspectral IR sounder, AIRS, was a Grating spectrometer. Subsequent on-orbit hyperspectral IR Sounders (e.g., IASI, CrIS, HIRAS, GIIRS), however, are Fourier transform spectrometers based on classic Michelson instruments. The Michelson spectrometer employs a beam splitter to divide the incoming radiance into two identical optical beams. The two optical beams will be reflected by one fixed mirror and one moving mirror, which can be translated smoothly within arm displacement L respectively. However, because the optical path difference (OPD) between the two beams is reflected by two mirrors, when these two beams meet the detector they will interfere with each other. The signal produced by variation of the OPD between the two beams is called an interferogram. An interferogram can be converted to an actual radiance spectrum by the Fourier transformation. The spectral resolution is determined by the maximum achievable OPD value, that is Δ σ = 1 2 O P D m a x = 1 2 L .
The fast Radiative Transfer Model (fRTM) is widely used in most applications of satellite-based radiances such as DA and atmospheric profile retrieval, in particular, with NRT operational applications. Since CO2 exhibits spatial and temporal variations, it is important to make CO2 a variable input in the fRTM. The two most widely used fRTMs are the Radiative Transfer for TOV (RTTOV) model developed at the NWP Satellite Application Facility (SAF) at the European Organization for Exploitation of Meteorological Satellite (EUMETSAT) [26] and the Community Radiative Transfer Model (CRTM) developed by the National Oceanic and Atmospheric Administration’s (NOAA) Joint Center for Satellite Data Assimilation (JCSDA) [27,28]. Each of them adopts one kind of parameterized transmittance calculation scheme (transmittance model), which makes the fRTM computationally efficient and reasonably accurate. Compared with the LBLRTM, which adopts a complex physical transmittance scheme for the radiance calculation, the RTTOV and the CRTM only lose little accuracy, (e.g., root-mean-square error less than 0.07 K statistically in most IR spectral regions) [29], while their computational efficiency have increased enormously, especially when the fast Jacobian calculations are included [30]. The parameterized transmittance calculation in the RTTOV model specifically adopts a profile-dependent predictor with regard to atmospheric temperature and trace gas concentration to predict transmittance at a fixed pressure grid. The RTTOV model could provide the radiance simulation in which CO2 is a predictor, that is, the variation in CO2 could be calculated in the radiance simulation. However, the CO2 concentration is not predicted in the current NWP models. The version of the RTTOV model that includes predictors such as temperature, water vapor and ozone is widely used in the operational DA system of the ECMWF Integrated Forecast System (IFS) model [31] and the Chinese Global/Regional Assimilation PrEdiction (GRAPES) model [32]. In comparison, the radiance contribution from CO2 gas absorption and emission is calculated with the fixed CO2 concentration profile in the RTTOV model. The fixed CO2 concentration was selected 12 years ago, its value is comparatively smaller in comparison with various site observations. Furthermore, the spatial and temporal variation of the CO2 concentration profile is quite remarkable in recent years (https://www.esrl.noaa.gov/gmd/ccgg/trends/monthly.html), it provides the motivation to study the radiance effect of CO2 variation on hyperspectral IR applications.
Version 12.6 of the LBLRTM [22,23,24,25] developed at Atmospheric and Environment Research (AER) Inc. is used here to conduct the sensitivity test on the radiative impact of CO2 variations. To describe the effects of pressure and Doppler line broadening, the Voigt line shape is calculated at all atmospheric levels, which provides the foundation for the LBLRTM line shape [22,23,24,25]. Requisite modifications to the Voigt line shape have been implemented based on analyses of laboratory and atmospheric spectra including line coupling and the water vapor continuum [25]. The LBLRTM adopts the accurate but computationally intensive physical transmittance calculation procedure and provides spectral radiance simulations with high accuracies, thus, it also serves as the standard transmittance database input and the benchmark to assess the uncertainties in a parameterized version of RTM.
The first set of sensitivity tests are about how the perturbation of CO2 concentration affects the hyperspectral IR radiance simulation. The radiance simulation from the LBLRTM model with a fixed CO2 concentration (around 380 ppmv) used in the RTTOV transmittance coefficients generation is used as a reference (Figure 2c). Other atmospheric inputs in sensitivity tests include the averaged atmospheric temperature, humidity and ozone profiles used in the RTTOV transmittance coefficients generation. Radiance spectra from 600 to 2600 cm−1 are simulated using the LBLRTM, with the CO2 perturbation of 5, 10, 15, 20, and 25 ppmv increments for all levels, respectively. Those perturbations reflect the CO2 changes including the trend and the seasonal variation shown in Figure 1. The largest CO2 profile increment of 25 ppmv is based on the site’s largest measurements of 410 ppmv. Radiance spectra with 0.625 cm−1 (e.g., CrIS, GIIRS, and HIRAS), 0.25 cm−1 (e.g., IASI) and 0.1 cm−1 spectral resolution, respectively, are simulated, and the impact of CO2 variation on radiance spectra with different spectral resolutions is analyzed in the following context.
The second set of sensitivity tests is to understand the impact of CO2 variation on atmospheric temperature profile retrieval. The one-dimensional variational (1DVAR) retrieval experiments have been conducted using the CO2 reference profile (Figure 2c) with 0, 5, 10, 15, 20, and 25 ppmv increments (CO2 + 0 means no CO2 uncertainty in retrieval), respectively. The impacts are quantitatively measured by the mean temperature retrieval bias and root-mean-square error (RMSE) in different CO2 concentration profiles.
The third set of sensitivity tests is to understand the feasibility of separating atmospheric temperature and CO2 information from the CO2 absorption radiances, which is the main obstacle in the CO2 retrieval. In those tests, the radiative effects of atmospheric temperature and CO2 variation are compared. The radiative effects are expressed in terms of brightness temperature difference (BTD) and interferogram signal difference (ISD). The question of separating atmospheric temperature and CO2 is addressed and discussed.

3. Results

The BTD and ISD are used to quantify the radiative effects of changes in CO2 on a hyperspectral IR sounder radiance spectrum simulation. The reference BT spectrum is calculated from a mean atmospheric state containing atmospheric temperature, moisture, O3, CO2, and other component profiles. Figure 2 shows the atmospheric profiles used in LBLRTM simulation along with the simulated BT spectrum for reference. The results and findings are described in detail in the following subsections.

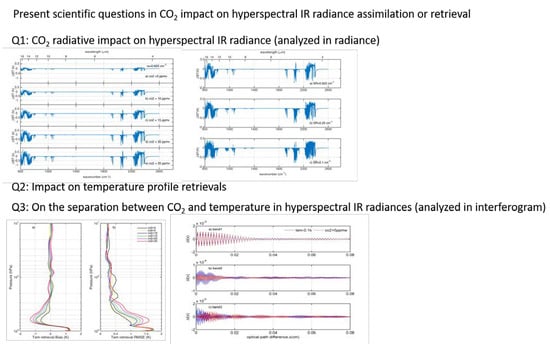
3.1. Impact of CO2 Changes on Hyperspectral IR Radiance Simulation

Figure 3 shows the BTD based on reference BT spectrum in Figure 2 when the CO2 concentration profile is perturbed by an increment of 5, 10, 15, 20, and 25 ppmv, respectively. It suggests that the radiative effect due to CO2 changes mainly occurs around the 15 µm (600–800 cm−1), 5.2 µm (1900–2000 cm−1), 4.8 µm (2040–2100 cm−1), and 4.5 µm (2250–2350 cm−1) as well as in the IR window region around 10 µm (1000 cm−1), which is determined by the selections absorption of CO2 gas. It indicates that the magnitude of the radiative effect increases as the perturbation increases.
When the CO2 concentration profile has an increment of 5 ppmv compared to the fixed CO2 concentration (380 ppmv), the radiative effect of CO2 could reach 0.2 K in the CO2 absorption spectral regions. It is closer to the Noise Equivalent Differential Temperature (NEDT) of a nominal hyperspectral IR sounder. Whereas, if the CO2 concentration profile has an increment of 10 ppmv, which is closer to the CO2 change over 5 years, the possible radiative effect could be greater than 0.5 K. It will also cause difficulties in the bias correction (BC) procedure of hyperspectral DA in NWP models and atmospheric temperature profile retrieval. In addition, the seasonal variation within 1 year is approximately 5–9 ppmv according to Figure 1, and this variation could lead to a radiative effect of 0.1–0.5 K according to Figure 3. Changing the CO2 base profile, for example, using the CO2 profile of 390 ppmv instead of 380 ppmv as a reference for the same sensitivity tests yields a similar results (not shown).
Figure 4 shows the BTD spectra with 0.625, 0.25 and 0.1 cm−1 spectral resolution, respectively, when CO2 concentration profile is specified with an increment of 5 ppmv. It shows that the radiative effect of CO2 changes varies with the spectral resolution of a hyperspectral sounder. The impact is more remarkable on a sounder with higher spectral resolution. The absorption line bandwidth for CO2 gas located around 15 μm is between 0.0005–0.001 cm−1. The bandwidth of corresponding transmittance spectral is far less than the highest spectral resolution of hyperspectral sounders onboard satellite. Using the senor with certain bandwidth equals to using the convolution window for smoothing the transmittance spectrum; the radiance observations with higher resolutions could reserve more concise characteristics in transmittance spectrum and thus are more sensitive to change of CO2 gas. It suggests that when assimilating IR CO2 absorption region radiances or retrieving atmospheric temperature profile from a hyperspectral IR sounder BT spectrum with higher spectral resolution, selection of channels becomes more important when the channels locate in both CO2 strong absorption regions and CO2 weak absorption regions. It should be noted that although the magnitudes of BTD do not change much at different spectral resolutions, the number of channels affected by CO2 changes increases with higher spectral resolution.

3.2. Impact of CO2 Changes on Temperature Profile Retrieval

Since CO2 exhibits significant changes, using a fixed CO2 concentration may lead to additional uncertainty in atmospheric temperature retrieval from CO2 absorption region radiances. Those effects must be considered.
In order to quantitatively evaluate the impact of CO2 uncertainty on atmospheric temperature profile retrieval, the 1DVAR retrieval experiments have been conducted to further analyze the temperature profile retrieval errors due to insufficient ability of depicting CO2 concentration variations. The impact of CO2 concentration variation on temperature retrieval highly depends on the sounder spectral coverage, spectral resolution, observation error, and the choice of background profile in retrieval. Taking IASI as an example in this study, the BT observations for all channels of IASI are simulated using the above-mentioned CO2 reference profile with 0, 5, 10, 15, 20, and 25 ppmv increments, respectively (CO2 + 0 means no IASI radiance simulation bias from CO2 gas). Random unbiased Gaussian observation errors that derived from IASI observation error matrix (contained in the 1DVAR package and used for operational DA systems) are then added to the simulated observations. Note that simulated BT observations have been derived from variable atmospheric temperature and humidity conditions. Actually, 83 representative atmospheric profiles, used by RTTOV model for generating coefficients for various satellite sensors, are used in the retrieval experiments. Each background profile is generated by adding random forecast errors to the truth profile [33]. The forecast errors are based on background error covariance matrix used in the operational Unified Model (UM) system and can be calculated by:
x 0 = x t + i ε i λ i 1 2 E i
where x t is the truth profile, x 0 is the background profile, λ i and E i are eigenvalue and eigenvector, respectively, of the background error covariance matrix at pressure level i, and ε i is random Gaussian error with a zero mean and a unit standard deviation.
The atmospheric temperature profile can be derived using OE theory through minimizing the following cost function:
J ( x ) = ( x x 0 ) · B 1 · ( x x 0 ) T + ( y o y ( x ) ) · O 1 · ( y o y ( x ) ) T
where x is the temperature profile (vector) to be retrieved, and y o and y ( x ) are the observed and the calculated radiances (vector), respectively. The calculated radiances are derived from RTM (also called forward operator). B and O are the background error covariance matrix and the observation error covariance matrix, respectively. Superscripts −1 and T denote inverse and transport, respectively. The atmospheric temperature profile then can be retrieved through iterative approach (e.g., Quasi-Newton iteration) [4]:
x n + 1 = x 0 + ( y T ( x n ) · O 1 · y ( x n ) + B 1 ) 1 · y T ( x n ) · O 1 · ( y o y ( x n ) + y ( x n ) · ( x n x 0 ) )
where y ( x ) is the Jacobian matrix with respect to x .
The mean temperature retrieval bias and root-mean-square error (RMSE) in different cases of CO2 concentration perturbations can be calculated through comparison between retrieved temperature profile ( x r ) and the true profile ( x t ), and results are shown in Figure 5. It is obviously shown that the CO2 concentration variation has large influence on tropospheric temperature profile retrieval. If CO2 concentration is fixed in the retrieval, the radiative effect from CO2 concentration variations will lead to incorrect temperature adjustment or increment. When CO2 concentration has a 15 ppmv increment, the tropospheric temperature retrieval error is almost doubled when compared with that from CO2 + 0 profile.
For atmospheric temperature profile retrieval, one option is to include the radiative effect due to CO2 changes in the observation errors. Another option is to select channels that are less sensitive to CO2 changes. The channel selection is out the scope of this study. However, channel selection will result in the loss of information for the sounding retrieval since the channels that are sensitive to CO2 also contain the atmospheric temperature information. The best estimate of CO2 is vital for atmospheric temperature profile retrieval from radiance measurements in CO2 absorption regions. It should be noted that although CO2 changes have direct radiative effects on atmospheric temperature retrieval, they also have an indirect impact on atmospheric moisture retrieval through temperature retrieval. This is because retrieval of atmospheric moisture profile from radiances in the H2O absorption region also requires reliable atmospheric temperature profile information.

3.3. Consideration of CO2 Changes in Radiance Assimilation in NWP Models

Using a fixed CO2 concentration may lead to additional uncertainty in DA of radiances from CO2 absorption regions in NWP models. In terms of DA of hyperspectral IR radiances from CO2 absorption regions in NWP models, selecting channels that are less sensitive to CO2 changes but more sensitive to atmospheric temperature changes could reduce the radiative effects caused by CO2 uncertainty. There are two additional approaches that would account for the radiative effects from CO2 changes. The first involves adding the radiance uncertainty in the observation errors due to CO2 setting, which is similar to a novel approach for assimilating clear equivalent radiances in cloudy skies [34,35] using imager-based cloud-clearing technique [36,37,38]. The second involves taking the BTD as bias and conducting bias correction (BC) in the DA process when assimilating hyperspectral IR radiances from CO2 absorption regions. The two approaches can be used together in DA.

3.4. On the Separation between CO2 and Atmospheric Temperature in Hyperspectral IR Radiances

Differences in atmospheric temperature and CO2 radiative effect on radiance spectra are compared in Figure 6. It is found that the radiative effect of CO2 with an increment of 5 ppmv (keep the temperature profile unchanged) is comparable with that from temperature perturbations of 0.1–0.2 K (use the CO2 base profile) for most CO2 absorption spectral regions. A similar conclusion can be drawn when the CO2 concentration increases with an increment of 10 ppmv or 15 ppmv. It suggests that using a fixed CO2 concentration profile might lead to incorrect temperature adjustment or increment in retrieval and DA in NWP models due to CO2 variations. It also implies that if the CO2 perturbation is less than 5 ppmv, the temperature retrieval uncertainty introduced by CO2 setting may be less than 0.2 K. Based on Chahine et al. [14], the 690–725 cm−1 (around 15 µm) CO2 absorption band is used to select the channels for retrieving the CO2 from AIRS measurements. Further, Figure 6 implies that the radiance spectra from 2040–2100 cm−1 (around 4.8 µm) band and 2250–2350 cm−1 (around 4.5 µm) band are also comparatively sensitive to CO2 changes, and could be used to separate the CO2 and atmospheric temperature information, or used for CO2 retrieval.
As a further analysis on the radiative effects in response to CO2 changes, ISDs are also compared when the atmospheric temperature perturbation was set to −0.1 K and the CO2 concentration increased by 5 ppmv. Consistently, all the calculations are based on the CO2 base profile. The interferogram signal is converted from the radiance spectrum through an inverse Fourier Transformation. The radiance spectra before and after atmospheric temperature or CO2 perturbation are converted to two interferograms. The interferogram signal difference is calculated by comparing two interferograms. Figure 7 shows the results of ISDs from the radiance spectra between 600 to 2600 cm−1 with 0.625 cm−1 spectral resolution. As previously discussed, the spectral resolution is determined by the maximum OPD. Figure 7a provides the entire interferogram difference for all radiance spectra with spectral resolutions of 0.625 cm−1. Figure 7b illustrates the first one-tenth of the interferogram difference (Figure 7a) as compared to the main signal differences. Figure 7 shows that the interferogram CO2 perturbation signal (with 5 ppmv perturbation) is weaker than the atmospheric temperature perturbation signal (−0.1 K perturbation) except when the OPD position is within 0.0075–0.0125 cm range. In this range, the signal of CO2 perturbation is stronger and will be helpful for CO2 retrieval.
Based on previous discussions, three IR bands seem to be suitable for separating atmospheric temperature and CO2 information. They are the 690–725 cm−1 band (referred as band 1), 2040–2100 cm−1 band (referred as band 2) and 2250–2350 cm−1 band (referred as band 3). The next step involves converting the radiance spectrum from the three bands into the interferogram to compare the CO2 signal difference from each band. Figure 8 shows the ISDs caused by atmospheric temperature perturbation of −0.1 K and CO2 perturbation of 5 ppmv, respectively, for the three bands. Both atmospheric temperature (0.1 K) and CO2 (5 ppmv) perturbation signals are stronger in band 1 than in the other two bands. However, temperature (0.1 K) and CO2 (5 ppmv) perturbation signals show synchronous variations in phase for band 1, thus, it is theoretically impossible to separate CO2 and atmospheric temperature information effectively by using only band 1. A similar problem exists in band 2. Figure 8c shows larger signal pattern differences between atmospheric temperature and CO2 perturbation signals for band 3, although the intensity of CO2 signal is significantly weaker for band 3 than bands 1 and 2. The results imply that band 3 is more helpful in the separation of atmospheric temperature and CO2 information; however, it requires a hyperspectral sounder with quite high signal-to-noise ratio (e.g., NEDT better than 0.1 K at normal BT spectral resolution of 0.625 cm−1). The combination of higher spectral resolution with higher signal-to-noise ratio provides better opportunity for separating atmospheric temperature and CO2 information from the hyperspectral IR radiances.

4. Discussion

Although atmospheric CO2 is a trace gas, it exhibits an increasing trend as well as seasonal variations that are large enough to have significant radiative transfer effects on hyperspectral IR sounder radiance applications. Those effects must be accounted for in atmospheric temperature profile retrieval and DA of radiances from CO2 absorption spectral regions. Adjusting for CO2 to best reflect the current atmospheric state is very important for extracting reliable atmospheric thermodynamic information for nowcasting, forecasting and NWP DA applications. Other possible approaches for mitigating the radiative effects due to CO2 changes include selecting channels and increasing observation errors for retrieval and DA. The reliable TCDR also highly depends on handling CO2 in fRTM for retrieval from hyperspectral IR radiance measurements.
It should be noted that the impact of CO2 changes on atmospheric temperature profile retrieval and DA highly depends on the sounder spectral coverage, spectral resolution, observation errors, and the background profile. Good estimate of CO2 concentration is critical for optimal use of high accurate and high spectral resolution sounder radiances in retrieval and DA. Better separation between CO2 and atmospheric temperature profile information from hyperspectral IR sounder radiances should be further investigated in future.
Moreover, CO2 exhibits spatial variation as well. The spatial variation over the globe could be 10–20 ppmv, which should also be considered in profile retrieval and DA. The CO2 spatial variation can be estimated from in-situ measurements taken from different locations, or from satellite remote sensing measurements. CO2 input with realistic temporal and spatial distributions in RTM is vital for deriving accurate atmospheric information to achieve more robust DA in NWP models.

5. Conclusions

Our studies indicate that CO2 changes have had a substantial effect on simulations for hyperspectral IR radiances in both longwave (LW) and shortwave (SW) CO2 absorption IR spectral regions. This influence cannot be ignored in the atmospheric temperature profile retrieval and DA. The radiative effects depend on the spectral coverage and spectral resolution, where the higher spectral resolution IR sounder shows larger BTDs in the CO2 absorption regions. It is important to take into account the radiative effect due to CO2 changes in temperature profile retrieval from hyperspectral IR radiances and radiance assimilation in NWP models. The radiative effects due to CO2 changes can be treated as additional observation uncertainties in atmospheric temperature profile retrieval and DA, and the influence on the temperature profile retrieval and radiance assimilation can be partially reduced by using selected channels not sensitive to CO2 changes. Besides, the simulation shows that it is very difficult to separate temperature and CO2 information from hyperspectral IR sounder radiances because the atmospheric temperature and CO2 signals in the interferogram show synchronous variations in phase, and temperature signal is much stronger than the CO2 signal in the IR CO2 absorption regions.
In summary, the following conclusions can be drawn from this study:
  • CO2 changes have substantial radiative effects on hyperspectral IR radiances calculations in both longwave and shortwave CO2 absorption IR spectral regions, as well as in the atmospheric window region. The impact differed from different spectral coverage and spectral resolution.
  • The radiative effect caused by the increasing trend of CO2 has been calculated to be greater than 0.5 K within 5 years, whereas calculations indicate an increase of 0.1–0.5 K simulation bias in the fast RTM, which are introduced by the seasonal variation in some CO2 absorption spectral regions.
  • Atmospheric temperature profile retrieval and radiance assimilation for NWP models using high spectral resolution IR sounder data should take into account the CO2 changes. CO2 changes have a significant impact on temperature profile retrieval (e.g., causes additional retrieval errors).
  • It is challenging to separate atmospheric temperature and CO2 information using hyperspectral IR sounder radiances, because the atmospheric temperature and CO2 signals in the interferogram show that synchronous variations in phase and temperature signal are much stronger than the CO2 signal in the IR CO2 absorption regions.

Author Contributions

Conceptualization, J.L.; methodology, D.D., Y.X. and W.B.; software, D.D.; validation, D.D. and W.B.; formal analysis, J.L. and D.D.; investigation, J.L. and P.Z.; resources, P.Z.; data curation, D.D.; writing—original draft preparation, J.L., D.D., and W.B.; writing—review and editing, J.L., Y.X. and P.Z.; visualization, D.D.; supervision, J.L.; project administration, P.Z.; funding acquisition, P.Z. All authors have read and agreed to the published version of the manuscript.

Funding

This research was funded by National R&D Program 2018YFB0504900, and National Natural Science Foundation 41975020.

Acknowledgments

We thank NOAA, CMA and WDCGG for providing the CO2 data.

Conflicts of Interest

The authors declare no conflict of interest.

References

  1. Menzel, W.P.; Timothy, J.S.; Zhang, P.; Li, J. Satellite based atmospheric infrared sounder development and applications. Bull. Am. Meteorol. Soc. 2018, 99, 583–603. [Google Scholar] [CrossRef]
  2. Yang, J.; Zhang, Z.; Wei, C.; Feng, L.U.; Qiang, G. Introducing the new generation of Chinese geostationary weather satellites-FengYun 4 (FY-4). Bull. Am. Meteorol. Soc. 2016, 98, 8. [Google Scholar]
  3. Min, M.; Wu, C.; Li, C.; Liu, H.; Xu, N.; Wu, X.; Wang, X. Developing the science product algorithm testbed for Chinese next-generation geostationary meteorological satellites: Fengyun-4 series. J. Meteorol. Res. 2017, 31, 708–719. [Google Scholar] [CrossRef]
  4. Li, J.; Li, J.-L.; Otkin, J.; Schmit, T.J.; Liu, C. Warning information in a preconvection environment from the geostationary advanced infrared sounding system—A simulation study using IHOP case. J. Appl. Meteorol. Clim. 2011, 50, 776–783. [Google Scholar] [CrossRef]
  5. Li, J.; Liu, C.-Y.; Zhang, P.; Schmit, T.J. Applications of Full Spatial Resolution Space-Based Advanced Infrared Soundings in the Preconvection Environment. Weather. Forecast. 2012, 27, 515–524. [Google Scholar] [CrossRef]
  6. Schmit, T.; Li, J.; Lee, S.J.; Li, Z.; Dworak, R.; Lee, Y.; Bowlan, M.; Gerth, J.; Martin, G.D.; Straka, W.; et al. Legacy atmospheric profiles and derived products from GOES-16: Validation and applications. Earth. Space. Sci. 2019, 6, 1730–1748. [Google Scholar] [CrossRef]
  7. Li, Z.; Li, J.; Gunshor, M.; Moeller, S.-C.; Schmit, T.J.; Yu, F.; McCarty, W. Homogenized Water Vapor Absorption Band Radiances From International Geostationary Satellites. Geophys. Res. Lett. 2019, 46, 10599–10608. [Google Scholar] [CrossRef] [Green Version]
  8. Xue, Y.; Li, J.; Menzel, W.P.; Borbas, E.; Ho, S.-P.; Li, Z.; Li, J. Characteristics of Satellite Sampling Errors in Total Precipitable Water from SSMIS, HIRS, and COSMIC Observations. J. Geophys. Res. Atmos. 2019, 124, 6966–6981. [Google Scholar] [CrossRef] [Green Version]
  9. Xue, Y.; Li, J.; Li, Z.; Gunshor, M.M.; Schmit, T.J. Evaluation of the Diurnal Variation of Upper Tropospheric Humidity in Reanalysis Using Homogenized Observed Radiances from International Geostationary Weather Satellites. Remote Sens. 2020, 12, 1628. [Google Scholar] [CrossRef]
  10. Li, J.; Wolf, W.; Menzel, W.P.; Zhang, W.; Huang, H.-L.; Achtor, T.H. Global soundings of the atmosphere from ATOVS measurements: The algorithm and validation. J. Appl. Meteorol. 2000, 39, 1248–1268. [Google Scholar] [CrossRef]
  11. Chédin, A.; Hollingsworth, A.; Scott, N.A.; Serrar, S.; Crevoisier, C.; Armante, R. Annual and seasonal variations of atmospheric CO2, N2O and CO concentrations retrieved from NOAA/TOVS satellite observations. Geophys. Res. Lett. 2002, 29, 110–111. [Google Scholar] [CrossRef]
  12. Crevoisier, C.; Heilliette, S.; Chédin, A.; Serrar, S.; Armante, R.; Scott, N.A. Midtropospheric CO2 concentration retrieval from AIRS observations in the tropics. Geophys. Res. Lett. 2004, 31, 31. [Google Scholar] [CrossRef]
  13. Crevoisier, C.; Chédin, A.; Matsueda, H.; Machida, T.; Armante, R.; Scott, N.A. First year of upper tropospheric integrated content of CO2 from IASI hyperspectral infrared observations. Atmos. Chem. Phys. 2009, 9, 8187–8222. [Google Scholar] [CrossRef]
  14. Chahine, M.T.; Barnet, C.; Olsen, E.T.; Chen, L.; Maddy, E. On the determination of atmospheric minor gases by the method of vanishing partial derivatives with application to CO2. Geophys. Res. Lett. 2005, 32, L22803. [Google Scholar] [CrossRef] [Green Version]
  15. Chahine, M.T.; Chen, L.; Dimotakis, P.; Jiang, X.; Li, Q.; Olsen, E.T.; Pagano, T.; Randerson, J.; Yung, Y.L. Satellite remote sounding of mid-tropospheric CO2. Geophys. Res. Lett. 2008, 35, L17807. [Google Scholar] [CrossRef] [Green Version]
  16. Strow, L.L.; Hannon, S.E. A 4-year zonal climatology of lower tropospheric CO2 derived from ocean-only Atmospheric Infrared Sounder observations. J. Geophys. Res. Atmos. 2008, 113, D18302. [Google Scholar] [CrossRef]
  17. Ota, Y.; Imasu, R. CO2 retrieval using thermal infrared radiation observation by Interferometric Monitor for Greenhouse Gases (IMG) onboard Advanced Earth Observing Satellite (ADEOS). J. Meterol. Soc. Jpn. 2016, 94, 471–490. [Google Scholar] [CrossRef] [Green Version]
  18. Serio, C.; Masiello, G.; Camy-Peyret, C.; Liuzzi, G. CO2 spectroscopy and forward/inverse radiative transfer modelling in the thermal band using IASI spectra. J. Quant. Spectrosc. Radiat. Transf. 2019, 222, 65–83. [Google Scholar] [CrossRef]
  19. Krishnapriya, M.; Chandra, A.B.; Nayak, R.K.; Patel, N.R.; Rao, P.V.N.; Dadhwal, V.K. Seasonal and inter-annual variability of atmosphere CO2 based on NOAA Carbon Tracker analysis and satellite observations. Photonirvachak-J. Ind. 2018, 46, 309–320. [Google Scholar] [CrossRef]
  20. Zhang, F.; Zhou, L.X. Implications for CO2 emissions and sinks changes in western China during 1995–2008 from atmospheric CO2 at Waliguan. Tellus. B 2013, 65, 19576. [Google Scholar] [CrossRef] [Green Version]
  21. Conway, T.J.; Tans, P.P.; Waterman, L.S.; Thoning, K.W.; Kitzis, D.R.; Masarie, K.A.; Zhang, N. Evidence for interannual variability of the carbon cycle from the NOAA/CMDL global air sampling network. J. Geophys. Res. 1994, 99, 22831–22855. [Google Scholar] [CrossRef]
  22. Clough, S.A.; Kneizys, F.X.; Davis, R.W. Line shape and the water vapor continuum. Atmos. Res. 1989, 23, 229–241. [Google Scholar] [CrossRef]
  23. Clough, S.A.; Kneizys, F.X.; Rothman, L.S.; Gallery, W.O. Atmospheric spectral transmittance and radiance: FASCOD1B. In Atmospheric Transmission; SPIE: Washington, WA, USA, 1981; Volume 277, pp. 152–166. [Google Scholar] [CrossRef]
  24. Clough, S.A.; Lacono, M.J.; Moncet, J.L. Line-by-line calculation of atmospheric fluxes and cooling rates: Application to water vapor. J. Geophys. Res. 1992, 97, 15761–15785. [Google Scholar] [CrossRef]
  25. Clough, S.A.; Shephard, M.W.; Mlawer, E.J.; Delamere, J.S.; Lacono, M.J.; Cady-Pereira, K.; Brown, P.D. Atmospheric radiative transfer modeling: A summary of the AER codes, short communication. J. Quant. Spectrosc. Radiat. Transf 2005, 91, 233–244. [Google Scholar] [CrossRef]
  26. Saunders, R.; Hocking, J.; Turner, E.; Rayer, P.; Rundle, D.; Brunel, P.; Vidot, J.; Roquet, P.; Matricardi, M.; Geer, A.; et al. An update on the RTTOV fast radiative transfer model (currently at version 12). Geosci. Model Dev. 2018, 11, 2717–2737. [Google Scholar] [CrossRef] [Green Version]
  27. Chen, Y.; Weng, F.; Han, Y.; Liu, Q. Validation of the Community Radiative Transfer Model (CRTM) by using CloudSat data. J. Geophys. Res. 2008, 113, 2156–2202. [Google Scholar] [CrossRef]
  28. Chen, Y.; Han, Y.; Van Delst, P.; Weng, F. On water vapor Jacobian in fast radiative transfer model. J. Geophys. Res. 2010, 115, 12303. [Google Scholar] [CrossRef]
  29. Di, D.; Li, J.; Han, W.; Bai, W.; Wu, C.; Menzel, W.P. Enhancing the fast radiative transfer model for FengYun-4 GIIRS by using local training profiles. J. Geophys. Res. Atmos. 2018, 123, 12583–12596. [Google Scholar] [CrossRef]
  30. Li, J.; Li, Z.; Wang, P.; Timothy, J.S.; Bai, W.; Robert, A. An efficient radiative transfer model for hyperspectral IR radiance simulation and applications under cloudy sky conditions. J. Geophys. Res. Atmos. 2017, 122, 7600–7613. [Google Scholar] [CrossRef]
  31. Engelen, R.J.; Bauer, P. The use of variable CO2 in the data assimilation of AIRS and IASI radiances. Q. J. R. Meteorol. Soc. 2014, 140, 958–965. [Google Scholar] [CrossRef]
  32. Yin, R.; Han, W.; Gao, Z.; Di, D. The evaluation of FY4A’s Geostationary Interferometric Infrared Sounder (GIIRS) long-wave temperature sounding channels using the GRAPES global 4D-Var. Q. J. R. Meteorol. Soc. 2020, 146, 1459–1476. [Google Scholar] [CrossRef]
  33. Li, Z.; Li, J.; Menzel, W.P.; Nelson III, J.P.; Schmit, T.J.; Weisz, E.; Ackerman, S.A. Forecasting and nowcasting improvement in cloudy regions with high temporal GOES sounder infrared radiance measurements. J. Geophys. Res. Atmos. 2009, 114, D09216. [Google Scholar] [CrossRef] [Green Version]
  34. Wang, P.; Li, J.; Li, Z.; Lim, A.H.N.; Li, J.; Goldberg, M.D. The Impact of Cross-track Infrared Sounder (CrIS) Cloud-Cleared Radiances on Hurricane Joaquin (2015) and Matthew (2016) Forecasts. J. Geophys. Res. Atmos. 2017, 122, 13201–13218. [Google Scholar] [CrossRef] [Green Version]
  35. Wang, P.; Li, J.; Goldberg, M.D.; Schmit, T.J. Assimilation of thermodynamic information from advanced IR sounders under partially cloudy skies for regional NWP. J. Geophys. Res. Atmos. 2015, 120, 5469–5484. [Google Scholar] [CrossRef]
  36. Wang, P.; Li, J.; Li, J.; Li, Z.; Schmit, T.J.; Bai, W. Advanced infrared sounder subpixel cloud detection with imagers and its impact on radiance assimilation in NWP. Geophys. Res. Lett. 2014, 41, 1773–1780. [Google Scholar] [CrossRef]
  37. Li, J.; Liu, C.Y.; Huang, H.-L.; Schmit, T.J.; Menzel, W.P.; Gurka, J. Optimal cloud-clearing for AIRS radiances using MODIS. IEEE Trans. Geosci. Remote Sens. 2005, 43, 1266–1278. [Google Scholar]
  38. Li, J.; Wang, P.; Han, H.; Li, J.; Zheng, J. On the assimilation of satellite sounder data in cloudy skies in the numerical weather prediction models. J. Meteorol. Res. 2016, 30, 169–182. [Google Scholar] [CrossRef]
Figure 1. Monthly mean CO2 mole fractions at (a) Waliguan and (b) Key Biscayne from 2009 to 2018.
Remotesensing 12 02401 g001
Figure 2. The atmospheric (a) temperature, (b) moisture, (c) CO2 profiles, and (d) the brightness temperature (BT) spectrum simulated from the atmospheric profiles. The base CO2 profile is around 380 ppmv. The spectral resolution is 0.625 cm−1 in this BT spectrum.
Remotesensing 12 02401 g002
Figure 3. Brightness temperature difference (BTD) when CO2 concentration profile has an increment of (a) 5, (b) 10, (c) 15, (d) 20, and (e) 25 ppmv, respectively, at a spectral resolution of 0.625 cm−1. The base CO2 profile is the one fixed in the RTTOV and is around 380 ppmv.
Remotesensing 12 02401 g003
Figure 4. BTD when CO2 concentration profile has an increment of 5 ppmv with regard to spectra with (a) 0.625, (b) 0.25 and (c) 0.1 cm−1 spectral resolution, respectively.
Remotesensing 12 02401 g004
Figure 5. (a) Mean temperature retrieval bias and (b) root-mean-square error (RMSE) in different cases of CO2 concentration perturbations. CO2 + 0 means no IASI radiance simulation bias from CO2.
Remotesensing 12 02401 g005
Figure 6. BTD spectra with 0.625 cm−1 spectral resolution (a) when CO2 concentration profile has an increment of 5 ppmv and atmospheric temperature perturbation with 0.1 K and −0.2 K; (b) when CO2 concentration profile has an increment of 10 ppmv and atmospheric temperature perturbation with 0.2 K and −0.4 K; (c) when CO2 concentration profile has an increment of 15 ppmv and atmospheric temperature perturbation with 0.3 K and −0.6 K.
Remotesensing 12 02401 g006
Figure 7. The ISDs caused by temperature perturbation of 0.1 K and CO2 perturbation of 5 ppmv, respectively. The interferograms are converted from the radiance spectra with 0.625 cm−1 spectral resolution from 600 to 2600 cm−1 spectral region. (a) shows the ISD for the entire interferogram in regard with original spectral resolution; (b) illustrates the first one-tenth of the interferogram difference in (a).
Remotesensing 12 02401 g007
Figure 8. The ISDs caused by the temperature perturbation of 0.1 K and CO2 perturbation of 5 ppmv, respectively. The interferograms are converted from the radiance spectra with 0.625 cm−1 spectral resolution from (a) band 1 (690–725 cm−1); (b) band 2 (2040–2100 cm−1); and (c) band 3 (2250–2350 cm−1).
Remotesensing 12 02401 g008

