Influence of Soil Properties on Maize and Wheat Nitrogen Status Assessment from Sentinel-2 Data


Abstract
1. Introduction
2. Materials and Methods
2.1. Study Area and Experimental Design
2.2. Field Data Collection
2.3. Satellite Data
2.4. NNI Determination
2.5. NNI Estimation from Remote Sensing
3. Results
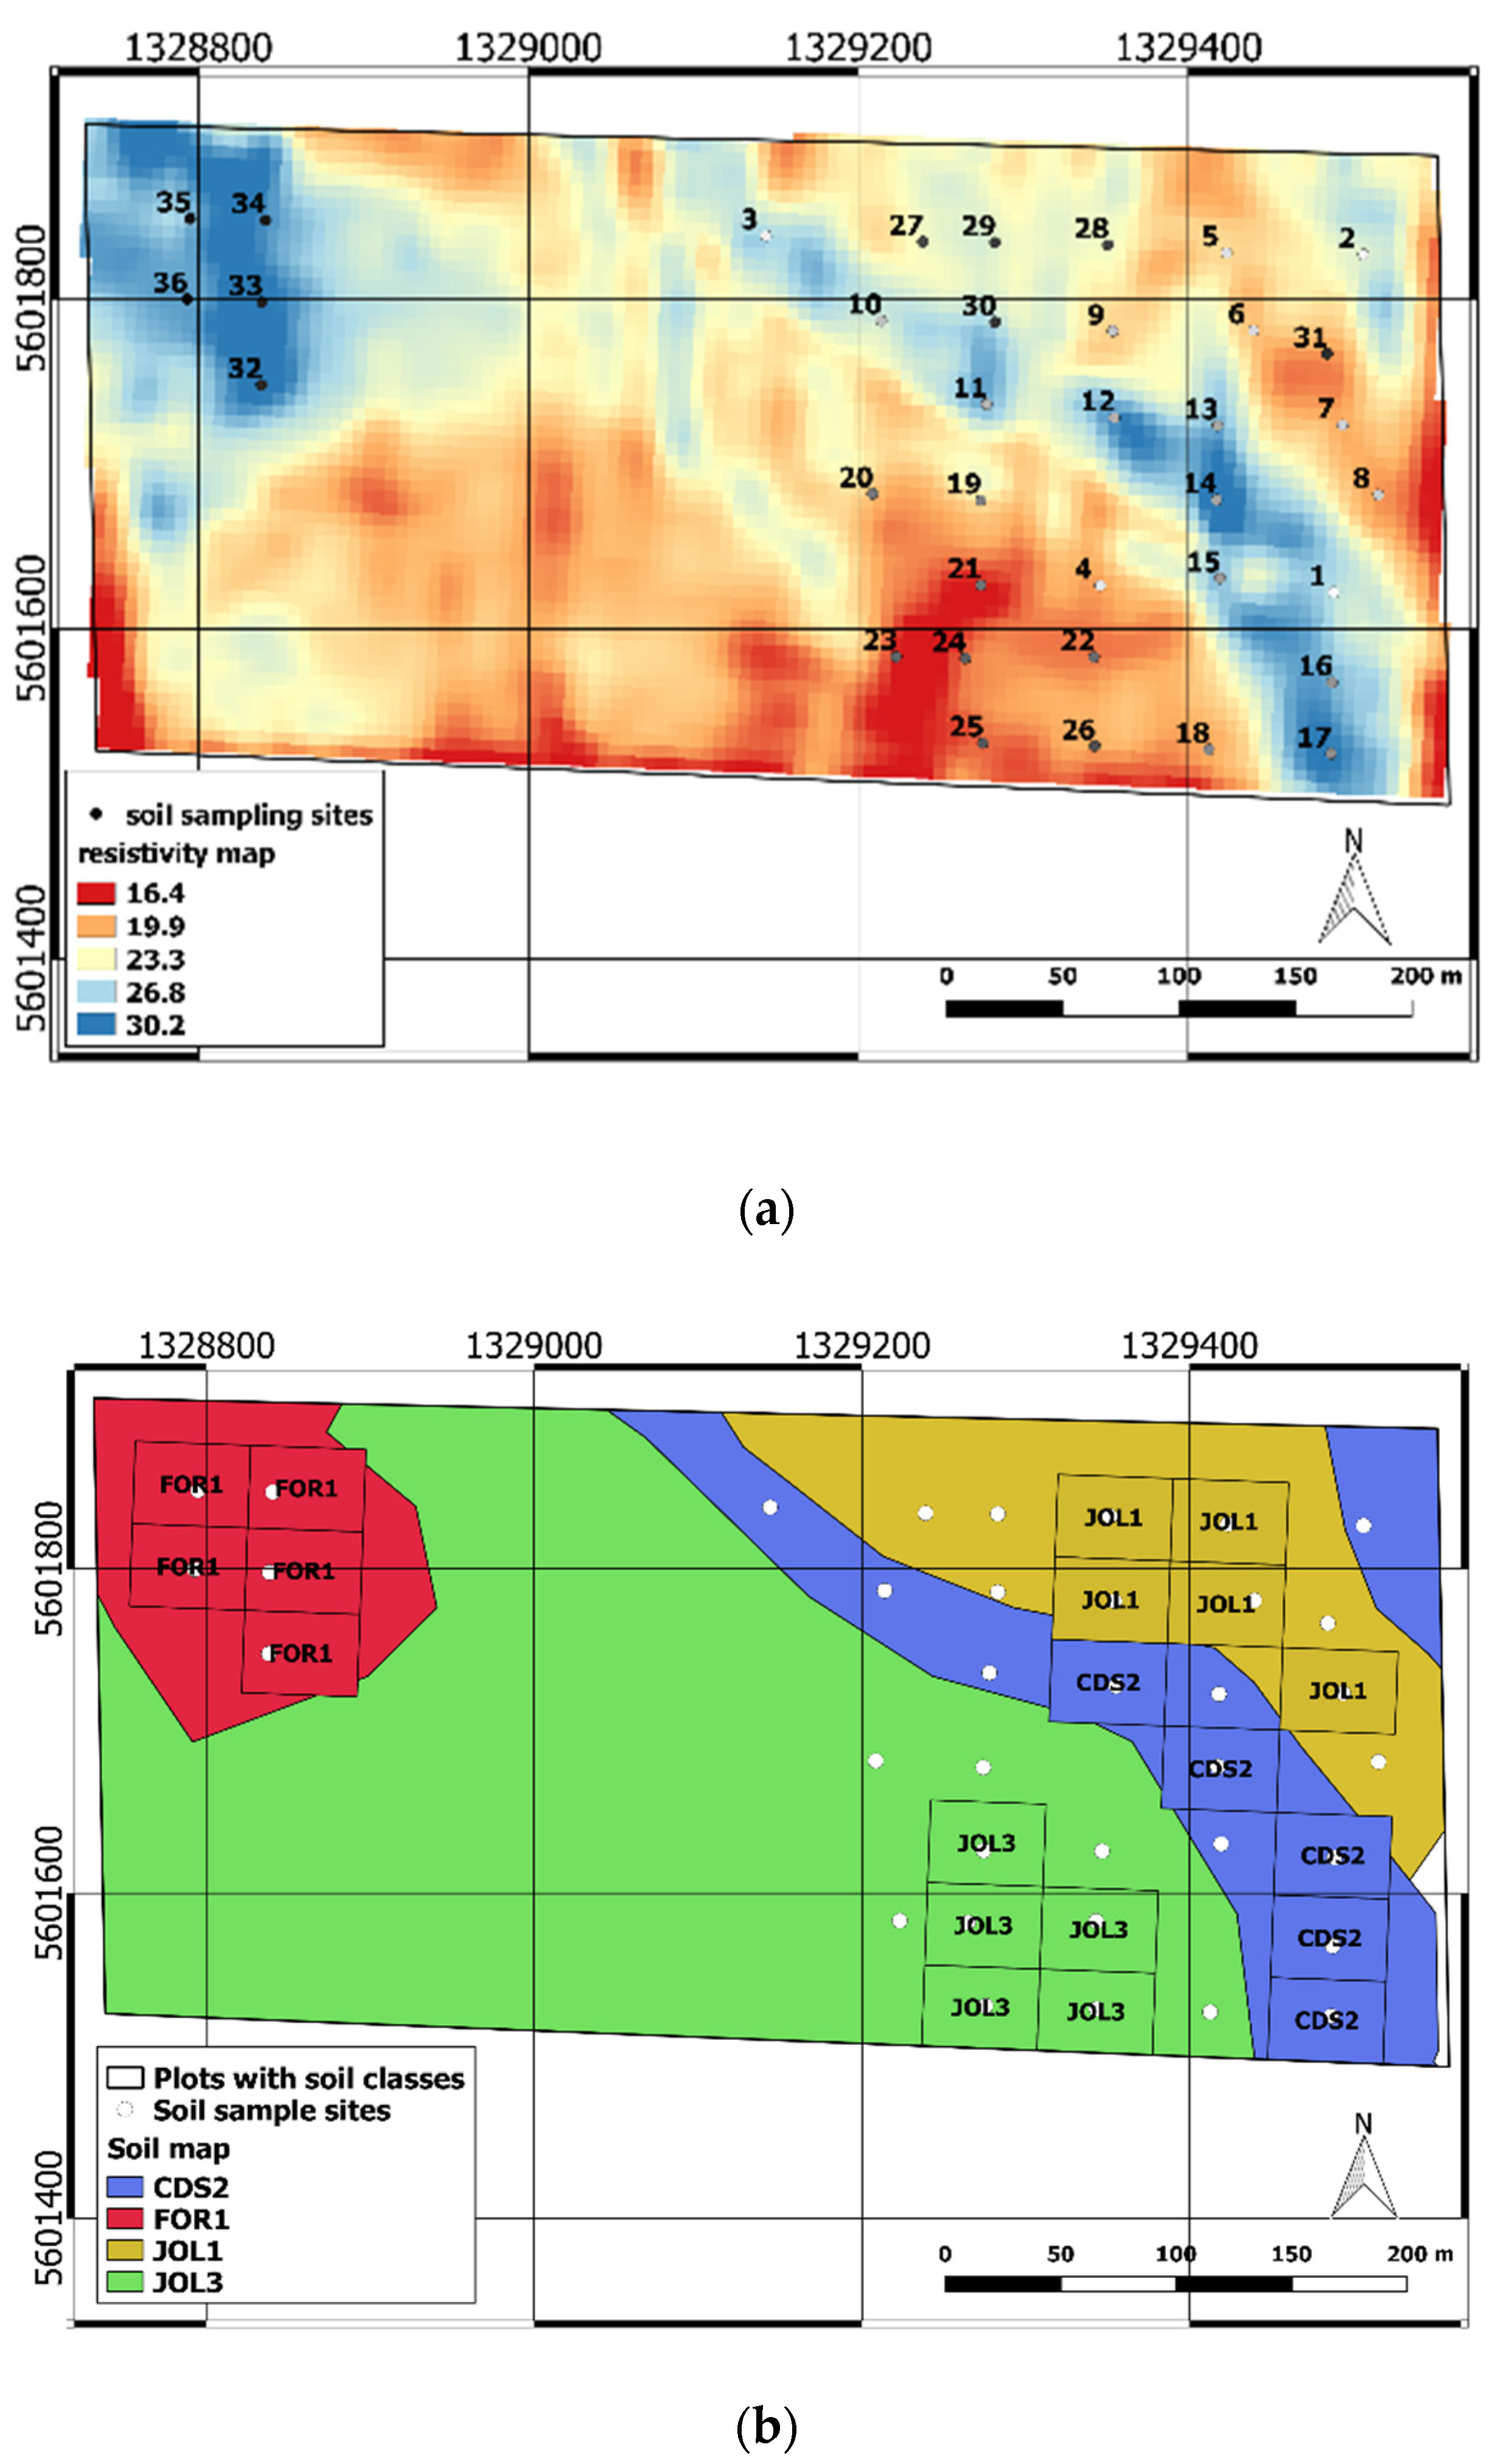
3.1. Soil Variability in the Experimental Field
3.2. Crop Response to Fertilization and Soil Influence
3.2.1. Plant Growth and Yield
3.2.2. Nutritional Status–NNI Values
3.3. Remote Sensing Estimation of NNI
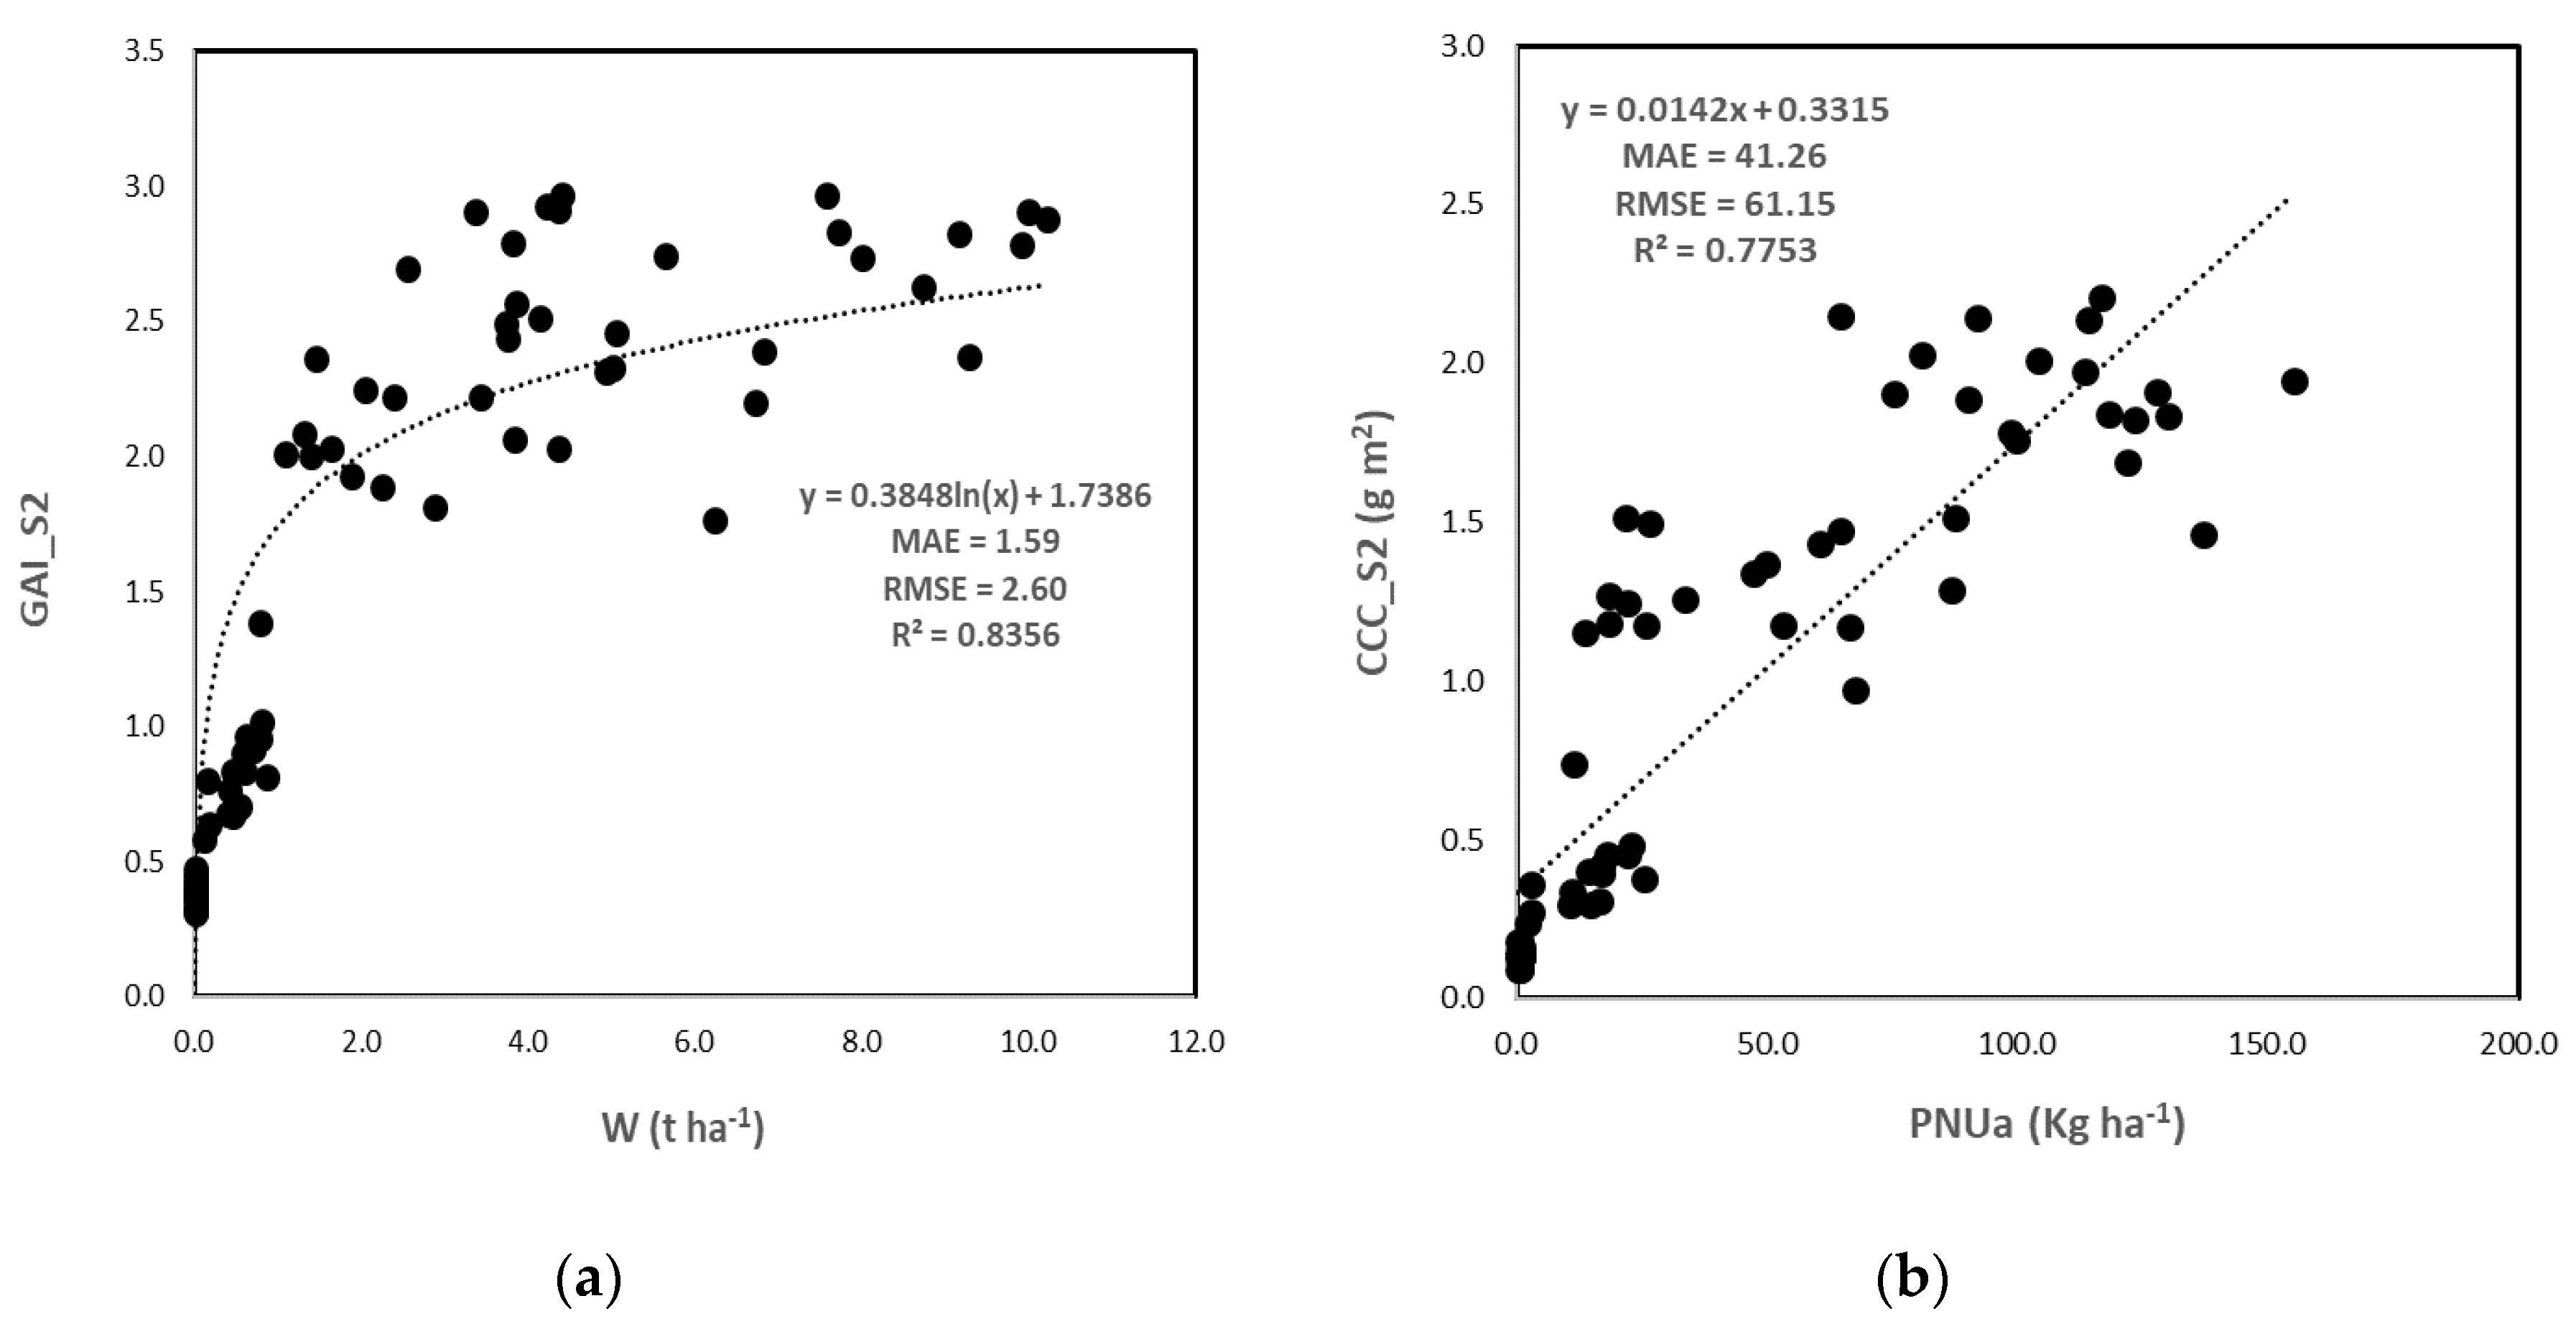
3.3.1. S2 BVs Accuracy
3.3.2. Crop Nutritional Status Estimation
Direct Method
Indirect Method
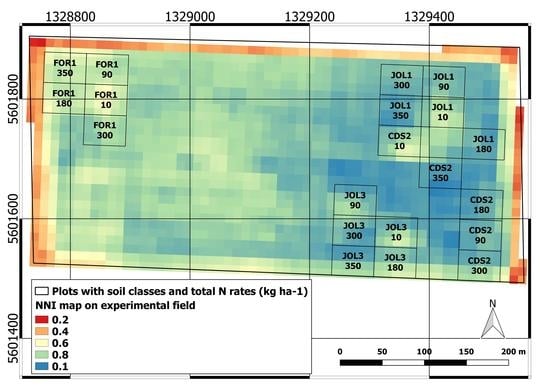
3.3.3. NNI Map and Yield Relation
4. Discussion
5. Conclusions
Author Contributions
Funding
Acknowledgments
Conflicts of Interest
References
- Cordero, E.; Longchamps, L.; Khosla, R.; Sacco, D. Spatial management strategies for nitrogen in maize production based on soil and crop data. Sci. Total Environ. 2019, 697, 133854. [Google Scholar] [CrossRef] [PubMed]
- Longchamps, L.; Khosla, R. Improving N use efficiency by integrating soil and crop properties for variable rate N management. In Precision Agriculture 2015—Papers Presented at the 10th European Conference on Precision Agriculture, ECPA 2015; Wageningen Academic Publishers: Wageningen, The Netherlands, 2015; pp. 249–255. [Google Scholar]
- FAO. World Fertilizer Trends and Outlook to 2018; Food and Agriculture Organization of the United Nations: Rome, Italy, 2015; ISBN 9789251086926. [Google Scholar]
- Dordas, C.A. Nitrogen nutrition index and its relationship to N use efficiency in linseed. Eur. J. Agron. 2011, 34, 124–132. [Google Scholar] [CrossRef]
- Cui, Z.; Chen, X.; Zhang, F. Current Nitrogen management status and measures to improve the intensive wheat-maize system in China. Ambio 2010, 39, 376–384. [Google Scholar] [CrossRef]
- Lassaletta, L.; Billen, G.; Grizzetti, B.; Anglade, J.; Garnier, J. 50 year trends in nitrogen use efficiency of world cropping systems: The relationship between yield and nitrogen input to cropland. Environ. Res. Lett. 2014, 9, 105011. [Google Scholar] [CrossRef]
- Caviglia, O.P.; Melchiori, R.J.M.; Sadras, V.O. Nitrogen utilization efficiency in maize as affected by hybrid and N rate in late-sown crops. Field Crops Res. 2014, 168, 27–37. [Google Scholar] [CrossRef]
- Stamatiadis, S.; Schepers, J.S.; Evangelou, E.; Tsadilas, C.; Glampedakis, A.; Glampedakis, M.; Dercas, N.; Spyropoulos, N.; Dalezios, N.R.; Eskridge, K. Variable-rate nitrogen fertilization of winter wheat under high spatial resolution. Precis. Agric. 2018, 19, 570–587. [Google Scholar] [CrossRef]
- Diacono, M.; Rubino, P.; Montemurro, F. Precision nitrogen management of wheat. A review. Agron. Sustain. Dev. 2013, 33, 219–241. [Google Scholar] [CrossRef]
- Bongiovanni, R.; Lowenberg-Deboer, J. Precision agriculture and sustainability. Precis. Agric. 2004, 5, 359–387. [Google Scholar] [CrossRef]
- Gastal, F.; Lemaire, G. N uptake and distribution in crops: An agronomical and ecophysiological perspective. J. Exp. Bot. 2002, 53, 789–799. [Google Scholar] [CrossRef]
- Körschens, M.; Albert, E.; Armbruster, M.; Barkusky, D.; Baumecker, M.; Behle-Schalk, L.; Bischoff, R.; Čergan, Z.; Ellmer, F.; Herbst, F.; et al. Effect of mineral and organic fertilization on crop yield, nitrogen uptake, carbon and nitrogen balances, as well as soil organic carbon content and dynamics: Results from 20 European long-term field experiments of the twenty-first century. Arch. Agron. Soil Sci. 2013, 59, 1017–1040. [Google Scholar] [CrossRef]
- Casa, R.; Castrignanò, A. Analysis of spatial relationships between soil and crop variables in a durum wheat field using a multivariate geostatistical approach. Eur. J. Agron. 2008, 28, 331–342. [Google Scholar] [CrossRef]
- Lemaire, G.; Jeuffroy, M.H.; Gastal, F. Diagnosis tool for plant and crop N status in vegetative stage. Theory and practices for crop N management. Eur. J. Agron. 2008, 28, 614–624. [Google Scholar] [CrossRef]
- Guerif, M.; Houlès, V.; Baret, F. Remote sensing and detection of nitrogen status in crops. Application to precise nitrogen fertilization. In Proceedings of the 4th International Symposium on Intelligent Information Technology in Agriculture, Beijing, China, 26–29 October 2007; p. 19. [Google Scholar]
- Plénet, D.; Lemaire, G. Relationships between dynamics of nitrogen uptake and dry matter accumulation in maize crops. Determination of critical N concentration. Plant Soil 2000, 216, 65–82. [Google Scholar] [CrossRef]
- Greenwood, D.J.; Lemaire, G.; Gosse, G.; Cruz, P.; Draycott, A.; Neeteson, J.J. Decline in Percentage N of C3 and C4 Crops with Increasing Plant Mass. Ann. Bot. 1990, 66, 425–436. [Google Scholar] [CrossRef]
- Justes, E.; Mary, B.; Meynard, J.-M.; Machet, J.-M.; Thelier-Huche, L. Determination of critical nitrogen dilution curve for winter wheat crops. Ann. Bot. 1994, 74, 397–404. [Google Scholar] [CrossRef]
- Williams, J.R.; Jones, C.A.; Kiniry, J.R.; Spanel, D.A. The EPIC Crop Growth Model. Trans. ASAE 1989, 32, 497–511. [Google Scholar] [CrossRef]
- Hansen, S.; Jensen, H.E.; Nielsen, N.E.; Svendsen, H. Simulation of nitrogen dynamics and biomass production in winter wheat using the Danish simulation model DAISY. Fertil. Res. 1991, 27, 245–259. [Google Scholar] [CrossRef]
- Grindlay, D.J.C.; Sylvester-Bradley, R.; Scott, R.K. Nitrogen uptake of young vegetative plants in relation to green area. J. Sci. Food Agric. 1993, 63, 116. [Google Scholar]
- Zhao, B.; Yao, X.; Tian, Y.C.; Liu, X.J.; Ata-Ul-Karim, S.T.; Ni, J.; Cao, W.X.; Zhu, Y. New critical nitrogen curve based on leaf area index for winter wheat. Agron. J. 2014, 106, 379–389. [Google Scholar] [CrossRef]
- Ata-Ul-Karim, S.T.; Zhu, Y.; Yao, X.; Cao, W. Determination of critical nitrogen dilution curve based on leaf area index in rice. Field Crops Res. 2014, 167, 76–85. [Google Scholar] [CrossRef]
- Confalonieri, R.; Debellini, C.; Pirondini, M.; Possenti, P.; Bergamini, L.; Barlassina, G.; Bartoli, A.; Agostoni, E.G.; Appiani, M.; Babazadeh, L.; et al. A new approach for determining rice critical nitrogen concentration. J. Agric. Sci. 2011, 149, 633–638. [Google Scholar] [CrossRef]
- Weiss, M.; Baret, F.; Myneni, R.B.; Pragnère, A.; Knyazikhin, Y. Investigation of a model inversion technique to estimate canopy biophysical variables from spectral and directional reflectance data. Agronomie 2000, 20, 3–22. [Google Scholar] [CrossRef]
- Houlès, V.; Guérif, M.; Mary, B. Elaboration of a nitrogen nutrition indicator for winter wheat based on leaf area index and chlorophyll content for making nitrogen recommendations. Eur. J. Agron. 2007, 27, 1–11. [Google Scholar] [CrossRef]
- Chen, P. A comparison of two approaches for estimating the wheat nitrogen nutrition index using remote sensing. Remote Sens. 2015, 7, 4527–4548. [Google Scholar] [CrossRef]
- Huang, S.; Miao, Y.; Zhao, G.; Yuan, F.; Ma, X.; Tan, C.; Yu, W.; Gnyp, M.L.; Lenz-Wiedemann, V.I.S.; Rascher, U.; et al. Satellite remote sensing-based in-season diagnosis of rice nitrogen status in Northeast China. Remote Sens. 2015, 7, 10646–10667. [Google Scholar] [CrossRef]
- Zhao, B.; Duan, A.; Ata-Ul-Karim, S.T.; Liu, Z.; Chen, Z.; Gong, Z.; Zhang, J.; Xiao, J.; Liu, Z.; Qin, A.; et al. Exploring new spectral bands and vegetation indices for estimating nitrogen nutrition index of summer maize. Eur. J. Agron. 2018, 93, 113–125. [Google Scholar] [CrossRef]
- Zhao, B.; Ata-Ul-Karim, S.T.; Duan, A.; Liu, Z.; Wang, X.; Xiao, J.; Liu, Z.; Qin, A.; Ning, D.; Zhang, W.; et al. Determination of critical nitrogen concentration and dilution curve based on leaf area index for summer maize. Field Crops Res. 2018, 228, 195–203. [Google Scholar] [CrossRef]
- Xia, T.; Miao, Y.; Wu, D.; Shao, H.; Khosla, R.; Mi, G.; Xia, T.; Miao, Y.; Wu, D.; Shao, H.; et al. Active Optical Sensing of Spring Maize for In-Season Diagnosis of Nitrogen Status Based on Nitrogen Nutrition Index. Remote Sens. 2016, 8, 605. [Google Scholar] [CrossRef]
- Cilia, C.; Panigada, C.; Rossini, M.; Meroni, M.; Busetto, L.; Amaducci, S.; Boschetti, M.; Picchi, V.; Colombo, R. Nitrogen status assessment for variable rate fertilization in maize through hyperspectral imagery. Remote Sens. 2014, 6, 6549–6565. [Google Scholar] [CrossRef]
- Wang, R.; Song, X.; Li, Z.; Yang, G.; Guo, W.; Tan, C.; Chen, L. Estimation of winter wheat nitrogen nutrition index using hyperspectral remote sensing. Trans. Chin. Soc. Agric. Eng. 2014, 30, 191–198. [Google Scholar] [CrossRef]
- Nutini, F.; Confalonieri, R.; Crema, A.; Movedi, E.; Paleari, L.; Stavrakoudis, D.; Boschetti, M. An operational workflow to assess rice nutritional status based on satellite imagery and smartphone apps. Comput. Electron. Agric. 2018, 154, 80–92. [Google Scholar] [CrossRef]
- Blondlot, A.; Gate, P.; Poilvé, H. Providing operational nitrogen recommendations to farmers using satellite imagery. Precis. Agric. 2005, 5, 345–352. [Google Scholar]
- Feng, W.; Guo, B.B.; Zhang, H.Y.; He, L.; Zhang, Y.S.; Wang, Y.H.; Zhu, Y.J.; Guo, T.C. Remote estimation of above ground nitrogen uptake during vegetative growth in winter wheat using hyperspectral red-edge ratio data. Field Crops Res. 2015, 180, 197–206. [Google Scholar] [CrossRef]
- Clevers, J.G.P.W.; Kooistra, L.; van den Brande, M.M.M. Using Sentinel-2 data for retrieving LAI and leaf and canopy chlorophyll content of a potato crop. Remote Sens. 2017, 9, 405. [Google Scholar] [CrossRef]
- Berger, K.; Atzberger, C.; Danner, M.; D’Urso, G.; Mauser, W.; Vuolo, F.; Hank, T. Evaluation of the PROSAIL model capabilities for future hyperspectral model environments: A review study. Remote Sens. 2018, 10, 85. [Google Scholar] [CrossRef]
- Delloye, C.; Weiss, M.; Defourny, P. Retrieval of the canopy chlorophyll content from Sentinel-2 spectral bands to estimate nitrogen uptake in intensive winter wheat cropping systems. Remote Sens. Environ. 2018, 216, 245–261. [Google Scholar] [CrossRef]
- Castaldi, F.; Casa, R.; Pelosi, F.; Yang, H. Influence of acquisition time and resolution on wheat yield estimation at the field scale from canopy biophysical variables retrieved from SPOT satellite data. Int. J. Remote Sens. 2015, 36, 2438–2459. [Google Scholar] [CrossRef]
- Upreti, D.; Huang, W.; Kong, W.; Pascucci, S.; Pignatti, S.; Zhou, X.; Ye, H.; Casa, R. A comparison of hybrid machine learning algorithms for the retrieval of wheat biophysical variables from sentinel-2. Remote Sens. 2019, 11, 481. [Google Scholar] [CrossRef]
- Verrelst, J.; Malenovský, Z.; Van der Tol, C.; Camps-Valls, G.; Gastellu-Etchegorry, J.P.; Lewis, P.; North, P.; Moreno, J. Quantifying Vegetation Biophysical Variables from Imaging Spectroscopy Data: A Review on Retrieval Methods. Surv. Geophys. 2019, 40, 589–629. [Google Scholar] [CrossRef]
- Weiss, M.; Baret, F. S2ToolBox Level 2 Products: LAI, FAPAR, FCOVER- VERSION 1.1; INRA: Avignone, France, 2016. [Google Scholar]
- Priori, S.; Martini, E.; Andrenelli, M.C.; Magini, S.; Agnelli, A.E.; Bucelli, P.; Biagi, M.; Pellegrini, S.; Costantini, E.A.C. Improving Wine Quality through Harvest Zoning and Combined Use of Remote and Soil Proximal Sensing. Soil Sci. Soc. Am. J. 2013, 77, 1338. [Google Scholar] [CrossRef]
- Lancashire, P.D.; Bleiholder, H.; Boom, T.V.D.; Langelüddeke, P.; Stauss, R.; Weber, E.; Witzenberger, A. A uniform decimal code for growth stages of crops and weeds. Ann. Appl. Biol. 1991, 119, 561–601. [Google Scholar] [CrossRef]
- Camacho, F.; Lacaze, R.; Latorre, C.; Baret, F.; De la Cruz, F.; Demarez, V.; Di Bella, C.; Fang, H.; García-Haro, J.; Gonzalez, M.P.; et al. A Network of Sites for Ground Biophysical Measurements in support of Copernicus Global Land Product Validation. Fourth Recent Adv. Quant. Remote Sens. 2014, 1, 1–6. [Google Scholar]
- Demarez, V.; Duthoit, S.; Baret, F.; Weiss, M.; Dedieu, G. Estimation of leaf area and clumping indexes of crops with hemispherical photographs. Agric. For. Meteorol. 2008, 148, 644–655. [Google Scholar] [CrossRef]
- Duveiller, G.; Weiss, M.; Baret, F.; Defourny, P. Retrieving wheat Green Area Index during the growing season from optical time series measurements based on neural network radiative transfer inversion. Remote Sens. Environ. 2011, 115, 887–896. [Google Scholar] [CrossRef]
- Ranghetti, L.; Boschetti, M.; Nutini, F.; Busetto, L. “sen2r”: An R toolbox for automatically downloading and preprocessing Sentinel-2 satellite data. Comput. Geosci. 2020, 139, 104473. [Google Scholar] [CrossRef]
- Baret, F.; Houlès, V.; Guérif, M. Quantification of plant stress using remote sensing observations and crop models: The case of nitrogen management. J. Exp. Bot. 2007, 58, 869–880. [Google Scholar] [CrossRef] [PubMed]
- Green, D.S.; Erickson, J.E.; Kruger, E.L. Foliar morphology and canopy nitrogen as predictors of light-use efficiency in terrestrial vegetation. Agric. For. Meteorol. 2003, 15, 163–171. [Google Scholar] [CrossRef]
- Rouse, J.W.; Haas, R.H.; Schell, J.A.; Deering, D.W. Monitoring vegetation systems in the Great Plains with ERTS. In Proceedings of the Third ERTS Symposium, NASA SP-351, Washington, DC, USA, 10–14 December 1973; Volume 1, pp. 309–317. [Google Scholar]
- Barnes, E.M.; Clarke, T.R.; Richards, S.E.; Colaizzi, P.D.; Haberland, J.; Kostrzewski, M.; Waller, P.; Choi, C.; Riley, E.; Thompson, T.; et al. Coincident detection of crop water stress, nitrogen status and canopy density using ground-based multispectral data. In Proceedings of the 5th International Conference on Precision Agriculture, Bloomington, MN, USA, 16–19 July 2000; pp. 1–15. [Google Scholar]
- Qi, J.; Chehbouni, A.; Huete, A.R.; Kerr, Y.H.; Sorooshian, S. A modified soil adjusted vegetation index. Remote Sens. Environ. 1994, 48, 119–126. [Google Scholar] [CrossRef]
- Gitelson, A.A.; Kaufman, Y.J.; Merzlyak, M.N. Use of a green channel in remote sensing of global vegetation from EOS- MODIS. Remote Sens. Environ. 1996, 58, 289–298. [Google Scholar] [CrossRef]
- Daughtry, C.S.T.; Walthall, C.L.; Kim, M.S.; De Colstoun, E.B.; McMurtrey, J.E. Estimating corn leaf chlorophyll concentration from leaf and canopy reflectance. Remote Sens. Environ. 2000, 74, 229–239. [Google Scholar] [CrossRef]
- Haboudane, D.; Miller, J.R.; Pattey, E.; Zarco-Tejada, P.J.; Strachan, I.B. Hyperspectral vegetation indices and novel algorithms for predicting green LAI of crop canopies: Modeling and validation in the context of precision agriculture. Remote Sens. Environ. 2004, 90, 337–352. [Google Scholar] [CrossRef]
- Rondeaux, G.; Steven, M.; Baret, F. Optimization of soil-adjusted vegetation indices. Remote Sens. Environ. 1996, 55, 95–107. [Google Scholar] [CrossRef]
- Haboudane, D.; Miller, J.R.; Tremblay, N.; Zarco-Tejada, P.J.; Dextraze, L. Integrated narrow-band vegetation indices for prediction of crop chlorophyll content for application to precision agriculture. Remote Sens. Environ. 2002, 81, 416–426. [Google Scholar] [CrossRef]
- Hunt, E.R.; Doraiswamy, P.C.; McMurtrey, J.E.; Daughtry, C.S.T.; Perry, E.M.; Akhmedov, B. A visible band index for remote sensing leaf chlorophyll content at the Canopy scale. Int. J. Appl. Earth Obs. Geoinf. 2012, 21, 103–112. [Google Scholar] [CrossRef]
- Ulrich, A. Physiological Bases for Assessing the Nutritional Requirements of Plants. Ann. Rev. Plant Physiol. 1952, 3, 207–228. [Google Scholar] [CrossRef]
- R Core Team. R: A Language and Environment for Statistical Computing; R Foundation for Statistical Computing: Vienna, Austria, 2018. [Google Scholar]
- Sehgal, V.K.; Chakraborty, D.; Sahoo, R.N. Inversion of radiative transfer model for retrieval of wheat biophysical parameters from broadband reflectance measurements. Inf. Process. Agric. 2016, 3, 107–118. [Google Scholar] [CrossRef]
- Cammarano, D.; Fitzgerald, G.; Basso, B.; O’Leary, G.; Chen, D.; Grace, P.; Fiorentino, C. Use of the Canopy Chlorophyl Content Index (CCCI) for remote estimation of wheat nitrogen content in rainfed environments. Agron. J. 2011, 103, 1597–1603. [Google Scholar] [CrossRef]
- Li, F.; Miao, Y.; Feng, G.; Yuan, F.; Yue, S.; Gao, X.; Liu, Y.; Liu, B.; Ustin, S.L.; Chen, X. Improving estimation of summer maize nitrogen status with red edge-based spectral vegetation indices. Field Crops Res. 2014, 157, 111–123. [Google Scholar] [CrossRef]
- Miao, Y.; Mulla, D.J.; Randall, G.W.; Vetsch, J.A.; Vintila, R. Combining chlorophyll meter readings and high spatial resolution remote sensing images for in-season site-specific nitrogen management of corn. Precis. Agric. 2009, 10, 45–62. [Google Scholar] [CrossRef]
- Hamblin, J.; Stefanova, K.; Angessa, T.T. Variation in chlorophyll content per unit leaf area in spring wheat and implications for selection in segregating material. PLoS ONE 2014, 9, e92529. [Google Scholar] [CrossRef]
- Lemaire, G.; Meynard, J.M. Use of the Nitrogen Nutrition Index for the Analysis of Agronomical Data. In Diagnosis of the Nitrogen Status in Crops; Lemaire, G., Ed.; Springer: Berlin/Heidelberg, Germany, 1997; pp. 45–55. ISBN 978-3-642-60684-7. [Google Scholar]
- Schroder, J.L.; Zhang, H.; Girma, K.; Raun, W.R.; Penn, C.J.; Payton, M.E. Soil acidification from long-term use of nitrogen fertilizers on winter wheat. Soil Sci. Soc. Am. J. 2011, 75, 957–964. [Google Scholar] [CrossRef]
- Han, S.; Hendrickson, L.L.; Ni, B. Comparison of satellite and aerial imagery for detecting leaf chlorophyll content in corn. Trans. Am. Soc. Agric. Eng. 2002, 45, 1229–1236. [Google Scholar] [CrossRef]
- Lemaire, G.; van Oosterom, E.; Sheehy, J.; Jeuffroy, M.H.; Massignam, A.; Rossato, L. Is crop N demand more closely related to dry matter accumulation or leaf area expansion during vegetative growth? Field Crops Res. 2007, 100, 91–106. [Google Scholar] [CrossRef]
- Roderick, M.L.; Berry, S.L.; Noble, I.R.; Farquhar, G.D. A theoretical approach to linking the composition and morphology with the function of leaves. Funct. Ecol. 1999, 13, 683–695. [Google Scholar] [CrossRef]
- Ma, B.-L.; Biswas, D.K. Precision Nitrogen Management for Sustainable Corn Production. In Sustainable Agriculture Reviews; Springer: Cham, Switzerland, 2015; pp. 33–62. [Google Scholar]


| Variety | Density | Plowing Date | Planting Date | Harvest Date | Irrigation | |
|---|---|---|---|---|---|---|
| Maize | SY | 8.8 seeds m2 | 2-Apr 2018 | 17-Apr 2018 | 25-Aug 2018 | Sub-irrigation |
| Wheat | ODISSEO | 200 kg ha−1 | 20-Oct 2018 | 12-Nov 2018 | 15-Jun 2019 | No irrigation |
| Year | Crop | N Treat. Code | N Rate (kg N ha−1) | BBCH a | N Application Date | BBCH b | Field Campaign Date | BBCH c | S2 Acquisition Date |
|---|---|---|---|---|---|---|---|---|---|
| 2018 | Maize | N0 | 10 | ||||||
| N1 | 90 | 00 d | 17-Apr | 12 | 09-May | 13 | 19-May | ||
| N2 | 180 | 13 | 21-May | 15 | 29-May | 16 | 03-Jun | ||
| N3 | 300 | 16 | 01-Jun | 30 | 18-Jun | 50 | 23-Jun | ||
| N4 | 350 | 60 | 26-Jun | 65 | 03-Jul | 65 | 08-Jul | ||
| Standard | 240 | ||||||||
| 2019 | Durum Wheat | N0 | 10 | ||||||
| N1 | 60 | 00 d | 20-Oct | ||||||
| N2 | 120 | 22 | 04-Mar | 25 | 19-Mar | 25 | 20-Mar | ||
| N3 | 180 | 237 | 06-Apr | 31 | 19-Apr | ||||
| N4 | 240 | 51 | 02-May | ||||||
| Standard | 160 |
| Index | Name | Reference |
|---|---|---|
| NDVI | Normalized Difference Vegetation Index | [52] |
| NDRE | Normalized Difference Red Edge Index | [53] |
| MSAVI | Modified Soil-Adjusted Vegetation Index | [54] |
| GNDVI | Green Normalized Difference Vegetation Index | [55] |
| MCARI | Modified Chlorophyll Absorption in Reflectance Index | [56] |
| MCARI2 | Modified Chlorophyll Absorption in Reflectance Index 2 | [57] |
| MTVI2 | Modified Triangular Vegetation Index 2 | [57] |
| OSAVI | Optimized Soil Adjusted Vegetation Index | [58] |
| TCARI | Transformed Chlorophyll Absorption Ratio Index | [59] |
| TCARI/ OSAVI | Transformed Chlorophyll Absorption Ratio Index/Optimized Soil Adjusted Vegetation Index | [59] |
| TCI | Triangular Chlorophyll Index | [60] |
| Statistic | Equation |
|---|---|
| Coefficient of Determination | |
| Mean Absolute Error | |
| Root Mean Square Error |
| Soil Class | N Total (%) | TOC (%) | C/N (%) | SOM (%) | Clay (%) | Silt (%) | Sand (%) | pH (-) |
|---|---|---|---|---|---|---|---|---|
| CDS2 | 0.33 a | 3.44 | 10.39 | 5.93 | 63.72 | 24.01 | 12.28 | 7.56 a |
| JOL3 | 0.33 a | 3.30 | 10.07 | 5.7 | 63.84 | 22.78 | 13.39 | 7.24 a |
| JOL1 | 0.32 a | 3.40 | 10.68 | 5.87 | 62.28 | 25.66 | 12.06 | 7.63 a |
| FOR1 | 0.40 b | 4.00 | 9.86 | 6.89 | 62.24 | 26.85 | 10.91 | 5.48 b |
| Mean | 0.34 * | 3.54 | 10.25 | 6.1 | 63.02 | 24.82 | 12.16 | 6.98 * |
| Soil Class | Max | Min | Mean | Tukey’s Post-Hoc Test |
|---|---|---|---|---|
| JOL1 | 10.2 | 5.0 | 8.3 | a |
| CDS2 | 10.0 | 3.4 | 7.9 | ab |
| JOL3 | 8.0 | 3.7 | 6.1 | ab |
| FOR1 | 6.3 | 1.6 | 4.2 | b |
| Variable | W | GAI DHP | GAI DHP | Cab | CCC1 a | CCC2 b | Na | NNI | PNUa |
|---|---|---|---|---|---|---|---|---|---|
| Unit | t ha−1 | Effective | True | µg cm2 | g m2 | g m2 | % | Kg ha−1 | |
| GAI_S2 | 0.68 | 0.87 | 0.91 | 0.25 | 0.77 | 0.81 | 0.56 | 0.74 | 0.75 |
| CCC_S2 (g m2) c | 0.65 | 0.84 | 0.88 | 0.28 | 0.77 | 0.81 | 0.46 | 0.76 | 0.77 |
| Cab_S2 (g m2) d | 0.54 | 0.77 | 0.83 | 0.30 | 0.69 | 0.76 | 0.47 | 0.82 | 0.70 |
| GNDVI | 0.56 | 0.78 | 0.86 | 0.26 | 0.67 | 0.74 | 0.58 | 0.77 | 0.66 |
| MCARI | 0.34 | 0.48 | 0.56 | 0.32 | 0.37 | 0.71 | 0.33 | 0.29 | |
| MCARI2 | 0.53 | 0.76 | 0.84 | 0.23 | 0.64 | 0.71 | 0.59 | 0.74 | 0.63 |
| MSAVI | 0.55 | 0.77 | 0.85 | 0.23 | 0.65 | 0.72 | 0.63 | 0.73 | 0.63 |
| MTVI2 | 0.53 | 0.76 | 0.84 | 0.23 | 0.64 | 0.71 | 0.59 | 0.74 | 0.63 |
| NDRE | 0.51 | 0.75 | 0.83 | 0.26 | 0.64 | 0.71 | 0.56 | 0.79 | 0.64 |
| NDVI | 0.48 | 0.72 | 0.80 | 0.21 | 0.59 | 0.66 | 0.56 | 0.76 | 0.60 |
| OSAVI | 0.53 | 0.75 | 0.84 | 0.24 | 0.63 | 0.70 | 0.61 | 0.74 | 0.62 |
| SAVI | 0.56 | 0.78 | 0.86 | 0.24 | 0.66 | 0.73 | 0.61 | 0.73 | 0.65 |
| TCARI | 0.43 | 0.64 | 0.72 | 0.28 | 0.54 | 0.62 | 0.54 | 0.74 | 0.54 |
| TCARI/OSAVI | 0.47 |
| Variable | W | GAI DHP | GAI DHP | Cab | CCC1 a | CCC2 b | Na | NNI | PNUa |
|---|---|---|---|---|---|---|---|---|---|
| Unit | t ha−1 | Effective | True | µg cm2 | g m2 | g m2 | % | Kg ha−1 | |
| GAI_S2 | 0.36 | 0.42 | 0.39 | 0.37 | 0.35 | 0.33 | |||
| CCC_S2 (g m2) c | 0.35 | 0.37 | 0.37 | 0.37 | 0.38 | 0.27 | |||
| Cab_S2 (g m2) d | 0.28 | 0.21 | 0.27 | 0.30 | 0.38 | ||||
| GNDVI | 0.45 | 0.45 | 0.44 | 0.46 | 0.46 | 0.39 | |||
| MCARI | 0.32 | 0.20 | 0.18 | 0.10 | 0.48 | 0.47 | 0.31 | ||
| MCARI2 | 0.36 | 0.46 | 0.36 | 0.36 | 0.29 | 0.35 | 0.35 | 0.42 | |
| MSAVI | 0.36 | 0.46 | 0.36 | 0.36 | 0.29 | 0.35 | 0.35 | 0.42 | |
| MTVI2 | 0.47 | 0.46 | 0.45 | 0.48 | 0.48 | 0.39 | |||
| NDRE | 0.42 | 0.50 | 0.43 | 0.41 | 0.36 | 0.32 | 0.31 | 0.45 | |
| NDVI | 0.39 | 0.48 | 0.39 | 0.38 | 0.31 | 0.36 | 0.36 | 0.44 | |
| OSAVI | 0.36 | 0.46 | 0.36 | 0.35 | 0.28 | 0.38 | 0.38 | 0.43 | |
| SAVI | 0.34 | 0.61 | 0.61 | ||||||
| TCARI | 0.42 | 0.40 | 0.40 | ||||||
| TCARI/OSAVI | 0.29 | 0.23 | 0.54 | 0.53 | 0.29 |
| Maize Field ID | NNI Mean Value | Tukey’s Post-Hoc Test | Yield t ha−1 |
|---|---|---|---|
| 9 | 0.90 | a | 22.1 |
| 175 | 0.90 | a | 18.5 |
| 10 | 0.89 | a | 24.2 |
| 11 | 0.88 | ab | 24.1 |
| 258 | 0.86 | bc | 19.5 |
| 8 | 0.83 | cd | 17.8 |
| 308 | 0.83 | d | 18.0 |
| 312 | 0.82 | d | 13.0 |
| 368 | 0.78 | e | 19.5 |
| Exp. Field | 0.77 | e | 14.2 |
| 331 | 0.69 | f | 19.5 |
| 467 | 0.68 | f | 16.0 |
| 92 | 0.58 | g | 10.5 |
| 91 | 0.5 | h | 16.0 |
© 2020 by the authors. Licensee MDPI, Basel, Switzerland. This article is an open access article distributed under the terms and conditions of the Creative Commons Attribution (CC BY) license (http://creativecommons.org/licenses/by/4.0/).
Share and Cite
Crema, A.; Boschetti, M.; Nutini, F.; Cillis, D.; Casa, R. Influence of Soil Properties on Maize and Wheat Nitrogen Status Assessment from Sentinel-2 Data. Remote Sens. 2020, 12, 2175. https://doi.org/10.3390/rs12142175
Crema A, Boschetti M, Nutini F, Cillis D, Casa R. Influence of Soil Properties on Maize and Wheat Nitrogen Status Assessment from Sentinel-2 Data. Remote Sensing. 2020; 12(14):2175. https://doi.org/10.3390/rs12142175
Chicago/Turabian StyleCrema, Alberto, Mirco Boschetti, Francesco Nutini, Donato Cillis, and Raffaele Casa. 2020. "Influence of Soil Properties on Maize and Wheat Nitrogen Status Assessment from Sentinel-2 Data" Remote Sensing 12, no. 14: 2175. https://doi.org/10.3390/rs12142175
APA StyleCrema, A., Boschetti, M., Nutini, F., Cillis, D., & Casa, R. (2020). Influence of Soil Properties on Maize and Wheat Nitrogen Status Assessment from Sentinel-2 Data. Remote Sensing, 12(14), 2175. https://doi.org/10.3390/rs12142175