Article

Comparative Assessment of the Built-Up Area Expansion Based on Corine Land Cover and Landsat Datasets: A Case Study of a Post-Socialist City

by
Ilinca-Valentina Stoica
1,
Marina Vîrghileanu
2,
Daniela Zamfir
1,*,
Bogdan-Andrei Mihai
2 and
Ionuț Săvulescu
2
1
Faculty of Geography and Interdisciplinary Centre for Advanced Researches on Territorial Dynamics, University of Bucharest, 010041 Bucharest, Romania
2
Faculty of Geography, University of Bucharest, 010041 Bucharest, Romania
*
Author to whom correspondence should be addressed.
Remote Sens. 2020, 12(13), 2137; https://doi.org/10.3390/rs12132137
Submission received: 3 June 2020 / Revised: 30 June 2020 / Accepted: 1 July 2020 / Published: 3 July 2020

Abstract

:
Monitoring uncontained built-up area expansion remains a complex challenge for the development and implementation of a sustainable planning system. In this regard, proper planning requires accurate monitoring tools and up-to-date information on rapid territorial transformations. The purpose of the study was to assess built-up area expansion, comparing two freely available and widely used datasets, respectively, Corine Land Cover and Landsat, to each other, as well as the ground truth, with the goal of identifying the most cost-effective and reliable tool. The analysis was based on the largest post-socialist city in the European Union, the capital of Romania, Bucharest, and its neighboring Ilfov County, from 1990 to 2018. This study generally represents a new approach to measuring the process of urban expansion, offering insights about the strengths and limitations of the two datasets through a multi-level territorial perspective. The results point out discrepancies between the datasets, both at the macro-scale level and at the administrative unit’s level. On the macro-scale level, despite the noticeable differences, the two datasets revealed the spatiotemporal magnitude of the expansion of the built-up area and can be a useful tool for supporting the decision-making process. On the smaller territorial scale, detailed comparative analyses through five case-studies were conducted, indicating that, if used alone, limitations on the information that can be derived from the datasets would lead to inaccuracies, thus significantly limiting their potential to be used in the development of enforceable regulation in urban planning.

Graphical Abstract

1. Introduction

Over the last decades, Europe has had to face an increased demand for land inside cities and their surroundings [1]. The impact is significant, as the area affected by the urban expansion process exceeds 1000 km2 annually [2]. Even though the population has declined in many parts of the continent, built-up surfaces have spread significantly, and continue to do so [3,4,5]. This pattern corresponds to a global phenomenon, as many built-up areas develop at a much faster rate than that of the population growth [6,7], suggesting an urban development trend that is more dispersed than compact [8]. Multiple previous studies described this process as a serious challenge for sustainable development, leading to many environmental problems [9,10] such as urban heat islands [11,12,13], climate change [14], air pollution [15] and water pollution [16]. The conversion of agricultural land cover types into built-up areas increases the consumption of fertile soil resources [17,18,19], which leads to intensive use of the remaining land and an ultimate decline in food production [20,21]. Biodiversity loss [7,22] and higher human pressure near protected areas [8,23] are also effects related to urban expansion process. In some cases, these negative environmental impacts are seen as a trade-off resulted from changes in land use [24].
However, because land is a limited natural resource, many concerned parties throughout the world are advocating for better governance that promotes sustainable planning [2,25]. For this reason, studies focusing on understanding the spatiotemporal characteristics of built-up area expansion at different levels became a necessity for scientists, policy makers and urban planners.
Moreover, it is important to continue investigating this phenomenon due to the differences noted across Europe, where there is an obvious spatial heterogeneity owing to place-specific factors with their own historical and political contexts [26]. In this regard, from the morphological point of view, after decades of highly regulated planning, at the fall of the communist regime (1990), cities from former communist Central and Eastern European (CEE) countries were characterized by compactness [27,28,29,30]. In fact, several authors described these cities as denser and more compact compared to capitalist cities in Western Europe [31,32,33]. However, over the last 30 years, in the new political and socioeconomic reality generated by the radical shift toward a market-based economy, these cities and their surroundings have registered many structural changes in terms of their spatial pattern. The previously well-defined cities have gradually expanded outside of their boundaries through less regular, discontinuous development. In this context, post-socialist large cities registered a higher rate of urban expansion than their counterparts in Western Europe [28]. Despite the similarities between CEE countries, there are some differences between them in how they manage urban transformations, which could be explained by their national characteristics [34].
Bucharest is the largest post-socialist city in the European Union [35]. Its current spatial configuration is the outcome of systemic transformations registered over the last 70 years under different political systems. Thus, between 1945 and 1989, the communist regime applied a centralized planning policy, with massive industrialization as the engine of urban growth [36,37] which lead to an explosive increase in Bucharest’s population, more than doubling in size between 1948 (1,025,180 inhabitants) and 1992 (2,067,545 inhabitants). Meanwhile, planning rules [38] established a clearly articulated and stable limit of built-up areas [39,40], meaning that the expansion outside these boundaries was restricted. The state had a near-monopoly on urban development [41], resulting in settlements characterized by a high degree of compactness. The collapse of communism (1989) marked the beginning of a period of massive political, economic, social and institutional transformations, towards democracy and free-market economy. This led, gradually, to a process of urban expansion and the dissolution of the compact city into a more dispersed structure [40] through the spreading of new built-up areas. Another catalyst for this process was the availability of large tracts of agricultural land in the county surrounding Bucharest, Ilfov (with 70% of the county’s land area in 1990, according to the Romanian National Institute of Statistics, NIS).
However, land use incoherencies were due to inefficient urban planning legislation [42,43]. Thus, practical and enforceable planning strategies are necessary, and for that there is an urgent need for accurate and up-to-date knowledge about the spatiotemporal dynamics of land cover.
In the last years, many studies have shown that remote sensing technologies play an important role in investigating territorial changes associated with urban expansion over time [10,44,45,46]. They have a great potential to improve urban management and support the decision-making process [25,26] and aid in sustaining effective development plans [9,11,47,48]. Considering the fast-paced dynamic of built-up areas, using geospatial information may be crucial [49].
The Corine Land Cover (CLC) data coverage is a good starting point for studies of urban area mapping and urban expansion in Europe. It is the main background for well-known land products such as the Copernicus Urban Atlas (https://land.copernicus.eu/local/urban-atlas), with its three editions (2006, 2012 and 2018) and two urban area change layers. These mapping resources have an outstanding value for regional urban area modeling and analysis [50], while some spatial statistical parameters of urban sprawl in the framework of the EU financed SCATTER project [49] were derived from the same CLC-based dataset.
The overwhelming majority of the studies that analyze urban expansion in the CEE context focus on the overall features and the driving forces of the process in a qualitative perspective [29,51,52,53,54,55]. Despite their valuable findings, the results allow only a partial view of the magnitude of urban dynamics, without approaching land use/land cover changes. Few studies addressed quantitative assessments based on remote sensing technologies to investigate: the urban structural changes in Berlin and its outskirts [56], the growth of the urbanized land in the metropolitan region of Budapest and the main drivers of this process [57] and the urbanized landscape in the functional urban areas of Prague and Bratislava [58]. Another research analyzed large scale urban dynamics, comparing several cities in terms of post-socialist urban growth [59]. All four studies reveal the overall patterns of the built-up area expansion on the macro-scale level. The current research stands out through a more comprehensive perspective, based on a multi-territorial level approach with the purpose of finding the most reliable tool—CLC or Landsat—by comparing them with the ground truth.
Concerning Bucharest and its surrounding area, previous studies based their evaluation of the dynamics of built-up space on Landsat data [40,60,61,62] or identified land use patterns by using Corine Land Cover datasets [63,64]. The results of these studies show different statistics regarding land use/cover classes, due to the input data; however, a question remains regarding which of the two datasets is more accurate when it comes to built-up area analysis. To determine that, the current research proposes a more complex approach: comparing the Corine Land Cover and Landsat databases and then testing the accuracy of the results through a proper validation process based on field observations, Google Earth imagery and sample units. Previous studies also outline certain limitations in using either Landsat [9] or Corine Land Cover [2,65,66] datasets alone for mapping the expansion of built-up areas. In fact, to the best of our knowledge, generally, the current study is the first attempt to measure built-up area expansion by confronting these two datasets, both with each other and the ground truth, in several test areas.
While mapping urban expansion is still perceived as a challenge that implies different approaches and methods [67,68], the need for further investigation to ascertain the quality of data has been pointed out before [65]. Furthermore, studies focused on urban expansion in CEE context noted that the impact of urban growth on land use has been insufficiently addressed [57] and that there is a “critical need for a quantitative assessment of urban dynamics” [59]. The current paper contributes to filling these recognized gaps and responds to the call for more local studies in order to determine the utility of remote sensing technologies for regional sciences [69] and their potential applications to policy and planning.
Despite Bucharest being the largest city in CEE, studies that delve into issues related with urban expansion process in this region do not refer to the capital of Romania [29,70], sometimes only hinting to it [32]. The reason behind this seems to be the relatively recent studies on the subject of Bucharest (mainly after 2010), although in the last years there has been a distinguished upward trend. In this regard, one of the complementary purposes of this investigation is to contribute to filling this lacuna as a starting point for further comparative studies.
Against this background, this paper aims to assess the process of built-up area expansion through two freely available and widely used datasets, namely Corine Land Cover vector coverages and supervised classification of Landsat satellite images, with the goal of finding the most suitable approach for this type of analysis. Focusing on the capital city, Bucharest, and the surrounding Ilfov County, our study followed three stages: (1) mapping the built-up area pattern for two temporal references: 1990 and 2018, based on both Landsat and CLC datasets; (2) analyzing the built-up area change within the post-communist temporal frame of 28 years (1990–2018); and (3) assessing the results comparing the datasets with each other, as well as with the ground truth, in order to identify the most accurate and cost-effective tool for built-up area pattern mapping and dynamics analysis. The datasets used in this study were generated from satellite remote sensing data at medium spatial resolution through two different methods: a visual interpretation approach based mainly on Landsat imagery resulting in the CLC datasets and a fully automatic processing workflow of Landsat images to derive the built-up area’s land cover class.
Our contribution emphasizes strengths and limitations of the use of each dataset both for the entire study area and at the territorial administrative unit level. This can be a potentially useful tool for policy-makers and local authorities to assess applied urban plans and to formulate effective regulations, contributing to sustainable land use management.

2. Materials and Methods
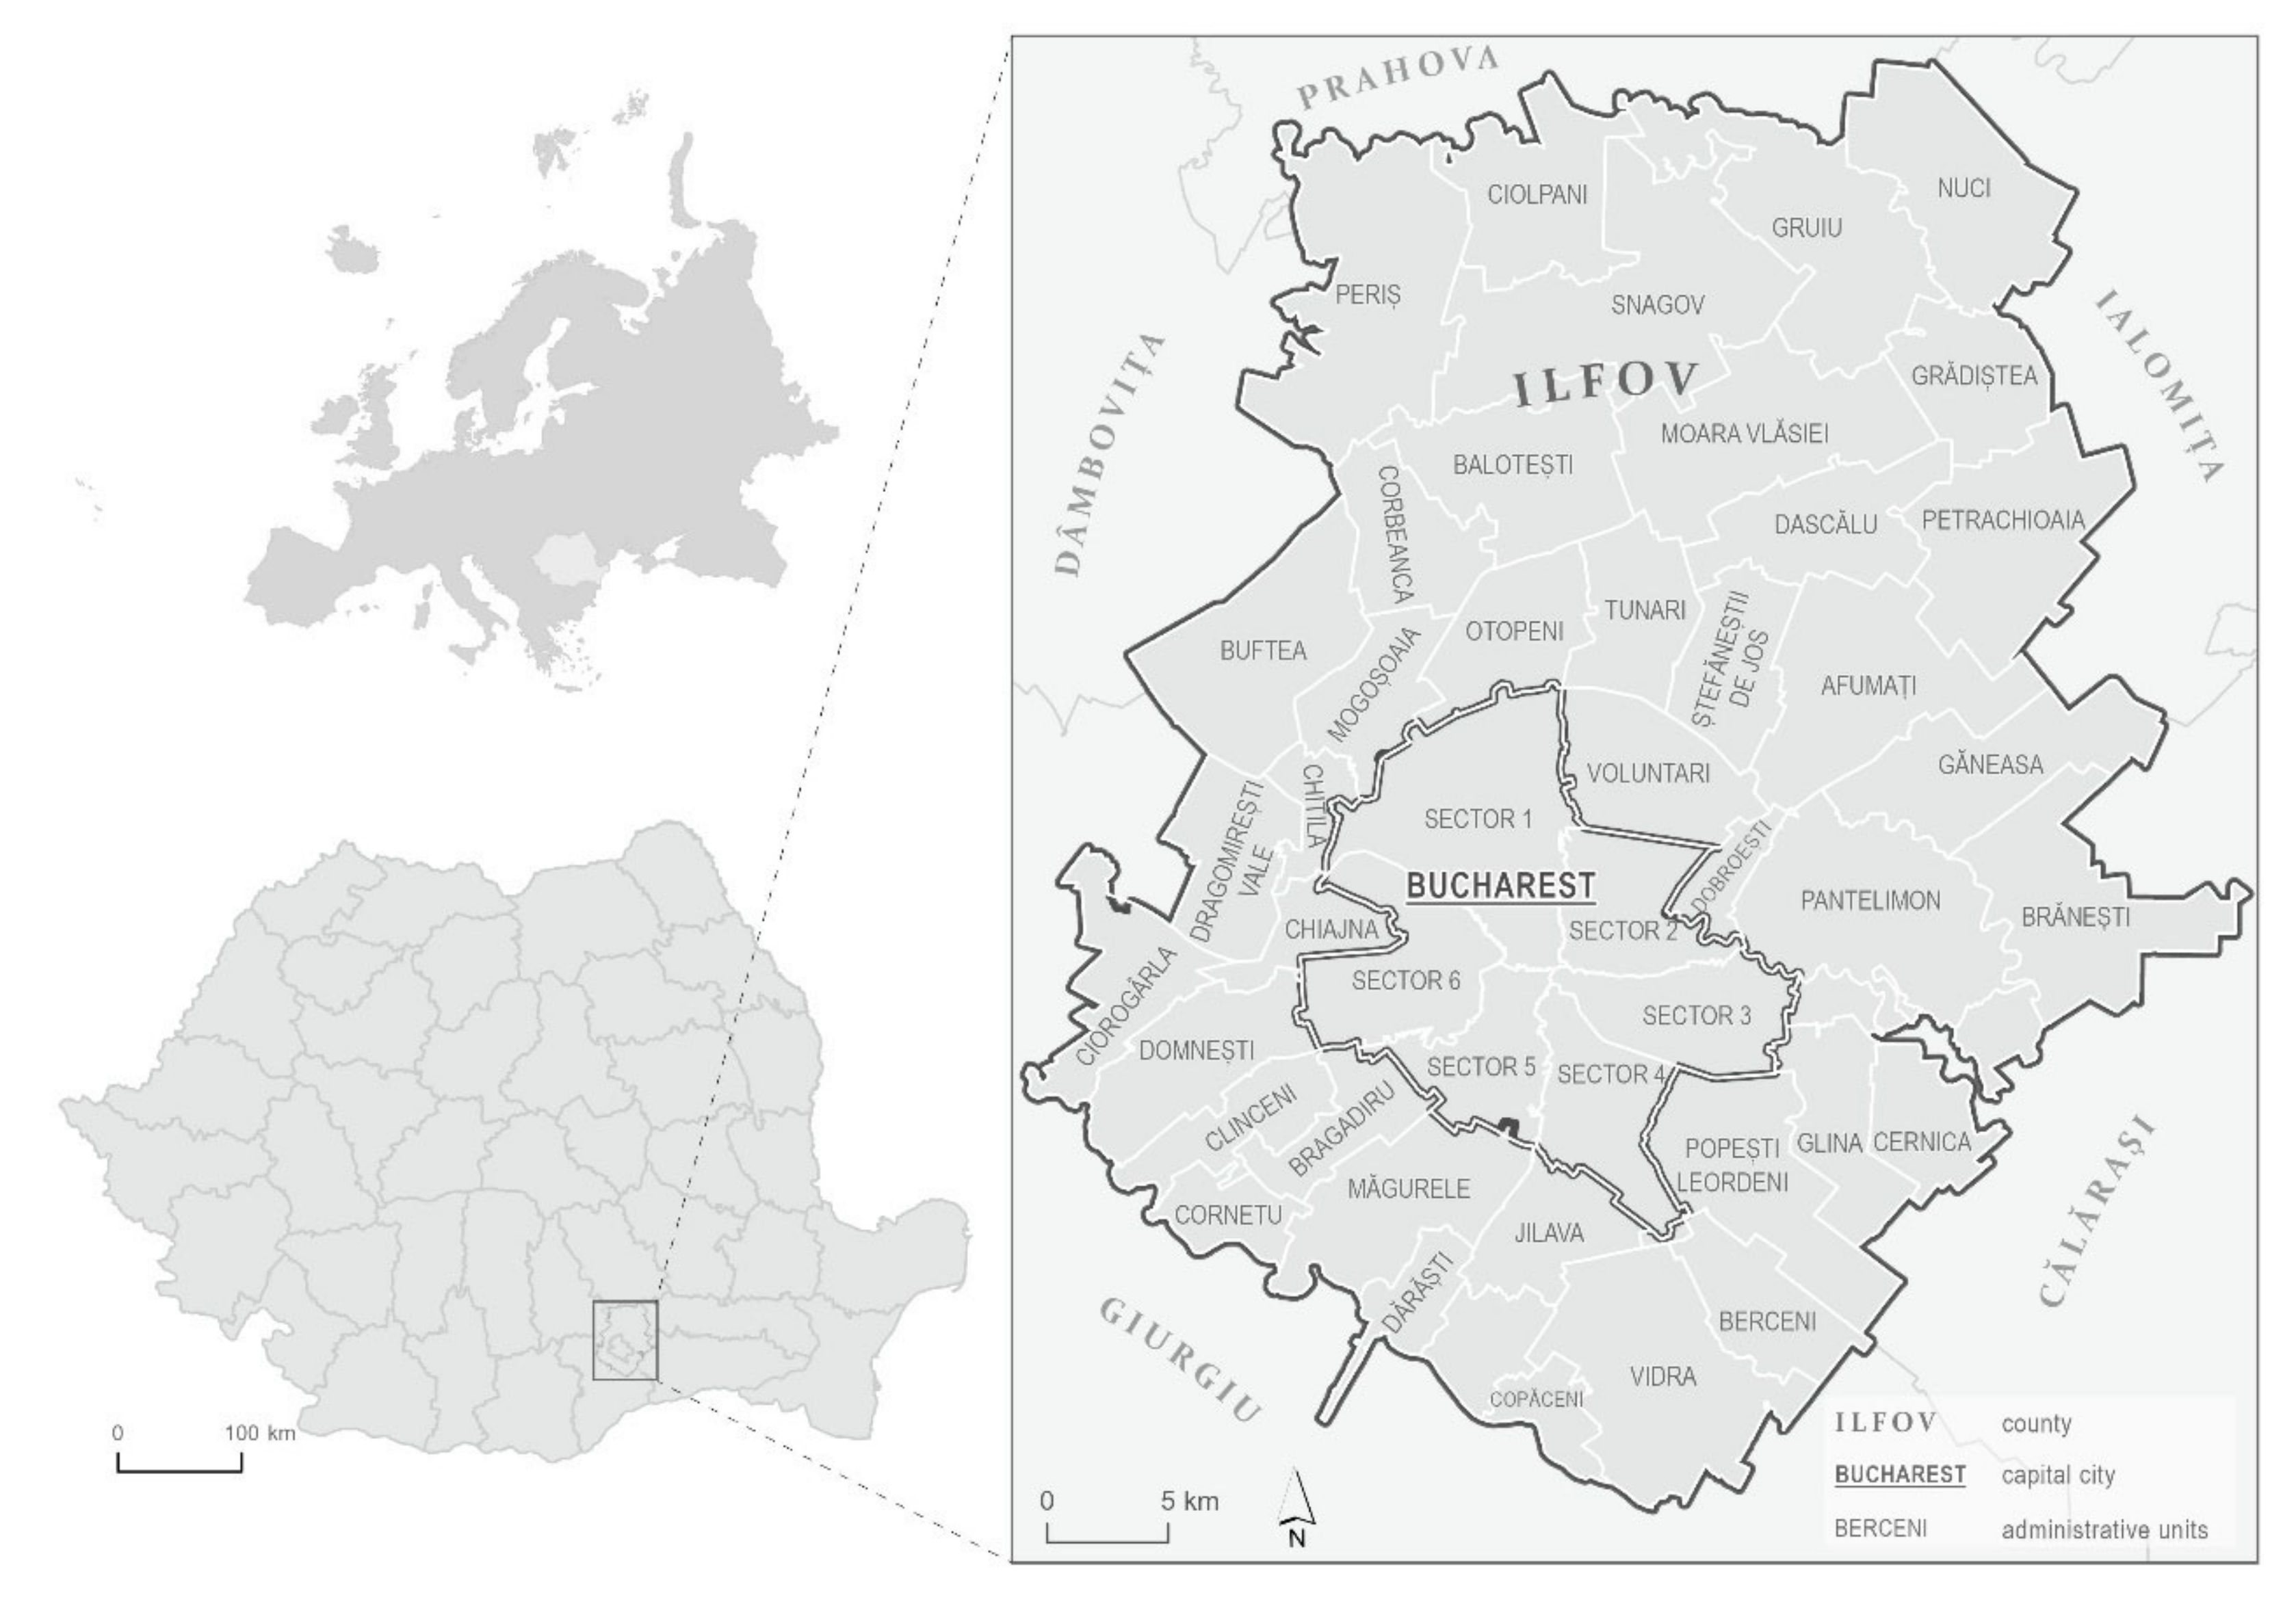
2.1. Study Area

The study focused on Bucharest and the neighboring Ilfov County, as shown in Figure 1. They are located on a plain area in the Southern part of Romania. Bucharest registers a population of 2,121,794 inhabitants (2018), covering a total area of 237.87 km2 [71]. It is the largest city and the main economic center in Romania, and it has undergone multiple socioeconomic transformations over the last decades. The adjoined Ilfov County has a population of 429,946 inhabitants and a total area of 1583.3 km2 [71]. The capital city accounts for 9.6% of the country’s population, and together with Ilfov County they make up 11.5%. However, the real number of people living in this area is actually much higher, considering that it is not mandatory to officially register changes in place of residence.
In terms of population dynamics, between 1992 and 2018, the area’s inhabitant number increased by a mere 3.4%. However, these data are comprised of a net differentiation between Ilfov County, with a whopping 55% growth in its population, compared to Bucharest, whose population apparently (at least officially) shrank by 3.2%, suggesting people’s tendency to move outside the city limits. In this regard, an analysis focused on the population dynamics in the predominantly urban regions in the EU-28, between 2004 and 2014, showed that Ilfov registered the highest growth rate [72]. Even though the numbers of newcomers are far from spectacular compared to other EU regions, numerous land use/land cover changes took place, such as a significant increase in built-up area, reconversion of industrial sites, fragmentation and shrinkage of agricultural land, deforestation, etc. Historically, Ilfov had a strong agricultural profile with compact settlements. After the fall of communism, the significance of agricultural activities gradually decreased, and instead many companies relocated there. In addition, new residential areas, significant in size, have been established in Ilfov to keep up with demand. As a result, this area has become the Bucharest commuter belt, with daily commuter flows and traffic jams.
Regarding population density, there are notable differences between the city of Bucharest and Ilfov County. The average in Bucharest–Ilfov is 1401 inhabitants/km2, but Bucharest itself is characterized by a very high concentration: 8920 inhabitants/km2 for 2018. The capital city is one of the most densely populated cities in Europe, with thousands of people living in large housing estates [73,74,75]—a legacy of socialist planning [40]. Meanwhile, in Ilfov County, population density is only 272 inhabitants/km2, expressing a rather dispersed, low density development, although still much higher than the national average (93 inhabitants/km2) [71].
Bucharest–Ilfov is the wealthiest region in the country and the main attractor of foreign direct investment [76,77]; in 2018, it concentrated 60.7% of the country’s total inflow [78]. On the background of this high level of economic performance, newcomers are attracted by the Bucharest–Ilfov Region for job opportunities, in stark contrast to much poorer neighboring regions [79].
As a consequence of the increasing population pressure over the land and its resources, this area faces many challenges posed by the demand for infrastructure, basic services, transport, solutions for environmental issues, etc. This trend is expected to continue as it is throughout the EU, where Ilfov is ranked sixth on the list of predominantly urban regions with the fastest projected rate of population growth in the period of 2015-2050 [72]. At the administrative level, Ilfov County includes 8 towns and 32 communes, with the county seat located in Bucharest. The capital city itself is divided into six sectors. The lack of coordination between the authorities in this region is one of the contributing factors to its uncontrolled urban development, even described as chaotic urban expansion [80,81,82].

2.2. Data Types and Data Sources

Our analysis integrates two independent data coverages for the entire Bucharest–Ilfov Region: a multidate Landsat imagery dataset and the corresponding CLC datasets (Table 1). All of them are subjected to calibration and validation in order to evaluate the accuracies of the built-up area’s detailed mapping over the size of the MMU (Minimum Mapping Unit), which in CLC data is 25.0 ha [83]. It is possible to map all built-up features in detail and to connect this geospatial information with strategies and planning processes at local and regional levels (e.g., general urban plans and county level master-plans).
The oldest satellite images (Landsat 5 TM) are from 1990, which was when the Bucharest–Ilfov Region began its transformation. It shows limited development of the built-up area right after the fall of the communist regime. At the time, agricultural landscape was dominant, which introduced difficulties in image classification. Another issue is the similarities between some bare ground areas in Bucharest’s built-up area and agricultural used ground during spring or autumn, in places where big socialist developments occurred after 1984—namely the city center along the Dâmbovița River, around the present-day House of Parliament [60,84]. This is why the built-up areas are classified using six-band multispectral Landsat data from different seasons.
The most recent satellite image set, from 2018, was classified in a similar formula, using a five multispectral and multidate stack from the Landsat 8 OLI (Operational Land Imager) sensor. This reveals the reconfiguration of the urban pattern inside Bucharest and the city’s urban expansion, with compact and dispersed developments: houses, farms, commercial and industrial areas, as well as a motorway and a new configuration of Romania’s main international airport in the town of Otopeni (Ilfov County).
Although both images have similar spatial and spectral resolution in reflective band intervals (according to USGS Landsat Project data, https://www.usgs.gov/land-resources/nli/landsat), there is a difference between them in terms of radiometric resolution (from 8- to 16-bit pixel depth). This is a step forward, as explained in the literature [85,86], but it called for a special limitation when using the same training areas for supervised classification. In this respect, it was necessary to separately train the classification on multidate images that covered three seasons, including winter, and to test different algorithms [87,88].
The Corine Land Cover polygon coverages from 1990 and 2018 consist of an inventory of land cover in 44 classes, produced by the majority of European countries through visual interpretation of Landsat and Sentinel multispectral satellite imagery at a minimum mapping unit (MMU) of 25 ha. The CLC datasets are based on three levels. In this study, the artificial surfaces class was used, which is part of Level 1 classification schema, along with agricultural areas, forest and semi-natural areas, wetlands and water bodies. Artificial surfaces class includes four sub-categories of land cover classes (Level 2): urban fabric; industrial, commercial and transport units; mine, dump and construction site; and artificial non-agricultural vegetated areas. According to the latest approach [89], Romania has a high diversity of CLC land cover classes compared to other countries (38 out of 44). For CLC 2018, there is a country level layer available, together with distinct derived data products integrated within the Riparian Zones, the Urban Atlas and Natura 2000 sites vector coverages.

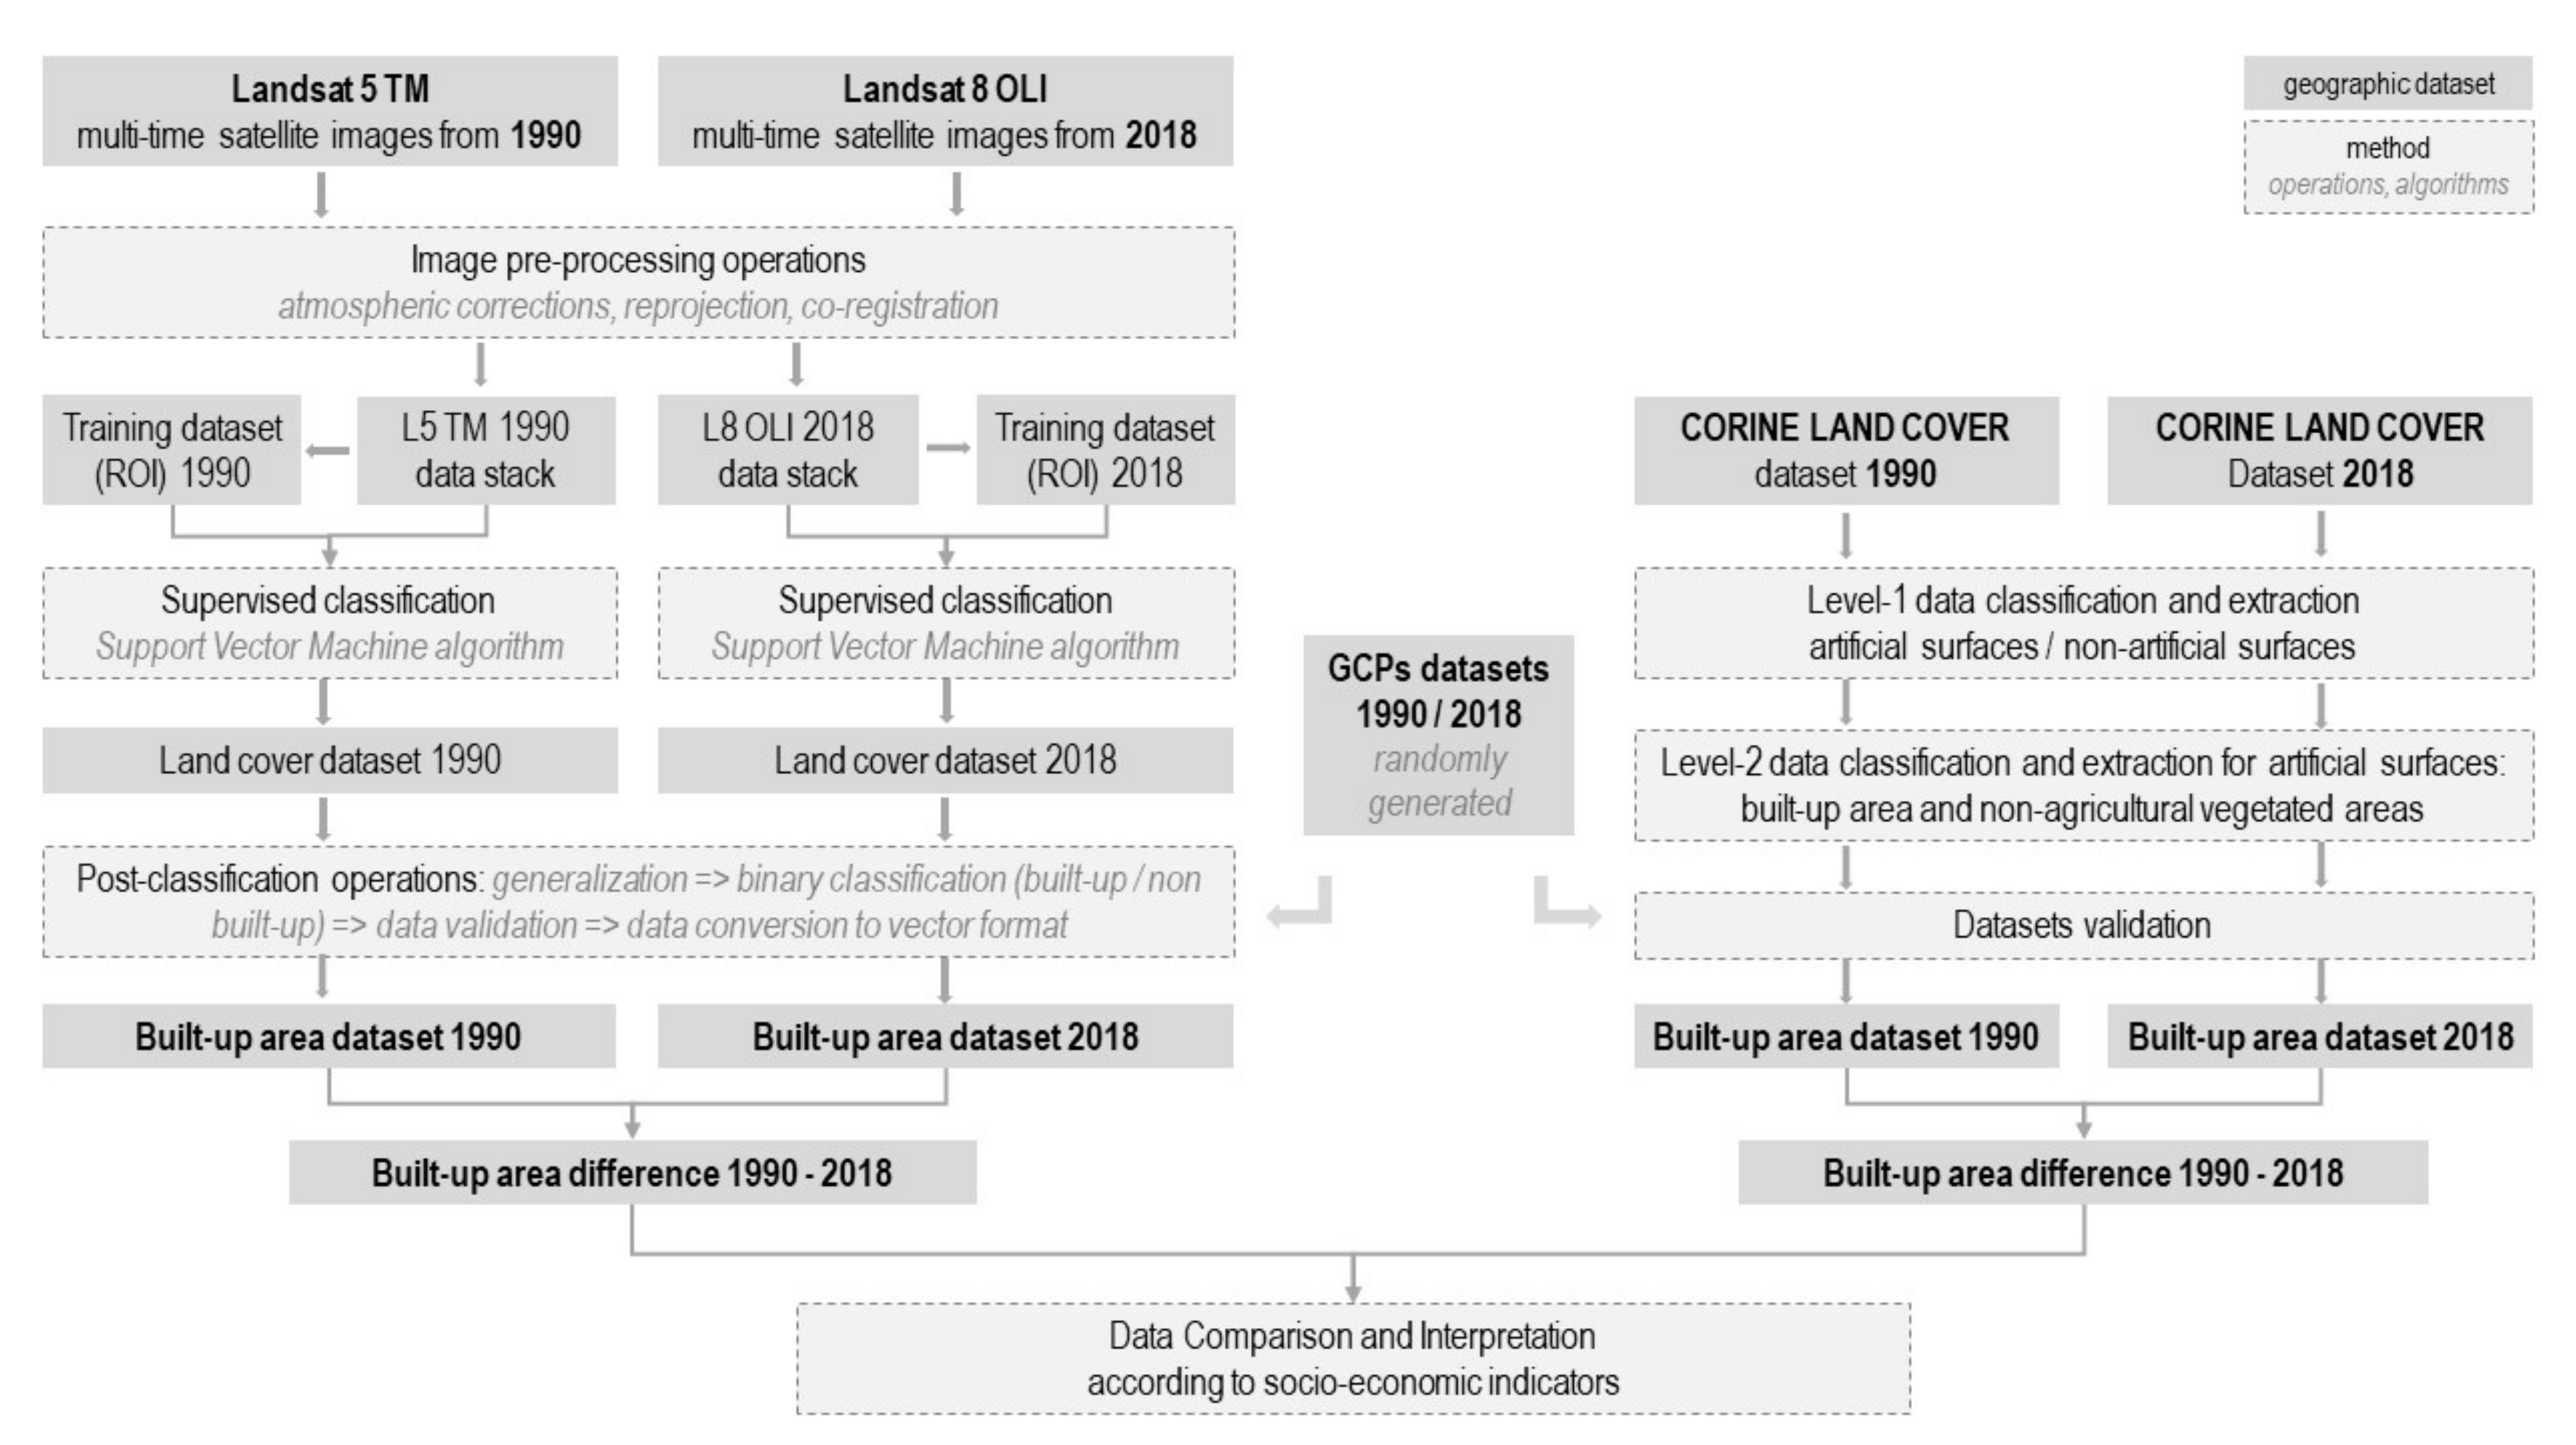
2.3. Data Processing, Analysis and Validation Methods

Figure 2 provides a detailed flowchart of the analysis. This is separated into two sequences: one focuses on Landsat image processing and classification and the other is based on the preparation and integration of the CLC data. Both are adapted to the temporal resolution.
Landsat TM (Thematic Mapper) and OLI image processing is a key part of the analysis. Thematic classification results for both reference times are used to evaluate the spatial accuracy of the corresponding Corine Land Cover standard vector coverages. This is focused only on the built-up area’s subsequent classes (compact and discontinuous), which record the most significant transformation, while other classes such as forests and water (lakes and rivers) did not change very much [60].
Classification of built-up areas was a complex task because the intention was to adapt the result to the CLC data standard or legend (https://land.copernicus.eu/pan-european/corine-land-cover/clc2018), corresponding to class one named artificial surfaces. This means that the investigation of built-up area expansion needs to integrate not only residential buildings but also other types of developments such as compact artificial surfaces such us commercial centers, airports, parking lots and warehouses. These landscape features cannot be classified from a pair of Landsat images for the reference dates, because, in summer/autumn images, the spectral discrimination is not statistically significant: with the local reddish-brown soil, they provide spectral signatures for artificial-surface that are nearly identical to those of bare ground. To compensate for this, we integrated more scenes in our data processing chain, as mentioned in Table 1, adapting two different training datasets for each of the image stacks from 1990 and 2018.
Support Vector Machine (SVM) image classification algorithm [90] proves to be the most efficient in the context of greatly diverse features of built-up areas on the background of a landscape that changes throughout the year (agriculture and forest landscapes). This was already tested by Rujoiu-Mare et al. [88] in Subcarpathian hills with encouraging results for particular classes, including discontinuous built-up areas. Training of classifications is based on visual interpretation of all imagery, integrated with field observation (for 2018 data) as well as orthophotos [91]. To train classifications, Landsat TM imagery from 1990 was also interpreted using visual analysis criteria [92] and cartographic data sources such as 1:25000 topographic maps [93].
The classification outputs for 1990 and 2018 were the subject of the post classification data processing, taking into account potential errors, such as isolated features that were wrongly classified as built-up area. Moreover, both classified rasters were the subject of cartographic generalization through GIS (Geographic Information System) tools, to make them comparable with the CLC’s MMU of 25 ha.
Corine Land Cover data configuration followed a similar scheme, but it was adapted to data semantic features and technical parameters (vector data instead of spectral data from imagery). GIS data analysis through a two-level data query allowed the production of the reference layers for 1990 and 2018. The extracted polygons feature artificial surfaces (Level-1), including built-up areas and non-agricultural vegetated area class, which were not taken into consideration because they can define an entire buffer zone of potential development in the context of the urban expansion process.
In the second phase of the analysis, the final binary encoded layers were evaluated by a set of 300 random point sample validation, selected according to the reference literature [94,95,96]. The confusion matrices were the result of crossing the binary datasets with the point related attributes collected by visual interpretation of the Landsat imagery and orthophotos (2017).
The evaluation of the obtained maps charting the change in the built-up area was the subject of a qualitative analysis of the data coverages at different scales, from the entire study area (Bucharest–Ilfov) to local entities of different sizes and complementary functional features. These entities make up the selection of case studies (test areas) illustrating some of the greatest differences between the datasets in order to test their potential to be used in monitoring built-up area expansion. To get a better perspective, they were also compared with topographic maps (1980) and orthophotos (0.5 m resolution). Additionally, for more insights into the results, field observations were made at some points.

3. Results

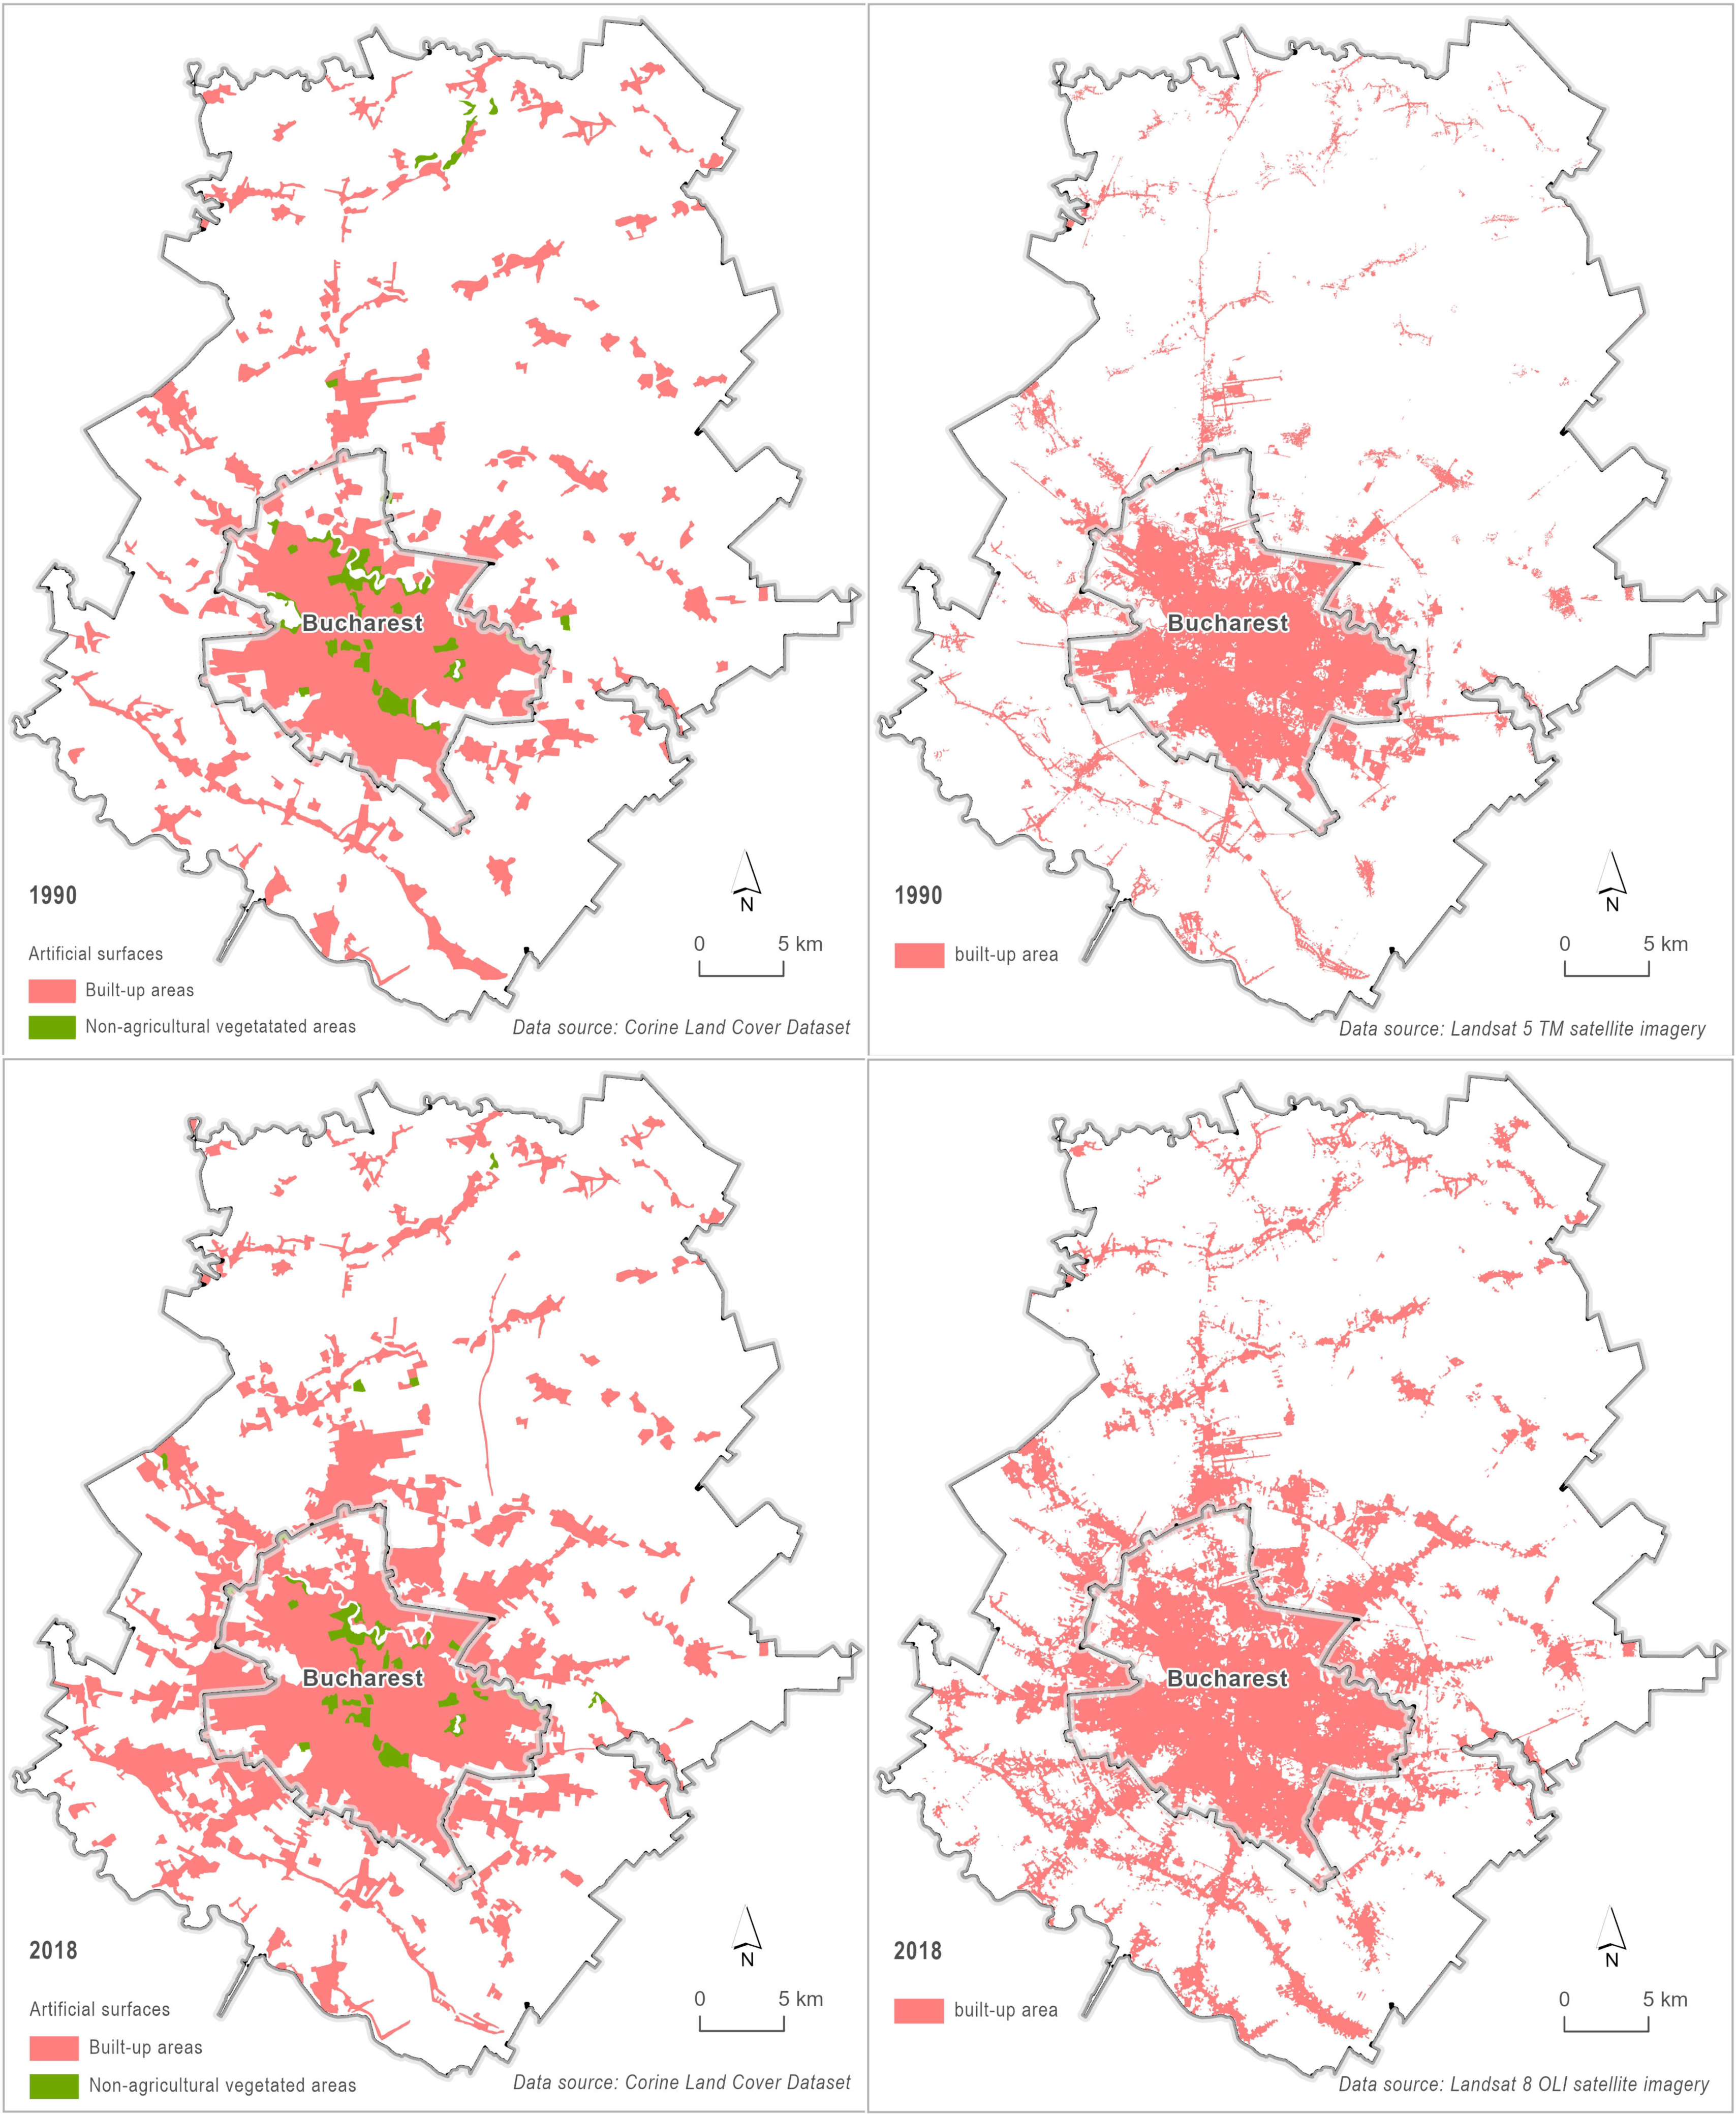
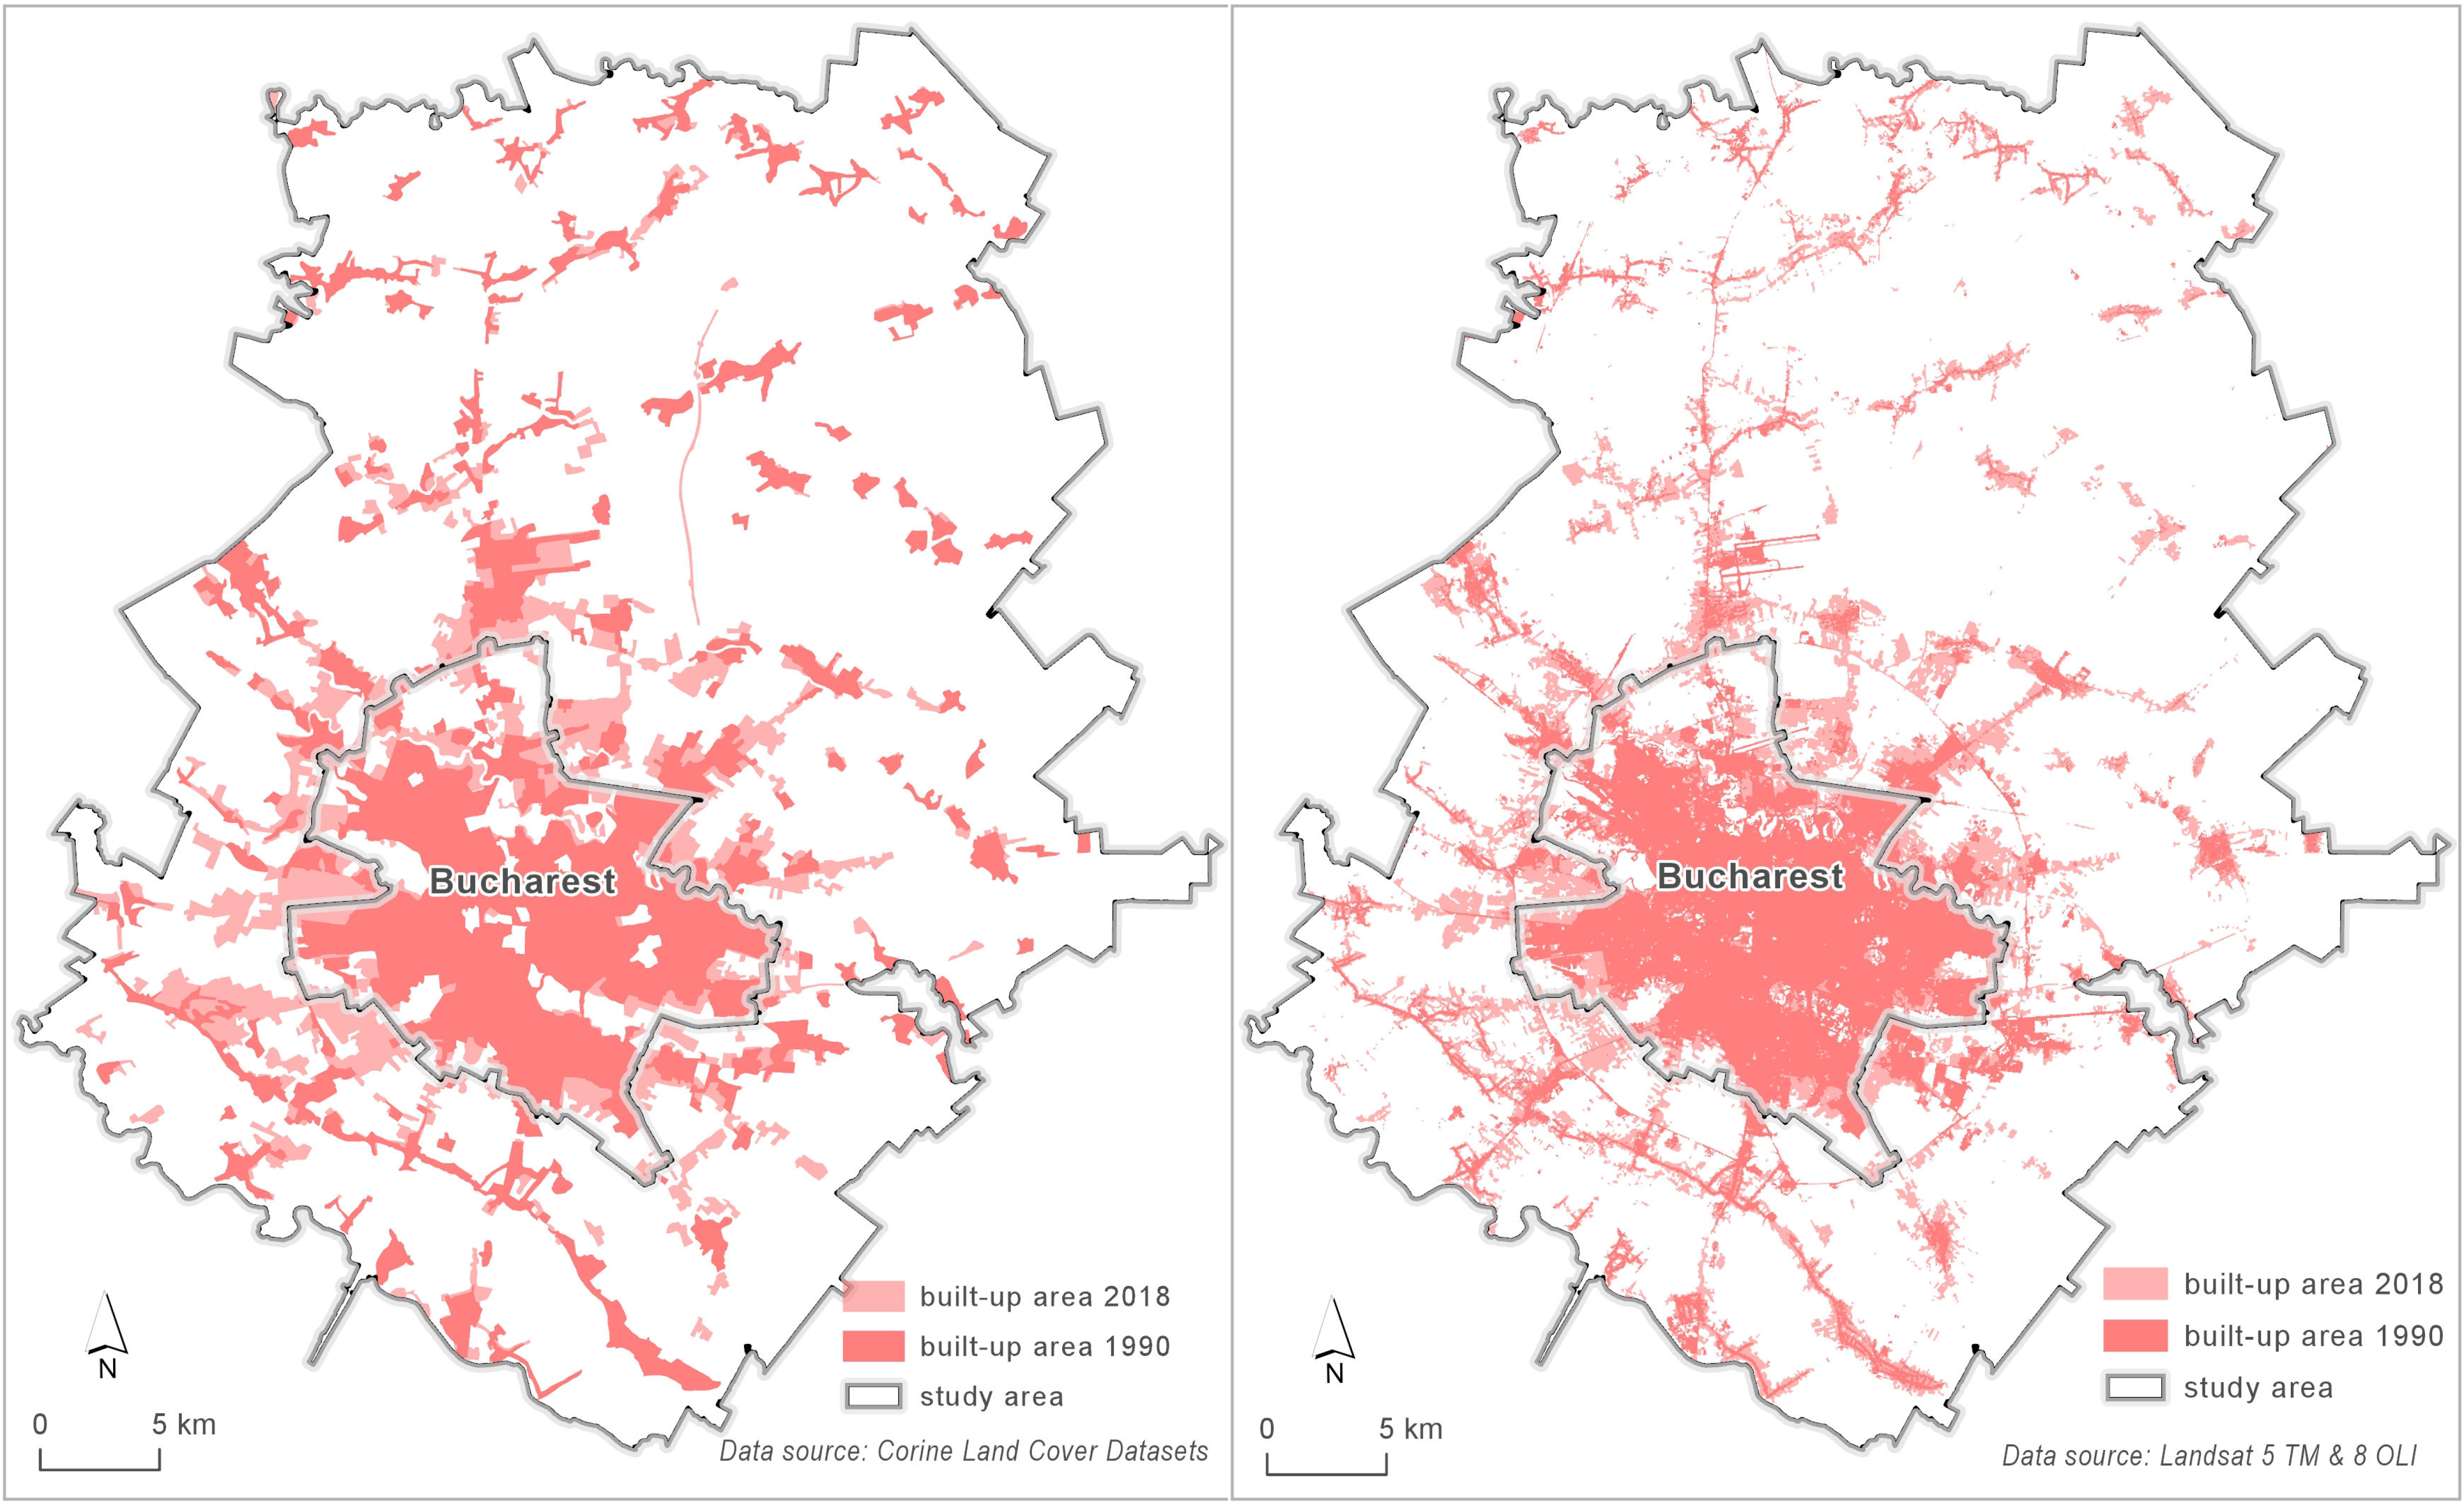
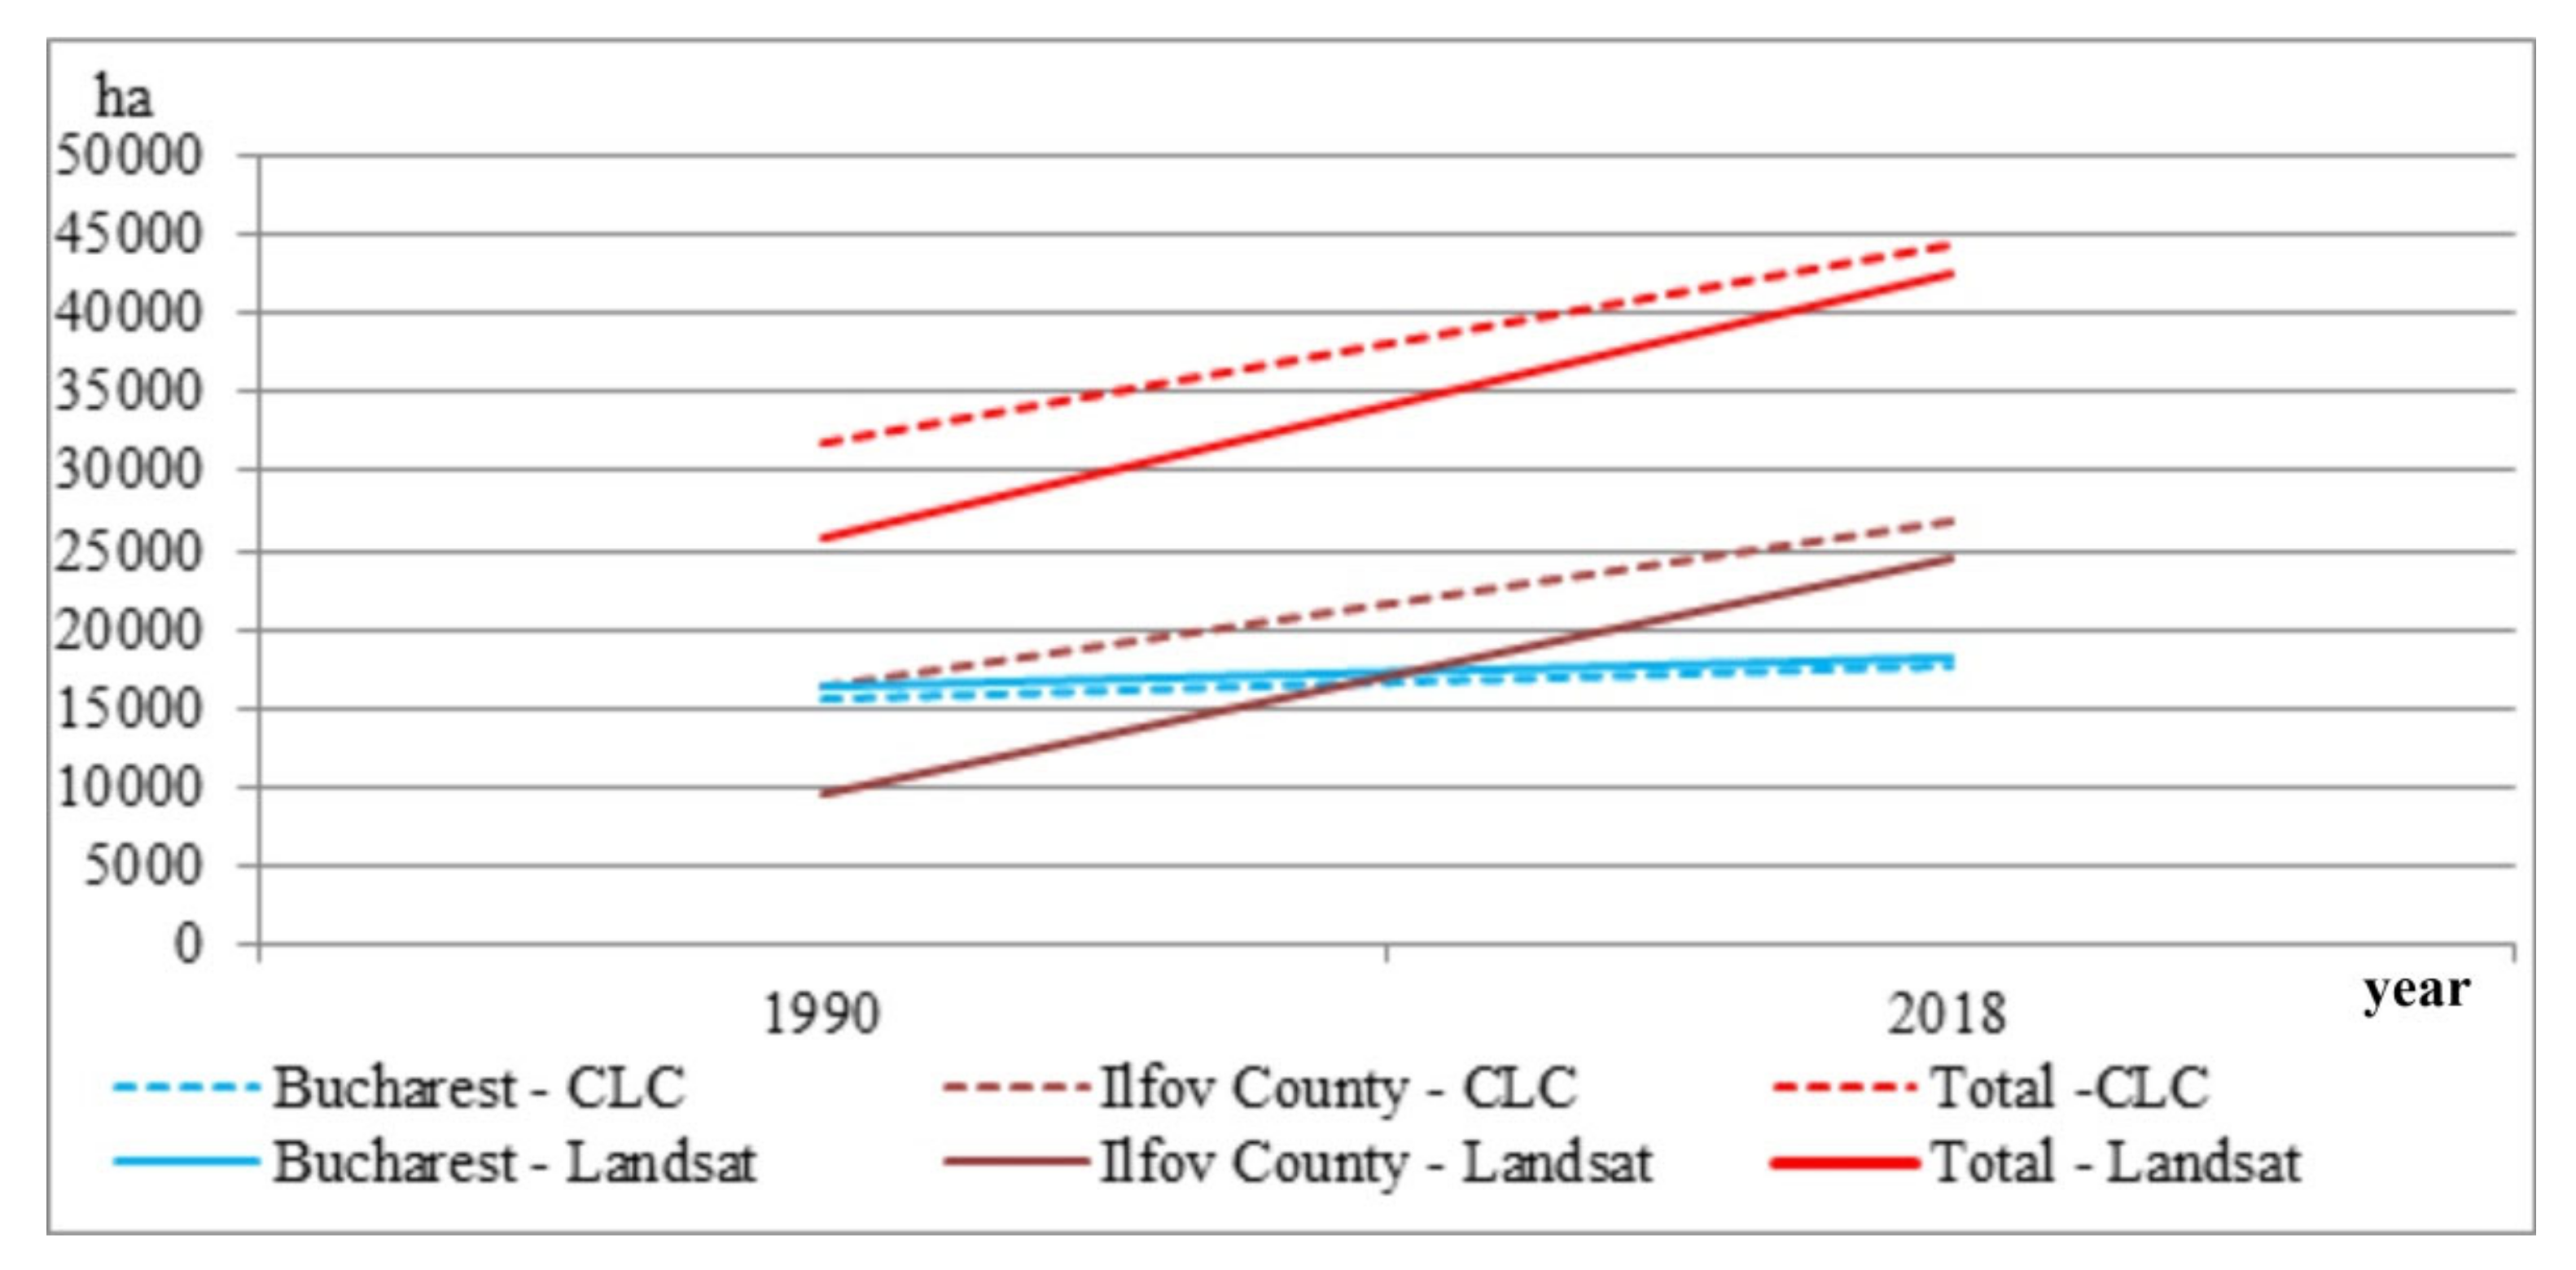
3.1. Critical Discrepancies between Corine Land Cover and Landsat Datasets at the Macro-Level

The built-up area configuration based on Corine Land Cover and Landsat datasets for both 1990 and 2018 are presented in the Figure 3.
The maps for 1990 illustrate a very compact and dense built-up area structure inside Bucharest. This pattern also features Ilfov County, but at a smaller scale, in some villages and towns that have well-established boundaries. Built-up area statistics reveal that more than 60% of Bucharest’s territory is occupied by this category: 64% in CLC datasets and 68% in the Landsat classification map. Otherwise, for Ilfov County, the value is much lower (11% in CLC and 6% in Landsat).
In 2018, after almost three decades of democracy and free market economy, both maps indicated an expansion of built-up areas, much more pronounced at the edge of Bucharest, but even more so outside its boundaries, in Ilfov County.
Clearly, the spreading process was not perfectly circular, but branched out in certain directions more than others, which was more obvious in Landsat imagery. That said, a distinct development axis on the southwest side, in a west–south linear configuration, can be identified in Ilfov County. This axis is visible on both maps.
Statistically, the built-up area coverage is more than 70% in the city of Bucharest, with some differences between the CLC dataset (73%) and the Landsat classification (76%). In Ilfov County, the differences between the datasets are lower: 17% in CLC and 16% in Landsat classification.
When comparing the maps from both datasets, there is an obvious contrast regarding the shape of the settlements, which appear more geometrical in the CLC version, especially in Ilfov County.
The built-up area dynamic between 1990 and 2018 (Figure 4) illustrates the spatiotemporal pattern of urban expansion, which occurred mainly around built-up areas that were already established. However, in some places, there is a visible densification process. For the entire study region, there was a noticeable increase in land occupied by built-up areas, 7% in CLC and 9% in Landsat classification, with a slight variation between the Bucharest area (9% in CLC and 8% in Landsat classification) and Ilfov County area (6% in CLC and 10% in Landsat classification).
Table 2 illustrates the main characteristics of the built-up area surfaces, for both the 1990 and the 2018 time references and by each analyzed dataset, as well as the major changes that have occurred in a span of 28 years.
Regarding Bucharest, for 1990, the Landsat classification shows a built-up surface that is over 800 ha bigger than its CLC counterpart. In turn, Ilfov County features an even greater discrepancy between the two datasets regarding the surface of the built-up area in 1990, totaling 6834.59 ha: the Landsat classification indicates 9586.14 ha of built-up area, while in CLC there are 16,420.73 ha. This discrepancy persists in the 2018 datasets, but at a much lower rate.
In terms of changes between the two reference years, Ilfov County registered a higher discrepancy of 4573.41 ha, with a total built-up area change value higher in Landsat classification than in CLC dataset. For Bucharest, the situation is opposite, with the Landsat classification dataset showing a slight decrease of over 300 ha compared to the CLC dataset.
The overall dynamics of the built-up area between 1990 and 2018 on both datasets demonstrates an upward trend, more pronounced for Ilfov County (Figure 5).

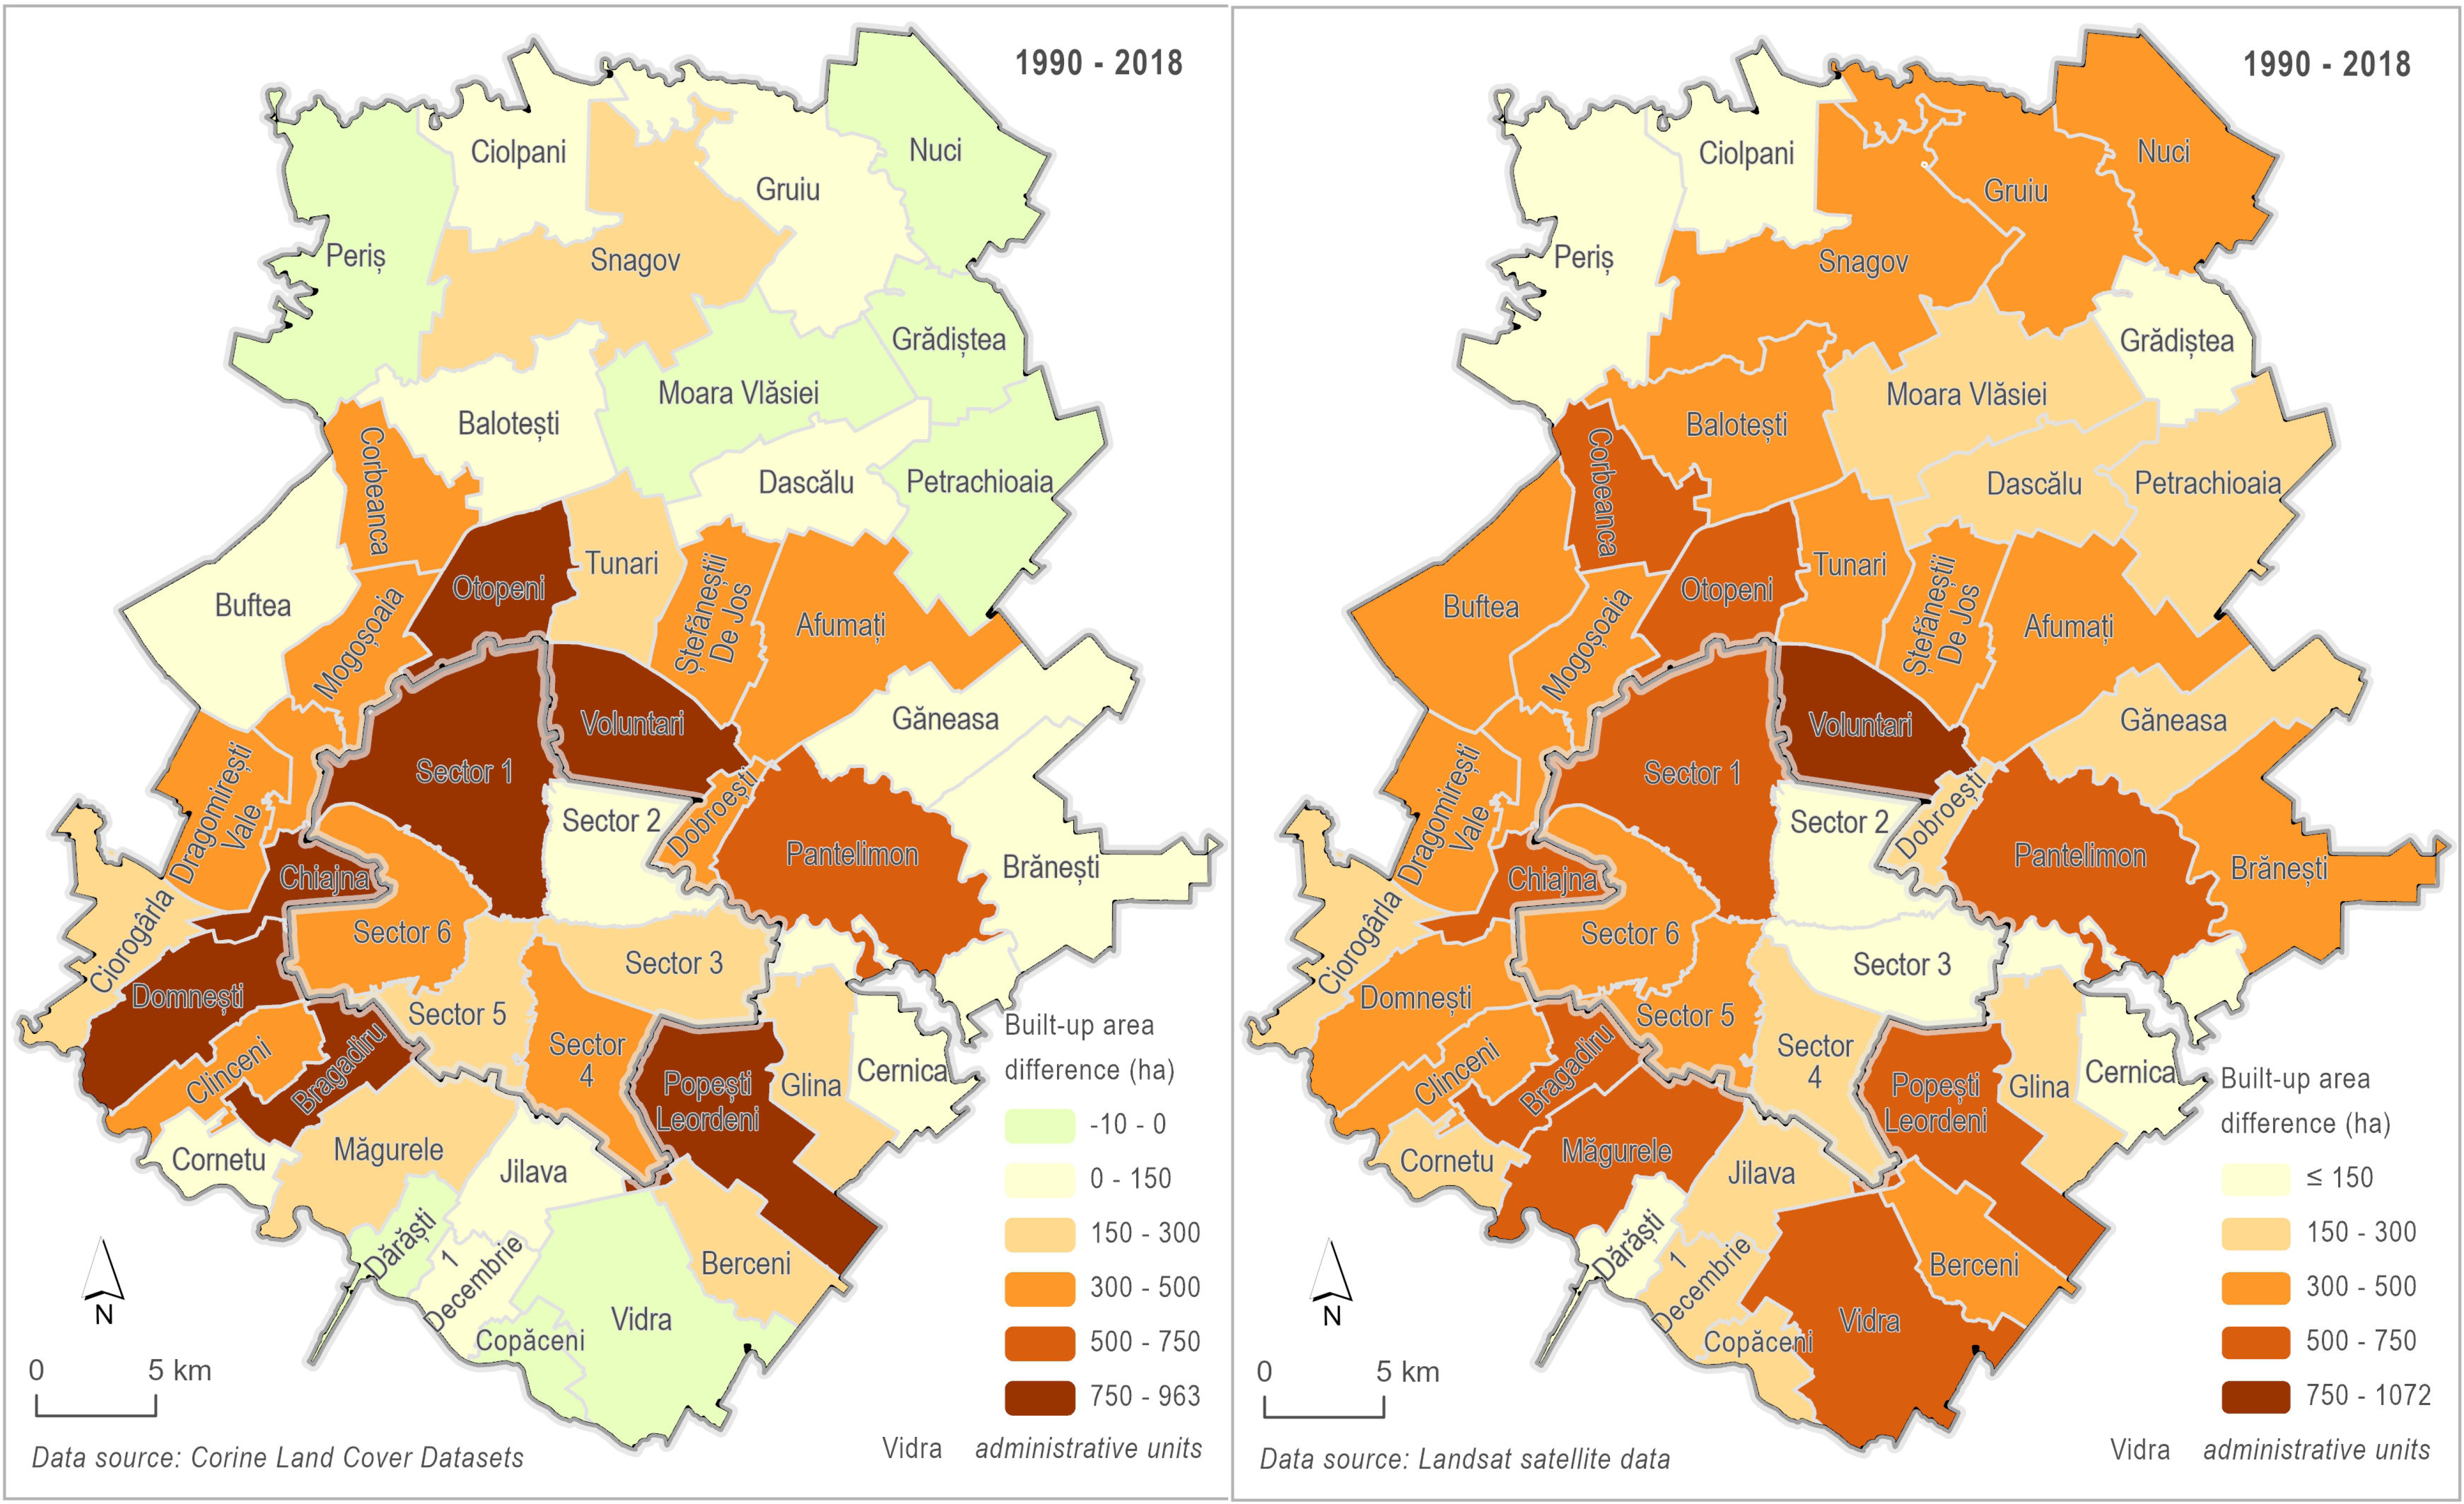
3.2. Spatiotemporal Discrepancies at the Territorial-Administrative Unit’s Level

Expanding the analysis to the administrative unit’s level is relevant, considering urban practitioners’ necessity of land use/land cover data for supporting sustainable planning strategies and the decision-making process on a smaller, local scale. In this regard, the comparative approach between both datasets in territorial administrative units in the Bucharest–Ilfov Region helps to better understand their spatial discrepancies. Thereby, in the CLC map, eight communes in the southern and northern parts of the study area present a decrease in their built-up area, while the Landsat classification map does not confirm this pattern (Figure 6).
Moreover, in 74% of administrative units, the Landsat classification indicates bigger values of change in built-up areas than CLC, while the remaining 26% present an opposite trend. Looking at Bucharest alone, three of the administrative sectors (2, 5 and 6) are in the first situation, whereas the rest correspond to the latter.
However, it generally seems that the expansion process of the built-up area denotes a higher amplitude on Landsat classification maps, while on CLC derived maps it appears more concentrated. In the second case, the administrative units are mainly located in the surroundings of the capital (except some areas, mainly in the southern part) and half of Bucharest’s urban sectors. Furthermore, most of the analyzed units (61%) feature an increase in built-up areas, more than 300 ha in Landsat classification data, whereas in CLC datasets, only 39% fit in this category.
The ranking established for each of the two datasets indicates the highest degree of urban expansion in the same three units located on the northern and western side, in Voluntari, Chiajna and Otopeni.
The largest discrepancy is recorded in the Vidra commune, in the south of Ilfov County, with a variation of 735.8 ha between CLC and Landsat datasets: in the former classification, the surface decreased by 235.4 ha, while, in the latter, it increased by 500.4 ha.
Other similar contradictions between these datasets, of more than 300 ha, are featured in some communes located in the northern and northeastern parts (Nuci, Moara Vlăsiei, Gruiu and Petrăchioaia), as well as in the town of Măgurele and the Domnești commune in the south. Conversely, the smallest discrepancies were identified for Mogoșoaia (3.6 ha) and Glina (8.2 ha).

4. Discussion

4.1. The Magnitude of Built-Up Area Expansion

The study focused on built-up area analysis for the Bucharest–Ilfov Region in the last 28 years (1990-2018), using both Landsat and CLC datasets. The results, despite the identified discrepancies, denote uncontained development beyond the clearly defined boundaries of the settlements for 1990, leading to multiple changes in their spatial pattern.
Among the most important driving forces that led to the restructuring of land use and urban expansion after the fall of communism are: (a) the abrogation of the restrictive planning legislation [38], which was not immediately replaced by a new planning system; (b) the restitution of land from the state (publicly owned) to its previous owners and, as a result, liberalization of the land market; (c) the privatization of state assets, including housing; (d) harsh deindustrialization and development of new tertiary sector activities; and (e) administrative decentralization of decision-making and empowerment of the local authorities.
Our findings reveal that the most significant transformations occurred in Ilfov County, featuring a more intense development of built-up areas compared to Bucharest. This can be explained by the population’s and real estate developers’ preference for the capital city’s surrounding area, but also the investors’ choice to establish new businesses in Ilfov County. The main reason for this decision was the availability and lower prices of land compared to Bucharest [97]. As a result, many residential zones have been developed, as well as industrial units, warehouses and commercial facilities [60,98]. In terms of the spatial pattern of the built-up areas, there is a noticeable tendency to develop along the ring road and main transportation routes in a radial configuration. In this regard, previous findings indicate that the urban growth initially expanded mainly to the north [99,100], and only recently there has been significant expansion to the south.
Regarding the general structure, there is a discrepancy caused by an axis of development on the southwest side of the Ilfov County, almost continuous between the settlements in a west–south direction. Some of the villages and towns located in the first ring of settlements around Bucharest were found more attractive, which was confirmed in previous research as well [40,82]. Moreover, this territorial layout was considered favorable because of its access to the capital city [62,101].
Generally, the newly built-up areas were developed through conversion of green field land or past industrial sites. The latter is related to the massive deindustrialization process, especially in Bucharest, which led to the closure of many factories and the demolishment of some of them, leaving bare land. These surfaces were used for redevelopments, predominantly for residential and commercial purposes. Thus, we can assume that these former industrial zones limited the land consumption for new constructions. Additionally, the reduction of the territorial footprint was possible in some places because of the demolitions of some unfinished communist projects [40,42,81], which allowed the re-use of the vacant land. Apart from these redevelopments, in Bucharest, the intra-urban pattern was changed by significant built-up area extensions through the conversion of agricultural land, mainly in the outlying part of the city. A recent example of this is the 50 ha of greenhouses transformed into apartment buildings in the southern part of the city. Another more recent trend is the densification process, with the emergence of new apartment buildings in the middle of large communist housing estates in several parts of the capital. However, overall, planning policies tend to prioritize urban expansion despite intra-urban densification [102].
However, the main challenge of post-communist spatial restructuring is the uncontrolled development of built-up areas in the absence of enforceable urban planning regulations. In this regard, one of the main issues is the lack of an integrated, coherent plan of development comprising the entire Bucharest–Ilfov Region. Meanwhile, the legislation stipulates that each administrative unit must hold its own general urban plan to regulate the main directions of growth.
Nowadays, unfortunately, most of these plans are not updated, expired and repeatedly extended. For instance, Bucharest’s local master plan (General Urban Plan) is out of date, having been enforced since 2000. This planning instrument was prolonged several times, even though its revision began in 2013 and has never been completed. In the meantime, a new provision extended it until the enforcement of the new updated version [103], meaning indefinitely. The main problem is that the expansion of the built-up area is done in patches with no common vision on the local or regional level. In this context, several authors labeled the absence of coherent planning and the uncertainty concerning future development as dysfunctional urbanism [42,104]. This leads to additional environmental problems reflected in the aggression exerted over the local natural resources, including in protected areas (e.g., Snagov Lake and Snagov Forest). Moreover, the increasing human pressure and the deficient management of the available land triggered spatial land use conflicts [42,80,105,106,107,108] and improper waste management [109].
Maintaining the same trajectory is even more alarming, considering the low share of built-up land in Ilfov County (17% according to CLC and 16% according to Landsat), as well as the assumption that the remaining surfaces can be used for further development. Hence, to mitigate the chaotic urban expansion prevalent nowadays, there is an urgent need for more strictly enforced regulation. Moreover, the current plans for the extension of the metro network towards the edge of the city will most likely amplify human pressure over these areas and speed up the appearance of new construction sites. In this regard, the results of this study reinforce previous findings, which predicted that urban expansion would carry on with a similar intensity [62].

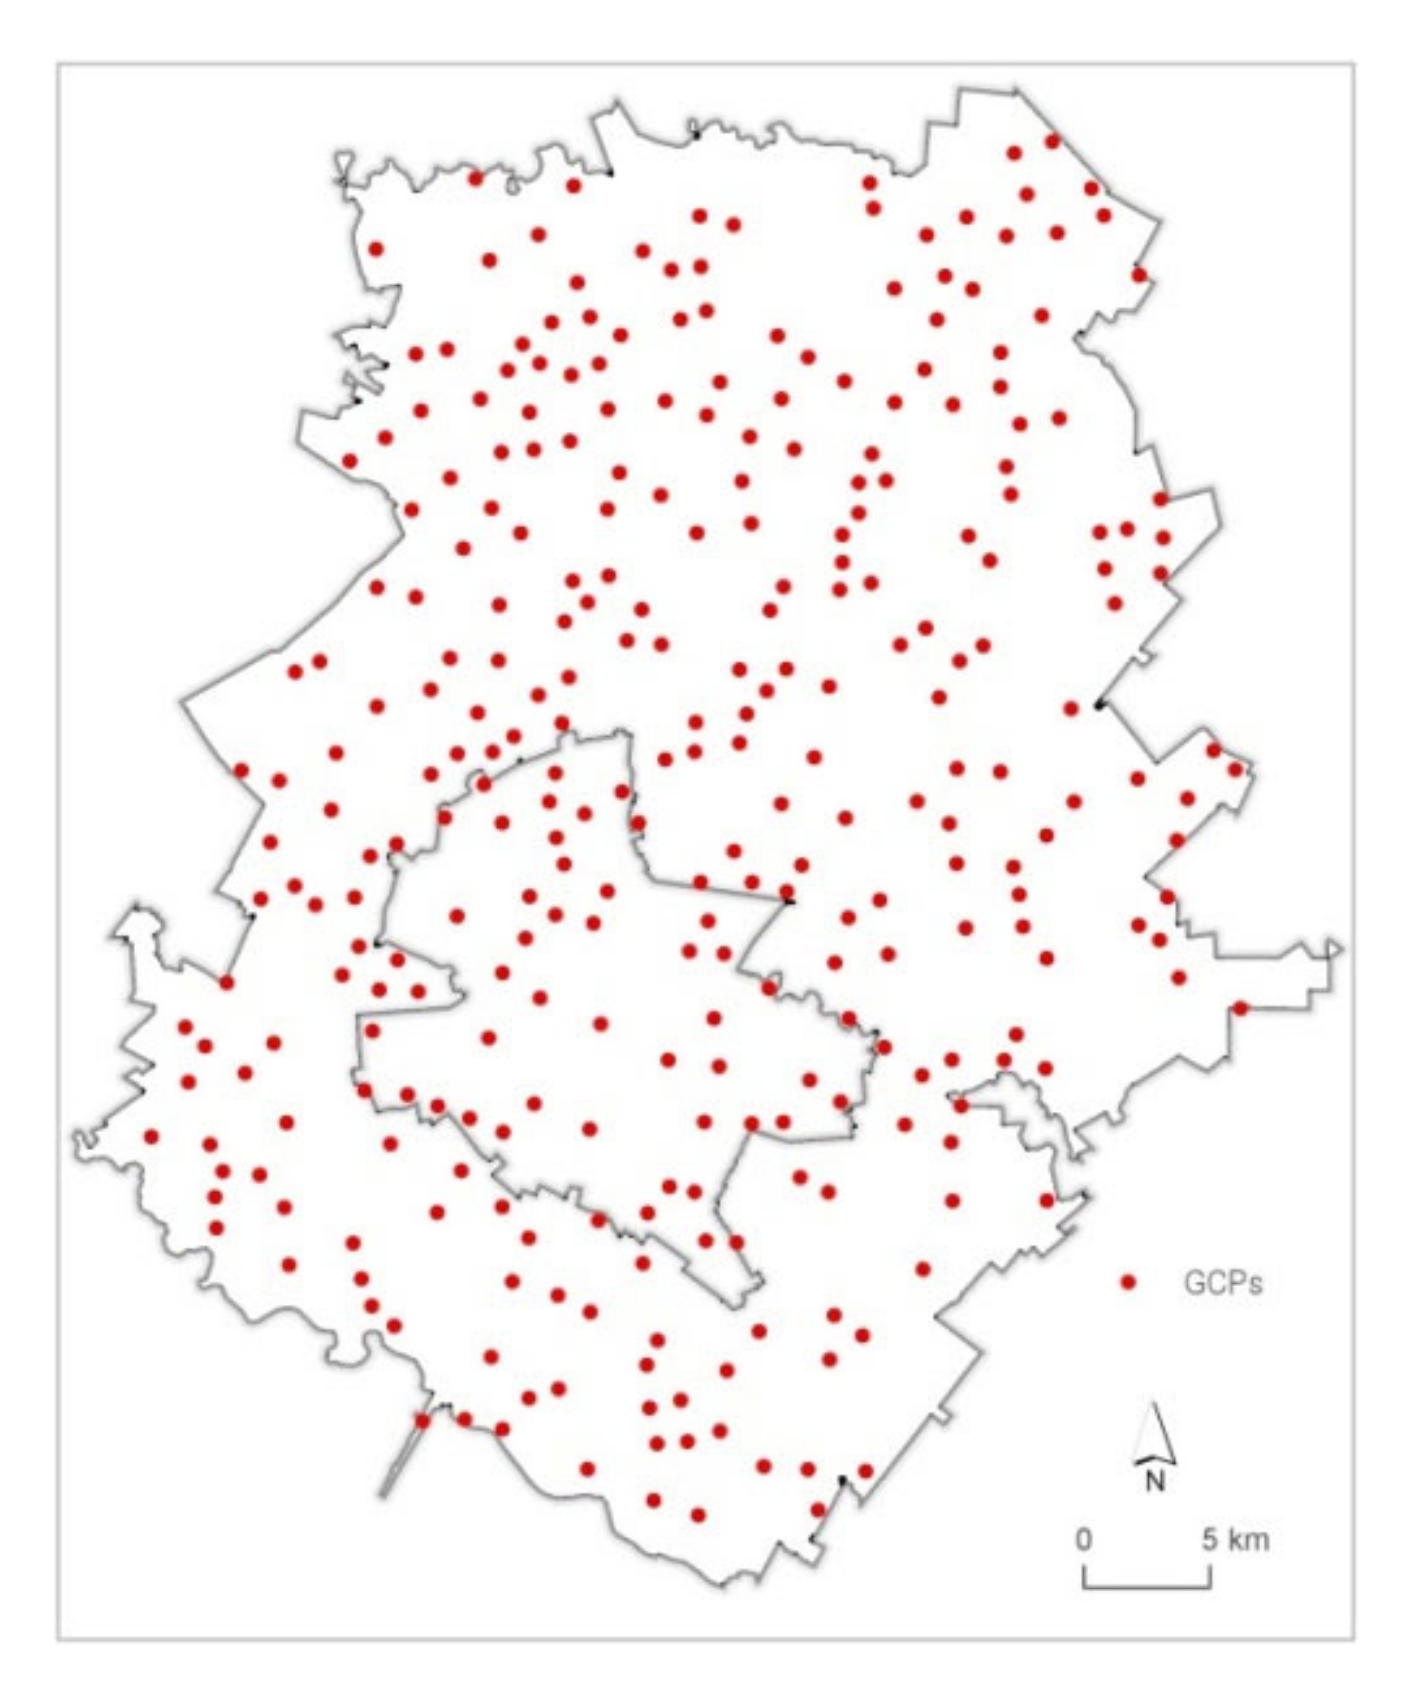
4.2. Accuracy Assessment of the Results

The accuracy evaluation of both current land cover data for the Bucharest–Ilfov Region was first explained in a quantitative formula, using the corresponding confusion matrices. An independent point type dataset was generated using a random point approach to assign land cover attributes for each sample. After a visual interpretation of topographic maps together with satellite imagery (1990) and satellite imagery combined with orthophotos (2018), the vector data obtained for the settlement patterns (point shape file) were crossed with the built-up area extracted from CLC and Landsat image classification (raster data files). Figure 7 depicts a uniform random point production for the study area to be followed for visual interpretation and attribute assignment.
Table 3 provides a synthetic view over the quality of the results from a statistical point of view, after testing the land cover derived vector attributes with the independent random point data attributes. The encouraging global accuracy of higher than 93% for all data coverages, with slight differences between Landsat classification and CLC, whose standard legend of 44 classes for all European countries required a generalization of the polygon pattern obtained by visual interpretation and manual vector production together with topological model building. In comparison, semiautomatic satellite image thematic classification returned the highest accuracies, higher than 95%, although the training stage needed supplementary work in sample polygon production by image interpretation and terrain observations, especially within fragmented built-up areas. These results could explain the efficiency of the multidate and multispectral Landsat image classification for more complex patterns such as houses/buildings and non-agricultural land. These results are similar to other approaches focusing on built-up areas in Romania, e.g., those of Mihai et al. [60] and Rujoiu-Mare et al. [88], based on Landsat and/or Sentinel 2 imagery. Both case studies employed a very large number of training samples and advanced algorithms such as ANN (Artificial Neural Network) or SVM. The calculated Kappa coefficients are an expression of the results’ performance, showing the highest values for satellite image classification (0.94).
The explained statistics do not indicate a significant difference between the built-up areas in CLC and Landsat classification, which means the currently available polygon data can be used for the purposes of simple, general mapping of built-up area. Small differences need to be identified through detailed mapping to evaluate the reliability of this data for urban planning and management, on a regional to local level.

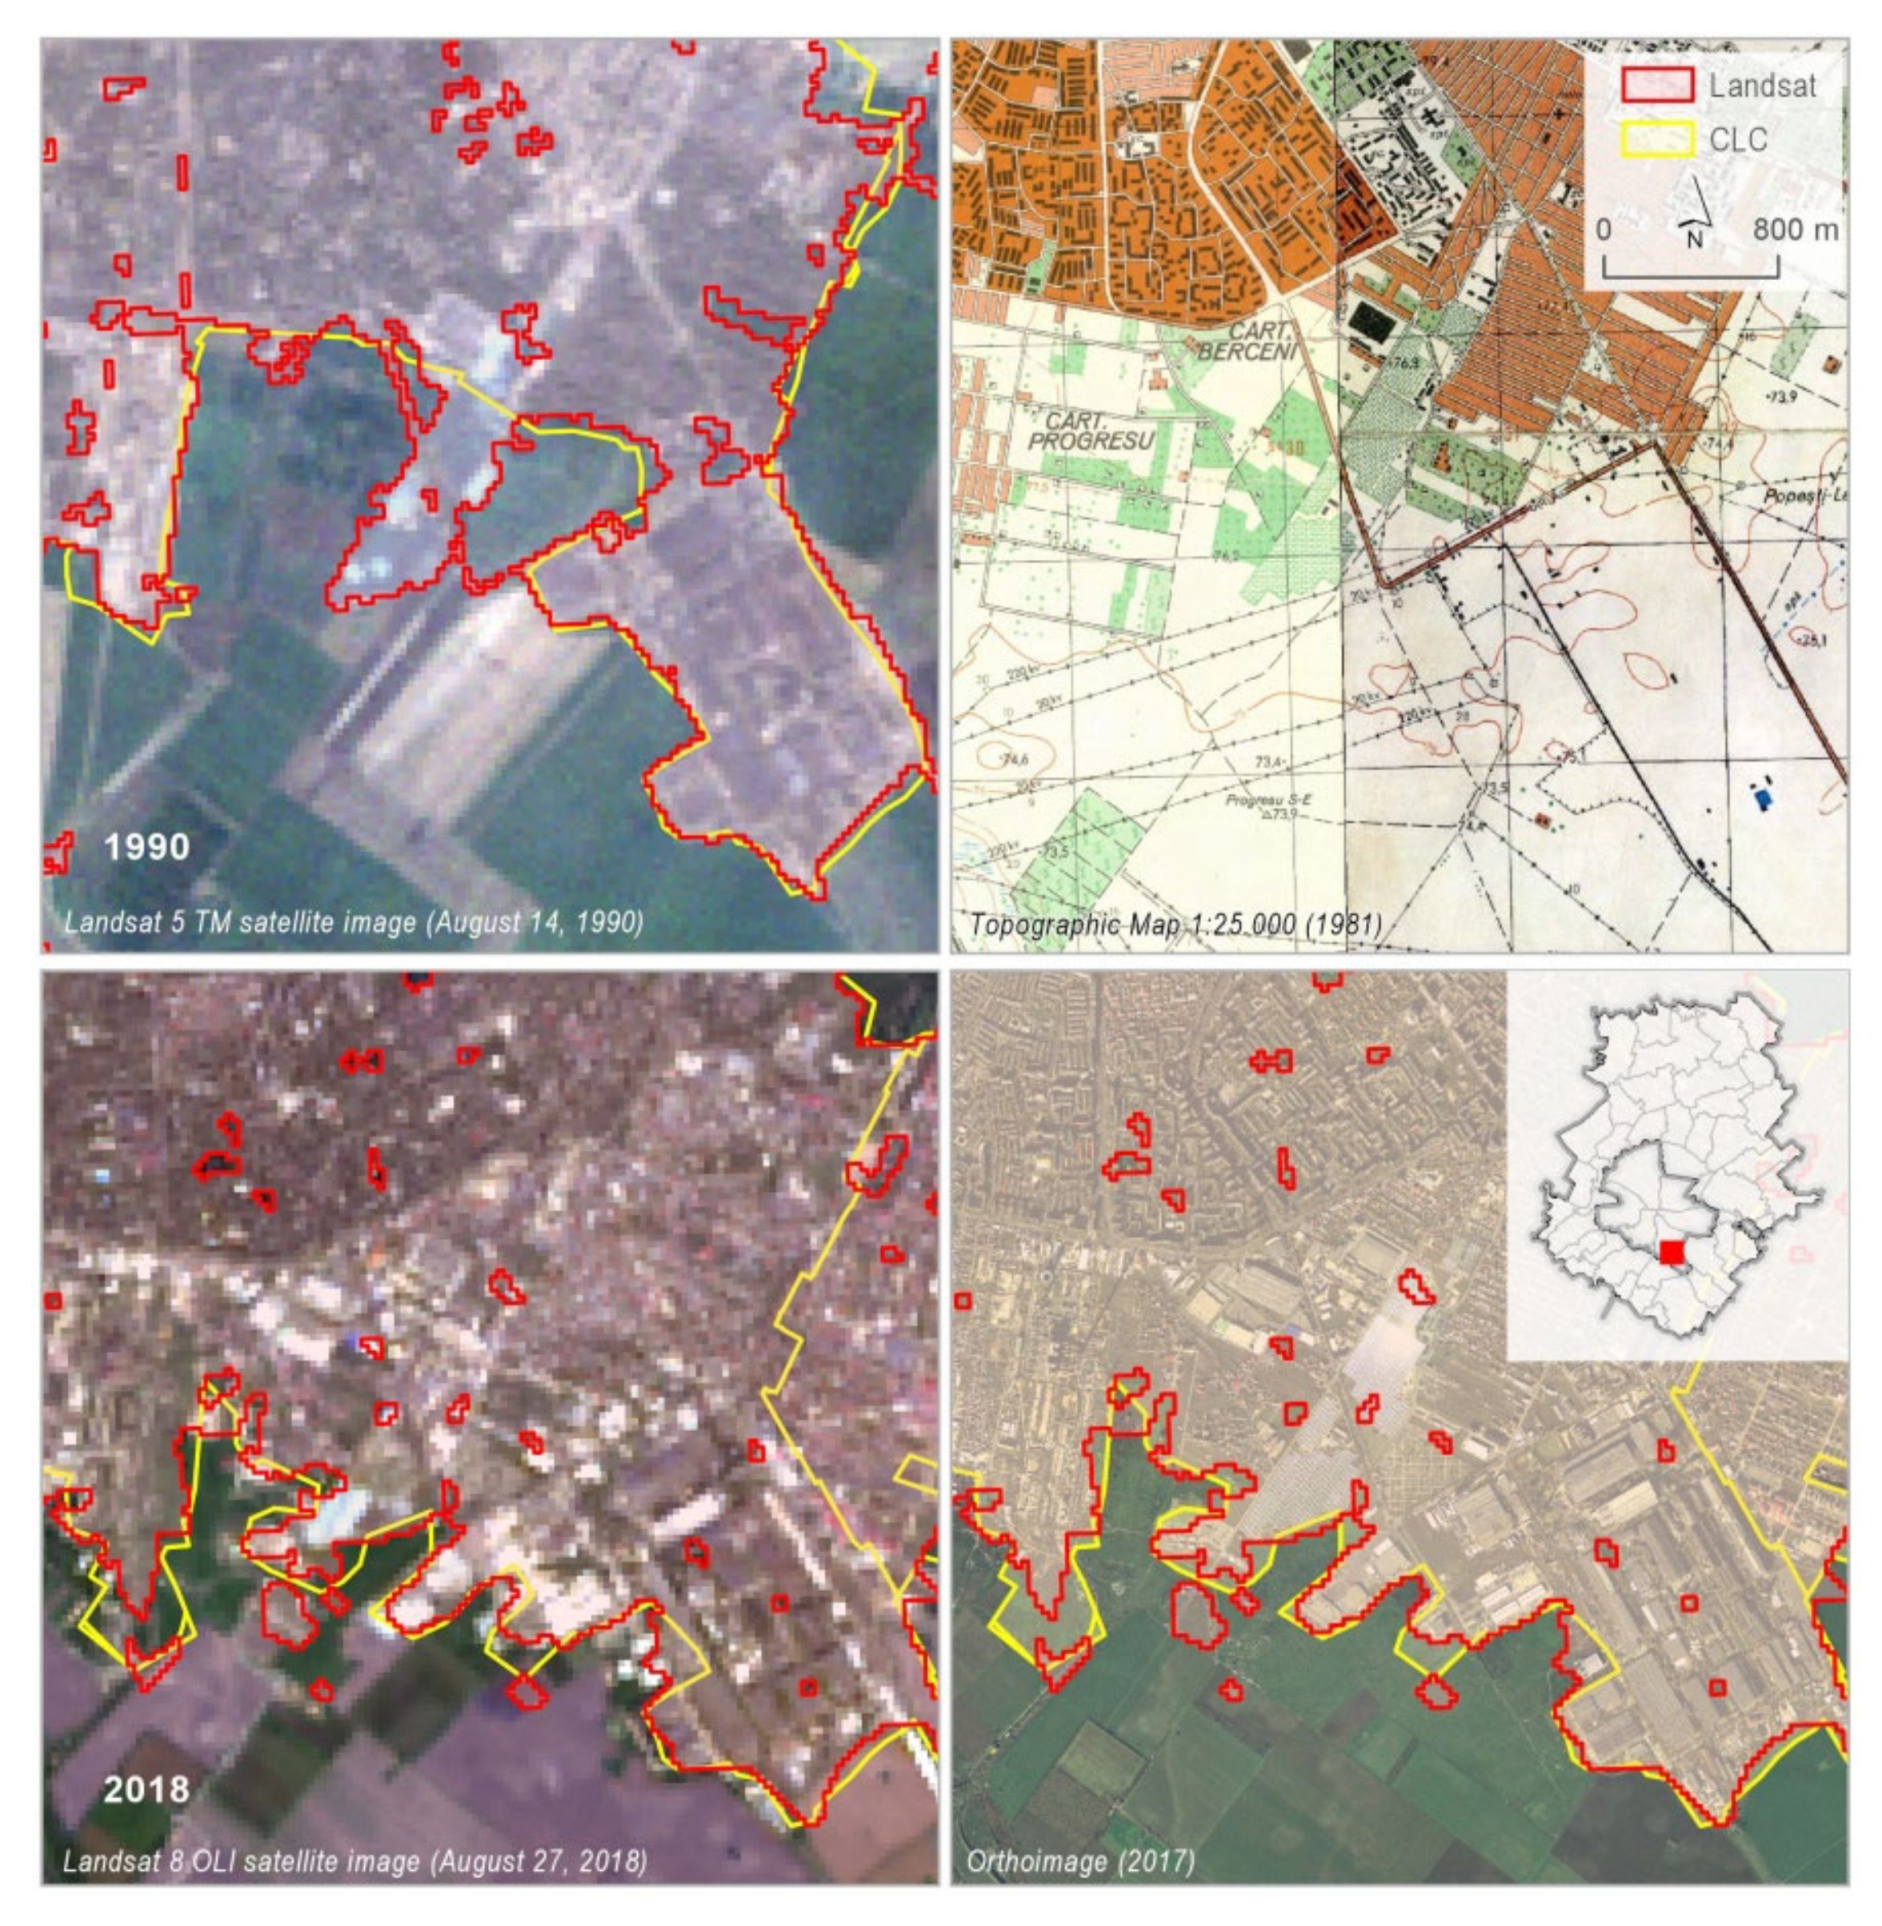
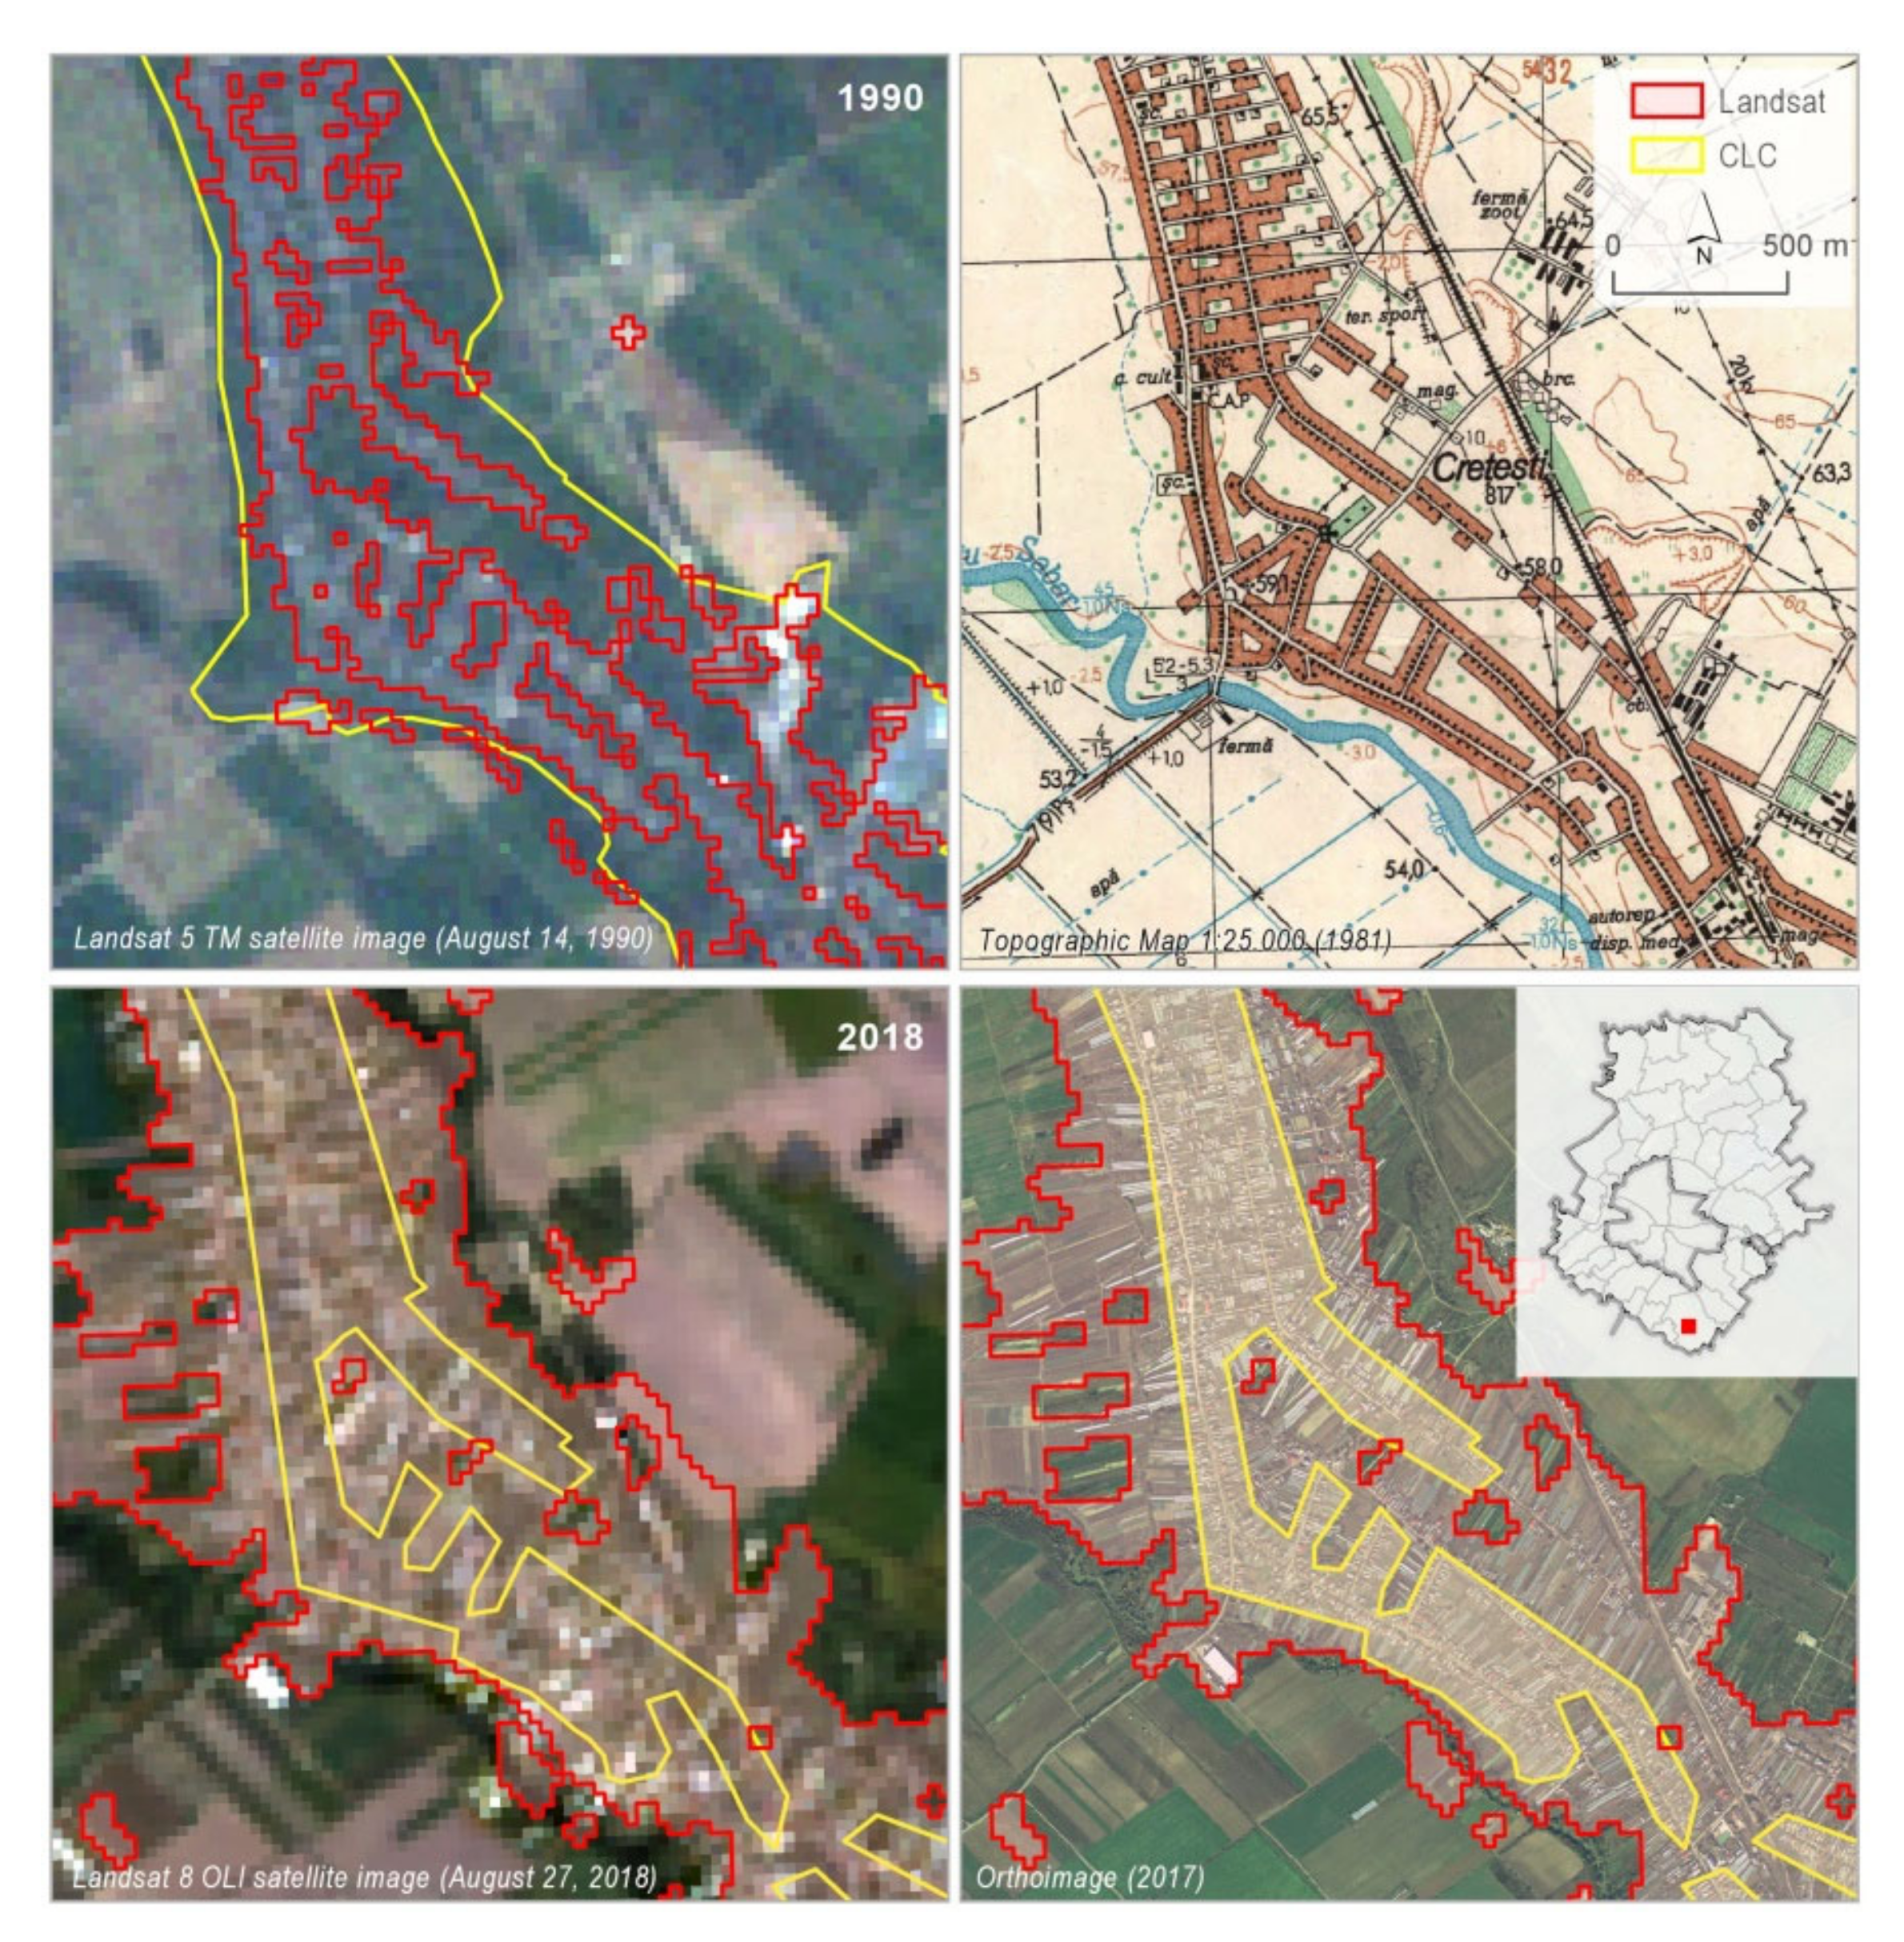
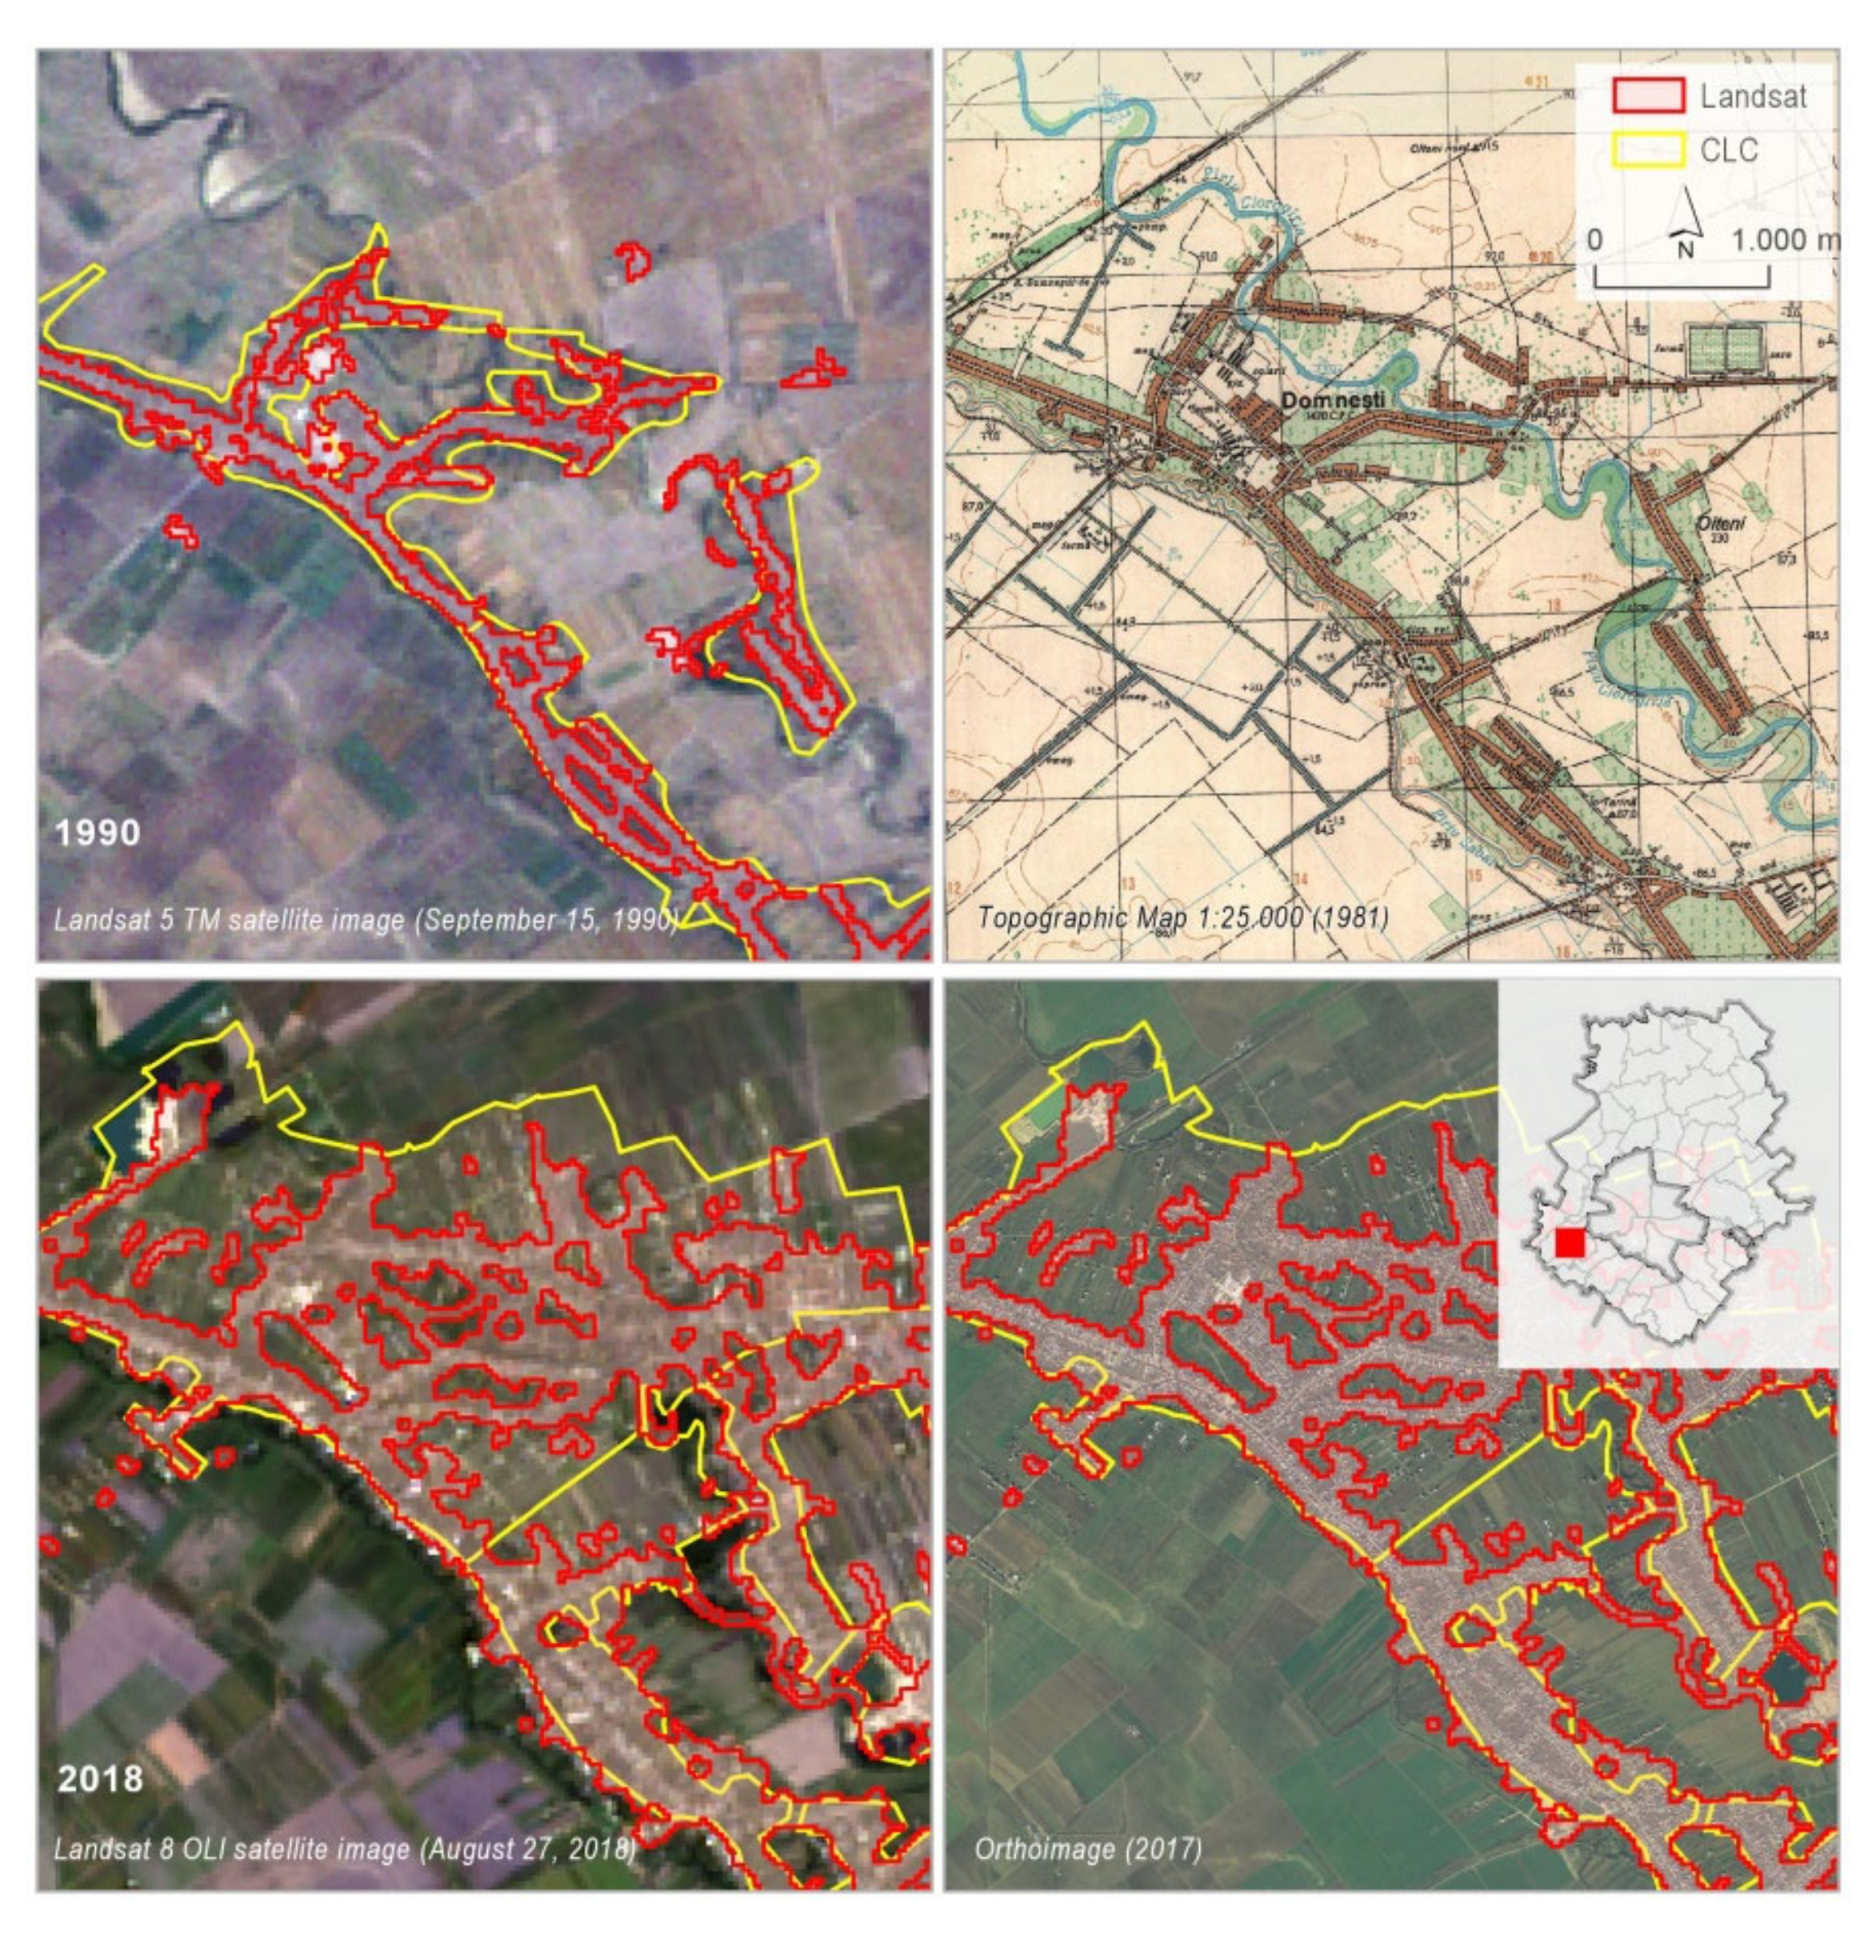
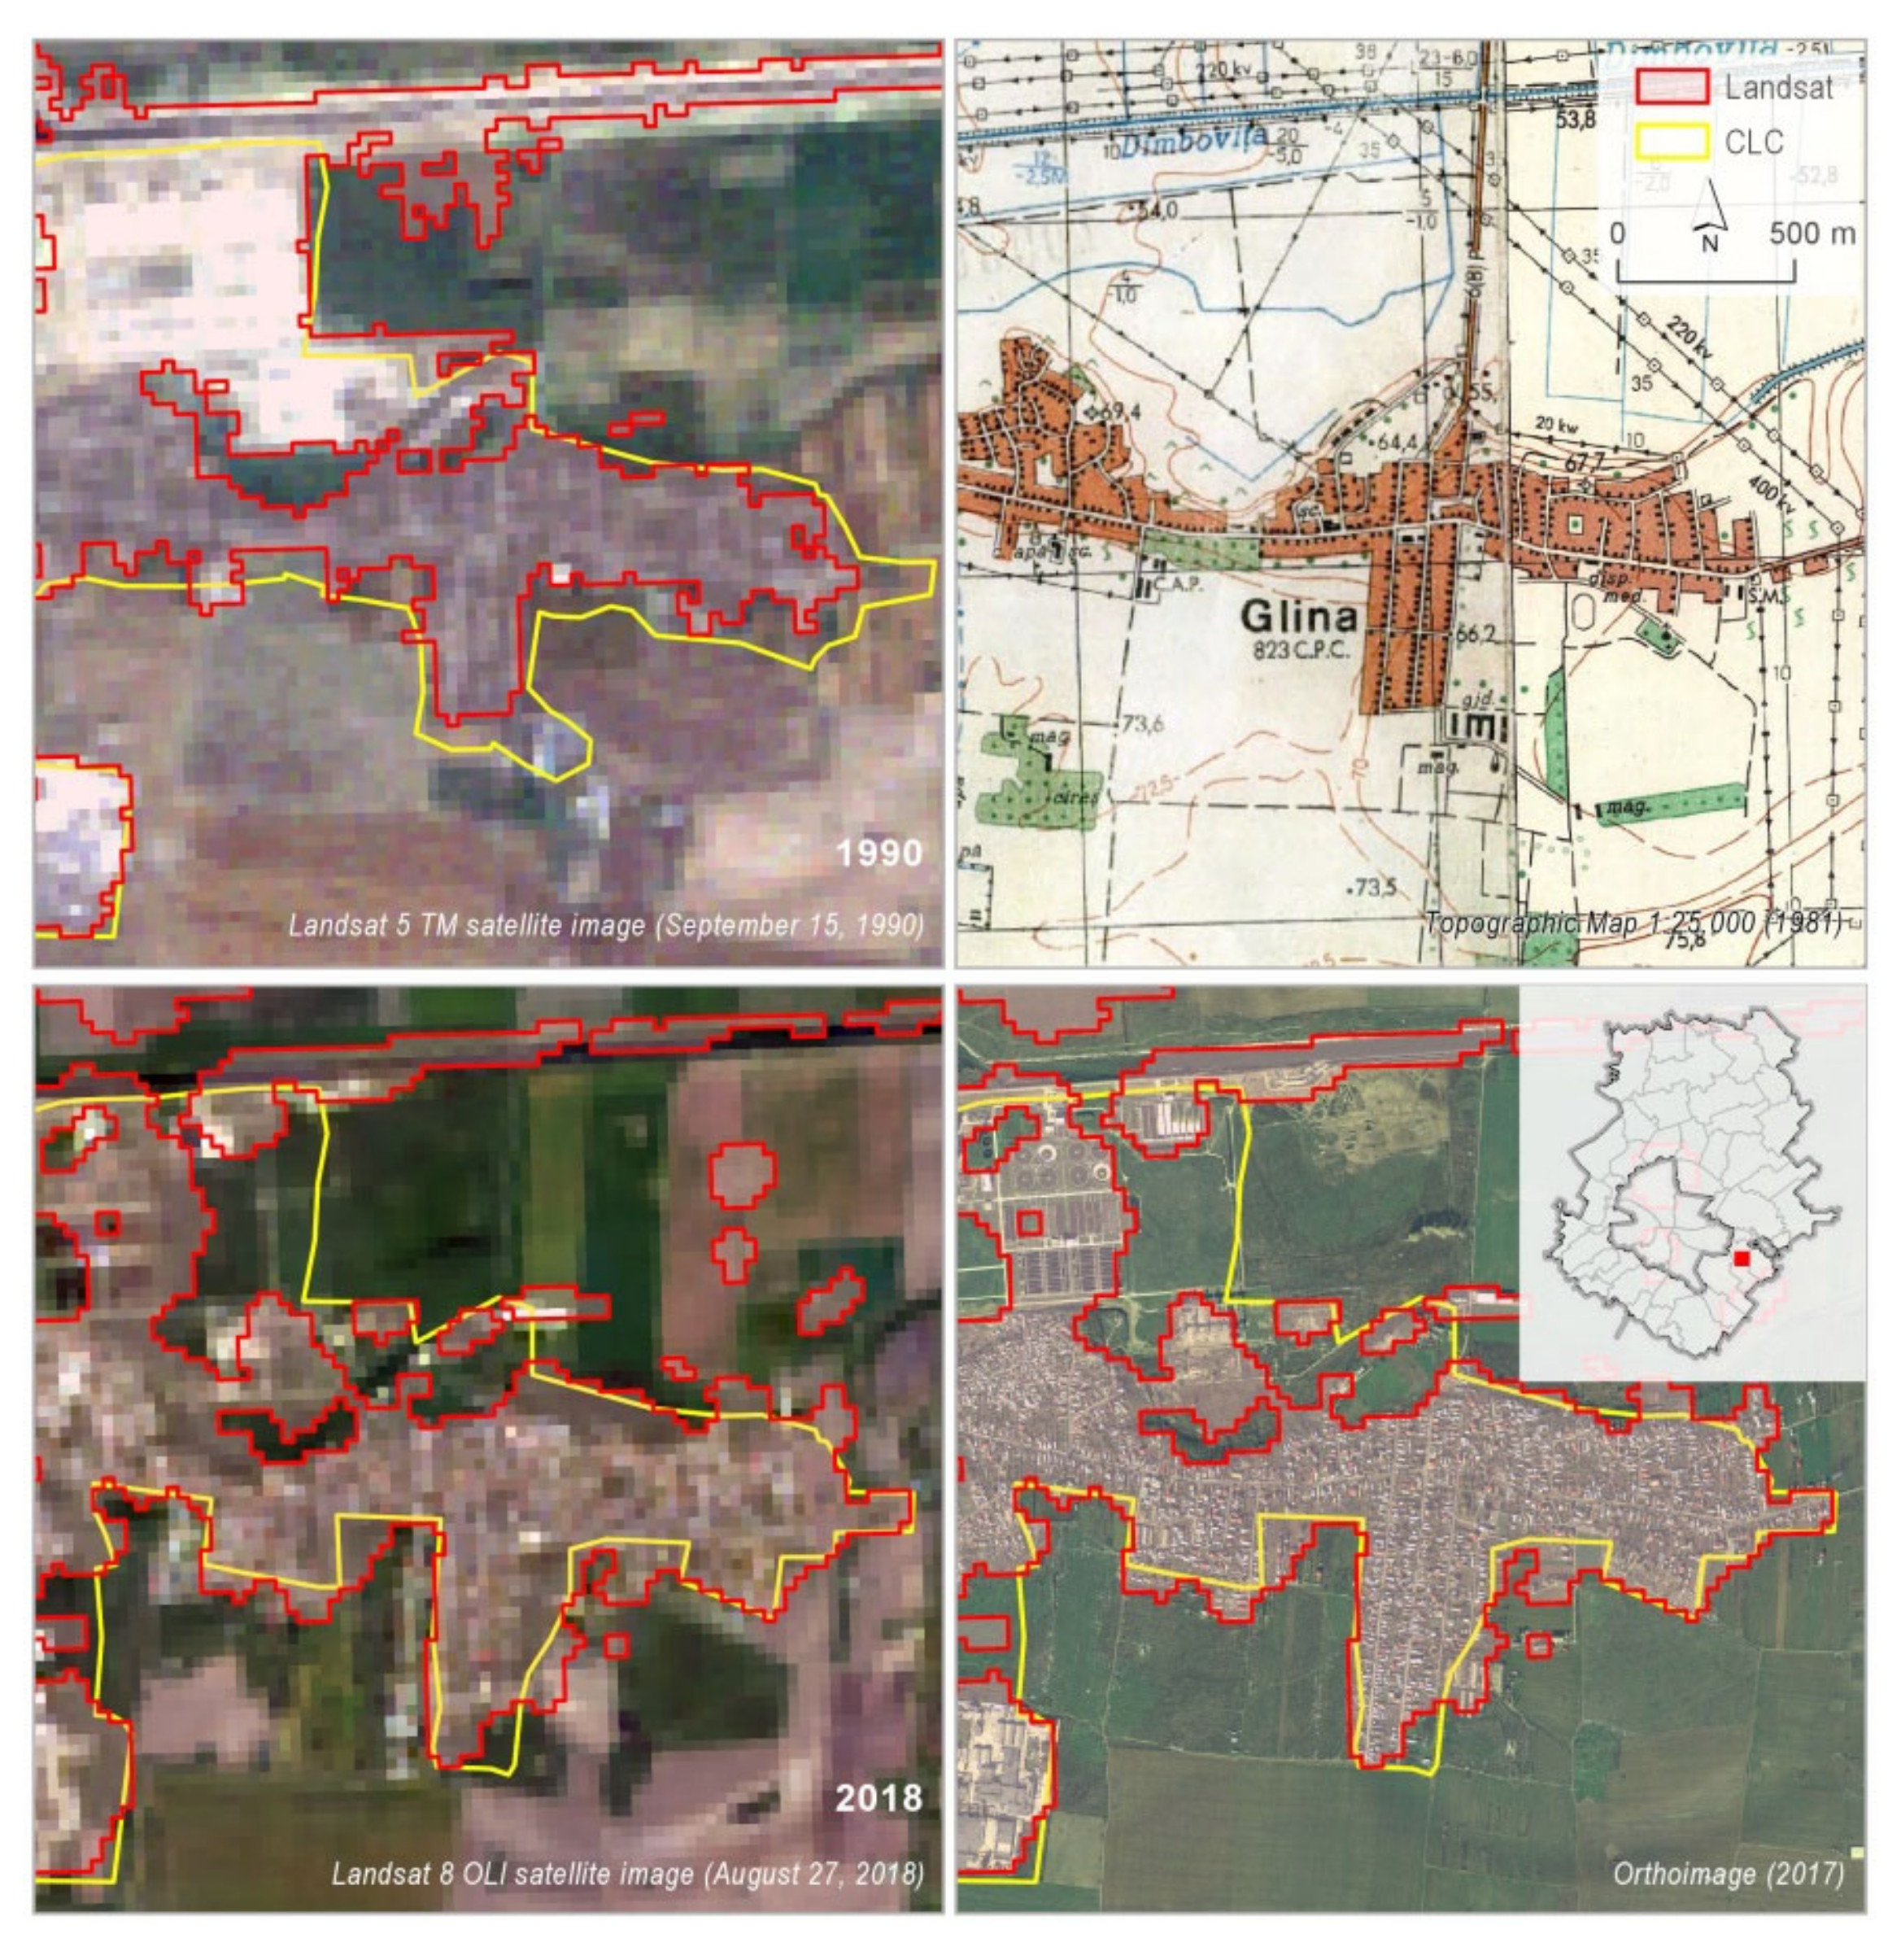
4.3. Spatial Comparison at the Local Level between Landsat and CLC Datasets

Our analysis continued with a selection of complementary case studies, illustrating relevant changes in built-up areas in the context of Bucharest’s development and urban expansion process. These examples are designed to depict the specific accuracy problems of built-up area mapping for both datasets in a qualitative formula.
The selection criteria involved the highest discrepancies found between the two datasets in Ilfov County, a Bucharest sector and an area known to be repulsive that recorded a built-up area increase (Glina village).
Figure 8 corresponds to the typical changes featuring the built-up area in the outlying of Bucharest (Sector 4). This part changed mainly in the last two decades, in a spectacular configuration, because the agricultural land pattern (vegetable crops and cereals), which was kept more or less the same since communist times around the state-established city limit, was replaced by many developments such as retail zones and residential areas. Some of these were built on the vacant land of former socialist factories. The topographic map does not illustrate this industrial area. To compensate, we integrated data derived from CLC with satellite image classification. When comparing these datasets, it is easy to observe more reliability for CLC 1990 and Landsat TM imagery, at the end of socialist period when the limits of the urban neighborhood were sharper and easily discernible from the still cultivated agricultural lands on the state-owned large plots.
The present-day pattern is more complex, because the city outskirts have transformed greatly since 2001, and agricultural plots changed after the real estate market pushed for their integration within the developing built-up area. In this context, on the whole, both CLC and Landsat show the correct trend in urban expansion, but they both lean towards a moderate overestimation: the first provides a generalized pattern and the second follows the outer limit of built-up areas in detail, including isolated developments and bare ground surrounded by buildings.
However, it is worth mentioning that around 50 ha of glass greenhouses were included in built-up areas in 1990 (entirely in Landsat, only partially in CLC). Meanwhile, the surface shrank, having been assigned to the same land use class.
The next three case studies illustrate the highest discrepancies in terms of differences registered in the dynamics of built-up area between 1990 and 2018 in villages located in the communes Vidra, Domnești and Nuci.
Farther south of the city is the village of Crețești (Vidra commune), a case study of a dynamic agricultural landscape (Figure 9), well-known as an area for vegetable crops and one of the supply centers for the capital city’s markets. For 1990, CLC data layer and satellite image thematic classification show differences in built-up areas: the first also includes gardens and plots around the farms as built-up area, while the other includes mainly houses and buildings. For 2018, the situation is opposite: the Landsat imagery is farther from the real configuration of the built-up area, as it includes—in addition to houses—farming facilities, represented here by many plastic greenhouses for vegetable crops and other agricultural plots. The CLC polygon, when compared with the high resolution orthophoto, is seemingly closer to the ground reality, but excludes many buildings.
Another case study focuses on the change of the rural settlement pattern to the west of Bucharest. This was a typical rural area (Domnești village, Figure 10), with a linear configuration along a secondary road, integrated within a typical agricultural landscape. For 1990, both datasets show a sharp edge of the built-up area, even though the CLC polygons extend the built-up area more than Landsat. Mapping the same feature, 28 years later, it is easy to observe new secondary built-up areas, developed under the pressure of the real estate market. The high radiometric resolution of Landsat OLI imagery and the integration of multidate images within the data for classification allow a detailed mapping of the entire village’s built-up area, albeit slightly overestimated. Meanwhile, CLC incorporates large surfaces of agricultural land in its estimation of the built-up area. These complex patterns are one typical example of the urban expansion following the real estate boom of the mid-2000s, within the former agricultural land around the big city.
The following case study tackles the villages located farther from Bucharest (Figure 11). These settlements are not in a closer connection with the city by transportation networks and other economic exchanges, but the latest improvements in road infrastructure increased the attraction of these areas. The villages of Merii Petchii and Nuci (Nuci commune, around 40 km from the capital city) is not far from the newly built A3 motorway (opened in 2012), although the infrastructure is still developing. The built-up area configuration in 1990 is totally different between the CLC and the polygon produced by thematic classification. This is the same situation with other mapped villages, as the interpretation included at the same time built-up area and surrounding agricultural plots such as gardens and orchards (topographic map can explain this difference for the early stage) here in the CLC version. Meanwhile, satellite imagery underestimates the built-up area compared with the ground reality. For 2018, the CLC show a higher spatial accuracy to be evaluated with the high resolution of the orthophoto. However, some reduced misclassification can still be identified. In contrast, Landsat OLI imagery largely exaggerates the built-up area, mistakenly including many tracts of agricultural land.
The last case study deals with an area characterized by a relatively constant dynamic of built-up area, in the southeastern part of Ilfov County (Glina village, Figure 12). Industrial areas cover important land south of the Dâmbovița River, but the area’s lower environmental quality (because of proximity to a landfill and a wastewater treatment plant) slow down the residential urban expansion in those parts. For 1990, discrepancies appear in both datasets, as they both classify other types of land cover as built-up area. For example, in the upper left corner of the image, a construction site for a wastewater treatment facility is marked as a built-up area, even though the work had barely begun [110].
For 2018, the satellite data provides a more reliable built-up area limit that superposes relatively well with the limit interpreted from orthophotos. The CLC version maintains the same overestimated configuration as in 1990.
These five complementary case studies are examples of how to integrate CLC and Landsat derived land cover data in regional analysis and planning.

4.4. Key Findings, Limitations and Future Research Directions

The utility and potential applications of combining CLC and Landsat datasets for research, policy and planning should be evaluated from a double perspective, on the macro-scale and on the territorial administrative unit level.
In the first case, despite the large discrepancies, both databases are able to reveal an overall spatiotemporal perspective on the territorial impact of the expansion of the built-up areas, denoting the main development axis, patches with higher pressures on natural resources, predictions of future extension trends, etc.
One of the main reasons for poor urban planning is considered to be the result of lack of instruments [97,111,112,113] as well as incomplete data regarding rapid multi-scale transformations and their territorial impact [114,115]. The shift to an effective planning system, at this level, requires up-to-date information. In this sense, the processed multi-temporal satellite images proved valuable, as already indicated in other studies [61,105,116,117,118]. Thus, the results are useful for monitoring the impact of applied policies and for further substantiation of integrated spatial development strategies and master plans. This approach is considered a time- and cost-effective method for the regional level [25,65], even though it “might not reach quality levels of tailor-made local maps generated through laborious manual classification approaches” [25]. In this regard, previous studies also stated that “all maps have errors and users need to decide which map meets their requirements” [119].
At the micro-level, the comparative results of mapping the built-up area in the five case studies are summarized in Table 4. Errors and inaccuracies can be identified, alternatively, for both datasets, outlining their limited potential to be used for supporting local development decisions and strictly enforced regulation in the urban planning, where a higher degree of accuracy is necessary.
These findings are in line with previous studies which advise using considerable caution in applying these datasets, alone, at the local level [9,65,120]. In addition, Mesev et al. [121] noted that accurate spatial configuration of urban areas is difficult to replicate solely from remotely sensed data.
Thematic classification remains an outstanding technique in the production of the updated LULC (land use/land cover) data layers, and complementary analyses evaluate the efficiency of different algorithms such as SVM, decision tree or maximum likelihood when mapping different areas with diverse and complex spectral signatures such as urban areas, among others [87,122,123,124,125]. Most approaches focus mainly on single date imagery and regional scale analysis, but more challenges occur at national and continental scales, where urban areas and built-up areas in general need to be discriminated from other classes influenced by the seasonality of spectral signature [126,127,128]. However, some authors recognized the limits of spectral reflective data in land cover mapping (including settlements) and evaluated different layer stacks, based on multidate imagery from a single sensor [88] or with hybrid origins such as spectral data-thermal data [129]; spectral data: spectral indices/orthogonal indices derived data [130,131,132]; spectral data: topographic derived data [133]; spectral data: image components data [134]; and newly developed indices for built-up areas [135]. Our approach also integrates Landsat data within the analysis of urban expansion, and it follows a multidate classification of built-up areas in order to improve the accuracy of the results. Schneider [67] also explained this principle, evaluating the SVM and decision tree algorithms using thematic classification. Moreover, the spatial and radiometric resolutions of some remote sensing sensors are responsible for some misclassifications of the built-up area class, as it is the case of the Landsat 5 TM imagery, whose 8-bit pixel depth is two times lower compared to Landsat 8 OLI imagery.
Accurate mapping of land cover features according to Corine Land Cover standards is a difficult task because these 44 classes in three detail levels are too complex to be correctly designated by automatic satellite image classification only, although this might be a possible solution [136]. This is the reason visual interpretation of imagery is still considered a basic technique for CLC vector data coverage production at national and European levels [137,138]. Other studies try to evaluate and validate different alternative solutions derived from other satellite data such as the ESA Sentinel 1 radar SAR imagery [139] or the integration of thermal infrared images for land cover mapping of urban areas [140]. Semi-automatic Corine Land Cover maps drawing in more homogeneous landscapes such as forested areas or marshes was tested in Finland [141] or Sweden [142].
Errors caused by manual vector production for CLC can easily influence the quality of the subsequent results of GIS mapping and modeling. In this context, the user first needs to validate land cover data and adapt it to ground truth, and then integrate it to the current work. Mapping of land cover features uses selections of CLC polygons in the training phase at a regional scale [143] and even on a continental scale in maps of forested regions [144]. Change mapping of urban areas was based on training on CLC polygons together with Landsat imagery [145,146].
Future studies plan to include the results at the micro-scale level and integrate them with other types of data. In addition, the findings for both macro- and micro-scale can be used as a starting point to predict territorial patterns and the magnitudes of future urban expansion.

5. Conclusions

This study examined the reliability of two datasets, Corine Land Cover and Landsat satellite images, for monitoring built-up area expansion based on a case study, represented by Bucharest, the capital of Romania, and the surrounding Ilfov County. The analysis was carried out between 1990 and 2018, during which multiple transformations of the settlement’s spatial patterns occurred, through an uncontrolled spread of new built-up areas.
Usually, the studies that tackle urban expansion use either CLC or Landsat, but our research goes beyond this approach, comparing the results of both datasets with each other and the ground truth, with the purpose of identifying the strengths and limitations of each dataset for mapping the built-up area’s spatiotemporal features and changes.
The findings are important for monitoring the urban expansion process in general, bringing a new perspective through a multi-level territorial approach, disclosing large discrepancies between the two databases. Despite these differences, our results point out, at the macro-scale level, that both CLC and Landsat are able to capture the main directions of development and the territorial impact of urban expansion. The largest development of the built-up areas was recorded in the surroundings of Bucharest, in Ilfov County, followed by the outlying parts of the capital at a lower intensity. This further reinforces their potential to be used by policy makers and authorities for substantiation and design of integrated strategies and master plans.
At the local level, multiple limitations and inaccuracies were identified based on the comparative analysis of five representative case studies, limiting their potential to be used for enforceable regulation in the urban planning field. However, the datasets could serve as a complementary database that should be integrated with other data and tools.
Our findings demonstrate the significance of deeper insights at the local level and can be used in future analysis of other areas with similar patterns. Further research is needed to develop possible improved instruments to accurately record the fast dynamic growth of built-up areas.

Author Contributions

All authors have equally contributed to the article. In more detail, the contributions for the different sections are: conceptualization, I.-V.S., M.V. and Z.D.; methodology, formal analysis and investigation, I.-V.S., M.V., D.Z., B.-A.M. and I.S.; writing—original draft preparation, I.-V.S., M.V. and B.-A.M; and writing—review and editing, I-V.S., M.V., D.Z., B.-A.M. and I.S. All authors have read and agreed to the published version of the manuscript.

Funding

The article was partially supported by the University of Bucharest, project number UB 1322 “Integrated and sectoral analyses in trans-scalar territorial dynamics”.

Conflicts of Interest

The authors declare no conflict of interest. The funders had no role in the design of the study; in the collection, analyses, or interpretation of data; in the writing of the manuscript, or in the decision to publish the results.

References

  1. European Environment Agency. Urban Sprawl in Europe: The Ignored Challenge; European Environment Agency, European Commission, Eds.; Office for Official Publications of the European Communities: Luxembourg, 2006. [Google Scholar]
  2. Meiner, A.; Pedroli, G.B.M.; European Environment Agency. Landscapes in Transition: An Account of 25 Years of Land Cover Change in Europe; Office for Official Publications of the European Communities: Luxembourg, 2017. [Google Scholar]
  3. European Environment Agency; Swiss Federal Office for the Environment (FOEN). Urban Sprawl in Europe: Joint EEA-FOEN Report; Office for Official Publications of the European Communities: Luxembourg, 2016. [Google Scholar]
  4. Hennig, E.I.; Schwick, C.; Soukup, T.; Orlitová, E.; Kienast, F.; Jaeger, J.A.G. Multi-Scale Analysis of Urban Sprawl in Europe: Towards a European de-Sprawling Strategy. Land Use Policy 2015, 49, 483–498. [Google Scholar] [CrossRef] [Green Version]
  5. Oueslati, W.; Alvanides, S.; Garrod, G. Determinants of Urban Sprawl in European Cities. Urban Stud. 2015, 52, 1594–1614. [Google Scholar] [CrossRef] [PubMed] [Green Version]
  6. Angel, S.; Parent, J.; Civco, D.L.; Blei, A.; Potere, D. The Dimensions of Global Urban Expansion: Estimates and Projections for All Countries, 2000–2050. Prog. Plan. 2011, 75, 53–107. [Google Scholar] [CrossRef]
  7. Seto, K.C.; Guneralp, B.; Hutyra, L.R. Global Forecasts of Urban Expansion to 2030 and Direct Impacts on Biodiversity and Carbon Pools. Proc. Natl. Acad. Sci. USA 2012, 109, 16083–16088. [Google Scholar] [CrossRef] [Green Version]
  8. Seto, K.C.; Fragkias, M.; Güneralp, B.; Reilly, M.K. A Meta-Analysis of Global Urban Land Expansion. PLoS ONE 2011, 6, e23777. [Google Scholar] [CrossRef]
  9. Khanal, N.; Uddin, K.; Matin, M.; Tenneson, K. Automatic Detection of Spatiotemporal Urban Expansion Patterns by Fusing OSM and Landsat Data in Kathmandu. Remote Sens. 2019, 11, 2296. [Google Scholar] [CrossRef] [Green Version]
  10. Rimal, B.; Zhang, L.; Keshtkar, H.; Wang, N.; Lin, Y. Monitoring and Modeling of Spatiotemporal Urban Expansion and Land-Use/Land-Cover Change Using Integrated Markov Chain Cellular Automata Model. Isprs Int. J. Geo Inf. 2017, 6, 288. [Google Scholar] [CrossRef] [Green Version]
  11. Ranagalage, M.; Estoque, R.; Handayani, H.; Zhang, X.; Morimoto, T.; Tadono, T.; Murayama, Y. Relation between Urban Volume and Land Surface Temperature: A Comparative Study of Planned and Traditional Cities in Japan. Sustainability 2018, 10, 2366. [Google Scholar] [CrossRef] [Green Version]
  12. Rousta, I.; Sarif, M.; Gupta, R.; Olafsson, H.; Ranagalage, M.; Murayama, Y.; Zhang, H.; Mushore, T. Spatiotemporal Analysis of Land Use/Land Cover and Its Effects on Surface Urban Heat Island Using Landsat Data: A Case Study of Metropolitan City Tehran (1988–2018). Sustainability 2018, 10, 4433. [Google Scholar] [CrossRef] [Green Version]
  13. Grigoraș, G.; Urițescu, B. Land Use/Land Cover Changes Dynamics and Their Effects on Surface Urban Heat Island in Bucharest, Romania. Int. J. Appl. Earth Obs. Geoinf. 2019, 80, 115–126. [Google Scholar] [CrossRef]
  14. Bai, X.; Dawson, R.J.; Ürge-Vorsatz, D.; Delgado, G.C.; Salisu Barau, A.; Dhakal, S.; Dodman, D.; Leonardsen, L.; Masson-Delmotte, V.; Roberts, D.C.; et al. Six Research Priorities for Cities and Climate Change. Nature 2018, 555, 23–25. [Google Scholar] [CrossRef] [PubMed]
  15. Larkin, A.; van Donkelaar, A.; Geddes, J.A.; Martin, R.V.; Hystad, P. Relationships between Changes in Urban Characteristics and Air Quality in East Asia from 2000 to 2010. Env. Sci. Technol. 2016, 50, 9142–9149. [Google Scholar] [CrossRef] [PubMed] [Green Version]
  16. Zaharia, L.; Ioana-Toroimac, G.; Cocoş, O.; Ghiţă, F.A.; Mailat, E. Urbanization Effects on the River Systems in the Bucharest City Region (Romania). Ecosyst. Health Sustain. 2016, 2, e01247. [Google Scholar] [CrossRef] [Green Version]
  17. Maktav, D.; Sunar, F. Remote Sensing of Urban Land Use Change in Developing Countries: An Example from Büyükçekmece, Istanbul, Turkey. In Remote Sensing of Urban and Suburban Areas; Rashed, T., Jürgens, C., Eds.; Remote Sensing and Digital Image Processing; Springer: Dordrecht, The Netherlands, 2010; Volume 10, pp. 289–312. [Google Scholar] [CrossRef]
  18. Zambon, I.; Benedetti, A.; Ferrara, C.; Salvati, L. Soil Matters? A Multivariate Analysis of Socioeconomic Constraints to Urban Expansion in Mediterranean Europe. Ecol. Econ. 2018, 146, 173–183. [Google Scholar] [CrossRef]
  19. Salvia, R.; Serra, P.; Zambon, I.; Cecchini, M.; Salvati, L. In-Between Sprawl and Neo-Rurality: Sparse Settlements and the Evolution of Socio-Demographic Local Context in a Mediterranean Region. Sustainability 2018, 10, 3670. [Google Scholar] [CrossRef] [Green Version]
  20. Jiang, L.; Deng, X.; Seto, K.C. The Impact of Urban Expansion on Agricultural Land Use Intensity in China. Land Use Policy 2013, 35, 33–39. [Google Scholar] [CrossRef]
  21. Cao, H.; Liu, J.; Fu, C.; Zhang, W.; Wang, G.; Yang, G.; Luo, L. Urban Expansion and Its Impact on the Land Use Pattern in Xishuangbanna since the Reform and Opening up of China. Remote Sens. 2017, 9, 137. [Google Scholar] [CrossRef] [Green Version]
  22. McDonald, R.I.; Güneralp, B.; Huang, C.-W.; Seto, K.C.; You, M. Conservation Priorities to Protect Vertebrate Endemics from Global Urban Expansion. Biol. Conserv. 2018, 224, 290–299. [Google Scholar] [CrossRef]
  23. Güneralp, B.; Seto, K.C. Futures of Global Urban Expansion: Uncertainties and Implications for Biodiversity Conservation. Env. Res. Lett. 2013, 8, 014025. [Google Scholar] [CrossRef]
  24. Kuemmerle, T.; Levers, C.; Erb, K.; Estel, S.; Jepsen, M.R.; Müller, D.; Plutzar, C.; Stürck, J.; Verkerk, P.J.; Verburg, P.H.; et al. Hotspots of Land Use Change in Europe. Env. Res. Lett. 2016, 11, 064020. [Google Scholar] [CrossRef]
  25. Leinenkugel, P.; Deck, R.; Huth, J.; Ottinger, M.; Mack, B. The Potential of Open Geodata for Automated Large-Scale Land Use and Land Cover Classification. Remote Sens. 2019, 11, 2249. [Google Scholar] [CrossRef] [Green Version]
  26. Salvati, L.; Zambon, I.; Chelli, F.M.; Serra, P. Do Spatial Patterns of Urbanization and Land Consumption Reflect Different Socioeconomic Contexts in Europe? Sci. Total Env. 2018, 625, 722–730. [Google Scholar] [CrossRef] [PubMed]
  27. Pichler-Milanovi, N.; Gutry-Korycka, M.; Rink, D. Sprawl in the Post-Socialist City: The Changing Economic and Institutional Context of Central and Eastern European Cities. In Urban Sprawl in Europe; Couch, C., Leontidou, L., Petschel-Held, G., Eds.; Blackwell Publishing Ltd.: Oxford, UK, 2007; pp. 102–135. [Google Scholar] [CrossRef]
  28. Hirt, S. Whatever Happened to the (Post)Socialist City? Cities 2013, 32, S29–S38. [Google Scholar] [CrossRef]
  29. Sýkora, L.; Stanilov, K. The Challenge of Postsocialist Suburbanization. In Confronting Suburbanization; John Wiley & Sons Ltd.: Chichester, UK, 2014; pp. 1–32. [Google Scholar] [CrossRef]
  30. Nedović-Budić, Z.; Tsenkova, S.; Marcuse, P. The Urban Mosaic of Post-Socialist Europe. In The Urban Mosaic of Post-Socialist Europe; Tsenkova, S., Nedović-Budić, Z., Eds.; Physica-Verlag HD: Heidelberg, Germany, 2006; pp. 3–20. [Google Scholar] [CrossRef]
  31. Hirt, S. Post-Socialist Urban Forms: Notes From Sofia. Urban Geogr. 2006, 27, 464–488. [Google Scholar] [CrossRef]
  32. Hirt, S.A. Iron Curtains: Gates, Suburbs and Privatization of Space in the Post-Socialist City; John Wiley & Sons Ltd.: Chichester, UK, 2012. [Google Scholar] [CrossRef]
  33. Sýkora, L.; Bouzarovski, S. Multiple Transformations: Conceptualising the Post-Communist Urban Transition. Urban Stud. 2011. [Google Scholar] [CrossRef] [Green Version]
  34. Taubenböck, H.; Gerten, C.; Rusche, K.; Siedentop, S.; Wurm, M. Patterns of Eastern European Urbanisation in the Mirror of Western Trends—Convergent, Unique or Hybrid? Env. Plan. B Urban Anal. City Sci. 2019. [Google Scholar] [CrossRef] [Green Version]
  35. Gentile, M.; Marcińczak, S. Housing Inequalities in Bucharest: Shallow Changes in Hesitant Transition. GeoJournal 2014, 79, 449–465. [Google Scholar] [CrossRef]
  36. Ianoș, I. Orașele și Organizarea Spațiului Geografic: Studiu de Geografie Economică asupra Teritoriului României; Editura Academiei Republicii Socialiste Romania: Bucharest, Romania, 1987. [Google Scholar]
  37. Ianoş, I.; Tălângă, C. Orașul și Sistemul Urban Românesc în Condițiile Economiei de Piață; Institutul de Geografie: Bucharest, Romania, 1994. [Google Scholar]
  38. Marea Adunare Națională. Lege Nr. 58 Din 1 Noiembrie 1974 Privind Sistematizarea Teritoriului Şi Localităţilor Urbane Şi Rurale; Buletinul Oficial: Bucharest, Romania, 1974; Volume 135. [Google Scholar]
  39. Suditu, B. Urban Sprawl and Residential Mobilities in the Bucharest Area—Reconfiguration of a New Residential Geography. Hum. Geogr. Stud. Res. Hum. Geogr. 2009, 3, 79–93. [Google Scholar]
  40. Ianoş, I.; Sîrodoev, I.; Pascariu, G.; Henebry, G. Divergent Patterns of Built-up Urban Space Growth Following Post-Socialist Changes. Urban Stud. 2016, 53, 3172–3188. [Google Scholar] [CrossRef]
  41. Tomaszewska, M.; Henebry, G. Urban–Rural Contrasts in Central-Eastern European Cities Using a MODIS 4 Micron Time Series. Remote Sens. 2016, 8, 924. [Google Scholar] [CrossRef] [Green Version]
  42. Ianoş, I.; Sorensen, A.; Merciu, C. Incoherence of Urban Planning Policy in Bucharest: Its Potential for Land Use Conflict. Land Use Policy 2017, 60, 101–112. [Google Scholar] [CrossRef]
  43. Tosa, C.; Mitrea, A.; Sato, H.; Miwa, T.; Morikawa, T. Economic Growth and Urban Metamorphosis: A Quarter Century of Transformations within the Metropolitan Area of Bucharest. J. Transp. Land Use 2018, 11. [Google Scholar] [CrossRef] [Green Version]
  44. Schneider, A.; Woodcock, C.E. Compact, Dispersed, Fragmented, Extensive? A Comparison of Urban Growth in Twenty-Five Global Cities Using Remotely Sensed Data, Pattern Metrics and Census Information. Urban Stud. 2008, 45, 659–692. [Google Scholar] [CrossRef]
  45. Netzband, M.; Jürgens, C. Urban and Suburban Areas as a Research Topic for Remote Sensing. In Remote Sensing of Urban and Suburban Areas; Rashed, T., Jürgens, C., Eds.; Remote Sensing and Digital Image Processing; Springer: Dordrecht, The Netherlands, 2010; Volume 10, pp. 1–9. [Google Scholar] [CrossRef]
  46. Alqurashi, A.; Kumar, L.; Sinha, P. Urban Land Cover Change Modelling Using Time-Series Satellite Images: A Case Study of Urban Growth in Five Cities of Saudi Arabia. Remote Sens. 2016, 8, 838. [Google Scholar] [CrossRef] [Green Version]
  47. Maktav, D.; Erbek, F.S.; Jürgens, C. Remote Sensing of Urban Areas. Int. J. Remote Sens. 2005, 26, 655–659. [Google Scholar] [CrossRef]
  48. Bouhennache, R.; Bouden, T.; Taleb-Ahmed, A.; Cheddad, A. A New Spectral Index for the Extraction of Built-up Land Features from Landsat 8 Satellite Imagery. Geocarto Int. 2019, 34, 1531–1551. [Google Scholar] [CrossRef]
  49. Besussi, E.; Chin, N.; Batty, M.; Longley, P. The Structure and Form of Urban Settlements. In Remote Sensing of Urban and Suburban Areas; Rashed, T., Jürgens, C., Eds.; Remote Sensing and Digital Image Processing; Springer: Dordrecht, The Netherlands, 2010; Volume 10, pp. 13–31. [Google Scholar] [CrossRef]
  50. Prastacos, P.; Lagarias, A.; Chrysoulakis, N. Using the Urban Atlas Dataset for Estimating Spatial Metrics. Methodology and Application in Urban Areas of Greece. Cybergeo 2017. [Google Scholar] [CrossRef]
  51. Hirt, S.; Stanilov, K. Revisiting Urban Planning in the Transitional Countries. Unpublished Regional Study Prepared for Planning Sustainable Cities: Global Report on Human Settlements; GRHS: Bismarck, ND, USA, 2009. [Google Scholar]
  52. Leetmaa, K.; Tammaru, T.; Anniste, K. From Priority-Led To Market-Led Suburbanisation in a Post-Communist Metropolis. Tijdschr Voor Econ. En Soc. Geogr. 2009, 100, 436–453. [Google Scholar] [CrossRef]
  53. Krisjane, Z.; Berzins, M. Post-Socialist Urban Trends: New Patterns and Motivations for Migration in the Suburban Areas of Rīga, Latvia. Urban Stud. 2012, 49, 289–306. [Google Scholar] [CrossRef]
  54. Slaev, A.D.; Nedović-Budić, Z.; Krunić, N.; Petrić, J.; Daskalova, D. Suburbanization and Sprawl in Post-Socialist Belgrade and Sofia. Eur. Plan. Stud. 2018, 26, 1389–1412. [Google Scholar] [CrossRef]
  55. Spórna, T.; Krzysztofik, R. ‘Inner’ Suburbanisation–Background of the Phenomenon in a Polycentric, Post-Socialist and Post-Industrial Region. Example from the Katowice Conurbation, Poland. Cities 2020, 104, 102789. [Google Scholar] [CrossRef]
  56. Diermayer, E.; Hostert, P. Assessing Post-Socialist Urban Change with Landsat Data Case Study Berlin, Germany. In Proceedings of the 2007 Urban Remote Sensing Joint Event, Paris, France, 11–13 April 2007; IEEE: Piscataway, NJ, USA, 2007; pp. 1–4. [Google Scholar] [CrossRef]
  57. Kovács, Z.; Farkas, Z.J.; Egedy, T.; Kondor, A.C.; Szabó, B.; Lennert, J.; Baka, D.; Kohán, B. Urban Sprawl and Land Conversion in Post-Socialist Cities: The Case of Metropolitan Budapest. Cities 2019, 92, 71–81. [Google Scholar] [CrossRef]
  58. Pazúr, R.; Feranec, J.; Štych, P.; Kopecká, M.; Holman, L. Changes of Urbanised Landscape Identified and Assessed by the Urban Atlas Data: Case Study of Prague and Bratislava. Land Use Policy 2017, 61, 135–146. [Google Scholar] [CrossRef]
  59. Poghosyan, A. Quantifying Urban Growth in 10 Post-Soviet Cities Using Landsat Data and Machine Learning. Int. J. Remote Sens. 2018, 39, 8688–8702. [Google Scholar] [CrossRef]
  60. Mihai, B.; Nistor, C.; Simion, G. Post-Socialist Urban Growth of Bucharest, Romania – a Change Detection Analysis on Landsat Imagery (1984–2010). Acta Geogr. Slov. 2015, 55. [Google Scholar] [CrossRef] [Green Version]
  61. Aldea, M.; Petrescu, F.; Parlow, E.; Iacoboaea, C.; Luca, O.; Sercaianu, M.; Gaman, F. Demonstrative Potential of Multitemporal Satellite Imagery. In Documenting Urban Dynamics: Generalisation from the Bucharest City Case; Themistocleous, K., Hadjimitsis, D.G., Michaelides, S., Papadavid, G., Eds.; Proc. SPIE 9688: Paphos, Cyprus, 2016; p. 96881X. [Google Scholar] [CrossRef]
  62. Kucsicsa, G.; Grigorescu, I. Urban Growth in the Bucharest Metropolitan Area: Spatial and Temporal Assessment Using Logistic Regression. J. Urban Plan. Dev. 2018, 144, 05017013. [Google Scholar] [CrossRef]
  63. Simion, G. The Spatial Changes of Land Use in The Bucharest Metropolitan Area 1970s–2000s. Hum. Geogr. J. Stud. Res. Hum. Geogr. 2010, 4, 115–123. [Google Scholar] [CrossRef]
  64. Simion, G.; Rusu, M. Land Use Patterns: Key Element of Quality of Life in the Metropolitan Area of Bucharest. In Multidimensional Approach to Quality of Life Issues; Sinha, B.R.K., Ed.; Springer: Singapore, 2019; pp. 343–358. [Google Scholar] [CrossRef]
  65. Diaz-Pacheco, J.; Gutiérrez, J. Exploring the Limitations of CORINE Land Cover for Monitoring Urban Land-Use Dynamics in Metropolitan Areas. J. Land Use Sci. 2014, 9, 243–259. [Google Scholar] [CrossRef]
  66. Feranec, J.; Soukup, T.; Hazeu, G.; Jaffrain, G. European Landscape Dynamics: CORINE Land Cover Data; CRC Press: Boca Raton, FL, USA, 2016. [Google Scholar] [CrossRef]
  67. Schneider, A. Monitoring Land Cover Change in Urban and Peri-Urban Areas Using Dense Time Stacks of Landsat Satellite Data and a Data Mining Approach. Remote Sens. Env. 2012, 124, 689–704. [Google Scholar] [CrossRef]
  68. Samal, D.R.; Gedam, S.S. Monitoring Land Use Changes Associated with Urbanization: An Object Based Image Analysis Approach. Eur. J. Remote Sens. 2015, 48, 85–99. [Google Scholar] [CrossRef]
  69. Patino, J.E.; Duque, J.C. A Review of Regional Science Applications of Satellite Remote Sensing in Urban Settings. Comput. Env. Urban Syst. 2013, 37, 1–17. [Google Scholar] [CrossRef]
  70. Andrusz, G.; Harloe, M.; Szelenyi, I. (Eds.) Cities After Socialism; Blackwell Publishers Ltd.: Oxford, UK, 1996. [Google Scholar] [CrossRef]
  71. Institutul Național de Statistică (National Institute os Statistics). Anuarul Statistic al României-Serii de Timp (CD-ROM); Institutul Național de Statistică: Bucharest, Romania, 2020. [Google Scholar]
  72. Koceva, M.M.; Brandmüller, T.; Lupu, I.; Önnerfors, Å.; Corselli-Nordblad, L.; Coyette, C.; Johansson, A.; Strandell, H.; Wolff, P. Urban Europe: Statistics on Cities, Towns and Suburbs, 2016th ed.; Europäische Kommission, Ed.; Statistical books/Eurostat; Publications Office of the European Union: Luxembourg, 2016. [Google Scholar]
  73. Hess, D.B.; Tammaru, T.; van Ham, M. Lessons Learned from a Pan-European Study of Large Housing Estates: Origin, Trajectories of Change and Future Prospects. In Housing Estates in Europe: Poverty, Ethnic Segregation and Policy Challenges; Hess, D.B., Tammaru, T., van Ham, M., Eds.; Springer International Publishing: Cham, Switzerland, 2018; pp. 3–31. [Google Scholar] [CrossRef] [Green Version]
  74. Marin, V.; Chelcea, L. The Many (Still) Functional Housing Estates of Bucharest, Romania: A Viable Housing Provider in Europe’s Densest Capital City. In Housing Estates in Europe: Poverty, Ethnic Segregation and Policy Challenges; Hess, D.B., Tammaru, T., van Ham, M., Eds.; Springer International Publishing: Cham, Switzerland, 2018; pp. 167–190. [Google Scholar] [CrossRef] [Green Version]
  75. Ianoş, I. Dinamica Urbană: Aplicaţii la Oraşul și Sistemul Urban Românesc; Editura Tehnică: Bucharest, Romania, 2004. [Google Scholar]
  76. Ianoş, I.; Petrişor, A.-I.; Zamfir, D.; Cercleux, A.L.; Stoica, I.V.; Tălângă, C. In Search of a Relevant Index Measuring Territorial Disparities in a Transition Country. Romania as a Case Study. Erde J. Geogr. Soc. Berl. 2013, 144, 69–81. [Google Scholar] [CrossRef]
  77. Pîrvu, R.; Bădîrcea, R.; Manta, A.; Lupăncescu, M. The Effects of the Cohesion Policy on the Sustainable Development of the Development Regions in Romania. Sustainability 2018, 10, 2577. [Google Scholar] [CrossRef] [Green Version]
  78. Popescu, C. Foreign Direct Investments and Regional Development in Romania. Rev Roum. Géogrrom. J. Geogr. 2012, 56, 61–70. [Google Scholar]
  79. European Commission; Statistical Office of the European Union. Eurostat Regional Yearbook: 2019 Edition; 2019. Available online: https://ec.europa.eu/eurostat/documents/3217494/10095393/KS-HA-19%E2%80%91001-EN-N.pdf/d434affa-99cd-4ebf-a3e3-6d4a5f10bb07 (accessed on 5 February 2020).
  80. Stoica, I.V.; Tălângă, C.; Braghină, C.; Zamfir, D. Ways of Managing the Urban-Rural Interface. Case Study: Bucharest. An. Univ. Din Oradea–Ser. Geogr. 2011, 21, 313–322. [Google Scholar]
  81. Ianoș, I.; Sîrodoev, I.; Pascariu, G. Built-up Space Dynamics Complicates the Present-Day Urban Land Use in Bucharest. An. Univ. Din Oradea-Ser. Geogr. 2012, 22, 48–53. [Google Scholar]
  82. Ianoş, I.; Cercleux, A.-L.; Pintilii, R.-D. Remarks on Identity Building of Rural and Urban Communities in the Bucharest Metropolitan Area. An. Univ. Din Oradea–Ser. Geogr. 2010, 20, 173–183. [Google Scholar]
  83. European Environment Agency. Corine Land Cover (CLC) 2018, Version 20b2. Available online: https://land.copernicus.eu/pan-european/corine-land-cover/clc2018 (accessed on 20 January 2020).
  84. Sandric, I.; Mihai, B.; Savulescu, I.; Suditu, B.; Chitu, Z. Change Detection Analysis for Urban Development in Bucharest-Romania, Using High Resolution Satellite Imagery. In Proceedings of the 2007 Urban Remote Sensing Joint Event, Paris, France, 1–13 April 2007; IEEE: Piscataway, NJ, USA, 2007; pp. 1–8. [Google Scholar] [CrossRef]
  85. Roy, D.P.; Wulder, M.A.; Loveland, T.R.; Woodcock, C.E.; Allen, R.G.; Anderson, M.C.; Helder, D.; Irons, J.R.; Johnson, D.M.; Kennedy, R.; et al. Landsat-8: Science and Product Vision for Terrestrial Global Change Research. Remote Sens. Env. 2014, 145, 154–172. [Google Scholar] [CrossRef] [Green Version]
  86. Vermote, E.; Justice, C.; Claverie, M.; Franch, B. Preliminary Analysis of the Performance of the Landsat 8/OLI Land Surface Reflectance Product. Remote Sens. Env. 2016, 185, 46–56. [Google Scholar] [CrossRef]
  87. Ottinger, M.; Kuenzer, C.; Liu, G.; Wang, S.; Dech, S. Monitoring Land Cover Dynamics in the Yellow River Delta from 1995 to 2010 Based on Landsat 5 TM. Appl. Geogr. 2013, 44, 53–68. [Google Scholar] [CrossRef]
  88. Rujoiu-Mare, M.-R.; Olariu, B.; Mihai, B.-A.; Nistor, C.; Săvulescu, I. Land Cover Classification in Romanian Carpathians and Subcarpathians Using Multi-Date Sentinel-2 Remote Sensing Imagery. Eur. J. Remote Sens. 2017, 50, 496–508. [Google Scholar] [CrossRef] [Green Version]
  89. “Danube Delta” National Institute For Research And Development. Available online: http://ddni.ro/wps/ro/project/corine-land-cover-2018_ro/ (accessed on 16 January 2020).
  90. Tso, B.; Mather, P.M. Classification Methods for Remotely Sensed Data, 2nd ed.; CRC Press: Boca Raton, FL, USA, 2009. [Google Scholar]
  91. National Agency for Cadastre and Land Registration. Ortophotos, 2017, 0.5 m spatial resolution, digital geospatial dataset in Stereographic 1970 national projection, RGB imagery, 2017.
  92. Campbell, J.B.; Wynne, R.H. Introduction to Remote Sensing, 5th ed.; Guilford Press: New York, NY, USA, 2011. [Google Scholar]
  93. Romanian Military Mapping Directorate. Topographic Maps of Romania scale 1:25,000, Georeferenced in Stereographic 1970 national projection; Romanian Military Mapping Directorate: Bucharest, Romania, 1982. [Google Scholar]
  94. Chuvieco, E. Fundamentals of Satellite Remote Sensing: An Environmental Approach, 2nd ed.; CRC Press: Boca Raton, FL, USA, 2016. [Google Scholar] [CrossRef]
  95. Congalton, R.G. A Review of Assessing the Accuracy of Classifications of Remotely Sensed Data. Remote Sens. Env. 1991, 37, 35–46. [Google Scholar] [CrossRef]
  96. Foody, G.M. Status of Land Cover Classification Accuracy Assessment. Remote Sens. Env. 2002, 80, 185–201. [Google Scholar] [CrossRef]
  97. Pătroescu, M.; Vânău, G.; Niţă, M.R.; Iojă, C.; Iojă, A. Land Use Change in the Bucharest Metropolitan Area and Its Impacts on the Quality of the Environment in Residential Developments. Forum Geogr. 2011, 10, 177–186. [Google Scholar] [CrossRef]
  98. Dumitrache, L.; Zamfir, D.; Nae, M.M.; Simion, G.; Stoica, V. The Urban Nexus: Contradictions and Dilemmas of (Post)Communist (Sub)Urbanization in Romania. Hum. Geogr. J. Stud. Res. Hum. Geogr. 2016, 10, 38–50. [Google Scholar] [CrossRef] [Green Version]
  99. Nae, M.; Turnock, D. The New Bucharest: Two Decades of Restructuring. Cities 2011, 28, 206–219. [Google Scholar] [CrossRef]
  100. Simion, G.; Nistor, C. Spatial Structure Changes inside Post-Communist Capital City of Bucharest. Hum. Geogr. J. Stud. Res. Hum. Geogr. 2012, 6, 79–89. [Google Scholar] [CrossRef]
  101. Tălânga, C.; Zamfir, D.; Stoica, I.-V. Urban-Rural Interface, Polycentric Development and Transportation Systems. Case Study: Bucharest Metropolitan Area. Hum. Geogr. J. Stud. Res. Hum. Geogr. 2010, 4, 47–52. [Google Scholar]
  102. Planul de Mobilitate Urbană Durabilă 2016-2030 Regiunea București–Ilfov. 2016. Available online: https://tpbi.ro/files/proiect_pmud.pdf (accessed on 20 January 2020).
  103. Guvernul României. Ordonanța de Urgență Nr. 51/2018 Pentru Modificarea Legii Nr. 350/2001 Privind Amenajarea Teritoriului Și Urbanismul Și Pentru Prorogarea Unor Termene; Monitorul official: Bucharest, Romania, 2018; Volume 520. [Google Scholar]
  104. McNeill, D. Dysfunctional Urbanism. Int. J. Urban Reg. Res. 2005, 29, 201–204. [Google Scholar] [CrossRef]
  105. Petrişor, A.-I.; Ianoş, I.; Tălângă, C. Land Cover and Use Changes Focused on the Urbanization Processes in Romania. Env. Eng. Manag. J. 2010, 9, 765–771. [Google Scholar] [CrossRef]
  106. Iojă, C.I.; Niţă, M.R.; Vânău, G.O.; Onose, D.A.; Gavrilidis, A.A. Using Multi-Criteria Analysis for the Identification of Spatial Land-Use Conflicts in the Bucharest Metropolitan Area. Contemp. Concepts Nov. Methods Foster. Indic. Based Approach Urban Complexities 2014, 42, 112–121. [Google Scholar] [CrossRef]
  107. Ianoș, I.; Merciu, F.C.; Merciu, G.; Zamfir, D.; Stoica, I.-V.; Vlăsceanu, G. Unclear Perspectives for a Specific Intra-Urban Space: Văcărești Lake Area (Bucharest City). Carpathian J. Earth Env. Sci. 2014, 9, 215–224. [Google Scholar]
  108. Merciu, F.C.; Sîrodoev, I.; Merciu, G.; Zamfir, D.; Schvab, A.; Stoica, I.V.; Paraschiv, M.; Saghin, I.; Cercleux, A.L.; Văidianu, N.; et al. The “Văcărești Lake” Protected Area, a Neverending Debatable Issue? Carpathian J. Earth Env. Sci. 2017, 12, 463–472. [Google Scholar]
  109. Ianos, I.; Zamfir, D.; Stoica, V.; Cercleux, L.; Schvab, A.; Pascariu, G. Municipal solid waste management for sustainable development of bucharest metropolitan area. Env. Eng. Manag. J. 2012, 11, 359–369. [Google Scholar] [CrossRef]
  110. ARCADIS. Stația de Epurare a Apelor Uzate Glina București Faza II (România). Planul de Implicare a Părților Interesate; ARCADIS: Amsterdam, The Netherlands, 2017. [Google Scholar]
  111. Suditu, B.; Ginavar, A.; Muică, A.; Iordăchescu, A.; Vârdol, A.; Ghinea Bogdan. Urban Sprawl Characteristics and Typologies in Romania. Hum. Geogr. J. Stud. Res. Hum. Geogr. 2010, 4, 79–87. [Google Scholar]
  112. Suditu, B. Urban Sprawl–the Legal Context and Territorial Practices in Romania. Hum. Geogr. J. Stud. Res. Hum. Geogr. 2012, 6, 73–77. [Google Scholar] [CrossRef] [Green Version]
  113. Iojă, C.I.; Tudor, C.A. Temporal Analysis of Incompatible Land-Use and Land-Cover: The Proximity between Residential Areas and Gas Stations in Bucharest Suburban Area. In Proceedings of the 2011 International Conference Environment–Landscape–European Identity, Bucharest, Romania, 4–6 November 2012; Volume 14, pp. 49–58. [Google Scholar] [CrossRef] [Green Version]
  114. Grădinaru, S.R.; Iojă, C.I.; Onose, D.A.; Gavrilidis, A.A.; Pătru-Stupariu, I.; Kienast, F.; Hersperger, A.M. Land Abandonment as a Precursor of Built-up Development at the Sprawling Periphery of Former Socialist Cities. Ecol. Indic. 2015, 57, 305–313. [Google Scholar] [CrossRef]
  115. Petrișor, A.-I. Land Cover and Land Use Analysis of Urban Growth in Romania. Hum. Geogr. J. Stud. Res. Hum. Geogr. 2012, 6, 47–51. [Google Scholar] [CrossRef] [Green Version]
  116. Ianoş, I.; Petrişor, A.-I.; Stoica, I.V.; Sârbu, C.N.; Zamfir, D.; Cercleux, A.-L. The Different Consuming of Primary Eco-Energies and Their Degradation in Territorial Systems. Carpathian J. Earth Env. Sci. 2011, 6, 251–260. [Google Scholar]
  117. Petrişor, A.-I. Long Term Urbanization within and around the Large Cities in Developing Countries: A Romanian Perspective on the Main Transitional Dynamics. Alger. J. Eng. Arch. Urban. 2017, 1, 14–19. [Google Scholar]
  118. Yang, C.; Li, Q.; Zhao, T.; Liu, H.; Gao, W.; Shi, T.; Guan, M.; Wu, G. Detecting Spatiotemporal Features and Rationalities of Urban Expansions within the Guangdong–Hong Kong–Macau Greater Bay Area of China from 1987 to 2017 Using Time-Series Landsat Images and Socioeconomic Data. Remote Sens. 2019, 11, 2215. [Google Scholar] [CrossRef] [Green Version]
  119. Pflugmacher, D.; Rabe, A.; Peters, M.; Hostert, P. Mapping Pan-European Land Cover Using Landsat Spectral-Temporal Metrics and the European LUCAS Survey. Remote Sens. Env. 2019, 221, 583–595. [Google Scholar] [CrossRef]
  120. Petrişor, A.-I.; Petrişor, L.E. Assessing Microscale Environmental Changes: CORINE Vs. The Urban Atlas. Present Env. Sustain. Dev. 2015, 9, 95–104. [Google Scholar] [CrossRef] [Green Version]
  121. Mesev, V. Classification of Urban Areas: Inferring Land Use from the Interpretation of Land Cover. In Remote Sensing of Urban and Suburban Areas; Rashed, T., Jürgens, C., Eds.; Remote Sensing and Digital Image Processing; Springer: Dordrecht, The Netherlands, 2010; Volume 10, pp. 141–164. [Google Scholar] [CrossRef]
  122. Jia, K.; Wei, X.; Gu, X.; Yao, Y.; Xie, X.; Li, B. Land Cover Classification Using Landsat 8 Operational Land Imager Data in Beijing, China. Geocarto Int. 2014, 29, 941–951. [Google Scholar] [CrossRef]
  123. Jia, K.; Liang, S.; Zhang, N.; Wei, X.; Gu, X.; Zhao, X.; Yao, Y.; Xie, X. Land Cover Classification of Finer Resolution Remote Sensing Data Integrating Temporal Features from Time Series Coarser Resolution Data. ISPRS J. Photogramm. Remote Sens. 2014, 93, 49–55. [Google Scholar] [CrossRef]
  124. Gong, W.; Yuan, L.; Fan, W.; Wang, X.; Stott, P. Comparison to Supervised Classification Modelling in Land Use Cover Using Landsat 8 OLI Data: An Example in Miyun County of North China. Nat. Env. Pollut. Technol. 2016, 15, 243–248. [Google Scholar]
  125. Lee, J.K.; Acharya, T.D.; Lee, D.H. Exploring Land Cover Classification Accuracy of Landsat 8 Image Using Spectral Index Layer Stacking in Hilly Region of South Korea. Sens. Mater. 2018, 30, 2927. [Google Scholar] [CrossRef]
  126. Griffiths, P.; Nendel, C.; Hostert, P. Intra-Annual Reflectance Composites from Sentinel-2 and Landsat for National-Scale Crop and Land Cover Mapping. Remote Sens. Env. 2019, 220, 135–151. [Google Scholar] [CrossRef]
  127. Bayramov, E.; Buchroithner, M.; Bayramov, R. Quantitative Assessment of 2014–2015 Land-Cover Changes in Azerbaijan Using Object-Based Classification of LANDSAT-8 Timeseries. Model. Earth Syst. Env. 2016, 2, 35. [Google Scholar] [CrossRef] [Green Version]
  128. Feng, D.; Zhao, Y.; Yu, L.; Li, C.; Wang, J.; Clinton, N.; Bai, Y.; Belward, A.; Zhu, Z.; Gong, P. Circa 2014 African Land-Cover Maps Compatible with FROM-GLC and GLC2000 Classification Schemes Based on Multi-Seasonal Landsat Data. Int. J. Remote Sens. 2016, 37, 4648–4664. [Google Scholar] [CrossRef]
  129. Mushore, T.D.; Mutanga, O.; Odindi, J.; Dube, T. Assessing the Potential of Integrated Landsat 8 Thermal Bands, with the Traditional Reflective Bands and Derived Vegetation Indices in Classifying Urban Landscapes. Geocarto Int. 2017, 32, 886–899. [Google Scholar] [CrossRef]
  130. Liu, Q.; Liu, G. Combining Tasseled Cap Transformation with Support Vector Machine to Classify Landsat TM Imagery Data. In Proceedings of the 2010 Sixth International Conference on Natural Computation, Yantai, China, 10–12 August 2010; IEEE: Piscataway, NJ, USA, 2010; pp. 3570–3572. [Google Scholar] [CrossRef]
  131. Li, S.; Chen, X. A New Bare-Soil Index for Rapid Mapping Developing Areas Using LANDSAT 8 Data. ISPRS Int. Arch. Photogramm. Remote Sens. Spat. Inf. Sci. 2014, 40, 139–144. [Google Scholar] [CrossRef] [Green Version]
  132. Li, X.; Zhou, W.; Ouyang, Z. Forty Years of Urban Expansion in Beijing: What Is the Relative Importance of Physical, Socioeconomic, and Neighborhood Factors? Appl. Geogr. 2013, 38, 1–10. [Google Scholar] [CrossRef]
  133. Hua, L.; Zhang, X.; Chen, X.; Yin, K.; Tang, L. A Feature-Based Approach of Decision Tree Classification to Map Time Series Urban Land Use and Land Cover with Landsat 5 TM and Landsat 8 OLI in a Coastal City, China. ISPRS Int. J. Geo Inf. 2017, 6, 331. [Google Scholar] [CrossRef] [Green Version]
  134. Nguyen Dinh, D. Automated Classification of Land Cover Using Landsat 8 Oli Surface Reflectance Product and Spectral Pattern Analysis Concept - Case Study in Hanoi, Vietnam. ISPRS Int. Arch. Photogramm. Remote Sens. Spat. Inf. Sci. 2016, XLI-B8, 987–991. [Google Scholar] [CrossRef]
  135. Zhou, Y.; Yang, G.; Wang, S.; Wang, L.; Wang, F.; Liu, X. A New Index for Mapping Built-up and Bare Land Areas from Landsat-8 OLI Data. Remote Sens. Lett. 2014, 5, 862–871. [Google Scholar] [CrossRef]
  136. Bossard, M.; Feranec, J.; Otahel, J. Corine Land Cover—Technical Guide-Addendum 2000; Technical Report 40; European Environment Agency: Copenhagen, Denmark, 2000. [Google Scholar]
  137. Feranec, J.; Hazeu, G.; Christensen, S.; Jaffrain, G. Corine Land Cover Change Detection in Europe (Case Studies of the Netherlands and Slovakia). Land Use Policy 2007, 24, 234–247. [Google Scholar] [CrossRef]
  138. Caetano, M.; Nunes, V.; Nunes, A. CORINE Land Cover 2006 for Continental Portugal; Technical Report; Instituto Geográfico Português: Faro, Portugal, 2009. [Google Scholar]
  139. Balzter, H.; Cole, B.; Thiel, C.; Schmullius, C. Mapping CORINE Land Cover from Sentinel-1A SAR and SRTM Digital Elevation Model Data Using Random Forests. Remote Sens. 2015, 7, 14876–14898. [Google Scholar] [CrossRef] [Green Version]
  140. Stathopoulou, M.; Cartalis, C. Daytime Urban Heat Islands from Landsat ETM+ and Corine Land Cover Data: An Application to Major Cities in Greece. Sol. Energy 2007, 81, 358–368. [Google Scholar] [CrossRef]
  141. Törmä, M.; Härmä, P.; Teiniranta, R.; Repo, R.; Järvenpää, E.; Kallio, E. The Production of Finnish Corine Land Cover 2000 Classification. Prod. Finn. Corine Land Cover 2000 Classif. 2004. [Google Scholar]
  142. Bronge, L.B.; Näslund-Landenmark, B. Wetland Classification for Swedish CORINE Land Cover Adopting a Semi-Automatic Interactive Approach. Can. J. Remote Sens. 2002, 28, 139–155. [Google Scholar] [CrossRef]
  143. Yüksel, A.; Akay, A.; Gundogan, R. Using ASTER Imagery in Land Use/Cover Classification of Eastern Mediterranean Landscapes According to CORINE Land Cover Project. Sensors 2008, 8, 1237–1251. [Google Scholar] [CrossRef] [PubMed] [Green Version]
  144. Pekkarinen, A.; Reithmaier, L.; Strobl, P. Pan-European Forest/Non-Forest Mapping with Landsat ETM+ and CORINE Land Cover 2000 Data. ISPRS J. Photogramm. Remote Sens. 2009, 64, 171–183. [Google Scholar] [CrossRef]
  145. Yılmaz, R. Monitoring Land Use/Land Cover Changes Using CORINE Land Cover Data: A Case Study of Silivri Coastal Zone in Metropolitan Istanbul. Env. Monit. Assess. 2010, 165, 603–615. [Google Scholar] [CrossRef] [PubMed]
  146. Martellozzo, F. Forecasting High Correlation Transition of Agricultural Landscapes into Urban Areas: Diachronic Case Study in North Eastern Italy. Int. J. Agric. Env. Inf. Syst. 2012, 3, 22–34. [Google Scholar] [CrossRef] [Green Version]
Figure 1. Location map of the study area.
Remotesensing 12 02137 g001
Figure 2. Scheme of the integrated Landsat image processing–CLC vector data analysis for built-up area diachronic mapping in Bucharest and Ilfov County, Romania (1990-2018).
Remotesensing 12 02137 g002
Figure 3. Built-up area in the Bucharest–Ilfov Region reflected by CLC datasets (left) and automatically generated from Landsat datasets (right) for 1990 and 2018 time references.
Remotesensing 12 02137 g003
Figure 4. Built-up area coverage in the Bucharest–Ilfov Region for both time references on CLC (left) and Landsat classification (right).
Remotesensing 12 02137 g004
Figure 5. Built-up area dynamics between 1990 and 2018, as resulted from CLC and Landsat classification datasets.
Remotesensing 12 02137 g005
Figure 6. The built-up area difference maps between 1990 and 2018 at the administrative units’ level, based on CLC (left) and Landsat classification (right) datasets.
Remotesensing 12 02137 g006
Figure 7. Map of random point sampling for Bucharest–Ilfov area used in accuracy evaluation of CLC and Landsat classification of built-up areas (1990 and 2018).
Remotesensing 12 02137 g007
Figure 8. Comparative mapping of the change in the built-up (1990/2018) in the southeastern edge of Bucharest. Landsat TM (1990) and OLI (2018) imagery from USGS, topographic map (1981) from the DTM (Military Topographical Directorate) and aerial orthophotos (2017) by ANCPI (National Agency of Cadastre and Land Registration).
Remotesensing 12 02137 g008
Figure 9. Comparative mapping of the change in the built-up (1990/2018) in the southeastern edge of Bucharest. Landsat TM (1990) and OLI (2018) imagery from USGS, topographic map (1981) from the DTM (Military Topographical Directorate) and aerial orthophotos (2017) by ANCPI (National Agency of Cadastre and Land Registration).
Remotesensing 12 02137 g009
Figure 10. Comparative mapping of the change in the built-up area (1990/2018) in Domnești village to the west of Bucharest. Landsat TM (1990) and OLI (2018) imagery from USGS, topographic map (1981) from the DTM (Military Topographical Directorate) and aerial orthophotos (2017) by ANCPI (National Agency of Cadastre and Land Registration).
Remotesensing 12 02137 g010
Figure 11. Comparative mapping of change in the built-up area (1990/2018) in Merii Petchii and Nuci villages, on the northeastern edge of Ilfov County. Landsat TM (1990) and OLI (2018) imagery from USGS, topographic map (1981) from the DTM (Military Topographical Directorate) and aerial orthophotos (2017) by ANCPI (National Agency of Cadastre and Land Registration).
Remotesensing 12 02137 g011
Figure 12. Comparative mapping of the change in the built-up area (1990/2018) around Glina village in the southeastern part of Ilfov County. Landsat TM (1990) and OLI (2018) imagery from USGS, topographic map (1981) from the DTM (Military Topographical Directorate) and aerial orthophotos (2017) by ANCPI (National Agency of Cadastre and Land Registration).
Remotesensing 12 02137 g012
Table 1. Data types and data sources used in the analysis.
DatasetTime ReferenceDescriptionSource
Landsat 5 TM–multidate satellite imagesJanuary 5, 1990
January 12, 1990
August 14, 1990
6-band multispectral data (raster datasets);
30 m spatial resolution;
8-bits radiometric resolution;
NASA USGS
earthexplorer.usgs.gov
Landsat 8 OLI–multidate satellite imagesJanuary 6, 2018
April 12, 2018
August 27, 2018
September 19, 2018
October 5, 2018
7-band multispectral data (raster datasets);
30 m spatial resolution;
16-bits radiometric resolution;
NASA USGS
earthexplorer.usgs.gov
Corine Land Cover Dataset 1990Time consistency 1986–199825 ha MMU (vector polygon coverage);
Extracted from single-date Landsat 5 imagery by visual interpretation;
Copernicus EU
land.copernicus.eu
Corine Land Cover Dataset 2018Time consistency 2017–201825 ha MMU (vector polygon coverage);
Extracted from Sentinel-2 and Landsat 8 imagery by visual interpretation;
Copernicus EU
land.copernicus.eu
Administrative units2018Vector data;National Agency for Cadastre and Land Registration (ANCPI)
Table 2. Built-up area surfaces comparison in Bucharest–Ilfov Region (1990–2018), based on CLC and Landsat classification datasets.
NameTotal Surface (ha)Built-Up Area 1990 (ha)Built-Up Area 2018 (ha)Built-Up Area Changes 1990–2018 (ha)
Corine Land Cover dataset
Bucharest24,037.4115,475.3617,649.902174.54
Ilfov County156,386.7116,420.7326,767.8910,347.16
Total Bucharest–Ilfov Region180,424.1231,896.0944,417.7912,521.70
Landsat classification dataset
Bucharest24,037.4116,284.0718,147.541863.47
Ilfov County156,386.719586.1424,506.7114,920.57
Total Bucharest–Ilfov Region180,424.1225,870.2142,654.2516,784.04
Discrepancies (CLC datasets–Landsat classification datasets)
Bucharest 0.00−808.71−497.64311.07
Ilfov County0.006834.592261.18−4573.41
Total Bucharest–Ilfov Region0.006025.881763.54−4262.34
Table 3. Main accuracies of built-up land cover mapping from CLC 1990/2018 and thematic classification of Landsat TM (1990)/Landsat OLI (2018).
19902018
CLCLandsat 5 TMCLCLandsat 8 OLI
Overall accuracy (%)93.666795.333394.000095.6667
Kappa coefficient0.92580.94530.91820.9409
Table 4. Synthetic comparison of the built-up area mapping, at the local level, between CLC and Landsat datasets.
19902018
CLCLandsatCLCLandsat
Bucharest—Sector 4Slightly overestimatedModerately
overestimated
Moderately
overestimated
Moderately
overestimated
Crețești villageSubstantially overestimatedSlightly overestimatedModerately
underestimated
Substantially overestimated
Domnești villageModerately overestimatedSlightly overestimated Substantially overestimatedSlightly overestimated
Merii Petchii and Nuci villagesSubstantially overestimatedModerately
underestimated
Slightly overestimatedSubstantially overestimated
Glina villageSubstantially overestimatedSubstantially overestimatedSubstantially overestimatedModerately
overestimated

