Article

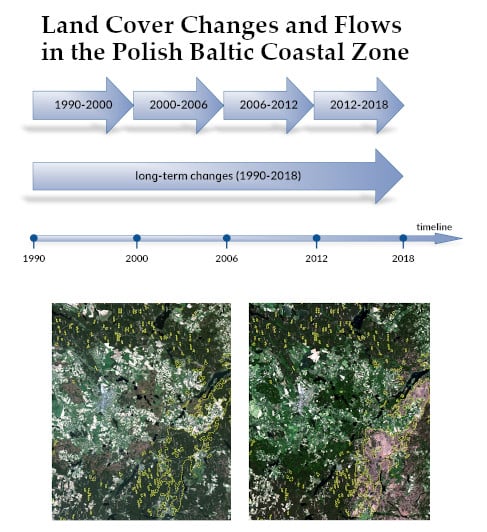
Land Cover Changes and Flows in the Polish Baltic Coastal Zone: A Qualitative and Quantitative Approach

by
Elzbieta Bielecka
,
Agnieszka Jenerowicz
,
Krzysztof Pokonieczny
* and
Sylwia Borkowska
Faculty of Civil Engineering and Geodesy, Military University of Technology, 00-908 Warsaw, Poland
*
Author to whom correspondence should be addressed.
Remote Sens. 2020, 12(13), 2088; https://doi.org/10.3390/rs12132088
Submission received: 26 May 2020 / Revised: 26 June 2020 / Accepted: 27 June 2020 / Published: 29 June 2020
(This article belongs to the Special Issue Remote Sensing Applications in Coastal Environment)

Abstract

:
Detecting land cover changes requires timely and accurate information, which can be assured by using remotely sensed data and Geographic Information System(GIS). This paper examines spatiotemporal trends in land cover changes in the Polish Baltic coastal zone, especially the urbanisation, loss of agricultural land, afforestation, and deforestation. The dynamics of land cover change and its impact were discussed as the major findings. The analysis revealed that land cover changes on the Polish Baltic coast have been consistent throughout the 1990–2018 period, and in the consecutive inventories of land cover, they have changed faster. As shown in the research, the area of agricultural land was subject to significant change, i.e., about 40% of the initial 8% of the land area in heterogeneous agriculture was either developed or abandoned at about equal rates. Next, the steady growth of the forest and semi-natural area also changed the land cover. The enlargement of the artificial surface was the third observed trend of land cover changes. However, the pace of land cover changes on the Baltic coast is slightly slower than in the rest of Poland and the European average. The region is very diverse both in terms of land cover, types of land transformation, and the pace of change. Hence, the Polish national authorities classified the Baltic coast as an area of strategic intervention requiring additional action to achieve territorial cohesion and the goals of sustainable development.

Graphical Abstract

1. Introduction

Land cover (LC) and its changes in space and time play a key role in recognising and understanding many physical and socioeconomic phenomena at any level. Therefore, concerns about land cover changes, in particular their quantitative and qualitative assessment, as well as the processes that affect them, have been reported in literature since the 1960s. It was noted that the change in land cover modifies albedo and heat fluxes [1], the exchange of energy in the surface–atmosphere interaction [2], carbon sequestration [3], and evapotranspiration [1], which finally affect the climate. Later, a much broader scope of the impact of land cover changes on ecosystem goods and services was identified, e.g., the vulnerability of places and people to climatic, economic, or sociopolitical perturbations, the ability of biological systems to support human needs [4], biotic diversity worldwide [5], and soil degradation [6]. Many of these changes remain a serious challenge today. As stated by Lambin et al. [7], many thought land changes mainly consisted in the conversion of arable land and forest to urban and industrial areas (urban sprawl), the transformation of forests to agricultural uses (deforestation), as well as the devastation of natural vegetation by overgrazing, which leads to desert conditions (desertification). These conversions were assumed to be irreversible and spatially homogeneous and to progress linearly [7]. However, as noticed by [7,8], not all impacts of LC changes are negative, as some are associated with growths in food and fiber production, in the efficiency of resource use, wealth, and well-being.
The coastal zone has been the main goal of the development of human society for centuries, which resulted in a land cover transformation. Urbanisation and industrialisation, tourism, fishing and other agricultural activities very often lead to environmental degradation, loss of biodiversity, and simplification of the landscape [9]. Halting the loss of biodiversity is an issue of both local and global concern, and it is one of the main strategic goals of the environmental policy of the European Union [10] as well as the United Nations Sustainable Development Goals (SDGs) defined in the “2030 Agenda” [11]. The most important of them are those explicitly related to coastal regions, i.e., Sustainable Cities and Communities—Goal 11, Climate Action—Goal 13, and Life below Water—Goal 14, as well as Goal 15—Protect, restore and promote sustainable use of terrestrial ecosystems, sustainably manage forests, combat desertification, and halt and reverse land degradation and halt biodiversity loss [12,13]. Satellite-derived information on land cover (use), as well as geographical distribution of population at the fine scale, provide an essential contribution to establishing measures to achieve the above objectives [14].
The European Union (EU) coastal regions are densely populated, being home to more than 41% of the total European population. However, population density varies depending on the geographical characteristic of the region, e.g., in Cyprus and Denmark 100% of people live in coastal regions, while in Romania only 5% live in coastal regions, and in Poland, only 12% do [15].
The coastal landscapes of the Baltic Sea are varied and show considerable regional differences. Based on a profound analysis of meteorological parameters of the Baltic Sea coastal region, e.g., air temperature (including the heat and cold waves), precipitation (rainfall), changes of the sea level (including storm surges and erosion of the coast), and sea monitoring data (e.g., salinity, acidity), the Institute of Meteorology and Water Management [16], identified warming of the troposphere and hydrosphere and change in rainfall intensity. The direct consequences of climate change comprise an increase of air temperature in all seasons of the year and changes of precipitation. Besides, such extreme phenomena as heat waves and longer dry and wet periods are also expected to occur more frequently. Climate change affects both ecosystems and the economy, but the effects vary depending on the geographical location and development. However, in the Baltic Sea region, despite climate change, transformation processes in the economy and agriculture that have been going on since the 1990s still have substantial and multiple impacts on ecosystems and human beings [17,18].
Land cover in the Polish Baltic coastal region is considered to be highly sensitive to observed climate change, since it is directly linked to weather and the environmental conditions [16,19]. However, the changes in land cover have not yet been assessed. Our study attempts to fill this gap by providing the first comprehensive quantitative and qualitative analysis of land cover changes and their nature in the Polish Baltic coastal zone in the last three decades, namely 1990–2018, the dates of the first and fifth CORINE Land Cover (CLC) data releases. Particularly, the trajectory of land cover changes in 1990–2018 was analysed with certain emphasis on urbanisation, agriculture intensification, and extensification, as well as afforestation and deforestation. Moreover, the study derives environmentally related indicators that could help monitor coastal management plans, and Spatial Development Goals 2030, especially goals 11 and 15. The study contributes to both research and policy fields. The introduction of CLC-based indicators makes it possible to determine the size and direction of land cover changes, and thus assess whether their impact on sustainable development is positive or negative. Considering the comprehensive analysis of land cover flows in the last three decades derives an effective footprint for establishing further sustainable development rules in the Polish Baltic Coast Region. Moreover, the research helps raise awareness to follow the spatial planning policy, particularly during rapid economic growth and spatial development.
The remainder of this paper is structured as follows: Section 2 describes the study area, data, and methods; Section 3 describes the results; Section 4 discusses the obtained results along with other achievements; finally, Section 5 concludes the research.

2. Materials and Methods

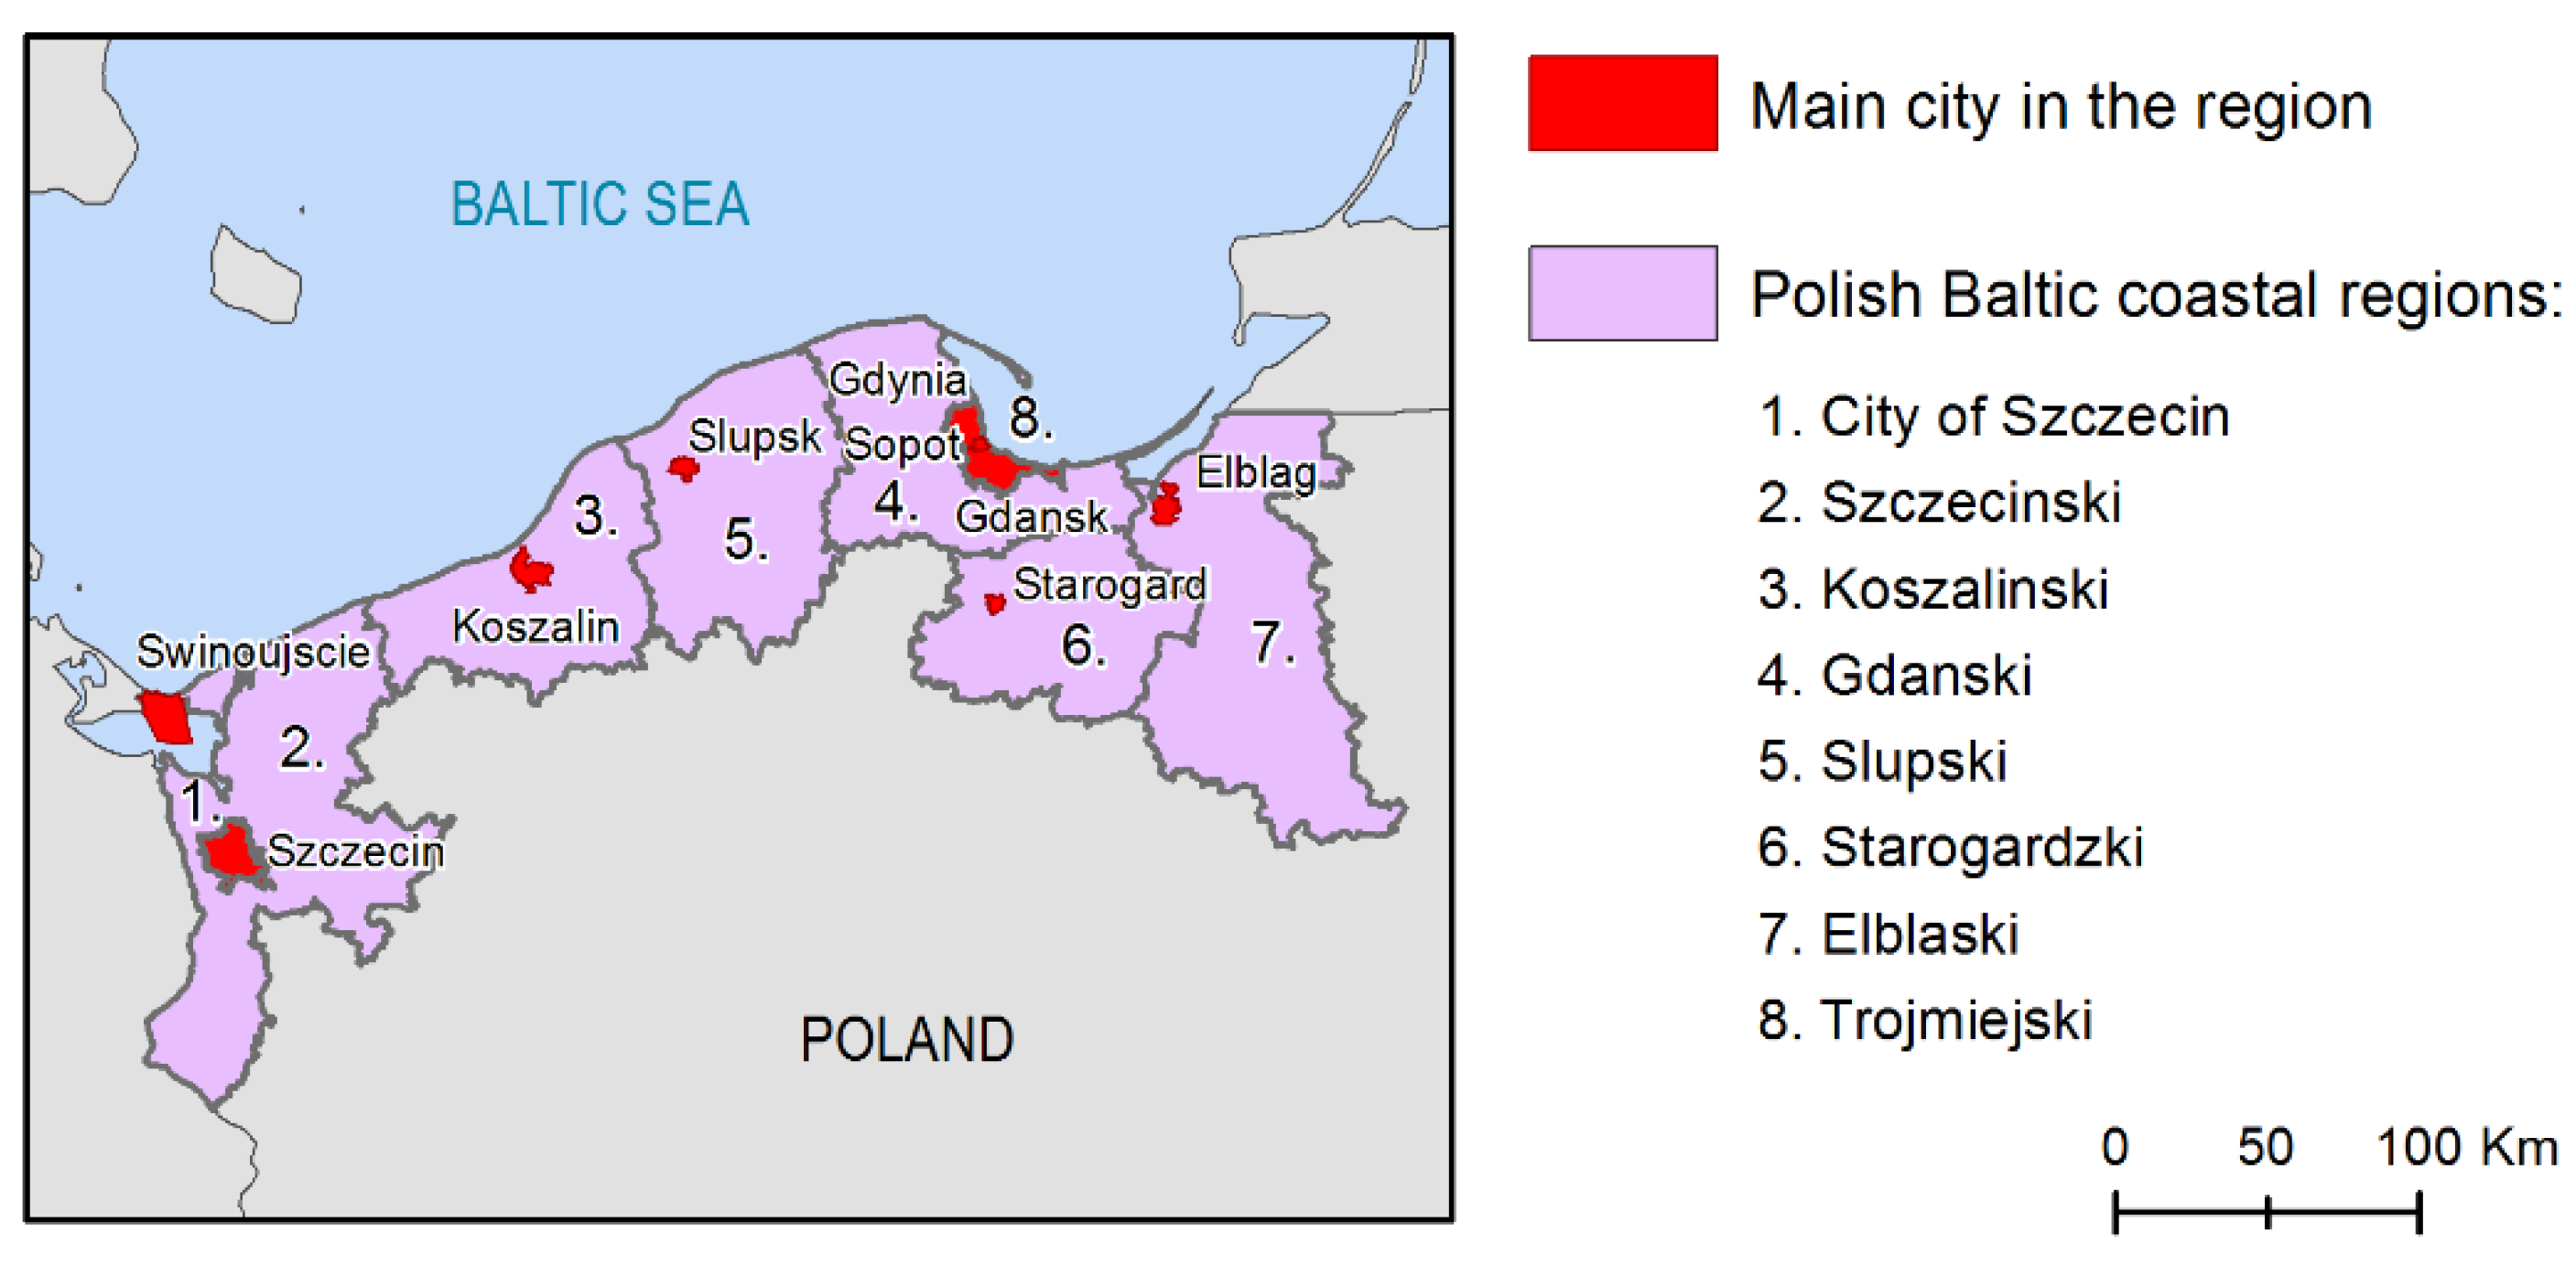
2.1. Area Description

The study covers the Polish Baltic coastal zone as defined by Eurostat [20], namely the NUTS3 administrative division having a border with a coastline or with more than half of their population living less than 50 km from the sea. It comprises the eight regions: Elblaski, Gdanski, Trojmiejski, Slupski, Koszalinski, Starogardzki, Szczecinski, and the city of Szczecin, as shown in Figure 1. They are further divided into 37 counties (NUTS4). Socioeconomic transformations and the incessant development of tourism, recreation, and associated services, as well as intense exploitation of marine resources have recently increased the role of the Polish coastal regions.
Approximately 3.9 million people live in the study area, which encompasses 33,482 km2 (see Table 1). With a mean population density of about 117 people per km2 (the country average is 123 people per km2), the study area is predominantly rural. Trojmiejski (comprises three cities: Gdansk, Gdynia, and Sopot) and the City of Szczecin regions are of significant industrial, economic, and cultural importance. The Baltic coastal zone is characterised by a 20.7% share of high nature value areas, which attract tourism development and improve the residents’ quality of life, but on the other hand, also restrict investment opportunities. The highest proportion of legally protected areas (NATURA2000, nature reserves, national parks, landscape parks), up to 30%, is found in the Szczecin (city), Gdanski, and Elblaski regions.
The Polish Baltic coast is 468 km long, without internal lagoonal coasts, including 428 km from Russia to the German border and 72 km of both sides of the Hel peninsula [22]. Dunes and sandy beaches dominate most of the Polish open coast (358 km), while cliffs are approximately 100 km long [22,23]. Two major gulfs: Pomerania Gulf in the west, and the Gulf of Gdansk in the east, as well as two large lagoons, the Szczecin Lagoon and the Vistula Lagoon, limit the Polish Baltic coast. About 26% of the coast is protected by groynes (98 km) and light and heavy revetments (41 km), which mostly protect the environment and densely populated areas [23].

2.2. Data used

2.2.1. CORINE Land Cover

CORINE Land Cover (CLC) is the European land cover database containing information on the physical and biological cover of the Earth’s surface including artificial surfaces, agricultural areas, forests, (semi-)natural areas, wetlands, and water bodies [24]. The information capture is generally based on computer-assisted photo-interpretation of satellite images (see Table 2), according to agreed, standardised, and hierarchical nomenclature. The temporal span for satellite acquisition data, as well as the sensor used for capturing the images, are the primary sources of uncertainty, significantly affecting the interpretation of land cover [25]. The first (highest) level comprises five land cover types, namely (1) artificial surfaces, (2) agricultural areas, (3) forest and semi-natural areas, (4) wetland and (5) water bodies, which are further divided into 15 land cover classes (level 2), and 44 classes at level 3. Until now, five CLC inventories are available for the reference years: 1990, 2000, 2006, 2012, 2018, as well as four LC changes for the periods 1990–2000; 2000–2006; 2006–2012; and 2012–2018 (see Figure A1). In Poland, the datasets are derived free of charge from the Chief Inspectorate of Environmental Protection [26].
Our study considers the second level of CLC nomenclature, and only those classes that are mapped in Poland, as presented in Table 3.

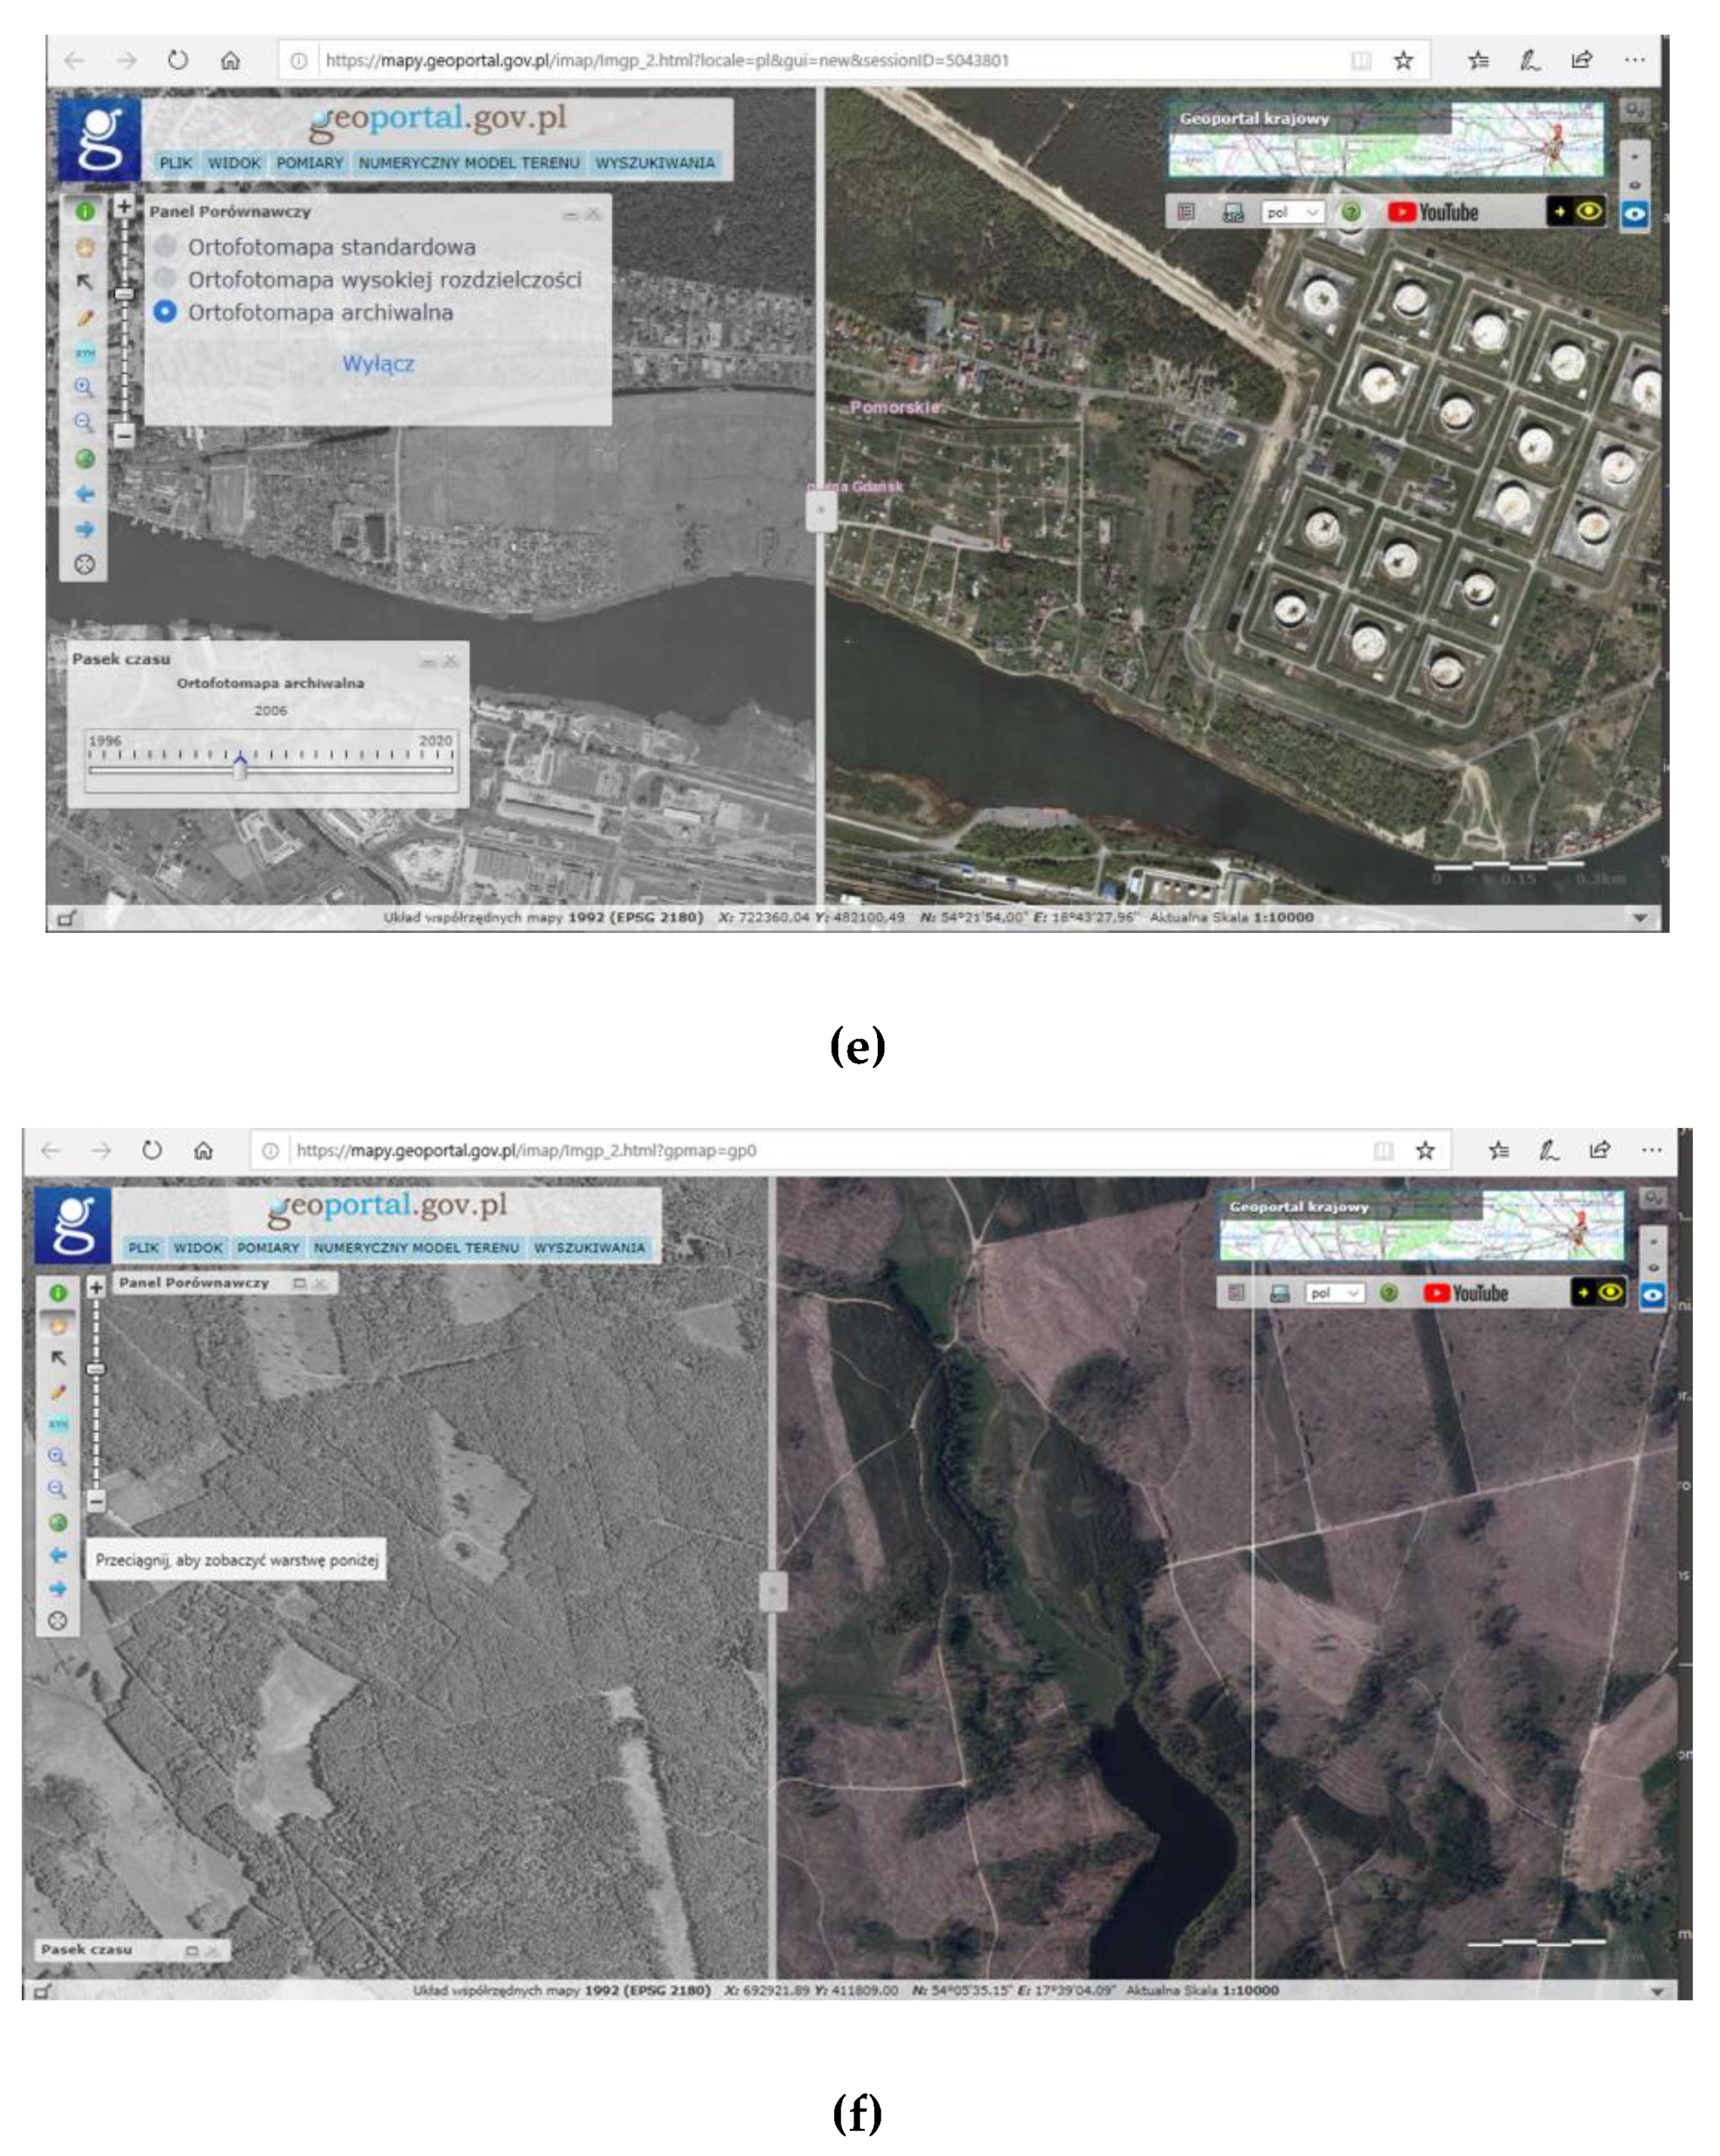
2.2.2. Satellite and Aerial Data

Prior to the analysis of changes in land cover and land flow, CLC change data were checked based on aerial orthophotomaps, high and very high-resolution mosaics elaborated within the frame of Copernicus land monitoring services as well as optical satellites (medium and high resolutions) available from open map services, as specified in Table 4 and shown in Figure A2.

2.2.3. Administrative Boundaries

The boundaries of NUTS3, small regions for specific diagnoses, were obtained from the Eurostat GISCO (Geographical Information and maps) [31,32]. Each NUTS unit is attributed a NUTS_CODE (unique code of the NUTS region as defined and published by Eurostat; NUTS_LABEL (name of the NUTS region as defined and published by Eurostat), and TAA (the type of the administrative area, i.e., land area or inland water). Further statistical and administrative division of Poland (counties) of the year 2018 was derived from the National Register of Boundaries (PRG) maintained by the Head Office of Geodesy and Cartography.

2.3. Methods Applied

2.3.1. Verification of Land Cover Changes

Data checking mainly involved verification of the CLC change code correctness. For the analyses, the correctness of the results of automatic change detection between classes resulting from the comparison of CLC databases from two relevant periods (e.g., 2000 and 2006). The analysis consisted mainly of visual analysis of remote sensing satellite imagery and verification, whether the change in the CLC database corresponds to the situation from multispectral satellite images. The analyses used data from open-source imagery data, i.e., GoogleEarth, USGS, and ESA Copernicus, that were not used when creating the Corine Land Cover databases. About 9% of land cover change polygons, randomly distributed in the Polish Baltic coastal zone for each time horizon and type of changes (see Figure A3), have been visually analysed. The smallest analysed polygon occupied 5 ha, and the largest occupied about 400 ha. The visual interpretation has been supported by the different colour composition of imagery data (Table 4). Prior to visual analysis, pan-sharpening of Landsat7 and Landsat 8 images was conducted. The nearest-neighbour diffusion-based pan-sharpening algorithm [33] was used to enhance the visual quality and improve the spatial resolution (to 15 m) of medium- resolution data. Moreover, almost all CLC changes that may lead to deforestation have been thoroughly investigated to look for forest management practices, in particular, sanitary clear-cuttings and planned logging that could lead to temporal deforestation.

2.3.2. Land Cover Changes Quantification

Land cover changes, defined as the transformation from one land cover class to another in two consecutive moments in time, were firstly categorised as land conversion or land modification following the definitions given by Lambin et al. [7,34]. Hence, land cover conversion means “the complete replacement of one cover type by another” and is measured by the shift from one CLC level 1 class to another (e.g., class 2—agricultural area to class 3—forests). These land cover changes result from such processes as urbanisation, deforestation (or afforestation), and agricultural expansion. On the other hand, land cover modification comprises all changes that “affect the character of the land cover without changing its overall classification” [7], e.g., extensification of agriculture, which is perceived as more beneficial to the environment.
This study aims to answer the following research questions:
  • What were the main land cover changes and land cover flows in the Polish Baltic coastal zone during the last three decades? Were they in line with the country average?
  • How did the changes in land cover affect the landscape in legally protected areas?
  • Is the spatial pattern of land cover changes clustered, dispersed, or random? Which regions are most affected by land cover changes?
  • How, positively or negatively, do changes in land cover affect the progress towards SDG?
The main trajectories of land cover changes were distinguished based on a slightly modified methodology introduced by Feranec et al. [35] that relies on an analysis of land cover transformation matrix during the analysed time period. Finally, the following land cover flows were identified to answer the above research questions:
LCF1—Urbanisation—refers to the conversion of agricultural land and forests into artificial surfaces (CLC classes 2.1, 2.2, 2.3, 3x, 4x to 1x).
LCF2—Expansion and intensification of agriculture—denotes conversion from natural and semi-natural areas (3.2, 3.3, 4.1, 4.2) into high-intensity agriculture (2.1; 2.2).
LCF3—Extensification of agriculture—states the modification from high to low-intensity forms of agriculture, namely from arable lands (2.1) and permanent crops (2.2) into pastures (2.3) or heterogeneous agricultural areas (2.4.).
LCF4—Afforestation—the re-creation of forest land, it generally comprises transformation from agriculture to forests.
LCF5—Deforestation—understood as the transition of forest land into non-forest land. Deforestation is predominantly associated with urbanisation (LCF1), i.e., transformation from forest to artificial surfaces, mainly 1.2, 1.3, and agricultural expansion, i.e., transformation of the forest into an agricultural area.
As the research focussed not only on land cover changes but also on their impact on achieving SDGs 2030, the following indices were calculated: land consumption rate (LConR), urban green space ratio (UGrR), forest cover ratio (FR), and the proportion of forest areas located within legally protected areas (FLPAP). They were the basis for calculating SDGs’ relevant indicators and contributed to monitoring progress goals 11 and 15. Primarily, these included target 11.3—towards the enhancement of inclusive and sustainable urbanisation, target 11.7—provide universal access to safe, inclusive, and accessible green and public spaces, as well as target 15.1—sustainable use of terrestrial ecosystems, in particular forests, and target 15.2—sustainable management of all types of forests, halt deforestation, restore degraded forests and substantially increase afforestation and reforestation globally.
Land consumption rate LConR, expressed in hectares per year, is defined as the ratio of the difference between the area occupied by artificial surfaces (ArtSf+1) at the final year (t + n) and the initial year (t) to the number of years (n) between land cover inventories (Equation (1)):
L C o n R = [ ( A S t + n A S t A S t ) 1 n ] 100 % .
The LConR relates directly to Goal 11 and allows us to calculate a measure of land use efficiency, which is defined as a ratio of land consumption rate to the population growth rate (11.3.1). The LConR index was computed for the Baltic Coastal zone in Poland, the Baltic coast regions (NUTS3), and protected areas.
The urban green space ratio in the year (UGrRt) denotes the percentage share of an urban green area (CLC class 1.4) in total city acreage (Equation (2)):
UGrRt = (UGt/Uarea(t)) × 100%
where UGt—urban green area (i.e., CLC 1.4, and 3.x classes) at the year t; Uarea(t)—urban area at the year t. With the CORINE Land Cover inventory, it allows comparing progress across cities towards the achievement of an optimal quantity of land allocated to public space (Goal 11, target 11.7 and indicator 11.7.1). The indicator was computed only for eight city counties, namely: Szczecin, Swinoujscie, Koszalin, Slupsk, Elblag, Gdansk, Gdynia, and Sopot, where the last three cities form the Trojmiejski (Tri-City) region.
The forest cover ratio (FR) is defined as the percentage of total forests and semi-natural areas (CLC level 2 cases 3.1 and 3.2) in the total land area at the time t. The measure predominantly applies to indicator 15.1.1., namely forest area (Farea(t)) as a proportion of total land area (Tarea(t)), Equation (3):
FR = (Farea(t)/Tarea(t)) × 100%.
The proportion of forest area located within legally protected areas (FLPAP(t)) at the analysed period t applies to 15.2.1 indicator—progress towards sustainable forest management (Equation (4)):
FLPAP(t) = (Farea(t)/LParea(t)) × 100%
where Farea(t)—forest area at the time t; LParea(t)—acreage of the legally protected area.
The spatial pattern of land cover changes was analysed by inferential statistics, namely Average Nearest Neighbour (ANN) and Ripley’s K function, assuming that complete spatial randomness is a realisation of a Poisson point process (the null hypothesis). ANN measures the average distance from each point to its nearest point, which is compared to the distances between the nearest points and distances that would be expected based on chance. The average distance less than the average for a hypothetical random distribution indicates clustering, while greater distance indicates the dispersion of analysed features [36]. Contrary to ANN, the Ripley’s K-function examines, instead of computing separating nearest neighbours, all inter-point distances. The function shows how to point pattern changes when the neighbourhood size increases or decreases. The variance stabilised Ripley K-function called the L function is generally used for data analysis (Equation (5)):
L ( d ) = A i = 1 N i = 1 , j 1 N k i , j π N ( N 1 )
where d —the distance, N —total number of points (features), A —the total area, and k i , j —a weight connected with edge correction function.
In this study, Ripley’s K function counts the number of neighbouring centroids of land cover change polygons found within a given distance of each central point of an individual land cover change patch. Then, the number of observed neighbouring centroids is compared to the number of central points that are expected based on an entirely spatially randomness. The advantage of Ripley’s K function is the ability to analyse the pattern in the scale function. However, it should be remembered that due to edge effects, patterns are questionable at greater distances [37].
The density of land cover changes was portrayed by kernel density, choropleth, and graduated symbol maps. Kernel density calculates a magnitude-per-unit area from the centroid of land cover change polygons using a changing area as a weight factor to fit a smoothly shaped surface to each point [38].
Disparities of land cover flows were portrayed by Gini coefficient, due to Equation (6) [39]:
G ( x ) = i = 1 n ( 2 i n 1 ) x i µ   n 2
of n ordered individuals with x i the size of individual i and x 2 < x 3 < x n , where: n —number of analysed regions, x i —the level of land cover flows in ascending order < x 1 < x 2 < . . < x n 1 < x n , and µ—mean value.
Gini takes values from 0 to 1, with 0 showing perfect equality and 1 representing perfect inequality. The coefficient was used as an indicator of unequal distribution of chosen land cover flows in the analysed areas.

2.4. Workflow

The study was conducted in three consecutive phases: (1) preparation, (2) analysis, and (3) presentation of results. The preparatory phase comprised data acquisition, transformation to common Coordinate Reference System (CRS), and such geoprocessing operations as clip, intersect, and dissolve. It also established the level of details of land cover changes analysis, i.e., the entire Polish Baltic coastal zone, regional, and local for selected analysis. An important step in the preparatory phase was visual verification of CLC changes in all analysed time intervals.
The analytical phase relied on land cover net changes and land flows calculation over the four short periods (1990–2000, 2000–2006, 2006–2012, 2012–2018) and long-term changes over the past 30 years (1990–2018), as is presented in Figure 2. The results were related to the Polish Baltic coastal zone, regions, and legally protected areas. Based on the developed formulas (Equations (1)–(5)), the progress towards Sustainable Development Goals 2030 in the Polish Baltic coastal zone was assessed. Qualitative analysis showed the land cover change spatial pattern and density.
The final stage visualised the results using a set of thematic maps, mainly choropleth, charts, and tables as well as described and summarised the land cover changes across the Polish Baltic coastal zone.

3. Results

3.1. CLC Change Data Veryfication

CORINE Land Cover data were profoundly verified before making them publicly available. The verification that has been done both at the country level by national verification teams and at the European level by the European Environment Agency (EEA) technical team achieved at least 85% of thematic accuracy [24]. Moreover, the independent validation based on the LUCAS (The Land Use/Cover Area frame Survey) Europe-wide data that had not been used as source data for CLC shows the total reliability of CLC2000 at level 87.0 ± 0.8% [26,40]. Moreover, as estimated by EEA [40], the highest class-level trustworthiness, above 95%, was obtained for water bodies and urban areas. Both arable land (2.1) and coniferous forest (3.1.1), the two largest CLC land cover classes, were assessed to have a high level of reliability, i.e., 90%, and 95%, respectively. However, validation was executed for CORINE land cover polygons, not the change polygons. So, there is no independent CLC change data assessment. Nevertheless, if the land cover classes were derived truthfully, we should not expect significant errors in the change database.
The verification of CLC change codes for the Baltic coastal zone confirms the high thematic accuracy of CORINE land cover change data for each analysed period, reaching a value of 95%. In particular, just a few errors were observed in land cover conversion, i.e., urbanisation, intensification of agriculture, afforestation, and deforestation. Predominantly, doubts in the attribution of the CLC change code were found where high-intensity agriculture (i.e., 2.1 and 2.2) was transformed into low-intensity forms, such as pastures (2.3) and mixed agricultural areas (2.4). They were detected on 11 polygons with a total area of 91 ha, which, given the total area of changes (1106.2 km2), can be considered insignificant and not burdening the results of further analysis.

3.2. Overview of Land Cover and Land Cover Net Changes

Agricultural land accounts for the most significant share of the Polish Baltic coastal zone with 56.28%. It is followed by forests that occupy 35.39%. Artificial surfaces cover just 5.1%, while water bodies cover 2.59%, and wetlands cover merely 0.54% (see Table 5).
The structure of agricultural land use on the Baltic coast exhibits considerable differences from region to region (Figure 3a), with an average share of 47.4%. The easternmost regions, Starogardzki and Elblaski, are mainly agricultural, with an agricultural land share of 67.3% and 62.3% respectively, of which 55.1% and 51.8% are arable lands, pastures occupy 5%, while heterogeneous agricultural areas occupy from 6.9% to 4.7%.
It is worth noting that respectively, 16% and 20% of the areas of the only two urban agglomerations, Szczecin and Tri-City (Gdansk, Gdynia and Sopot), are occupied by agriculture. One of the characteristics of the Polish Baltic zone landscape is the high percentage of forests, scrubs, and herbaceous vegetation (Figure 3b). The average forest cover in the Baltic region amounts to 33.8% (11,852.75 km2) and is higher than the national average equals of 29.5%. On average, there is 0.3 ha of forests per capita, which is 0.06 ha more than the national average, but still two times lower than the world average: 0.62 ha [41]. Forests occupy nearly half of the Slupsk region area, 48.1%, while in Koszalinski they occupy as much as 39.6%. A relatively small area, but still slightly more than 25%, of forested land exists in the Starogardzki region and Szczecin city, 26.2% and 25.1%, respectively. Moreover, forests cover a relatively large part of the Trojmiejski region, 31.8%. This is about 2.5% more than the national average, which makes this agglomeration one of the greenest ones in Poland. The urbanisation level, i.e., the share of artificial surfaces, in the Polish Baltic regions is also significantly diversified, with the highest share of 44.0% in the Trojmiejski region and 36.4% in the city of Szczecin and the lowest one (Figure 3c) in the Slupski agro-forestry region. This diversity is also emphasised by the large difference between the mean and median values of urbanisation that amount to 13.4% and 4.6%, respectively.
The land cover changes in the Polish Baltic coastal zone comprise (1) gradual growth in urban areas, particularly transportation networks, commercial, industrial, and housing areas; (2) high (5.52%) loss of agricultural land, particularly arable land and pastures; and (3) a successive increase in forest cover associated with the agro-forestry programs implemented in Poland, and changes within the forest areas related to timber operations and forest renovation. A significant decrease in agricultural areas compensates for the overall increase in artificial surfaces and forests together with semi-natural lands (see Figure 4a). The growth of forests, shrubs, and semi-natural areas is slow and amounts to 0.1% per year, which after 28 years gives a 2.81% growth. The total increase in artificial surfaces was 2.65%, although the most significant growth occurred in 2000–2006 (1.4%), whereas in the remaining periods of CLC inventories, the gain in value remained significantly below 1% (Figure 4b). The percentages of various land cover categories in the increases of anthropogenic surfaces differ slightly with the highest proportion of land associated with roads and related infrastructure as well as construction sites (see Table 5). The loss of arable land follows a linear trend (R2 = 0.94) with an annual decrease of 0.16%. The total loss of arable land in 1990–2018 equals 5.52%.
The net changes in the Baltic coastal regions also differ substantially (see Figure 4c). The Trojmiasto (Tri-city) agglomeration faced the highest loss of agriculture and at the same time the highest growth of urbanised lands. On the contrary, Szczecin, the second-largest city in the Polish Baltic region, has been afforested and developed at the expense of agricultural land. A relatively large number of agricultural areas have fallen in the Elblaski region. They have been afforested and taken over for transportation facilities and highways. The total land cover changes in the Polish Baltic coastal zone in 1990–2018 equal 3.22% (1078.14 km2), whereas the annual land cover change takes the value of 0.12% (40.18 km2). The amounts of total land cover changes, both in the acreage and number of patches, differ slightly between consecutive periods, being the highest in the last six-year period (Figure 4d).
The intensity of the long-term changes (from 1990 to 2018) varies considerably across the analysed area (Figure 5). Gdansk, the largest city on the Polish Baltic coast, has witnessed as much as 8.5% of land cover changes of the city’s area. Moreover, the number of changes in the city amounted to 216, which results in the average area of a change polygon being 10.28 ha. Compared to 1990, land cover changed in 6.2% of the Gdanski county (the land county, neighbouring the city of Gdansk from the south), which makes it the second most affected county. Relatively small changes were recorded in typically small tourist cities such as Sopot (located near Gdansk, in the Trojmiejski region, in the eastern part of the Baltic zone) and Swinoujscie—placed on the west coast (0.3% and 0.9% respectively), and in the agricultural areas of the Elblaski region (from 0.7% to 1.1%).
Land cover changes have also affected legally protected areas. From 1990 to 2018, there was an increase in artificial areas by 1.4%, a decrease in agricultural land by 4.5%, and an increase in forests and scrub by 2.9%. In 1990, urban fabric areas covered 0.68% of protected areas, while in 2018, they covered as much as 1.98% with the highest increase observed in 2000–2006 (0.82%). The most considerable land cover changes affected agricultural land, as they covered a decline of 4.50% compared to 1990. The loss concerned all four agricultural classes of level 2 CLC with the highest decline of heterogeneous agriculture areas (2.38%) and arable land (1.79%). Pasture loss was 0.33% and permanent crops loss was merely 0.02%. Arable land was generally transformed into more extensive use, such as heterogeneous agriculture (CLC 2.4. class) or pasture (2.3 class), while 2.4 lands have very often been afforested. Forests in legally protected areas gradually increased their area by 1.53% compared to 1990, with the most significant changes taking place in 1990–2000 covering 1.21%, which was the result of the abandonment of agricultural land and reclamation of military areas that are assigned to the CLC class 3.2 (open spaces with little or no vegetation). However, a slight forest decrease (0.08%) was observed in 2018 compared to 2012. Most of these changes included forest clearing (class 3.2.).

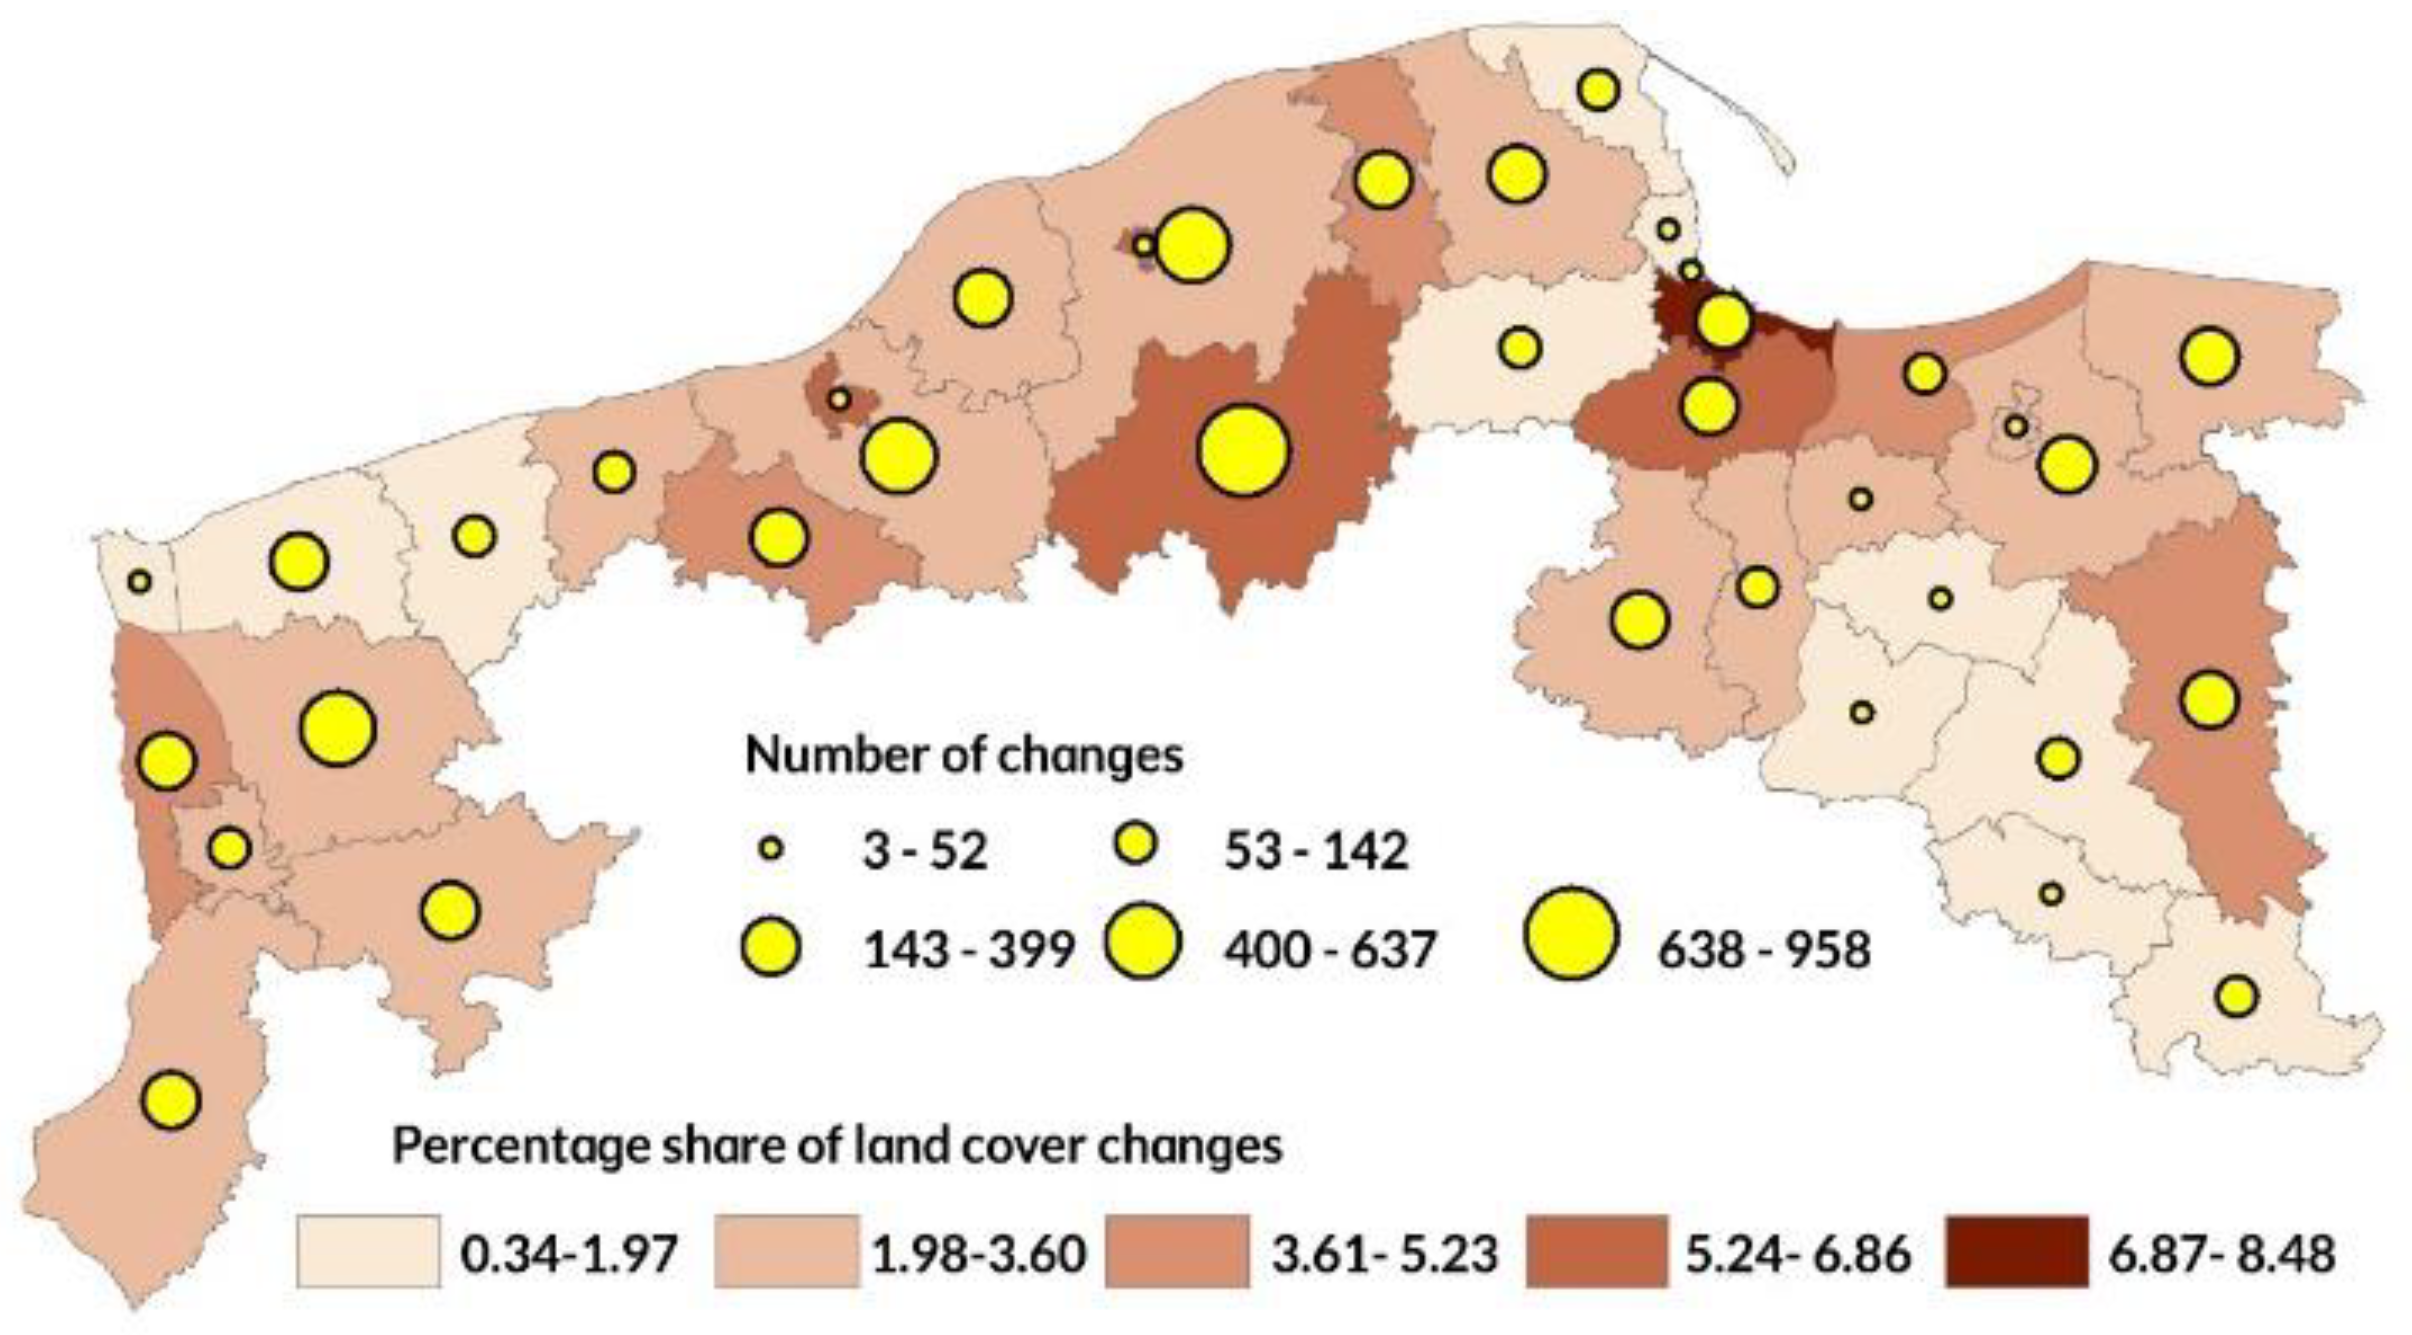
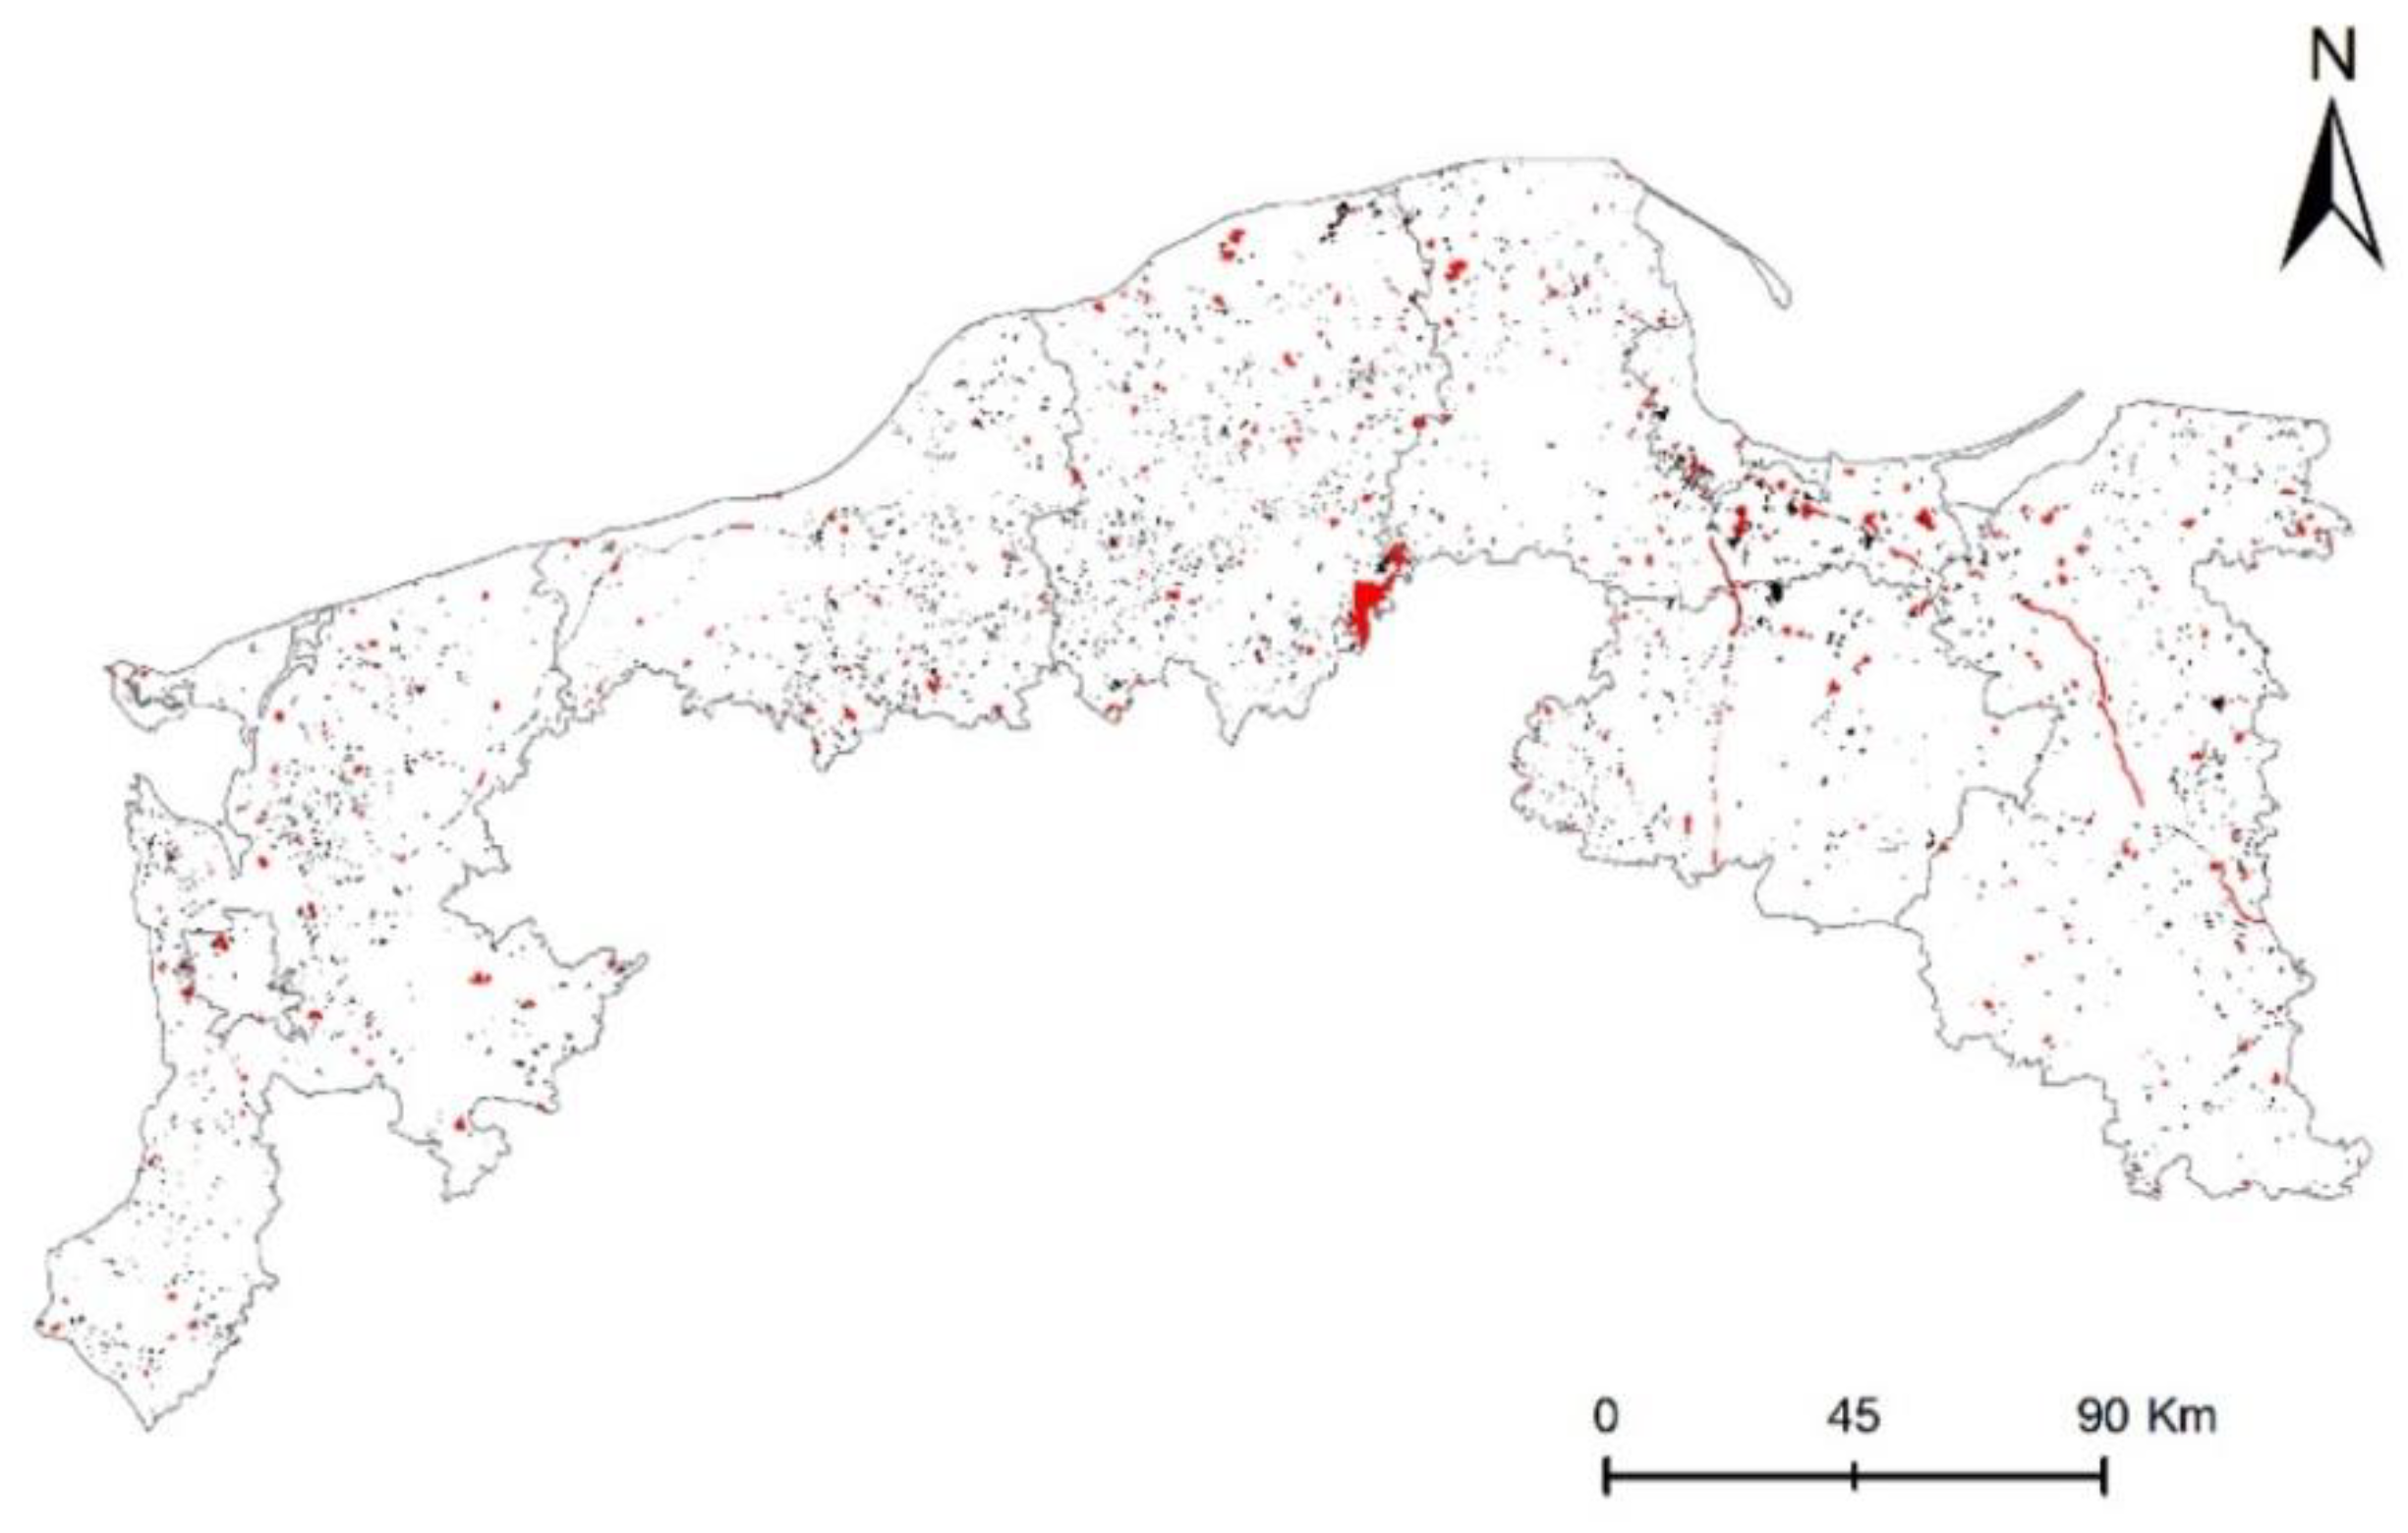
3.3. Spatial Pattern and Density of Land Cover Changes

The spatial pattern of land cover changes over the Polish Baltic coastal zone in 1990–2018 was clustered, which is documented by the ANN statistics, particularly the NN ratio of 0.42 and the z-score of −95.18, indicating that there is a less than 1% likelihood that the clustered pattern is the result of random chance. Changes in land cover are also clustered in all analysed periods. The NN ratio did not differ much in subsequent analysed periods, assuming values less than 1, i.e., denoting a clustered pattern. In 1990–2000, the NN amounted to −0.33, in 2000–2006, it was −0.29, in 2006–2012, it took the value of 0.30, and in 2012–2018, this ratio equaled 0.39 (with p <0.001 for all statistics). Moreover, Ripley’s K function graph (Figure 6) also shows a large concentration of land cover changes regardless of the scale, i.e., from the small, less than 20 km distances, to distances exceeding 100 km. Furthermore, the L (d) curve graph assumes a similar shape for changes in land cover in each of the analysed periods, indicating their clustered nature in close proximity, as well as throughout the entire study area.
Based on the overall CLC changes data from 1990 to 2018, a kernel density analysis was carried out with a grid cell of 900 m and a radius of 9000 m. The results show that the density of land cover changes estimated by kernel density function is between 0.029 and 0.82 per square kilometres, and the average kernel density of the 7444 CLC changes varies from 0 to 0.67. The visualisation map (Figure 7) can demonstrate the characteristics of land cover changes spatial distribution, one of which is the CLC change concentration in the tri-city region, which is associated with a high intensification of artificial areas. The densification of land cover changes is also clearly visible in large forest complexes located in the regions Szczecinski (Goleniow Forest and Beech Forest), Koszalinski, and Slupski (Central Pomeranian Forests), and in the southern part of the Elblaski region (Elblag-Zulawy Forests).

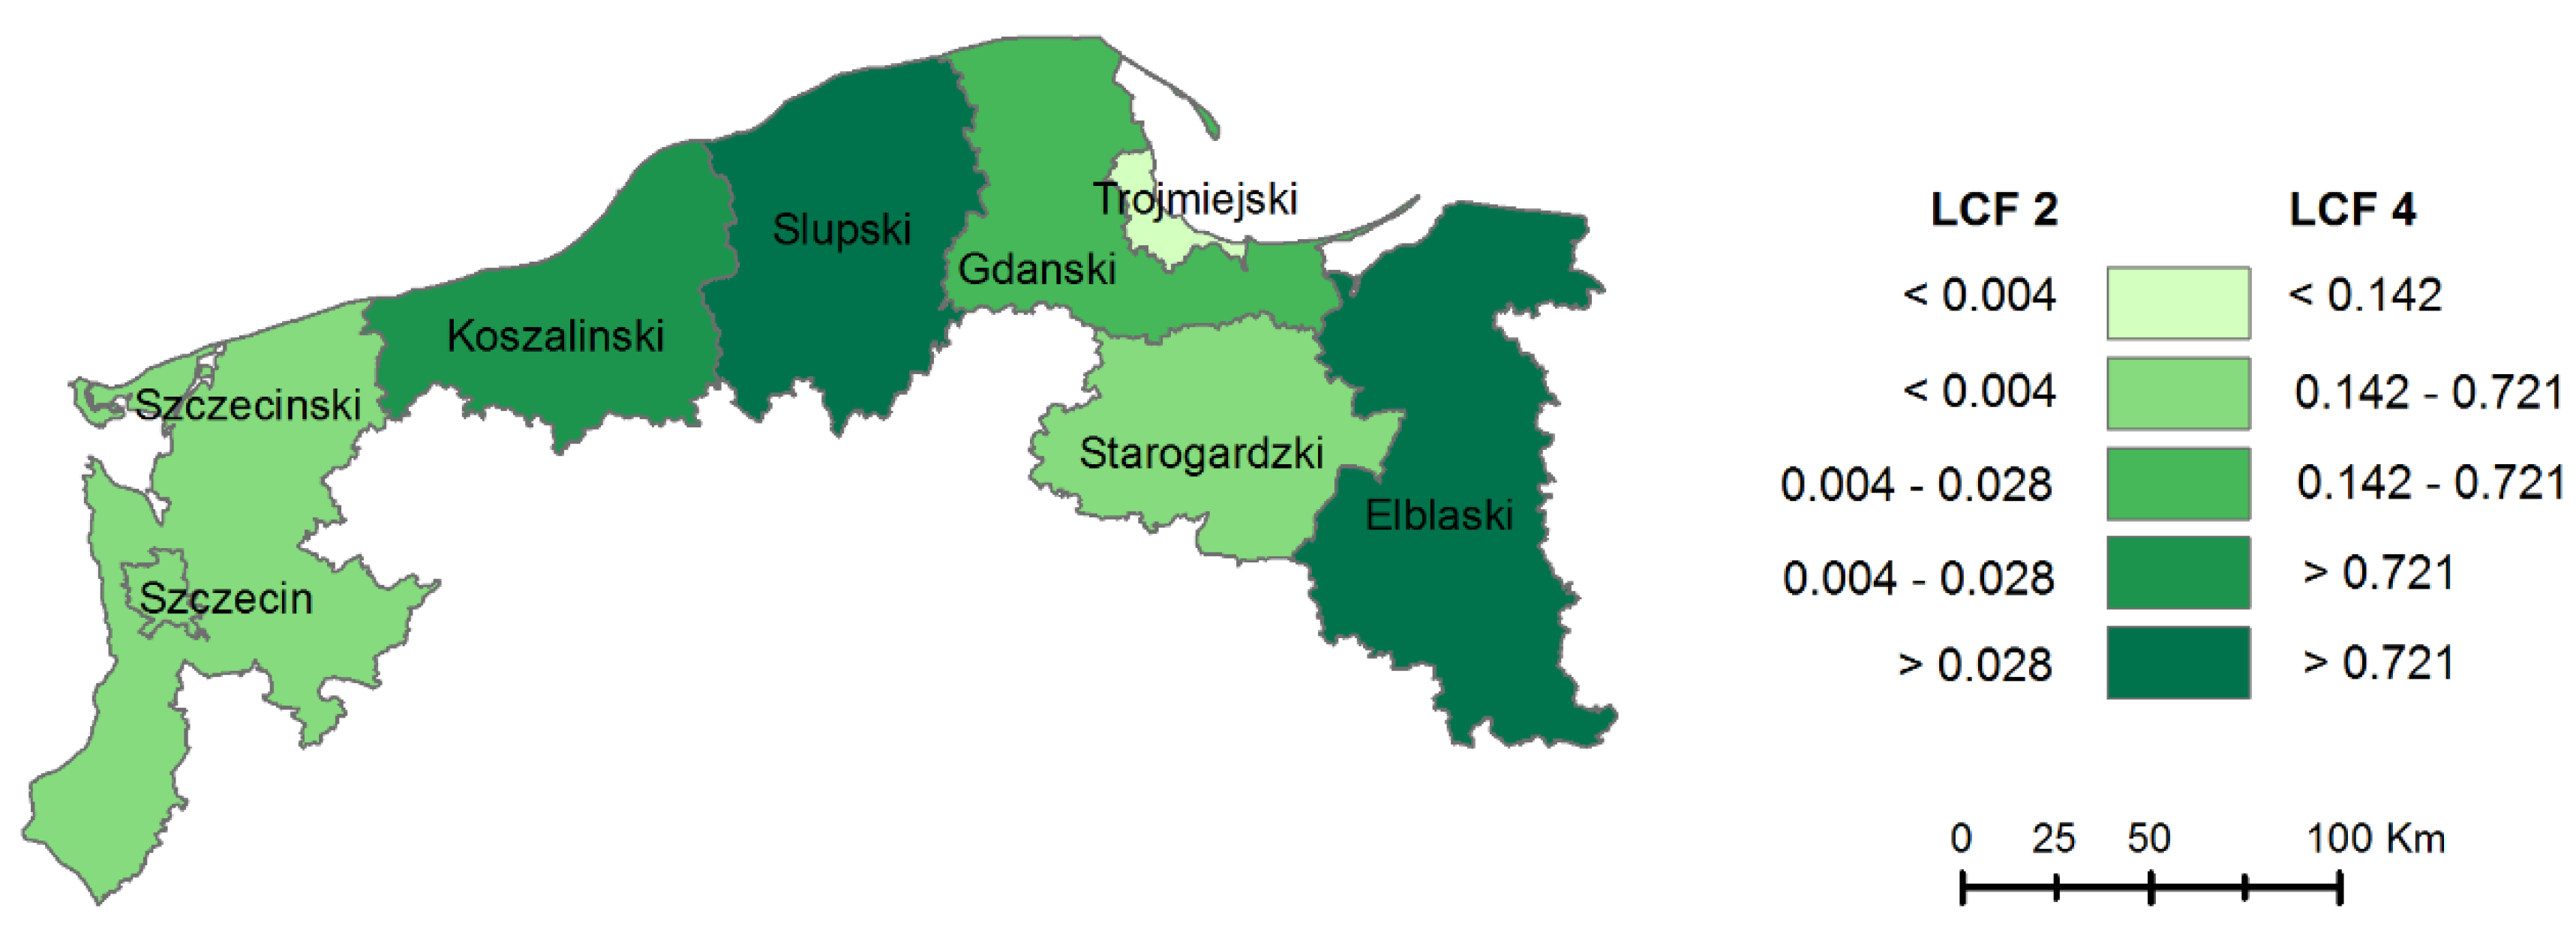
3.4. Land Cover Flows

Urbanisation (LF1) is seen in Europe as one of the land cover flows that has the greatest environmental impact [35]. The rate of urban land cover types has been increasing continually, and the total value noticed for years 1990–2018 was 0.49 (Table 6). The marked growth of urban areas and the accompanying infrastructure occurred after 2006, which was caused by an increase in investments co-financed mainly from EU funds.
The highest increase among all analysed regions is visible in the Trojmiejski region, where not only new housing estates were constructed, but also the expansion of the road network, construction of the highway and city beltways, was observed. When analysing the land cover flow for LCF1 depending on the area of the region, we can see that this is the equal distribution in terms of the size of the analysed area (Gini coefficient equal to 0.24772)—Figure 8a.
Urban sprawl also affects seaside resorts where new tourist buildings have been built, which is clearly visible on high-resolution images as shown in Dziwnow, which is a small city located in the west part of the Polish Baltic coastal zone. Particularly, the Dziwnow peninsula and the embankment of Lake Wrzosowisko were subjected to anthropological pressure after 2006 (Figure 9).
Further changes concerned agricultural areas. In Europe, the fine-grained structure and associated biodiversity of traditional rural landscapes continue to be affected by land take, agricultural intensification, and farmland abandonment. However, for the analysed zone, a slight increase in the expansion and intensification of agriculture could be observed, especially for the Elblaski and Slupski regions in the last analysed period, i.e., 2006–2018 (Figure 10). For these areas, the process of revitalisation of rural areas began after 2010, which was supported by European Union programs.
Along with the intensification of agriculture, changes in forest cover were noted, as the highest land cover flow in the Polish Baltic coastal zone (Table 6). The largest afforestation was noted in the Slupski, Elblaski, and Koszalinski regions, where the intensification of agriculture could be observed at the same time (Figure 10 and Figure 11a).
Based on the analysis of CLC data, the deforestation was also noted (LCF5). As based on the Gini coefficient (0.56052) as shown in Figure 8b, this land flow is not even in all areas studied. The deforestation has been most intensified in the last decade (Figure 11b). However, this not always does mean complete deforestation, e.g., for new transport infrastructure or housing. The increase in land cover flow consisting of the “disappearance” of forests is caused by the sustainable management of forests, i.e., the felling of diseased trees, in order to protect the woods against fire and to maintain the forest cover in good condition. Figure 12a–c present coniferous forest at various stages of growth, as captured by Maxar (DigitalGlobe) and Airbus satellites such as IKONOS, QuickBird, GeoEye, and WorldView. The images show tree logging polygons form CLC change data that has been done during 2006–2012 (green polygon) and in 2012–2018 (yellow polygons). Meanwhile, Figure 12d,e presents the tremendous forest damage in the Slupski region caused by a hurricane on the night of 11–12 August 2017 and registered in CORINE Land Cover in 2018. The largest (yellow) polygon cover an area of 3350 ha.

3.5. Progress towards SDGs 11 and 15

The long-term (28 years) land consumption rate (LconR) in the Baltic coastal zone amounts to 3.71%, with the total increase in artificial surfaces equal to 103.89%. The index took the highest value of 7.95% in 2000–2006, and the lowest, 0.56%, in 2012–2018. In the years 1990–2000, an annual rate of land consumption amounts to 1.48%. After the year 2006, the index decreased to 2.72%. The LconR indicator took the highest values for agriculture regions, namely Elblaski (6.6%), Gdanski (5.98%), and Starogardzki (5.71%), while the lowest one was noted in the Szczecinski region (0.04%) and the city of Szczecin (0.34%). In the legally protected lands, artificial surface area increased during 28 years (1990-2018) by 10,295.8 ha, i.e., by an average of 367.7 ha per year. In the year 1990, it amounted to 5691.42 ha, while in 2018, it was three times larger and took the value of 15,987.22 ha. The land consumption rate there amounts to 6.46% of the total HNV area. Nevertheless, LconR values in subsequent periods of CLC inventories differed significantly, assuming the lowest value of 0.28% in the latest period of 2012–2018, and the highest 15.12% in 2000–2006 (see Figure 13).
After 2006, the values of LconR in the Baltic coastal zone clearly decreased, reaching 3.75% in 2006–2012, and only 0.28% in 2012–2018. This should be considered as the positive effects of European and Polish legal regulations regarding land development and management towards sustainable goals. The large increase of the land consumption rate in 2000–2006 was mainly associated with the use of EU pre-accession funds for the development of new commercial centres, as well as the construction and reconstruction of road infrastructure, including the construction of animal culverts, marked pedestrian crossings, and bicycle paths.
The urban green ratio in the analysed cities varies significantly, having the lowest value in Swinoujscie (1.86%), the city located on the Odra delta, and the highest in Slupsk (11.31%), which is a small town located on the central Baltic coast. Slupsk and Sopot are the greenest cities in the Polish Baltic coastal zone, with the UGrR higher than 10% (Figure 14a). In contrast, urban green areas per capita take the highest value in Swinoujscie (80.0 m) and the lowest in Gdynia (16.4 m). In most cities, the size of urban green areas has increased since 1990 (Figure 14b). Elblag ranks first, increasing the urban green areas by 3.47%; in 1990, the urban greenery ratio was just 2.88%, ahead of only Swinoujscie and Koszalin. Then, it is followed by Gdansk, where urban greenery expands by 2.98%. Gdynia, Sopot, and Swinoujscie show relative stability of the urban green space ratio, with fluctuations below 0.2%. Only Szczecin reduced its urban greenery by 0.49%; a decrease was recorded in 2000, followed later by a very slow upsurge from 7.40% in 2000 to 7.75% in 2018.
The forest cover ratio in the Baltic coastal zone has been steadily increasing, reaching 32.4% in 1990, while in 2018, it was 35.3%. The long-term (1990–2018) average annual increase in forest area was about 0.1%, i.e., 34 km2. The index varies from 25.1% in Szczecin (city) to 48.1% in the Slupski region. In six regions, except for Slupsk and Starogardzki, its value exceeds 30%. In the period 1990–2018, the forest cover ratio (FR) increased slightly, from 3.56% in Szczecin to 1.84% in the Gdansk region, while only a minimal decline of 0.14% was observed in the Trojmiejski region.
The proportion of forest areas located within legally protected areas, or the FLPAP index, remained at 48.76% in 2018, gradually, increasing its value compared to 1990 (see Figure 15). The highest (88.8%) and most stable in the analysed period, the value of the FLPAP indicator, is observed in the Trojmiejski region, where the tri-city landscape park and Oliwa forests are located. The least, albeit 25% of forests in legally protected areas, are observed in the Szczecin region.

4. Discussion

Changes in land cover because of civilisation processes are inevitable and include mainly urban sprawl, transport networks densification, the intensification of agriculture, and changes related to forest management. They are dynamic, widespread, and accelerating, and they are mainly driven by natural phenomena and anthropogenic activities [42,43]. By and large, land cover changes are increasingly recognised as an essential driver of environmental change on both spatial and temporal scales [34]. Current land cover changes are triggered by economic development, investment, agricultural policy, and environmental protection policy. An important factor influencing the changes is the rise of consumption resulting from the growth in the wealth of society [44]. In Poland, as in other post-Communist countries, the land cover has changed since 1989, after the collapse of the Soviet Union and the sociopolitical transformation of Central and Eastern European countries [17,18,45].
The CLC database was developed using satellite remote sensing data, i.e., Landsat, Indian Remote Sensing (IRS) Satellite, and Sentinel, which are not VHR data. However, not all land cover changes can be captured using medium-resolution images that have been used to interpret changes within the EU CORINE Land Cover project. What is more, the spatial resolution of CLC change data, i.e., 5 ha as a minimum mapping unit with a minimum width of 100 m, allows the storage of fragmented landscapes in the form of mixed classes (e.g., 2.4 or 3.2), which ultimately leads to generalisation. Therefore, CORINE land cover inventories are dedicated to analysis on a regional or national scale, starting from 1: 75,000 [46].
CLC data show that total land cover changes increased from the 1990–2000 period to the 2012–2018 period. The main land cover trends (in the 1990–2012 period) and their environmental impacts according to European land accounting [47] are as follows:
  • urban and infrastructure expansion resulting in a loss of productive soils and landscape fragmentation;
  • continuous decrease of agricultural areas and, as a consequence, farmland abandonment and biodiversity loss;
  • intensification of forest land use, leading to a declining quality of forest ecosystems.
These trends are observed in Europe, Poland [46], and the Polish Baltic coastal zone. Land cover changes in Poland amount to 0.93%, 0.53% and 0.99% respectively in 1990–2000, 2000–2006, and 2006–2012 [43,44], which gives a 0.10% (3348.2 ha) annual land cover change of the total area in the years 1990–2006 and 0.16% for the period 2006–2012. The Polish coastal zone faced slightly slower changes respectively: 0.63%, 0.59%, 0.90% in the subsequent changes, and 1.13% in the last period of 2012–2018.
Urban expansion is a constant trend across all regions in the Baltic zone, reaching the highest value in the Trojmiejski region (4.7%) and the lowest in Slupski (0.2). This process has been more intensive since 2000, which is related to Poland’s pre-accession declaration to the EU and financing structural investments. Although changes in land cover between 1990 and 2018 in the Baltic zone showed that agricultural areas changed most often, changes in agriculture structure, denoted as LF3, covered just 5357.2 ha, which is 0.16% of the Baltic coastal zone area. Conversion from natural and semi-natural areas to high-intensity agriculture, i.e., the expansion and intensification (LF2) of agriculture, was visible only in the period 2006–2012, but its size amounts to 0.05% (1674.1 ha) in 1990–2018. Land cover changes related to forest management remain the largest in terms of the total turnover of 2.06% of the total analysed area, including afforestation by 0.89% and deforestation by 1.17%. The results indicate that this process was more intense in 2012–2018, which was mainly due to the hurricane on the night of 11–12 August 2017. This hurricane destroyed about 26,000 ha of forests [21], of which approximately 2000 ha are in the area under analysis. The increase in the forest cover of the country is a visible result of the implementation of the National Program for Extending Forest Cover (KPZL) adopted in 1995. Its intention was to increase Poland’s forest cover to 30% in 2020 and 33% in 2050.
The changes over land use in the Polish Baltic zone in the last three decades only slightly follow the tendency in the neighbouring Baltic countries, such as Germany, Lithuania, and Estonia, where they were much more intensive [10,18]. The results and tendencies obtained in the Polish Baltic zone are much more similar to other coastal countries such as Malta, Cyprus, Bulgaria [46].
Changes in land cover triggered by urbanisation, landscape fragmentation, and intensification of agriculture have been recognised and discussed by many scientists [48,49,50] as those that deeply affect biodiversity and human life, especially in protected areas. Legally protected areas located in the Polish coastal zone were also affected by land cover changes, although the total size of changed areas during 1990–2018 was mainly associated with activities aimed at the protection of nature in these areas in compliance with European and national provisions.
Trends and the rate of land cover changes force local and regional spatial planning authorities to identify harmful land cover flows and develop a policy that prevents their further growth. According to the National Strategy of Regional Development [51] and EU’s territorial cohesion policy for the Baltic Sea region [19], the spatiotemporal dynamics of land cover changes should be monitored on a regular basis, at local and regional levels, since only continuous land use monitoring can ensure appropriate, sustainable territorial management, and development. In Poland, according to Geodetic and Cartographic law, the duty to monitor land cover/land use changes belongs to the responsibilities of the Voivodeship self-government authorities [52]. However, as noted by Noszczyk [53], monitoring activities involve general observations of the current land use structure in comparison with the previous years (or, very rarely, several previous years), and this is certainly insufficient.
The Baltic coastal zone in Poland is perceived by public administration as a region of utmost importance due to its location in the border area. Such a geographical location creates a few challenges for sustainable development potential and counteracting marginalisation. The most important ones include low transport accessibility and a low availability of goods and services, shaping development capabilities for inhabitants [51]. The analysis shows that industrial, commercial, and transport areas increased slightly in the Baltic area, reaching an average value of 0.7% in 2018 and a growth of 0.02% compared to 2012, i.e., two years after the National Regional Development Strategies had entered into force. The highest rises were observed in the Trojmiejski region (0.25%) and the city of Szczecin (0.11%), while the lowest ones (0.01%) were observed in the Koszalinski and Slupski regions, i.e., those with the worst road and rail access to the center of the voivodeship [54]. However, it is worth noting that large forest cover (35.4%) and a significant share of legally protected areas (20.7%) prevent the free development of commercial areas and road networks, which may contribute to reducing the development of tourism, and thus reduce the income of the population and public administration. Therefore, pursuant to the National Strategy of Regional Development [51], local and regional policies should complement the environmental policy for the comprehensive protection and conservation of nature in the region, as well as improving the use of endogenous regions’ potential in order to increase economic growth. In such a context, the monitoring of regional development plays a considerable role, in particular, monitoring land cover changes and flows. It is assumed that the EU’s agricultural and environmental policy, together with national environmental protection, is an important element shaping land cover structure in the Polish Baltic coastal zone. Of utmost importance is the Act on the Protection of Agricultural and Forest Land [55], which requires the consent of the Minister of Agriculture and Rural Development for agricultural and forest land consumption. However, this national legislation does not apply to the transformation of agricultural land into non-agricultural land within the city limits.
The responsible and sustainable management of coastal zones requires access to up-to-date, reliable spatial data stored in a spatial information system. Evidence-based remotely sensed land cover data at a fine scale is of utmost importance for public administration as an essential tool for managing and monitoring these areas. The CORINE land cover datasets of an agreed and harmonised nomenclature have been available to all of Europe since 1990 for subsequent six-year periods, and as such, they constitute an invaluable source of spatiotemporal data for monitoring the state and changes of landscape, particularly land accounts according to EU and national regulations [25,56]. Moreover, recently, the EEA has established a project aimed at governing coastal zone areas, in particular to monitor landscape dynamics in coastal zones in a spatially explicit manner. The first release thematic hotspot products will consist of land cover/land use datasets for 2012 and 2018 as well as a change layer between 2012 and 2018. The products are going to provide land cover status and changes every six years. The first delivery is expected by the end of 2020 [57]. As [47] noted, regular inventories of land cover changes are vital to assess the reasons and consequences of natural and artificial processes, identify trends, maintain ecological balance, and take these factors into account in decision-making processes.
Researchers’ interest towards attaining the 17 SDGs, agreed in September 2015, and set up in the 2023 Agenda for Sustainable Development is still a hot topic in many scientific fields. The indicators for SDGs achievements are grouped into three tiers, according to methodological clarity and data accessibility. Indicator 11.3.1 has been classified as tier II, although, as noted by Nicolau et al. [58] it is not conceptually clear, as the agreed and precise definition of urban land is still missing. The elaborated land consumption rate (LconR) is based on a remotely sensed urban area and its relative growth, and as such, it may be considered as an input component to 11.3.1 indicator calculation. Indicators 15.1.1 and 15.2.1 belong to tier I (conceptually clear, methodology and standards are available, and data are regularly produced by most of the countries). However, Liu et al. [59] found that the 15.2.1 progress towards sustainable forest management required further deconstruction and analysis of its definition. Moreover, they introduced five sub-indicators, among them a sub-indicator “proportion of forest area located within the legally established area”, which was used in the presented study.

5. Conclusions

The investigation of land cover and its changes over time and space play an essential role in understanding socioeconomic and physical phenomena at any level. The analysis of coastal areas is particularly important because of their economic and social significance for all countries. The Polish Baltic coastal area is dominated by agro-forestry landscape, with a small share (5.19%) of urbanised surfaces. Due to the nature of the land cover and the strategic geolocation, analysing the land cover changes in this area is very important for environmental, economic, and political purposes.
Total land cover changes in the Baltic coastal zone reveal a valuable trend in national territorial protection policy. The analysis showed a dispersed spatial pattern of land cover changes in the Baltic coastal regions in each of the analysed periods. That indicates that land cover changes have affected every Baltic region. However, the scale of changes varies depending on the region, being the highest in the Trojmiejski (tri-city) and the lowest in Szczecinski. The structure of land cover changes in the Polish coastal zone of the Baltic Sea is intricate and exhibits marked differences between regions. Urbanisation mostly affected the Trojmiejski urban region and small, mainly touristic cities located along the coastal zone. The intensification and extensification of agriculture (LF2 and LF3) dominate in the regions of Elblaski, Slupski, and Koszlinski, where after the year 1990, as a result of the abandonment of cooperative farms, the structure and type of agricultural production changed. These regions also saw the marked changes in forests—on the one hand, clear-cutting, harvesting of trees, and forest damage due to natural hazards (i.e., hurricanes), and on the other hand, afforestation in accordance with national and regional environmental and agricultural policies.
Two distinct periods were observed in land cover changes and flow. The first, after the fall of socialism and before Poland’s accession to the EU (1990–2006), was characterised by slower changes, consisting mainly in the abandonment of agricultural land and afforestation. Secondly, in the years 2006–2018, there was a visible intensification of urbanisation due to the availability of EU structural and cohesion funds. The expansion of urban and related infrastructure was accompanied by deforestation.
Our findings show that agricultural land loss, at an average at 6612.8 ha per year, was the dominant land cover net change in the years 1990–2018. It was followed by a steady growth of the forest and semi-natural area, by an average of 3366.2 ha annually. Afforestation is the result of planting new trees as well as a natural expansion of forests on abandoned agricultural land (e.g., CLC change from 2.4 to 3.1). The enlargement of the artificial surface was the third observed trend of land cover changes, with a total size of 88,560.0 ha (2.65%) and annual growth of 3162.9 ha.
The analysis of land cover changes and calculated on its basis indices monitoring the achievement of SDGs by 2030 indicate an increase in land consumption rate and steady increase in the forest cover ratio, and in most of the cities in the analysed area, a growth of urban green ratio.
As presented in this article, land cover changes can be easily observed with the CLC database. Information on the land cover was derived from computed-aid visual interpretation based on optical images (Landsat 4/5, 7, and 8, SPOT 4/5, IRS-P6, RapidEye and Sentinel 2) in the visible and near-infrared spectrum, which allows the creation of false and true-colour compositions, and reached the 95% of CLC thematic reliability.
Temporal trajectories of apparent land cover changes based on the multi-decadal CLC inventories provide valuable information for regional and national authorities that force them to make transparent (based on data) decisions. From the administrative, research, and technical points of view, the potential of CORINE land cover data is unquestionable, since it consistently stores easily accessible spatiotemporal data. This fact is reflected in the INSPIRE data specification for land cover [60], where the CLC is shown as one of the sets where technical and semantic standardisation has been achieved, constituting one of the most harmonised European datasets. Therefore, it can be stated that CORINE may be a key element of future studies covering land cover changes related to the goals of sustainable development across the world.

Author Contributions

Conceptualization, E.B. and A.J.; methodology, E.B., A.J.; software, K.P.; validation, E.B., A.J. and K.P.; formal analysis, K.P., S.B., A.J., E.B.; investigation, E.B., A.J.; resources, K.P.; writing—original draft preparation, E.B., A.J.; writing—review and editing, E.B., A.J., S.B.; visualisation, S.B.; supervision, E.B. All authors have read and agreed to the published version of the manuscript.

Funding

This research was funded by Military University of Technology in Warsaw, Faculty of Civil Engineering and Geodesy, Institute of Geospatial Engineering and Geodesy.

Acknowledgments

Corine Land Cover data were obtained from the Chief Inspectorate of Environmental Protection CLC web page http://clc.gios.gov.pl/ on 11 December 2019. Boundaries of NUT3 were gained from the Eurostat GISCO Database web page https://ec.europa.eu/eurostat/web/gisco/geodata/reference-data/administrative-units-statistical-units/nuts. Data on the administrative division was gained from the Head Office of Geodesy and Cartography.

Conflicts of Interest

The authors declare no conflict of interest.

Appendix A

Figure A1. CORINE Land Cover types in Polish Baltic coastal zone in (a) 1990; (b) 2018; (c) CLC classes—level 2; (d) CLC changes in 1990–2018.
Remotesensing 12 02088 g0a1aRemotesensing 12 02088 g0a1b
Figure A2. Satellite images and aerial ortorectified data supporting CLC change data checking (a) Landsat 5 false colour composition; (b) Landsat 7 false colour composition; (c) pan-sharpened Landsat 8 false colour composition; (d) High-resolution mosaic of Sentinel-2 (10 m) in true (bands 4,3,2) and false colour (bands 8,4,3) available by via Copernicus services (Elblag); (e) Geoportal services of archive and new aerial ortoimagery (Gdansk); (f) Geoportal services—forest damage in the Slupski region after the hurricane on 11–12 August 2017.
Remotesensing 12 02088 g0a2aRemotesensing 12 02088 g0a2b
Figure A3. Red marked CLC changed polygons used for data verification.
Remotesensing 12 02088 g0a3

References

  1. Strandberg, G.; Kjellström, E. Climate Impacts from Afforestation and Deforestation in Europe. Earth Interact. 2019, 23, 1–27. [Google Scholar] [CrossRef]
  2. Sagan, C.; Toon, O.B.; Pollack, J.B. Anthropogenic Albedo Changes and the Earth’s Climate. Science 1979, 206, 1363–1368. [Google Scholar] [CrossRef]
  3. Chun, J.; Kim, C.-K.; Kang, W.; Park, H.; Kim, G.; Lee, W.-K. Sustainable Management of Carbon Sequestration Service in Areas with High Development Pressure: Considering Land Use Changes and Carbon Costs. Sustainability 2019, 11, 5116. [Google Scholar] [CrossRef] [Green Version]
  4. Vitousek, P.M.; Mooney, H.A.; Lubchenco, J.; Melillo, J.M. Human Domination of Earth’s Ecosystems. Science 1997, 277, 494–499. [Google Scholar] [CrossRef] [Green Version]
  5. Sala, O.E.; Chapin, F.S.; Armesto, J.J.; Berlow, E.; Bloomfield, J.; Dirzo, R.; Huber-Sanwald, E.; Huenneke, L.F.; Jackson, R.B.; Kinzig, A.; et al. Global Biodiversity Scenarios for the Year 2100. Science 2000, 287, 1770–1774. [Google Scholar] [CrossRef] [PubMed]
  6. Trimble, S.W.; Crosson, P.U.S. Soil Erosion Rates-Myth and Reality. Science 2000, 289, 248–250. [Google Scholar] [CrossRef] [Green Version]
  7. Lambin, E.F.; Geist, H.J.; Lepers, E. Dynamics of Land-Use and Land-Cover Change in Tropical Regions. Annu. Rev. Environ. Resour. 2003, 28, 205–241. [Google Scholar] [CrossRef] [Green Version]
  8. Dorocki, S.; Raźniak, P.; Winiarczyk-Raźniak, A. Changes in the command and control potential of European cities in 2006–2016. Geogr. Pol. 2019, 92, 275–288. [Google Scholar] [CrossRef]
  9. Esposito, M.A.; Perdigao, V.; Christensen, S.; Di Cura, A. The LaCoast Atlas: Land Cover Changes in European Coastal Zones; EU—European Commission Publication Office, Joint Research Centre: Milan, Italy, 2000. [Google Scholar]
  10. Antso, K.; Palginõmm, V.; Szava-Kovats, R.; Kont, A. Dynamics of Coastal Land Use over the Last Century in Estonia. J. Coast. Res. 2011, SI 64, 1769–1773. [Google Scholar]
  11. Neumann, B.; Ott, K.; Kenchington, R. Strong sustainability in coastal areas: A conceptual interpretation of SDG 14. Sustain. Sci. 2017, 12, 1019–1035. [Google Scholar] [CrossRef] [Green Version]
  12. Merkens, J.-L.; Reimann, L.; Hinkel, J.; Vafeidis, A.T. Gridded population projections for the coastal zone under the Shared Socioeconomic Pathways. Glob. Planet. Chang. 2016, 145, 57–66. [Google Scholar] [CrossRef] [Green Version]
  13. Merkens, J.-L.; Vafeidis, A. Using Information on Settlement Patterns to Improve the Spatial Distribution of Population in Coastal Impact Assessments. Sustainability 2018, 10, 3170. [Google Scholar] [CrossRef] [Green Version]
  14. Neumann, B.; Vafeidis, A.T.; Zimmermann, J.; Nicholls, R.J. Correction: Future Coastal Population Growth and Exposure to Sea-Level Rise and Coastal Flooding—A Global Assessment. PLoS ONE 2015, 10, e0131375. [Google Scholar] [CrossRef]
  15. Eurostat. Eurostat regional yearbook 2011, chapter 13 Coastal Region. In Eurostat Regional Yearbook 2011; Publications Office of the European Union: Luxembourg, 2011; pp. 170–183. [Google Scholar]
  16. Institute of Meteorology and Water Management. Assessment of Actual and Future Climate Changes on Polish Coastal Zone and Its Ecosystem. Available online: https://nfosigw.gov.pl/download/gfx/nfosigw/pl/nfoekspertyzy/858/210/1/2014-424.pdf (accessed on 19 December 2019).
  17. Fortuniak, K. Stochastyczne i deterministyczne aspekty zmienności wybranych elementów klimatu Polski. Acta Univ. Lodz. Folia Geogr. Phys. 2000, 4, 1–139. [Google Scholar]
  18. Neumann, T.; Schernewski, G.; Hofstede, J. Global Change and Baltic Coastal Zones; Coastal Research Library; Springer: Dordrecht, The Netherlands, 2011; Volume 1. [Google Scholar] [CrossRef]
  19. Zaucha, J. Territorial Cohesion—Baltic Sea Region Examples; Baltic 21 Series; s.Pro Sustainable Projects: Berlin, Germany, 2011; Volume 2. [Google Scholar]
  20. Eurostat. Methodological Manual on Territorial Typologies—2018 Edition; Publications Office of the European Union: Luxembourg, 2019. [Google Scholar] [CrossRef]
  21. GUS. Statystyka Regionalna—Regional Statistic. Available online: http://stat.gov.pl/statystyka-regionalna/jednostki-terytorialne/klasyfikacja-nuts/ (accessed on 13 November 2019).
  22. Tylkowski, J. The tendencies of bioclimatic conditions changes and dynamics occurrence of thermally stimulus weather events in the Polish Baltic coastal zone. J. Educ. Health Sport 2017, 7, 467–480. [Google Scholar] [CrossRef]
  23. Pruszak, Z.; Zawadzka, E. Vulnerability of Poland’s Coast to Sea-Level Rise. Coast. Eng. J. 2005, 47, 131–155. [Google Scholar] [CrossRef]
  24. Bossard, M.; Feranec, J.; Otahel, J. Technical Report No 40/2000 CORINE Land Cover Technical Guide—Addendum 2000; EEA: Copenhagen, Denmark, 2000. [Google Scholar]
  25. Bielecka, E.; Jenerowicz, A. Intellectual Structure of CORINE Land Cover Research Applications in Web of Science: A Europe-Wide Review. Remote Sens. 2019, 11, 2017. [Google Scholar] [CrossRef] [Green Version]
  26. GIOŚ. CORINE Land Cover-CLC. Available online: http://clc.gios.gov.pl/ (accessed on 30 November 2019).
  27. Główny Urząd Geodezji i Kartografii. Geoportal Infrastruktury Informacji Przestrzennej. Available online: Geoportal.gov.pl (accessed on 10 February 2020).
  28. Copernicus Proramme. Copernicus Land Monitoring Service. Available online: https://land.copernicus.eu/imagery-in-situ (accessed on 10 February 2020).
  29. European Space Agency. Copernicus Open Access Hub. Available online: https://scihub.copernicus.eu/ (accessed on 10 February 2020).
  30. U.S. Geological Survey. Landsat Data Access. Available online: https://www.usgs.gov/land-resources/nli/landsat/landsat-data-access (accessed on 20 April 2020).
  31. European Commission Eurostat. NUTS. Available online: https://ec.europa.eu/eurostat/web/gisco/geodata/reference-data/administrative-units-statistical-units/nuts (accessed on 10 December 2019).
  32. European Parliament. Regulation (EC) No 1059/2003 of the European Parliament and of the Council of 26 May 2003 on the Establishment of a Common Classification of Territorial Units for Statistics (NUTS); OJ L 154; The European Parliament: Brussels, Belgium, 2003; pp. 1–41. [Google Scholar]
  33. Sun, W.; Chen, B.; Messinger, D.W. Nearest-neighbor diffusion-based pan-sharpening algorithm for spectral images. Opt. Eng. 2014, 53, 013107. [Google Scholar] [CrossRef] [Green Version]
  34. Lambin, E.F.; Rounsevell, M.D.A.; Geist, H.J. Are agriculturala land-use model able to predict changes in land-use intensity. Agric. Ecosyst. Environ. 2000, 82, 321–331. [Google Scholar] [CrossRef]
  35. Feranec, J.; Jaffrain, G.; Soukup, T.; Hazeu, G. Determining changes and flows in European landscapes 1990–2000 using CORINE land cover data. Appl. Geogr. 2010, 30, 19–35. [Google Scholar] [CrossRef]
  36. Ripley, B.D. The second-order analysis of stationary point processes. J. Appl. Probab. 1976, 13, 255–266. [Google Scholar] [CrossRef] [Green Version]
  37. Deng, Y.; Liu, J.; Liu, Y.; Luo, A. Detecting Urban Polycentric Structure from POI Data. ISPRS Int. J. GeoInf. 2019, 8, 283. [Google Scholar] [CrossRef] [Green Version]
  38. Silverman, B.W. Density Estimation for Statistics and Data Analysis; Chapman and Hall/CRC: New York, NY, USA, 1986. [Google Scholar]
  39. Gini, C. On the Measure of Concentration with Special Reference to Income and Statistics. Color. Coll. Publ. Gen. Ser. 1936, 208, 73–79. [Google Scholar]
  40. European Environment Agency. The Thematic Accuracy of Corine Land Cover 2000: Assessment Using LUCAS (Land Use/Cover Area Frame Statistical Survey); EEA Technical Report No 7/2006; EEA Publication Office: Copenhagen, Denmark, 2006; p. 85. Available online: https://www.eea.europa.eu/publications/technical_report_2006_7 (accessed on 5 May 2020).
  41. GUS. Forestry; Statistical Publishing Establishment: Warsaw, Poland, 2017. Available online: www.stat.gov.pl (accessed on 12 December 2019).
  42. Agarwal, C.; Green, G.M.; Grove, J.M.; Evans, T.P.; Schweik, C.M. A Review and Assessment of Land-Use Change Models: Dynamics of Space, Time, and Human Choice; General Techical Report NE-297; U.S. Northeastern Research Station, Forest Service, Department of Agriculture: Newtown Square, PA, USA, 2002; p. 61. [Google Scholar]
  43. Guerra, C.A.; Rosa, I.M.D.; Pereira, H.M. Change versus stability: Are protected areas particularly pressured by global land cover change? Landsc. Ecol. 2019, 34, 2779–2790. [Google Scholar] [CrossRef] [Green Version]
  44. Matyka, M. Analiza regionalnego zróżnicowania zmian w użytkowaniu gruntów w Polsce. Pol. J. Agron. 2012, 10, 16–20. [Google Scholar]
  45. Woch, M.; Konarski, M. Ewolucja Prawa Miejscowego Jednostek Samorządu Terytorialnego w Polsce; Wydawnictwo Marek Woch: Warszawa, Poland, 2014. [Google Scholar]
  46. Bielecka, E.; Ciołkosz, A. Land Cover Structure in Poland and its changes in the last decade of 20th Century. Ann. Geomat. 2004, 2, 81–93. [Google Scholar]
  47. EEA. Landscapes in Transition An Account of 25 Years of Land Cover Change in Europe; EEA Report No 10/2017; Publications Office of the European Union: Luxembourg, 2017; Available online: https://www.eea.europa.eu/publications/landscapes-in-transition (accessed on 28 November 2019).
  48. Hosciło, A.; Tomaszewska, M. CORINE Land Cover 2012—4th CLC inventory completed in Poland. Geoinf. Issues 2014, 6, 49–58. [Google Scholar] [CrossRef]
  49. Walz, U. Monitoring of landscape change and functions in Saxony (Eastern Germany)—Methods and indicators. Ecol. Indic. 2008, 8, 807–817. [Google Scholar] [CrossRef]
  50. Łowicki, D.; Walz, U. Gradient of Land Cover and Ecosystem Service Supply Capacities—A Comparison of Suburban and Rural Fringes of Towns Dresden (Germany) and Poznan (Poland). Procedia Earth Planet. Sci. 2015, 15, 495–501. [Google Scholar] [CrossRef] [Green Version]
  51. Ministry of Regional Development. National Strategy of Regional Development 2010–2020. Regions, Cities, Rural Areas; Ministry of Regional Development: Warsaw, Poland, 2010. [Google Scholar]
  52. Journal of Laws. Geodetic and Cartographic Law; Dz.U. 2016, poz. 1629; Law Office of the Polish Parliament: Warsaw, Poland, 2016. [Google Scholar]
  53. Noszczyk, T. Land Use Change Monitoring as a Task of Local Government Administration in Poland. J. Ecol. Eng. 2018, 19, 170–176. [Google Scholar] [CrossRef]
  54. Bański, J.; Degórski, M.; Komornicki, T.; Śleszyński, P. The delimitation of areas of strategic intervention in Poland: A methodological trial and its results. Morav. Geogr. Rep. 2018, 26, 84–94. [Google Scholar] [CrossRef] [Green Version]
  55. Journal of Laws. Act on the Protection of Agricultural and Forest Land; Dz.U. 1995 nr 16 poz. 78; Law Office of the Polish Parliament: Warsaw, Poland, 2017. [Google Scholar]
  56. Gibas, P.; Majorek, A. Analysis of Land-Use Change between 2012–2018 in Europe in Terms of Sustainable Development. Land 2020, 9, 46. [Google Scholar] [CrossRef] [Green Version]
  57. European Environment Agency. Thematic Hotspot Monitoring in Coastal Zones. New Product Update 2019–20. August 2019. Available online: https://land.copernicus.eu/local/coastal-zones (accessed on 17 February 2020).
  58. Nicolau, R.; David, J.; Caetano, M.; Pereira, J. Ratio of Land Consumption Rate to Population Growth Rate—Analysis of Different Formulations Applied to Mainland Portugal. ISPRS Int. J. GeoInf. 2018, 8, 10. [Google Scholar] [CrossRef] [Green Version]
  59. Liu, S.; Bai, J.; Chen, J. Measuring SDG 15 at the County Scale: Localisation and Practice of SDGs Indicators Based on Geospatial Information. ISPRS Int. J. GeoInf. 2019, 8, 515. [Google Scholar] [CrossRef] [Green Version]
  60. INSPIRE Thematic Working Group Land Cover. D2.8.II.2 INSPIRE Data Specification on Land Cover—Technical Guidelines. 2013. Available online: https://inspire.ec.europa.eu/id/document/tg/lc (accessed on 14 March 2020).
Figure 1. The Polish Baltic coastal zone.
Remotesensing 12 02088 g001
Figure 2. Short and long-term analysis of land cover changes; simplified diagram.
Remotesensing 12 02088 g002
Figure 3. Polish coastal zone land cover structure in percent: (a) agricultural areas; (b) forest cover; (c) artificial surfaces.
Remotesensing 12 02088 g003
Figure 4. Land cover changes in the Polish Baltic coastal region: (a) net changes in percent 1990–2018; (b) percent of main CLC land cover types; (c) net changes in percent 1990–2018 by regions; (d) total area and number of patches.
Remotesensing 12 02088 g004
Figure 5. The percentage share of the land cover changes and the number of change polygons by counties (NUTS4 administration units in Poland).
Remotesensing 12 02088 g005
Figure 6. The spatial pattern of land cover changes in 1990–2018, in the relation of scale. Ripley’s K function.
Remotesensing 12 02088 g006
Figure 7. The density of land cover changes estimated by the kernel function.
Remotesensing 12 02088 g007
Figure 8. Gini coefficient for: (a) LCF1 and (b) LCF5.
Remotesensing 12 02088 g008
Figure 9. Dziwnow, the coastal resort in the Szczecinski region, 0.25 m aerial ortoimagery from geoportal.gov.pl: (a) 2005; (b) 2018; (c) planned, until 2020, development the Dziwnow peninsula.
Remotesensing 12 02088 g009
Figure 10. Choropleth map of LCF2 and LCF4 in percent.
Remotesensing 12 02088 g010
Figure 11. Land cover flows in 1990–2018 in percent: (a) LCF4, afforestation; (b) LF5, deforestation.
Remotesensing 12 02088 g011
Figure 12. Coniferous forest in the Slupsk region: (a) 2006—without clear-cuttings; (b) 2012—green polygons indicate cutting conducted from 2006 to 2012; (c) 2018—new cutting marked in yellow; (d,e) Bytow and Lipusz districts of Bory Tucholskie Forest CIR compositions, before (d) and after hurricane (e) in 2017.
Remotesensing 12 02088 g012aRemotesensing 12 02088 g012b
Figure 13. Long and short-term diversity of land consumption rate (LConR) across the Polish Baltic coastal zone and regions.
Remotesensing 12 02088 g013
Figure 14. The urban green ratio in the city counties: (a) UGrR in 2018; (b) UGrR changes in 1990–2018.
Remotesensing 12 02088 g014
Figure 15. Forest area in km2 and forest cover in protected areas.
Remotesensing 12 02088 g015
Table 1. Polish coastal regions: area and population.
Coastal Region (NUTS3) NamesNumber of Counties 1,2Population Total 1Population Density 1Area [km2]
Elblaski7(1)526,321727323.46
Gdanski5(0)590,1981374299.30
Trojmiejski3(3)748,9861805415.05
Slupski4(1)335,402645240.16
Koszalinski5(1)357,478824363.27
Starogardzki5(0)432,4881064095.79
Szczecinski7(1)513,412697444.81
City of Szczecin1(1)402,4651339300.50
Total37(8)3,906,750 33,482.34
1 Based on statistical data from the year 2018 [21]. 2 The number of city counties (cities with poviat rights) is shown in brackets.
Table 2. Overview of satellite data used for land cover interpretation in Poland.
Reference YearSatelliteTemporal Extend (Poland) 1
1990Landsat 4/5 TM1986–1995
2000Landsat 7 ETM+1990–2001
2006SPOT 4/5, IRS-P62005–2006
2012RapidEye, IRS-P62011–2012
2018Sentinel 2, Landsat-82017
1 Based on National Reports on CORINE Land Cover inventories (available at Chieef Environmental Inspectorate- Glowny Inspektroat Ochrony Srodowiska (GIOS) web site http://clc.gios.gov.pl/).
Table 3. CORINE Land Cover nomenclature (level 1 and level 2).
CLC Level 1CLC Level 2
CodeNameCodeName
1.Artificial surfaces1.1Urban fabric
1.2Industrial, commercial and transport units
1.3Mine, dump and construction sites
1.4Artificial, non-agricultural vegetated areas
2.Agricultural areas2.1Arable land
2.2Permanent crops
2.3Pastures
2.4Heterogeneous agricultural areas
3.Forests and semi-natural areas3.1Forest
3.2Scrub and/or herbaceous vegetation associations
3.3Open spaces with little or no vegetation
4.Wetlands4.1Inland wetlands
4.2Coastal wetlands1
Water bodies5.1Continental waters
5.2Marine waters
1Italics show the land cover class that does not occur in Poland.
Table 4. Satellite and aerial imageries used for CLC change verification.
ProductsTime HorizonRepositoryComments
Aerial orthophotomapas1990s, since 2000 every 2 yearsGeoportal maintained by the Head Office of Geodesy and Cartography [27]For the 1990s. data available only for Gdansk, Sopot, Szczecin; 0.25 resolution
Very High-Resolution Image Mosaic 20122012Copernicus land monitoring services [28]True Colour (2.5m) of pan-sharpened: SPOT-5, 6 and FORMOSAT-2
The HR Mosaic for 20182018Copernicus land monitoring services [28]Sentinel-2 (10 m) true and false colour compositions
Sentinel-22018European Space Agency (ESA) [29]Sentinel-2 (10 m, 20 m, 60 m); false colour compositions
IKONOS, QuickBird, GeoEye, WorldView, SPOT, PleiadesSince 2000 1Google EarthTrue-colour compositions; Very High-resolution images 2.5–5 m resolution
Landsat1990 1, 2000, 2006, 2012, 2018USGS Earth Explorer [30]For 1990 partial coverage; Pansharpened images (15 m); True and false colour compositions
1 Depending on the period and place being analysed, different Very High Resolution (VHR) satellite images are available.
Table 5. The area in percent occupied according to the CORINE Land Cover (CLC) inventories.
CLC CodeCLC Nomenclature19902000200620122018Net Changes in 1990–2018 1
1.1Urban fabric1.7932.1383.3753.8993.9482.155
1.2Industrial, commercial and transport units0.4660.4700.5150.6140.6560.190
1.3Mine, dump and construction sites0.0570.0710.1320.1670.2430.186
1.4Artificial, non-agricultural vegetated areas0.2310.2450.2970.3440.3460.114
2.1Arable land44.74144.66443.60642.68042.519–2.222
2.2Permanent crops0.0890.0700.0710.0820.078–0.010
2.3Pastures8.8758.4168.9488.7748.717–0.157
2.4Heterogeneous agricultural areas8.1057.4945.3694.9994.975–3.130
3.1Forest32.14632.85633.15333.70933.5731.427
3.2Scrub and/or herbaceous vegetation associations0.2880.3771.3331.5061.7141.426
3.3Open spaces with little or no vegetation0.1360.1140.1060.0980.098–0.038
4.1Inland wetlands0.5210.5230.5090.5390.5400.019
4.2Coastal wetlands20.0000.0000.0000.0000.0000.000
5.1Continental waters2.4742.4822.5012.5062.5090.034
5.2Marine waters0.0800.0790.0860.0850.0840.005
Total100100100100100
1 + increase; − decrease. 0—unchanged; 2 land cover class that does not occur in Poland.
Table 6. Land cover flow in 1990-2018.
Land Cover Flow1990–20002000–20062006–20122012–20181990–2018
%/km2%/km2%/km2%/km2%/km2
LCF1—Urbanization0.0590.0840.1640.1830.49
1975.462812.525491.116127.2716,406.36
LCF2—Intensification of agriculture000.0160.030.046
535.721004.471540.19
LCF3—Extensification of agriculture0.0910.050.0090.0070.157
3046.901674.12301.34234.385256.73
LCF4—Afforestation0.2080.1490.3010.230.888
6964.334988.8710,078.197700.9529,732.35
LCF5—Deforestation0.0350.1930.3460.5991.173
1171.886462.1011,584.9020,055.9439,274.82

