Article

R2FA-Det: Delving into High-Quality Rotatable Boxes for Ship Detection in SAR Images

Science and Technology on Automatic Target Recognition Laboratory, National University of Defense Technology, Changsha 410073, China
*
Author to whom correspondence should be addressed.
Remote Sens. 2020, 12(12), 2031; https://doi.org/10.3390/rs12122031
Submission received: 26 May 2020 / Revised: 14 June 2020 / Accepted: 20 June 2020 / Published: 24 June 2020
(This article belongs to the Special Issue Computer Vision and Deep Learning for Remote Sensing Applications)

Abstract

:
Recently, convolutional neural network (CNN)-based methods have been extensively explored for ship detection in synthetic aperture radar (SAR) images due to their powerful feature representation abilities. However, there are still several obstacles hindering the development. First, ships appear in various scenarios, which makes it difficult to exclude the disruption of the cluttered background. Second, it becomes more complicated to precisely locate the targets with large aspect ratios, arbitrary orientations and dense distributions. Third, the trade-off between accurate localization and improved detection efficiency needs to be considered. To address these issues, this paper presents a rotate refined feature alignment detector (R 2 FA-Det), which ingeniously balances the quality of bounding box prediction and the high speed of the single-stage framework. Specifically, first, we devise a lightweight non-local attention module and embed it into the stem network. The recalibration of features not only strengthens the object-related features yet adequately suppresses the background interference. In addition, both forms of anchors are integrated into our modified anchor mechanism and thus can enable better representation of densely arranged targets with less computation burden. Furthermore, considering the shortcoming of the feature misalignment existing in the cascaded refinement scheme, a feature-guided alignment module which encodes both the position and shape information of current refined anchors into the feature points is adopted. Extensive experimental validations on two SAR ship datasets are performed and the results demonstrate that our algorithm has higher accuracy with faster speed than some state-of-the-art methods.

Graphical Abstract

1. Introduction

With the superiority of monitoring targets in all-time and all-weather conditions, synthetic aperture radar (SAR) has become an effective tool for providing increasing numbers of images and plays a significant role in civilian and military fields. The advancing of spaceborne and airborne SAR sensors, such as Sentinel-1, TerraSAR-X, RADARSAT-2 and Gaofen-3, has further facilitated the research of SAR ship detection. Their potential applications under discussion are extensive, including maritime management, harbor dynamic surveillance and battlefield environment perception. However, ship detection in SAR images [1] is demanding owing to the huge variations of ships in scales, shapes, orientations and distributions. Moreover, the complex inshore and sea-cluttered background could further interfere the targeted ships.
The conventional approaches can be categorized into four types, including statistical characteristics-based methods [2,3], transformation-based methods [4,5], saliency-based methods [6,7,8] and polarization information-based methods [9,10]. Although many of them have been exploited in practical applications, these methods are highly dependent on hand-crafted features and are less adaptable to new SAR images. Additionally, the algorithm modeling and the multi-step processing are time-consuming and less intelligent.
Beneficial in terms of the powerful feature representation capabilities and robustness, a series of object detection methods based on convolutional neural networks (CNNs) have made remarkable progress in the literature of computer vision. The state-of-the-art deep CNN-based object detection methods can be roughly divided into two main streams: (1) two-stage detection algorithms [11,12,13,14,15,16] which first generate candidate proposals and then perform region classification and refined location in the second stage; (2) one-stage detection algorithms [17,18,19,20,21] which use a single convolutional network to directly predict the bounding boxes and corresponding classes. The two-stage methods dominate accuracy in bounding box prediction, whereas the single-stage approaches have enhanced computational efficiency.
Compared with astonishing progresses made on general object detection, the huge domain mismatch between SAR images and natural scene images makes deep CNN-based SAR ship detection a challenging task. Previous works have investigated the application of CNN on SAR ship detection and satisfactory results have been reported within both two-stage methods [22,23,24,25] and single-stage methods [26,27,28,29]. However, these approaches represent and locate a ship target in the form of a horizontal bounding box, which is not suitable for ships with large aspect ratios and arbitrary orientations. Furthermore, ships in port or inshore are too closely packed to be effectively distinguished, thereby resulting in missing detections. Therefore, the rotatable bounding box (RBox) has been employed in [30,31,32,33], and this representation can better describe the true shape of the target whilst providing better accuracy in ship detection.
Despite the previous works, the following issues remain unaddressed. First, as we have pointed out above, ships in SAR images are usually embedded into a complex and cluttered background, which prevents conventional convolutions from extracting salient features for detection. Thus, a more discriminative feature representation is required. Second, although the number of matched prior boxes increases when rotated anchors are introduced, the usage of RBox reduces the detection efficiency since an additional degree of rotational freedom needs to be determined. In addition, conventional approaches require manual calibration of the RBox, which renders them more complicated and less adaptive. Therefore, a better paradigm for anchor generation in SAR rotated ship detection needs to be considered. Third, the conventional two-stage and one-stage methods benefit from either accuracy or efficiency, while sacrificing the other. A fine balance between both merits was rarely considered in previous literature and would be more appealing to be examined. As a representative example, RefineDet [34] borrows the two-step regression strategy for a one-stage detector; however, the feature points corresponding to each refined anchor remain unchanged. Hence, feature adaptations are needed throughout the refinement stages to make the regression branch more optimal.
As a response to the aforementioned problems, this paper delves into the accurate detection of arbitrarily oriented SAR ships under complex scenarios by proposing a rotated refined feature alignment detector (R 2 FA-Det). Specifically, we first propose a lightweight attention block to reinforce the features extracted from object-related regions and mitigate the adverse effect caused by complex background. For the purpose of embodying the concrete feature response, both the neighborhood information and all the other location information are aggregated in this attention module. Note that the attention block is carefully designed to be lightweight such that the feature extraction does not incur much computational burden. Next, to avoid the complex manual calibration of the hyper parameters in rotated anchors, we improve the representation of the bounding box by implementing a combination strategy of initial horizontal anchors and refined rotated ones. In this new form of anchor, we obtain the angle information by multi-stage regression which gets rid of laborious manual design and progressively strengthens the requirement for more compact bounding boxes. Finally, so as to mitigate the misalignment phenomenon, we resort to the single-stage detector with cascade structure which consists of a feature guided alignment module. This module dynamically adjusts the feature points associated with the refined anchors instead of original ones, making the detector more perceptive of the position refinement. Experiments on two typical SAR image datasets demonstrate the superiority of the proposed method for achieving precise and compact locations with low computation cost.
The main contributions of this paper are summarized from the following aspects:
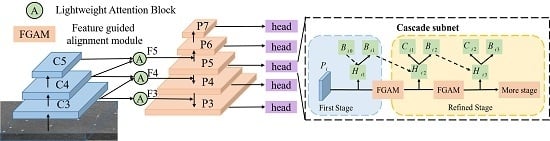
  • For paying more attention to the object-related region, an efficient version of the non-local attention mechanism is embedded in the feature pyramidal structure. This attention block merges the contextual information from the adjacent feature levels, enabling a more discriminative feature representation without incurring extra computation burden.
  • For densely arranged or arbitrarily oriented targets in SAR images, a modified anchor mechanism is proposed by enjoying the merits of both horizontal anchors and rotated ones. We also resolve the problem of rotated anchor generation by attaching multi-stage refinement, which not only considerably reduces the amount of ineffective rotated anchors, but also satisfies the precise position estimation of the target.
  • To the best of our knowledge, this is the first work in the field of rotated SAR ship single-stage detectors that mitigates the feature misalignment problem resulting from the cascaded pipeline. The relationship between the refined rotated anchors and adapted feature pixels can be established by the feature guided alignment module, which further boosts the precision of the predicted results.
  • Our method is validated comprehensively and compared with many representative deep CNN-based detection methods on two SAR ship datasets. When it comes to large-scene SAR ship detection based on rotated bounding box, the proposed architecture can achieve the state-of-the-art results and provide a useful benchmark for the future research.
The remainder of this paper is organized as follows. Section 2 reviews the related work. Section 3 illustrates the framework designed for ship detection. Several experiments on two SAR ship datasets were conducted to verify the effectiveness of our method, and detailed experimental results and analysis are presented in Section 4. Finally, Section 5 concludes this paper with further discussions.

2. Related Work

Here, we briefly introduce deep CNN-based object detection methods in SAR images and optical remote sensing images (RSIs).

2.1. Deep CNN Method for SAR Ship Detection

Owing to the powerful feature extraction ability, deep CNN-based methods are widely employed for SAR ship detection as a substitute for hand-crafted feature-based traditional methods. The majority of studies on SAR ship detection have been carried out by region-proposal based methods. As a pioneering investigation into the standard faster R-CNN method, Li et al., applied several tricks, such as transfer learning, feature fusion and hard negative mining, while building a SAR ship detection dataset (SSDD) for verifying their model [22]. To improve the detection results of small-sized ships, the shallow high-resolution features are fused with the deep semantic features by using a top-down pathway or densely connected structure [23,24]. The fusion of ship context information in [23] also boosts the accuracy of inshore ships detection. To alleviate the imbalance between foreground and background samples, focal loss has been explored in the both region-based method [24] and the regression-based method [26]. As a novel and valid approach which learns a ship detector from scratch, Deng et al. redesigned the backbone network and enabled training without a large number of training samples [35]. In terms of detection efficiency, single-stage-based methods are receiving more and more attention [26,27,28,29]. The dense attention pyramid network (DAPN) [29] and the method in [28] both extract high-resolution fused feature maps with more semantic information and integrate the attention mechanism in different parts of their model: the first one is based on the horizontal bounding box, whereas the second one outputs the angle prediction.

2.2. Deep CNN Method for RSIs

In this part, we reflect on some detection frameworks designed for rotated targets [36,37,38,39,40,41,42]. Derived by Faster RCNN, Zhang et al. generated multi-oriented proposals by rotated RPNs and extracted rotated RoI features by rotated RoI pooling, which can be beneficial for ships in dense arrangements [39]. Yang et al. further combined the rotation properties of targets with a dense feature pyramid network (R-DFPN) [40]. For both horizontal and rotated bounding box generation, Zhang et al. incorporated contextual information to provide extra guidance for objects and proposed a scale-aware attention module which focuses on specific image scales [43]. To reduce the number of rotated anchors, a subnetwork is adopted to regress the transformation parameters from horizontal RoIs to rotated RoIs and a lightweight RCNN is put forward [44]. Independent of RPN, the multi-dimensional attention network based on a tailored feature fusion structure has been devised to further achieve advanced performance [45]. As for a rotatable framework specially designed for SAR ship detection, the existing work [28,30,31] rarely takes the anchor representation into consideration and highly depends on the default angles.

3. Proposed Methodology

The framework of the R 2 FA-Det is depicted in Figure 1, which consists of three main components: the backbone network for feature extraction, the lightweight attention-strengthened module and the detection head in cascade structure. The overall architecture is established on the basis of one the most advanced single-stage detectors, RetinaNet. In this section, we first re-visit the standard feature extractor with pyramidal representation. Moreover, the attention module is injected into the adjacent feature levels to construct abundant feature representation. Then, we illustrate the combination of two forms of anchors and the feature guided alignment module in cascade structure, respectively.

3.1. Attention-Strengthened FPN Structure

Since low-level feature maps with higher resolution are suitable for small-scale ship detection, whereas high-level ones with more semantic information fit well for large scale objects, the feature pyramid network (FPN) serves as a widespread backbone network to fuse multi-scale features. However, the multi-scale features extracted solely by general convolutions are less representative in capturing contextual information. To this effect, a feature enrichment scheme is introduced to improve the discriminative power of the backbone network, thereby generating salient feature maps passed to prediction layers in the detection head. As shown in Figure 1, the fundamental structure of FPN is comprised of, bottom-up, the feedforward network, the lateral connections and the top-down network. In particular, an attention-strengthened FPN (AFPN) is devised by adding a lightweight attention block (LAB) into the lateral connections and this design effectively improves the feature representation capability between adjacent levels.
Standard convolutions only capture the dependencies between spatial neighborhood pixels, whereas repeatedly combining convolutions is still less effective in understanding global scene information. In contrast to stacked convolutions, the non-local block [46] potently captures long-range dependencies between pixels, which are crucial for modeling the global context. Since the basic non-local block aims at strengthening the features of the query position by information aggregation from other positions, numerous matrix multiplications dominate the computation and cause the inefficiency of this attention mechanism. Some simplified yet effective designs of the non-local module have showcased its outperformance in semantic segmentation, as hinted in [47,48,49]. Motivated by these modules, we provide a combination of the non-local block and pyramid sampling mechanisms to leverage the advantage of both and alleviate the computational overhead. Furthermore, differently from the single input feature map of the non-local block, an alternative to fusing adjacent level feature maps is instantiated in our proposed block. By doing so, we arrive at the final formulation of LAB, as sketched in Figure 2.
According to the left part of Figure 1, ResNet [50] with FPN is adopted as the backbone network. The output feature maps are down-sampled 32 times by five stages and we only utilize three levels of the multi-scale feature pyramid, following the design of RetinaNet. We then zoom in to show how the LAB acts on the neighboring layer of the backbone network. In the two adjacent stages, consider the feature map from the lower level denoted as C i t i × H × W and the feature map from the higher level C i + 1 t i + 1 × H / 2 × W / 2 . t i , H and W indicate the channel number, spatial height and width of corresponding feature level i, while t i + 1 means the channel number of the higher level feature map. 1 × 1 convolutions are applied to transform C i to the query embedding α . Two parallel branches named the key and value branch, which enjoy a similar structure as the query branch, are attached to the higher level feature C i + 1 and the outputs are represented by β and γ , respectively. Next, the three embeddings are flattened to size t ^ × N , where N denotes the total number of pixels ( N = H × W ) and t ^ denotes the channel number after transformation. In the detection framework, the output of the backbone network in each stage has a large resolution (for an input of size 512, the output feature map is of size 64, N = 64 2 ). In order to decrease the huge computational overhead caused by similarity matrix multiplication calculated on the query embedding, changing N to a smaller number S is a valid option, which can be achieved by sampling the most representative pixels from β and γ rather than feeding all the spatial points. We embed atrous spatial pyramid pooling (ASPP) in the non-local block to enhance global and multi-scale representations while avoiding redundant computation. The ASPP part consists of one 1 × 1 convolution and three 3 × 3 convolutions with different sampling rate s = ( 3 , 6 , 9 ) , which are further pooled in parallel branches and fused to generate the final result. That is, after operations by convolutions, we propose to add sampling operations P β and P γ after β and γ ; thus, the sampled outputs of the key and the value branch can be computed by:
β P = P β ( β ) , γ P = P γ ( γ ) .
which embeds context features of different scales and encodes global semantic information with an expanded receptive field. Specifically, the sampled output size of each pooling layer attached at each branch of ASPP is set as n = 1 , 2 , 3 , 5 , respectively. Next, the four pooling results are flattened and then concatenated to serve as the input of the matrix multiplication. Then the total number of feature pixels can be calculated as S = n 2 . Compared with the size of original feature map, the computational complexity of the non-local module is largely reduced by S / H × W times in this way.
When calculating the similarity matrix, the query vector α is the first dot product of the sampled points β P represented as:
S α β = α T × β P
Then, after the softmax function, as applied in [46], the output of three branches can be obtained by:
O s = Softmax ( S α β ) × γ P T
where O s t ^ × N . By ensuring the consistency of channel numbers, the final output F i is computed via a residual unit:
F i = W o ( O s T ) + C i
where W o , implemented by a 1 × 1 convolution, acts as a weighting factor which transforms the channel dimension from t ^ to t i .
Both the bottom-up part of FPN and our attention-strengthened FPN follow the feed-forward computation of the stem network which builds a feature hierarchy. The forward features from all levels of bottom-up scheme are represented as a multi-scale feature pyramid F p = { F 3 , F 4 , F 5 } . As described above, the lightweight attention block achieves enhanced feature representation by fusing the feature map of high-level C i + 1 with the adjacent low-level C i . Note that LAB starts from level C 3 , the forward feature F 3 for the lowest pyramidal level is in fact obtained by substituting lower level features with reused feature from C 3 . That is,
F i = ϕ i ( C i , C i ) , ( i = 3 ) ϕ i ( C i , C i 1 ) , ( i = 4 , 5 )
where C i is the forward feature from i t h level and ϕ i ( . ) denotes serial operations included in LAB.
In addition to the bottom-up part, the top-down scheme in FPN further injects the high-level semantic information from the latter layers to the former ones. For i t h level,
P i = μ k ( P i + 1 ) + F i , ( i = 3 , 4 ) F i , ( i = 5 ) C o n v ( P i 1 ) , ( i = 6 , 7 )
where μ k is the upsampling operation; C o n v is a 3 × 3 conv block with stride 2. This implies the backward feature pyramid B p = { P 3 , P 4 , , P n } ( n = 7 ) , which is further applied as the input of prediction layer.
As a consequence, the forward features from all levels of bottom-up scheme are endowed with global scene semantic cues. Meanwhile, our lightweight attention block is explicitly suited to maintain both efficiency and effectiveness in distinguishing targets from complex scenarios.

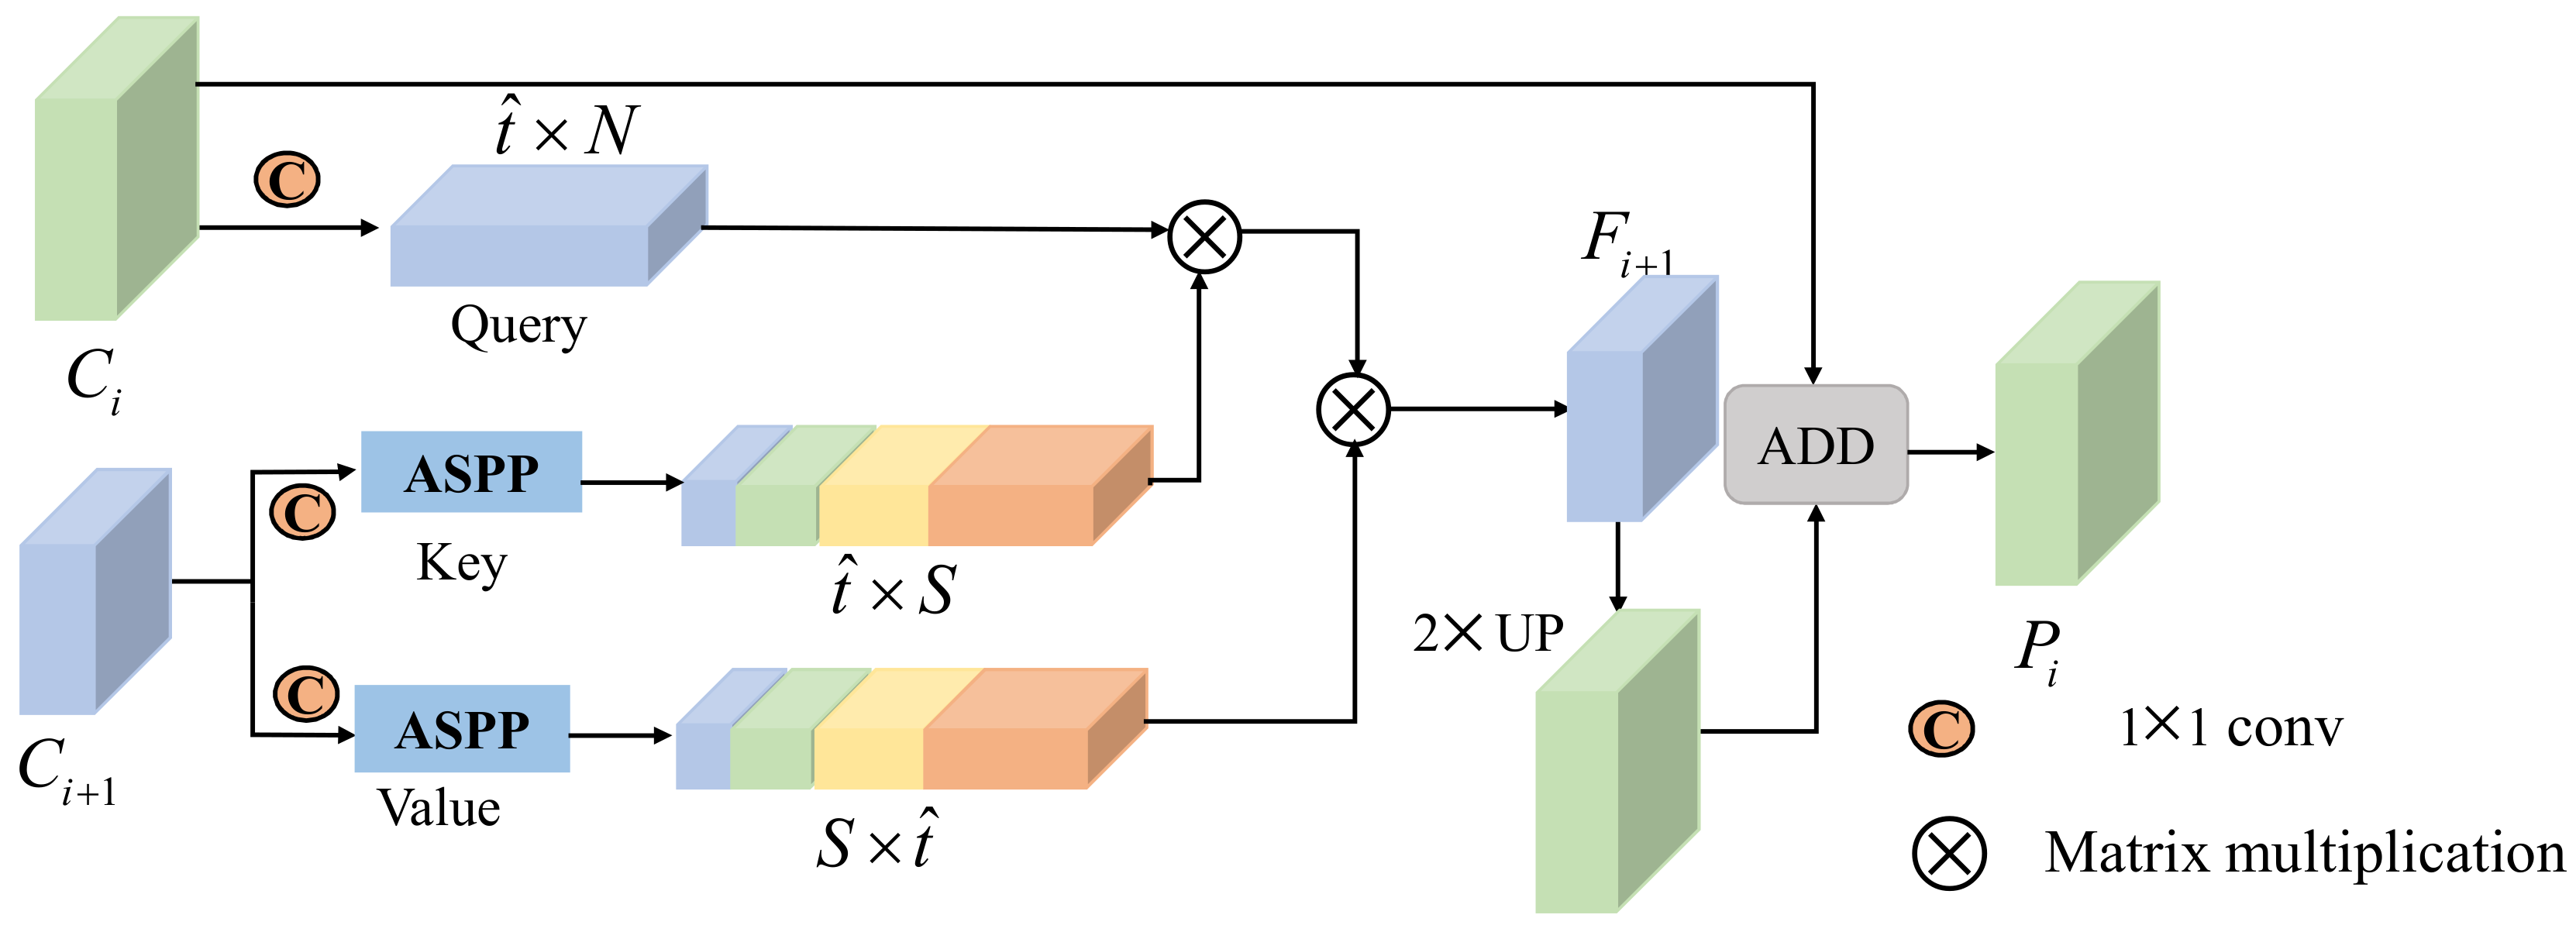
3.2. Cascade Refinement Paradigm

Horizontal bounding boxes are widely used to represent the detection results while rotatable bounding boxes fit well owing to the following reasons.
  • The representation of horizontal bounding boxes exhibits poor ability in accurately describing the real shapes of ships. When the aspect ratio of a target gets larger, the shape mismatch problem becomes more severe.
  • The detection results in the horizontal bounding box contain background pixels, whereas the rotatable one largely eliminates the background interference; therefore, it is easier to separate targets from a complex background.
  • When ships are densely packed, the areas of overlap between them will be quite large. However, the target with a large overlap region will be discarded by non-maximum suppression (NMS), which results in missing detection.
On the whole, the rotatable bounding box (RBox) is more suitable for anchor representation, generating more compact bounding boxes and reducing the missing detections. The arbitrary-oriented rectangle can be defined by five tuple coordinate ( x , y , w , h , θ ) , where ( x , y ) denotes the coordinates of its central point; w and h are the lengths of the long side of the box and the short side of the box, respectively. The orientation parameter θ , determining the rotation angle of RBox, is defined as the angle between w and the positive x-axis in radian system. A universal approach for achieving high coverage in one-stage detectors is to add multiple anchors with shapes and scales that vary as much as possible. Multi-orientation anchors are indispensable in a rotatable detection framework; however, the number of anchors increases with the diversity of preset angles, and the process of anchor generation usually requires a large amount of time. Besides, most rotated anchors fall into false candidates and further aggravate the foreground-background class imbalance problem in single-stage detectors.
As discovered by previous work [15], higher quality of localization can be guaranteed by gradually classifying and regressing boxes in multiple phases. This can be explained as learning and refining proposals step by step under increasing intersection-over-union (IoU) thresholds. Motivated by this, we intend to integrate the learning mechanism into single-stage detectors and propose an anchor refinement paradigm via cascade structure. Totally differently from cascade R-CNN, our method is devised on the basis of a region regression manner and composed of two forms of anchors. Specifically, horizontal anchors are used in the first stage for faster speed and higher recall rate, and the refined rotated anchors are applied in the refinement stages for better adaption to intensive scenarios. The two forms of anchors, in a cascading manner, are synthesized to leverage the merits of both and thus prove to boost the performance while maintaining a low computational cost.
The cascade structure in our detector consists of several phases and the number of phases can be selected flexibly. To adequately get anchors close to the corresponding ground truth, the matched anchors of the previous stage are taken as the inputs of the next stage to ensure higher quality, and thus form a coarse-to-fine framework in structure. As depicted in the dashed box of Figure 1, the detection head is denoted as H i k , where i and k indicate the feature level and the stage number respectively. Each detection head of ith feature level referred to as H i is assigned to each predictor for classification and bounding box regression. Similarly, B i k represents the regressed bounding box while B i 0 means the ground truth box of each object, and C i k corresponds to the classification results of the k t h stage (since we only regress the offset information of the bounding box in the first stage, k > 1 ).
During the training stage, positive and negative samples are selected from the prior RBoxes according to the IoU between ground truths and prior RBoxes. IoU is usually used for assigning samples for bounding boxes without rotation and we introduce angle-related IoU (ArIoU) for computing the overlap between two RBoxes. Given the oriented ground-truth box G and the rotated anchor A, the calculation of ArIoU can be expressed as follows:
A r I o U ( A , G ) = a r e a ( A * G ) a r e a ( A * G ) | c o s ( θ A θ G ) |
where θ A and θ G denote the angles of A and G. The angle information θ is kept in the range of [ 90 ° , 0 ) . A * is such a transitional rotated anchor which shares the location and size parameters of A. ⋂ and ⋃ mean the intersection and union of two RBoxes.
For the anchor matching step in the training stage, the assignment of a positive sample or negative sample depends on the following rules: first, we select the RBox with the largest IoU for each ground truth box as the positive example; then, the prior RBox whose ArIoU with any ground truths larger than the foreground IoU threshold preset in i t h stage T i is taken as the positive anchor. An rotated anchor will be regarded as the negative sample when the ArIoU with all ground truths is less than the background IoU threshold. In the testing stage, the detection network outputs the confidence score and corresponding location of the predicted RBoxes, which are first filtered by the confidence threshold and then processed by NMS to remove redundant predictions.

3.3. Box Regression and Classification Network

This paper focuses on the generation of rotated anchors to improve the location accuracy. Hence, we incorporate the angle estimation into the regression branch, which predicts the five tuple offset from the positive anchor to the nearby ground truth box. The detection head of each level of FPN is connected with the classification branch and the regression branch responsible for predicting categories and locations. Inherited from conventional RPN based detectors, we adopt the binary cross-entropy loss L b for scoring each initial anchor in the refined stages and the softmax cross-entropy loss L s to obtain the specific category score in the final stage. While computing the regression loss for the positive rotated anchors, it is necessary to convert the ground truth to the encoded location offset; meanwhile, they are utilized as the regression targets. Given the prior RBox A, the regressed target t * = ( t x * , t y * , t w * , t h * , t θ * ) can be denoted by:
t x * = ( G x A x ) / A w , t y * = ( G y A y ) / A h , t w * = l o g ( G w / A w ) , t h * = l o g ( G h / A h ) , t θ * = t a n ( G θ A θ )
where G i and A i denote the five-tuple coordinate i ( x , y , w , h , θ ) of ground truth box and prior RBox, respectively. The five-tuple parameterized offsets of the predicted box v = ( v x , v y , v w , v h , v θ ) are also calculated by this encoding scheme. The location loss L r e g can be formulated as
L r e g ( v , t * ) = m x , y , w , h , θ s m o o t h L 1 ( v m t m * )
s m o o t h L 1 ( x ) = 0.5 x 2 , i f | x | < 1 | x | 0.5 , e l s e
Based on the above definitions, the multi-task loss in the j t h stage can be defined as follows:
L j = λ 1 N j i = 1 N j l i L r e g ( v i , t i * ) + λ 2 N j i = 1 N j L c l s ( p i , l i ) .
where N j is the total number of samples in the jth stage, l i is the label of the ground truth which matches with ith anchor and p i gives the predicted probability distribution computed by the softmax function for the anchor i. l i is an indicator for matching the ith anchor to each ground truth box. l i = 1 when the anchor is a positive sample, else l i = 0 . The hyperparmeters λ 1 , λ 2 control the trade-off between two losses and are set to 1 by default.
In conjunction with the cascade scheme, our model can be trained in an end-to-end manner by minimizing the overall loss formulated as:
L t o t a l = s = 1 S λ s ( L r e g s + L c l s s )
where L r e g s is the regression loss at each stage s and L c l s s is the corresponding classification loss. In the following implementation, we set the stage-wise weight λ s as 1.

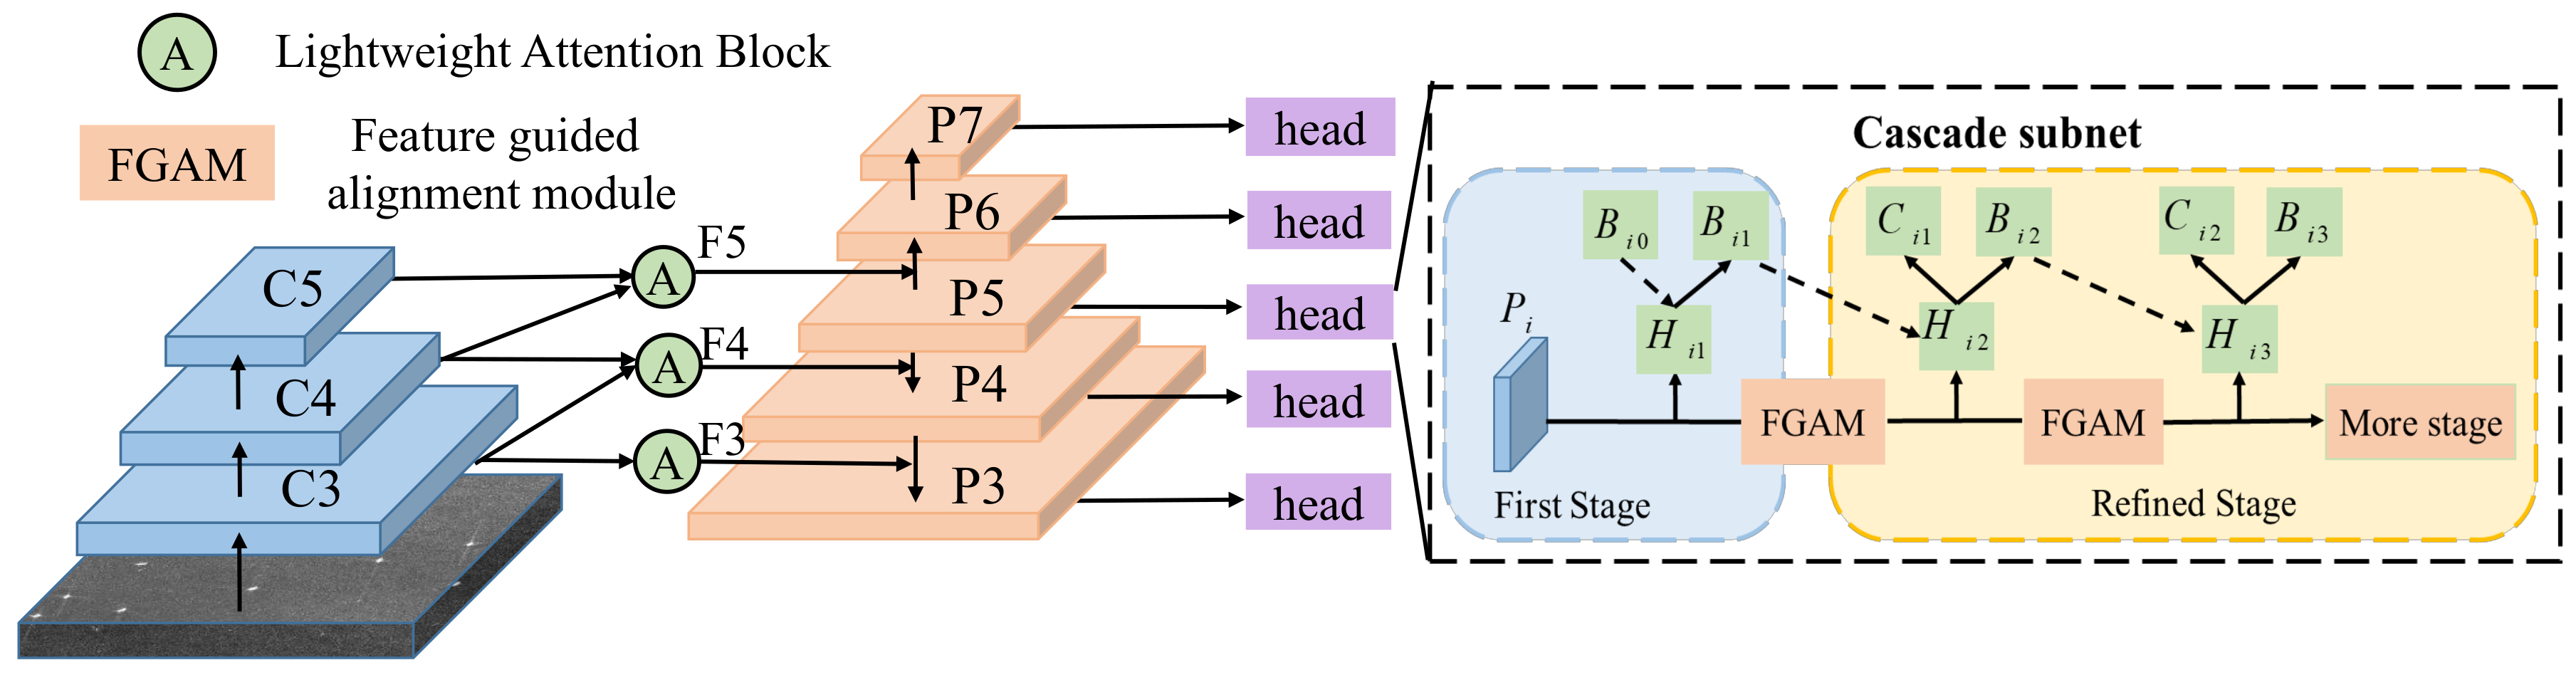
3.4. Feature Guided Alignment Module

In conventional RPN or single-stage based methods, anchor centers are well aligned with the feature map pixels, so convolutional features can truly reflect the anchor representations. Nevertheless, with the involvement of refinement stages, the distribution of refined anchors have changed significantly. While cascade RCNN relies on the RoI pooling operation for feature refinement, the recently proposed RefineDet in single-stage detectors is not well resolved in this aspect. Directly transferring the original features from the previous stage for multiple regression is sub-optimal and will result in the misalignment problem between regressed anchors and image features. To counter this problem, we introduce a feature guided alignment module (FGAM) to extract adapted features based on the predicted shapes of refined anchors.
The standard convolution samples each pixel by a regular grid, while deformable convolution [51,52] can expand the sampling region by imposing offsets upon the filter kernels. Following its enhanced capability of modeling geometric transformation, we are enlightened to resample the feature points in an adaptive way according to the new shapes of anchors passed into the next stage; thus, we better perceive the learning process of adjusted anchors (see Figure 3).
When the predefined anchors are refined stage by stage, the anchors are not uniformly distributed on the feature map; that is, the shapes and orientations of anchors vary across locations. The box regressions from the previous stage predict five-tuple output ( x , y , w , h , θ ) , where the former two ( x , y ) indicate the spatial offsets and the latter three ( w , h , θ ) indicate the scale and angle offsets. Here, we use the spatial and angle offsets learned from regression branch to estimate the kernel offsets s k and the modulated factor m k , which can be computed as,
s k = f 1 × 1 ( x i , y i ) m k = s i g m o i d ( f 1 × 1 ( θ i ) )
where f 1 × 1 denotes the convolution whose kernel size is 1 × 1 , s i g m o i d ( · ) is the activation layer. ( x i , y i ) and θ i denote the spatial and angle offsets predicted by the i t h stage in the cascade structure. Since the spatial, scale and angle offsets are decoupled and separately utilized, there are different combinations to construct the offset parameter used in the adaptive convolution. We have compared several implementations in the next section. Finally, the form in Equation (13) is employed for its effectiveness and efficiency.
Taking the original feature map from the previous stage P O as an example, the final aligned feature P A shown in the yellow rectangle of Figure 3 can be formulated as:
P A ( s 0 ) = s k R m s k · w ( s k ) · P O ( s 0 + s k + s k )
where s 0 denotes each spatial location in P A ; R means the sampling region ( 3 × 3 kernel size) of the input features. s k and m s k are the learnable offset and modulation scalar for the s k -th location, respectively.
In summary, the regressed offsets output from the previous stage are further used in the FGAM to refine not only the anchor locations but also the feature maps used for the next refinement stage. The adaptive convolution in FGAM plays a non-trivial role in the maintenance of aligning features.

4. Experiments and Discussions

This section reports in-depth experiments conducted under the proposed architecture. At first, the detailed information of two types of dataset and the experimental settings of our detector will be described. Then, the evaluation criteria are introduced. The next part contains a series of experiments and ablative analysis, which are set to explore each component of our proposed SAR ship detector. Finally, the comparison with other CNN-based state-of-the-art methods indicates the effectiveness and efficiency of the proposed method.

4.1. Data Set and Experiment Setup

For SAR ship detection, the SAR Ship Detection Dataset (SSDD) and GF-3 SAR Rotated Ship Detection Dataset (GF3RSDD) were collected to evaluate the performances of detectors. The ground truths in our experiments are identified and manually labeled with the aid of the corresponding scenes on Google Earth. Instead of using horizontal bounding box, a modified labeling method is adopted to label the actual length and width of the target and the angle relative to the x-axis as in [31]. The detailed information can be described as follows:

4.1.1. SSDD

This publicly available dataset [22] contains SAR images with different resolutions, polarization modes or sensor types, or under different sea conditions, scenarios and so on. Some detailed information about SSDD can be described in Table 1. As a benchmark dataset for researchers to evaluate their approaches, SSDD contains 1160 images and 2456 ship instances in total. The dataset is separated into a training, validation and test sets with the ratio of 7:2:1. The diverse sensor types, resolutions and polarizations ensure better generalization of the trained model. Furthermore, the images in SSDD cover a variety of scenarios, such as ships distributed inshore, offshore, inland (river) and in-harbor, which makes the dataset convincing when verifying the performance of our detector under complex backgrounds and with diversified target distributions.

4.1.2. GF3RSDD

GF-3 is a C-band SAR satellite which can work in multiple imaging modes and provide high-resolution images. In this paper, several large scene SAR images in typical scenes from China, Indonesia, Japan and Singapore were acquired from the GF-3 sensor, whose main information can be found in Table 1. Since all the images are single-look, complex images, they are first converted to an amplitude image and then transformed to the ground range image. Owing to the diverse background, from simple to particularly complex, and varying target distributions, from single to densely packed, GF3RSDD is suitable to confirm the effectiveness of our rotated ship detector. Given the restricted GPU memory, each large scene image with average size of 25,000 × 30,000 is cropped into several adjacent image blocks for both training and testing. In the training stage, we set the image block overlap with 300 pixels and remove the annotation of ships that are more than 50% cut off by the image block boundaries. Then, the image blocks without any shisp are discarded and the remaining image blocks of size 1024 × 1024 constitute the training dataset. In the testing stage, two large test images are divided into image blocks with the same size as the training chips and each pair of adjacent image blocks has a 15% overlap area. The overlap ratio is larger than that in the training stage to ensure that ships at the boundary area will not be ignored. Thereafter, each cropped patch is passed through the network individually to get the predicted offsets; then they are decoded and transformed to the real coordinates in the input large image. In order to analyze the detection results of densely arranged ships under inshore scenario, we crop a patch of specific area in Jiangsu, China, and Yokosuka, Japan for visualization and the detection results will be discussed in the next section.
Next, the implementation details and parameter optimization will be illustrated in the following four aspects.
(1)
Data Preprocessing
Due to the large size of the input image in GF3RSDD, training a SAR ship detector requires large amounts of memory and a small mini-batch size. To reduce the lengthy training time brought by large input size, we randomly crop 512 × 512 small image chips from the input image blocks for training. As the average image size in SSDD is smaller, we also fix the size of each input image chip containing the targets as 300 × 300 . For the training set of the above two datasets, data augmentation strategies such as horizontal and vertical flipping and random cropping, are utilized to increase the number of training sets and make our model more robust. Considering the particularity of SAR images, we duplicate the one-channel images into three channels, and thus enable the use of a pretrained model on the natural image dataset ImageNet. Unless otherwise specified, the default backbone network for the proposed SAR ship detector is ResNet-50.
(2)
Parameter Setting
Similarly to the architecture of RetinaNet, the corresponding anchor sizes are set as 32–512 at each feature pyramid level from P3 to P7. Considering various scales and shapes of ships, we design three scales { 2 0 , 2 1 / 3 , 2 2 / 3 } and seven aspect ratios { 1 , 1 / 2 , 2 , 1 / 3 , 3 , 2 / 3 , 3 / 2 } to { P 3 , P 4 , P 5 , P 6 , P 7 } , respectively. That is, there are k = 21 different anchors at each location of each pyramidal feature map for the prediction head. For comparison methods which totally rely on rotated anchors, the additional angle parameter is adopted and four angles { 90 ° , 60 ° , 45 ° , 30 ° } are chosen. In the first stage of our detector, we label the prior anchor as a positive one if IoU with the ground truth is over 0.5, and the anchor is labeled as a negative one if the IoU with the ground truth is lower than 0.4. When cascade structure is introduced in our model, different IoU thresholds are set in different stages and the IoU is calculated between RBoxes. In the first refinement stage, the IoU thresholds of foreground and background samples are set as 0.6 and 0.5, respectively. When multiple refinement stages are attached, the thresholds are 0.7 and 0.6.
(3)
Network Optimization
Our model is fine-tuned by using adaptive moment estimation (Adam) and the hyper-parameters are set as the default values. A total of 32 image chips per mini-batch are feed into the network for each iteration. In the beginning, we set the initial learning rate as 10 3 ; however, the outputs from the first stage are disordered and this makes the training process unstable. Thus, we first apply a warm up strategy which gradually ascends the learning rate from 5 × 10 6 to 10 3 . Then, we set total training iterations according to the amount of training dataset. For SSDD, the network is trained for 20 epochs with an initial learning rate of 0.001, which is decreased by 0.1 after 12 and 16 epochs respectively. For GF3RSDD, the total training epoch is set as 30 while the learning rate decays at 18 and 24 epochs.
All the experiments were implemented based on the deep learning framework PyTorch and executed on a PC with an Intel Single Core i7 CPU, NVIDIA GTX-1080Ti GPU with 11-GB video memory. The PC operating system was Ubuntu 16.04.
(4)
Post-Processing Step
When evaluating the performance of our detector on a large scene imagery, we first divide the image into several image blocks and then the detection results of each image block can be obtained. Following the order of division, we stitch them together by adding the upper-left corner’s coordinate of each image block. Since operating NMS directly on rotated detection results is more time-consuming than that on horizontal boxes, a NMS based on horizontal rectangles with a higher IOU threshold 0.5 is applied first; then the NMS of lower threshold 0.3 is executed on rotated boxes. After gathering the results on image blocks and performing a two-step NMS strategy, we get the final results on a large scene test image.

4.2. Evaluation Metrics

In this paper, the commonly used evaluation indicators average precision (AP), precision-recall curve (PRC) and F1 score are utilized to reflect the holistic performance of SAR ship detector. For single class object detection, mean AP is equal to AP, which can be defined by [53]:
A P = 0 1 p ( r ) d r
where recall denoted as r can be calculated as:
R e c a l l = T r u e p o s i t i v e T r u e p o s i t i v e + F a l s e n e g a t i v e
which measures the fraction of positive samples that are correctly identified. Precision denoted as p is defined as:
P r e c i s i o n = T r u e p o s i t i v e T r u e p o s i t i v e + F a l s e p o s i t i v e
which represents the ratio of true positives in all the detection results. AP is a comprehensive index and a larger value means a better performance of the detector. The PR curve reveals the relation between precision and recall, and the larger the area it covers, the better the detection result. F1 which combines the recall and precision metrics into a single measurement is formulated as:
F 1 = 2 precision recall precision + recall .

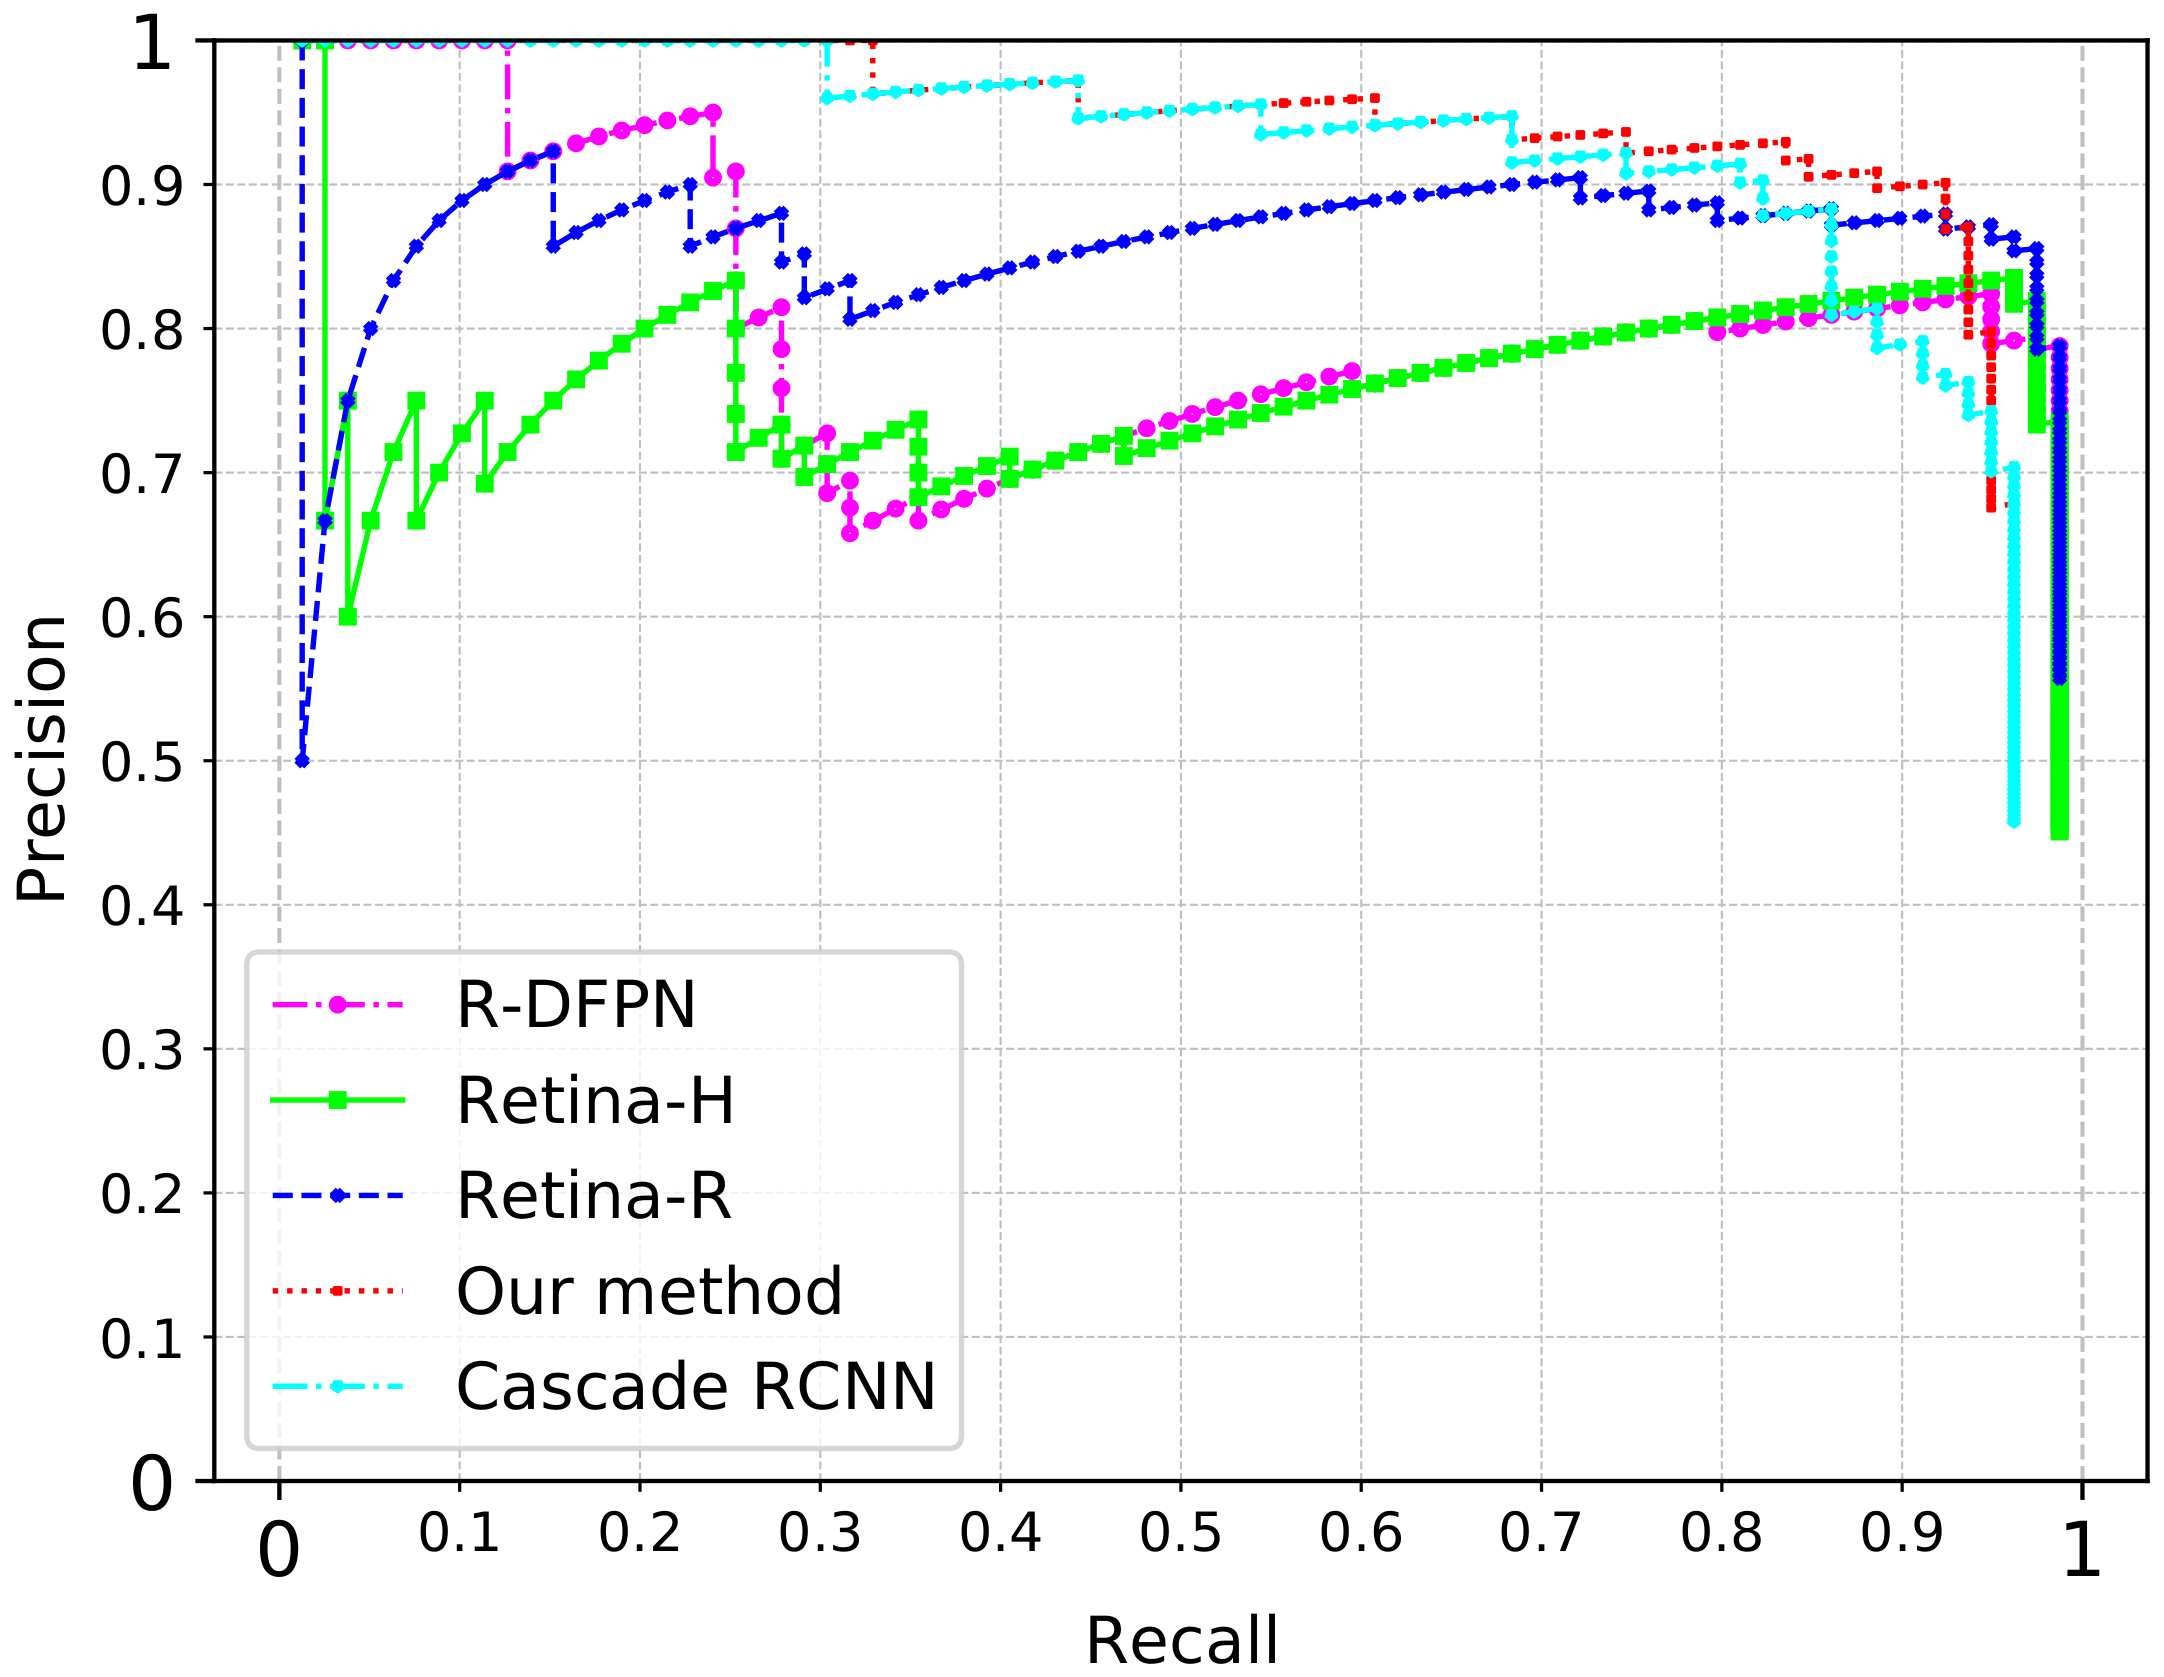
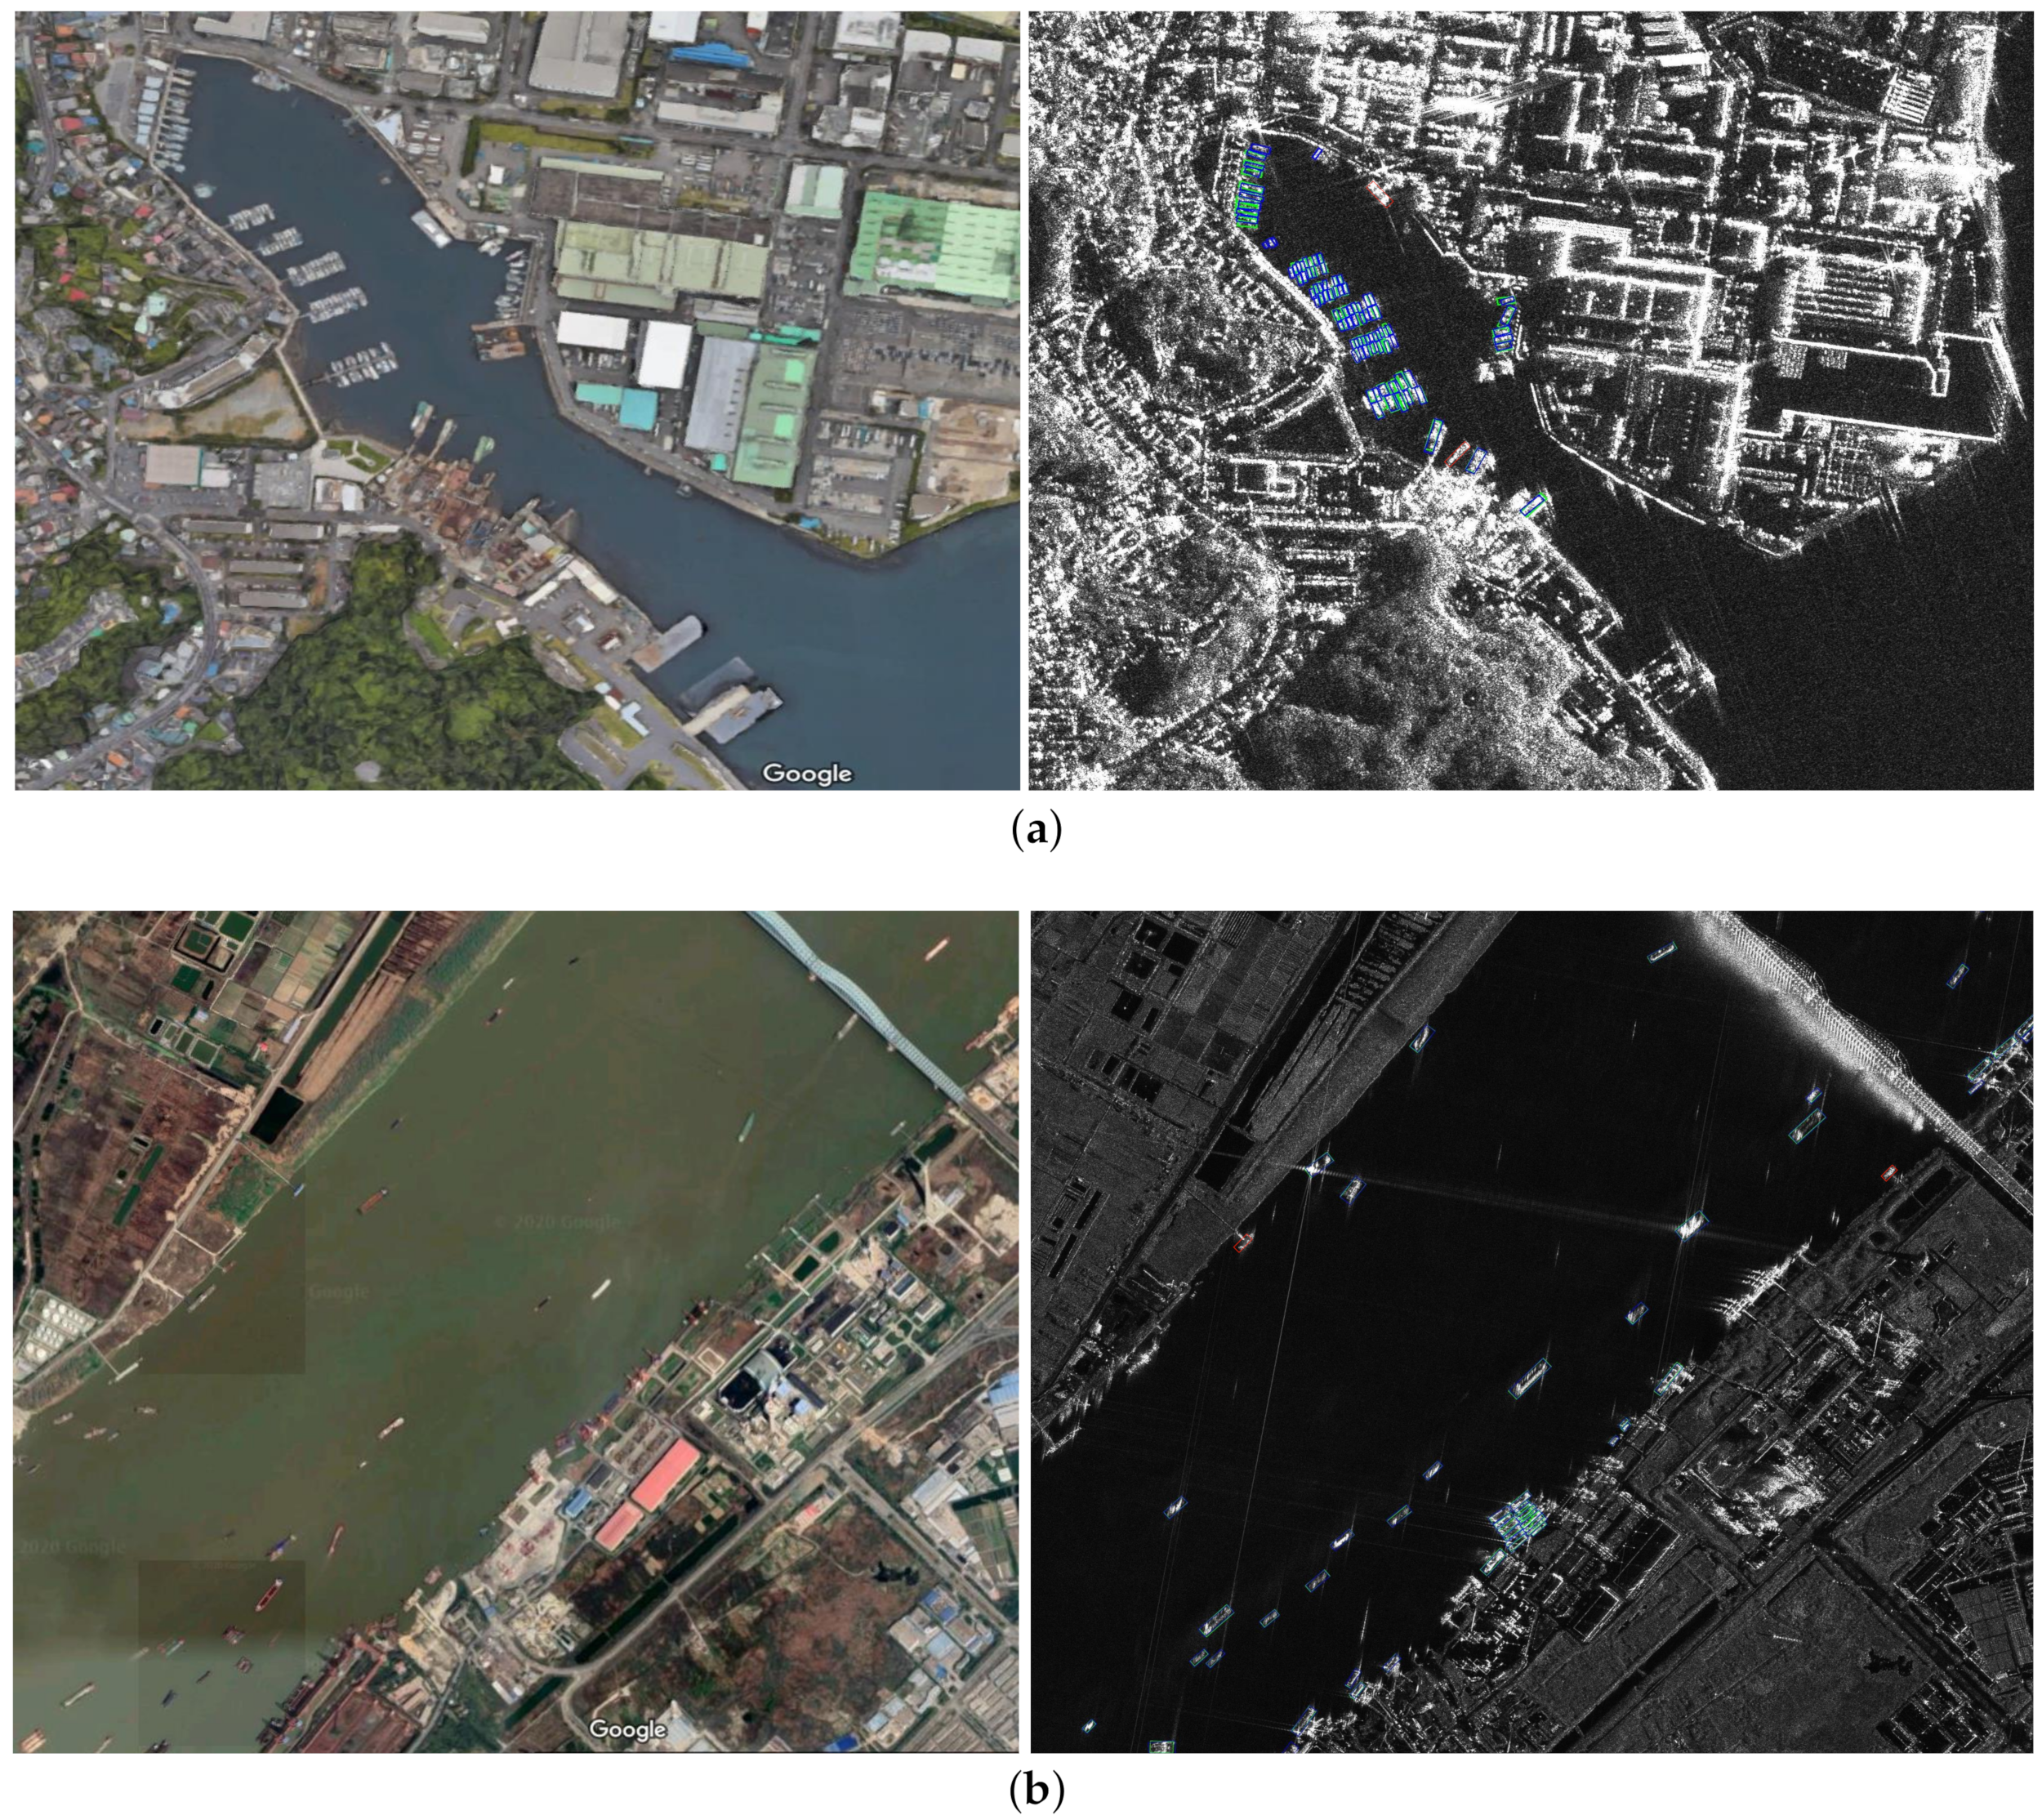
4.3. Qualitative and Quantitative Analyses of Results

To demonstrate the effectiveness of R 2 FA-Det, we perform a comprehensive component-wise analysis, in which different components are omitted. GF3RSDD is utilized to conduct ablation experiments and the chip detection results are mainly visualized with the assistance of SSDD. This part contains a series of experiments set to identify the contributions of AFPN, the effectiveness of two forms of anchors, the improved location accuracy gained by cascade structure and the substantial role of FGAM. Both qualitative and quantitative results are reported to verify the superiority of our method.
(1) Effect of AFPN: The attention mechanism originates from the visual mechanism of human beings and has found its application in the ship detection task [28,29]. Both of them refer to the attention module proposed in [54], whereas they share few similarities with the attention module in AFPN. The method in [28] adopts the attention module to each feature map separately while the attention block is embedded into FPN structure in [29]. However, the feature responses between all the locations in the image and the interaction of adjacent pyramidal feature levels in FPN are neglected. As a lightweight module, the attention mechanism in AFPN is embedded into the lateral connections between two adjacent feature levels. The baseline network is a ResNet-50 network with a FPN structure designed for rotated detection. By adding a convolutional block attention module (CBAM), an ordinary non-local block (NB) or an attention module [49] (referred as ANB) to each pyramidal feature level in the baseline model for comparison, the corresponding models can be represented as FPN-CBAM, FPN-NB and FPN-ANB, respectively. The comparison results under three methods are displayed in Figure 4.
In the complex scenario, the general FPN-based model has some false alarms and missed detections, corresponding to small islands or rocks similar to the ship and the ship distributed in the inland rivers. False alarms are partly eliminated when CBAM is adopted, but it still cannot distinguish the ships from each other in the inland region. Compared with this attention module which only takes into account of the separate pixels, AFPN improves performance for ship detection in the inshore scene since the features of targets are strengthened by capturing long-range dependencies between adjacent levels. Similarly to ANB, the proposed attention module also reduces spatial redundancy and computation cost, yet differently, a new sampling strategy (atrous spatial pyramid pooling) is constructed and responsible for long-range context aggregation.
The average precision and inference times under different attention mechanisms are displayed in Table 2. It can be justified that the efficiency of AFPN in testing a chip image can be boosted by double compared with FPN-NB. Since AFPN is designed in a lightweight manner, the increase of inference time is still acceptable. Compared with FPN-ANB, the inference time is only slightly increased. By constructing the attention module between adjacent feature levels, the AP is increased to 83.0% (up 6.6% compared with traditional FPN), which suggests that the long-range dependency modeling is effective in capturing the most discriminative regions. Benefiting from adaptively sampling rich context information in split and merge strategy, the proposed AFPN can achieve 1.1% accuracy gain in comparison with FPN-ANB. This demonstrates that the enhancement of semantic information is effective for distinguishing ships from complex background.
(2) Effect of regressed rotated anchors: From the perspective of anchor settings, we analyze the effects of two forms of anchors and their combination on the speed and accuracy of single-stage detector, and then a robust baseline for regression-based rotated detector is constructed on RetinaNet, as reported in Table 3 (The results in bold means the best result of corresponding index). The single-stage detection methods based on horizontal anchors and rotated anchors are denoted as Retina-H and Retina-R, respectively, which both output rotated detection results. Only anchors of one form (horizontal or rotated) are applied in Retina-H and Retina-R, while R 2 FA-Det utilizes both of them.
As shown from Figure 5, the results predicted by Retina-H tend to be accurate for targets distributed in the open region, while the performance degrades for densely clustered targets or those docked at ports. In contrast to HBoxes, the RBoxes in Retina-R are viable by adding the orientation parameter, which partly eases the missing detections and performs better in separating side-by-side ships from each other, as displayed in the third column of Figure 5. Although Retina-R achieves roughly 3% AP better than Retina-H, as listed in Table 3, the vast majority of RBoxes are burdensome for subsequent detection heads and further lead to the sacrificing of inference time. To enable an efficient detector, we first apply HBoxes to reduce the number of proposals and increase the object recall rate, and then use the refined RBoxes to overcome the obscure detection problem existing in dense scenes, as shown in the last column of Figure 5. In the end, the rotated detector with the combined representation of HBoxes and RBoxes achieves the inference speed of 51.2 ms and 82.93% AP; the former index is better than Retina-R and the latter one is better than Retina-H, as revealed in terms of speed and accuracy.
(3) Effect of cascade structure: As discussed above, our detector without further refinement spends less time but has restricted performance regarding accuracy. In this part, we introduce the cascade refinement scheme to promote the quality of regressed rotated anchors and this refinement with different stages serves the variety of the R 2 FA-Det head.
Since adding a refinement stage enjoys 1.4% absolute AP gain, we also consider attaching different numbers of refinement stages and keep all the settings the same except the stage number. The performance evaluation is assessed in Table 3, where the experimental results indicate that more than three-stage refinements will not bring extra improvements to the overall performance in terms of speed and accuracy. Three stages are enough to achieve the most accurate regression with marginal extra run-time compared with the model without any refinement stage. With successive increases in the number of refinement stages, a significant improvement of AP can be observed, which moves from 82.93% (no cascade) to 90.49% ( s = 3 ). We also compute the AP at increasing IoU thresholds to illustrate the impact of rotated anchor promotion on localization accuracy.
Figure 6 indicates that the overall accuracy is elevated particularly under higher IoU threshshold (>0.7) and the refined regression of RBox should have contributed to this considerably. Compared with the model without angle refinement (Retina-s0), the cascade refinement scheme brings the largest 10.8% gain under 0.7 threshold when applying two stages (Retina-s2). Although different stage numbers have different levels of impact on AP under different thresholds, the average improvement of AP under IoU range from 0.5 to 0.9 can be maximally boosted from 52.47% to 65.07% when three stages are involved.
To visually demonstrate the influence of cascade structure, a test chip reflecting the densely packed ships located inshore is selected as the example, as shown in Figure 7. With more refinement stages, the detection results become more discernible for adjacent targets and they are better matched to the actual shapes of the targets. These can be attributed to the coarse-to-fine framework which contains several cascade stages to refine the intermediate prediction results.
(4) Effect of FGAM: After demonstrating the impact of the cascade refinement scheme, we further move on to discuss, regarding mapping, the relationship between new shapes of refined anchors and the adapted feature points in FGAM. The ablation study in Table 3 reports the best results of 90.49% AP can be obtained when adding three stages to the detection head of each feature level, and the experimental analysis in this part is performed using the same settings for fair comparison.
To explore different ways of extracting aligned features, we devise three types of mapping mechanism in FGAM: ordinary convolution independent of kernel offsets, standard deformable convolution (DeformConv) with straightforward learned offsets, DeformConv with kernel offsets learned by the distribution of regressed anchors. For the last type, we also have different options of offset generation in feature alignment module. An observation from Table 4 is as follows. There is no evidence that the ordinary convolution has an influence on FGAM and the AP even decreases by 2.2%. For the standard DeformConv (second row), the offsets are learned by applying a convolutional layer directly on the features to be aligned and this exhibits a minor improvement of 0.7% AP compared with the traditional convolution. Different choices in the third type of mapping examine the impact of applying the regressed shape, scale and spatial information as offsets, as revealed in third row to eighth row in Table 4.
Experimental results indicate that only appending the scale offsets ( w , h ) shows deteriorated performance. When the spatial offsets ( x , y ) or both spatial and scale offsets ( x , y , w , h ) are incorporated to learn the kernel offsets, the AP increases by 1.8% and 0.3%, respectively. This is comprehensible because spatial information can better reflect the location change of feature points. So only the spatial offsets are introduced to estimate the kernel offsets when deform convolution is considered without modulation, which also serves as the counterpart of adaptive convolution. To make full use of the angle offset θ from refined anchors, we follow the addition of modulated scalar adopted in DeformConv and a distinct increase of AP (from 92.3% to 94.7%) can be recorded. To make an investigation about the most informative parameter extracted from regressed anchors, we also generate the modulated factor by width and height offsets for fair comparison. The adaptive convolution provides slight improvement (0.1% in width modulation and 0.2% height modulation) compared with the aid of angle offsets. The reason lies in that the shape information has almost achieved a relatively optimal point while the angle part can be more sensitive to feature adaptation. All these investigations suggest that the position offsets are most beneficial for FGAM to align features while the angle offsets can further boost the accuracy to some extent. Adding the FGAM improves the overall accuracy by 4.2% compared with the best result in Table 3, which verifies the necessity of including alignment operation in cascade structure.

4.4. Comparison with CNN-Based Methods

To verify the effectiveness of the proposed SAR ship detector, we compared our results with other state-of-the-art results using the two datasets. Categorized by the usage of region proposal network, two-stage methods such as improved faster RCNN [22] and densely connected multiscale neural network (DCMSNN) [24], and single-stage methods such as SSD [17], RetinaNet [18], YOLOv3 [21] and DAPN [29] are adopted for comparsion. According to the representation type of bounding boxes, the proposed method is compared with RBox-based approaches such as R 2 CNN [36], R-DFPN [40], RRPN [41], DRBox-v2 [31] abd attention-SSD [28]. Besides the average precision, the computational efficiency is of great importance in the real-time application of SAR ship detection. Thus, we also provide the running time for each method. Since in the test set of SSDD, only image chips are available, the running time (ms) is calculated on processing a image chip. When GF3RSSD is utilized for evaluation, we crop a representative region from a large scale SAR image as the test image, and the total inference time (s) reported here is comprised of cropping image blocks, detection on several image patches and post processing time in total.
(1) Experiments on SSDD: In this part, a variety of influential detection algorithms are compared with the proposed one and we demonstrate the results according to the type of detector (number of stages) and the representation of bounding box (HBox or RBox) as exhibited in Table 5.
In contrast with methods for the HBoxes, the models using the rotated representation exhibit higher accuracy, which verifies the superiority of rotated methods in the SAR ship detection task. However, although some two-stage methods such as R 2 CNN, R-DFPN and RRPN based on faster R-CNN show higher AP, the detection efficiency is pretty low compared with those one-stage-based rotated detectors. In this paper, our detector enjoys both the merits of rotated representation and the speed advantage of one-stage framework. The testing time of a chip image is 63.2 ms, which is 4× times faster than RRPN and 6× times faster than cascade RCNN with rotated boxes. Although DRBox-v2 occupies an important place in the one-stage detector, R 2 FA-Det still improves the AP by 1.91% while the inference time is only slightly increased by multi-stage refinement.
(2) Experiments on GF3RSDD: To further verify the effectiveness of our model, experiments on GF3RSDD are also conducted by evaluating on a typical region of size 8432 × 7451. The PRCs of some representative methods are shown in Figure 8. From the perspective of anchor design, Retina-R shows better adaptation than Retina-H, which is ineffective in predicting the actual shape of targets. Apparently, our method surpasses the best two-stage rotated method R-DFPN by a large margin due to its distinctive anchor design and multi-stage angle refinement. When the rotated anchors are referred in the most outstanding detector cascade RCNN (which can be interpreted as RPN based model with cascade structure), R 2 FA-Det still beats it in accuracy, as seen from the red curve.
The GF3RSDD contains ship instances with arbitrary orientations and multiple aspect ratios in a crowded scenario, which is technically demanding when achieving accurate positions. Turning now to the holistic detection performance over large-scale SAR images, we display visualized results of our method on two cropped test images as shown in Figure 9. The left part denotes the optical image and the right part represents the detection results in SAR images. Note that the positions of targets are inconsistent under different imaging times, so the optical images only approximately reflect the ships in a specific detection area. The green boxes denote predicted results, the blue boxes denote ground truths and the red boxes denote false alarms. In the inland rivers, most of the ships moored closely can be detected with clear boundary. Even when multiple targets with large aspect ratios are densely clustered near shore (seen from Figure 9a), only a minor number of missing targets appear and sporadic targets with high brightness are taken as ships. Some false alarms like cranes (similar to ships) have been detected in Figure 9b, and we will further study how to remove those false alarms.

5. Conclusions

In this paper, a novel detector for SAR ship targets called R 2 FA-Det is proposed as a robust and accurate end-to-end framework. Firstly, the attention-strengthened FPN can significantly alleviate cluttered background interference and highlight the features from the object region. Secondly, we elaborately renovate the anchor representation in typical horizontal anchor-based methods, and the combination of horizontal anchors and rotated anchors performs well under dense scenes with less computational burden. Furthermore, the cascade refinement structure is adopted in single-stage based detectors, which can remarkably improve the prediction accuracy of target positions, especially under a higher IoU evaluation metric. Finally, the feature guided alignment module is adopted to reassign feature points to the learned anchors, leading to a more optimal regression part of cascade structure in our detector. On the whole, R 2 FA-Det not only challenges the limitation of accuracy on rotated one-stage methods, but also streamlines the designation of anchors by regression offset learning mechanism, thereby outperforming recent state-of-the-art methods. For different sources of SAR images, the distribution mismatch between source domain and target domain will lead to performance degradation. Hence, the transferability of our detector to other sources of SAR data will be considered by domain adaption methods in the future work. Additionally, considering the laborious work in generating labels, training with limited labeled SAR data in a semi-supervised way is also worthy of being investigated.

Author Contributions

S.C. proposed the idea, wrote the manuscript, designed the method pipeline and implemented the validation. R.Z. collected experimental data and helped with validation. J.Z. solved problems in the software and helped with validation and visualization. All authors have read and agreed to the published version of the manuscript.

Funding

This work was supported in part by the National Natural Science Foundation of China under grants 61471370 and 61401479.

Acknowledgments

The authors would like to thank the teachers and students in the Science and Technology on Automatic Target Recognition Laboratory, and the National University of Defense Technology, for their work of dataset collection and assistance of experiments. The authors would also like to thank the anonymous reviewers for their helpful comments and suggestions to improve the manuscript.

Conflicts of Interest

The authors declare no conflict of interest.

References

  1. Wang, J.; Sun, L. Study on Ship Target Detection and Recognition in SAR imagery. In Proceedings of the International Conference on Information Science & Engineering, Nanjing, China, 26–28 December 2009. [Google Scholar]
  2. Wei, X.; Wang, X.; Chong, J. Local region power spectrum-based unfocused ship detection method in synthetic aperture radar images. J. Appl. Remote Sens. 2018, 12, 016026. [Google Scholar] [CrossRef] [Green Version]
  3. Zhu, J.; Qiu, X.; Pan, Z.; Zhang, Y.; Lei, B. Projection Shape Template-Based Ship Target Recognition in TerraSAR-X Images. IEEE Geosci. Remote. Sens. Lett. 2017, 14, 222–226. [Google Scholar] [CrossRef]
  4. Tello, M.; López-Martínez, C.; Mallorqui, J.J. A novel algorithm for ship detection in SAR imagery based on the wavelet transform. IEEE Geosci. Remote Sens. Lett. 2005, 2, 201–205. [Google Scholar] [CrossRef]
  5. Shi, H.; Zhang, Q.; Bian, M.; Wang, H.; Wang, Z.; Chen, L.; Yang, J. A novel ship detection method based on gradient and integral feature for single-polarization synthetic aperture radar imagery. Sensors 2018, 18, 563. [Google Scholar] [CrossRef] [Green Version]
  6. Zhai, L.; Li, Y.; Su, Y. Inshore ship detection via saliency and context information in high-resolution SAR images. IEEE Geosci. Remote Sens. Lett. 2016, 13, 1870–1874. [Google Scholar] [CrossRef]
  7. Wang, X.; Chen, C. Ship detection for complex background SAR images based on a multiscale variance weighted image entropy method. IEEE Geosci. Remote Sens. Lett. 2016, 14, 184–187. [Google Scholar] [CrossRef]
  8. Diao, W.; Sun, X.; Zheng, X.; Dou, F.; Wang, H.; Fu, K. Efficient saliency-based object detection in remote sensing images using deep belief networks. IEEE Geosci. Remote Sens. Lett. 2016, 13, 137–141. [Google Scholar] [CrossRef]
  9. Yeremy, M.; Campbell, J.; Mattar, K.; Potter, T. Ocean surveillance with polarimetric SAR. Can. J. Remote Sens. 2001, 27, 328–344. [Google Scholar] [CrossRef]
  10. Touzi, R.; Charbonneau, F. Characterization of target symmetric scattering using polarimetric SARs. IEEE Trans. Geosci. Remote Sens. 2002, 40, 2507–2516. [Google Scholar] [CrossRef]
  11. Girshick, R.; Donahue, J.; Darrell, T.; Malik, J. Region-based convolutional networks for accurate object detection and segmentation. IEEE Trans. Pattern Anal. Mach. Intell. 2016, 38, 142–158. [Google Scholar] [CrossRef] [PubMed]
  12. Ren, S.; He, K.; Girshick, R.; Sun, J. Faster R-CNN: Towards Real-Time Object Detection with Region Proposal Networks. In Advances in Neural Information Processing Systems; MIT Press: Cambridge, MA, USA, 2015; pp. 91–99. [Google Scholar]
  13. Lin, T.Y.; Dollar, P.; Girshick, R.; He, K.; Hariharan, B.; Belongie, S. Feature Pyramid Networks for Object Detection. In Proceedings of the IEEE Conference on Computer Vision and Pattern Recognition, Honolulu, HI, USA, 21–26 July 2017; pp. 936–944. [Google Scholar]
  14. Dai, J.; Li, Y.; He, K.; Sun, J. R-FCN: Object detection via region-based fully convolutional networks. In Proceedings of the International Conference on Neural Information Processing System, Barcelona, Spain, 5–10 December 2016; pp. 379–387. [Google Scholar]
  15. Cai, Z.; Vasconcelos, N. Cascade R-CNN: Delving Into High Quality Object Detection. In Proceedings of the IEEE Conference on Computer Vision and Pattern Recognition, Salt Lake City, UT, USA, 18–23 June 2018; pp. 6154–6162. [Google Scholar]
  16. He, K.; Gkioxari, G.; Dollár, P.; Girshick, R. Mask R-CNN. In Proceedings of the IEEE Conference on Computer Vision and Pattern Recognition, Venice, Italy, 22–29 October 2017; pp. 2961–2969. [Google Scholar]
  17. Liu, W.; Anguelov, D.; Erhan, D.; Szegedy, C.; Reed, S.; Fu, C.Y.; Berg, A.C. SSD: Single Shot MultiBox Detector. In Proceedings of the European Conference on Computer Vision, Amsterdam, The Netherlands, 8–16 October 2016; Springer: Cham, Switzerland, 2016; pp. 21–37. [Google Scholar]
  18. Lin, T.Y.; Goyal, P.; Girshick, R.; He, K.; Dollár, P. Focal loss for dense object detection. In Proceedings of the IEEE International Conference on Computer Vision, Venice, Italy, 22–29 October 2017; pp. 2980–2988. [Google Scholar]
  19. Redmon, J.; Divvala, S.; Girshick, R.; Farhadi, A. You Only Look Once: Unified, real-time object detection. In Proceedings of the IEEE Conference on Computer Vision and Pattern Recognition, Las Vegas, NV, USA, 27–30 June 2016; pp. 779–788. [Google Scholar]
  20. Redmon, J.; Farhadi, A. YOLO9000: Better, faster, stronger. In Proceedings of the IEEE Conference on Computer Vision and Pattern Recognition, Honolulu, HI, USA, 21–26 July 2017; pp. 7263–7271. [Google Scholar]
  21. Redmon, J.; Farhadi, A. Yolov3: An incremental improvement. arXiv 2018, arXiv:1804.02767. [Google Scholar]
  22. Li, J.; Qu, C.; Shao, J. Ship detection in SAR images based on an improved faster R-CNN. In Proceedings of the BIGSARDATA, Beijing, China, 13–14 November 2017; pp. 1–6. [Google Scholar]
  23. Kang, M.; Ji, K.; Leng, X.; Lin, Z. Contextual Region-Based Convolutional Neural Network with Multilayer Fusion for SAR Ship Detection. Remote Sens. 2017, 9, 860. [Google Scholar] [CrossRef] [Green Version]
  24. Jiao, J.; Zhang, Y.; Sun, H.; Yang, X.; Gao, X.; Hong, W.; Fu, K.; Sun, X. A densely connected end-to-end neural network for multiscale and multiscene SAR ship detection. IEEE Access 2018, 6, 20881–20892. [Google Scholar] [CrossRef]
  25. Zhao, J.; Zhang, Z.; Yu, W.; Truong, T.K. A cascade coupled convolutional neural network guided visual attention method for ship detection from SAR images. IEEE Access 2018, 6, 50693–50708. [Google Scholar] [CrossRef]
  26. Wang, Y.; Wang, C.; Zhang, H.; Dong, Y.; Wei, S. Automatic ship detection based on retinanet using multi-resolution gaofen-3 imagery. Remote Sens. 2019, 11, 531. [Google Scholar] [CrossRef] [Green Version]
  27. Chang, Y.L.; Anagaw, A.; Chang, L.; Wang, Y.C.; Hsiao, C.Y.; Lee, W.H. Ship detection based on YOLOv2 for SAR imagery. Remote Sens. 2019, 11, 786. [Google Scholar] [CrossRef] [Green Version]
  28. Wang, J.; Lu, C.; Jiang, W. Simultaneous ship detection and orientation estimation in SAR images based on attention module and angle regression. Sensors 2018, 18, 2851. [Google Scholar] [CrossRef] [Green Version]
  29. Cui, Z.; Li, Q.; Cao, Z.; Liu, N. Dense Attention Pyramid Networks for Multi-Scale Ship Detection in SAR Images. IEEE Trans. Geosci. Remote Sens. 2019, 57, 8983–8997. [Google Scholar] [CrossRef]
  30. Liu, L.; Pan, Z.; Lei, B. Learning a rotation invariant detector with rotatable bounding box. arXiv 2017, arXiv:1711.09405. [Google Scholar]
  31. An, Q.; Pan, Z.; Lei, L.; You, H. DRBox-v2: An Improved Detector With Rotatable Boxes for Target Detection in SAR Images. IEEE Trans. Geosci. Remote Sens. 2019, 57, 8333–8349. [Google Scholar] [CrossRef]
  32. Pan, Z.; Yang, R.; Zhang, Z. MSR2N: Multi-Stage Rotational Region Based Network for Arbitrary-Oriented Ship Detection in SAR Images. Sensors 2020, 20, 2340. [Google Scholar] [CrossRef] [PubMed] [Green Version]
  33. Chen, C.; He, C.; Hu, C.; Pei, H.; Jiao, L. MSARN: A Deep Neural Network Based on an Adaptive Recalibration Mechanism for Multiscale and Arbitrary-oriented SAR Ship Detection. IEEE Access 2019, 7, 159262–159283. [Google Scholar] [CrossRef]
  34. Zhang, S.; Wen, L.; Bian, X.; Lei, Z.; Li, S.Z. Single-shot refinement neural network for object detection. In Proceedings of the IEEE Conference on Computer Vision and Pattern Recognition, Salt Lake City, UT, USA, 18–23 June 2018; pp. 4203–4212. [Google Scholar]
  35. Deng, Z.; Sun, H.; Zhou, S.; Zhao, J. Learning deep ship detector in SAR images from scratch. IEEE Trans. Geosci. Remote Sens. 2019, 57, 4021–4039. [Google Scholar] [CrossRef]
  36. Jiang, Y.; Zhu, X.; Wang, X.; Yang, S.; Li, W.; Wang, H.; Fu, P.; Luo, Z. R2CNN: Rotational region cnn for orientation robust scene text detection. arXiv 2017, arXiv:1706.09579. [Google Scholar]
  37. Liu, Z.; Hu, J.; Weng, L.; Yang, Y. Rotated region based CNN for ship detection. In Proceedings of the 2017 IEEE International Conference on Image Processing (ICIP), Beijing, China, 17–20 September 2017; pp. 900–904. [Google Scholar]
  38. Li, M.; Guo, W.; Zhang, Z.; Yu, W.; Zhang, T. Rotated region based fully convolutional network for ship detection. In Proceedings of the IGARSS 2018-2018 IEEE International Geoscience and Remote Sensing Symposium, Valencia, Spain, 22–27 July 2018; pp. 673–676. [Google Scholar]
  39. Zhang, Z.; Guo, W.; Zhu, S.; Yu, W. Toward Arbitrary-Oriented Ship Detection With Rotated Region Proposal and Discrimination Networks. IEEE Geosci. Remote Sens. Lett. 2018, 15, 1745–1749. [Google Scholar] [CrossRef]
  40. Yang, X.; Sun, H.; Fu, K.; Yang, J.; Sun, X.; Yan, M.; Guo, Z. Automatic ship detection in remote sensing images from google earth of complex scenes based on multiscale rotation dense feature pyramid networks. Remote Sens. 2018, 10, 132. [Google Scholar] [CrossRef] [Green Version]
  41. Ma, J.; Shao, W.; Ye, H.; Wang, L.; Wang, H.; Zheng, Y.; Xue, X. Arbitrary-oriented scene text detection via rotation proposals. IEEE Trans. Multimedia 2018, 20, 3111–3122. [Google Scholar] [CrossRef] [Green Version]
  42. Xiao, X.; Zhou, Z.; Wang, B.; Li, L.; Miao, L. Ship Detection under Complex Backgrounds Based on Accurate Rotated Anchor Boxes from Paired Semantic Segmentation. Remote Sens. 2019, 11, 2506. [Google Scholar] [CrossRef] [Green Version]
  43. Zhang, G.; Lu, S.; Zhang, W. CAD-Net: A Context-Aware Detection Network for Objects in Remote Sensing Imagery. IEEE Trans. Geosci. Remote Sens. 2019, 57, 10015–10024. [Google Scholar] [CrossRef] [Green Version]
  44. Ding, J.; Xue, N.; Long, Y.; Xia, G.S.; Lu, Q. Learning RoI Transformer for Oriented Object Detection in Aerial Images. In Proceedings of the IEEE International Conference on Computer Vision and Pattern Recognition, Long Beach, CA, USA, 16–20 June 2019; pp. 2849–2858. [Google Scholar]
  45. Yang, X.; Yang, J.; Yan, J.; Zhang, Y.; Zhang, T.; Guo, Z.; Sun, X.; Fu, K. SCRDet: Towards more robust detection for small, cluttered and rotated objects. In Proceedings of the IEEE International Conference on Computer Vision, Seoul, Korea, 27 October–2 November 2019; pp. 8232–8241. [Google Scholar]
  46. Wang, X.; Girshick, R.; Gupta, A.; He, K. Non-local neural networks. In Proceedings of the IEEE Conference on Computer Vision and Pattern Recognition, Salt Lake City, UT, USA, 18–23 June 2018; pp. 7794–7803. [Google Scholar]
  47. Fu, J.; Liu, J.; Tian, H.; Li, Y.; Bao, Y.; Fang, Z.; Lu, H. Dual attention network for scene segmentation. In Proceedings of the IEEE Conference on Computer Vision and Pattern Recognition, Long Beach, CA, USA, 16–20 June 2019; pp. 3146–3154. [Google Scholar]
  48. Huang, Z.; Wang, X.; Huang, L.; Huang, C.; Wei, Y.; Liu, W. CCNet: Criss-Cross Attention for Semantic Segmentation. In Proceedings of the IEEE International Conference on Computer Vision, Seoul, Korea, 27 October–2 November 2019; pp. 603–612. [Google Scholar]
  49. Zhu, Z.; Xu, M.; Bai, S.; Huang, T.; Bai, X. Asymmetric Non-local Neural Networks for Semantic Segmentation. In Proceedings of the IEEE International Conference on Computer Vision, Seoul, Korea, 27 October–2 November 2019; pp. 593–602. [Google Scholar]
  50. He, K.; Zhang, X.; Ren, S.; Sun, J. Deep residual learning for image recognition. In Proceedings of the IEEE Conference on Computer Vision and Pattern Recognition, Las Vegas, NV, USA, 27–30 June 2016; pp. 770–778. [Google Scholar]
  51. Dai, J.; Qi, H.; Xiong, Y.; Li, Y.; Zhang, G.; Hu, H.; Wei, Y. Deformable convolutional networks. In Proceedings of the IEEE Conference on Computer Vision and Pattern Recognition, Venice, Italy, 22–29 October 2017; pp. 764–773. [Google Scholar]
  52. Zhu, X.; Hu, H.; Lin, S.; Dai, J. Deformable ConvNets V2: More Deformable, Better Results. In Proceedings of the IEEE Conference on Computer Vision and Pattern Recognition, Long Beach, CA, USA, 16–20 June 2019; pp. 9308–9316. [Google Scholar]
  53. Everingham, M.; Gool, L.V.; Williams, C.K.I.; Winn, J.; Zisserman, A. The Pascal Visual Object Classes (VOC) Challenge. Int. J. Comput. Vis. 2010, 88, 303–338. [Google Scholar] [CrossRef] [Green Version]
  54. Woo, S.; Park, J.; Lee, J.Y.; So Kweon, I. CBAM: Convolutional block attention module. In Proceedings of the European conference on computer vision (ECCV), Munich, Germany, 8–14 September 2018; pp. 3–19. [Google Scholar]
Figure 1. Structure of the R 2 FA-Det which consists of a backbone network, an attention-strengthened FPN design and a cascade detection head. C3, C4 and C5 denote the feature maps of the backbone network; P3, P4, P5, P6 and P7 represent the boosted feature maps adopted in the cascade subnet, which use the fusion feature to predict the labels and the bounding boxes.
Remotesensing 12 02031 g001
Figure 2. Structure of the lightweight attention block (LAB). ASPP represents the atrous spatial pyramid pooling which reduces the complexity of non-local matrix multiplication. ADD means the summation between the original feature map and the strengthened one. UP denotes upsampling the higher level feature map.
Remotesensing 12 02031 g002
Figure 3. Adapted convolution adjusts the feature points to the refined anchors.
Remotesensing 12 02031 g003
Figure 4. Comparison of ground truths and detection results under different methods on SSDD test chip images. (a) Ground truths. (bd) Results of FPN, FPN-CBAM and AFPN, respectively.
Remotesensing 12 02031 g004
Figure 5. Comparison of ground truths and detection results under different types of anchors on SSDD test images. (a) Ground truths. (bd) Results of Retina-H, Retina-R and R 2 FA-Det, respectively.
Remotesensing 12 02031 g005
Figure 6. Comparison of AP results across IoU thresholds from 0.5 to 0.95 based on different anchor representations and different refinement stages.
Remotesensing 12 02031 g006
Figure 7. Visualization of ground truths and detection results under different number of stages on a test chip image. (a) Ground truths. (bf) Results of models with refinement stage increases from 0 to 4.
Remotesensing 12 02031 g007
Figure 8. Comparison of precision–recall curves on GF3RSDD from different methods.
Remotesensing 12 02031 g008
Figure 9. Ship detection results with the proposed approach for two large images from GF3RSDD. (a) An image with a size of 3200 × 2400 in port of Yokosuka, Japan under HH polarization. (b) An image with larger area of 8000 × 7000 in the Yangtze River, in Jiangsu, China.
Remotesensing 12 02031 g009
Table 1. Number and imaging information of SSDD and GF3RSDD.
SatelliteWavebandImaging ModePolarizationResolutionPositionAve SizeNumber of Images
GF3CSpotlight ModeHH1 mChina, Indonesia, Japan, Singapore25,000 × 30,0008
Sentinel-1 RadarSat-2 TerraSAR-XC, XInterferometric wide swath Mode, Spotlight Mode, Strip ModeHH, VV, HV, VH1 m–15 mYantai, China, Visakhapatnam, India 481 × 331 1160
Table 2. Performance comparison when different types attention module embedded in FPN.
Model NameAttention TypeAPInference Time (ms)
FPNNone76.470.7
FPN-CBAMchannel + spatial80.278.9
FPN-NBnon local81.3136.5
FPN-ANBasymmetric non local82.170.3
AFPNlightweight non local83.072.2
Table 3. Ablation study using the proposed strategy.
MethodAFPNHBoxRBoxRefine StageAPF1Time (ms)
Retina-H 75.1276.8748.8
79.6877.0450.3
Retina-R 76.4279.5370.7
83.0480.2372.2
R 2 FA-Det-82.9382.2851.2
s = 1 84.2983.6455.3
s = 2 87.5485.5259.6
s = 3 90.4987.9463.2
s = 4 89.0588.2168.5
Table 4. Performance comparison when different types of offsets generation are applied in convolution operator of FGAM.
Conv TypeOffset GenerationModulate FactorAP
Conventional Convolution88.2
Deformable Convolutionlearned directly88.9
( w , h )86.6
( x , y , w , h )90.8
( x , y )92.3
Adaptive Convolution( x , y ) w 92.4
( x , y ) h 92.5
( x , y ) θ 94.7
Table 5. Speed and accuracy comparison among different methods on SSDD.
Detection MethodModel TypeBounding BoxAP (%)Inference Time (ms)
Faster RCNNtwo stageshorizontal70.4973.2
Improved Faster RCNNtwo stageshorizontal78.3185.4
DCMSNNtwo stageshorizontal89.3294.5
SSDone stagehorizontal70.5828.3
RetinaNetone stagehorizontal75.3548.8
YOLOv3one stagehorizontal71.9227.6
DAPNone stagehorizontal89.8041.3
R 2 CNNtwo stagesrotated82.16152.7
R-DFPNtwo stagesrotated83.45298.8
RRPNtwo stagesrotated75.93259.3
Cascade RCNNmulti stagesrotated88.45357.6
RetinaNetone stagerotated76.3870.7
DRBox-v2one stagerotated92.8155.1
Attention-SSDone stagerotated84.2043.6
R 2 FA-Detmulti stagesrotated94.7263.2

