Remotely Sensed Urban Surface Ecological Index (RSUSEI): An Analytical Framework for Assessing the Surface Ecological Status in Urban Environments

 ,
,  , and
, and 
Abstract
:
1. Introduction
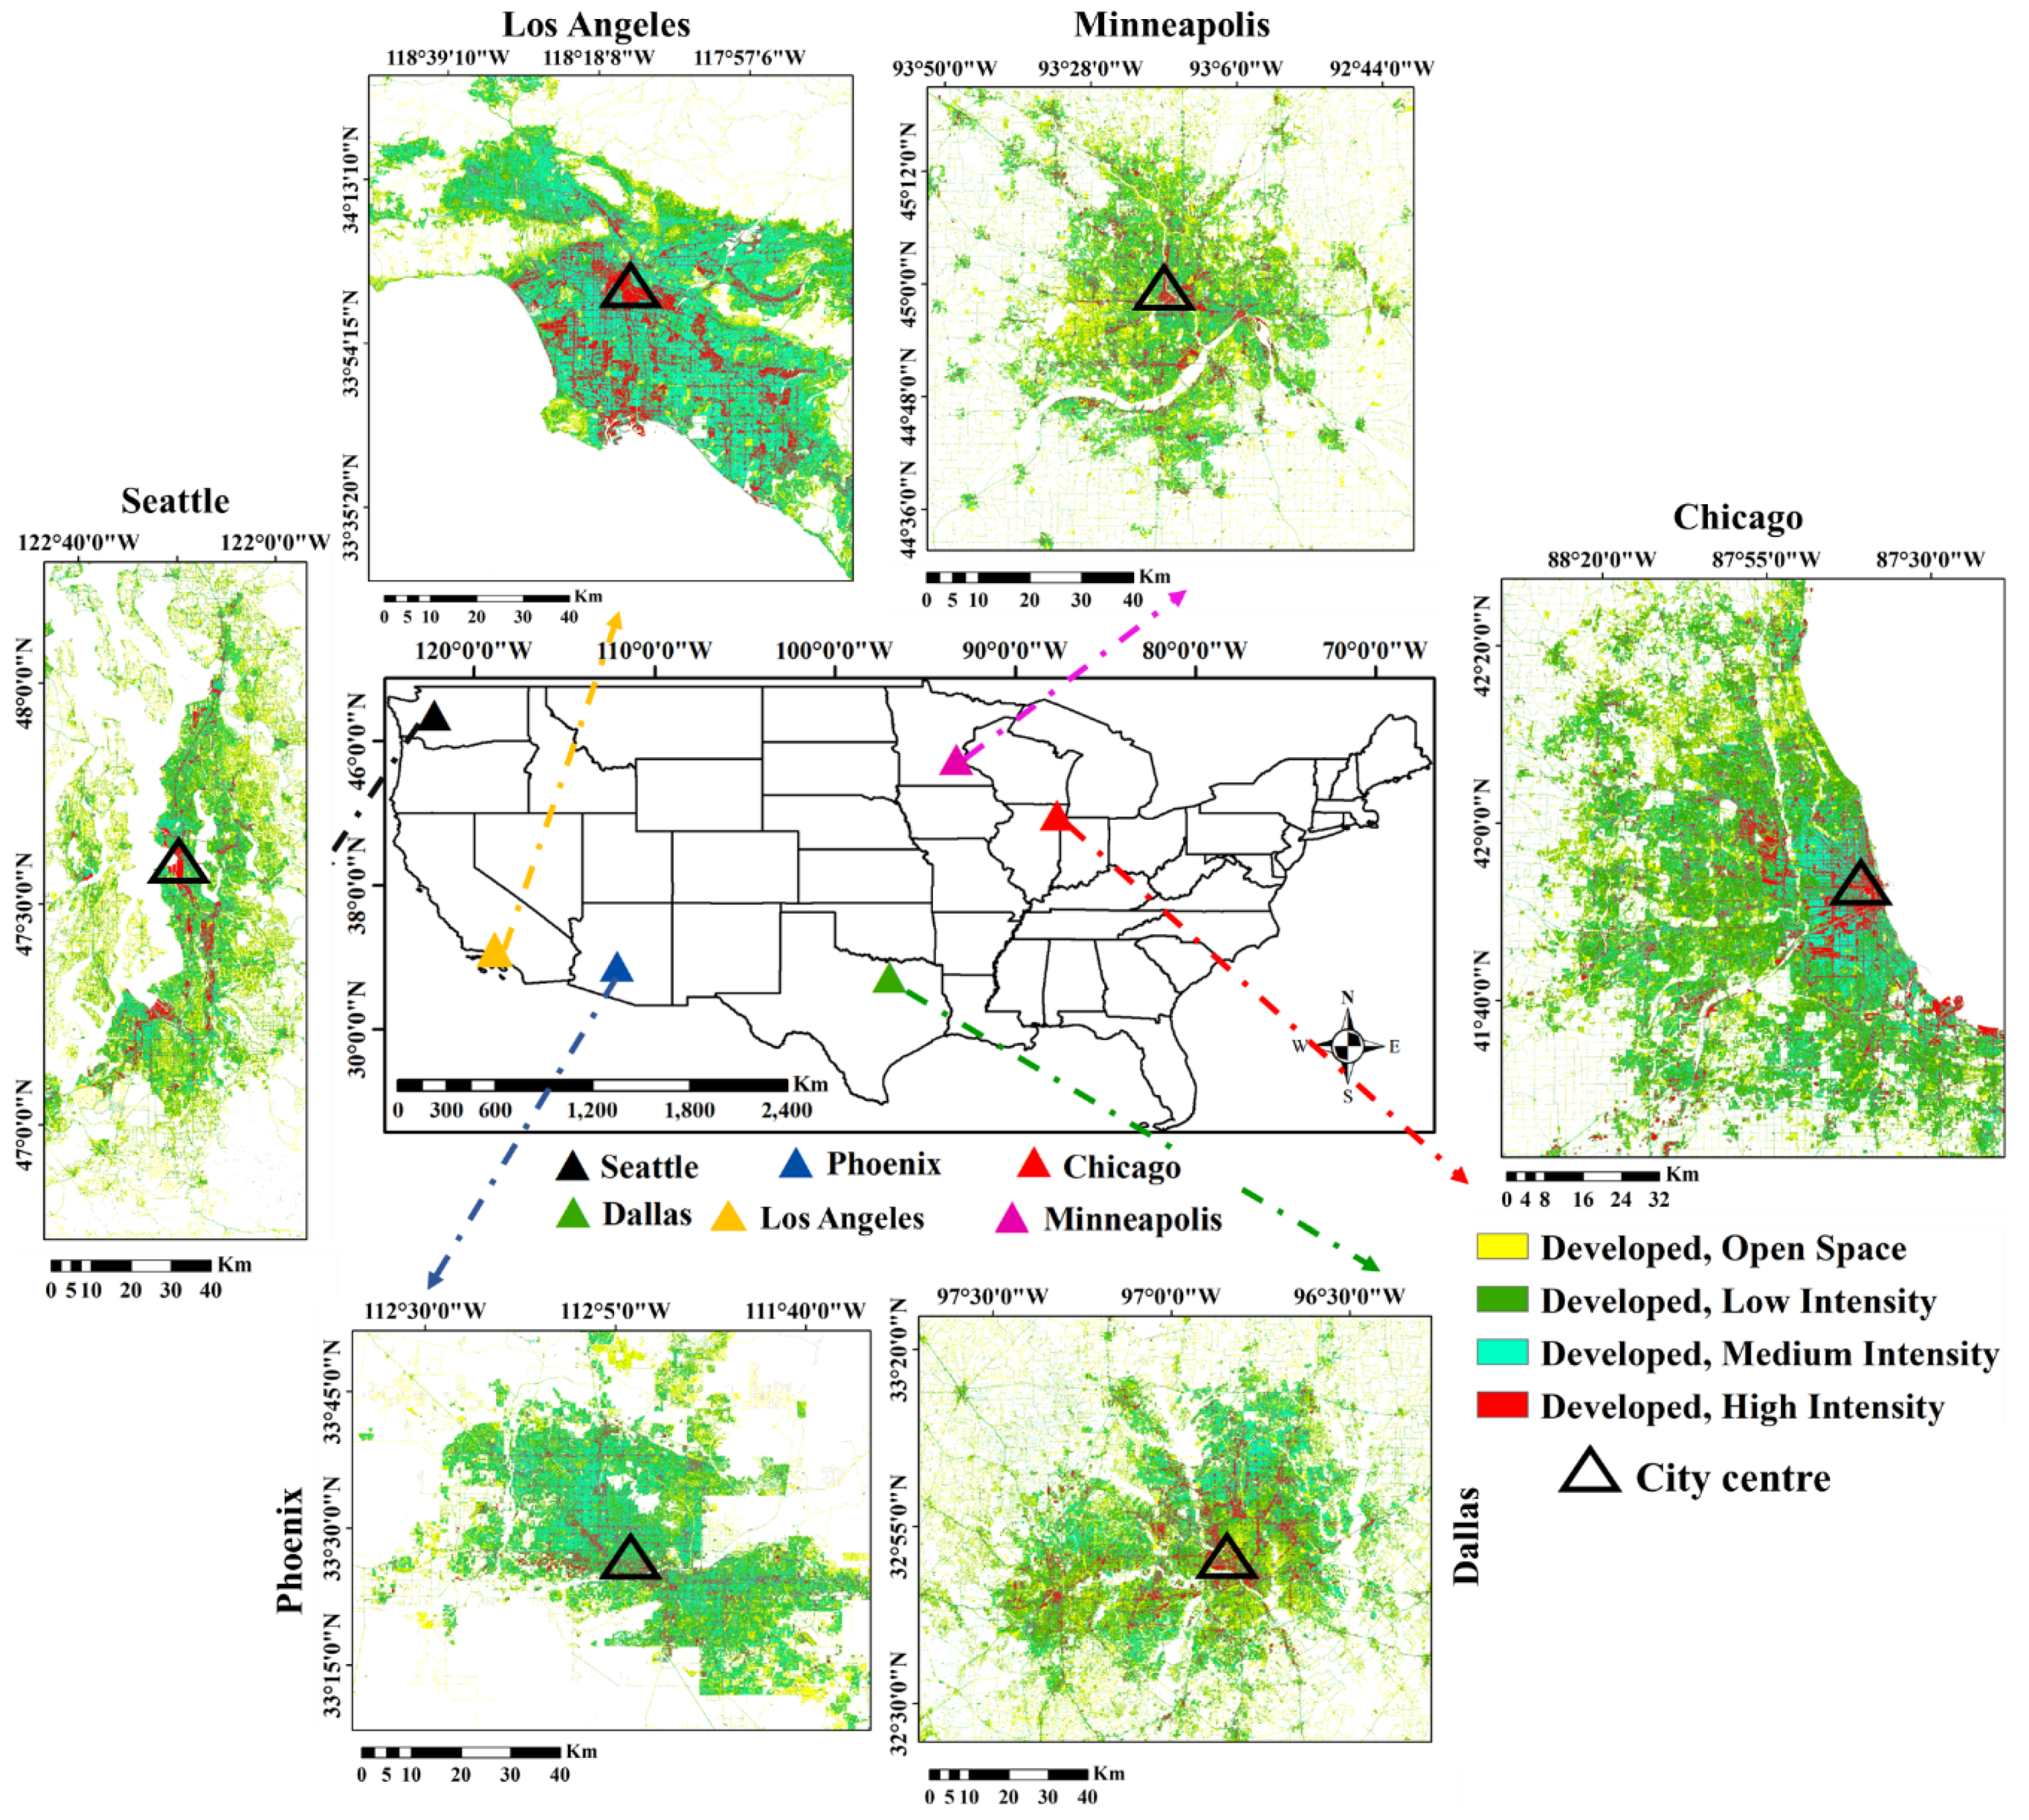
2. Study Area
3. Data and Methods
3.1. Data
3.2. Methods
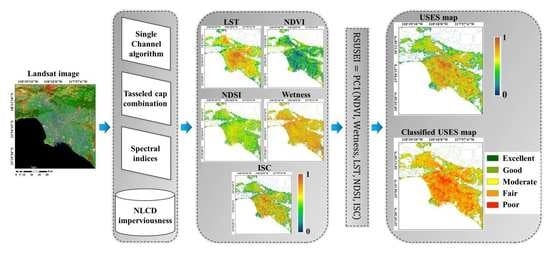
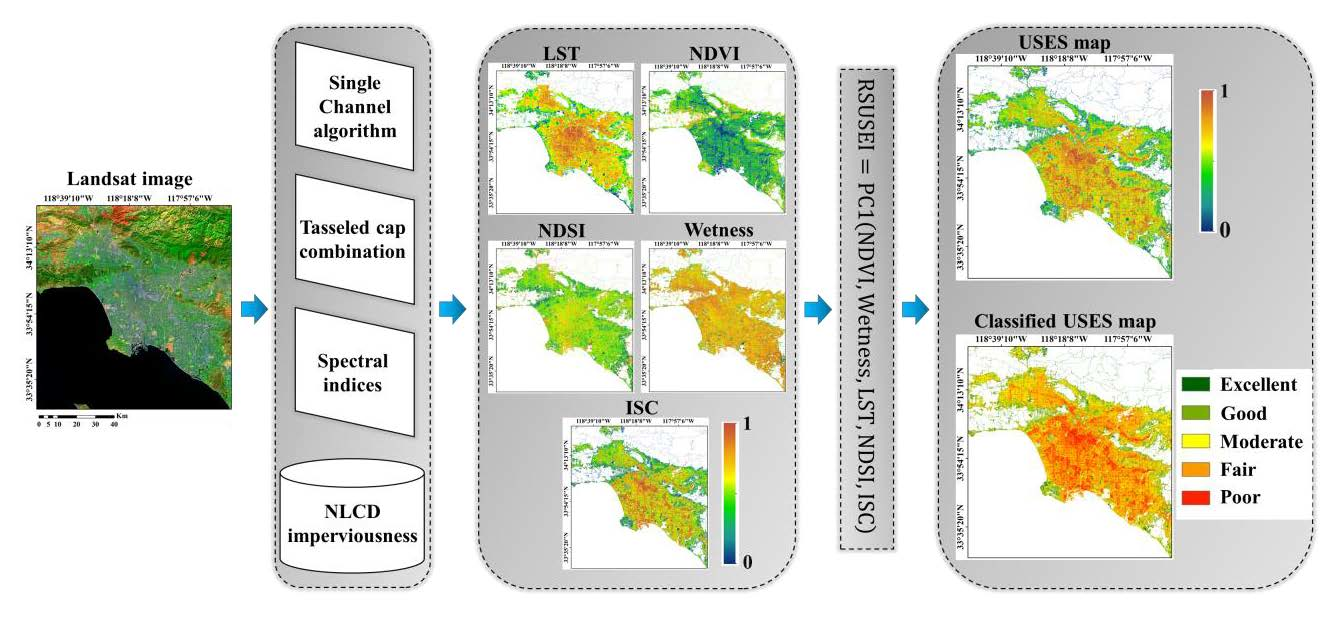
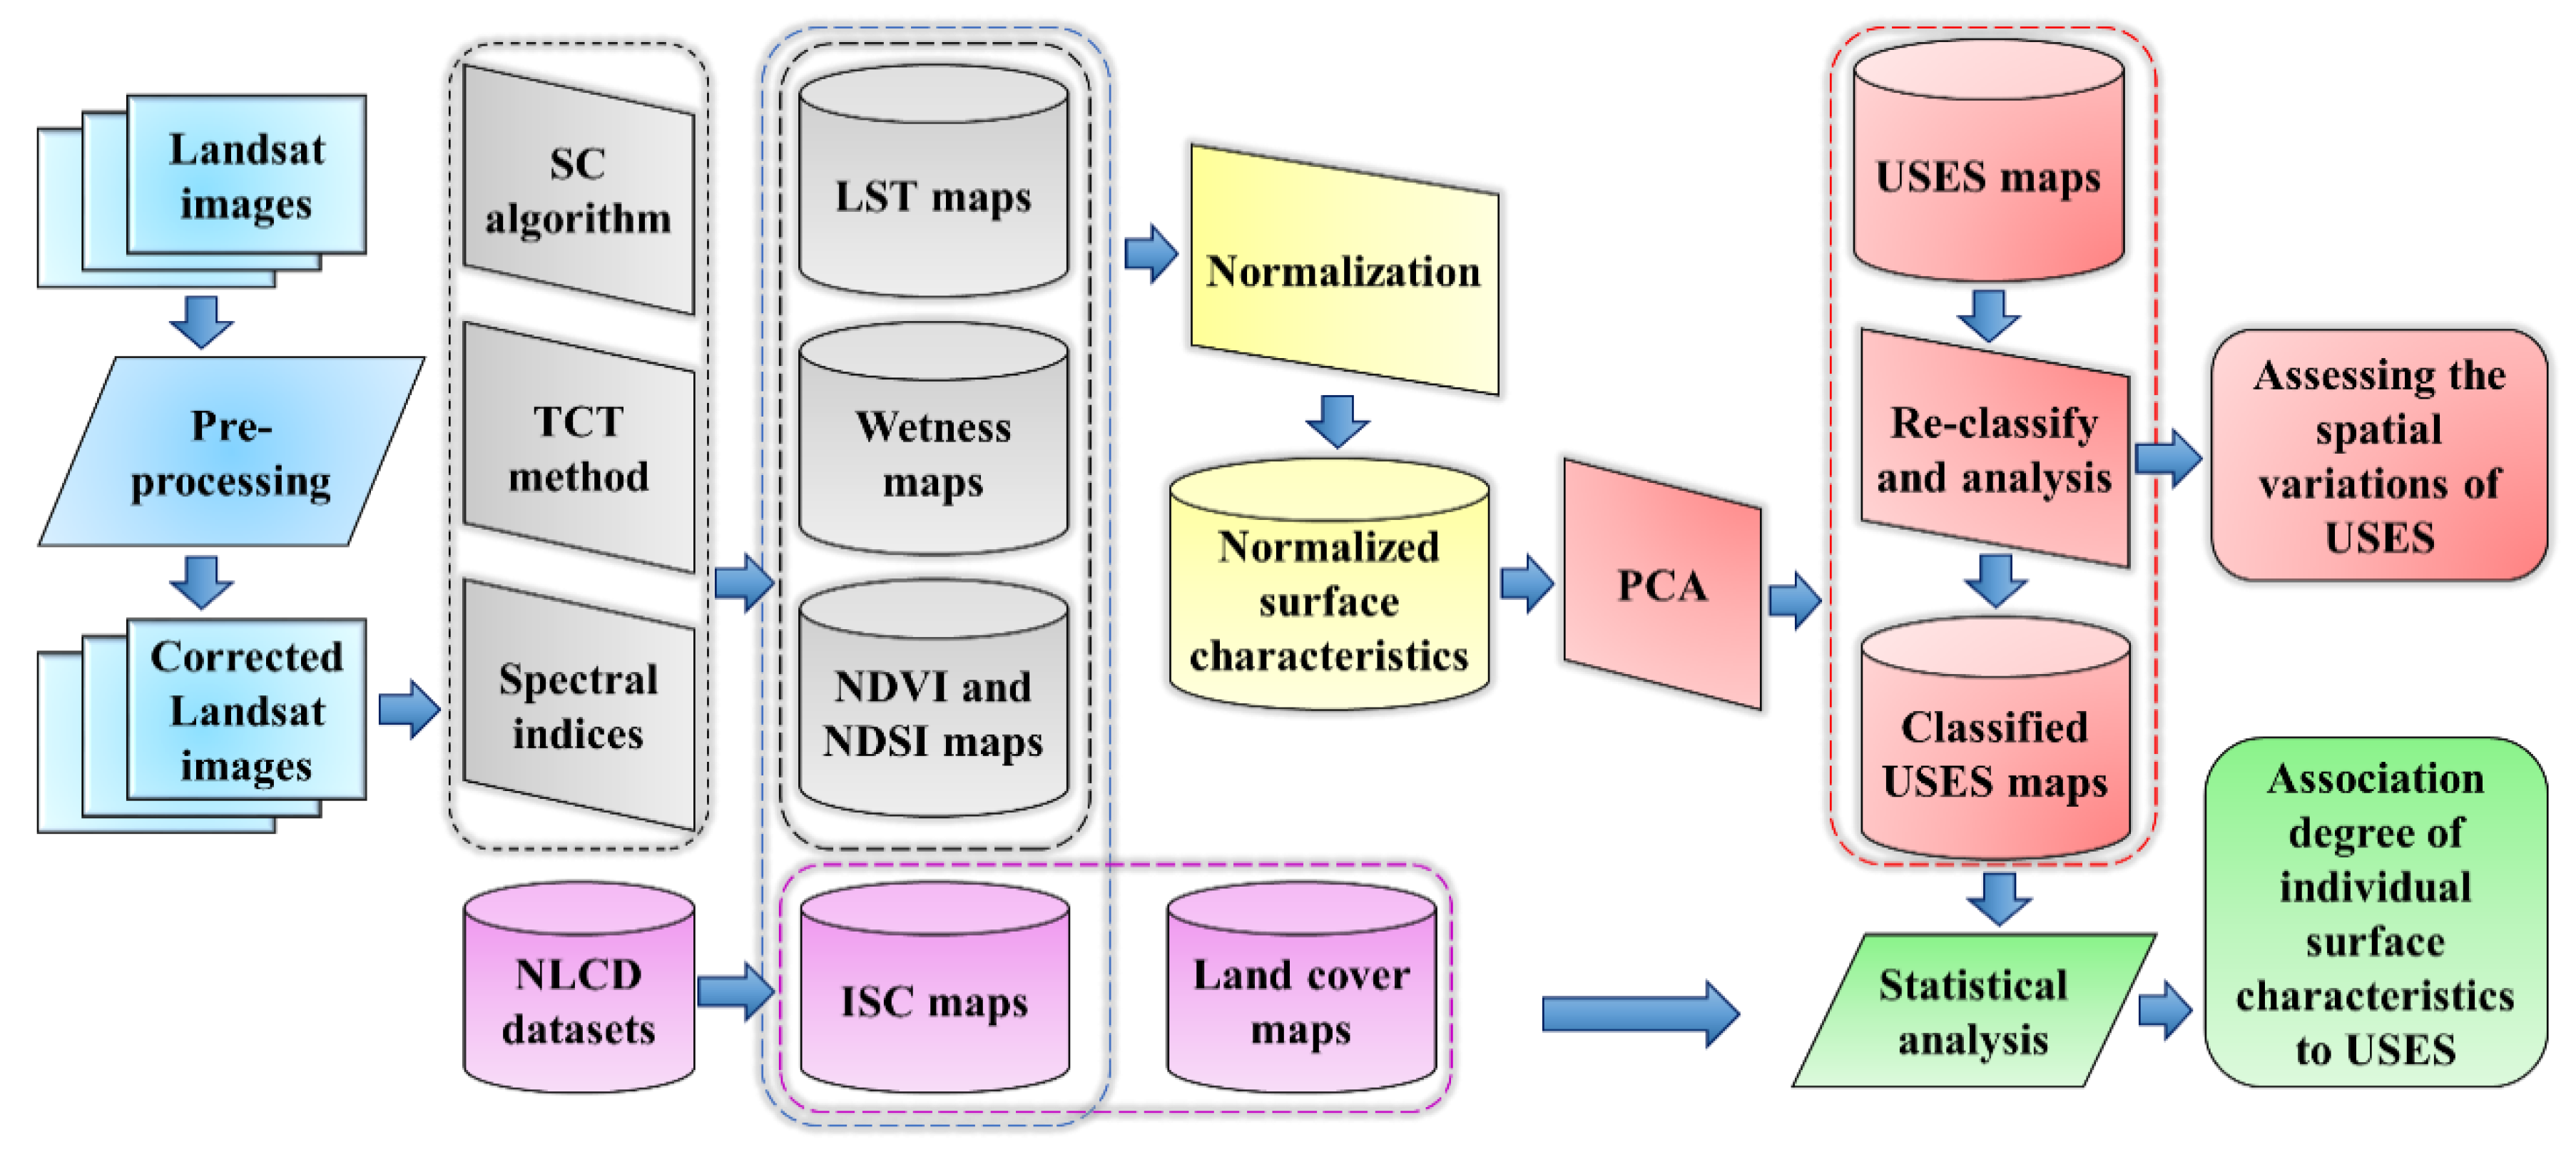
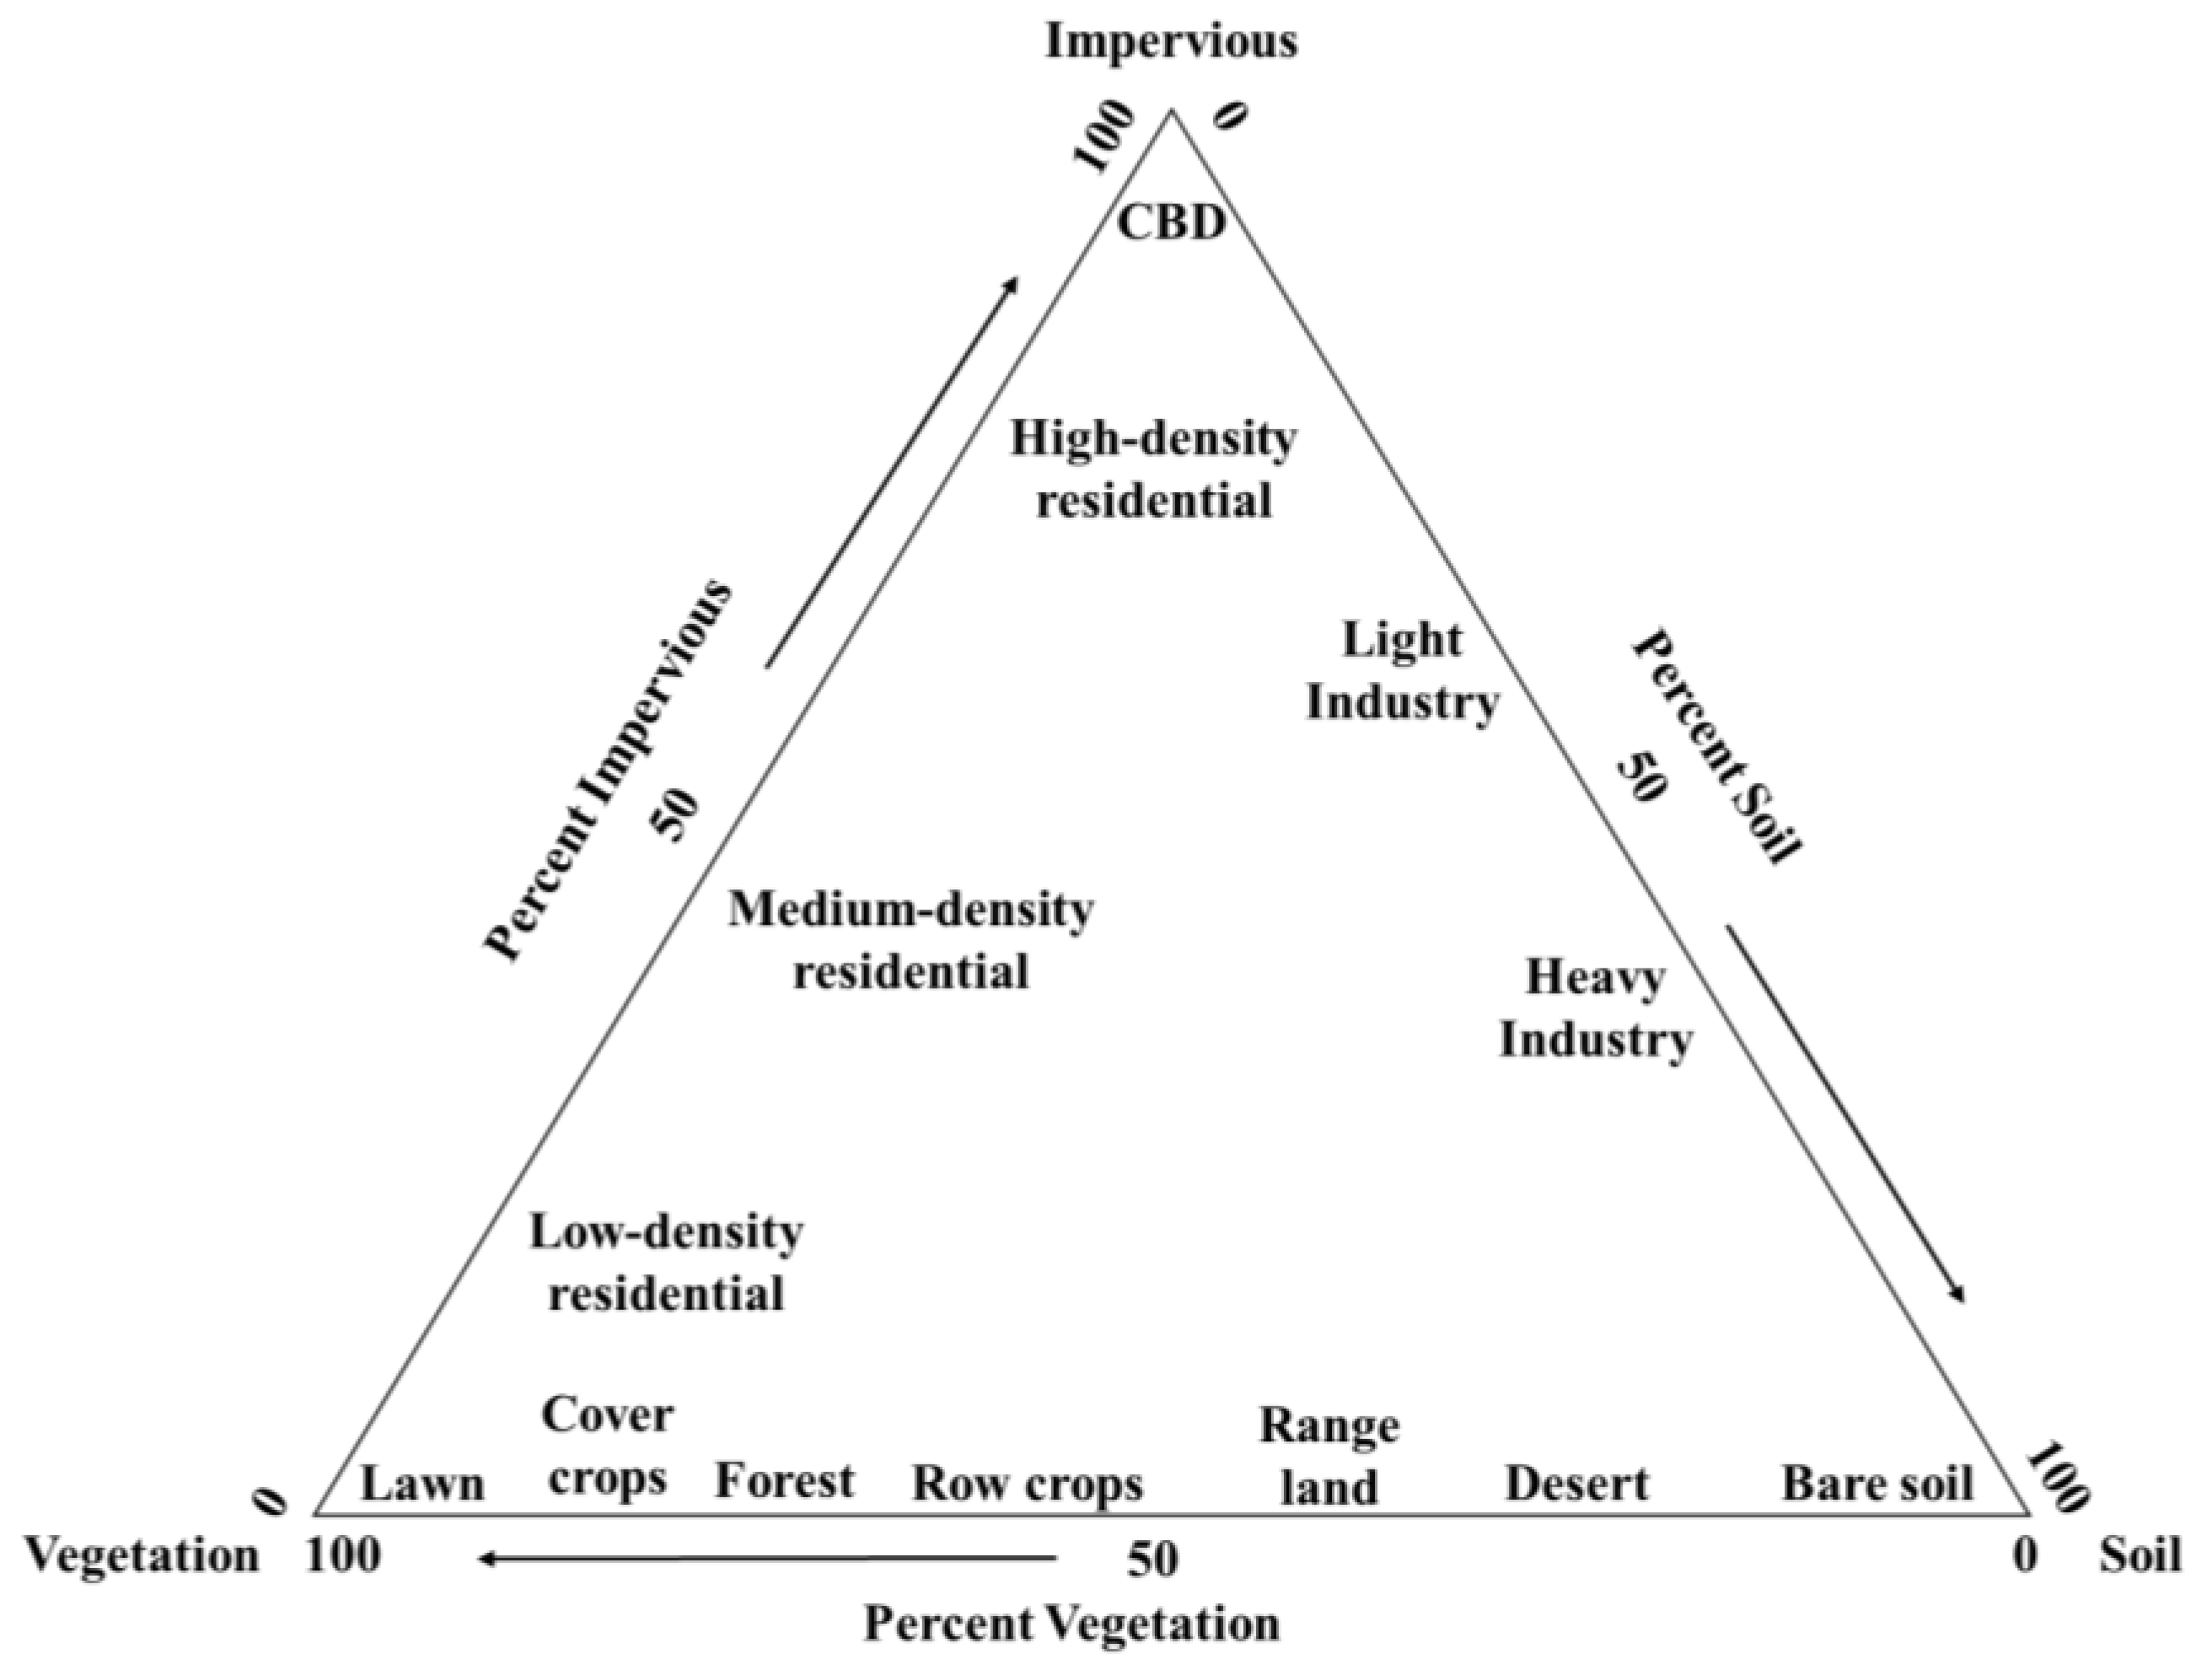
3.2.1. Landsat Image Preprocessing and Surface Characteristics Modeling
3.2.2. Remotely Sensed Urban Surface Ecological Index (RSUSEI)
3.2.3. Association Degree of Individual Surface Characteristics to USES
4. Results
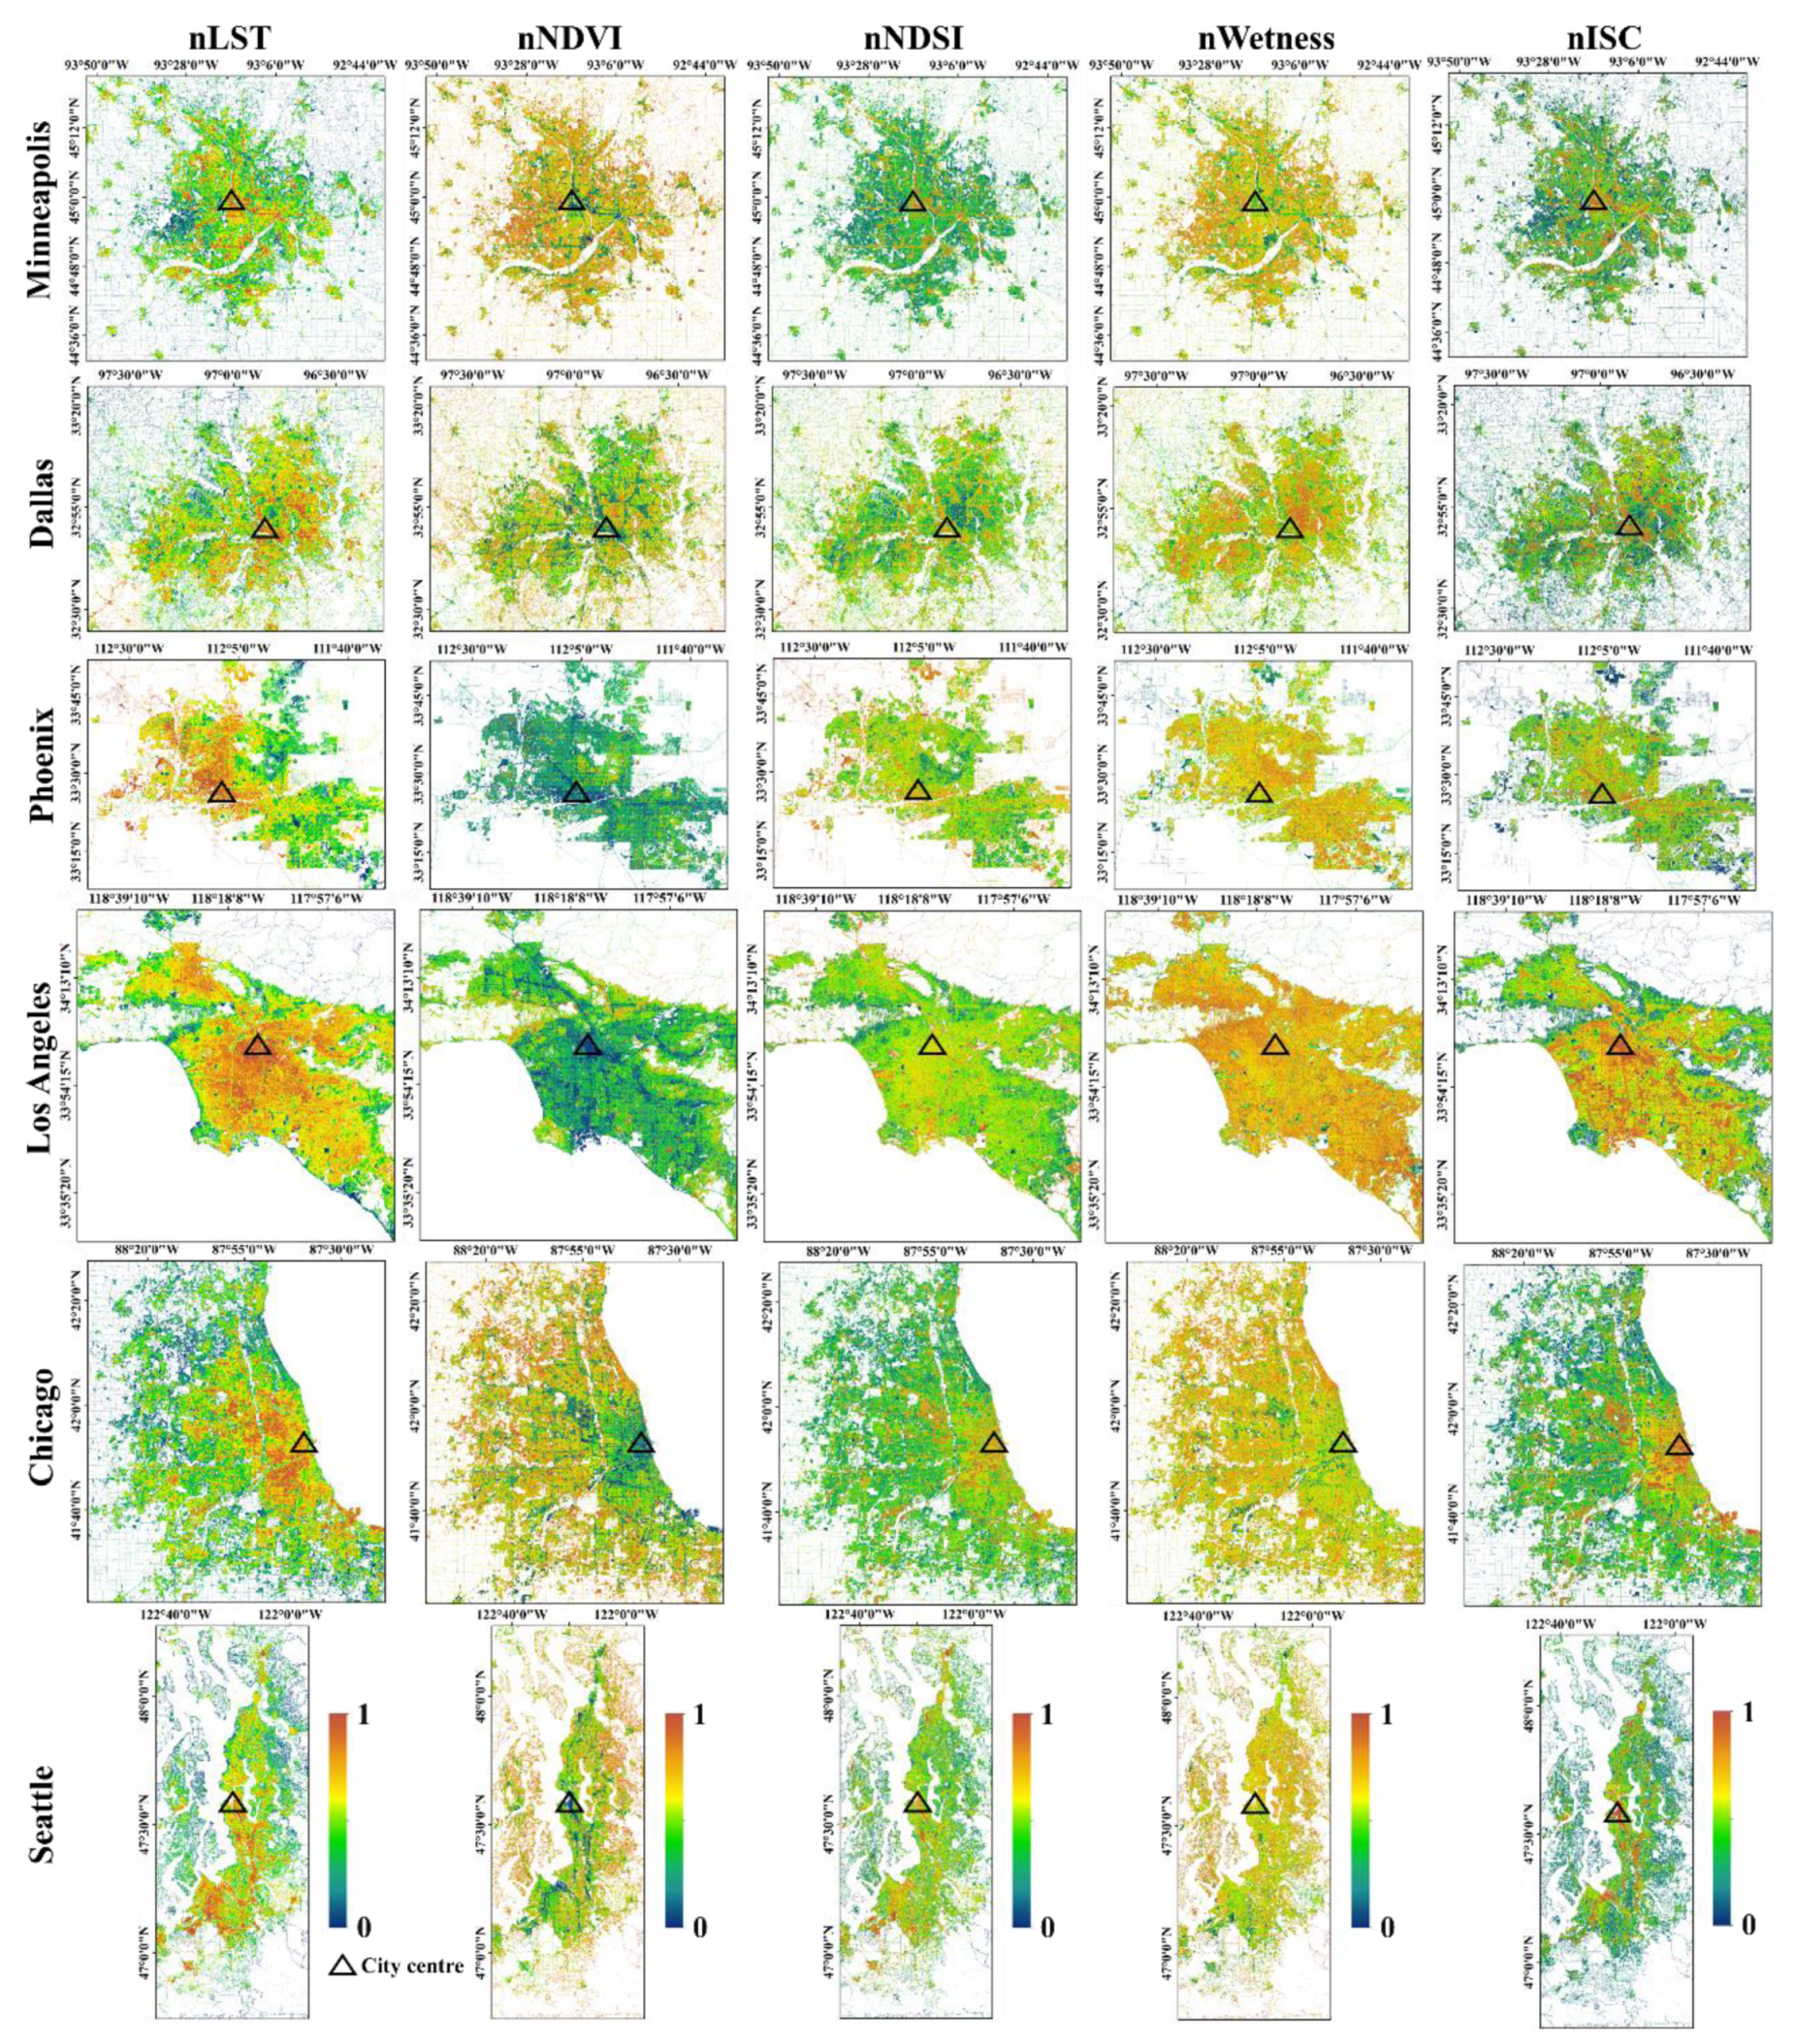
4.1. Spatial Distribution of Surface Characteristics
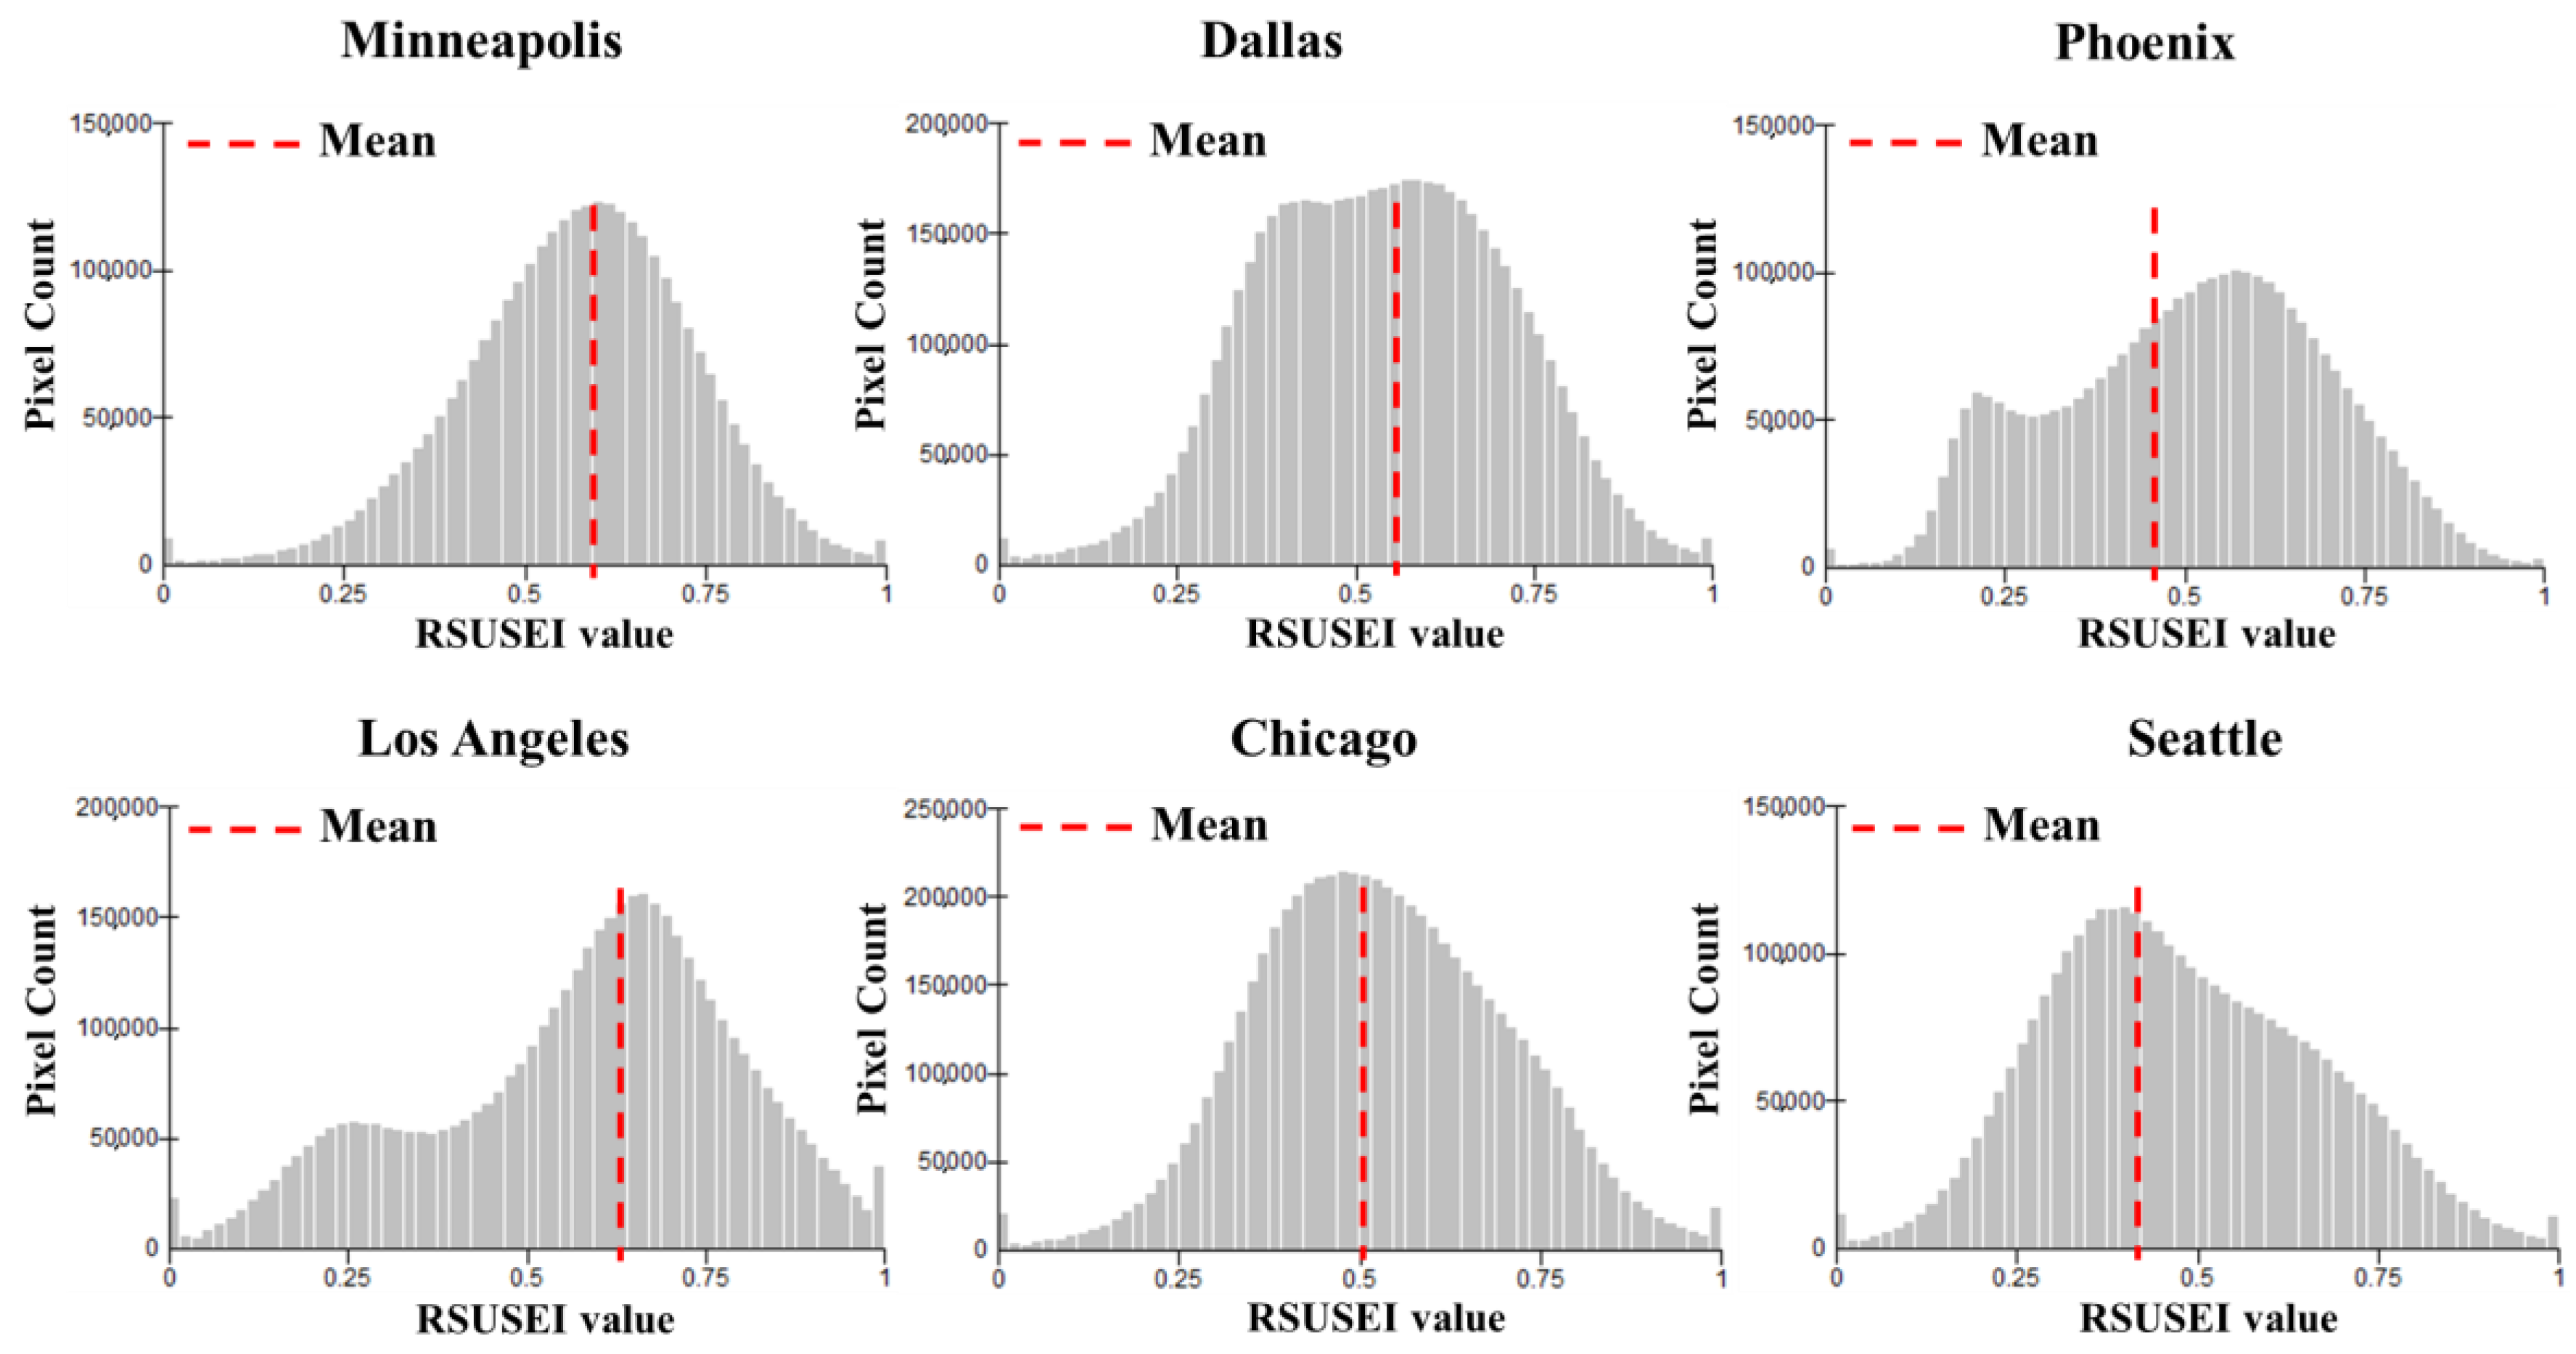
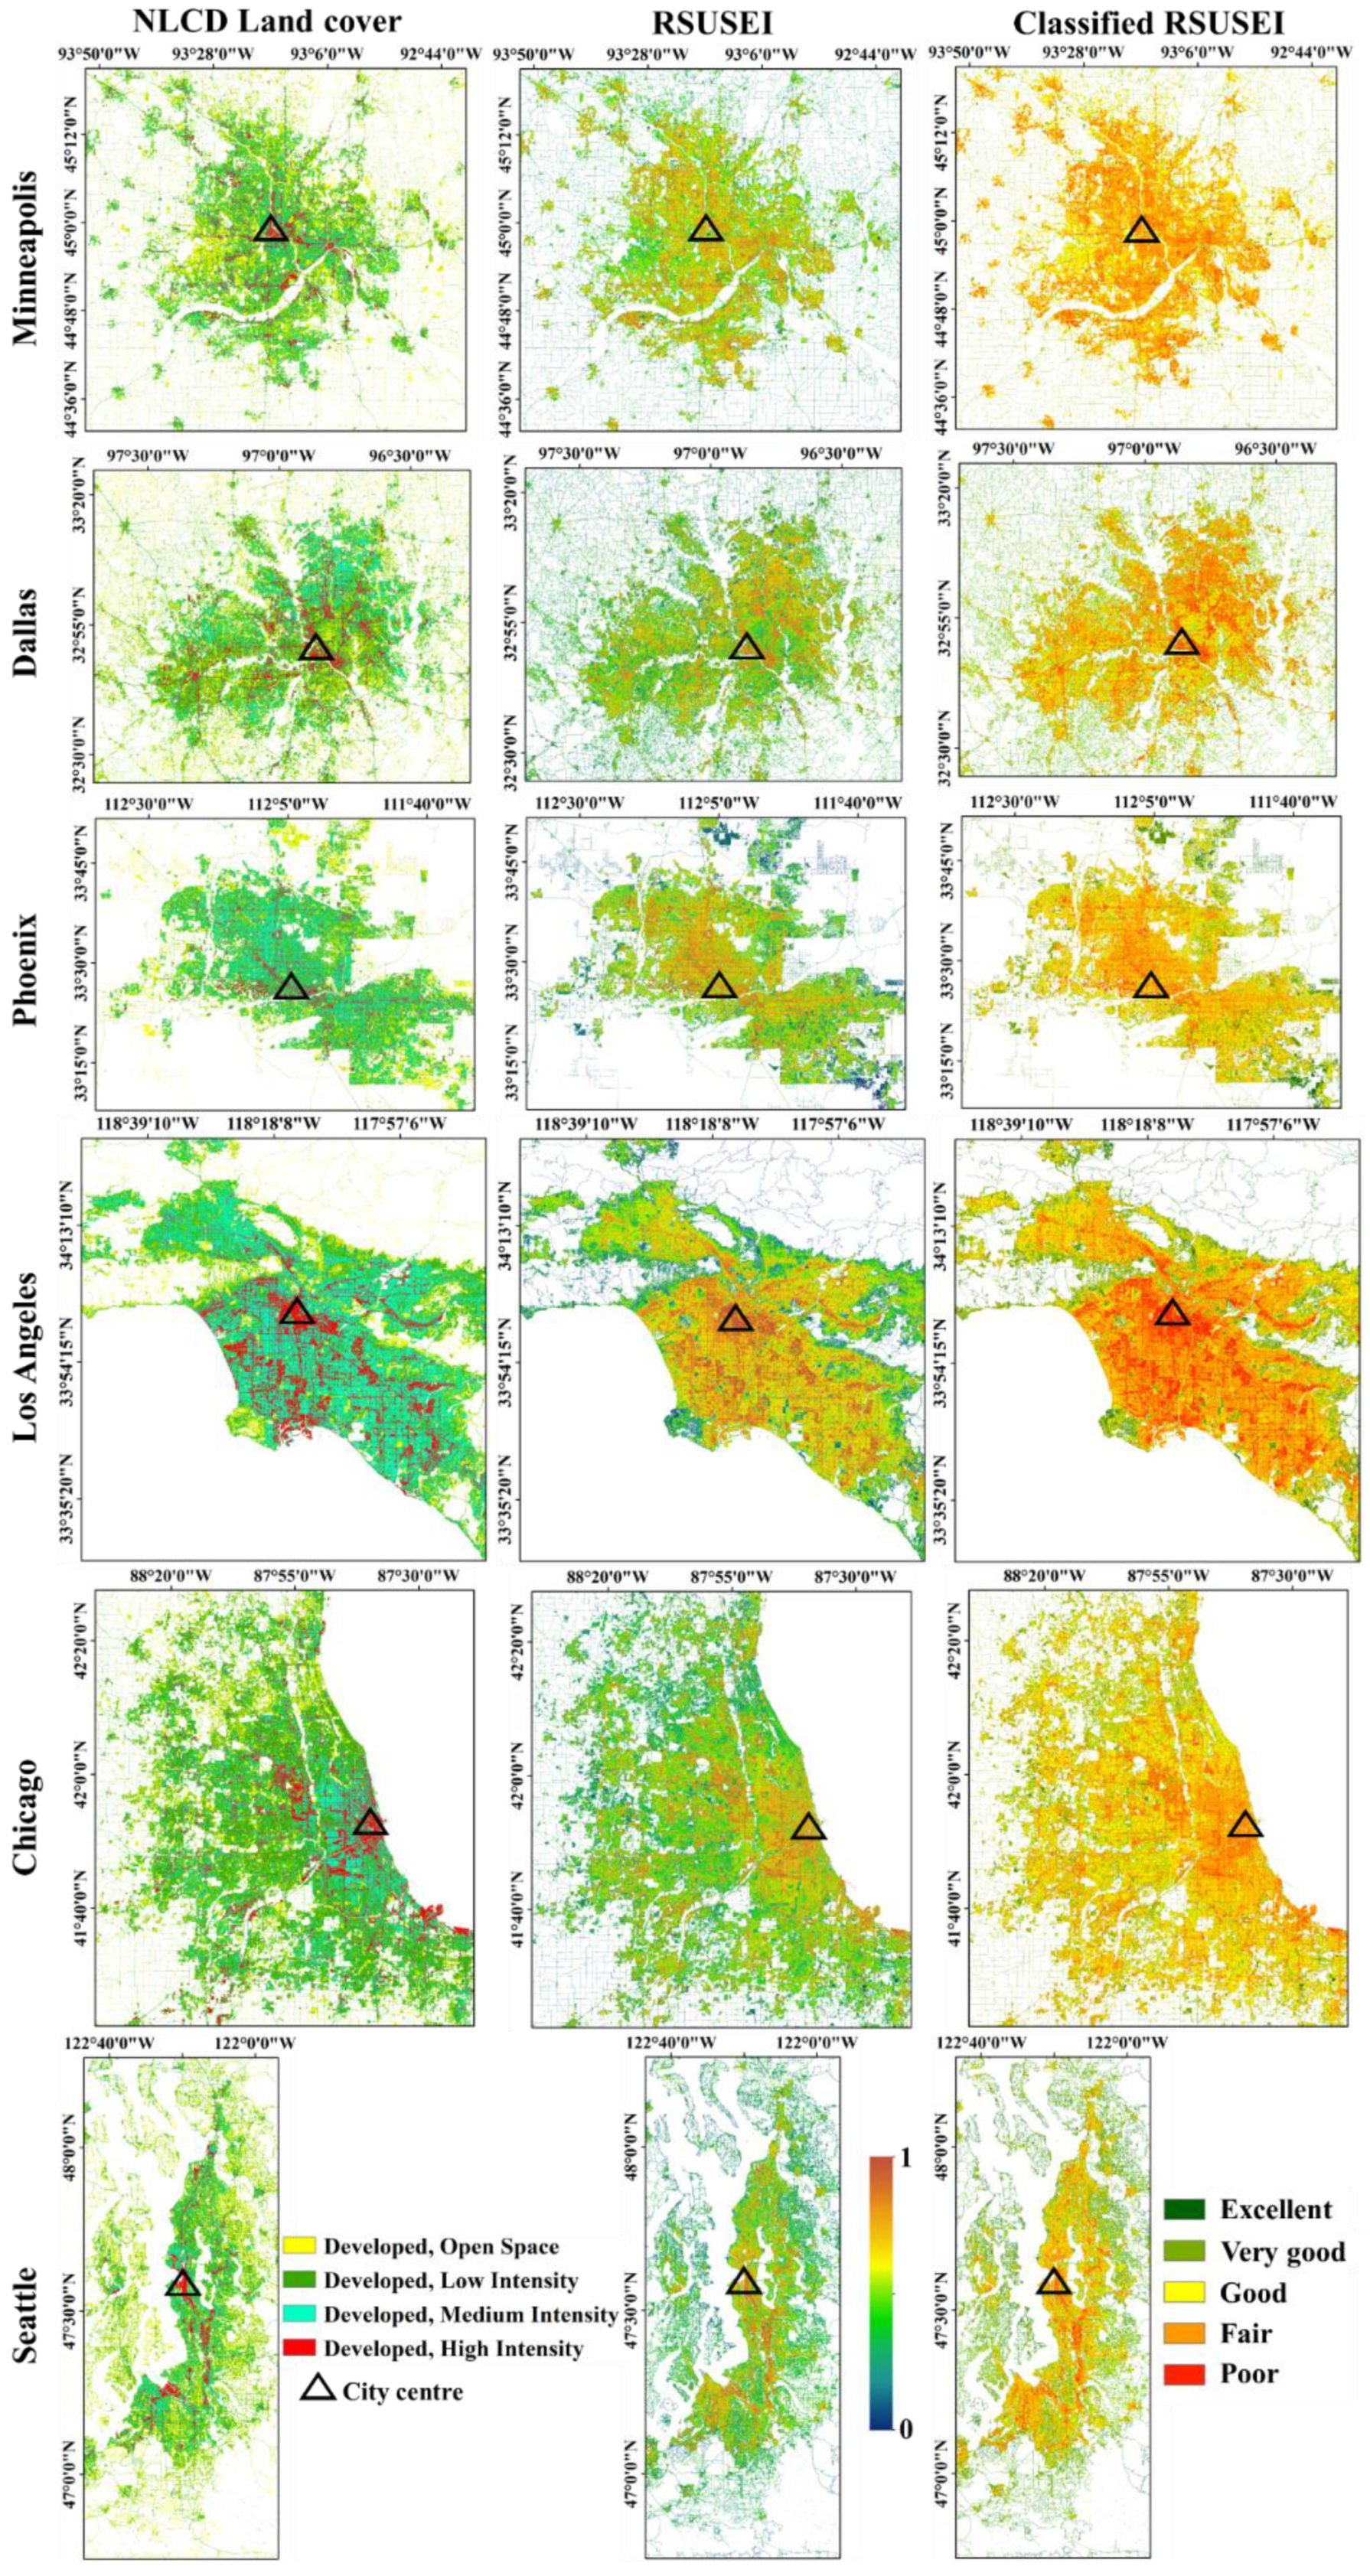
4.2. Spatial Distribution of USES
4.3. Association Degree of Surface Biophysical Parameters on the USES Modeling
5. Discussion
6. Conclusions
Author Contributions
Funding
Conflicts of Interest
References
- Reza, M.I.H.; Abdullah, S.A. Regional Index of Ecological Integrity: A need for sustainable management of natural resources. Ecol. Indic. 2011, 11, 220–229. [Google Scholar] [CrossRef]
- Frohn, R.C.; Lopez, R.D. Remote Sensing for Landscape Ecology: New Metric Indicators: Monitoring, Modeling, and Assessment of Ecosystems; CRC Press: Boca Raton, FL, USA, 2017. [Google Scholar]
- Wu, Z.; Zhang, Y. Water Bodies’ Cooling Effects on Urban Land Daytime Surface Temperature: Ecosystem Service Reducing Heat Island Effect. Sustainability 2019, 11, 787. [Google Scholar] [CrossRef] [Green Version]
- Xu, H.; Wang, M.; Shi, T.; Guan, H.; Fang, C.; Lin, Z. Prediction of ecological effects of potential population and impervious surface increases using a remote sensing based ecological index (RSEI). Ecol. Indic. 2018, 93, 730–740. [Google Scholar] [CrossRef]
- Xu, H.; Wang, Y.; Guan, H.; Shi, T.; Hu, X. Detecting Ecological Changes with a Remote Sensing Based Ecological Index (RSEI) Produced Time Series and Change Vector Analysis. Remote Sens. 2019, 11, 2345. [Google Scholar] [CrossRef] [Green Version]
- Hu, X.; Xu, H. A new remote sensing index for assessing the spatial heterogeneity in urban ecological quality: A case from Fuzhou City, China. Ecol. Indic. 2018, 89, 11–21. [Google Scholar] [CrossRef]
- Zhu, X.; Wang, X.; Yan, D.; Liu, Z.; Zhou, Y. Analysis of remotely-sensed ecological indexes’ influence on urban thermal environment dynamic using an integrated ecological index: A case study of Xi’an, China. Int. J. Remote Sens. 2019, 40, 3421–3447. [Google Scholar] [CrossRef]
- Estoque, R.C. A Review of the Sustainability Concept and the State of SDG Monitoring Using Remote Sensing. Remote Sens. 2020, 12, 1770. [Google Scholar] [CrossRef]
- Lin, T.; Ge, R.; Huang, J.; Zhao, Q.; Lin, J.; Huang, N.; Zhang, G.; Li, X.; Ye, H.; Yin, K. A quantitative method to assess the ecological indicator system’s effectiveness: A case study of the Ecological Province Construction Indicators of China. Ecol. Indic. 2016, 62, 95–100. [Google Scholar] [CrossRef]
- Pettorelli, N.; Vik, J.O.; Mysterud, A.; Gaillard, J.-M.; Tucker, C.J.; Stenseth, N.C. Using the satellite-derived NDVI to assess ecological responses to environmental change. Trends Ecol. Evol. 2005, 20, 503–510. [Google Scholar] [CrossRef] [PubMed]
- Willis, K.S. Remote sensing change detection for ecological monitoring in United States protected areas. Biol. Conserv. 2015, 182, 233–242. [Google Scholar] [CrossRef]
- Cohen, W.B.; Goward, S.N. Landsat’s role in ecological applications of remote sensing. Bioscience 2004, 54, 535–545. [Google Scholar] [CrossRef]
- Sun, Z.; Chang, N.-B.; Opp, C. Using SPOT-VGT NDVI as a successive ecological indicator for understanding the environmental implications in the Tarim River Basin, China. J. Appl. Remote Sens. 2010, 4, 043554. [Google Scholar]
- Estoque, R.C.; Murayama, Y. Monitoring surface urban heat island formation in a tropical mountain city using Landsat data (1987–2015). ISPRS J. Photogramm. 2017, 133, 18–29. [Google Scholar] [CrossRef]
- He, C.; Gao, B.; Huang, Q.; Ma, Q.; Dou, Y. Environmental degradation in the urban areas of China: Evidence from multi-source remote sensing data. Remote Sens. Environ. 2017, 193, 65–75. [Google Scholar] [CrossRef]
- Fu, P.; Xie, Y.; Weng, Q.; Myint, S.; Meacham-Hensold, K.; Bernacchi, C. A physical model-based method for retrieving urban land surface temperatures under cloudy conditions. Remote Sens. Environ. 2019, 230, 111191. [Google Scholar] [CrossRef]
- Fu, Y.; Li, J.; Weng, Q.; Zheng, Q.; Li, L.; Dai, S.; Guo, B. Characterizing the spatial pattern of annual urban growth by using time series Landsat imagery. Sci. Total Environ. 2019, 666, 274–284. [Google Scholar] [CrossRef]
- King, R.S.; Baker, M.E. Considerations for analyzing ecological community thresholds in response to anthropogenic environmental gradients. J. N. Am. Benthol. Soc. 2010, 29, 998–1008. [Google Scholar] [CrossRef] [Green Version]
- Firozjaei, M.K.; Weng, Q.; Zhao, C.; Kiavarz, M.; Lu, L.; Alavipanah, S.K. Surface anthropogenic heat islands in six megacities: An assessment based on a triple-source surface energy balance model. Remote Sens. Environ. 2020, 242, 111751. [Google Scholar] [CrossRef]
- Weng, Q.; Lu, D.; Liang, B. Urban surface biophysical descriptors and land surface temperature variations. Photogramm. Eng. Remote Sens. 2006, 72, 1275–1286. [Google Scholar] [CrossRef] [Green Version]
- Weng, Q.; Liu, H.; Liang, B.; Lu, D. The spatial variations of urban land surface temperatures: Pertinent factors, zoning effect, and seasonal variability. IEEE J. Sel. Top. Appl. Earth Obs. Remote Sens. 2008, 1, 154–166. [Google Scholar] [CrossRef]
- Lu, D.; Weng, Q. Extraction of urban impervious surfaces from an IKONOS image. Int. J. Remote Sens. 2009, 30, 1297–1311. [Google Scholar] [CrossRef]
- Ridd, M.K. Exploring a VIS (vegetation-impervious surface-soil) model for urban ecosystem analysis through remote sensing: Comparative anatomy for cities. Int. J. Remote Sens. 1995, 16, 2165–2185. [Google Scholar] [CrossRef]
- Firozjaei, M.K.; Sedighi, A.; Kiavarz, M.; Qureshi, S.; Haase, D.; Alavipanah, S.K. Automated Built-Up Extraction Index: A New Technique for Mapping Surface Built-Up Areas Using LANDSAT 8 OLI Imagery. Remote Sens. 2019, 11, 1966. [Google Scholar] [CrossRef] [Green Version]
- Amiri, R.; Weng, Q.; Alimohammadi, A.; Alavipanah, S.K. Spatial–temporal dynamics of land surface temperature in relation to fractional vegetation cover and land use/cover in the Tabriz urban area, Iran. Remote Sens. Environ. 2009, 113, 2606–2617. [Google Scholar] [CrossRef]
- Haashemi, S.; Weng, Q.; Darvishi, A.; Alavipanah, S.K. Seasonal variations of the surface urban heat island in a semi-arid city. Remote Sens. 2016, 8, 352. [Google Scholar] [CrossRef] [Green Version]
- Xian, G.; Homer, C.; Demitz, J.; Fry, J.; Hossain, N. Change of impervious surface area between 2001 and 2006 in the conterminous United States. Photogramm. Eng. Remote Sens. 2011, 77, 758–762. [Google Scholar]
- Yang, L.; Huang, C.; Homer, C.G.; Wylie, B.K.; Coan, M.J. An approach for mapping large-area impervious surfaces: Synergistic use of Landsat-7 ETM+ and high spatial resolution imagery. Can. J. Remote Sens. 2003, 29, 230–240. [Google Scholar] [CrossRef]
- Berk, A.; Conforti, P.; Kennett, R.; Perkins, T.; Hawes, F.; van den Bosch, J. MODTRAN® 6: A major upgrade of the MODTRAN® radiative transfer code. In Proceedings of the 2014 6th Workshop on Hyperspectral Image and Signal Processing: Evolution in Remote Sensing (WHISPERS), Lausanne, Switzerland, 24–27 June 2014; pp. 1–4. [Google Scholar]
- Firozjaei, M.K.; Kiavarz, M.; Nematollahi, O.; Karimpour Reihan, M.; Alavipanah, S.K. An evaluation of energy balance parameters, and the relations between topographical and biophysical characteristics using the mountainous surface energy balance algorithm for land (SEBAL). Int. J. Remote Sens. 2019, 40, 1–31. [Google Scholar] [CrossRef]
- Tucker, C.J. Red and photographic infrared linear combinations for monitoring vegetation. Remote Sens. Environ. 1979, 8, 127–150. [Google Scholar] [CrossRef] [Green Version]
- Baig, M.H.A.; Zhang, L.; Shuai, T.; Tong, Q. Derivation of a tasselled cap transformation based on Landsat 8 at-satellite reflectance. Remote Sens. Lett. 2014, 5, 423–431. [Google Scholar] [CrossRef]
- Mijani, N.; Alavipanah, S.K.; Hamzeh, S.; Firozjaei, M.K.; Arsanjani, J.J. Modeling thermal comfort in different condition of mind using satellite images: An Ordered Weighted Averaging approach and a case study. Ecol. Indic. 2019, 104, 1–12. [Google Scholar] [CrossRef]
- Zhao, H.; Chen, X. Use of normalized difference bareness index in quickly mapping bare areas from TM/ETM+. In Proceedings of the International geoscience and remote sensing symposium, Seoul, Korea, 25–29 July 2005; p. 1666. [Google Scholar]
- Jiménez-Muñoz, J.C.; Sobrino, J.A.; Skoković, D.; Mattar, C.; Cristóbal, J. Land surface temperature retrieval methods from Landsat-8 thermal infrared sensor data. IEEE Geosci. Remote Sens. Lett. 2014, 11, 1840–1843. [Google Scholar] [CrossRef]
- Firozjaei, M.K.; Alavipanah, S.K.; Liu, H.; Sedighi, A.; Mijani, N.; Kiavarz, M.; Weng, Q. A PCA–OLS Model for Assessing the Impact of Surface Biophysical Parameters on Land Surface Temperature Variations. Remote Sens. 2019, 11, 2094. [Google Scholar] [CrossRef] [Green Version]
- Fu, P.; Weng, Q. A time series analysis of urbanization induced land use and land cover change and its impact on land surface temperature with Landsat imagery. Remote Sens. Environ. 2016, 175, 205–214. [Google Scholar] [CrossRef]
- Firozjaei, M.K.; Fathololoumi, S.; Kiavarz, M.; Arsanjani, J.J.; Alavipanah, S.K. Modelling surface heat island intensity according to differences of biophysical characteristics: A case study of Amol city, Iran. Ecol. Indic. 2020, 109, 105816. [Google Scholar] [CrossRef]
- Firozjaei, M.K.; Kiavarz, M.; Alavipanah, S.K.; Lakes, T.; Qureshi, S. Monitoring and forecasting heat island intensity through multi-temporal image analysis and cellular automata-Markov chain modelling: A case of Babol city, Iran. Ecol. Indic. 2018, 91, 155–170. [Google Scholar] [CrossRef]
- Karimi, F.M.; Kiavarz, M.M.; Alavi, P.S.K. Monitoring and predicting spatial-temporal changes heat island in babol city due to urban sprawl and land use changes. Eng. J. Geospat. Inf. Technol. 2017, 5, 123–151. [Google Scholar]
- Liu, H.; Weng, Q. Seasonal variations in the relationship between landscape pattern and land surface temperature in Indianapolis, USA. Environ. Monit. Assess. 2008, 144, 199–219. [Google Scholar] [CrossRef]
- Lu, D.; Weng, Q. Spectral mixture analysis of ASTER images for examining the relationship between urban thermal features and biophysical descriptors in Indianapolis, Indiana, USA. Remote Sens. Environ. 2006, 104, 157–167. [Google Scholar] [CrossRef]
- Weng, Q.; Hu, X.; Quattrochi, D.A.; Liu, H. Assessing intra-urban surface energy fluxes using remotely sensed ASTER imagery and routine meteorological data: A case study in Indianapolis, USA. IEEE J. Sel. Top. Appl. Earth Obs. Remote Sens. 2014, 7, 4046–4057. [Google Scholar] [CrossRef]
- Weng, Q. Remote sensing of impervious surfaces in the urban areas: Requirements, methods, and trends. Remote Sens. Environ. 2012, 117, 34–49. [Google Scholar] [CrossRef]
- Weng, Q.; Lu, D. A sub-pixel analysis of urbanization effect on land surface temperature and its interplay with impervious surface and vegetation coverage in Indianapolis, United States. Int. J. Appl. Earth Obs. 2008, 10, 68–83. [Google Scholar] [CrossRef]
- Weng, Q.; Rajasekar, U.; Hu, X. Modeling urban heat islands and their relationship with impervious surface and vegetation abundance by using ASTER images. IEEE Trans. Geosci. Remote Sens. 2011, 49, 4080–4089. [Google Scholar] [CrossRef]
- Wickham, J.; Wade, T.; Norton, D. Spatial patterns of watershed impervious cover relative to stream location. Ecol. Indic. 2014, 40, 109–116. [Google Scholar] [CrossRef]
- Beck, S.M.; McHale, M.R.; Hess, G.R. Beyond impervious: Urban land-cover pattern variation and implications for watershed management. Environ. Manag. 2016, 58, 15–30. [Google Scholar] [CrossRef] [PubMed]


| Land Cover Class | Minneapolis | Dallas | Phoenix | Los Angeles | Chicago | Seattle | ||||||
|---|---|---|---|---|---|---|---|---|---|---|---|---|
| Area | % | Area | % | Area | % | Area | % | Area | % | Area | % | |
| Developed, Open Space | 962.6 | 36.0 | 1329.3 | 27.0 | 646.5 | 23.5 | 616.9 | 15.2 | 1042.3 | 19.1 | 936.6 | 31.2 |
| Developed, Low Intensity | 859.0 | 32.1 | 1682.1 | 34.1 | 966.8 | 35.2 | 965.9 | 23.9 | 2430.7 | 45.5 | 1182.1 | 39.3 |
| Developed, Medium Intensity | 599.1 | 22.4 | 1305.2 | 26.5 | 913.5 | 33.2 | 1804.7 | 44.6 | 1338.1 | 24.5 | 647.5 | 21.6 |
| Developed, High Intensity | 250.9 | 9.5 | 606.2 | 12.4 | 221.1 | 8.1 | 653.1 | 16.3 | 650.8 | 11.9 | 238.2 | 7.9 |
| Total area | 2671.6 | 100 | 4922.8 | 100 | 2747.9 | 100 | 4040.6 | 100 | 5461.9 | 100 | 3004.4 | 100 |
| Index | Equation | Reference |
|---|---|---|
| NDVI | [31] | |
| Wetness | Tasseled cap transformation (TCT) component 3 | [32,33] |
| NDSI | [34] | |
| LST | Single Channel (SC) algorithm | [35] |
| Cities | nLST | nNDVI | nNDSI | nWetness | nISC |
|---|---|---|---|---|---|
| Minneapolis | 0.39 (0.16) | 0.66 (0.19) | 0.41 (0.16) | 0.75 (0.11) | 0.36 (0.27) |
| Dallas | 0.54 (0.14) | 0.56 (0.19) | 0.49 (0.15) | 0.55 (0.11) | 0.41 (0.28) |
| Phoenix | 0.65 (0.13) | 0.25 (0.16) | 0.64 (0.09) | 0.79 (0.04) | 0.53 (0.11) |
| Los Angeles | 0.63 (0.12) | 0.29 (0.17) | 0.59 (0.13) | 0.69 (0.12) | 0.52 (0.26) |
| Chicago | 0.42 (0.16) | 0.56 (0.23) | 0.42 (0.14) | 0.65 (0.08) | 0.43 (0.25) |
| Seattle | 0.46 (0.14) | 0.58 (0.22) | 0.50 (0.17) | 0.58 (0.12) | 0.37 (0.25) |
| Land Cover Class | nLST | nNDVI | nNDBI | nWetness | nISC |
|---|---|---|---|---|---|
| Developed, Open Space | 0.42 | 0.62 | 0.42 | 0.68 | 0.06 |
| Developed, Low Intensity | 0.49 | 0.52 | 0.45 | 0.64 | 0.34 |
| Developed, Medium Intensity | 0.57 | 0.40 | 0.52 | 0.61 | 0.62 |
| Developed, High Intensity | 0.64 | 0.22 | 0.62 | 0.56 | 0.89 |
| Land Cover Class | Minneapolis | Dallas | Phoenix | Los Angeles | Chicago | Seattle | Mean |
|---|---|---|---|---|---|---|---|
| Developed, Open Space | 0.40 | 0.35 | 0.37 | 0.38 | 0.34 | 0.32 | 0.35 |
| Developed, Low Intensity | 0.58 | 0.51 | 0.47 | 0.45 | 0.45 | 0.48 | 0.49 |
| Developed, Medium Intensity | 0.63 | 0.65 | 0.64 | 0.59 | 0.64 | 0.64 | 0.63 |
| Developed, High Intensity | 0.65 | 0.76 | 0.80 | 0.85 | 0.76 | 0.76 | 0.76 |
| City | nLST | nNDVI | nNDSI | nWetness | ISC |
|---|---|---|---|---|---|
| Minneapolis | 0.41 | −0.24 | 0.3 | −0.34 | 0.90 |
| Dallas | 0.4 | −0.21 | 0.06 | −0.24 | 0.99 |
| Phoenix | 0.32 | −0.27 | 0.31 | −0.56 | 0.99 |
| Los Angeles | 0.59 | −0.52 | 0.01 | −0.4 | 0.99 |
| Chicago | 0.53 | −0.28 | 0.21 | −0.045 | 0.98 |
| Seattle | 0.57 | −0.39 | 0.14 | −0.09 | 0.98 |
| Mean | 0.47 | −0.31 | 0.17 | −0.27 | 0.97 |
© 2020 by the authors. Licensee MDPI, Basel, Switzerland. This article is an open access article distributed under the terms and conditions of the Creative Commons Attribution (CC BY) license (http://creativecommons.org/licenses/by/4.0/).
Share and Cite
Firozjaei, M.K.; Fathololoumi, S.; Weng, Q.; Kiavarz, M.; Alavipanah, S.K. Remotely Sensed Urban Surface Ecological Index (RSUSEI): An Analytical Framework for Assessing the Surface Ecological Status in Urban Environments. Remote Sens. 2020, 12, 2029. https://doi.org/10.3390/rs12122029
Firozjaei MK, Fathololoumi S, Weng Q, Kiavarz M, Alavipanah SK. Remotely Sensed Urban Surface Ecological Index (RSUSEI): An Analytical Framework for Assessing the Surface Ecological Status in Urban Environments. Remote Sensing. 2020; 12(12):2029. https://doi.org/10.3390/rs12122029
Chicago/Turabian StyleFirozjaei, Mohammad Karimi, Solmaz Fathololoumi, Qihao Weng, Majid Kiavarz, and Seyed Kazem Alavipanah. 2020. "Remotely Sensed Urban Surface Ecological Index (RSUSEI): An Analytical Framework for Assessing the Surface Ecological Status in Urban Environments" Remote Sensing 12, no. 12: 2029. https://doi.org/10.3390/rs12122029
APA StyleFirozjaei, M. K., Fathololoumi, S., Weng, Q., Kiavarz, M., & Alavipanah, S. K. (2020). Remotely Sensed Urban Surface Ecological Index (RSUSEI): An Analytical Framework for Assessing the Surface Ecological Status in Urban Environments. Remote Sensing, 12(12), 2029. https://doi.org/10.3390/rs12122029