Using ALS Data to Improve Co-Registration of Photogrammetry-Based Point Cloud Data in Urban Areas

 ,
,
Abstract
:
1. Introduction
- Can an ALS-based digital terrain model (DTM) be used to realign DAP-based point clouds consistently?
- If so, what are the quantified improvements seen in such point clouds?
2. Materials and Methods
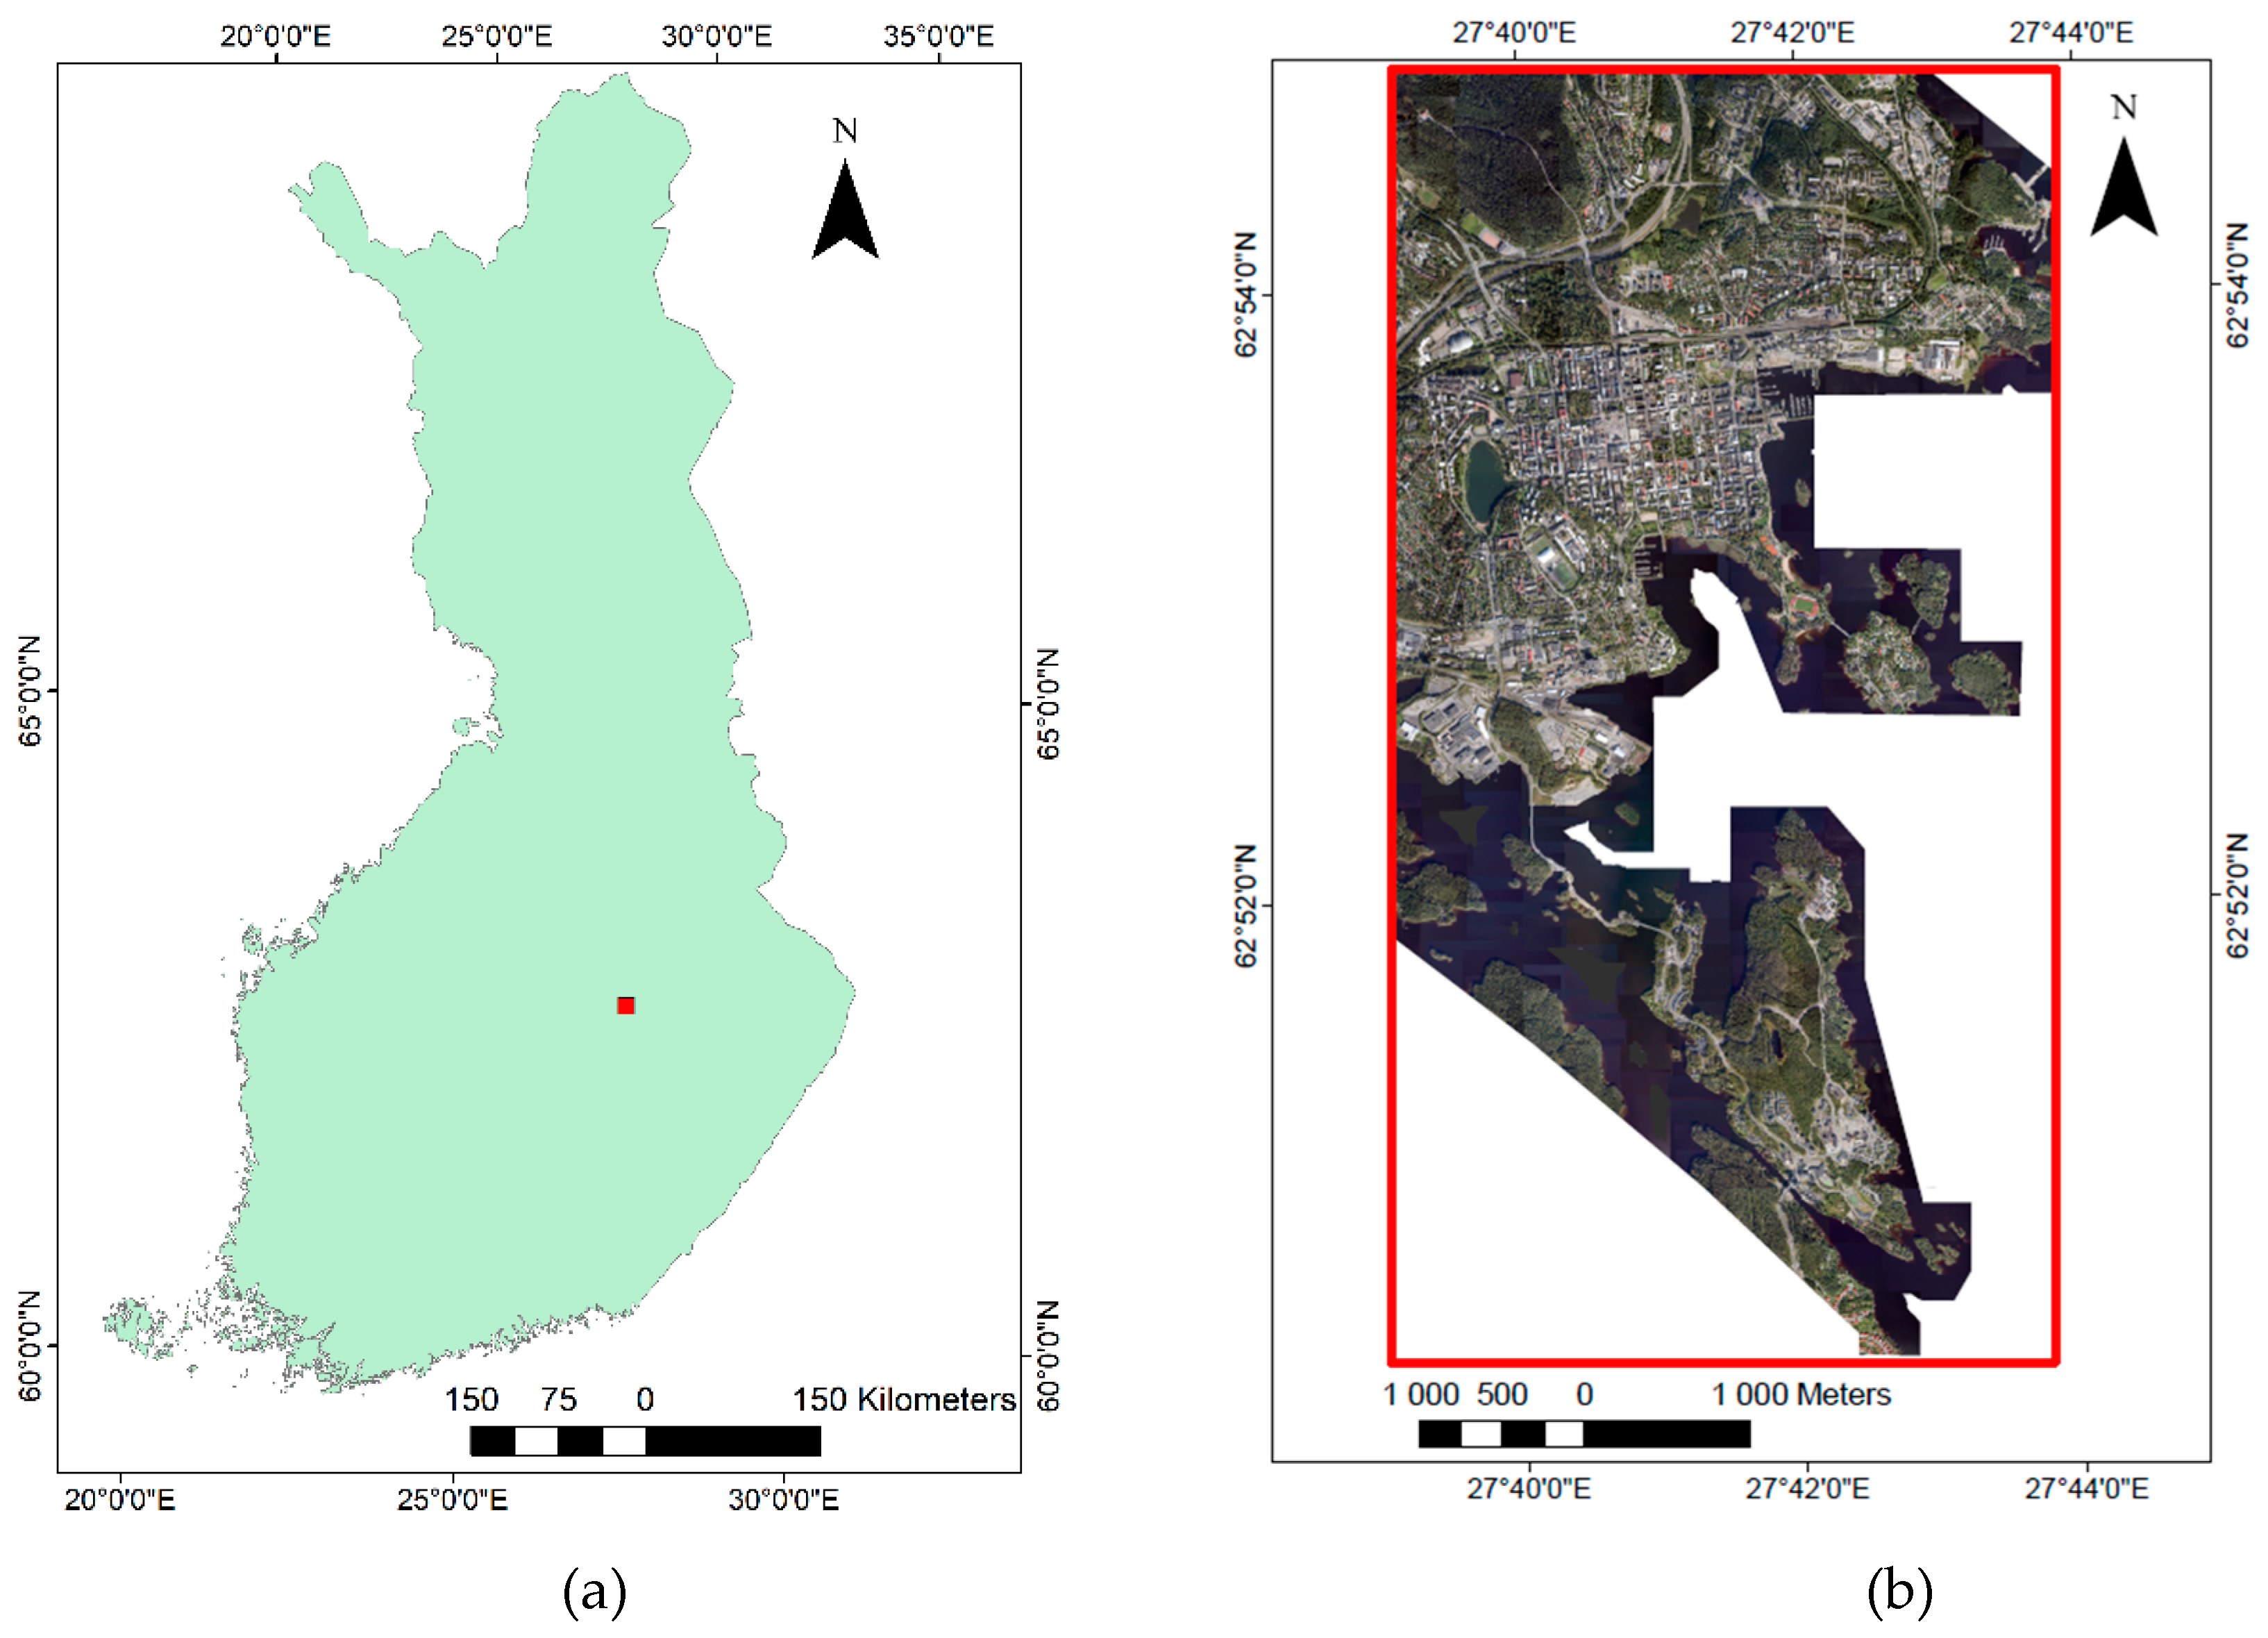
2.1. Study Area
2.2. Remote Sensing Datasets
Creation of Image Point Clouds
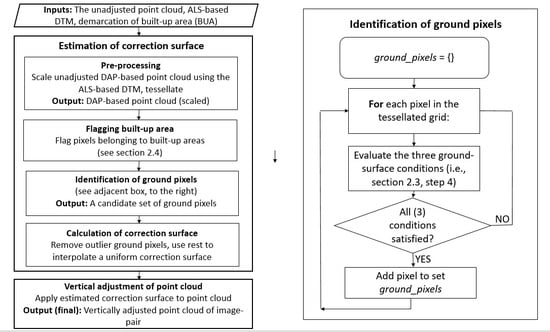
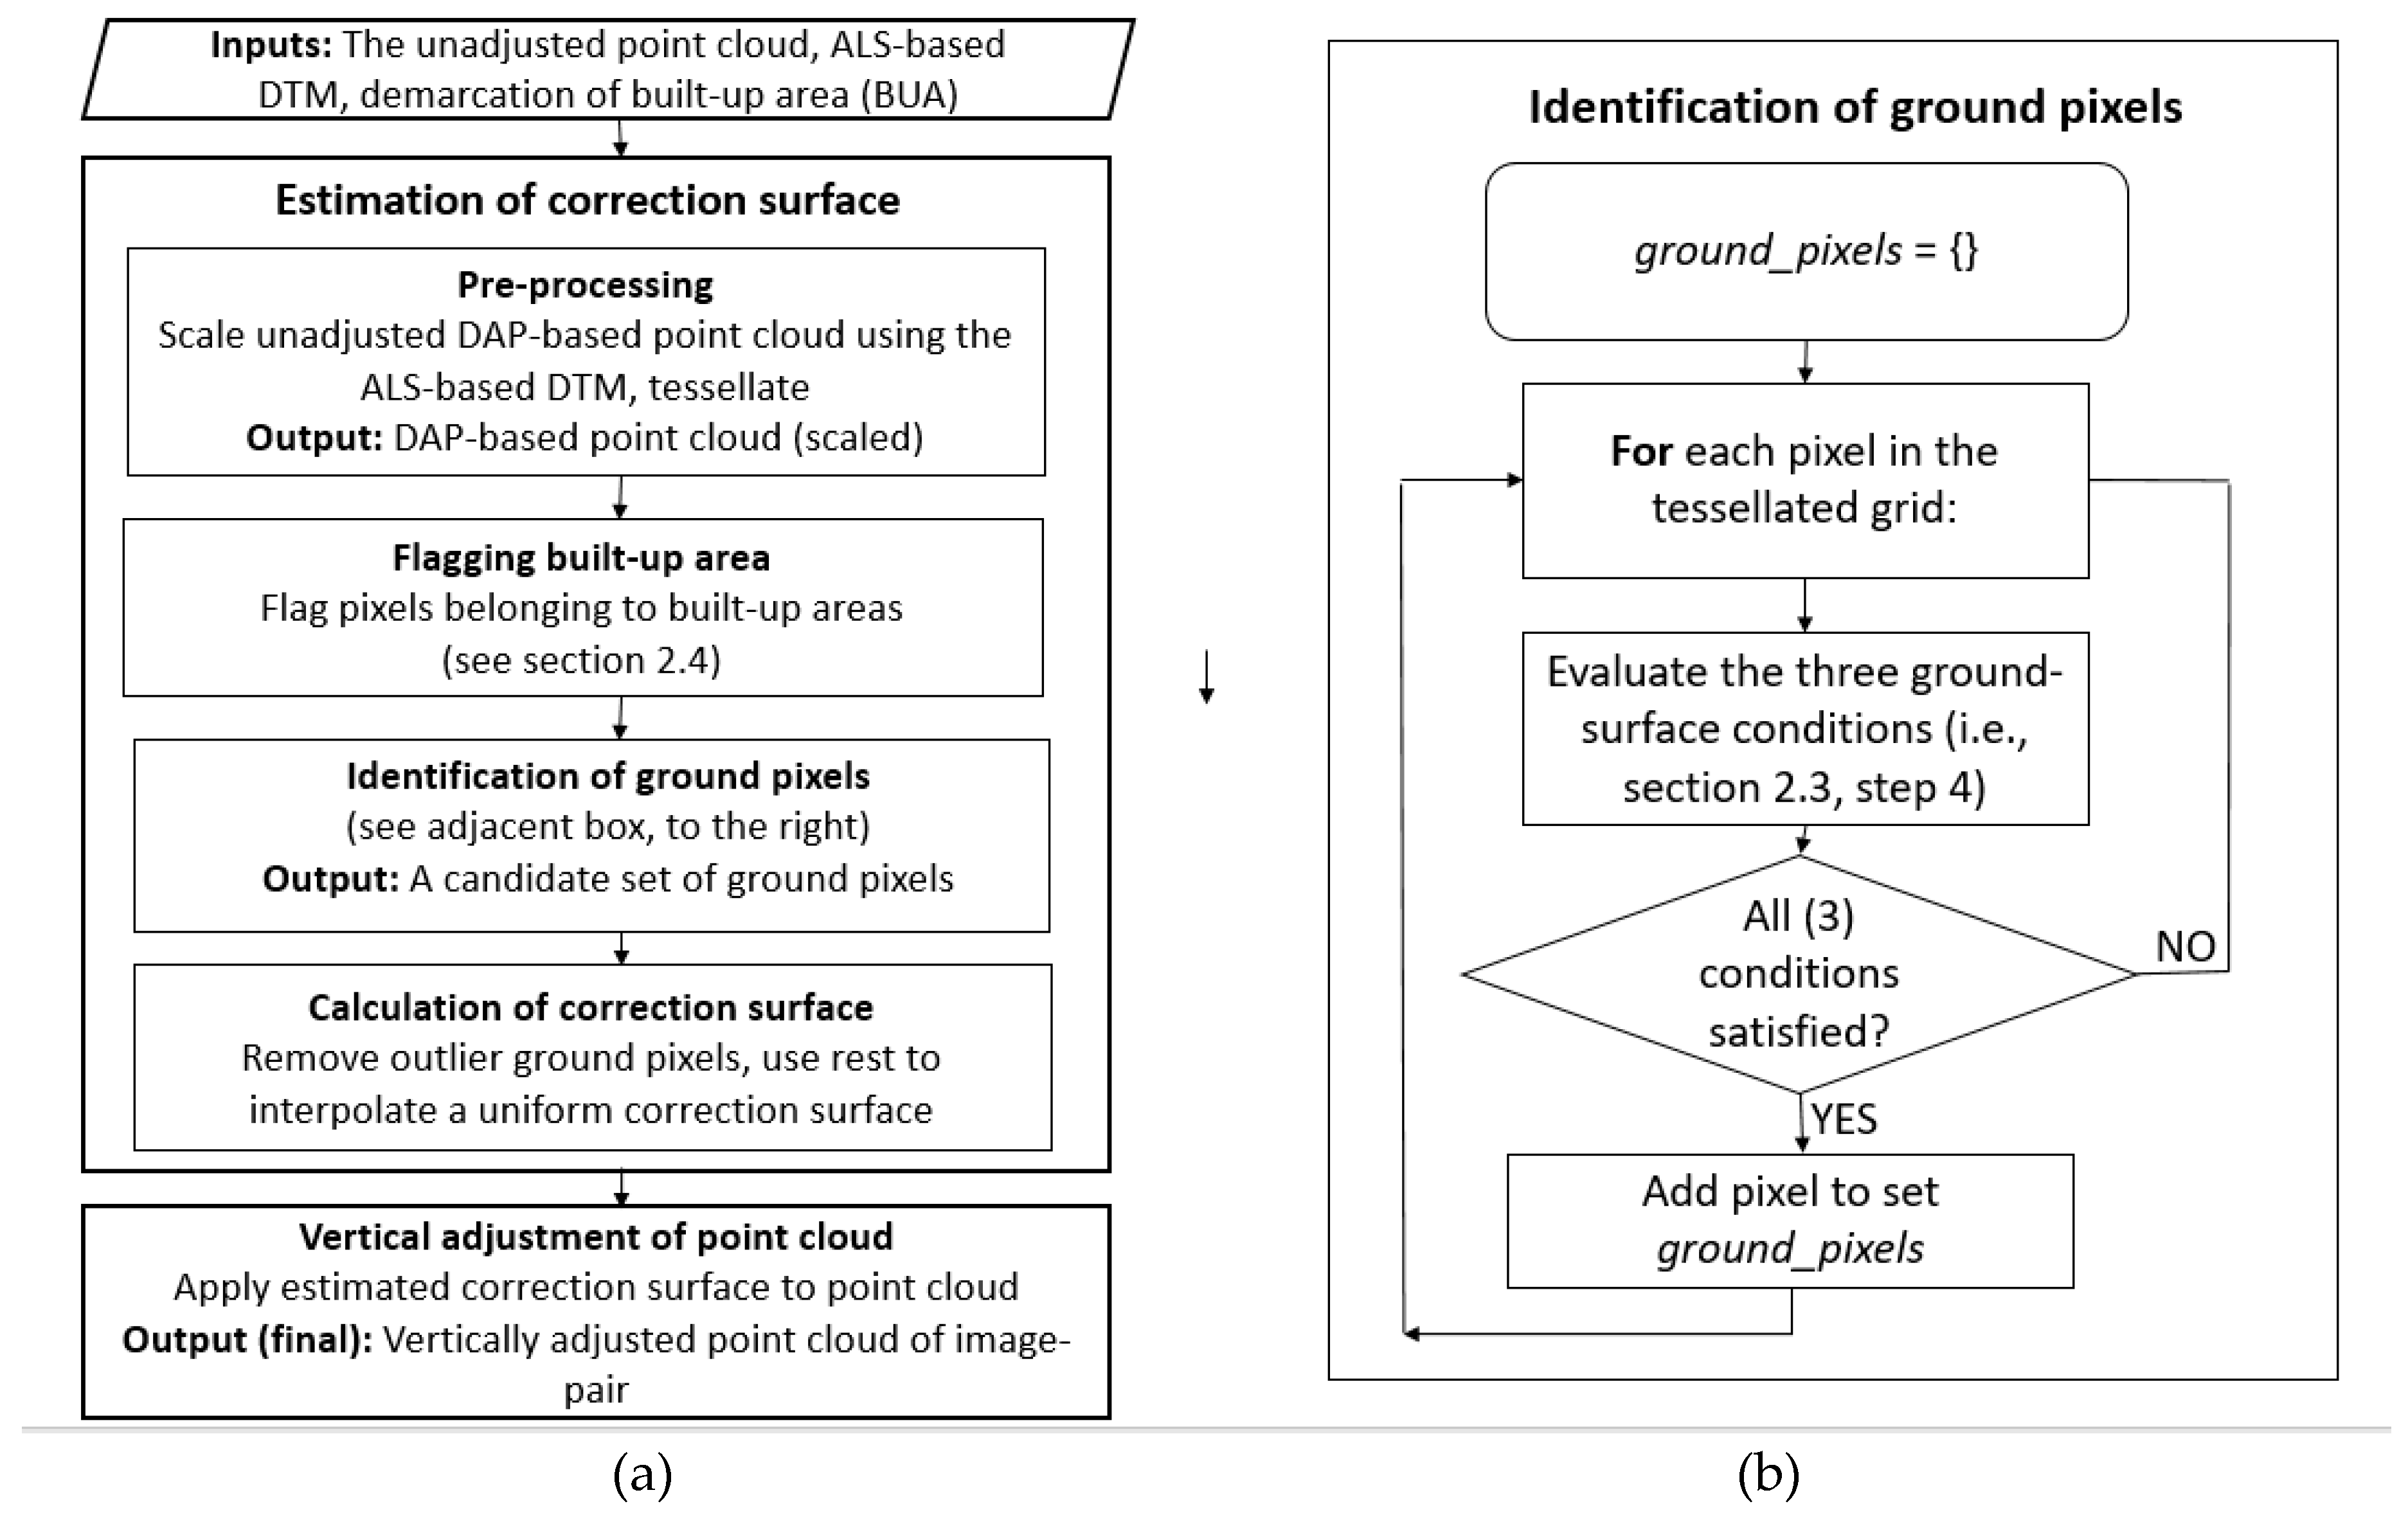
2.3. Height Adjustment Algorithm
- The unadjusted DAP-based point cloud data.
- The ALS-based DTM of the area.
- Demarcation of built-up area (BUA) for the area in consideration (e.g., a GIS-vector representation).
- The pixel size (pixel_size).
- The standard deviation threshold (SDmax).
- The minimum number of points threshold (npmin).
- Ground pixel outlier detection threshold (zcorrmax).
- The adjusted DAP-based point cloud data.
- The elevations of the unadjusted DAP-based points (ZDAP) are scaled so that they are now relative to the ALS ground level (∆ZDAP). This is done by subtracting the (ALS-based) DTM from the DAP point clouds z values.
- A user-defined pixel size (pixel_size) was used to tessellate the spatial extend of the point cloud into a regular square-grid.
- Grid-elements (pixels) that belong to buildings and similar structures are labelled as ‘built-up area’ (BUA) pixels. This is done using the ‘demarcation of built-up area (BUA)’ layer. This is elaborated further in Section 2.4.
- Each grid-element (pixel) of this tessellated grid was examined as to whether it would qualify as a ground pixel (i.e., a pixel that represents a patch of ground) or not. This was done by the following three criteria:
- It should not be labelled as a BUA pixel (see step 3 above).
- The ‘flat surface’ criterion: The standard deviation of vertical heights of the set of points must be below a user-specified threshold (SDmax).
- The number of (point cloud) points in the pixel should be greater than a user-defined value npmin.
In this step, criteria (a) and (b) helps us identify flat surfaces that are not the tops of buildings and such structures, while (c) is for avoiding spurious ground points. Hence, there is high likelihood that these would be ground surface patches. This step is implemented by using a for-loop and looping through and examining all pixels in the area under consideration. - Then, we compute a ‘vertical correction estimate’ (∆ZCGP, correction to ground pixel) for each such identified ground pixel:where ∆ZDAP is the set of Z values of (point cloud) points in that (ground) pixel.∆ZCGP = mean(∆ZDAP)
- We then iteratively trim the list of candidates of DAP-based point cloud ground pixels identified in the above steps using the following criteria:
- Drop candidate ground pixels which specify too high absolute correction values (i.e., abs(∆ZCGP) > zcorrmax).
- Compute the vertical displacement difference between the highest and lowest candidate ground pixels. If this is greater than a user-defined threshold (hdiffmax), then both those candidate ground pixels are dropped. This is mainly to exclude points which are either too high (such as tree top points) or too low (noise-related below-ground artifacts) from being selected as spurious ground points.
- We interpolate a raster (∆ZCOR) representing a correction surface for the full spatial extend of the original DAP-based point cloud from these set of ∆ZCGP points. This interpolation surface is computed using Delaunay triangulation (linear interpolation inside triangles) followed by Gaussian filtering using a user-specified sigma value.
- The Z value of each point in the point cloud is corrected (adjusted) as follows:where ZADJ is the adjusted height of the point, ZDAP is the original height of the point and ∆ZCOR is the value of the correction surface raster at that point.ZADJ = ZDAP − ∆ZCOR
2.4. Built-Up Area (BUA) Exclusion
2.5. Evaluation of Efficacy of Algorithm
- After the examination of several areas in and around the city, the pixel size for flat area detection and correction raster generation (pixel_size) was fixed at 3.0 m.
- The standard deviation threshold (SDmax) was set to 0.2 m. This was done after examining several vertical profiles of ground patches. Most of the points for these samples fell within ±0.5 m from the mean.
- The value of npmin was set to 10. This was done after realizing that pixels with less than ten points were mostly erroneously classified.
- Meanwhile, the value of zcorrmax was set to 100.0 m. This was done after some initial runs, and realizing that some outlier points (displaced more than 100 m) need to be filtered off.
- The building exclusion step was done using a built-up area shapefile obtained from the National Land Survey of Finland (NLS), based on data collected in 2016.
3. Results
4. Discussion
5. Conclusions
Author Contributions
Funding
Acknowledgments
Conflicts of Interest
References
- Seto, K.C.; Fragkias, M.; Güneralp, B.; Reilly, M.K. A meta-analysis of global urban land expansion. PLoS ONE 2011, 6, e23777. [Google Scholar] [CrossRef] [PubMed]
- Zhu, Z.; Zhou, Y.; Seto, K.C.; Stokes, E.C.; Deng, C.; Pickett, S.T.; Taubenböck, H. Understanding an urbanizing planet: Strategic directions for remote sensing. Remote Sens. Environ. 2019, 228, 164–182. [Google Scholar] [CrossRef]
- Grimm, N.B.; Faeth, S.H.; Golubiewski, N.E.; Redman, C.L.; Wu, J.; Bai, X.; Briggs, J.M. Global change and the ecology of cities. science 2008, 319, 756–760. [Google Scholar] [CrossRef] [PubMed] [Green Version]
- Seto, K.C.; Dhakal, S.; Bigio, A.; Blanco, H.; Delgado, G.C.; Dewar, D.; Huang, L.; Inaba, A.; Kansal, A.; Lwasa, S. Human settlements, infrastructure and spatial planning. In Climate Change 2014: Mitigation of Climate Change. Contribution of Working Group III to the Fifth Assessment Report of the Intergovernmental Panel on Climate Change; Cambridge University Press: Cambridge, UK; New York, NY, USA, 2014. [Google Scholar]
- McClune, A.P.; Mills, J.P.; Miller, P.E.; Holland, D.A. Automatic 3D building reconstruction from a dense image matching dataset. Int. Arch. Photogramm. Remote Sens. Spat. Inf. Sci. 2016, 41. [Google Scholar]
- Vu, H.-H.; Labatut, P.; Pons, J.-P.; Keriven, R. High accuracy and visibility-consistent dense multiview stereo. IEEE Trans. Pattern Anal. Mach. Intell. 2011, 34, 889–901. [Google Scholar] [CrossRef]
- Marshall, V.J.; Cadenasso, M.L.; McGrath, B.P.; Pickett, S.T. Patch Atlas: Integrating Design Principles and Ecological Knowledge for Cities as Complex Systems; Yale University Press: Cumberland, RI, USA, 2020. [Google Scholar]
- Vosselman, G.; Maas, H.-G. Airborne and Terrestrial Laser Scanning; CRC Press: Boca Raton, FL, USA, 2010. [Google Scholar]
- Snavely, N.; Seitz, S.M.; Szeliski, R. Photo tourism: Exploring photo collections in 3D. In ACM Siggraph 2006 Papers; Association for Computing Machinery (ACM): New York, NY, USA, 2006; pp. 835–846. [Google Scholar]
- Hirschmuller, H. Stereo processing by semiglobal matching and mutual information. IEEE Trans. Pattern Anal. Mach. Intell. 2008, 30, 328–341. [Google Scholar] [CrossRef] [PubMed]
- Zhang, B.; Miller, S.; Walker, S.; DeVenencia, K. Next generation automatic terrain extraction using Microsoft ultracam imagery. In Proceedings of the ASPS 2007 Annual Conference, Tampa, FL, USA, 7–11 May 2007. [Google Scholar]
- Zhou, K.; Meng, X.; Cheng, B. Review of Stereo Matching Algorithms Based on Deep Learning. Comput. Intell. Neurosci. 2020, 2020. [Google Scholar] [CrossRef]
- Widyaningrum, E.; Gorte, B.G.H. Comprehensive comparison of two image-based point clouds from aerial photos with airborne LiDAR for large-scale mapping. Int. Arch. Photogramm. Remote Sens. Spat. Inf. Sci. 2017, 42, 557–565. [Google Scholar] [CrossRef] [Green Version]
- Nex, F.; Gerke, M. Photogrammetric DSM denoising. The International Archives of Photogrammetry, Remote Sensing and Spatial Information Sciences 2014, 40, 231. [Google Scholar] [CrossRef] [Green Version]
- Zhu, Q.; Li, Y.; Hu, H.; Wu, B. Robust point cloud classification based on multi-level semantic relationships for urban scenes. Isprs J. Photogramm. Remote Sens. 2017, 129, 86–102. [Google Scholar] [CrossRef]
- Hu, H.; Chen, C.; Wu, B.; Yang, X.; Zhu, Q.; Ding, Y. Texture-aware dense image matching using ternary census transform. In Proceedings of the ISPRS Annals of the Photogrammetry, Remote Sensing and Spatial Information Sciences, Volume III-3, 2016 XXIII ISPRS Congress, Prague, Czech Republic, 12–19 July 2016. [Google Scholar]
- Huhle, B.; Schairer, T.; Jenke, P.; Straßer, W. Robust non-local denoising of colored depth data. In Proceedings of the 2008 IEEE Computer Society Conference on Computer Vision and Pattern Recognition Workshops, Anchorage, AK, USA, 23–28 June 2008; pp. 1–7. [Google Scholar]
- Fua, P.; Sander, P. Reconstructing surfaces from unstructured 3d points. In Proceedings of the Second European Conference on Computer Vision (ECCV’90), Santa Margherita Ligure, Italy, 19–22 May 1992. [Google Scholar]
- Wang, J.; Yu, Z.; Zhu, W.; Cao, J. Feature-preserving surface reconstruction from unoriented, noisy point data. Comput. Gr. Forum 2013, 32, 164–176. [Google Scholar] [CrossRef]
- Ali-Sisto, D.; Gopalakrishnan, R.; Kukkonen, M.; Savolainen, P.; Packalen, P. A method for vertical adjustment of digital aerial photogrammetry data by using a high-quality digital terrain model. Int. J. Appl. Earth Obs. Geoinf. 2020, 84, 101954. [Google Scholar] [CrossRef]
- White, J.C.; Wulder, M.A.; Vastaranta, M.; Coops, N.C.; Pitt, D.; Woods, M. The utility of image-based point clouds for forest inventory: A comparison with airborne laser scanning. Forests 2013, 4, 518–536. [Google Scholar] [CrossRef] [Green Version]
- Gopalakrishnan, R.; Seppänen, A.; Kukkonen, M.; Packalen, P. Utility of image point cloud data towards generating enhanced multitemporal multisensor land cover maps. Int. J. Appl. Earth Obs. Geoinf. 2020, 86, 102012. [Google Scholar] [CrossRef]
- Zhang, Z.; Liu, X. Support vector machines for tree species identification using LiDAR-derived structure and intensity variables. Geocarto Int. 2013, 28, 364–378. [Google Scholar] [CrossRef]
- Axelsson, P. DEM generation from laser scanner data using adaptive TIN models. Int. Arch. Photogramm. Remote Sens. 2000, 33, 111–118. [Google Scholar]
- Li, W.; Zhou, W.; Bai, Y.; Pickett, S.T.; Han, L. The smart growth of Chinese cities: Opportunities offered by vacant land. Land Degrad. Dev. 2018, 29, 3512–3520. [Google Scholar] [CrossRef]
- Pepe, M.; Prezioso, G.; Santamaria, R. Impact of vertical deflection on direct georeferencing of airborne images. Surv. Rev. 2015, 47, 71–76. [Google Scholar] [CrossRef]
- Grejner-Brzezinska, D.A.; Yi, Y.; Toth, C.; Anderson, R.; Davenport, J.; Kopcha, D.; Salman, R. On improved gravity modeling supporting direct georeferencing of multisensor systems. Proc. Int. Soc. Photogramm. Remote Sens 2004, 35, 908–913. [Google Scholar]
- Ahmadi, S.; Zoej, M.V.; Ebadi, H.; Moghaddam, H.A.; Mohammadzadeh, A. Automatic urban building boundary extraction from high resolution aerial images using an innovative model of active contours. Int. J. Appl. Earth Obs. Geoinf. 2010, 12, 150–157. [Google Scholar] [CrossRef]
- Aldred, D.A.; Wang, J. A method for obtaining and applying classification parameters in object-based urban rooftop extraction from VHR multispectral images. Int. J. Remote Sens. 2011, 32, 2811–2823. [Google Scholar] [CrossRef]
- Vu, T.T.; Yamazaki, F.; Matsuoka, M. Multi-scale solution for building extraction from LiDAR and image data. Int. J. Appl. Earth Obs. Geoinf. 2009, 11, 281–289. [Google Scholar] [CrossRef]
- Wang, J.; Lehrbass, B.; Zeng, C. Urban Building Mapping using LiDAR and Relief-Corrected Colour-Infrared Aerial Images. In Proceedings of the 34th International Symposium on Remote Sensing of Environment, Sydney, Australia, 10–15 April 2011; pp. 10–15. [Google Scholar]


| Urban | Suburban | Vegetated (Parks, Urban Forests) | |
|---|---|---|---|
| Proportion of area with decreased standard deviation, % | 70.1 | 72.0 | 60.0 |
| Proportion of area with decreased 95% interquantile range, % | 81.0 | 83.8 | 69.5 |
© 2020 by the authors. Licensee MDPI, Basel, Switzerland. This article is an open access article distributed under the terms and conditions of the Creative Commons Attribution (CC BY) license (http://creativecommons.org/licenses/by/4.0/).
Share and Cite
Gopalakrishnan, R.; Ali-Sisto, D.; Kukkonen, M.; Savolainen, P.; Packalen, P. Using ALS Data to Improve Co-Registration of Photogrammetry-Based Point Cloud Data in Urban Areas. Remote Sens. 2020, 12, 1943. https://doi.org/10.3390/rs12121943
Gopalakrishnan R, Ali-Sisto D, Kukkonen M, Savolainen P, Packalen P. Using ALS Data to Improve Co-Registration of Photogrammetry-Based Point Cloud Data in Urban Areas. Remote Sensing. 2020; 12(12):1943. https://doi.org/10.3390/rs12121943
Chicago/Turabian StyleGopalakrishnan, Ranjith, Daniela Ali-Sisto, Mikko Kukkonen, Pekka Savolainen, and Petteri Packalen. 2020. "Using ALS Data to Improve Co-Registration of Photogrammetry-Based Point Cloud Data in Urban Areas" Remote Sensing 12, no. 12: 1943. https://doi.org/10.3390/rs12121943
APA StyleGopalakrishnan, R., Ali-Sisto, D., Kukkonen, M., Savolainen, P., & Packalen, P. (2020). Using ALS Data to Improve Co-Registration of Photogrammetry-Based Point Cloud Data in Urban Areas. Remote Sensing, 12(12), 1943. https://doi.org/10.3390/rs12121943