Clear-Sky Surface Solar Radiation and the Radiative Effect of Aerosol and Water Vapor Based on Simulations and Satellite Observations over Northern China

1
School of Electronic Science and Engineering (National Exemplary School of Microelectronics), University of Electronic Science and Technology of China, Chengdu 611731, China
2
State Key Laboratory of Information Engineering in Surveying, Mapping and Remote Sensing, Wuhan University, Wuhan 430079, China
3
Collaborative Innovation Center for Geospatial Technology, Wuhan 430079, China
*
Author to whom correspondence should be addressed.
Remote Sens. 2020, 12(12), 1931; https://doi.org/10.3390/rs12121931
Submission received: 3 May 2020
/
Revised: 7 June 2020
/
Accepted: 11 June 2020
/
Published: 15 June 2020
(This article belongs to the Special Issue Remote Sensing Monitoring Aerosols and Its Effects on Atmospheric Radiation)
Abstract
:The distribution and trend of clear-sky surface solar radiation (SSR) and the quantitative effects of aerosol and water vapor are investigated in northern China during 2001–2015 using radiation simulations and satellite observations. Clear-sky SSR in northern China is high in summer and low in winter, which is dominated by astronomical factors and strongly modulated by the seasonal variations of radiative effects of aerosol (ARE) and water vapor (WVRE). The larger variation of WVRE than ARE indicates that water vapor plays a more important role in moderating the seasonal variation of clear-sky SSR. Clear-sky SSR shows an overall decreasing trend of –0.12 W/m2 per year, with decrease more strongly than –0.60 W/m2 per year in west-central Shandong and increase (about 0.40 W/m2) in south-central Inner Mongolia. The consistency of spatial distribution and high correlation between clear-sky SSR and ARE trend indicate that the clear-sky SSR trend is mainly determined by aerosol variation. Dust mass concentration decreases about 16% in south-central Inner Mongolia from 2001 to 2015, resulting in the increase in clear-sky SSR. In contrast, sulfate aerosol increases about 92% in west-central Shandong, leading to the decreasing trend of clear-sky SSR.
1. Introduction
Solar radiation reaching the Earth’s surface, also known as the surface solar radiation (SSR), is the primary energy source for life on the planet [1,2]. It drives the majority of the terrestrial processes (e.g., the carbon cycle and hydrological cycle) and plays a crucial role in a large number of sectors (e.g., agriculture and solar energy production) [3,4,5]. In the past decade, the role of solar energy in the global energy transformation has increased rapidly. The percentage of solar power in global electricity generation has increased from 0.1% in 2008 to 2.2% in 2018 [6].
SSR is controlled by many factors such as solar geometries and atmospheric constituents [7,8]. Solar geometries including the Earth–Sun distance and the solar zenith angle determine solar radiation reaching the top of the atmosphere and drive the seasonal and diurnal variations of SSR [9,10]. Solar radiation is modulated by atmospheric constituents as it passes through the atmosphere. Cloud has been regarded as a key modulator of solar radiation in the atmosphere. Previous studies have found that the reduction in solar radiation from the 1960s to the 1980s at many sites coincides with the increase of cloud cover [11,12]. However, cloud change cannot always explain the variation of SSR. Most regions in China have experienced simultaneous decrease of cloud cover and SSR from 1960s to 1990s [13,14], which indicates the important role of other atmospheric constituents except for clouds. Some important efforts have been made to separate SSR variation into cloudy-sky and clear-sky conditions to exclude effects of cloud cover and cloud properties on solar radiation and highlight the effects of other atmospheric constituents [15,16]. Under clear-sky conditions, solar radiation is modulated by aerosol, water vapor, and radiative active gases, in which aerosol and water vapor exert the most important effects on solar radiation [7,17]. Depending on its composition, aerosols can absorb or scatter solar radiation, thus reducing solar radiation reaching the surface [18,19]. In addition, a great number of aerosol particles act as cloud condensation nuclei and affect cloud properties and lifetime [20,21]. In the past few decades, many studies have been conducted to analyze the effect of aerosols on SSR in regional and global scales [22,23,24,25,26]. Water vapor strongly absorbs solar shortwave radiation in some bands with wavelengths larger than 700 nm, which has an important influence on SSR, especially in regions and seasons with abundant water vapor. Some previous studies have made quantitative analyses on the radiative effect of water vapor [27,28,29,30]. The roles that aerosol and water vapor play in the seasonal and inter-annual variations of SSR are still uncertain, considering the huge disparities of spatial and temporal distributions of aerosol and water vapor among regions.
Northern China is a major economic zone in China and East Asia. Over the past few decades, northern China has experienced rapid industrialization and urbanization, which resulted in tremendous increase in the consumption of fossil fuel and in the emission of pollutants and anthropogenic aerosol in the atmosphere [31,32]. It also suffers from long-distance transported dust aerosol from northwest China, especially in spring [33]. Influenced by the complex topography and Asian monsoon, the seasonal variation and spatial distribution of water vapor differ widely in different areas of northern China [34]. Some studies have analyzed the aerosol radiative effect based on models and site observations in northern China [35,36], which have provided information on the spatial and temporal variation of ARE. Song et al. (2018) investigated the daytime variation of aerosol optical on aerosol direct radiative effects in northern China [36]. Che et al. (2014) studied the column aerosol optical properties and aerosol radiative forcing during a serious haze-fog month over the North China Plain in 2013 [37]. However, knowledge about the role of water vapor in clear-sky SSR variation is still lacking, and a comprehensive and quantitative analysis on the roles of water vapor and aerosol in the seasonal and inter-annual variation of SSR is imperative.
This study simulates clear-sky SSR in northern China from 2001 to 2015 based on the Mesoscale Atmospheric Global Irradiance Code (MAGIC), and data from satellite observations and atmospheric reanalysis products. The aerosol direct radiative effect (ARE) and water vapor radiative effect (WVRE) are also calculated based on simulations assuming no aerosol and no water vapor, respectively. The temporal and spatial distribution of clear-sky SSR in northern China is then investigated and the roles of aerosol and water vapor on the seasonal variation and long-term trend of clear-sky SSR are analyzed quantitatively base on the variation of ARE and WVRE. Data and methods used in this study are shown in Section 2, and Section 3 introduces main results of clear-sky SSR variation and discussion on the driving factors.
In this study, the months of year have been divided into four seasons, namely spring (March, April, and May), summer (June, July, and August), autumn (September, October, and November), and winter (December, January, and February).
2. Materials and Methods
2.1. Data
The satellite measurements of aerosol properties are taken from the Terra’s Moderate Resolution Imaging Spectroradiometer (MODIS) sensor, which monitors the Earth’s surface in 36 channels from 0.41 μm to 14.4 μm with near-daily global coverage and moderate resolution [38]. The MODIS C6 product includes aerosol optical depth (AOD) using refined retrieval algorithm [39] and provides a combined dataset, combining the DT and DB data. The resultant merged AOD field is more spatially complete than either the DB or DT AOD fields [40], which provides extended spatial coverage and is important for investigating aerosol loading over areas with complex topography and underlying surface in North China. We use the combined Dark Target and Deep Blue product from Terra MODIS Level-3 monthly data in 1° × 1° resolution. Ruiz-Arias (2013) assessed the Level-3 MODIS AOD against more than 500 AERONET ground stations around the globe and the root mean square error is 0.14 [41].
Single scattering albedo (SSA) used for solar radiation modeling come from the Kinne aerosol climatology, which is developed based on merging of data from Aerosol Comparisons between Observations and Models (AEROCOM) global modeling and ground measurements from the Aerosol Robotic Network (AERONET) [42,43,44]. The Kinne aerosol climatology contains monthly SSA data in 1° × 1° resolution with RMSE of 0.06 in comparison with SSA from AERONET [42].
The water vapor data is obtained from the ERA-Interim data, which is a global atmospheric reanalysis data provided by the European Centre for Medium-Range Weather Forecasting (ECMWF). The data provides meteorological parameters such as surface temperature, soil temperature, and relative humidity [45]. The ERA-Interim data used here is the monthly water vapor with a spatial resolution of 0.25° × 0.25°. The RMSE of water vapor is 2.8 kg/m2 in comparison with radiosonde observations [46].
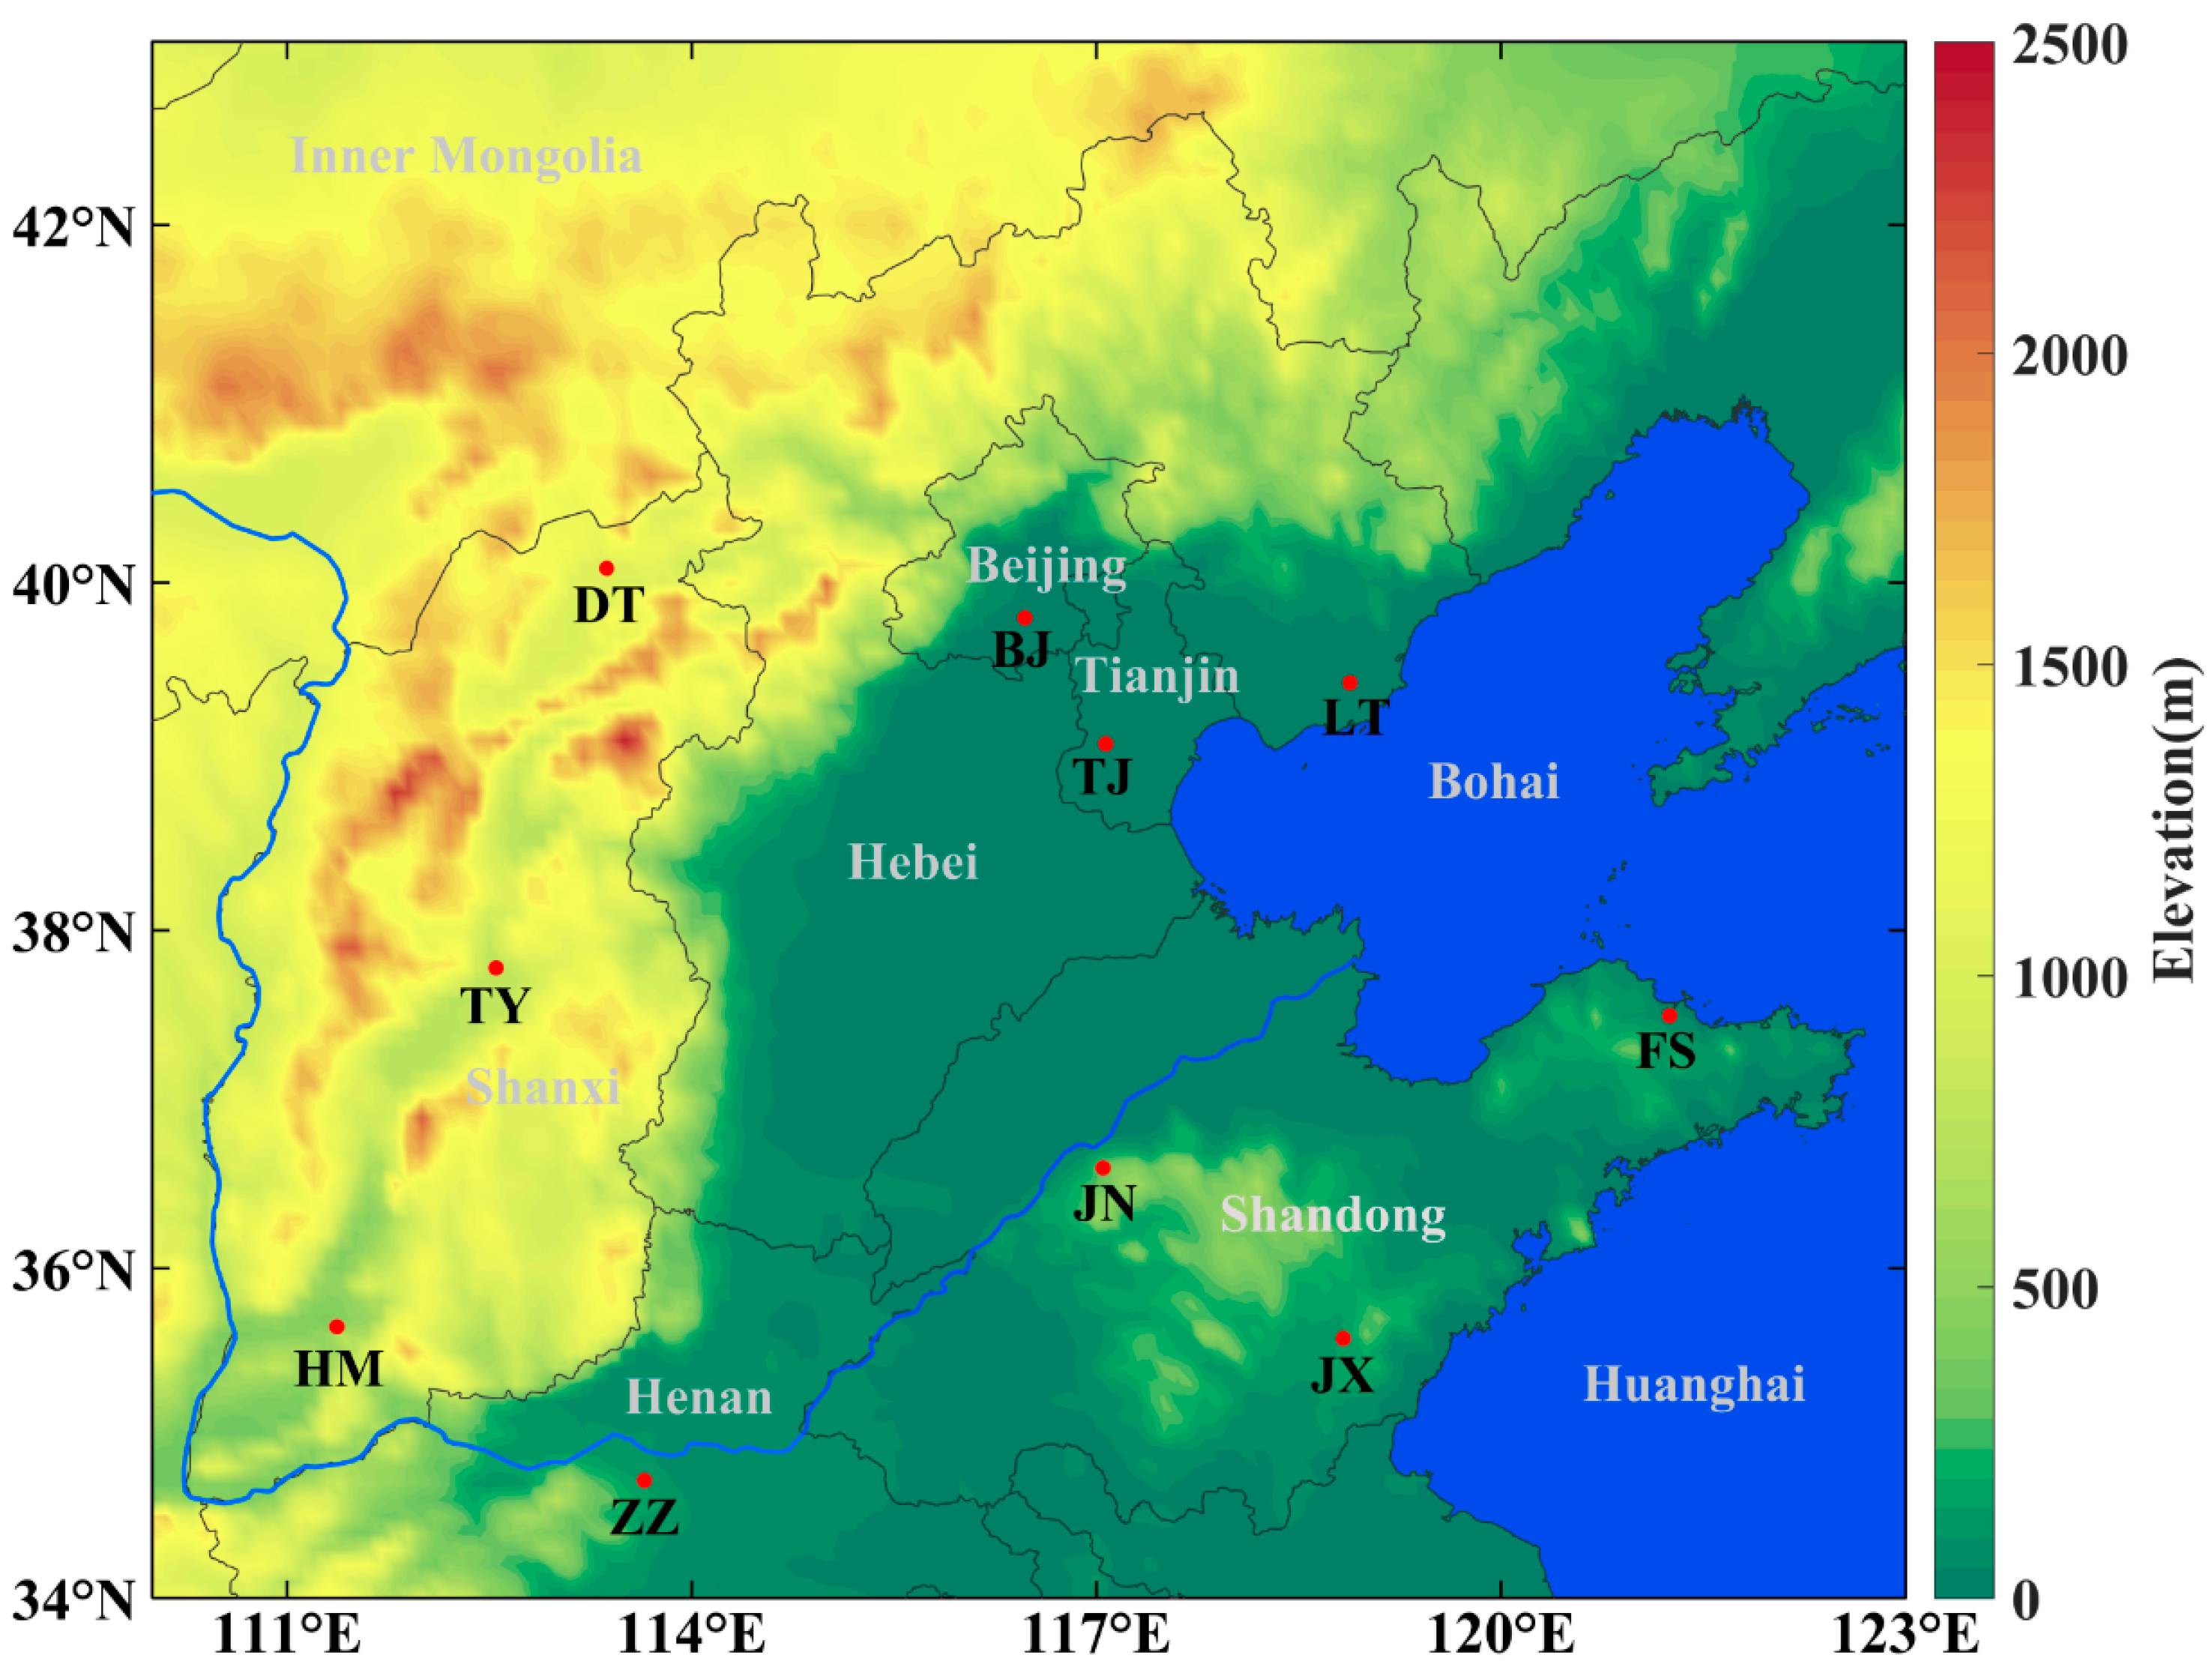
The solar radiation data in ground observation stations is from the daily data set of basic elements of meteorological radiation in China provided by the National Meteorological Information Center. SSR from 10 stations during 2001–2015 is used to validate the modeled SSR in this study, and the locations of these stations are shown in Figure 1.
Aerosol data from the second Modern-Era Retrospective analysis for Research and Applications (MERRA-2) is also used. MERRA-2 product is an atmospheric reanalysis provided by the NASA Global Modeling and Assimilation Office (GMAO) [47,48]. In this study, the surface aerosol mass concentration data with a spatial resolution of 0.625° × 0.5° from the “tavgM_2d_aer_Nx” dataset is used to analyze the influence of aerosol compositions on clear-sky SSR variation.
2.2. Methodology
2.2.1. Simulation of Clear-Sky SSR and Calculation of ARE and WVRE
In this study, the clear-sky SSR is simulated using MAGIC [49], which is based on radiation simulated by a Radiative Transfer Model (RTM) and stored in look-up tables to improve the computing efficiency. It assumes plane atmosphere and uses the modified Lambert function for each wavelengths under cloud-free conditions [49].The RTM model libRadtran [50] has been used for the extensive analysis of the interaction between radiation and the atmosphere and the computation of the LUTs. All RTM calculations for LUTs establishment are performed for the US standard atmosphere, which provides vertical information on the total number density of atmospheric constituents. The clear-sky SSR is simulated with input of aerosol properties from MODIS product and Kinne aerosol climatology, water vapor from ERA-Interim water vapor and surface albedo from the Surface and Radiation Budget/Clouds and the Earth’s Radiant Energy System (SARB/CERES) [51]. The clear-sky SSR assuming conditions without aerosol and without water vapor is then simulated by adjusting the extinction of aerosol and water vapor to zero, respectively, remaining other inputs unchanged. All the simulations are conducted in time interval of 15 min and resolution of 0.5° × 0.5°. The instantaneous ARE () and WVRE () is calculated as follows:
where is the clear-sky solar flux including aerosol and water vapor, is the clear-sky solar flux without aerosol and with water vapor, and is the clear-sky solar flux with aerosol and without water vapor. Then, the daily ARE () and WVRE () are calculated by the integration of the instantaneous data over 24 h:
The trends of clear-sky SSR, ARE, and WVRE are calculated based on their monthly mean values. In order to eliminate the great influence of seasonal cycle, the data is first deseasonalized by subtracting the seasonal cycle obtained from the harmonic regression [52,53]. The trends (ω) of clear-sky SSR, ARE, and WVRE are then calculated by applying the least-square fit to the deseasonalized time series. The significance of trend is evaluated using the ratio of |ω/σω|, where σω is the standard deviation of the trend [54]. The trend is regarded as significant at the 95% confidential level when |ω/σω| is larger than 2.
2.2.2. Validation of Simulated Clear-Sky SSR
The reliability of simulated clear-sky SSR is validated by comparison with the ground observations. As SSR in stations are observed under all-sky conditions, SSR observations should be distinguished between cloudy and clear-sky conditions. An empirical threshold optimization method is used to select clear-sky conditions from the SSR observations. If the observed daily SSR value exceeds 89% of the clear-sky solar radiation simulated by the MAGIC, a given day can be identified as a clear-sky condition [55]. The threshold for clear-sky situations refers to Bartok (2017) [55], who selected the empirical optimum threshold by testing different thresholds against the clear-sky detection and interpolation algorithm of Long and Ackerman (2000) [56] using the Baseline Surface Radiation Network (BSRN) data. As the consequence, the optimal threshold showing the higher average between clear-sky and all-sky matches is detected to be 89%.
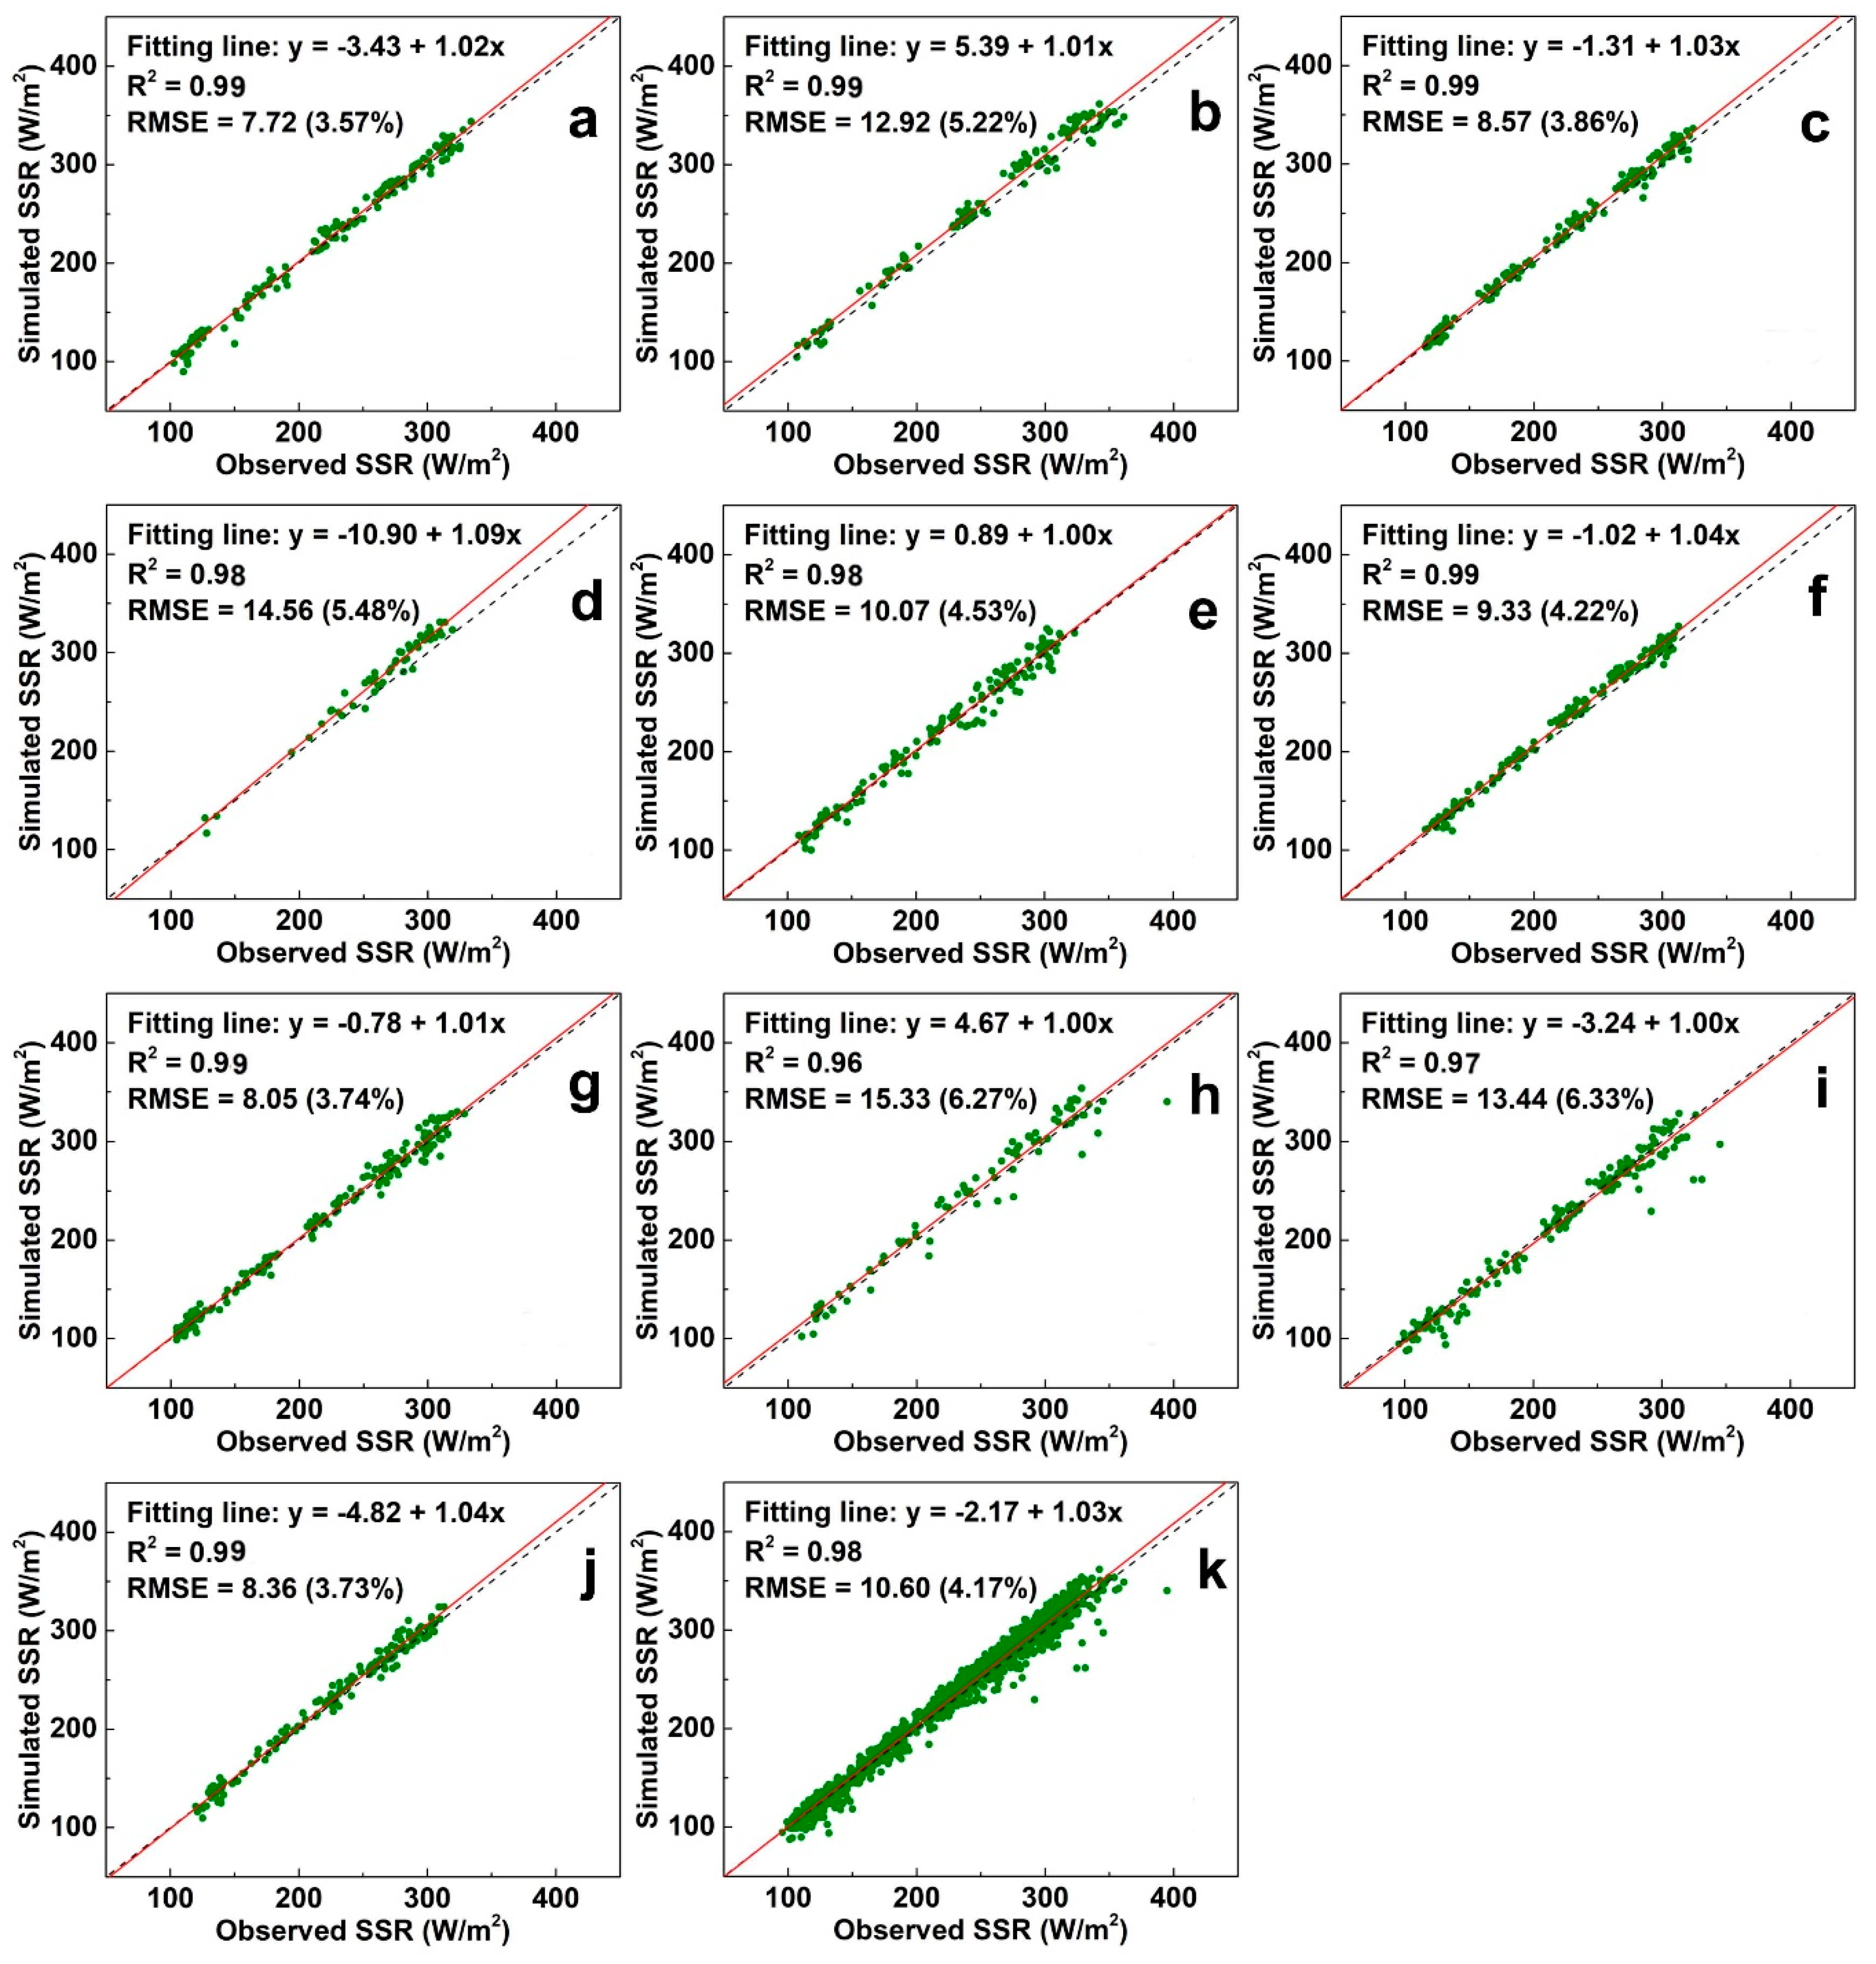
Table 1 and Figure 2 shows the statistical analysis between observed and simulated clear-sky SSR at 10 stations. The overall slope of fitted straight line between observations and simulations at 10 stations is 1.03, the determination coefficient (R2) is 0.98, the mean absolute error (MAE) is 8.13 W/m2 (3.62%), and the root mean square error (RMSE) is 10.60 W/m2 (4.17%). The accuracy of simulation from this study is better than results from Otunla (2019) [57] (RMSE: 15–26%) and Zhang and Wen (2014) [58] (RMSE: 9.6%). R2 in all the stations are higher than 0.96, and MAE range from 6.17–12.98 W/m2. RMSE at nine stations are less than 7% in the Tianjin station. From above, the comparison shows a very good agreement, which confirms the reliability of the simulation in this study.
3. Results
3.1. Spatial Pattern of Clear-Sky SSR and Associated Factors in North China
As shown in Figure 3, the 15-year average of clear-sky SSR in North China presents a clear distribution of high values in the northwest and low values in the southeast. A low-value center with clear-sky SSR less than 215 W/m2 is found in the neighboring region of Shandong, Hebei, and Tianjin, which corresponds to core of the North China Plain (NCP). To the southeast of the low-value center, the clear-sky SSR increase slightly to about 225 W/m2 in south and east of Shandong. And to the northwest of the low-value center, the clear-sky SSR increase dramatically to more than 240 W/m2 in Shanxi, northwest Hebei and south-central Inner Mongolia. Yu et al. (2020) studied the clear-sky solar radiation over arid and semi-arid areas in china, and their results shows that the clear-sky SSR over the south-central Inner Mongolia is about 250 W/m2, which is consistent to our results.
Comparing spatial distribution of clear-sky SSR in Figure 3 and altitudes in Figure 1, the locations with low clear-sky SSR correspond to those with low altitudes. The low-altitude plain regions are usually characterized with dense population and developed industry, and a large amount of anthropogenic aerosol is emitted by industrial and domestic activities [59]. Comparing spatial pattern of clear-sky SSR in Figure 3 and ARE in Figure 4a, regions with low clear-sky SSR correspond to regions with strong attenuation effect of aerosol on solar radiation. High ARE (larger than −40 W/m2) are found in the neighboring region of Shandong, Hebei and Tianjin, which are much higher than the national mean ARE in China (−15.70 W/m2) [60]. However, low ARE (smaller than −15 W/m2) are found in north Hebei and south-central Inner Mongolia. High terrain altitude induces low total atmospheric column and large clear-sky SSR, also contributing to the spatial distribution of SSR [61].
The WVRE (Figure 4b) shows an obvious distribution of high values in the southeast and low values in the northwest as the distribution of water vapor is influenced by the distance to the sea, underlying surface, latitude, and topography [34,62]. The strongest attenuation effect of water vapor on solar radiation (larger than −40 W/m2) occur in north Henan and south Shandong. While the weakest (around −30 W/m2) occur in south-central Inner Mongolia due to high altitude and latitude, dry climate and long distance to the sea [63]. The spatial difference of extinction of water vapor on solar radiation contributes to the spatial distribution of clear-sky SSR. However, the spatial difference of WVRE is much smaller than ARE, and the spatial distribution of clear-sky SSR is more strongly influenced by aerosol.
3.2. Seasonal Variation of Clear-Sky SSR and Driving Factors in North China
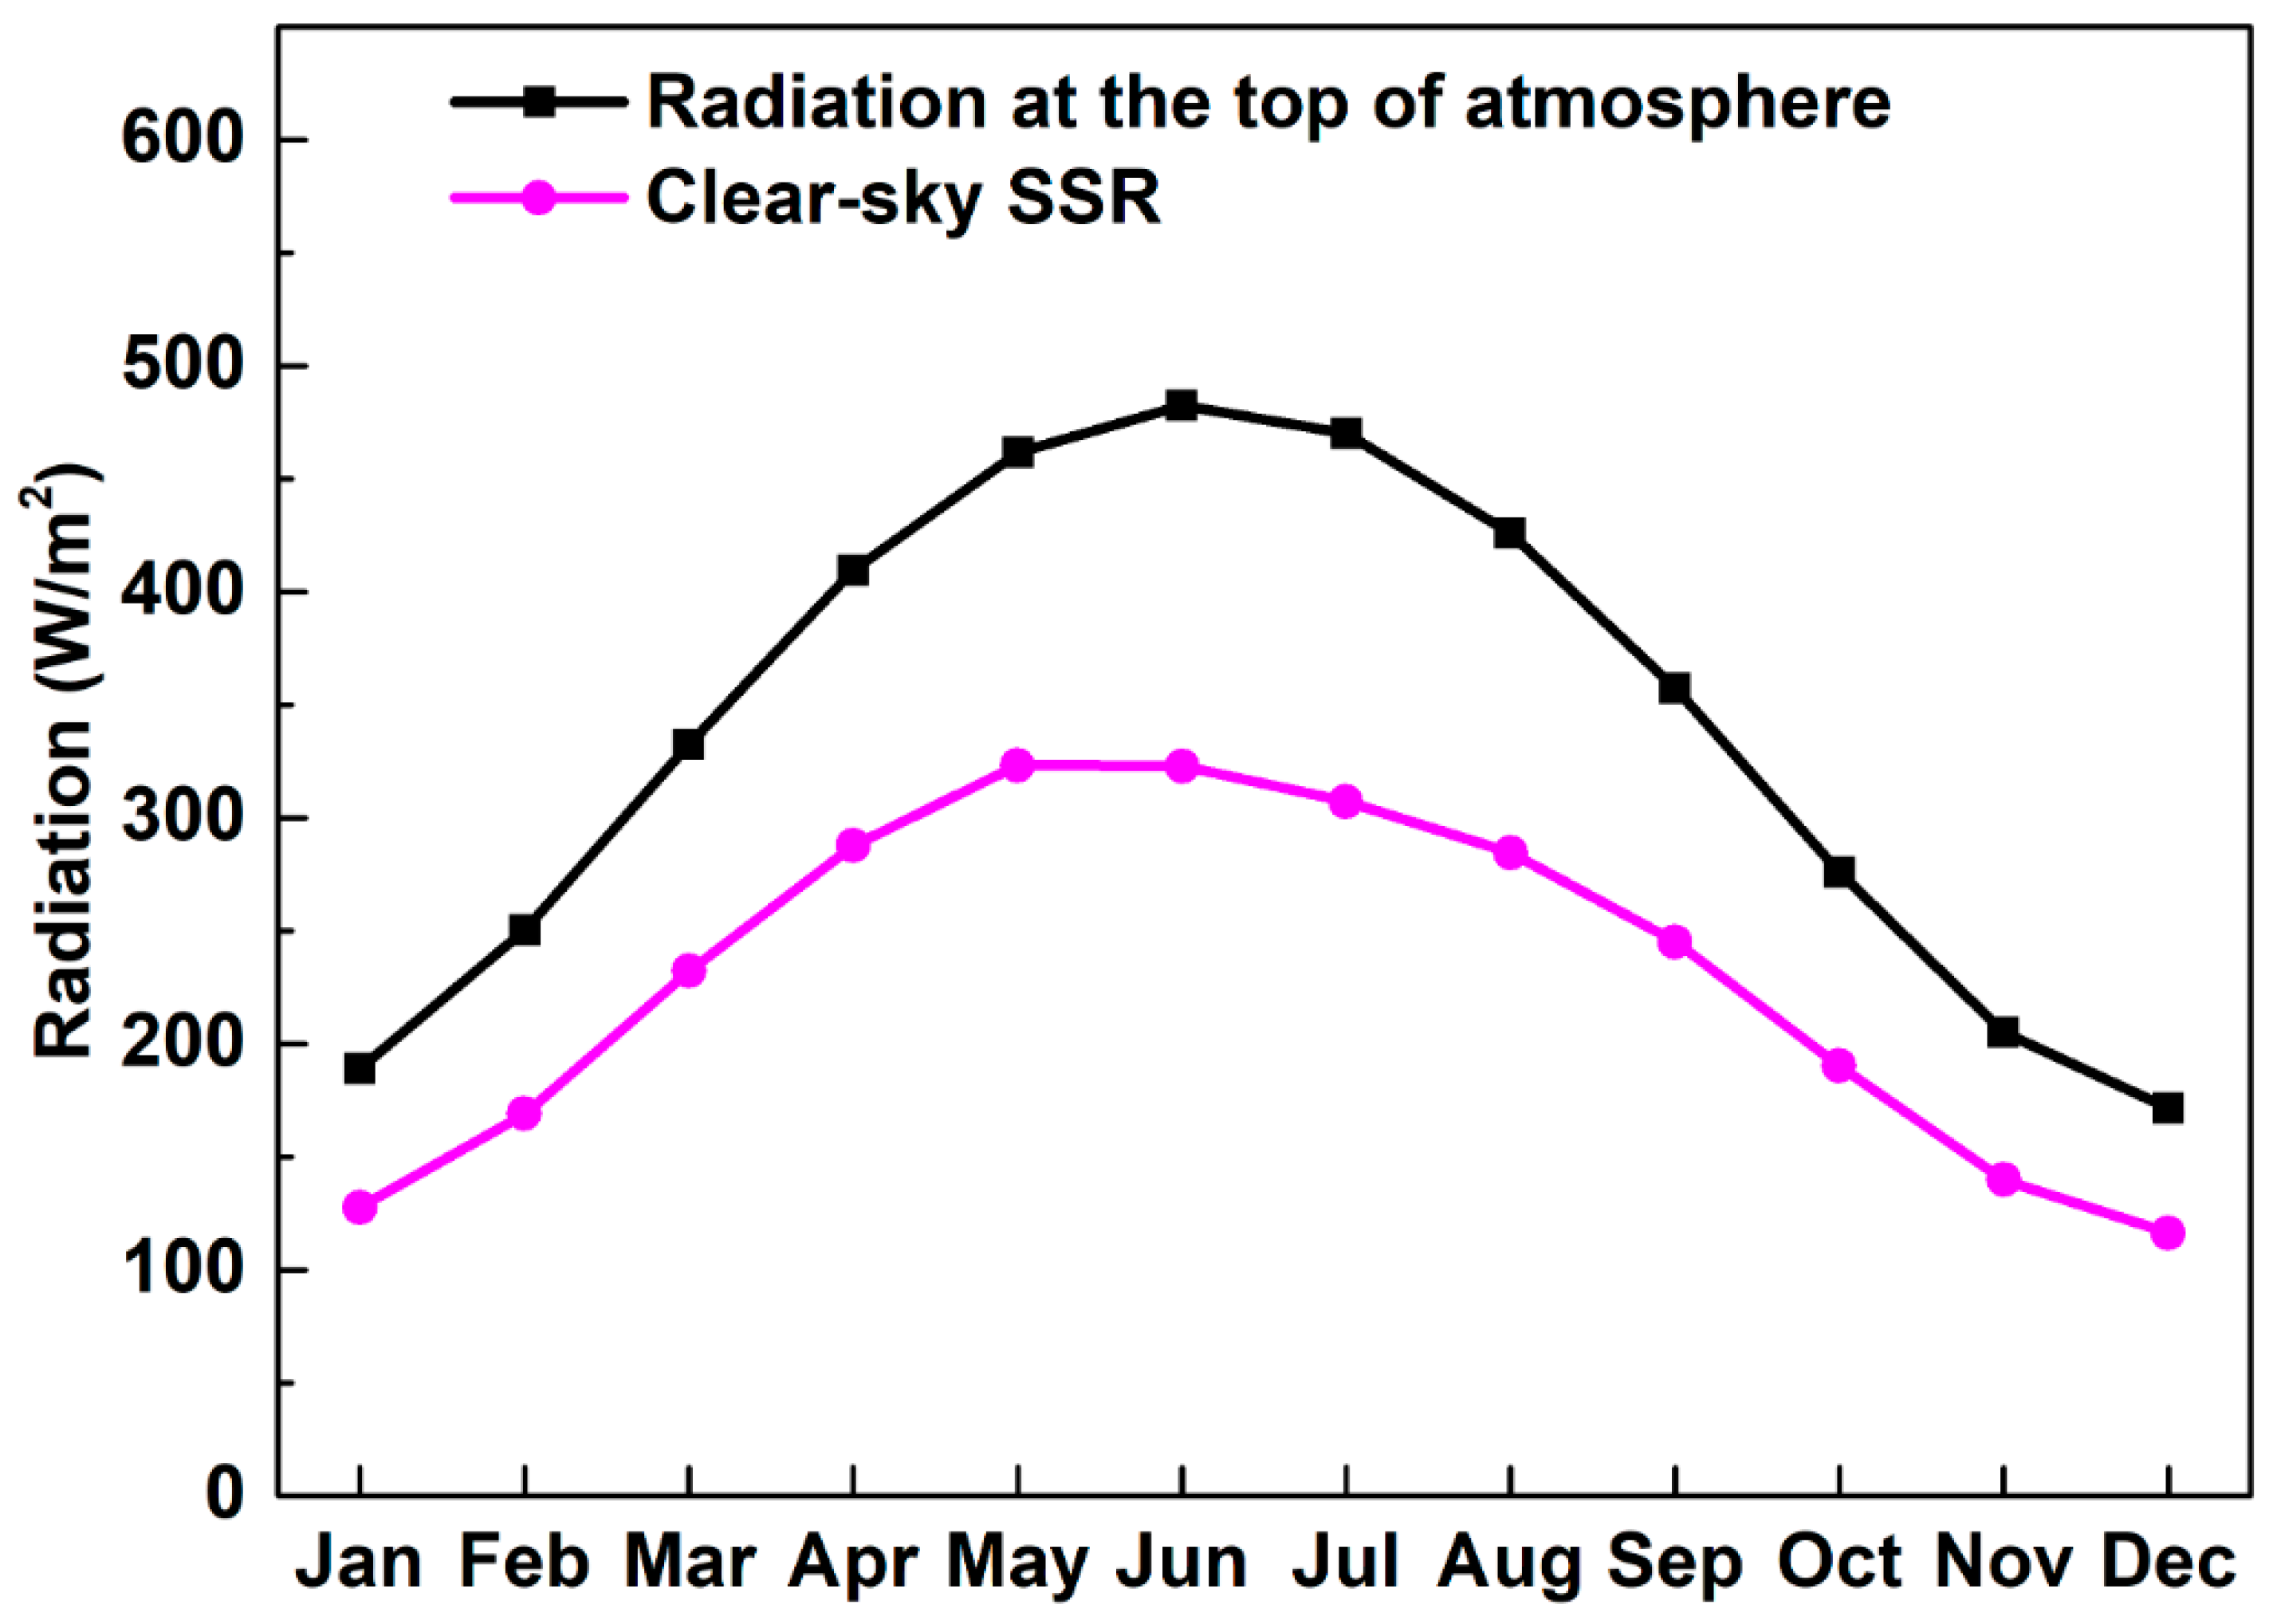
Figure 5 shows the spatial distribution of seasonal averaged clear-sky SSR in northern China during 2001–2015. The clear-sky SSR shows a significant seasonal variation with high values in spring and summer (281.06 W/m2 and 304.90 W/m2) and low values in autumn and winter (191.73 W/m2 and 137.62 W/m2). The seasonal variation of solar radiation at a given location is mainly driven by the astronomical factors such as the tilt of the Earth’s rotation axis with respect to the Earth’s orbital plane around the Sun and the resulting seasonality of insolation and the Earth–Sun distance. Figure 6 shows the monthly variation of regional average of clear-sky solar radiation at the surface and the top of the atmosphere (TOA) in northern China. The regional average of clear-sky SSR increases from 127.58 W/m2 in January to the peak of 323.24 W/m2 in May and then decreases to a low level in December, showing a single-peak change. The seasonal pattern of clear-sky SSR is similar to that at the TOA, indicating that the seasonal variation of clear-sky SSR is primarily determined by the solar radiation reaching the TOA, which is modulated by the astronomical factors.
As shown in Figure 5, Shanxi, northwest Hebei, and south-central Inner Mongolia are characterized with high clear-sky SSR in all seasons, but the values changes with seasons. In spring, high clear-sky SSR (larger than 270 W/m2) occur in Shanxi, northwest Hebei, and south-central Inner Mongolia, while low ones are found in west Shandong, southeast Hebei, and parts of north Henan. Figure 7 and Figure 8 show the spatial distribution of seasonal mean ARE and WVRE in northern China. ARE and WVRE in spring are lower than −20 W/m2 and −40 W/m2 in the northwest regions of northern China, respectively, and about −45 W/m2 and −50 W/m2 in west Shandong, southeast Hebei, and parts of north Henan. In summer, dramatic increases of clear-sky SSR (about 50 W/m2) is found in the northwest part of northern China, which is due to the increased solar radiation reaching the TOA as a result of short Earth–Sun distance in summer [10]. However, clear-sky SSR show little increase in the boundary of Shandong, Hebei, and Henan. In these regions, ARE show a significant increase to more than −60 W/m2, indicating a much stronger attenuation effect of aerosol on solar radiation in summer. WVRE also shows a large enhancement from spring to summer. In autumn, a large decrease in clear-sky SSR is found and the differences among regions are reduced in northern China. The decrease is mainly dominated by the astronomical factors as the radiative effects of aerosol and water vapor on solar radiation are weakened simultaneously. In winter, clear-sky SSR decrease to lower than 170 W/m2 in most regions of northern China and the lowest values (about −130 W/m2) are found in the boundary of Tianjin, Shandong, and Hebei. The attenuation effect of aerosol and water vapor on solar radiation also reach the valley in winter. ARE values are even lower than −7 W/m2 in parts of Hebei and Inner Mongolia, and WVRE values are lower than −20 W/m2 in most of northern China.
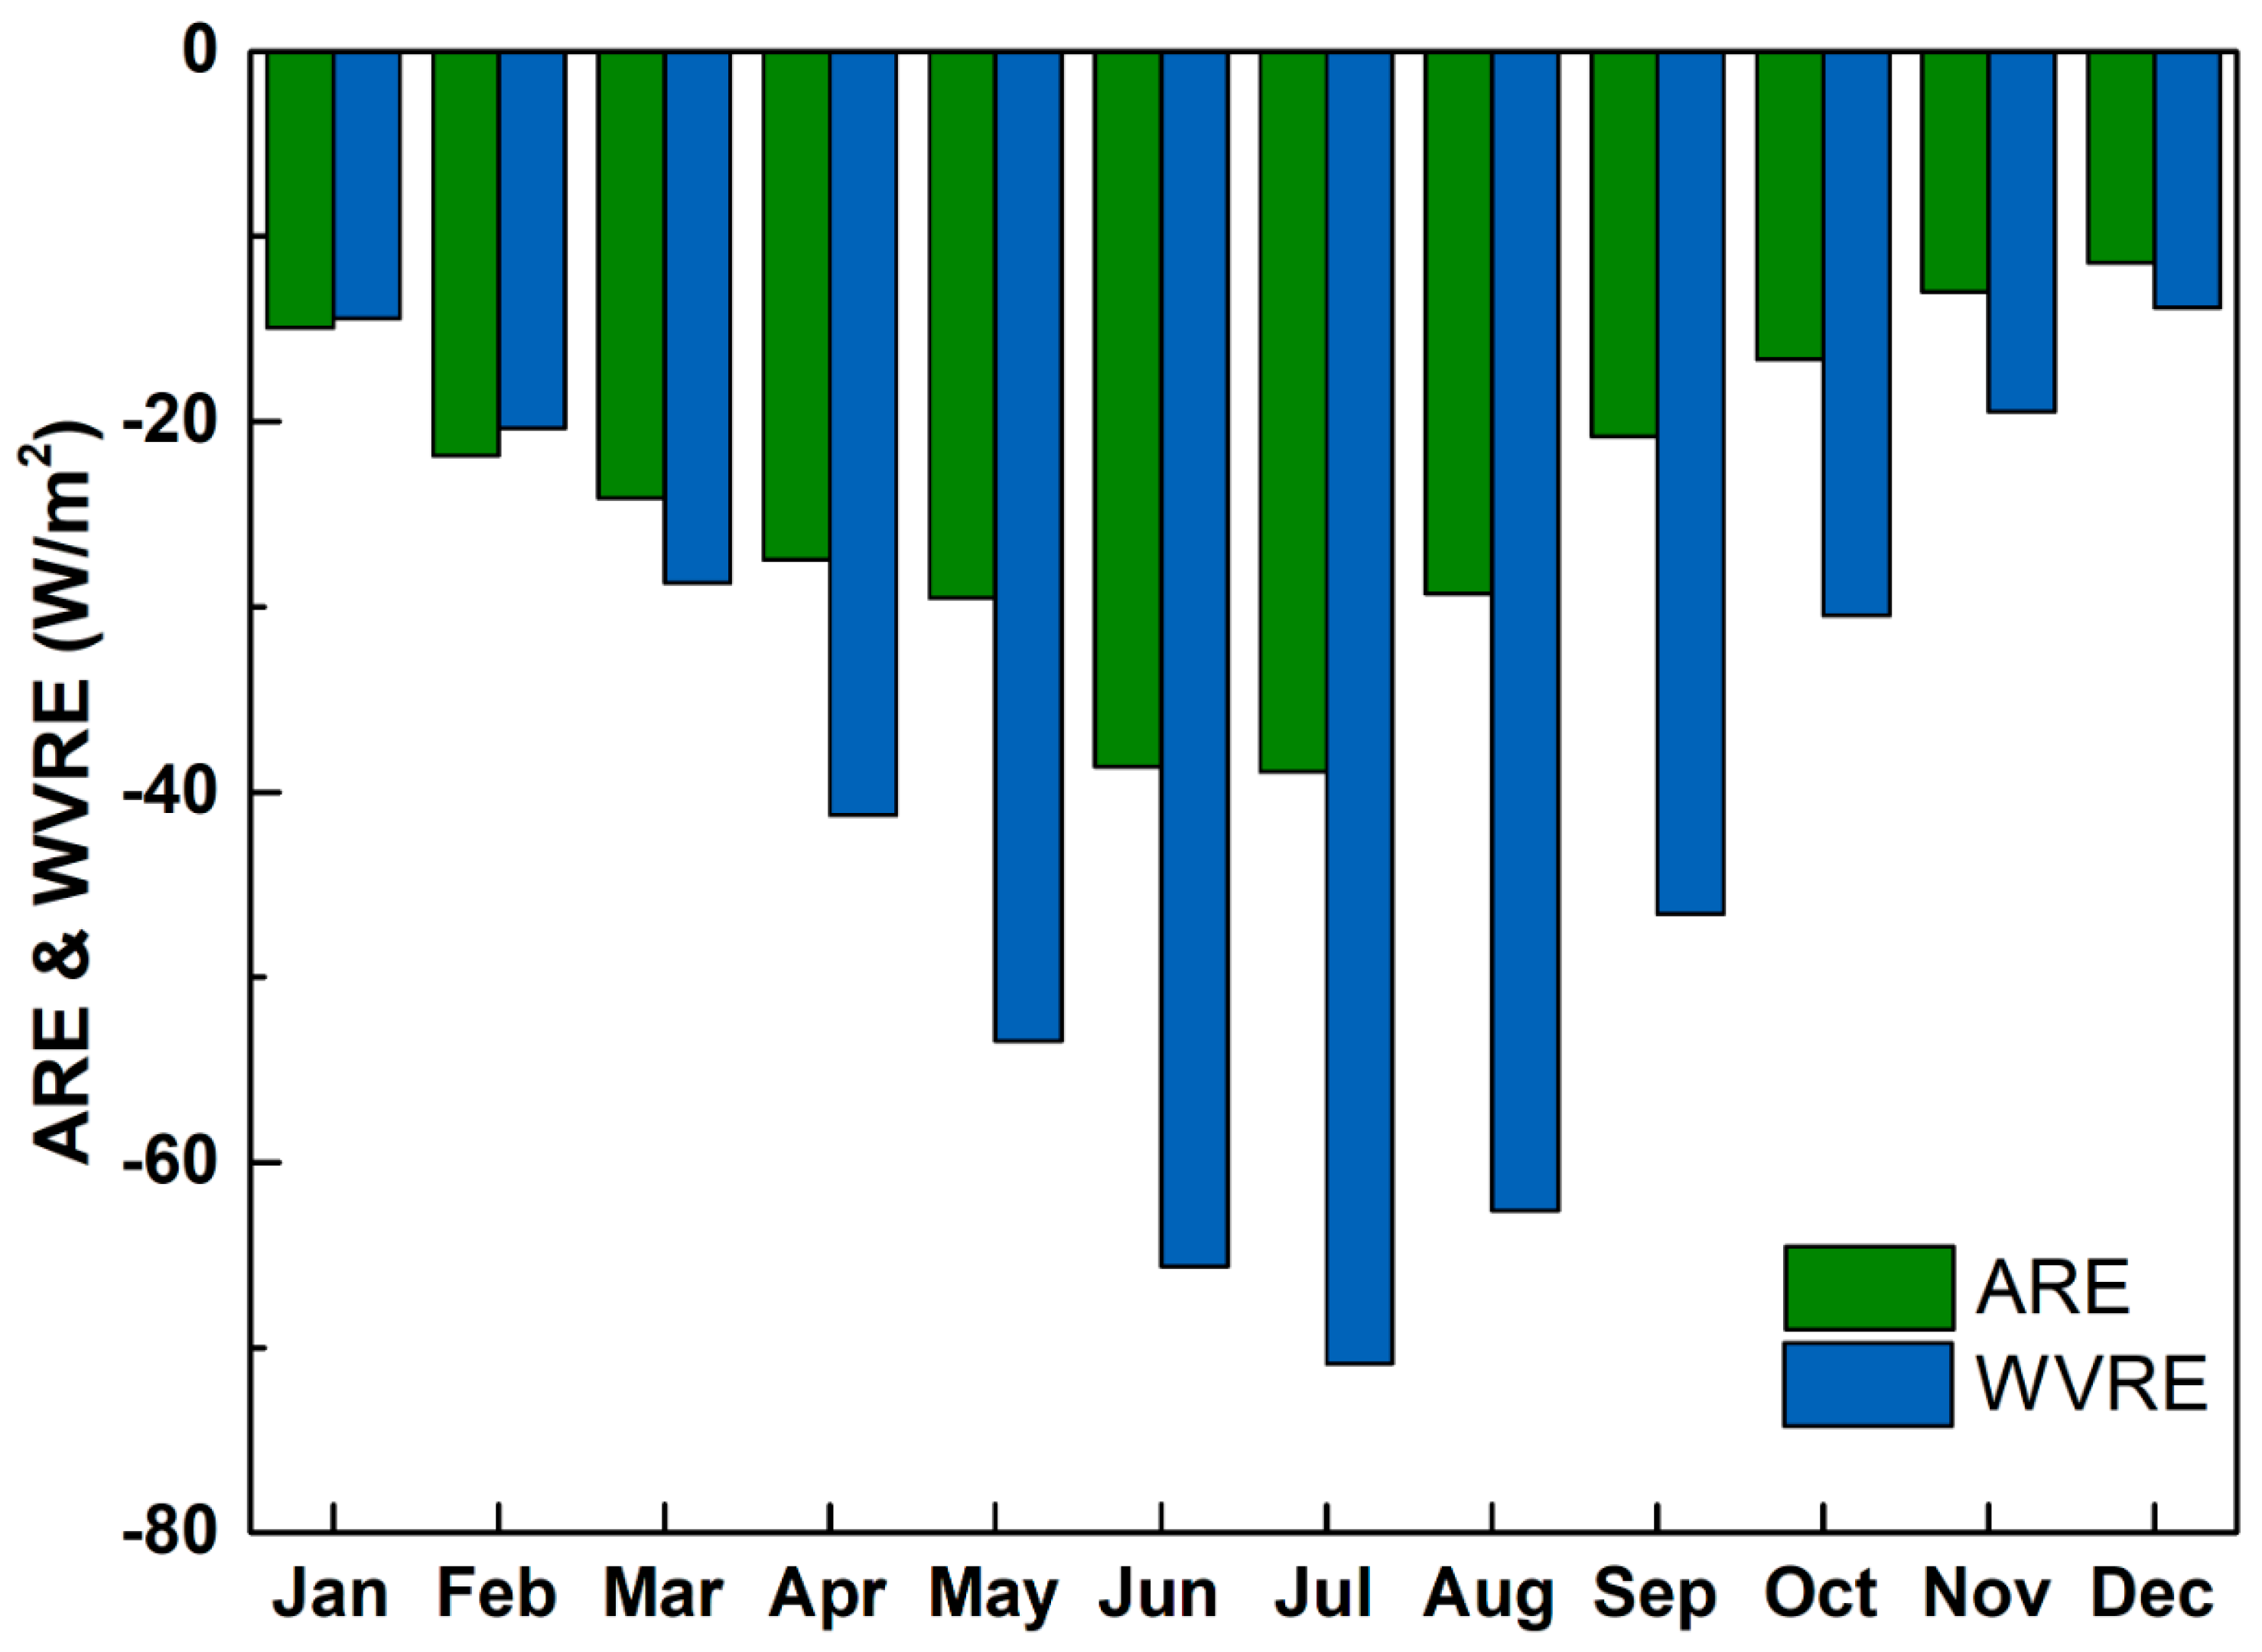
The seasonal variation of clear-sky SSR is dominated by the solar radiation reaching the TOA, as discussed above. However, it should be noted that there is some difference between the monthly pattern of solar radiation at the surface and that at the TOA. The peak at the surface shows in May, and solar radiation are strongly attenuated in June, July, and August. Figure 9 shows the monthly variation of ARE and WVRE. ARE increases from January as temperature increases, which is mainly due to the increase of gas-particle transformation and hygroscopic growth of aerosol particles with temperature and humidity [64,65]. In spring, sandstorms occur frequently in northwest China, and dust aerosol is transported to northern China, which increases aerosol loading and its extinction on solar radiation [33]. Dust aerosol is characterized with high absorption in low wavelengths and results in low SSA in this season, which also contributes the increase in ARE. Pani et al. (2018) studied the ARE over an urban atmosphere in northern peninsular southeast Asia (PSEA) in 2014, and showed ARE ranged between −45.3 to −103.4 W/m2 from March to April [66], which is larger than that (lower than −30 W/m2) in our study during the same period. The difference mainly come from different aerosol loading and properties. Influenced by increased aerosol emission from biomass burning from February to April, AOD was larger than 1 and SSA is lower than 0.9 in some regions of PSEA, which contributed to the higher ARE [66,67]. The maximum ARE (−38.90 W/m2) occurs in July, and then ARE decreases sharply in August and September. The decrease of AOD due to the wet deposition by heavy rain causes a decrease in ARE in August and September [68]. Moreover, large SSA values (0.94) are found in these months, and the decrease of aerosol absorption also contributes to the decrease in ARE. The minimum ARE (−11.40 W/m2) occurs in December, when the Asian winter monsoon brings clean and dry air to northern China.
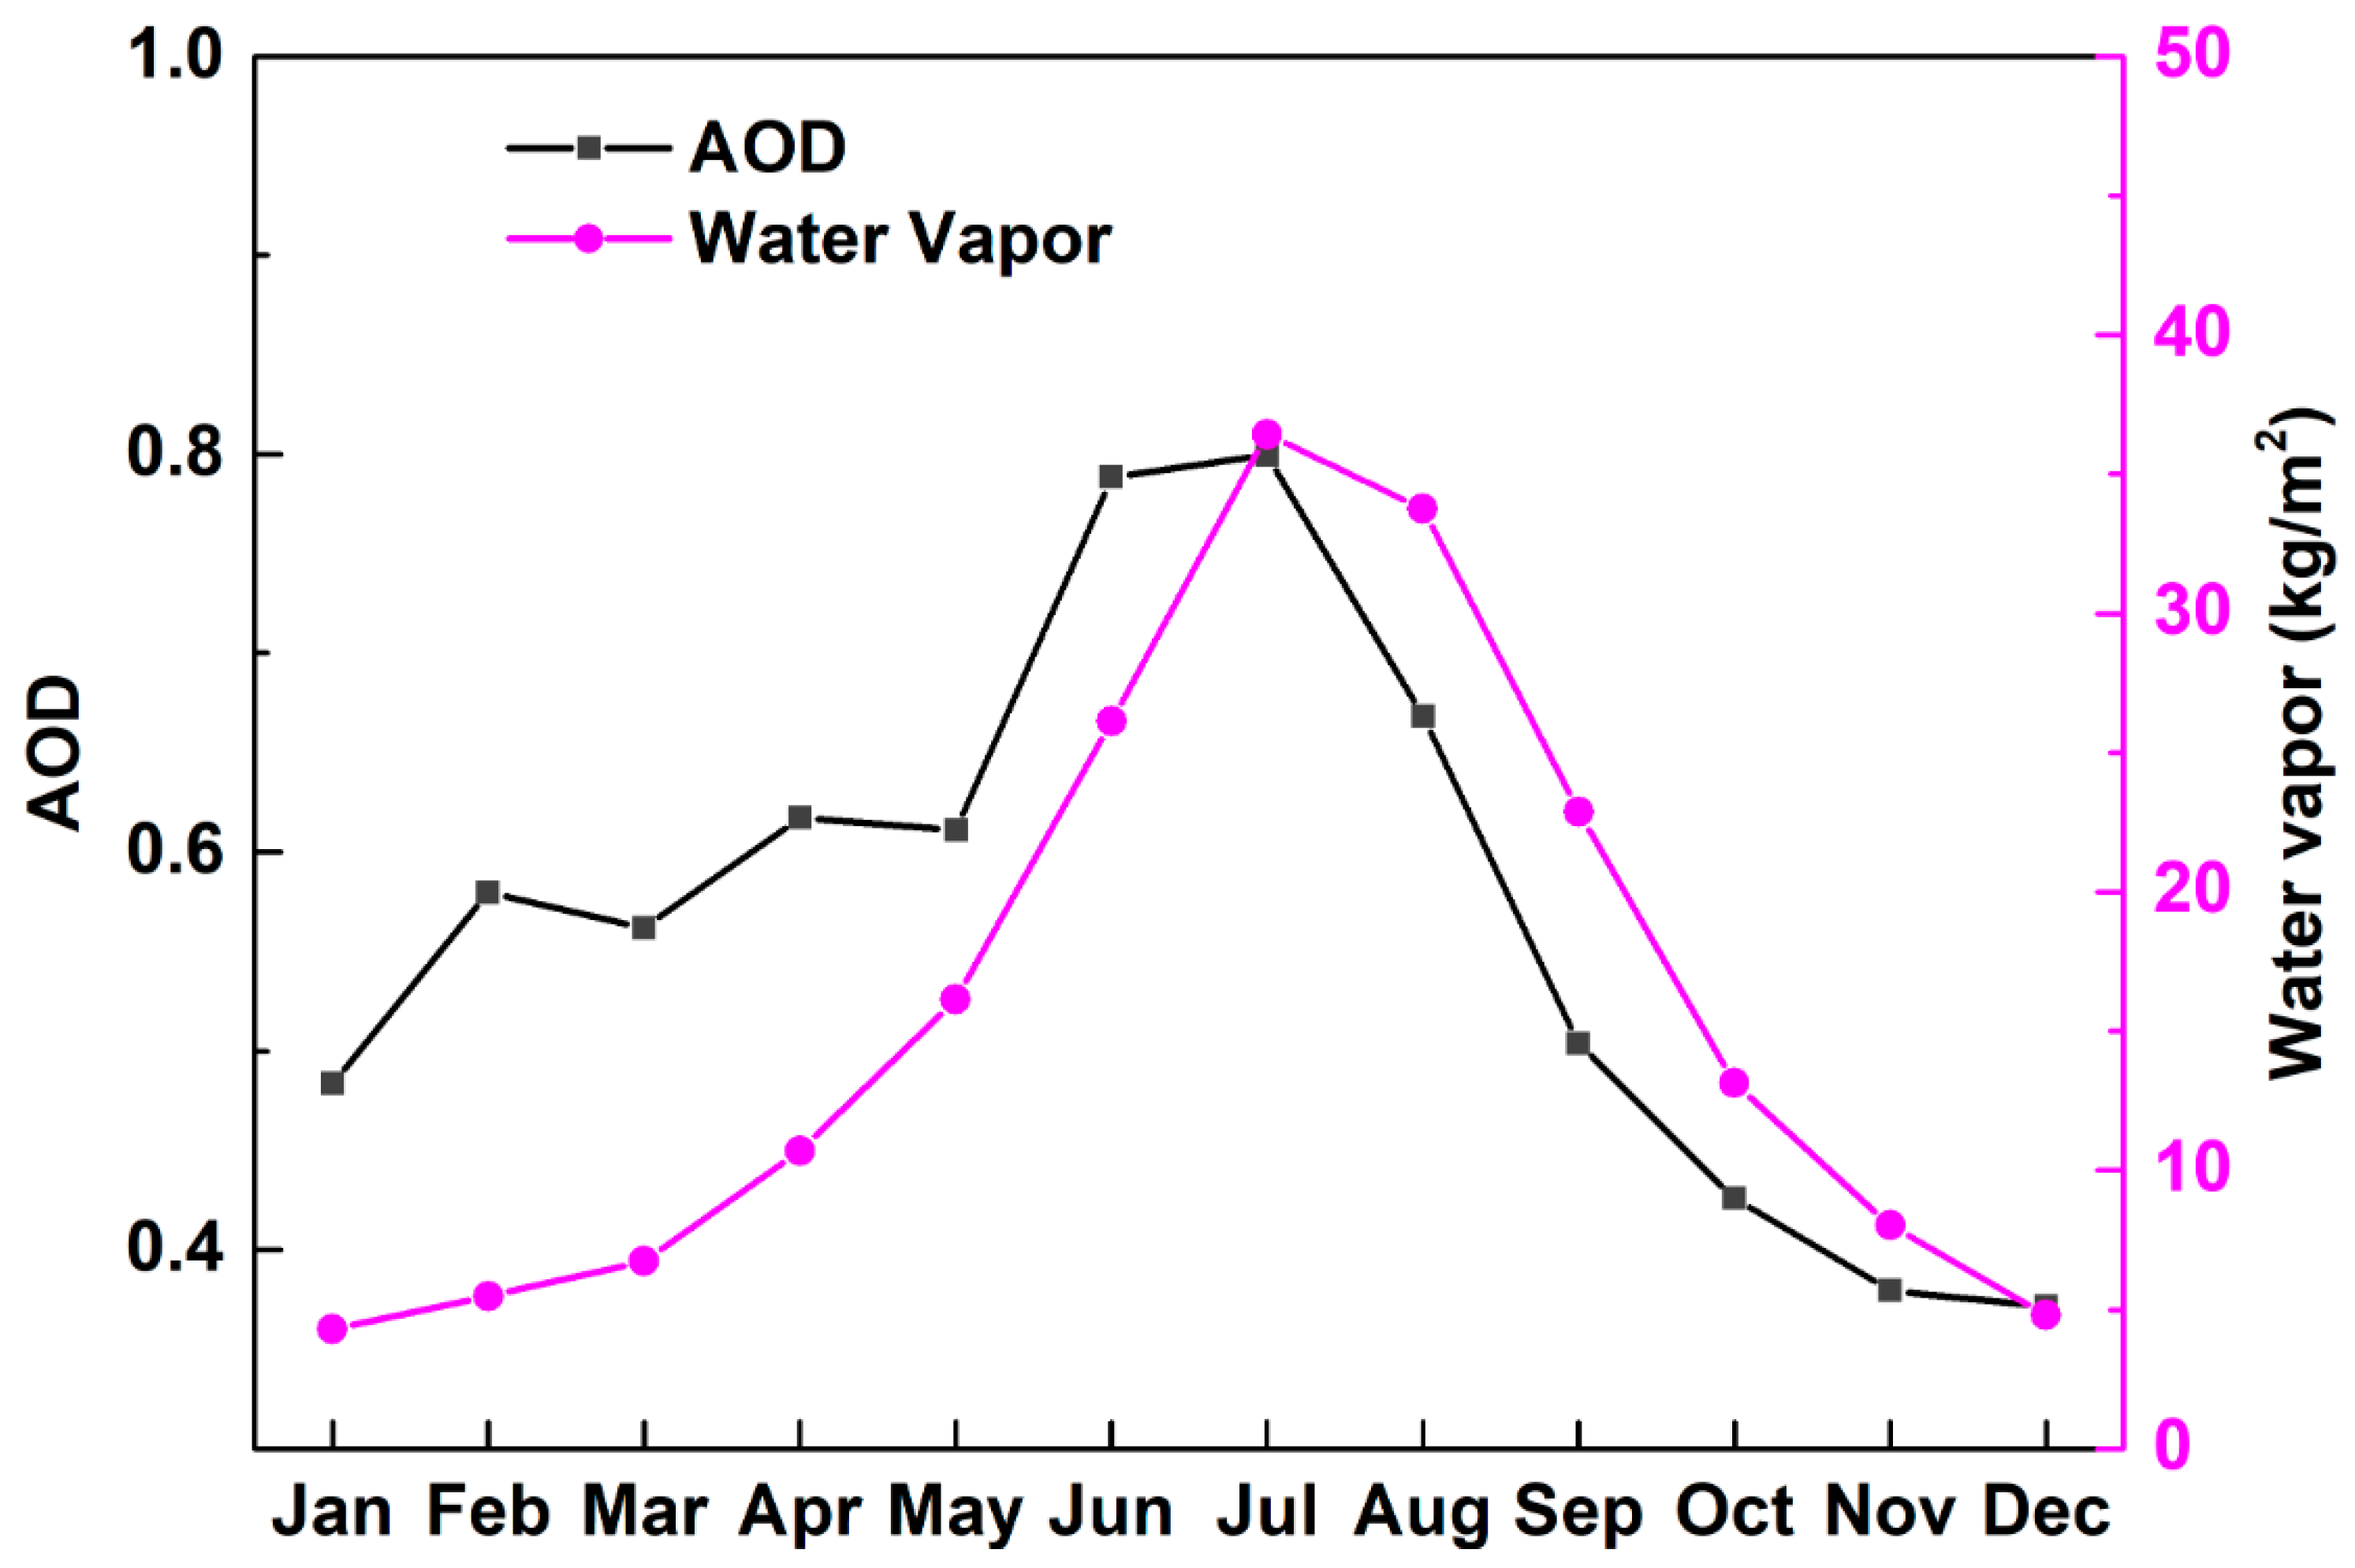
WVRE are low in winter and even lower than ARE in January and February. However, the extinction of solar radiation by water vapor increases dramatically from March to July as the Asian summer monsoon brings warm and humid air [69,70]. As shown in Figure 10, water vapor increases simultaneously. WVRE reaches the maximum of –70.88 W/m2 in July, which is about 1.82 times that of ARE. In August and September, though a large decrease is found in WVRE, the decrease in ARE is more obvious, and the ratios of WVRE to ARE increase to 2.14 and 2.24, respectively. The high values of WVRE and ARE in June, July, and August are responsible for the inconsistent seasonal variation of solar radiation at the surface and TOA. In the following months, WVRE decreases dramatically and reaches to the minimum of −13.84 W/m2 in December as a result of the dry air condition caused by the winter monsoon [69,70]. As shown in Figure 9, the monthly variation of WVRE is much more drastic than ARE, and water vapor plays a more important role in moderating the seasonal variation of clear-sky SSR.
3.3. Long-Term Trend of Clear-Sky SSR and the Roles of Aerosol and Water Vapor in Northern China
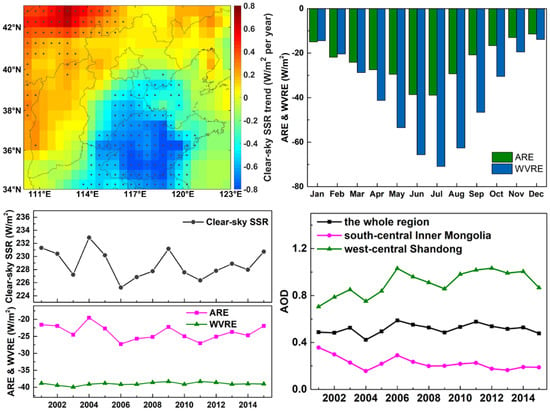
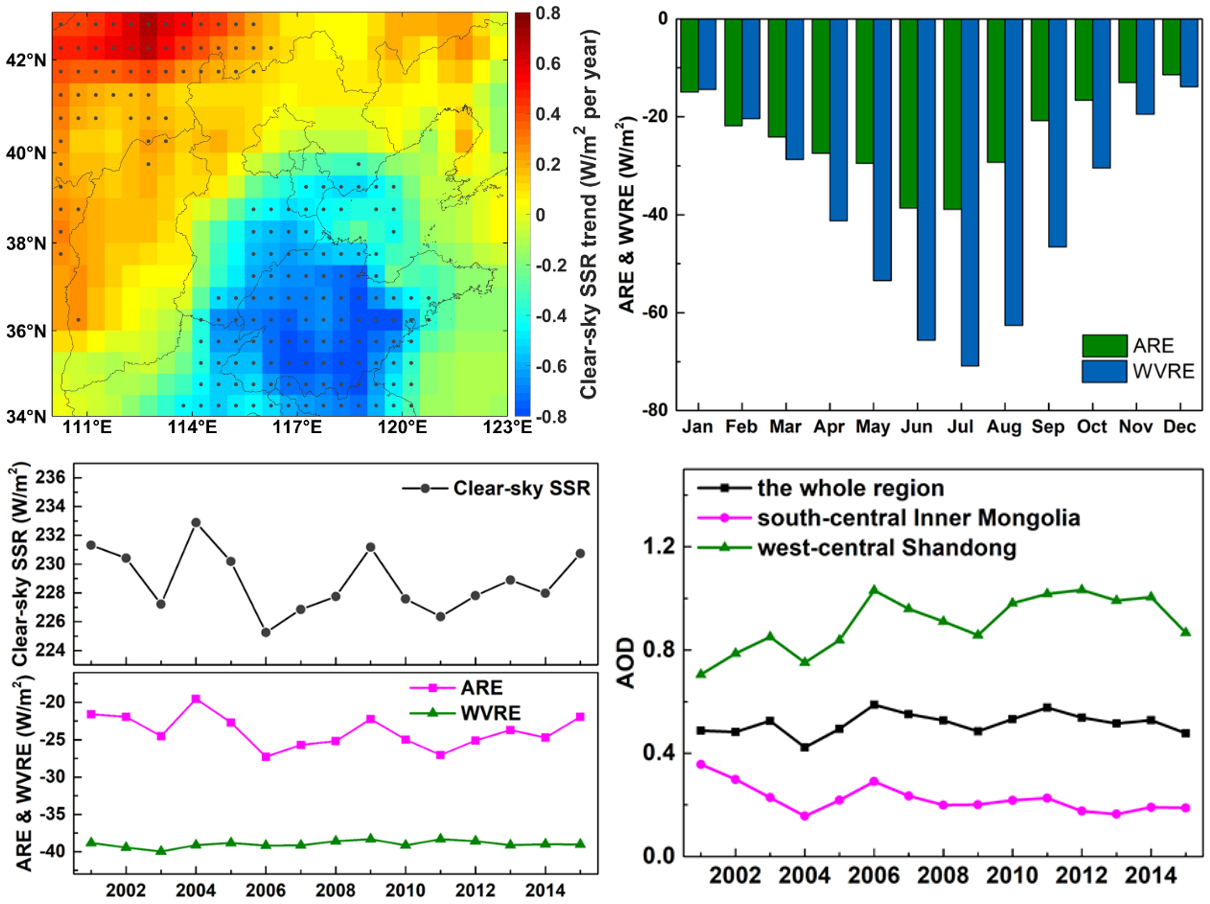
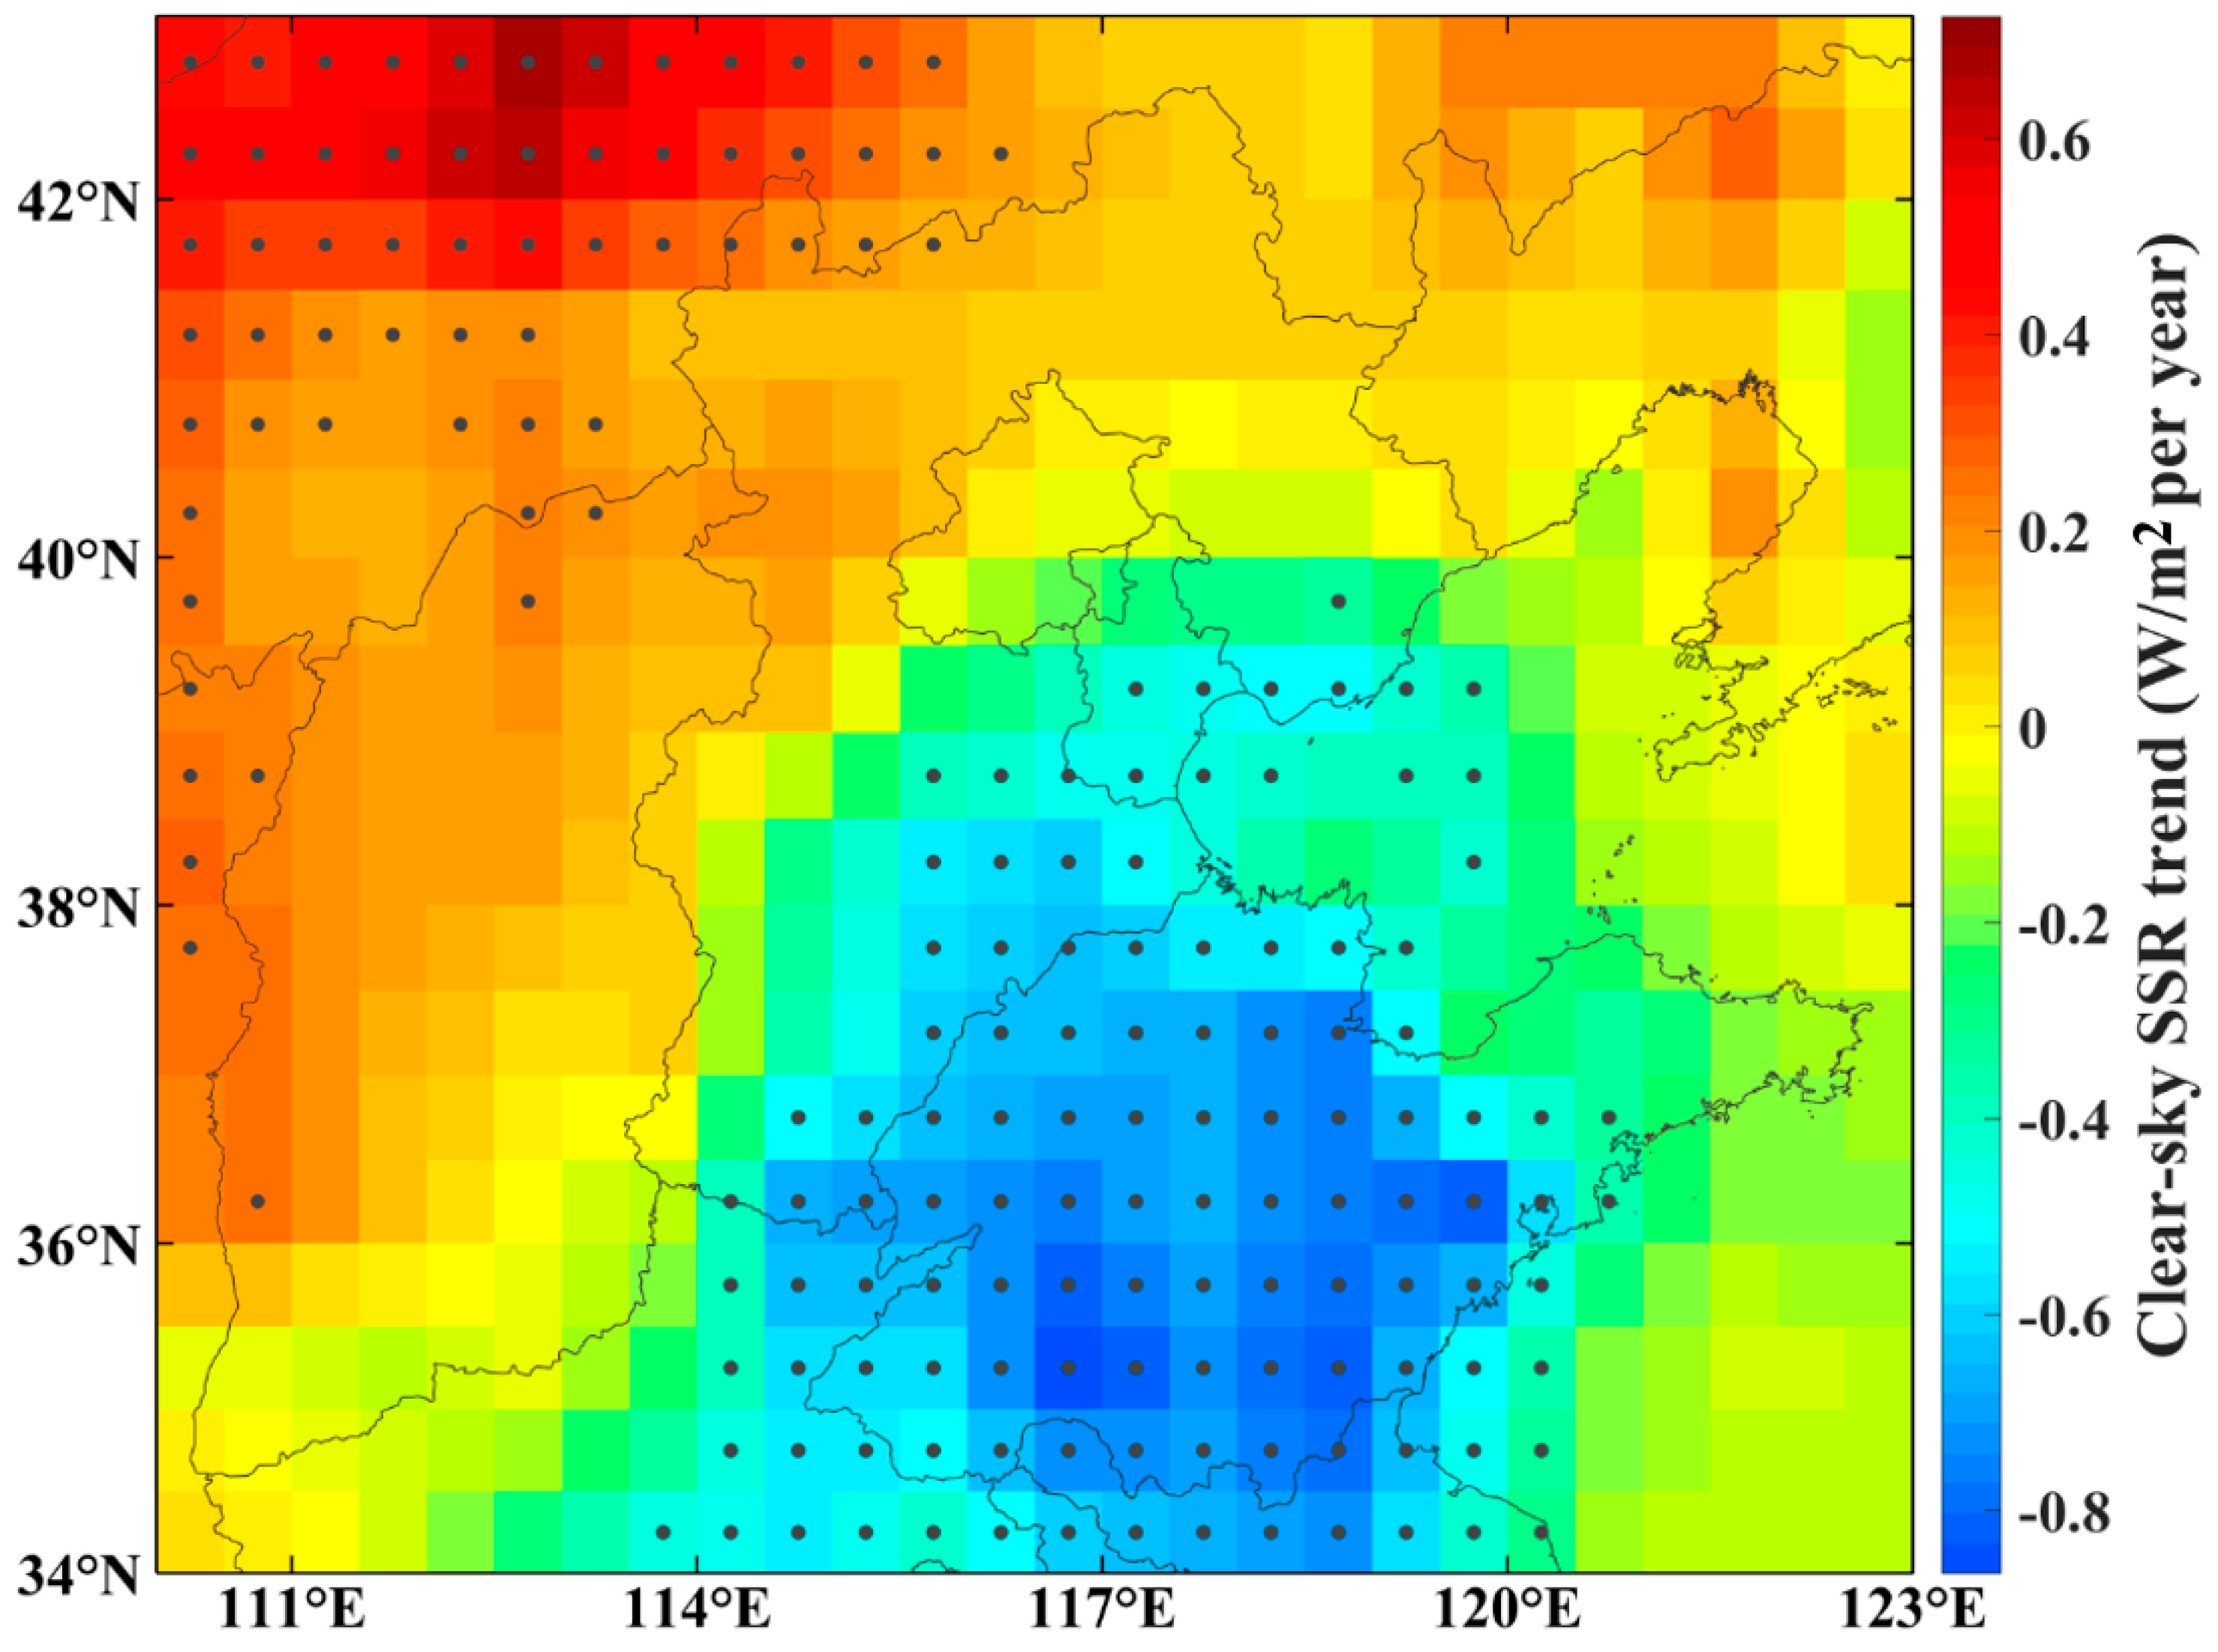
Figure 11 shows the monthly clear-sky SSR time series and the deseasonlized clear-sky SSR trend in northern China from 2001 to 2015. The clear-sky SSR in North China shows an overall decreasing trend of –0.12 W/m2 per year but is not significant at the 95% confidential level. Figure 12 shows the spatial distribution of clear-sky SSR trends in northern China from 2001 to 2015. The trends among different regions vary greatly. There is on significant trend over Beijing, north Hebei, and south Shanxi. While positive trend with annual growth rate larger than 0.30 W/m2 are found in south-central Inner Mongolia. On the other hand, a significant decreasing trend (larger than −0.60 W/m2 per year) occurs in west-central Shandong, in some places of which trend up to –0.80 W/m2 per year is even found. Clear-sky SSR in these regions decrease about 4% in 15 years.
Figure 13a shows the spatial distribution of ARE trends in northern China from 2001 to 2015. The 15-year trend of ARE in northern China is –0.15 W/m2, which indicates that the extinction effect of aerosol on solar radiation is enhanced during 2001–2015. The weakening of ARE is found in the northwest of northern China and is significant in south-central Inner Mongolia with an annual change rate of about 0.30 W/m2 per year. While significant enhancement of ARE occur in most of Shandong, southeast Hebei, northeast Henan, and annual change rates of larger than –0.60 W/m2 per year are mainly found in west-central Shandong.
Comparing clear-sky SSR trend in Figure 12 and ARE trend in Figure 13a, the areas where clear-sky SSR decrease/increase have a good match with the areas where ARE is enhanced/weakened. The areas with the largest decrease of clear-sky SSR and the largest enhancement of ARE are located in west-central Shandong, while the areas with the largest increase of clear-sky SSR, and the largest weakening of ARE is found in south-central Inner Mongolia. The good consistency in the spatial distribution of clear-sky SSR and ARE trend suggests that the variation of ARE may be the dominated factor for the long-term variation of clear-sky SSR.
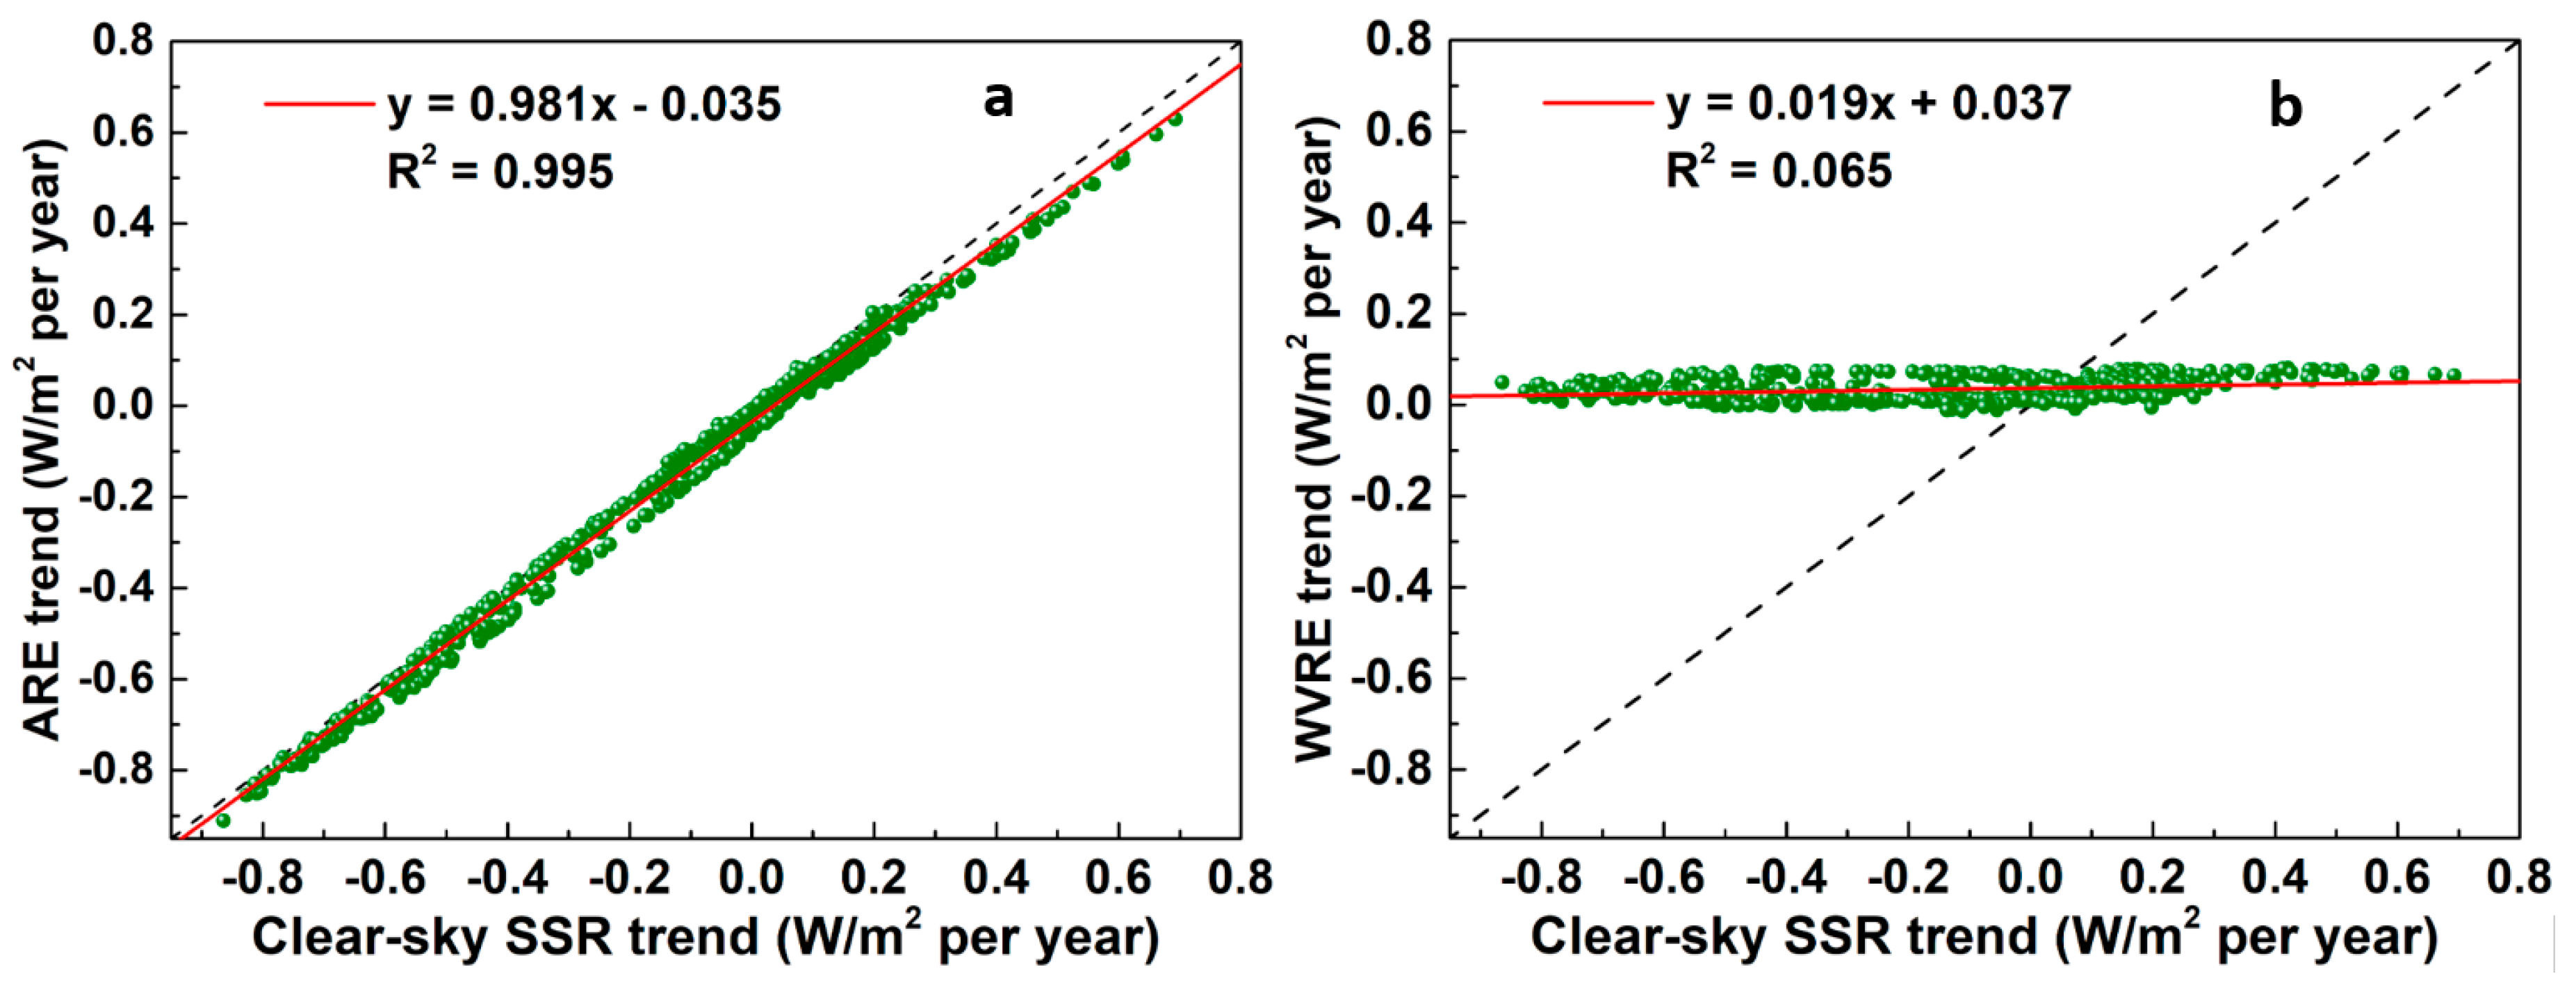
Figure 14a shows the comparison of clear-sky SSR trend and co-located ARE trend. The slope of linear regression is about 0.981 and R2 between clear-sky SSR and ARE trend is 0.995, which indicates that the clear-sky SSR trend is mainly determined by the variation of attenuation effect on solar radiation by aerosol.
Figure 13b shows the spatial distribution of WVRE trend in northern China during 2001–2015. The weakening of WVRE is found in most regions of northern China. Variations of WVRE are slight over Beijing, Tianjin, and most areas of Shandong and Hebei. Significant weakening of WVRE occurs in north Henan and south-central Inner Mongolia, with annual change rate being about 0.07 W/m2 per year. The weakening WVRE contributes to the increase in clear-sky SSR in south-central Inner Mongolia. However, the trend of WVRE accounts for only about 17% of the clear-sky SSR trend, so it is not the governing factor for clear-sky SSR trend. Figure 14b shows the comparison between clear-sky SSR trend and WVRE trend. The trend of WVRE varies slightly as trend of clear-sky SSR changes greatly, and R2 between them is lower than 0.07, indicating that the variation of extinction by water vapor has little impact on the trend of clear-sky SSR.
Figure 15 shows the variation of annual mean clear-sky SSR, ARE, and WVRE in northern China from 2001 to 2015. The annual mean clear-sky SSR over the whole region changes drastically with the highest value in 2004 (232.88 W/m2) and the lowest value in 2006 (225.25 W/m2), and an overall decreasing trend is found. The annual mean ARE varies in the range of −19.53 W/m2 to −27.28 W/m2. The variation of annual mean ARE shows a similar pattern to clear-sky SSR, confirming the dominating effect of ARE on the variation of annual clear-sky SSR. The annual mean of WVRE varies around −39.00 W/m2, which is about 1.65 times that of ARE. However, the change of annual WVRE is so little that its influence on the variation of clear-sky SSR is quite limited.
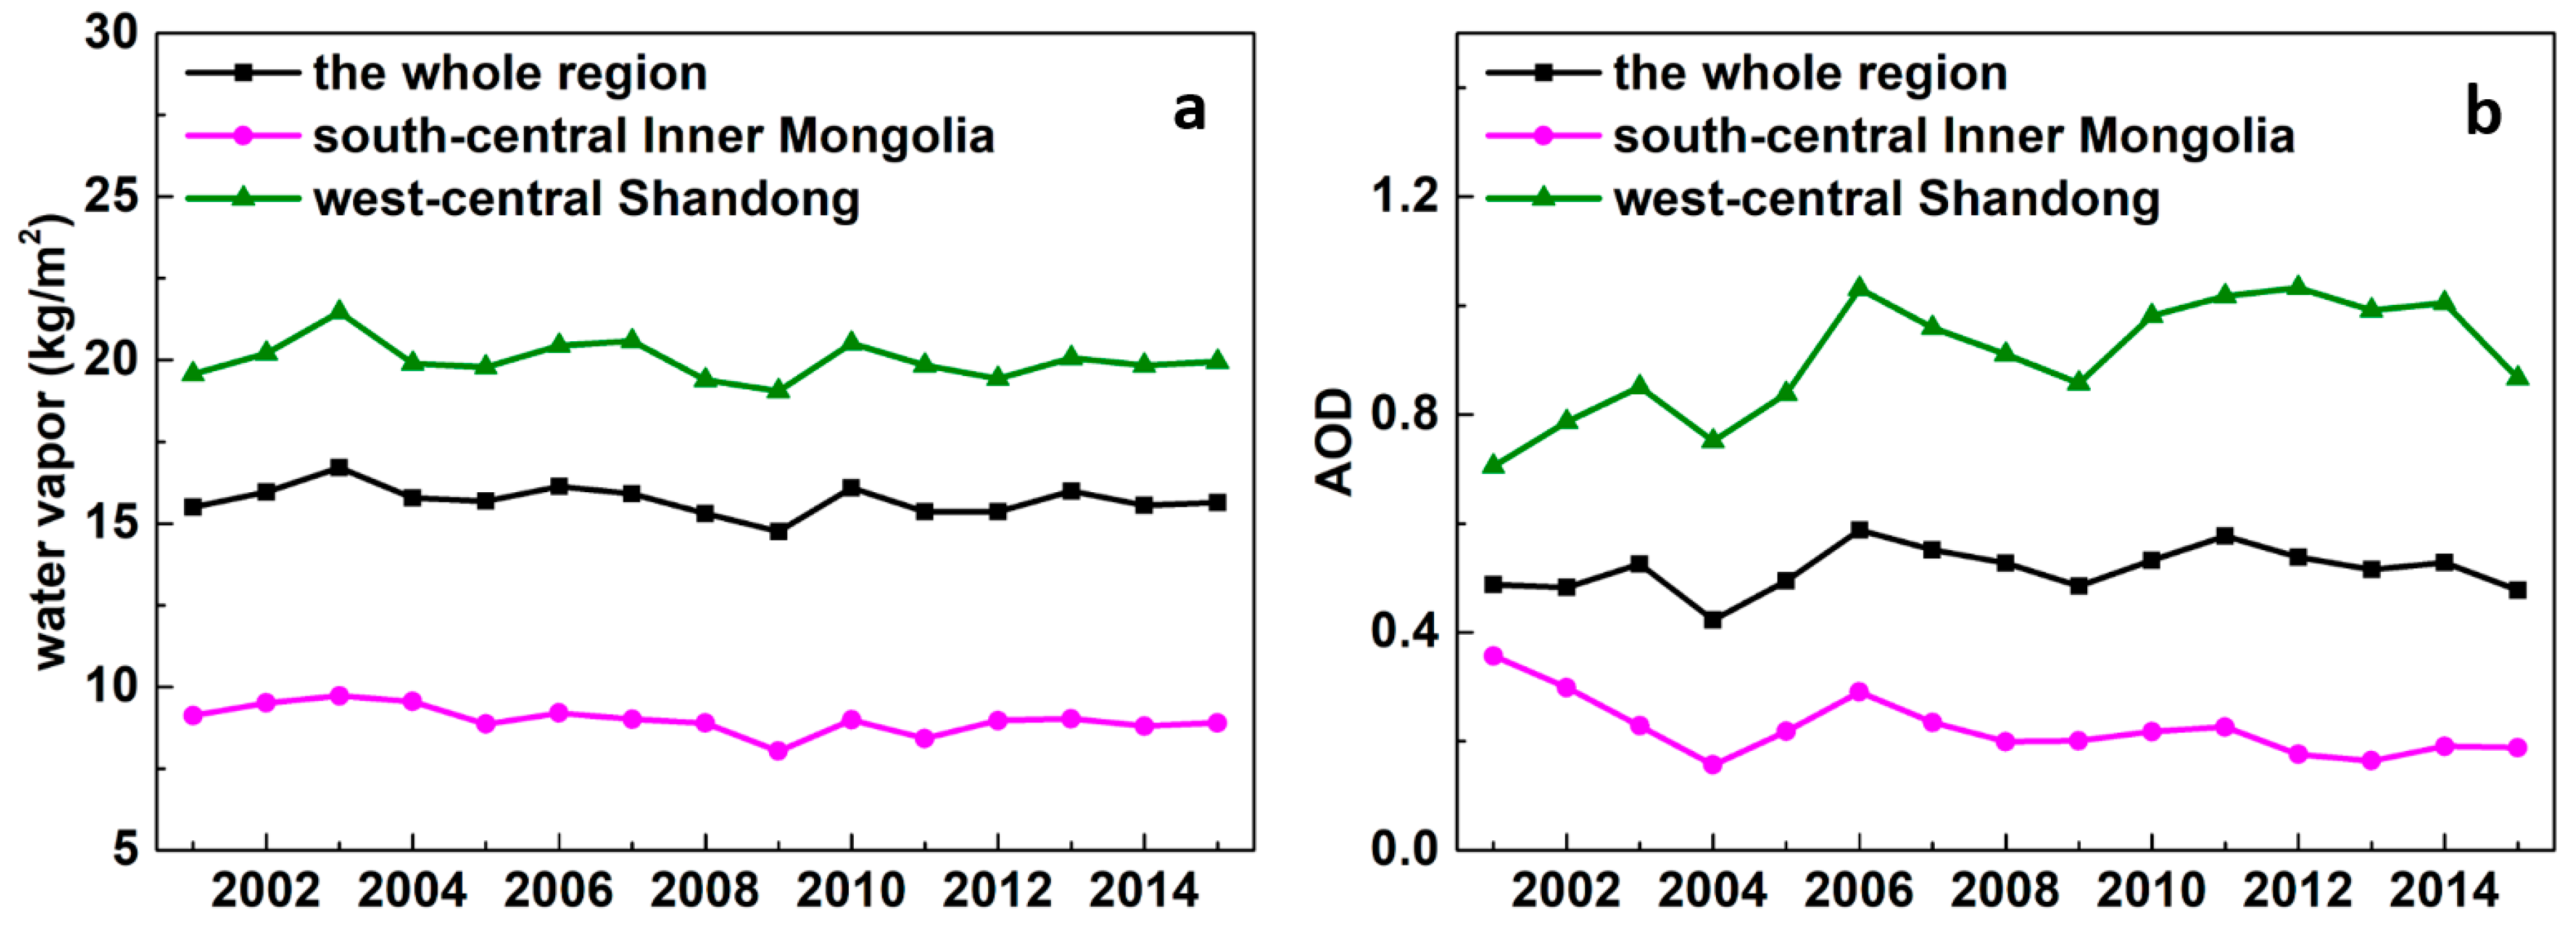
Figure 16a shows the variations of annual mean water vapor over two regions with significant trend (south-central Inner Mongolia and west-central Shandong). There is no obvious trend of water vapor in west-central Shandong. Water vapor in south-central Inner Mongolia shows a small decrease in 15 years, which slightly contributes to the increase in clear-sky SSR. Figure 16b shows the annual variation of AOD, which is an important indicator of aerosol loading. AOD in south-central Inner Mongolia decreases greatly from 0.36 in 2001 to 0.19 in 2015. The large decrease of aerosol loading would be responsible for the weakening of ARE and increase of clear-sky SSR in this region. In contrast, AOD in west-central Shandong shows an increase from 0.71 in 2001 to 0.87 in 2015 and is responsible for the enhancement of ARE and decrease of clear-sky SSR in this area.
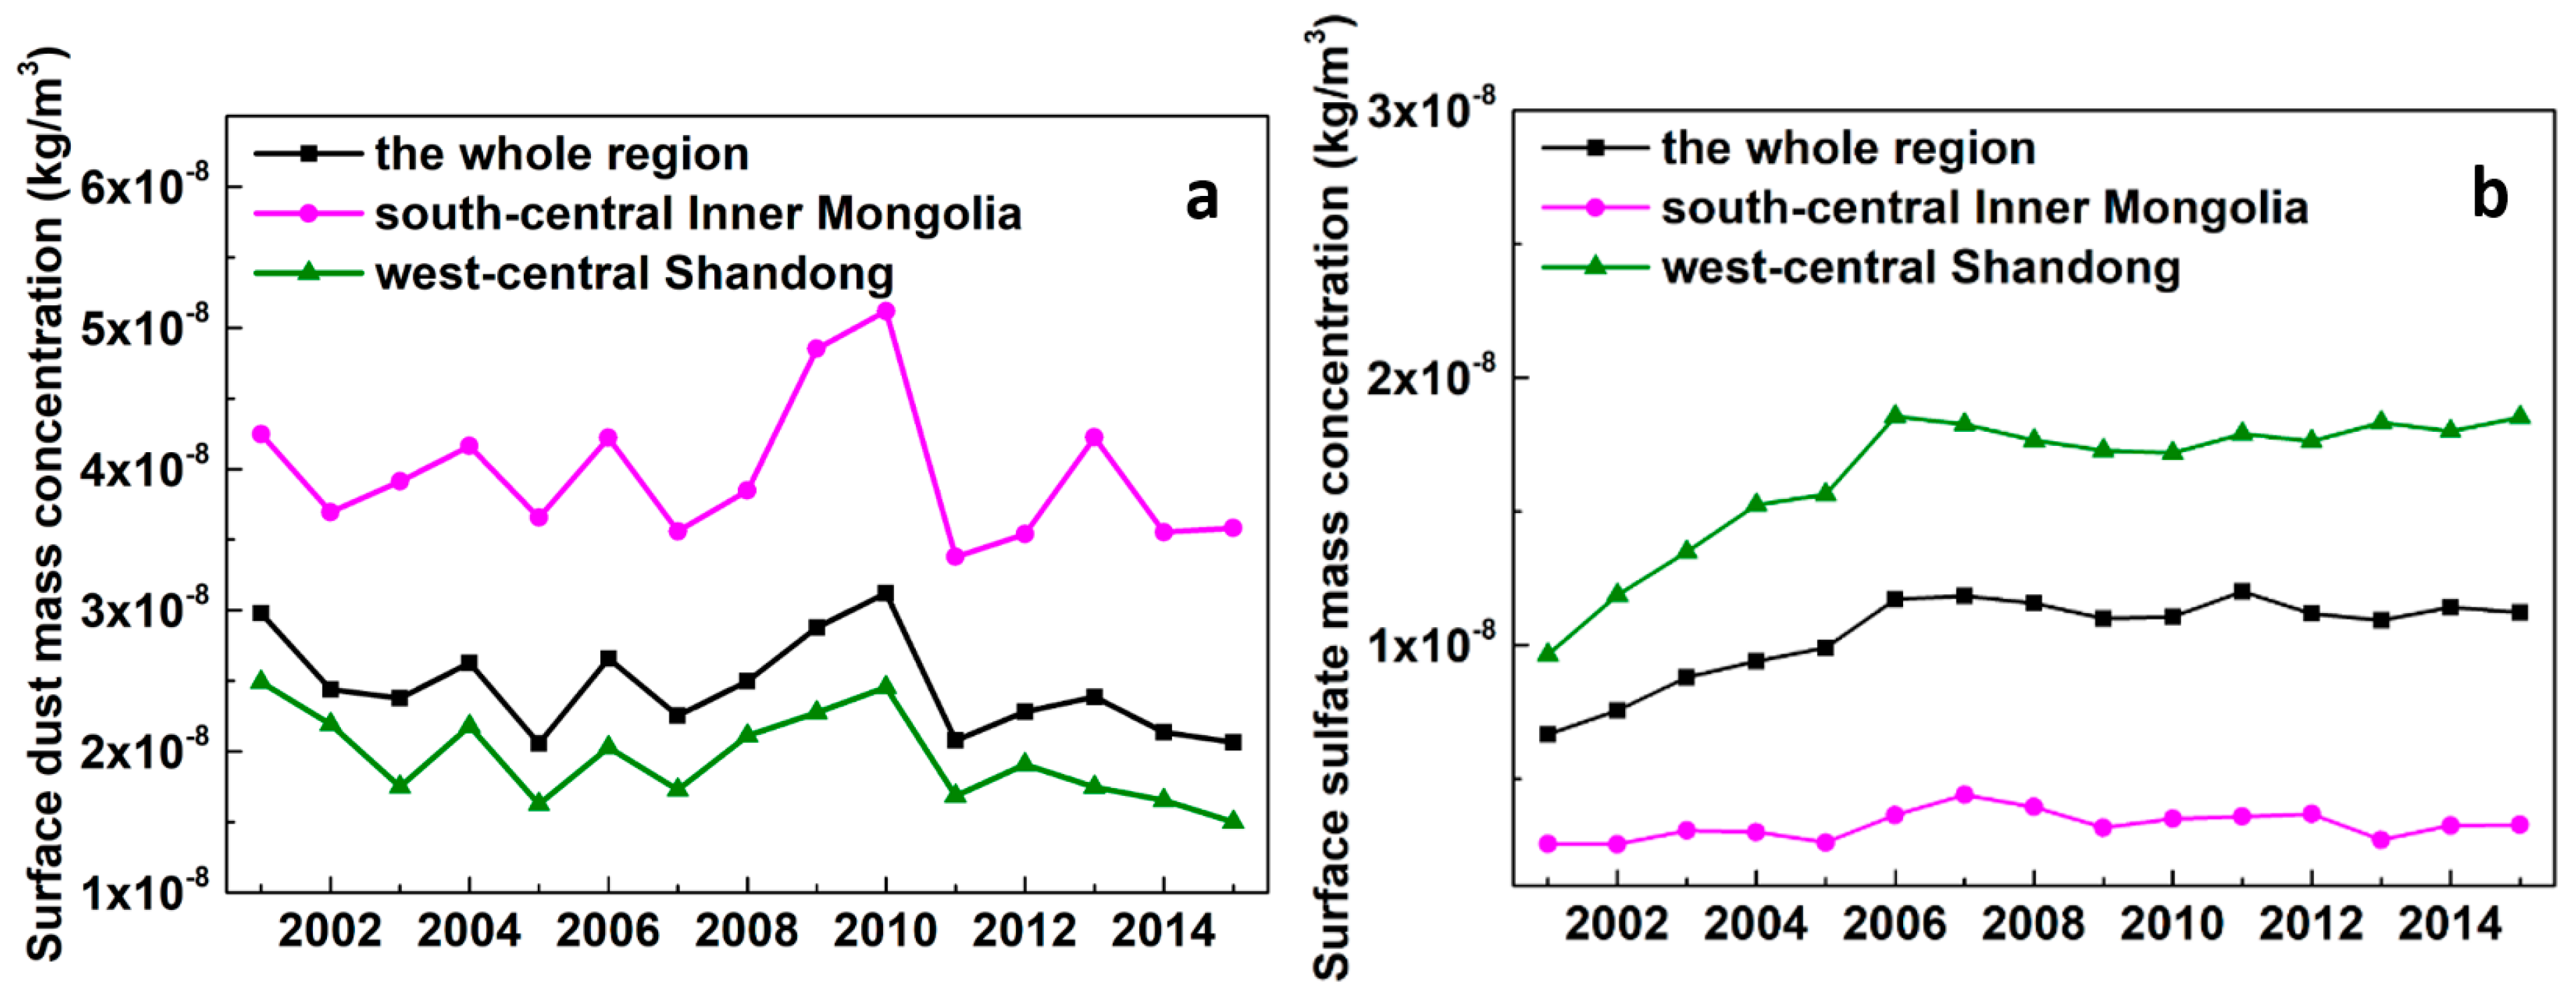
To figure out the roles of natural and anthropogenic aerosol emissions in clear-sky SSR variation, the annual variation of typical aerosol compositions such as dust and sulfate from MERRA2 is investigated. As shown in Figure 17, dust mass concentration at the surface decreases dramatically in North China, indicating a decreasing influence of dust aerosol. Dust mass concentration in south-central Inner Mongolia decreases about 16% from 2001 to 2015. As a result, the extinction of dust particles on solar radiation decreases and more solar radiation reaches the surface, causing the increase of clear-sky SSR in this region. In contrast, sulfate mass concentration in this region is in low level and shows little variation due to the undeveloped industry and sparse population here. Dust mass concentration in west and central Shandong also shows a great decrease. However, sulfate mass concentration increases about 92% from 2001 to 2015. The dramatic increase in sulfate aerosol leads to the decreasing trend of clear-sky SSR in this area.
4. Discussion
To assess the influence of input parameters on SSR simulation, we conducted sensitivity tests for SSR simulation by adding a perturbed value for each parameter inputted in the MAGIC model. The sensitivity test is based on two steps—first, SSR was simulated using the measured values as input parameters, obtaining the non-perturbed results. Second, we simulated SSR by adding a perturbed value for an input parameter and keeping other parameters unchanged, thereby obtaining a perturbed result. This step is repeated to obtain perturbed results for all the input aerosol parameters, such as AOD, SSA, and water vapor. A similar strategy has been adopted for uncertainty estimation in previous studies [71]. The perturbed values of AOD, SSA, and water vapor values were selected based on the uncertainties of these parameters as shown in Section 2. AOD was perturbed by ±0.14, SSA was perturbed by ±0.06, and water vapor was perturbed by ±2.80 kg/m2. Table 2 shows the absolute and percentage changes between the non-perturbed and perturbed results. An increase of 0.14 in AOD from the measurements causes an SSR decrease of 3.71%. By contrast, a decrease of 0.14 in AOD results in a decrease with similar magnitudes. The largest SSR change in this analysis is associated with SSA uncertainty. An increase of 0.06 in SSA provides an increase of 4.54% for SSR. For water vapor, an increase of 2.80 kg/m2 in water vapor causes a 0.64% decrease in SSR.
5. Conclusions
In this study, we analyzed the distribution and trend of clear-sky SSR and the quantitative effects of aerosol and water vapor over northern China based on clear-sky SSR, ARE, and WVRE simulated by the MAGIC. The comparison between simulated and observed clear-sky SSR shows a R2 of 0.98, MAE of 8.14 W/m2 (3.62%), and RMSE of 10.60 W/m2 (4.17%), confirming the reliability of the simulation in this study.
During 2001–2015, clear-sky SSR shows a clear distribution of high values in the northwest and low values in the southeast. A low-value center with clear-sky SSR less than 215 W/m2 is found in the boundaries of Shandong, Hebei, and Tianjin, which is characterized with low altitude plains, developed industry, and high anthropogenic emissions. Regions with low clear-sky SSR correspond to areas with strong extinction effect of aerosol on solar radiation, indicating that aerosol loading plays an important role in the spatial distribution of clear-sky SSR.
Clear-sky SSR in northern China shows a similar seasonal pattern with solar radiation at the TOA with high value (304.90 W/m2) in summer and low value (137.62 W/m2) in winter, which is mainly modulated by astronomical factors. The seasonal variation of WVRE is much more drastic than ARE, and water vapor plays a more important role in moderating the seasonal variation of clear-sky SSR.
The clear-sky SSR in North China shows an overall decreasing trend of −0.12 W/m2 per year. A decrease more strongly than −0.60 W/m2 per year occurs in west-central Shandong, and a positive trend with annual growth rate larger than 0.30 W/m2 is found in south-central Inner Mongolia. The clear-sky SSR trend is mainly determined by the variation of aerosol’s effect on solar radiation. AOD decreases greatly from 0.36 in 2001 to 0.19 in 2015 over south-central Inner Mongolia and increases from 0.71 in 2001 to 0.87 in 2015 over west-central Shandong. Dust mass concentration over south-central Inner Mongolia decreases about 16% from 2001 to 2015, resulting in the decrease of the extinction of dust particles on solar radiation and the increase of clear-sky SSR. In contrast, sulfate aerosol over west-central Shandong increases about 92% in 15 years, leading to the decreasing trend of clear-sky SSR.
Using fixed atmospheric vertical distribution is one source of error in this study, and we will carry out studies adopting observations of atmospheric vertical profiles in SSR simulations to reduce error in the future work.
Author Contributions
G.Z. and Y.M. conceived and designed the experiments. G.Z. collected and analyzed the data and wrote the paper. G.Z. and Y.M. revised the manuscript. All authors have read and agreed to the published version of the manuscript.
Funding
This research was funded by the National Natural Science Foundation of China, grant number 41875038 and 41801261.
Acknowledgments
We would like to thank the MODIS scientific teams for providing MODIS data, the National Meteorological Information Center for providing surface solar radiation data, and the NASA Global Modeling and Assimilation Office and the European Centre for Medium-Range Weather Forecasting for providing the atmospheric reanalysis data.
Conflicts of Interest
The authors declare no conflict of interest.
References
- Sanchez-Lorenzo, A.; Wild, M. Decadal variations in estimated surface solar radiation over Switzerland since the late 19th century. Atmos. Chem. Phys. Discuss. 2012, 12, 8635–8644. [Google Scholar] [CrossRef] [Green Version]
- Wild, M. Enlightening Global Dimming and Brightening. Bull. Am. Meteorol. Soc. 2012, 93, 27–37. [Google Scholar] [CrossRef]
- Xu, J.; Li, C.; Shi, H.; He, Q.; Pan, L. Analysis on the impact of aerosol optical depth on surface solar radiation in the Shanghai megacity, China. Atmos. Chem. Phys. Discuss. 2011, 11, 3281–3289. [Google Scholar] [CrossRef] [Green Version]
- Valipour, M. Importance of solar radiation, temperature, relative humidity, and wind speed for calculation of reference evapotranspiration. Arch. Agron. Soil Sci. 2014, 61, 239–255. [Google Scholar] [CrossRef]
- Ren, X.; He, H.; Zhang, L.; Yu, G.-R. Global radiation, photosynthetically active radiation, and the diffuse component dataset of China, 1981–2010. Earth Syst. Sci. Data 2018, 10, 1217–1226. [Google Scholar] [CrossRef] [Green Version]
- Europe, S.P. Global Market Outlook for Solar Power 2019–2023; SolarPower Europe: Brussels, Belgium, 2019. [Google Scholar]
- Qian, Y.; Wang, W.; Leung, L.R.; Kaiser, D.P. Variability of solar radiation under cloud-free skies in China: The role of aerosols. Geophys. Res. Lett. 2007, 34. [Google Scholar] [CrossRef]
- Shi, G.-Y.; Hayasaka, T.; Ohmura, A.; Chen, Z.-H.; Wang, B.; Zhao, J.-Q.; Che, H.; Xu, L. Data Quality Assessment and the Long-Term Trend of Ground Solar Radiation in China. J. Appl. Meteorol. Clim. 2008, 47, 1006–1016. [Google Scholar] [CrossRef]
- Karakoti, I.; Pathak, P.P.; Nandan, H. A Comprehensive Study of Ground Measurement and Satellite-Derived Data of Global and Diffuse Radiation. Environ. Prog. Sustain. Energy 2018, 38, e13060. [Google Scholar] [CrossRef]
- Fröhlich, C. Variability of the solar “constant” on time scales of minutes to years. J. Geophys. Res. Space Phys. 1987, 92, 796. [Google Scholar] [CrossRef]
- Liepert, B.G. Observed reductions of surface solar radiation at sites in the United States and worldwide from 1961 to 1990. Geophys. Res. Lett. 2002, 29, 61. [Google Scholar] [CrossRef] [Green Version]
- Abakumova, G.M.; Feigelson, E.M.; Russak, V.; Stadnik, V.V. Evaluation of Long-Term Changes in Radiation, Cloudiness, and Surface Temperature on the Territory of the Former Soviet Union. J. Clim. 1996, 9, 1319–1327. [Google Scholar] [CrossRef] [Green Version]
- Li, J.; Yu, R.; Zhou, T.; Wang, B. Why Is There an Early Spring Cooling Shift Downstream of the Tibetan Plateau? J. Clim. 2005, 18, 4660–4668. [Google Scholar] [CrossRef] [Green Version]
- Kaiser, D.P. Decreasing cloudiness over China: An updated analysis examining additional variables. Geophys. Res. Lett. 2000, 27, 2193–2196. [Google Scholar] [CrossRef] [Green Version]
- Haywood, J.; Bellouin, N.; Jones, A.; Boucher, O.; Wild, M.; Shine, K.P. The roles of aerosol, water vapor and cloud in future global dimming/brightening. J. Geophys. Res. Space Phys. 2011, 116, 116. [Google Scholar] [CrossRef] [Green Version]
- Wild, M.; Trüssel, B.; Ohmura, A.; Long, C.N.; König-Langlo, G.; Dutton, E.G.; Tsvetkov, A. Global dimming and brightening: An update beyond 2000. J. Geophys. Res. Space Phys. 2009, 114, 114. [Google Scholar] [CrossRef] [Green Version]
- Malm, W.C.; Walther, E.G.; Cudney, R.A. The Effects of Water Vapor, Ozone and Aerosol on Atmospheric Turbidity. J. Appl. Meteorol. 1977, 16, 268–274. [Google Scholar] [CrossRef] [Green Version]
- Satheesh, S.K.; Ramanathan, V. Large differences in tropical aerosol forcing at the top of the atmosphere and Earth’s surface. Nature 2000, 405, 60–63. [Google Scholar] [CrossRef]
- Kanakidou, M.; Seinfeld, J.H.; Pandis, S.N.; Barnes, I.; Dentener, F.J.; Facchini, M.C.; van Dingenen, R.; Ervens, B.; Nenes, A.; Nielsen, C.J.; et al. Organic aerosol and global climate modelling: A review. Atmos. Chem. Phys. Discuss. 2004, 4, 5855–6024. [Google Scholar] [CrossRef] [Green Version]
- Radke, L.F.; Coakley, J.A.; King, M.D. Direct and Remote Sensing Observations of the Effects of Ships on Clouds. Science 1989, 246, 1146–1149. [Google Scholar] [CrossRef] [Green Version]
- Andreae, M.O.; Rosenfeld, D. Aerosol–cloud–precipitation interactions. Part 1. The nature and sources of cloud-active aerosols. Earth-Sci. Rev. 2008, 89, 13–41. [Google Scholar] [CrossRef]
- Norris, J.R.; Wild, M. Trends in aerosol radiative effects over Europe inferred from observed cloud cover, solar “dimming,” and solar “brightening”. J. Geophys. Res. Space Phys. 2007, 112. [Google Scholar] [CrossRef] [Green Version]
- Qian, Y.; Kaiser, D.P.; Leung, L.R.; Xu, M. More frequent cloud-free sky and less surface solar radiation in China from 1955 to 2000. Geophys. Res. Lett. 2006, 33. [Google Scholar] [CrossRef] [Green Version]
- Tzanis, C.G.; Varotsos, C. Tropospheric aerosol forcing of climate: A case study for the greater area of Greece. Int. J. Remote. Sens. 2008, 29, 2507–2517. [Google Scholar] [CrossRef]
- Boucher, O.; Pham, M. History of sulfate aerosol radiative forcings. Geophys. Res. Lett. 2002, 29. [Google Scholar] [CrossRef]
- Kaufman, Y.J.; Tanre, D.; Holben, B.N.; Mattoo, S.; Remer, L.A.; Eck, T.F.; Vaughan, J.; Chatenet, B. Aerosol Radiative Impact on Spectral Solar Flux at the Surface, Derived from Principal-Plane Sky Measurements. J. Atmos. Sci. 2002, 59, 635–646. [Google Scholar] [CrossRef] [Green Version]
- Obregón, M.A.; Costa, M.J.; Serrano, A.; Silva, A.M. Effect of water vapor in the SW and LW downward irradiance at the surface during a day with low aerosol load. In Proceedings of the IOP Conference Series: Earth and Environmental Science, Elche, Spain, 29 June–1 July 2015; IOP Publishing: Bristol, UK, 2015; p. 12009. [Google Scholar]
- Hakuba, M.Z.; Folini, D.; Wild, M. On the Zonal Near-Constancy of Fractional Solar Absorption in the Atmosphere. J. Clim. 2016, 29, 3423–3440. [Google Scholar] [CrossRef]
- Donohoe, A.; Battisti, D.S. What Determines Meridional Heat Transport in Climate Models? J. Clim. 2012, 25, 3832–3850. [Google Scholar] [CrossRef]
- Schwarz, M.; Folini, D.; Yang, S.; Wild, M. The Annual Cycle of Fractional Atmospheric Shortwave Absorption in Observations and Models: Spatial Structure, Magnitude, and Timing. J. Clim. 2019, 32, 6729–6748. [Google Scholar] [CrossRef]
- Fu, D.; Song, Z.; Zhang, X.; Xia, X.; Wang, J.; Che, H.; Wu, H.; Tang, X.; Zhang, J.; Duan, M. Mitigating MODIS AOD non-random sampling error on surface PM2.5 estimates by a combined use of Bayesian Maximum Entropy method and linear mixed-effects model. Atmos. Pollut. Res. 2020, 11, 482–490. [Google Scholar] [CrossRef]
- Song, Z.; Fu, D.; Zhang, X.; Wu, Y.; Xia, X.; He, J.; Han, X.; Zhang, R.; Che, H. Diurnal and seasonal variability of PM2.5 and AOD in North China plain: Comparison of MERRA-2 products and ground measurements. Atmos. Environ. 2018, 191, 70–78. [Google Scholar] [CrossRef]
- Zhang, J.; Xia, X.; Zong, X.; Fan, X.; Chen, H.; Li, J. Dust Properties and Radiative Impacts at a Suburban Site during 2004–2017 in the North China Plain. Remote. Sens. 2019, 11, 1842. [Google Scholar] [CrossRef] [Green Version]
- Cao, L.Q.; Yu, J.H.; Ge, Z.X. Water vapor content in the atmosphere and its variation trend over North China. Adv. Water Sci. 2005, 16, 439–443. [Google Scholar] [CrossRef]
- Zhang, X.; Xia, X.; Xuan, C. On the drivers of variability and trend of surface solar radiation in Beijing metropolitan area. Int. J. Clim. 2014, 35, 452–461. [Google Scholar] [CrossRef]
- Song, J.; Xia, X.; Che, H.; Wang, J.; Zhang, X.; Li, X. Daytime variation of aerosol optical depth in North China and its impact on aerosol direct radiative effects. Atmos. Environ. 2018, 182, 31–40. [Google Scholar] [CrossRef]
- Che, H.; Xia, X.; Zhu, J.; Li, Z.; Dubovik, O.; Holben, B.; Goloub, P.; Chen, H.; Estelles, V.; Cuevas, E.; et al. Column aerosol optical properties and aerosol radiative forcing during a serious haze-fog month over North China Plain in 2013 based on ground-based sunphotometer measurements. Atmos. Chem. Phys. Discuss. 2014, 14, 2125–2138. [Google Scholar] [CrossRef] [Green Version]
- King, M.D.; Menzel, W.P.; Kaufman, Y.; Tanre, D.; Gao, B.-C.; Platnick, S.; Ackerman, S.; Remer, L.; Pincus, R.; Hubanks, P. Cloud and aerosol properties, precipitable water, and profiles of temperature and water vapor from MODIS. IEEE Trans. Geosci. Remote. Sens. 2003, 41, 442–458. [Google Scholar] [CrossRef] [Green Version]
- Levy, R.C.; Mattoo, S.; Munchak, L.A.; Remer, L.A.; Sayer, A.M.; Patadia, F.; Hsu, N.C. The Collection 6 MODIS aerosol products over land and ocean. Atmos. Meas. Tech. 2013, 6, 2989–3034. [Google Scholar] [CrossRef] [Green Version]
- Sayer, A.M.; Munchak, L.A.; Hsu, N.C.; Levy, R.C.; Bettenhausen, C.; Jeong, M.-J. MODIS Collection 6 aerosol products: Comparison between Aqua’s e-Deep Blue, Dark Target, and “merged” data sets, and usage recommendations. J. Geophys. Res. Atmos. 2014, 119, 13965–13989. [Google Scholar] [CrossRef]
- Ruiz-Arias, J.A.; Dudhia, J.; Gueymard, C.A.; Pozo-Vazquez, D. Assessment of the Level-3 MODIS daily aerosol optical depth in the context of surface solar radiation and numerical weather modeling. Atmos. Chem. Phys. Discuss. 2013, 13, 675–692. [Google Scholar] [CrossRef] [Green Version]
- Kinne, S.; Schulz, M.; Textor, C.; Guibert, S.; Balkanski, Y.; Bauer, S.E.; Berntsen, T.; Berglen, T.F.; Boucher, O.; Chin, M.; et al. An AeroCom initial assessment—Optical properties in aerosol component modules of global models. Atmos. Chem. Phys. Discuss. 2006, 6, 1815–1834. [Google Scholar] [CrossRef] [Green Version]
- Lacagnina, C.; Hasekamp, O.P.; Bian, H.S.; Curci, G.; Myhre, G.; van Noije, T.; Schulz, M.; Skeie, R.B.; Takemura, T.; Zhang, K. Aerosol single-scattering albedo over the global oceans: Comparing PARASOL retrievals with AERONET, OMI, and AeroCom models estimates. J. Geophys. Res. Atmos. 2015, 120, 9814–9836. [Google Scholar] [CrossRef] [Green Version]
- Holben, B.; Eck, T.; Slutsker, I.; Tanre, D.; Buis, J.; Setzer, A.; Vermote, E.; Reagan, J.; Kaufman, Y.; Nakajima, T.; et al. AERONET—A Federated Instrument Network and Data Archive for Aerosol Characterization. Remote. Sens. Environ. 1998, 66, 1–16. [Google Scholar] [CrossRef]
- Boilley, A.; Wald, L. Comparison between meteorological re-analyses from ERA-Interim and MERRA and measurements of daily solar irradiation at surface. Renew. Energy 2015, 75, 135–143. [Google Scholar] [CrossRef]
- Zhang, Y.; Cai, C.; Chen, B.; Dai, W. Consistency Evaluation of Precipitable Water Vapor Derived from ERA5, ERA-Interim, GNSS, and Radiosondes Over China. Radio Sci. 2019, 54, 561–571. [Google Scholar] [CrossRef]
- Gelaro, R.; Mccarty, W.; Suárez, M.J.; Todling, R.; Molod, A.; Takacs, L.; Randles, C.; Darmenov, A.; Bosilovich, M.G.; Reichle, R.H.; et al. The Modern-Era Retrospective Analysis for Research and Applications, Version 2 (MERRA-2). J. Clim. 2017, 30, 5419–5454. [Google Scholar] [CrossRef] [PubMed]
- Molod, A.; Takács, L.; Suárez, M.; Bacmeister, J. Development of the GEOS-5 atmospheric general circulation model: Evolution from MERRA to MERRA2. Geosci. Model Dev. 2015, 8, 1339–1356. [Google Scholar] [CrossRef] [Green Version]
- Müller, R.; Matsoukas, C.; Gratzki, A.; Behr, H.; Hollmann, R. The CM-SAF operational scheme for the satellite based retrieval of solar surface irradiance—A LUT based eigenvector hybrid approach. Remote. Sens. Environ. 2009, 113, 1012–1024. [Google Scholar] [CrossRef]
- Emde, C.; Buras-Schnell, R.; Kylling, A.; Mayer, B.; Gasteiger, J.; Hamann, U.; Kylling, J.; Richter, B.; Pause, C.; Dowling, T.; et al. The libRadtran software package for radiative transfer calculations (Version 2.0). Geosci. Model Dev. Discuss. 2015, 8, 10237–10303. [Google Scholar] [CrossRef] [Green Version]
- Christopher, S.; Zhang, J.; Kaufman, Y.J.; Remer, L.A. Satellite-based assessment of top of atmosphere anthropogenic aerosol radiative forcing over cloud-free oceans. Geophys. Res. Lett. 2006, 33. [Google Scholar] [CrossRef] [Green Version]
- Silvestre, M.R.; Silvestre, M.R. Temporal decomposition, and harmonic regression models: A comparison to the series of monthly average minimum and maximum temperature at presidente prudente (sp). Rev. Bras. Meteorol. 2015, 30, 157–185. [Google Scholar]
- Levine, D.; Crews, K. Time series harmonic regression analysis reveals seasonal vegetation productivity trends in semi-arid savannas. Int. J. Appl. Earth Obs. Geoinform. 2019, 80, 94–101. [Google Scholar] [CrossRef]
- Weatherhead, E.; Reinsel, G.C.; Tiao, G.C.; Meng, X.-L.; Choi, D.; Cheang, W.-K.; Keller, T.; de Luisi, J.; Wuebbles, D.J.; Kerr, J.B.; et al. Factors affecting the detection of trends: Statistical considerations and applications to environmental data. J. Geophys. Res. Space Phys. 1998, 103, 17149–17161. [Google Scholar] [CrossRef]
- Bartók, B. Aerosol radiative effects under clear skies over Europe and their changes in the period of 2001–2012. Int. J. Clim. 2016, 37, 1901–1909. [Google Scholar] [CrossRef]
- Long, C.N.; Ackerman, T.P. Identification of clear skies from broadband pyranometer measurements and calculation of downwelling shortwave cloud effects. J. Geophys. Res. Space Phys. 2000, 105, 15609–15626. [Google Scholar] [CrossRef]
- Otunla, T.A. Estimates of clear-sky solar irradiances over Nigeria. Renew. Energy 2019, 131, 778–787. [Google Scholar] [CrossRef]
- Zhang, C.; Wen, M. Using Satellite Data to Estimate Solar Radiation of Clear Sky over Fujian. J. Nat. Res. 2014, 29, 1496–1507. [Google Scholar]
- Song, Z.; Fu, D.; Zhang, X.; Han, X.; Song, J.; Zhang, J.; Wang, J.; Xia, X. MODIS AOD sampling rate and its effect on PM2.5 estimation in North China. Atmos. Environ. 2019, 209, 14–22. [Google Scholar] [CrossRef]
- Feng, N.; Christopher, S. Clear sky direct radiative effects of aerosols over Southeast Asia based on satellite observations and radiative transfer calculations. Remote. Sens. Environ. 2014, 152, 333–344. [Google Scholar] [CrossRef]
- Marty, C.; Philipona, R.; Fröhlich, C.; Ohmura, A.; Marty, C. Altitude dependence of surface radiation fluxes and cloud forcing in the alps: Results from the alpine surface radiation budget network. Theor. Appl. Clim. 2002, 72, 137–155. [Google Scholar] [CrossRef]
- Qian, X.; Yao, Y.Q.; Li, J.R.; Yin, J.; Ma, J.L. The Distribution of Precipitable Water Vapor over China. Acta Astronom. Sin. 2012, 53, 325–341. [Google Scholar]
- Yu, M.; Ellis, J.E.; Epstein, H.E. Regional Analysis of Climate, Primary Production, and Livestock Density in Inner Mongolia. J. Environ. Qual. 2004, 33, 1675–1681. [Google Scholar] [CrossRef] [PubMed]
- Xia, X.; Chen, H.B.; Wang, P.C.; Zhang, W.X.; Goloub, P.; Chatenet, B.; Eck, T.F.; Holben, B.N. Variation of column-integrated aerosol properties in a Chinese urban region. J. Geophys. Res. Space Phys. 2006, 111, 05204. [Google Scholar] [CrossRef]
- Huang, R.-J.; Zhang, Y.; Bozzetti, C.; Ho, K.F.; Cao, J.; Han, Y.; Daellenbach, K.R.; Slowik, J.G.; Platt, S.; Canonaco, F.; et al. High secondary aerosol contribution to particulate pollution during haze events in China. Nature 2014, 514, 218–222. [Google Scholar] [CrossRef] [PubMed] [Green Version]
- Pani, S.K.; Lin, N.-H.; Chantara, S.; Wang, S.-H.; Khamkaew, C.; Prapamontol, T.; Janjai, S. Radiative response of biomass-burning aerosols over an urban atmosphere in northern peninsular Southeast Asia. Sci. Total. Environ. 2018, 633, 892–911. [Google Scholar] [CrossRef] [PubMed]
- Gautam, R.; Hsu, N.C.; Eck, T.F.; Holben, B.N.; Janjai, S.; Jantarach, T.; Tsay, S.-C.; Lau, W.K. Characterization of aerosols over the Indochina peninsula from satellite-surface observations during biomass burning pre-monsoon season. Atmos. Environ. 2013, 78, 51–59. [Google Scholar] [CrossRef]
- Luo, Y.; Zheng, X.; Zhao, T.; Chen, J. A climatology of aerosol optical depth over China from recent 10 years of MODIS remote sensing data. Int. J. Clim. 2013, 34, 863–870. [Google Scholar] [CrossRef]
- Sun, X.; Wang, P. How old is the Asian monsoon system? Paleobotanical records from China. Palaeogeogr. Palaeoclimatol. Palaeoecol. 2005, 222, 181–222. [Google Scholar] [CrossRef]
- He, J.; Ju, J.; Wen, Z.; Lu, J.; Jin, Q. A review of recent advances in research on Asian monsoon in China. Adv. Atmos. Sci. 2007, 24, 972–992. [Google Scholar] [CrossRef]
- Loeb, N.G.; Su, W. Direct Aerosol Radiative Forcing Uncertainty Based on a Radiative Perturbation Analysis. J. Clim. 2010, 23, 5288–5293. [Google Scholar] [CrossRef]
Figure 1.
Elevation map and stations distribution in the study area. DT, TY, HM, BJ, TJ, LT, FS, JN, JX, and ZZ represent Datong, Taiyuan, Houma, Beijing, Tianjin, Laoting, Fushan, Jinan, JUxian, and Zhengzhou, respectively.
Figure 1.
Elevation map and stations distribution in the study area. DT, TY, HM, BJ, TJ, LT, FS, JN, JX, and ZZ represent Datong, Taiyuan, Houma, Beijing, Tianjin, Laoting, Fushan, Jinan, JUxian, and Zhengzhou, respectively.

Figure 2.
Comparison between monthly observed and simulated clear-sky surface solar radiation (SSR) at (a) Beijing; (b) Datong; (c) Fushan; (d) Houma; (e) Jinan; (f) JUxian; (g) Laoting; (h) Taiyuan; (i) Tianjin; (j) Zhengzhou; and (k) all the sites.
Figure 2.
Comparison between monthly observed and simulated clear-sky surface solar radiation (SSR) at (a) Beijing; (b) Datong; (c) Fushan; (d) Houma; (e) Jinan; (f) JUxian; (g) Laoting; (h) Taiyuan; (i) Tianjin; (j) Zhengzhou; and (k) all the sites.

Figure 3.
Spatial distribution of annual averaged clear-sky SSR in northern China from 2001 to 2015.
Figure 3.
Spatial distribution of annual averaged clear-sky SSR in northern China from 2001 to 2015.
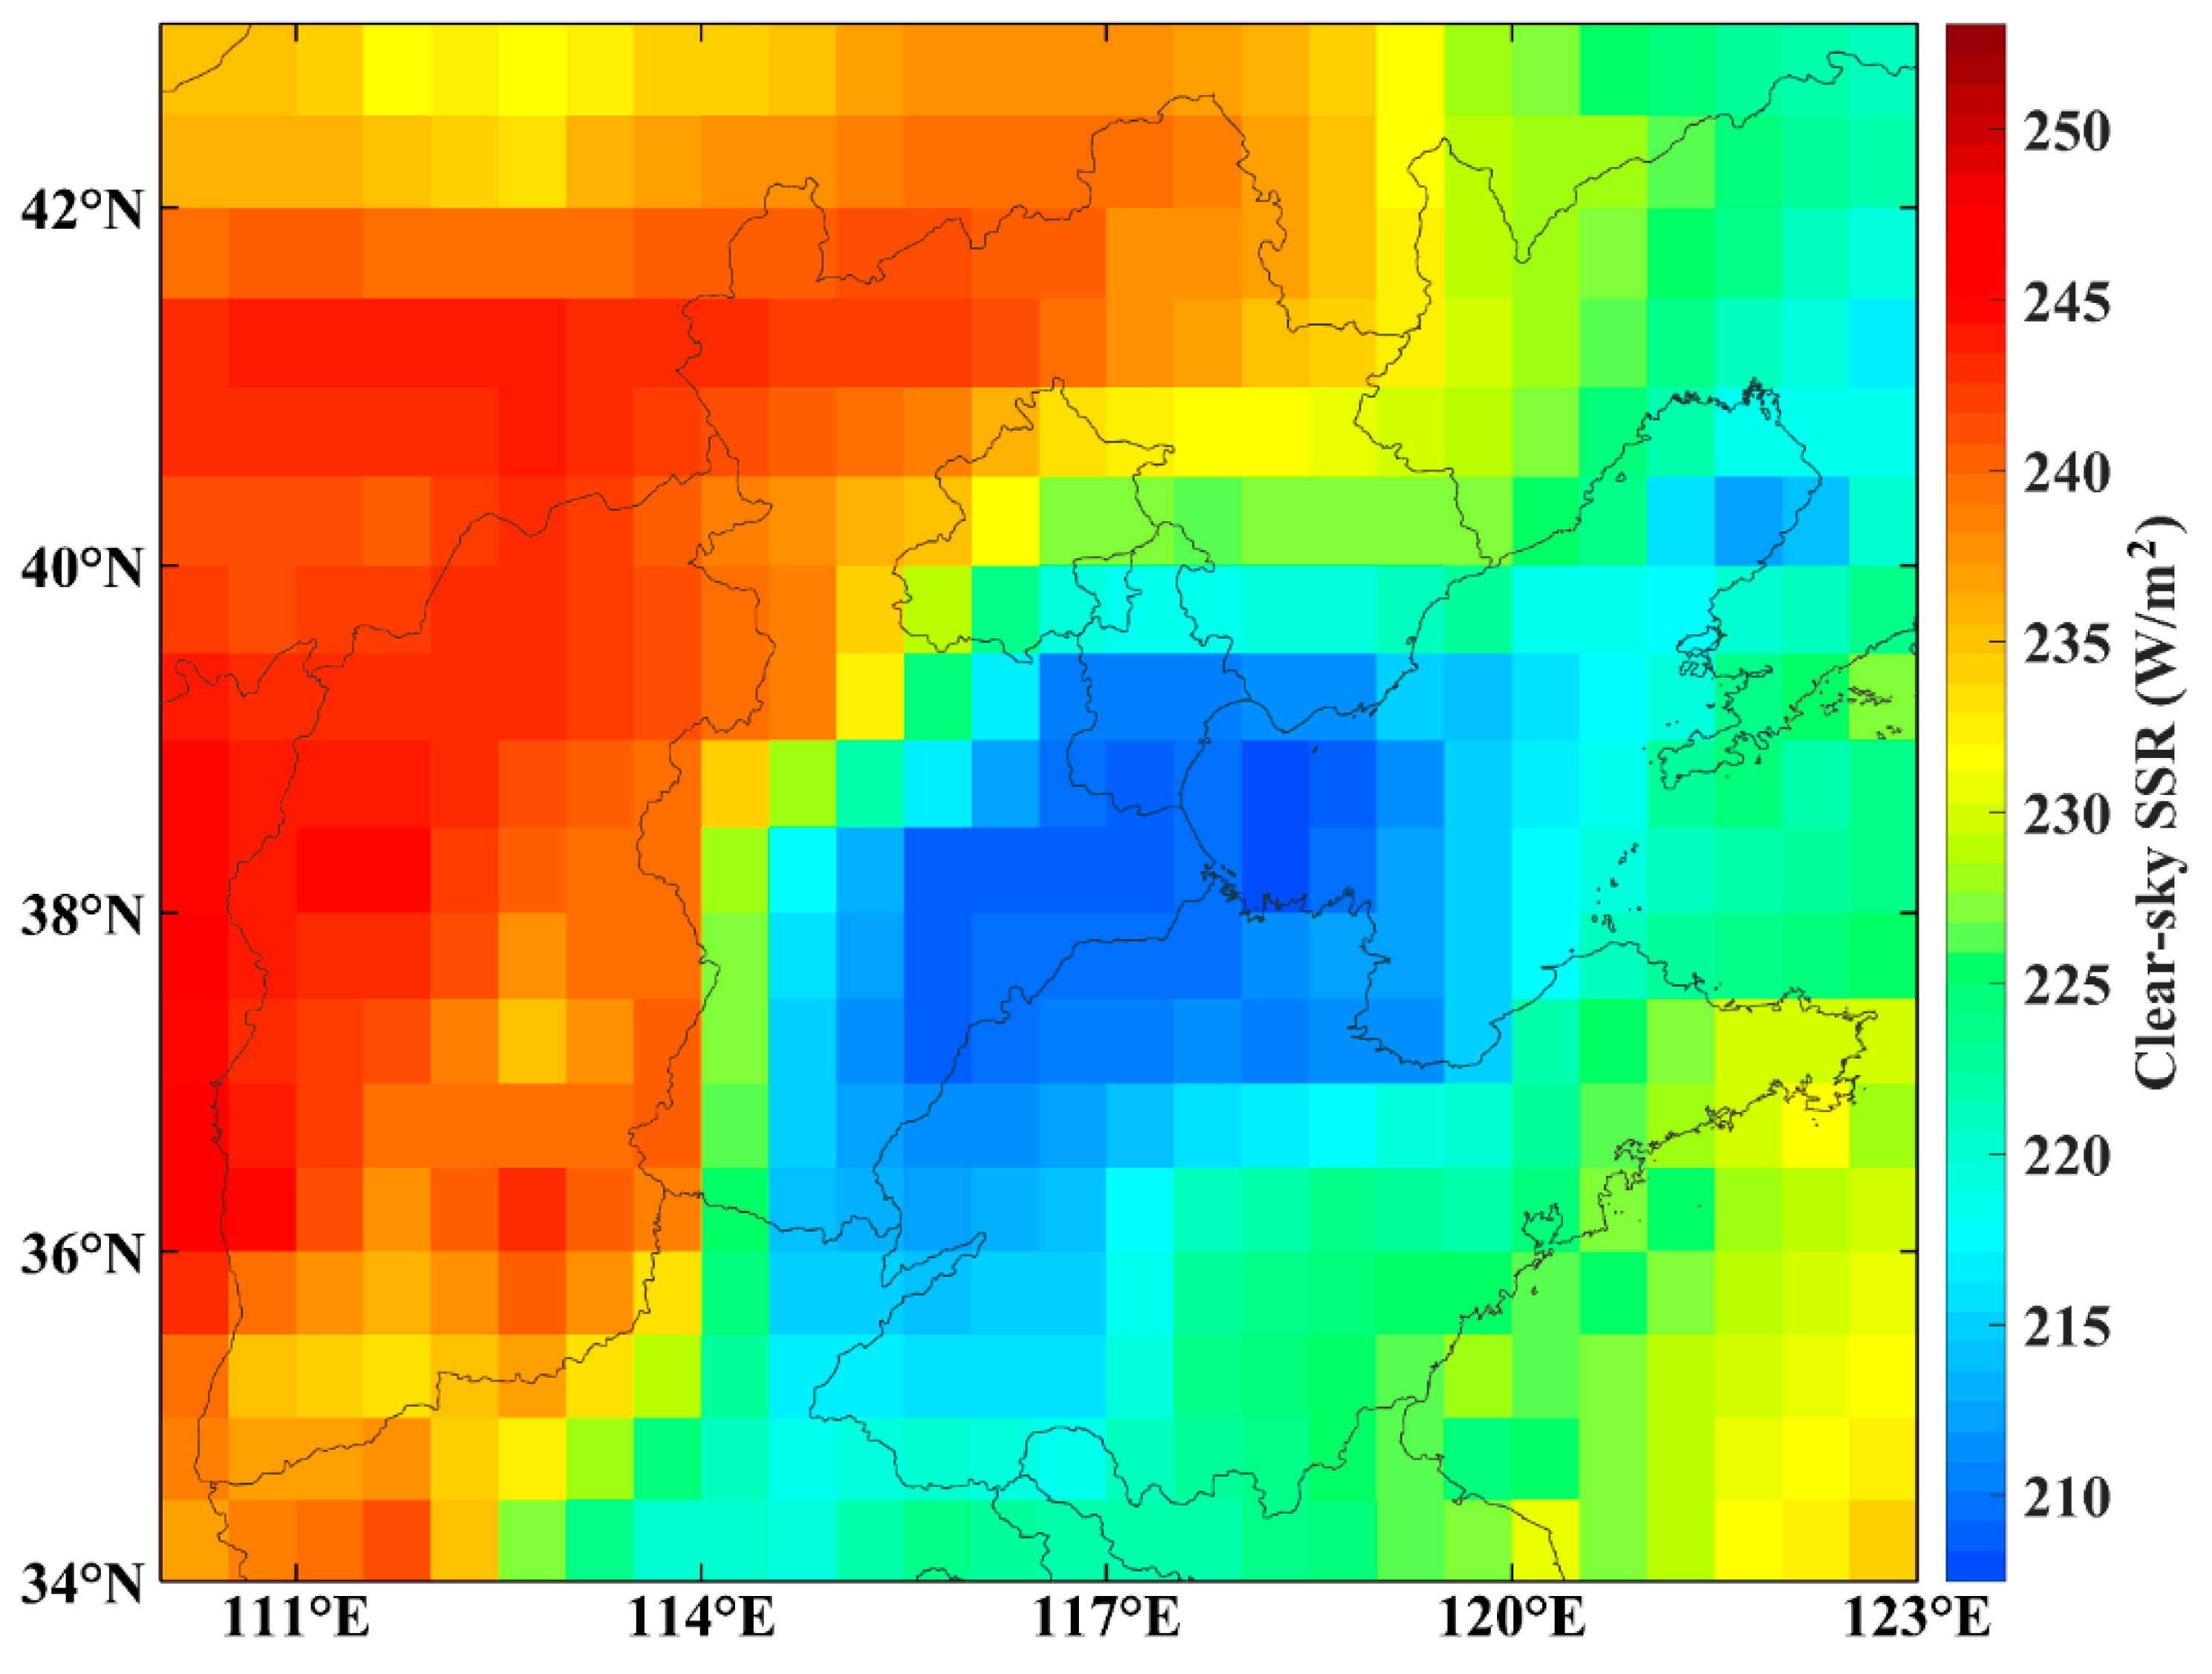
Figure 4.
Spatial distribution of annual averaged (a) aerosol direct radiative effect (ARE) and (b) water vapor radiative effect (WVRE) in northern China from 2001 to 2015.
Figure 4.
Spatial distribution of annual averaged (a) aerosol direct radiative effect (ARE) and (b) water vapor radiative effect (WVRE) in northern China from 2001 to 2015.
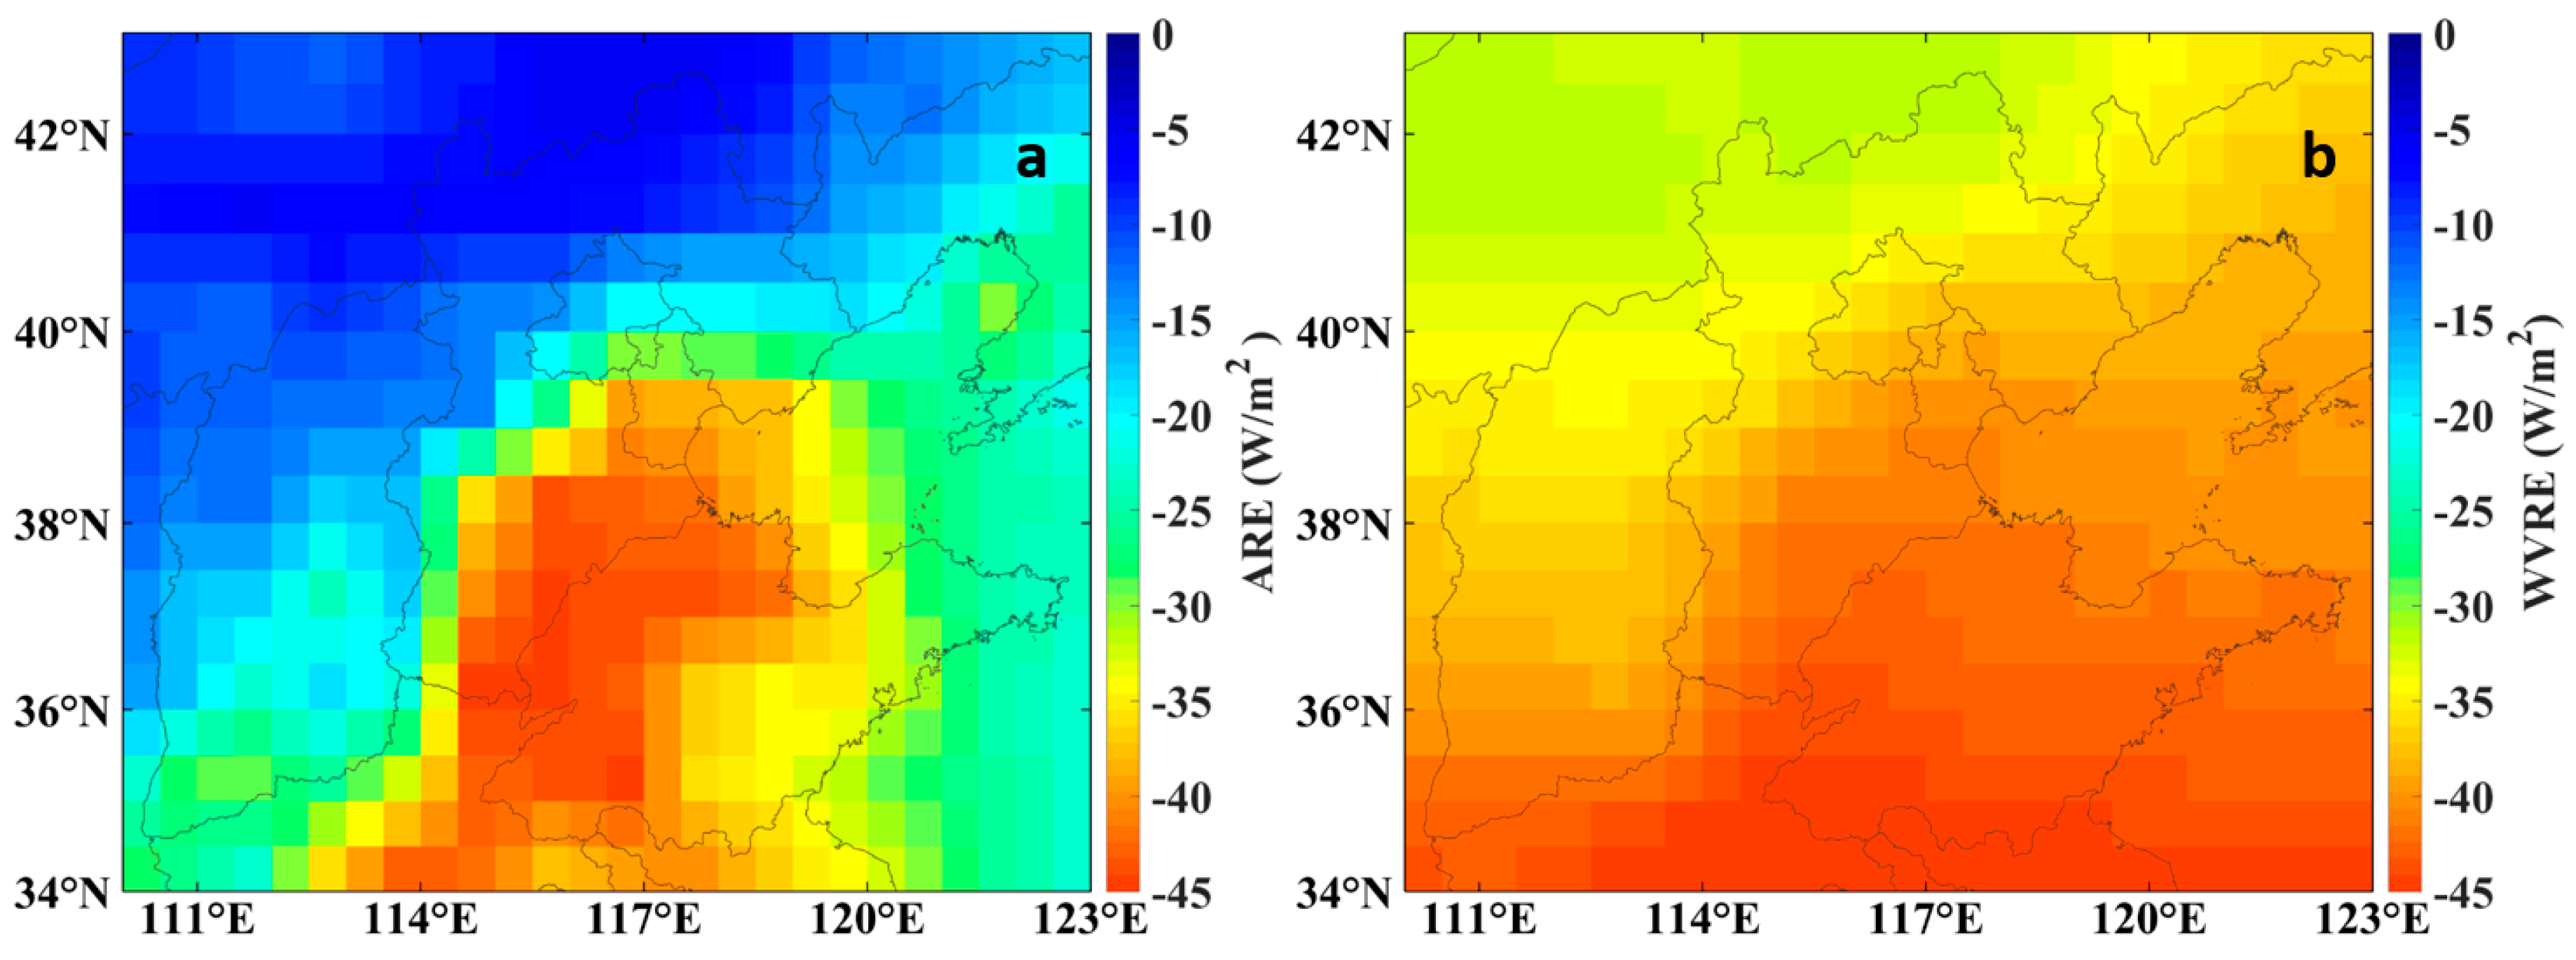
Figure 5.
Spatial distribution of seasonal mean clear-sky SSR in northern China from 2001 to 2015: (a) Spring; (b) Summer; (c) Autumn; and (d) Winter.
Figure 5.
Spatial distribution of seasonal mean clear-sky SSR in northern China from 2001 to 2015: (a) Spring; (b) Summer; (c) Autumn; and (d) Winter.
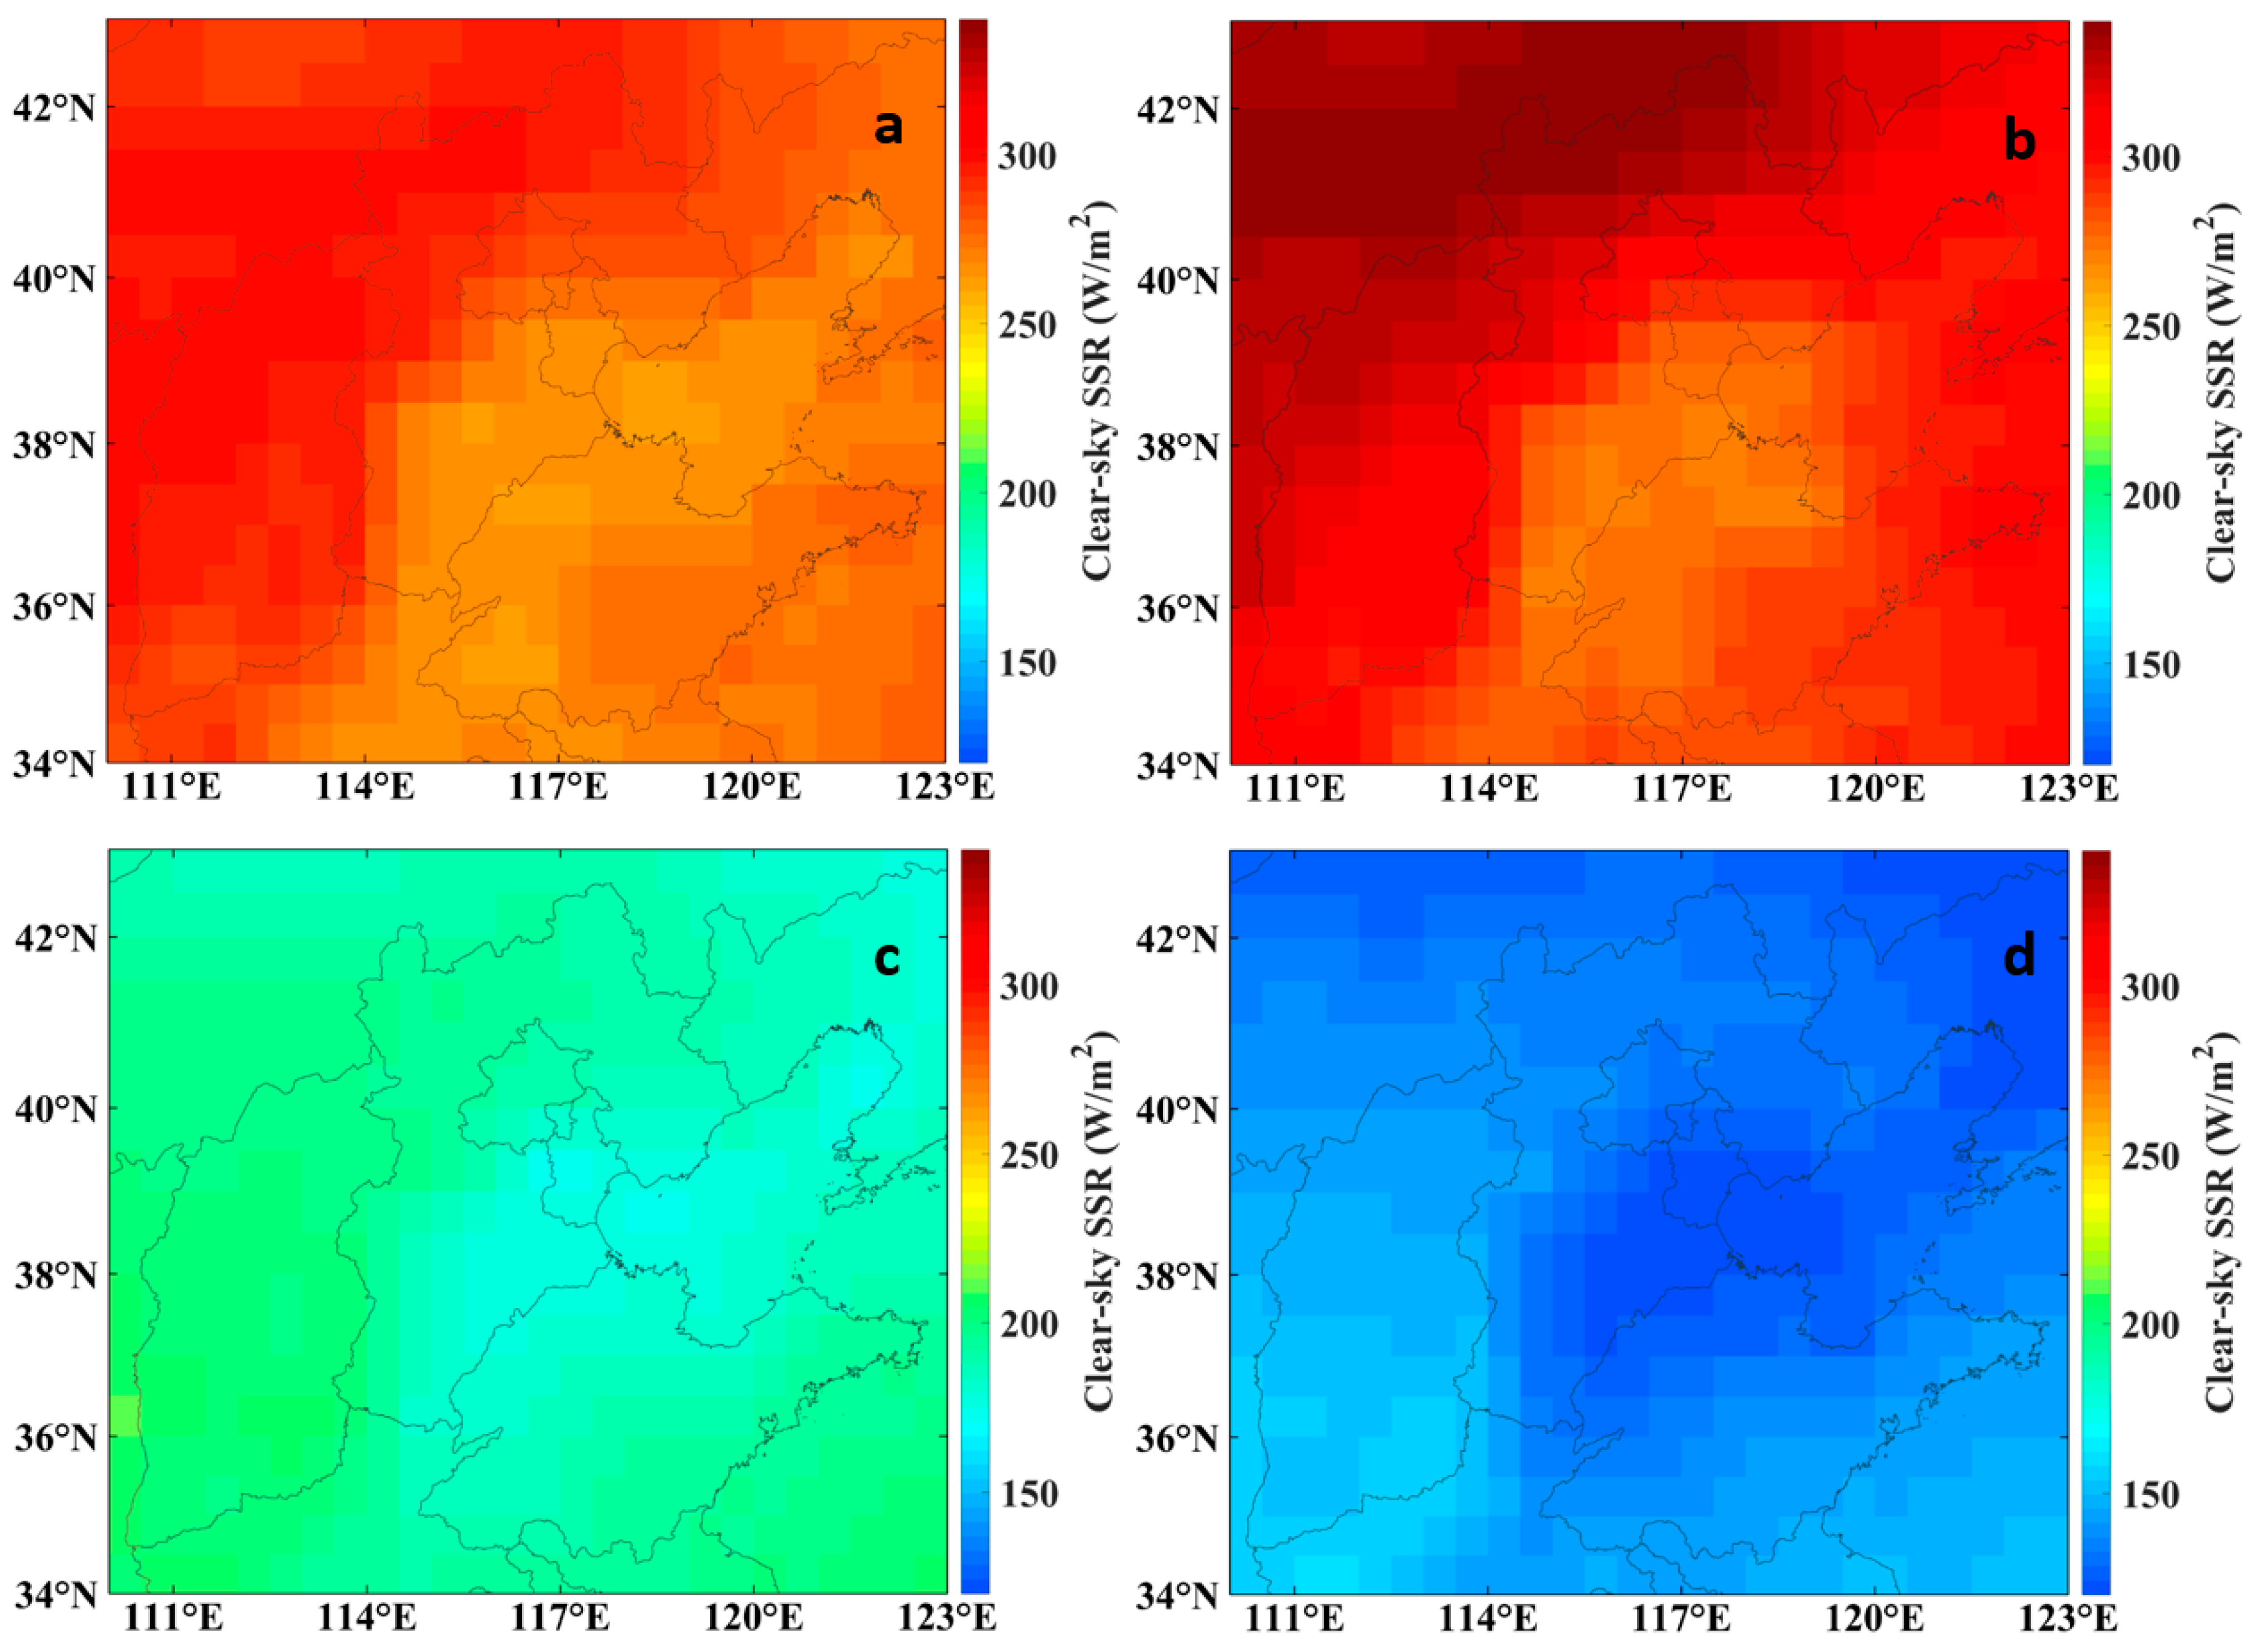
Figure 6.
Monthly variations of solar radiation at the top of atmosphere and clear-sky SSR in northern China during 2001–2015.
Figure 6.
Monthly variations of solar radiation at the top of atmosphere and clear-sky SSR in northern China during 2001–2015.

Figure 7.
Spatial distribution of seasonal mean ARE in northern China from 2001 to 2015: (a) Spring, (b) Summer, (c) Autumn, and (d) Winter.
Figure 7.
Spatial distribution of seasonal mean ARE in northern China from 2001 to 2015: (a) Spring, (b) Summer, (c) Autumn, and (d) Winter.
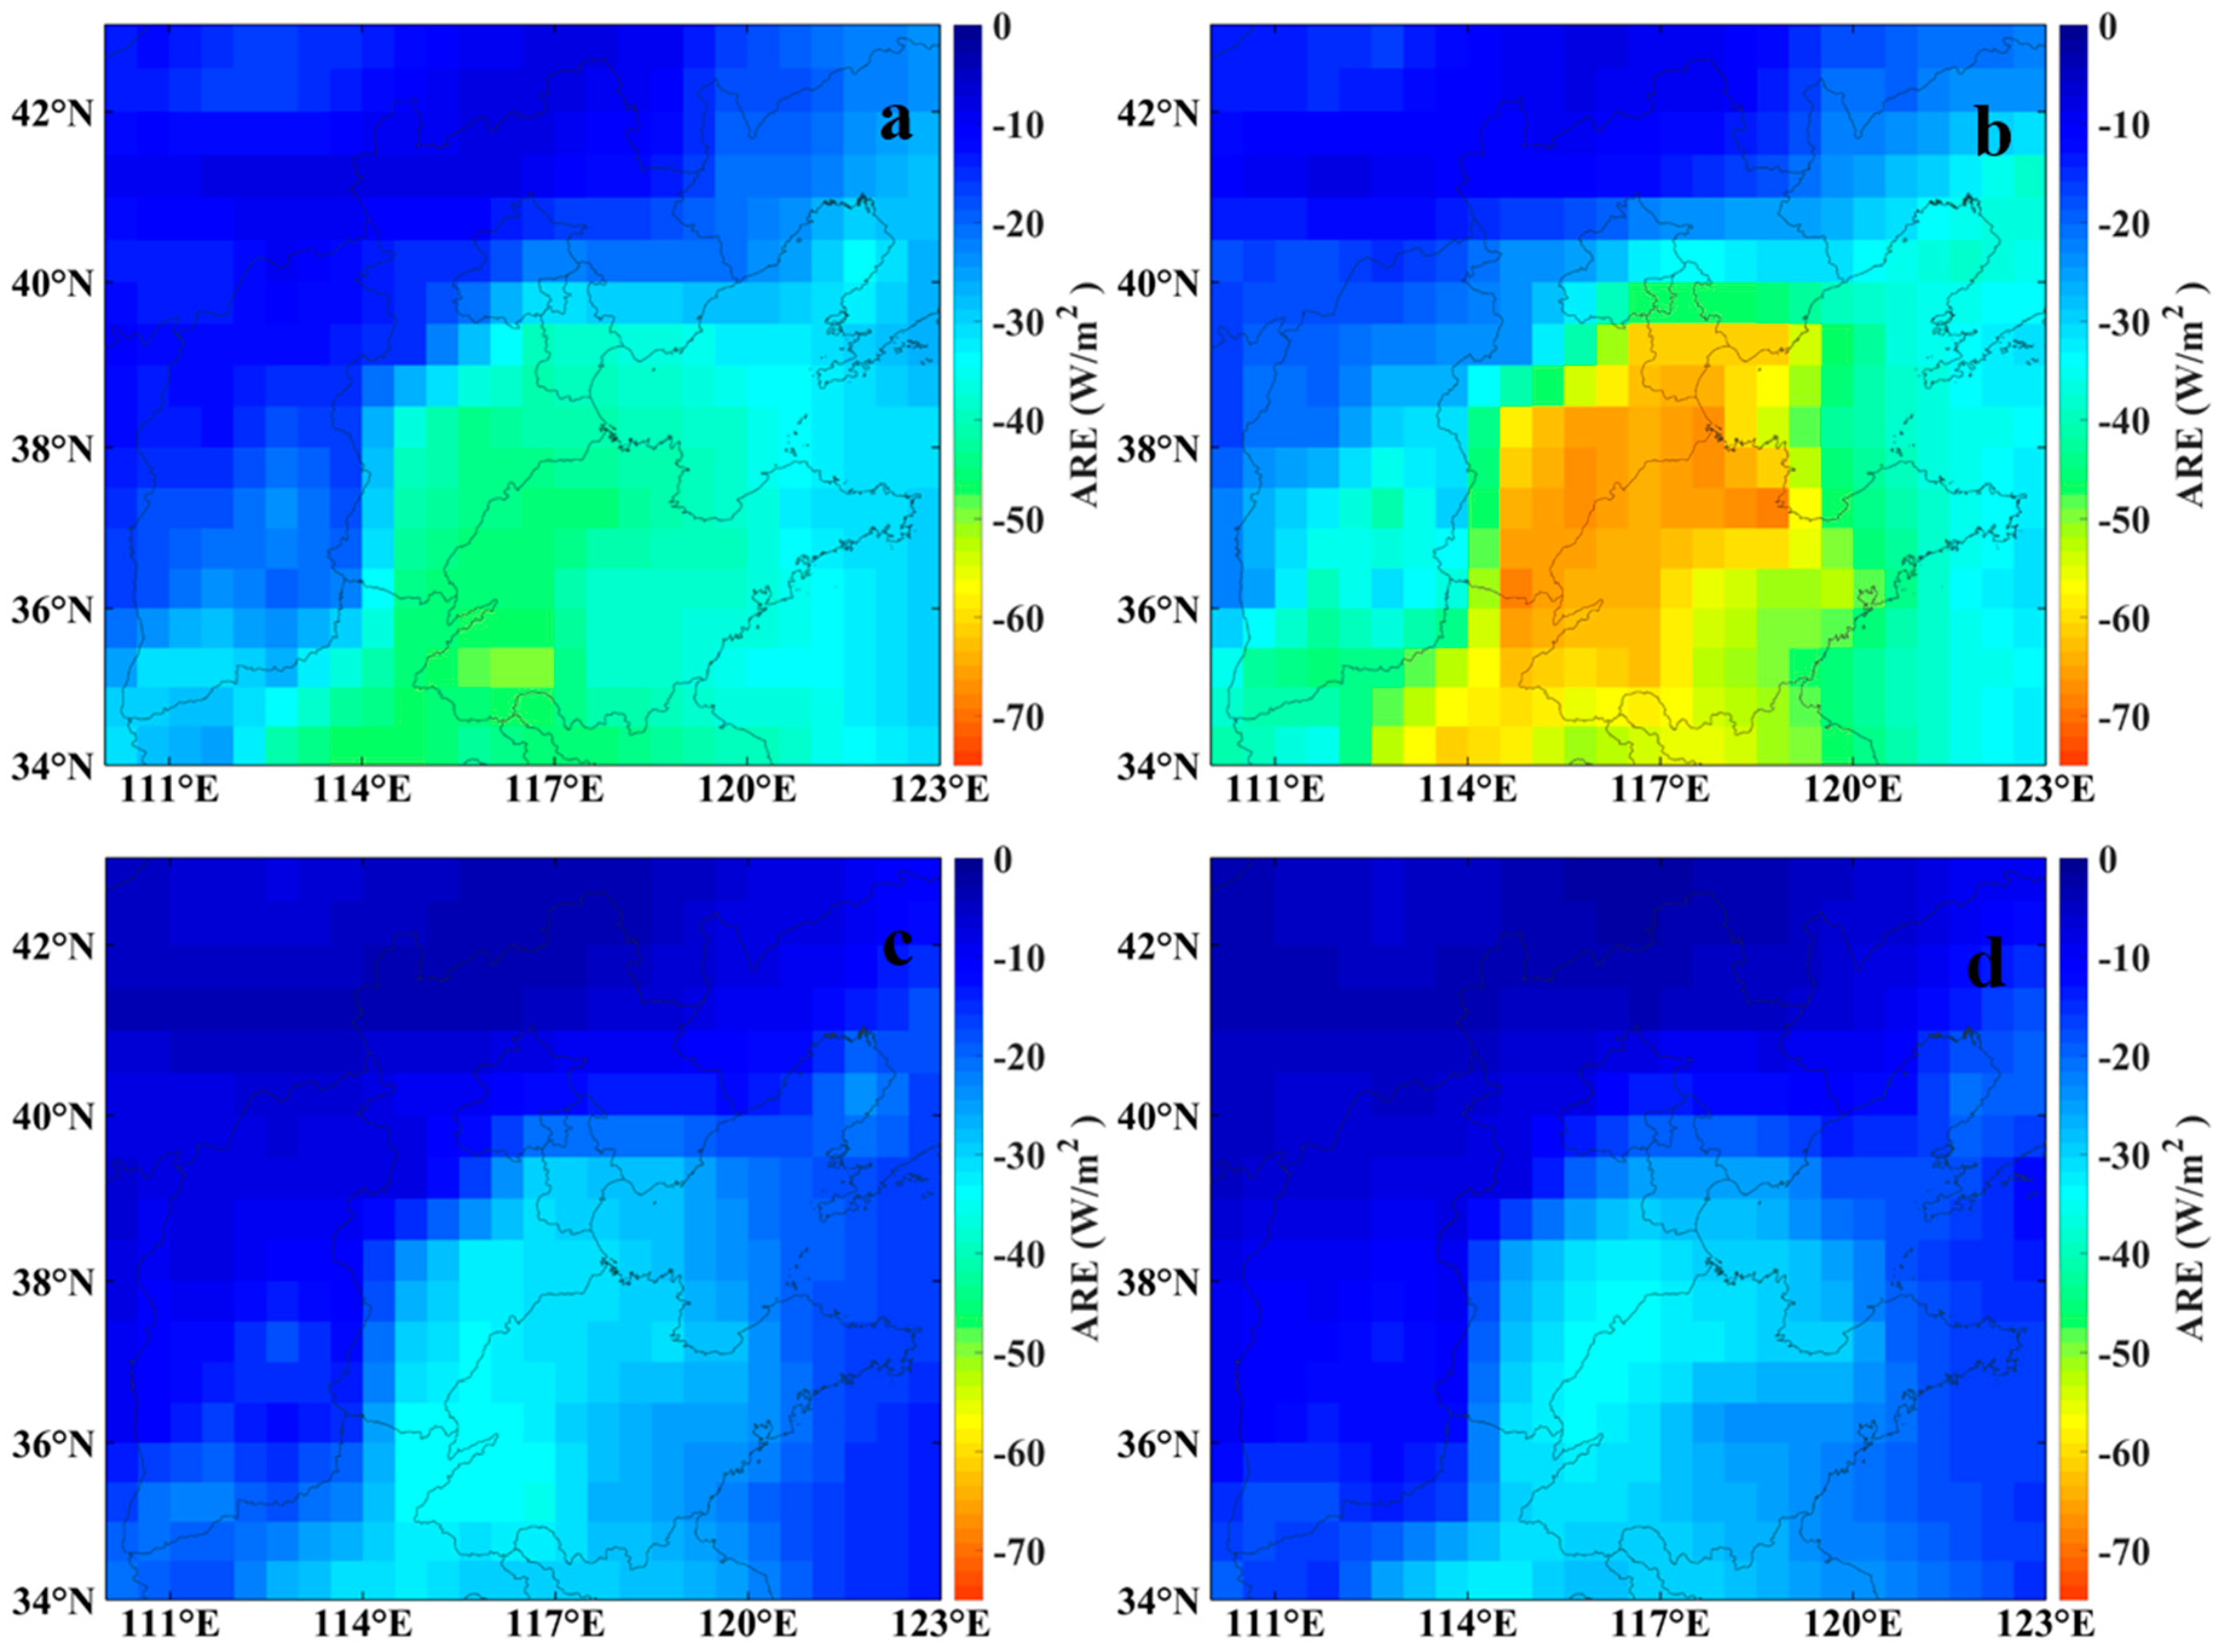
Figure 8.
Spatial distribution of seasonal mean WVRE in northern China from 2001 to 2015: (a) Spring, (b) Summer, (c) Autumn, and (d) Winter.
Figure 8.
Spatial distribution of seasonal mean WVRE in northern China from 2001 to 2015: (a) Spring, (b) Summer, (c) Autumn, and (d) Winter.
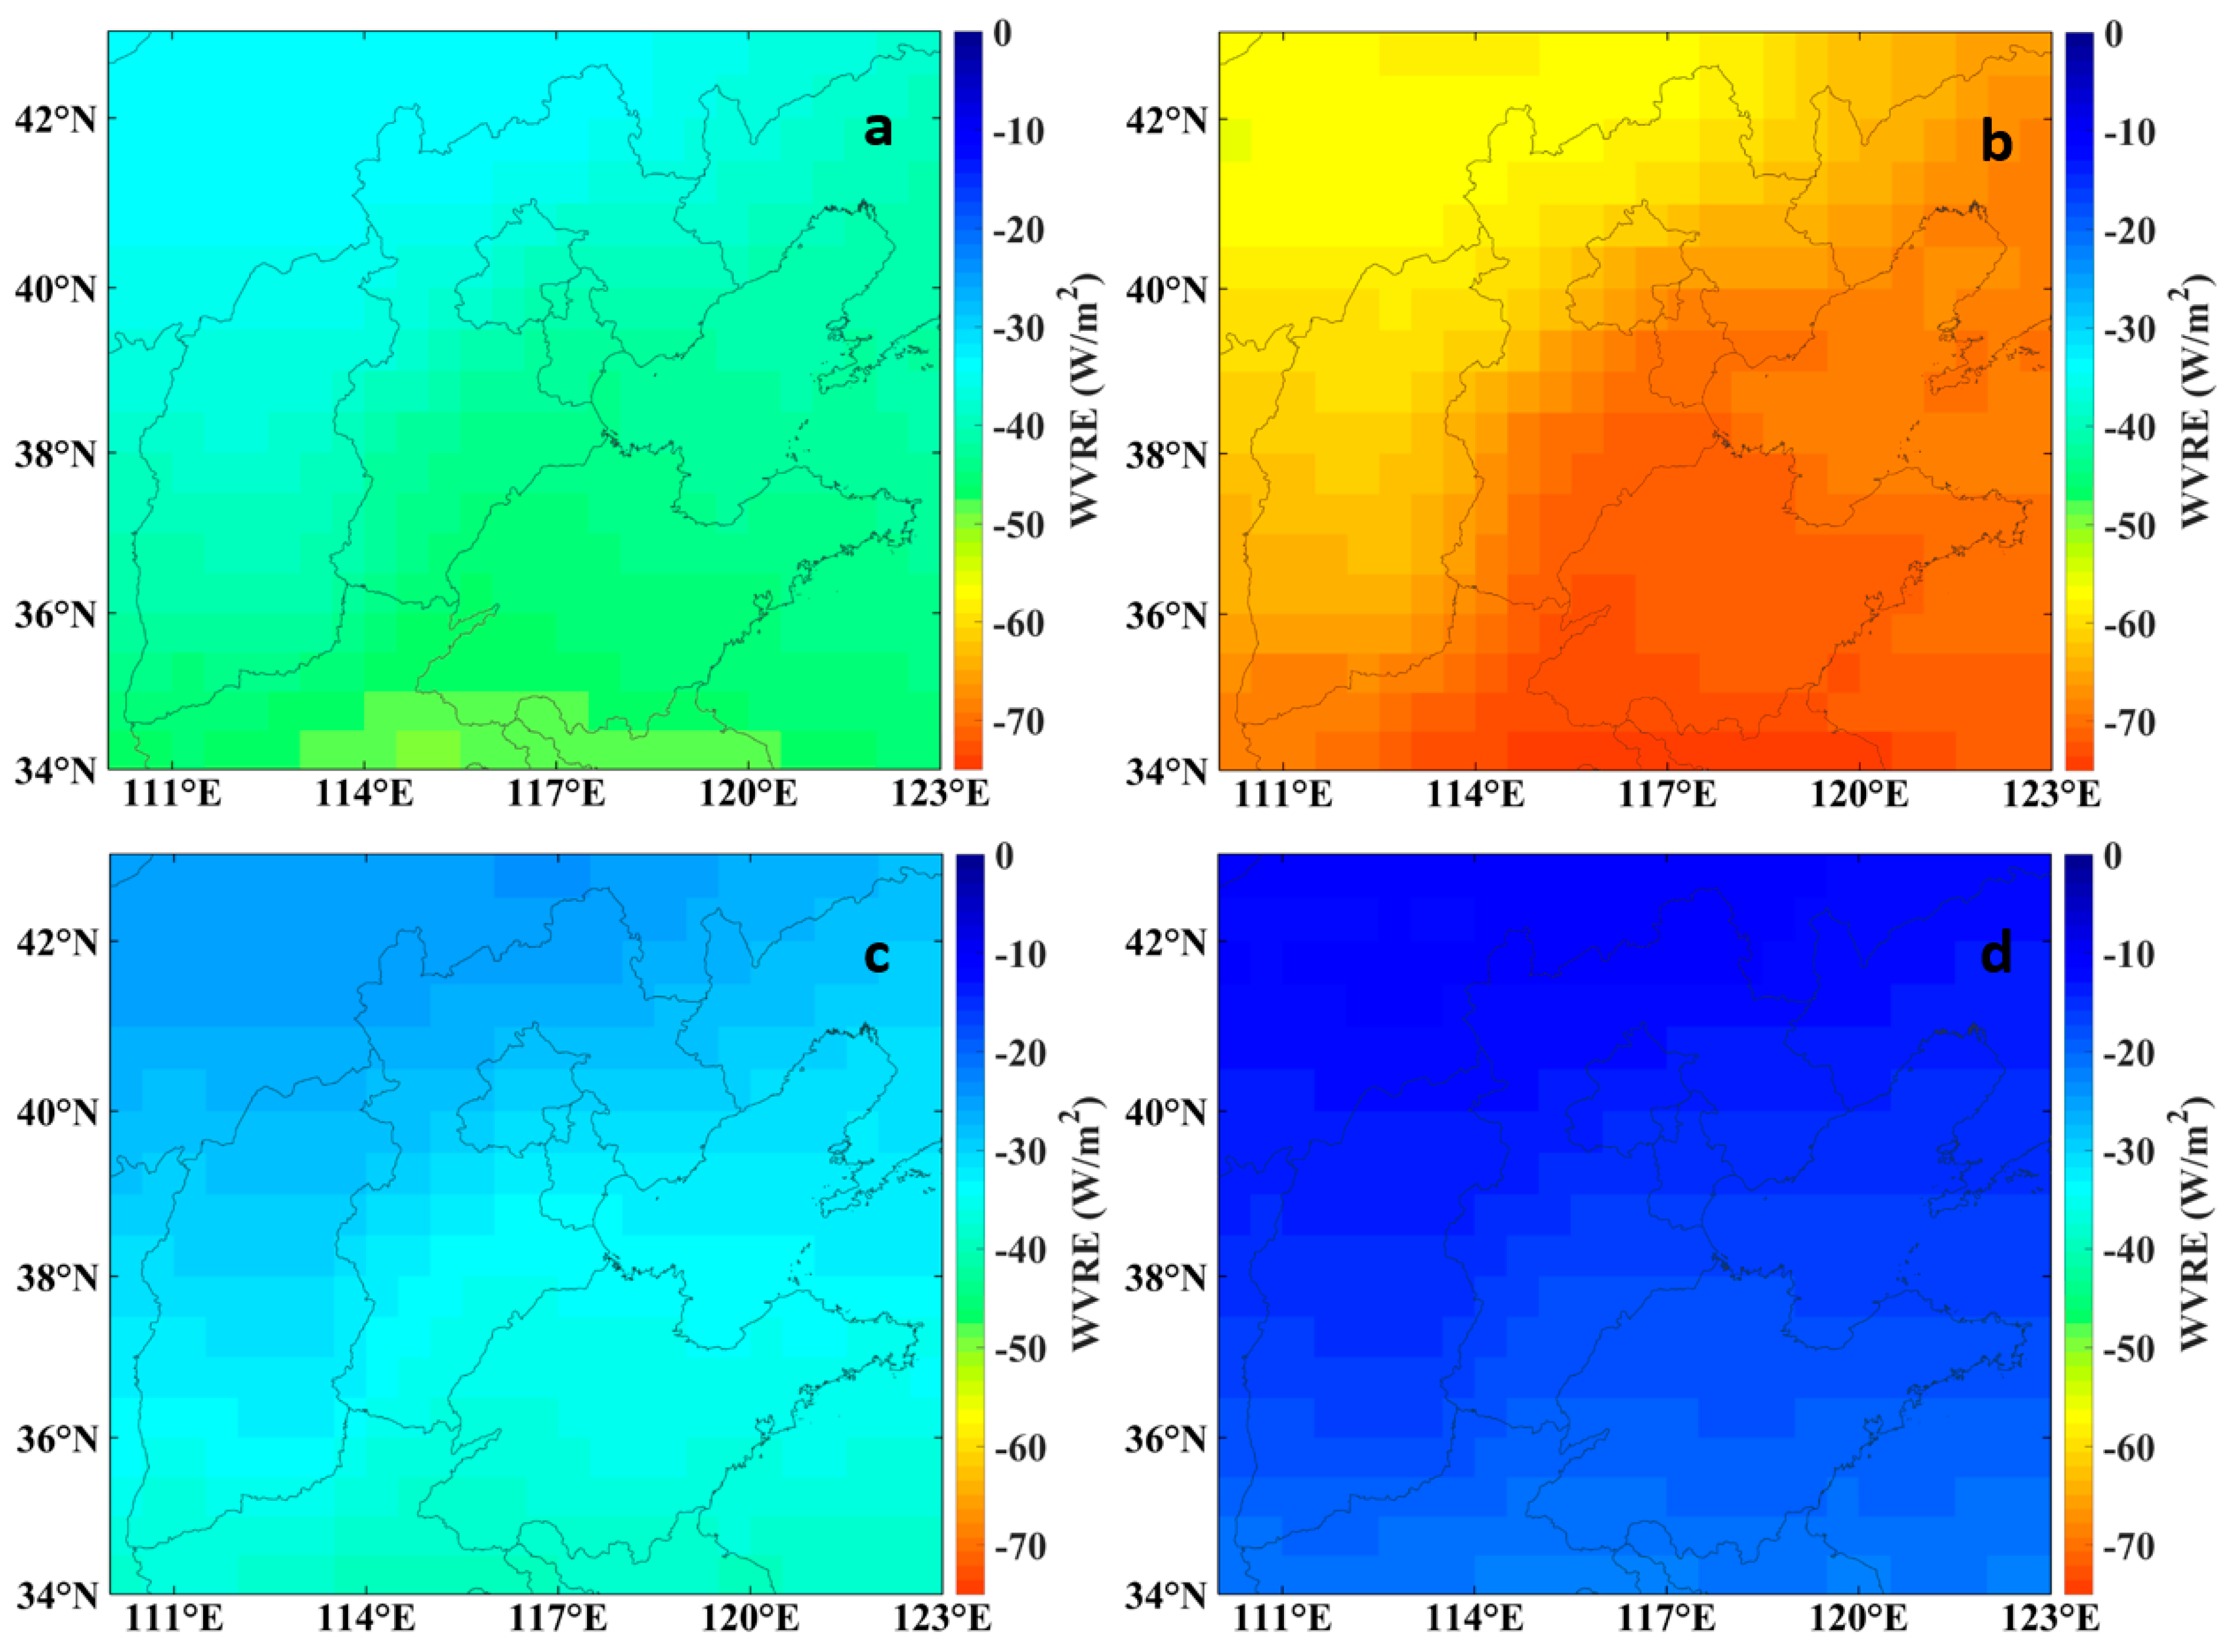
Figure 9.
Monthly variations of ARE and WVRE in northern China during 2001–2015.

Figure 10.
Monthly variations of aerosol optical depth (AOD) and water vapor in northern China during 2001–2015.
Figure 10.
Monthly variations of aerosol optical depth (AOD) and water vapor in northern China during 2001–2015.

Figure 11.
(a) Monthly clear-sky SSR time series and (b) deseasonalized clear-sky SSR trend in northern China from 2001 to 2015.
Figure 11.
(a) Monthly clear-sky SSR time series and (b) deseasonalized clear-sky SSR trend in northern China from 2001 to 2015.
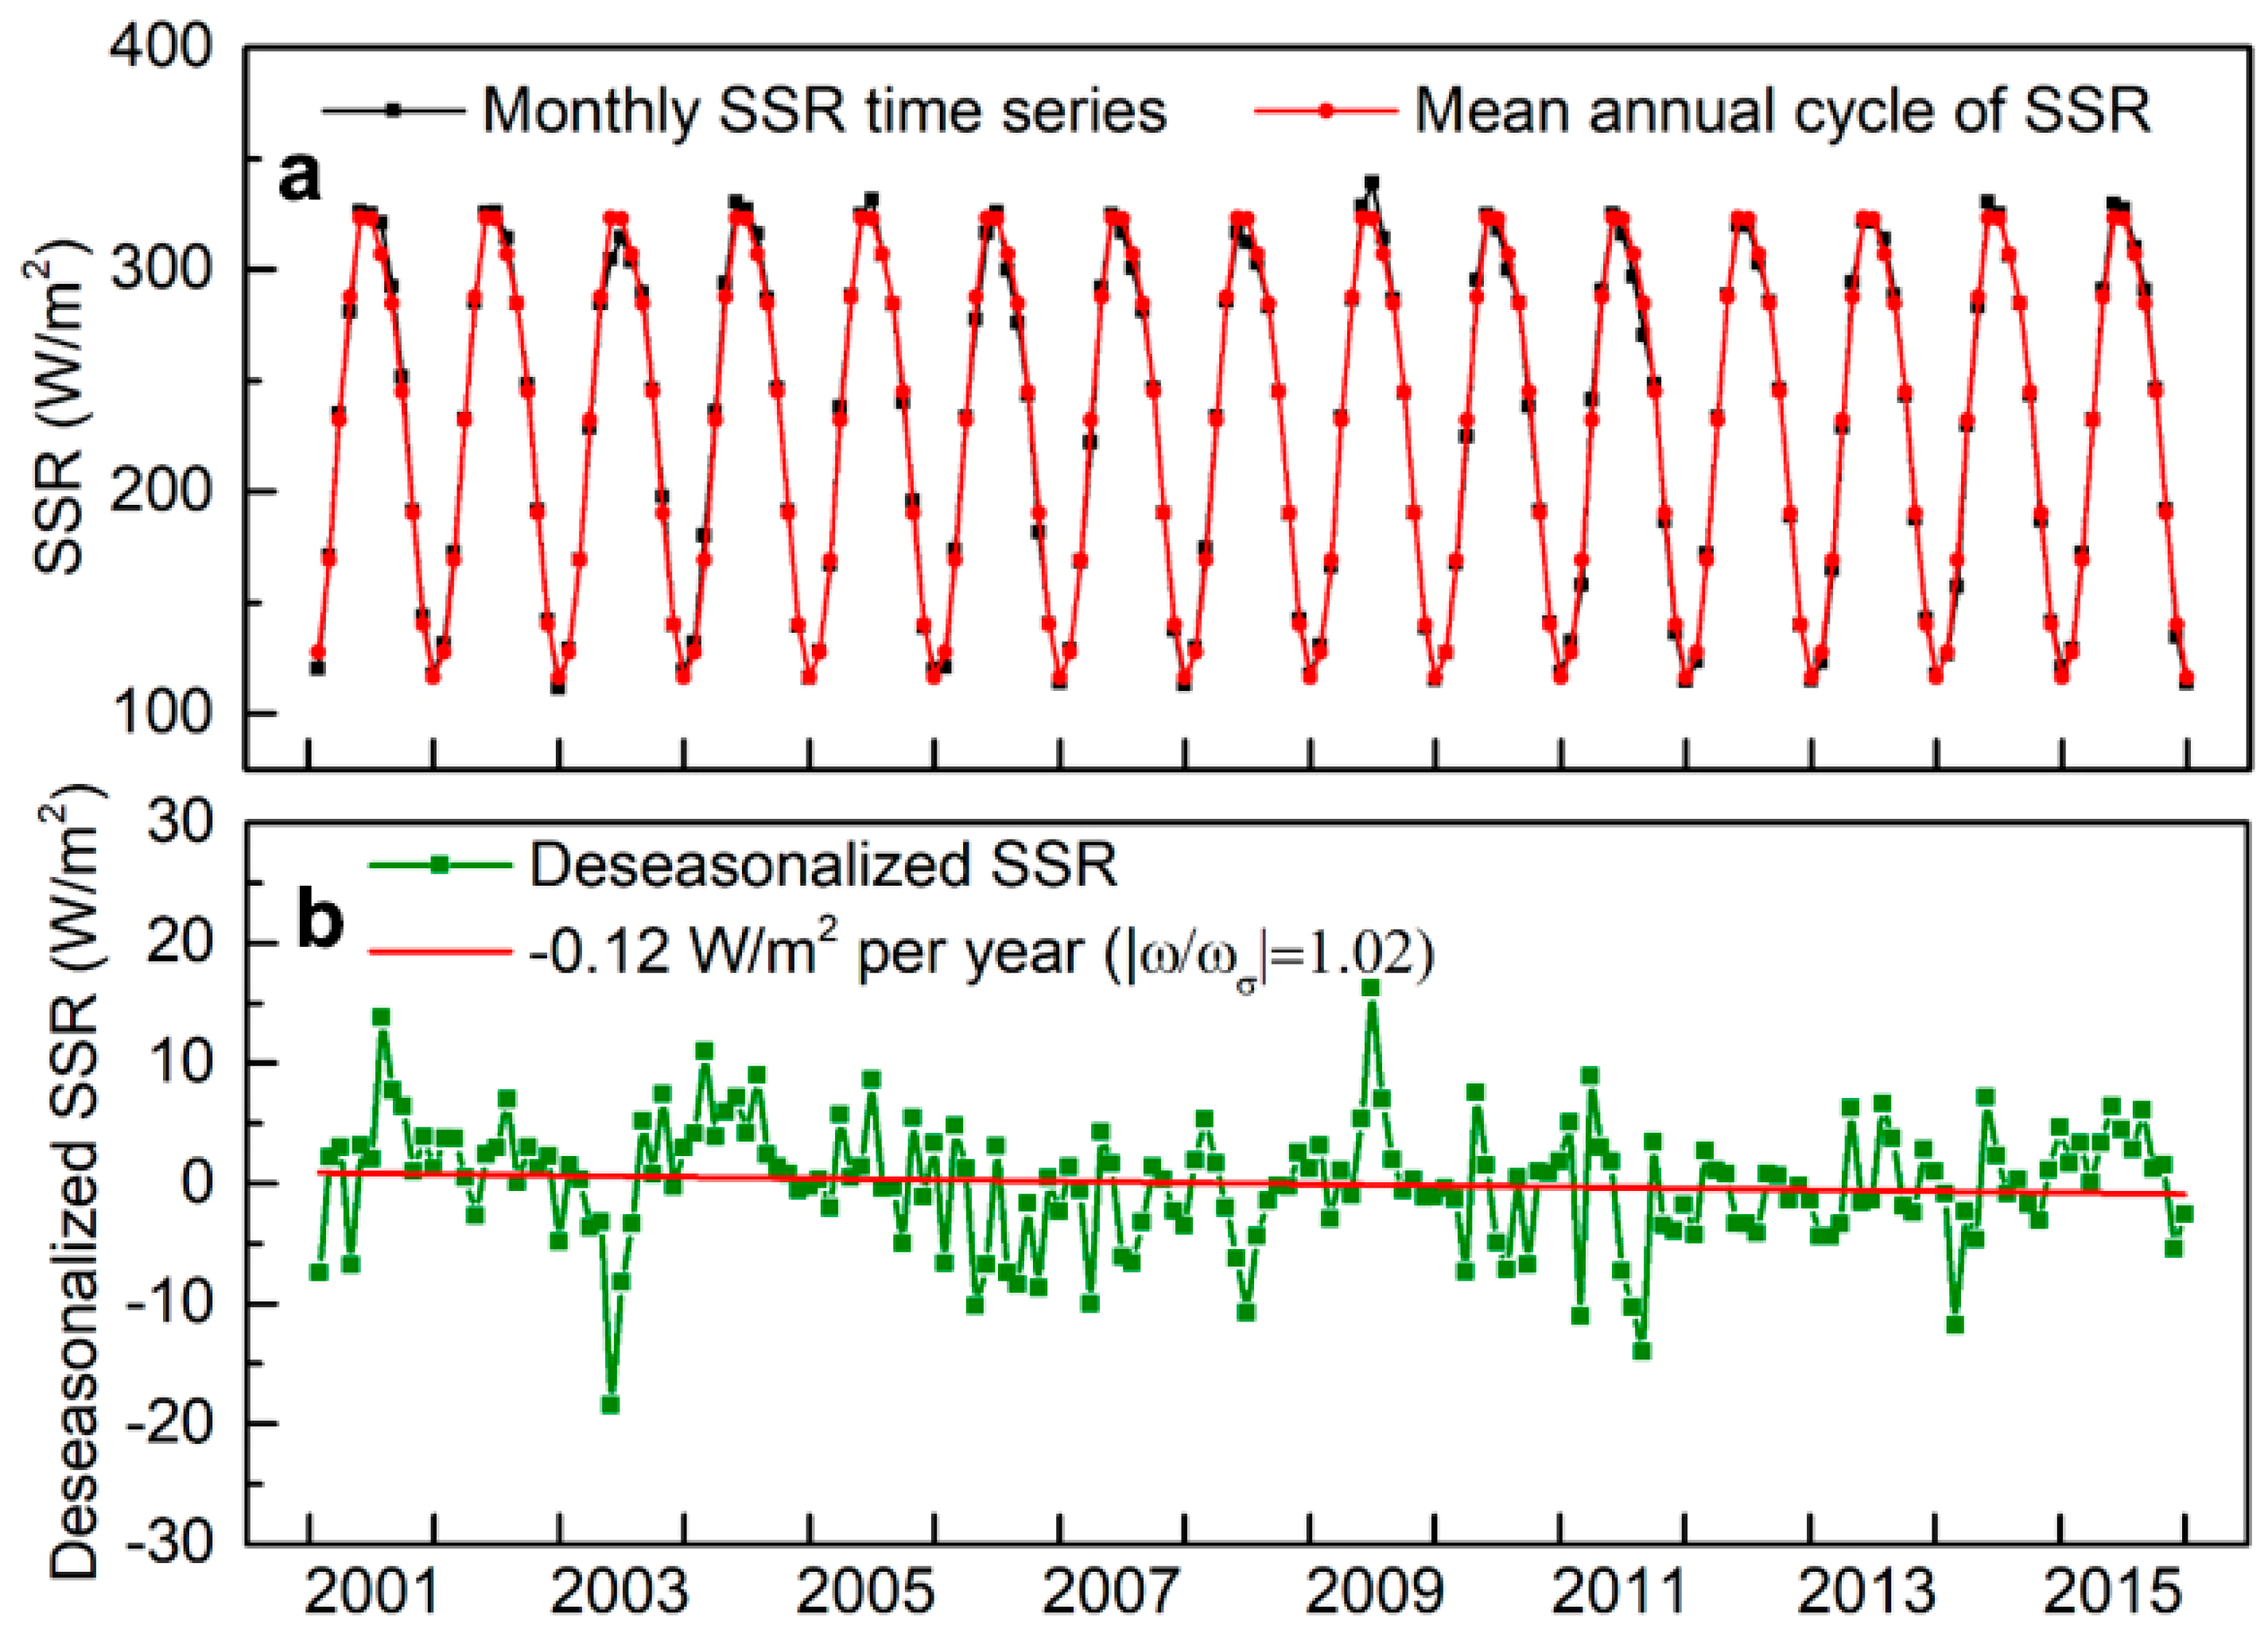
Figure 12.
Spatial distribution of deseasonalized trends of clear-sky SSR in northern China during 2001–2015. Regions with significant trends (p value < 0.05) are indicated by dots.
Figure 12.
Spatial distribution of deseasonalized trends of clear-sky SSR in northern China during 2001–2015. Regions with significant trends (p value < 0.05) are indicated by dots.
Figure 13.
Spatial distribution of deseasonalized trends of (a) ARE and (b) WVRE in northern China during 2001–2015. Regions with significant trends (p value < 0.05) are indicated by dots.
Figure 13.
Spatial distribution of deseasonalized trends of (a) ARE and (b) WVRE in northern China during 2001–2015. Regions with significant trends (p value < 0.05) are indicated by dots.
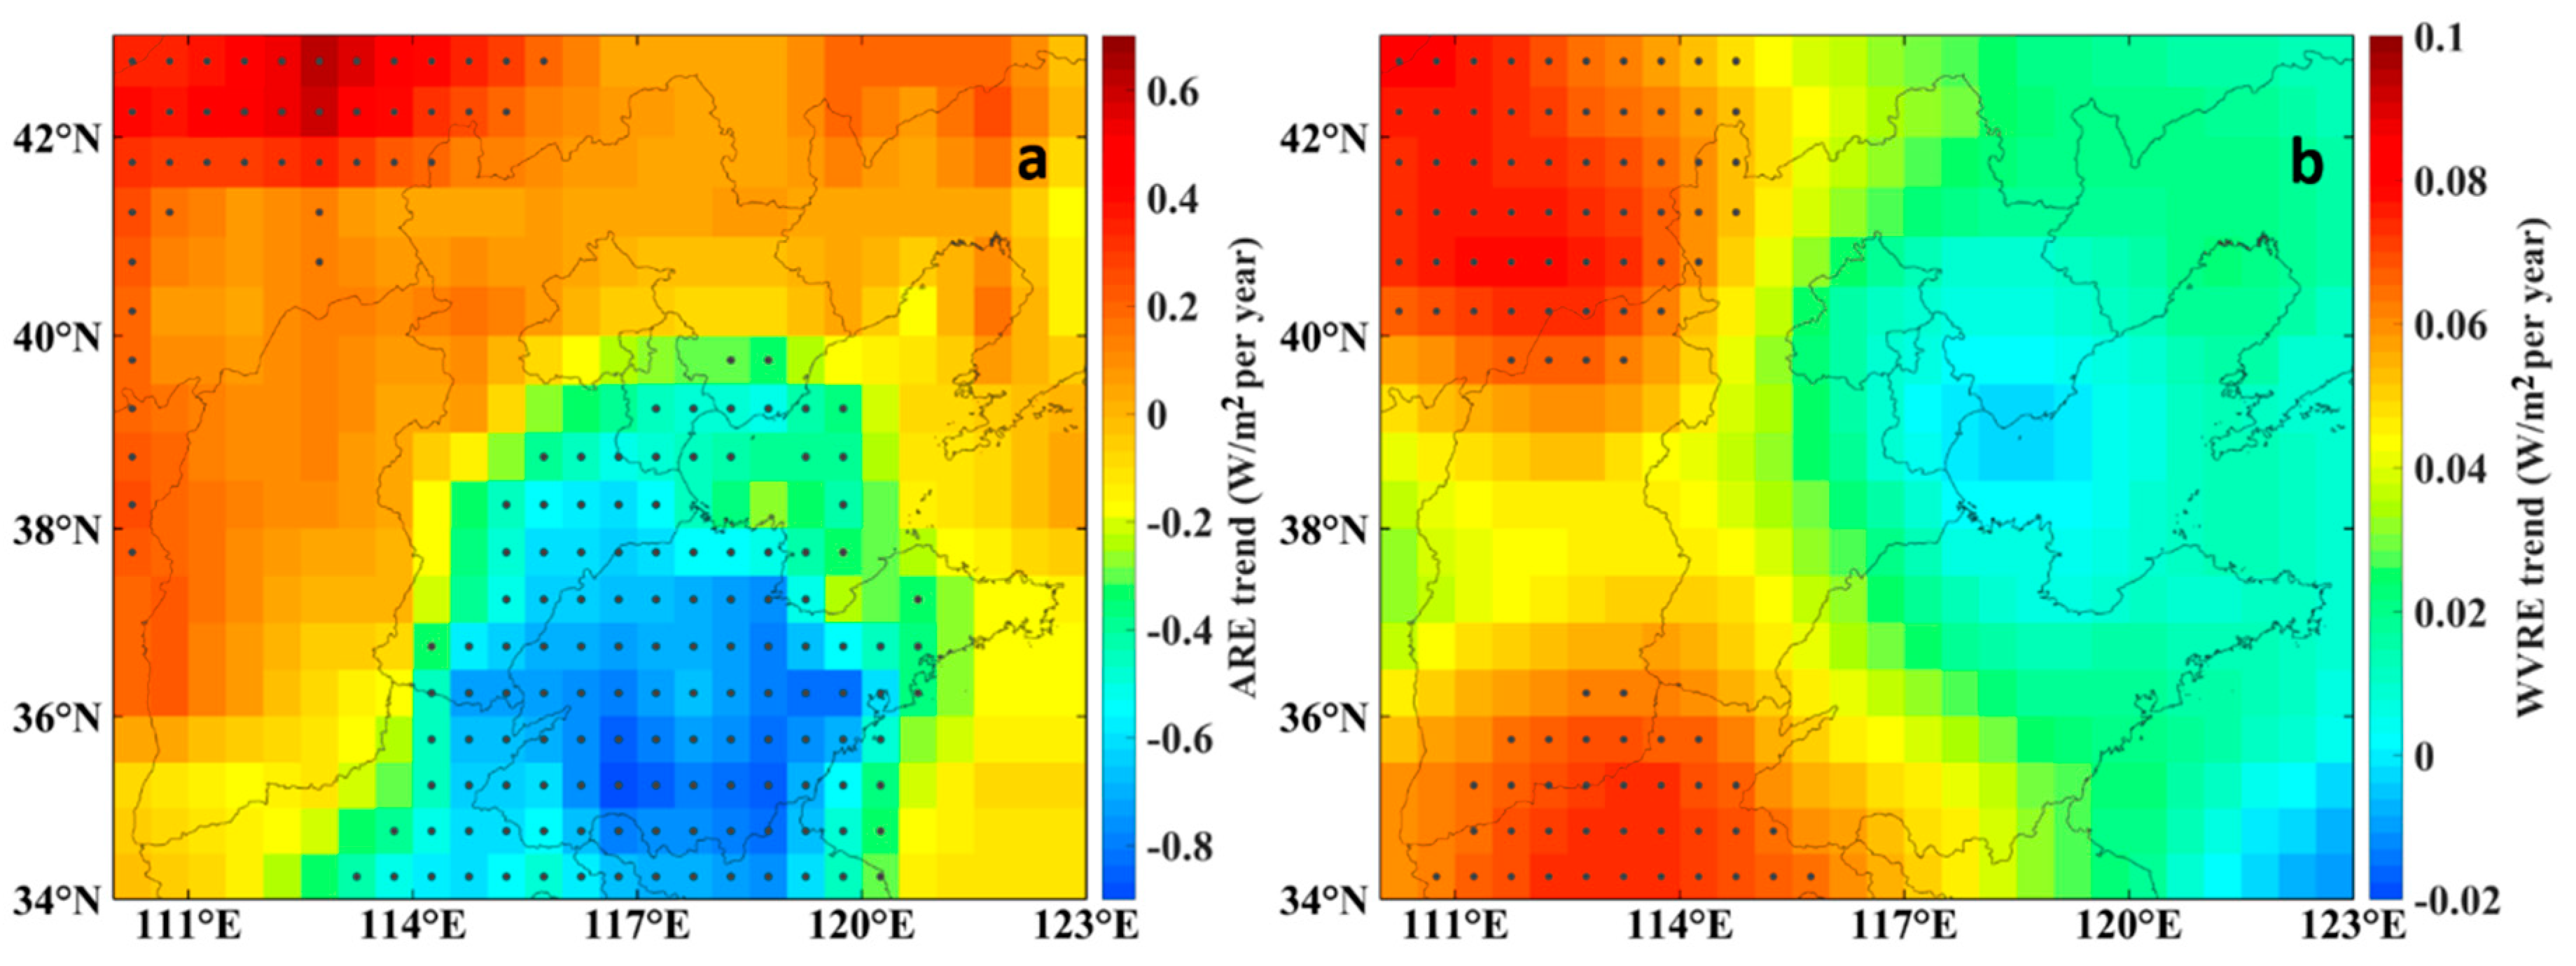
Figure 14.
Linear regressions between clear-sky SSR trend and (a) ARE trend and (b) WVRE trend in northern China during 2001–2015.
Figure 14.
Linear regressions between clear-sky SSR trend and (a) ARE trend and (b) WVRE trend in northern China during 2001–2015.

Figure 15.
Variations of annual (a) clear-sky SSR and (b) ARE and WVRE in northern China from 2001 to 2015.
Figure 15.
Variations of annual (a) clear-sky SSR and (b) ARE and WVRE in northern China from 2001 to 2015.
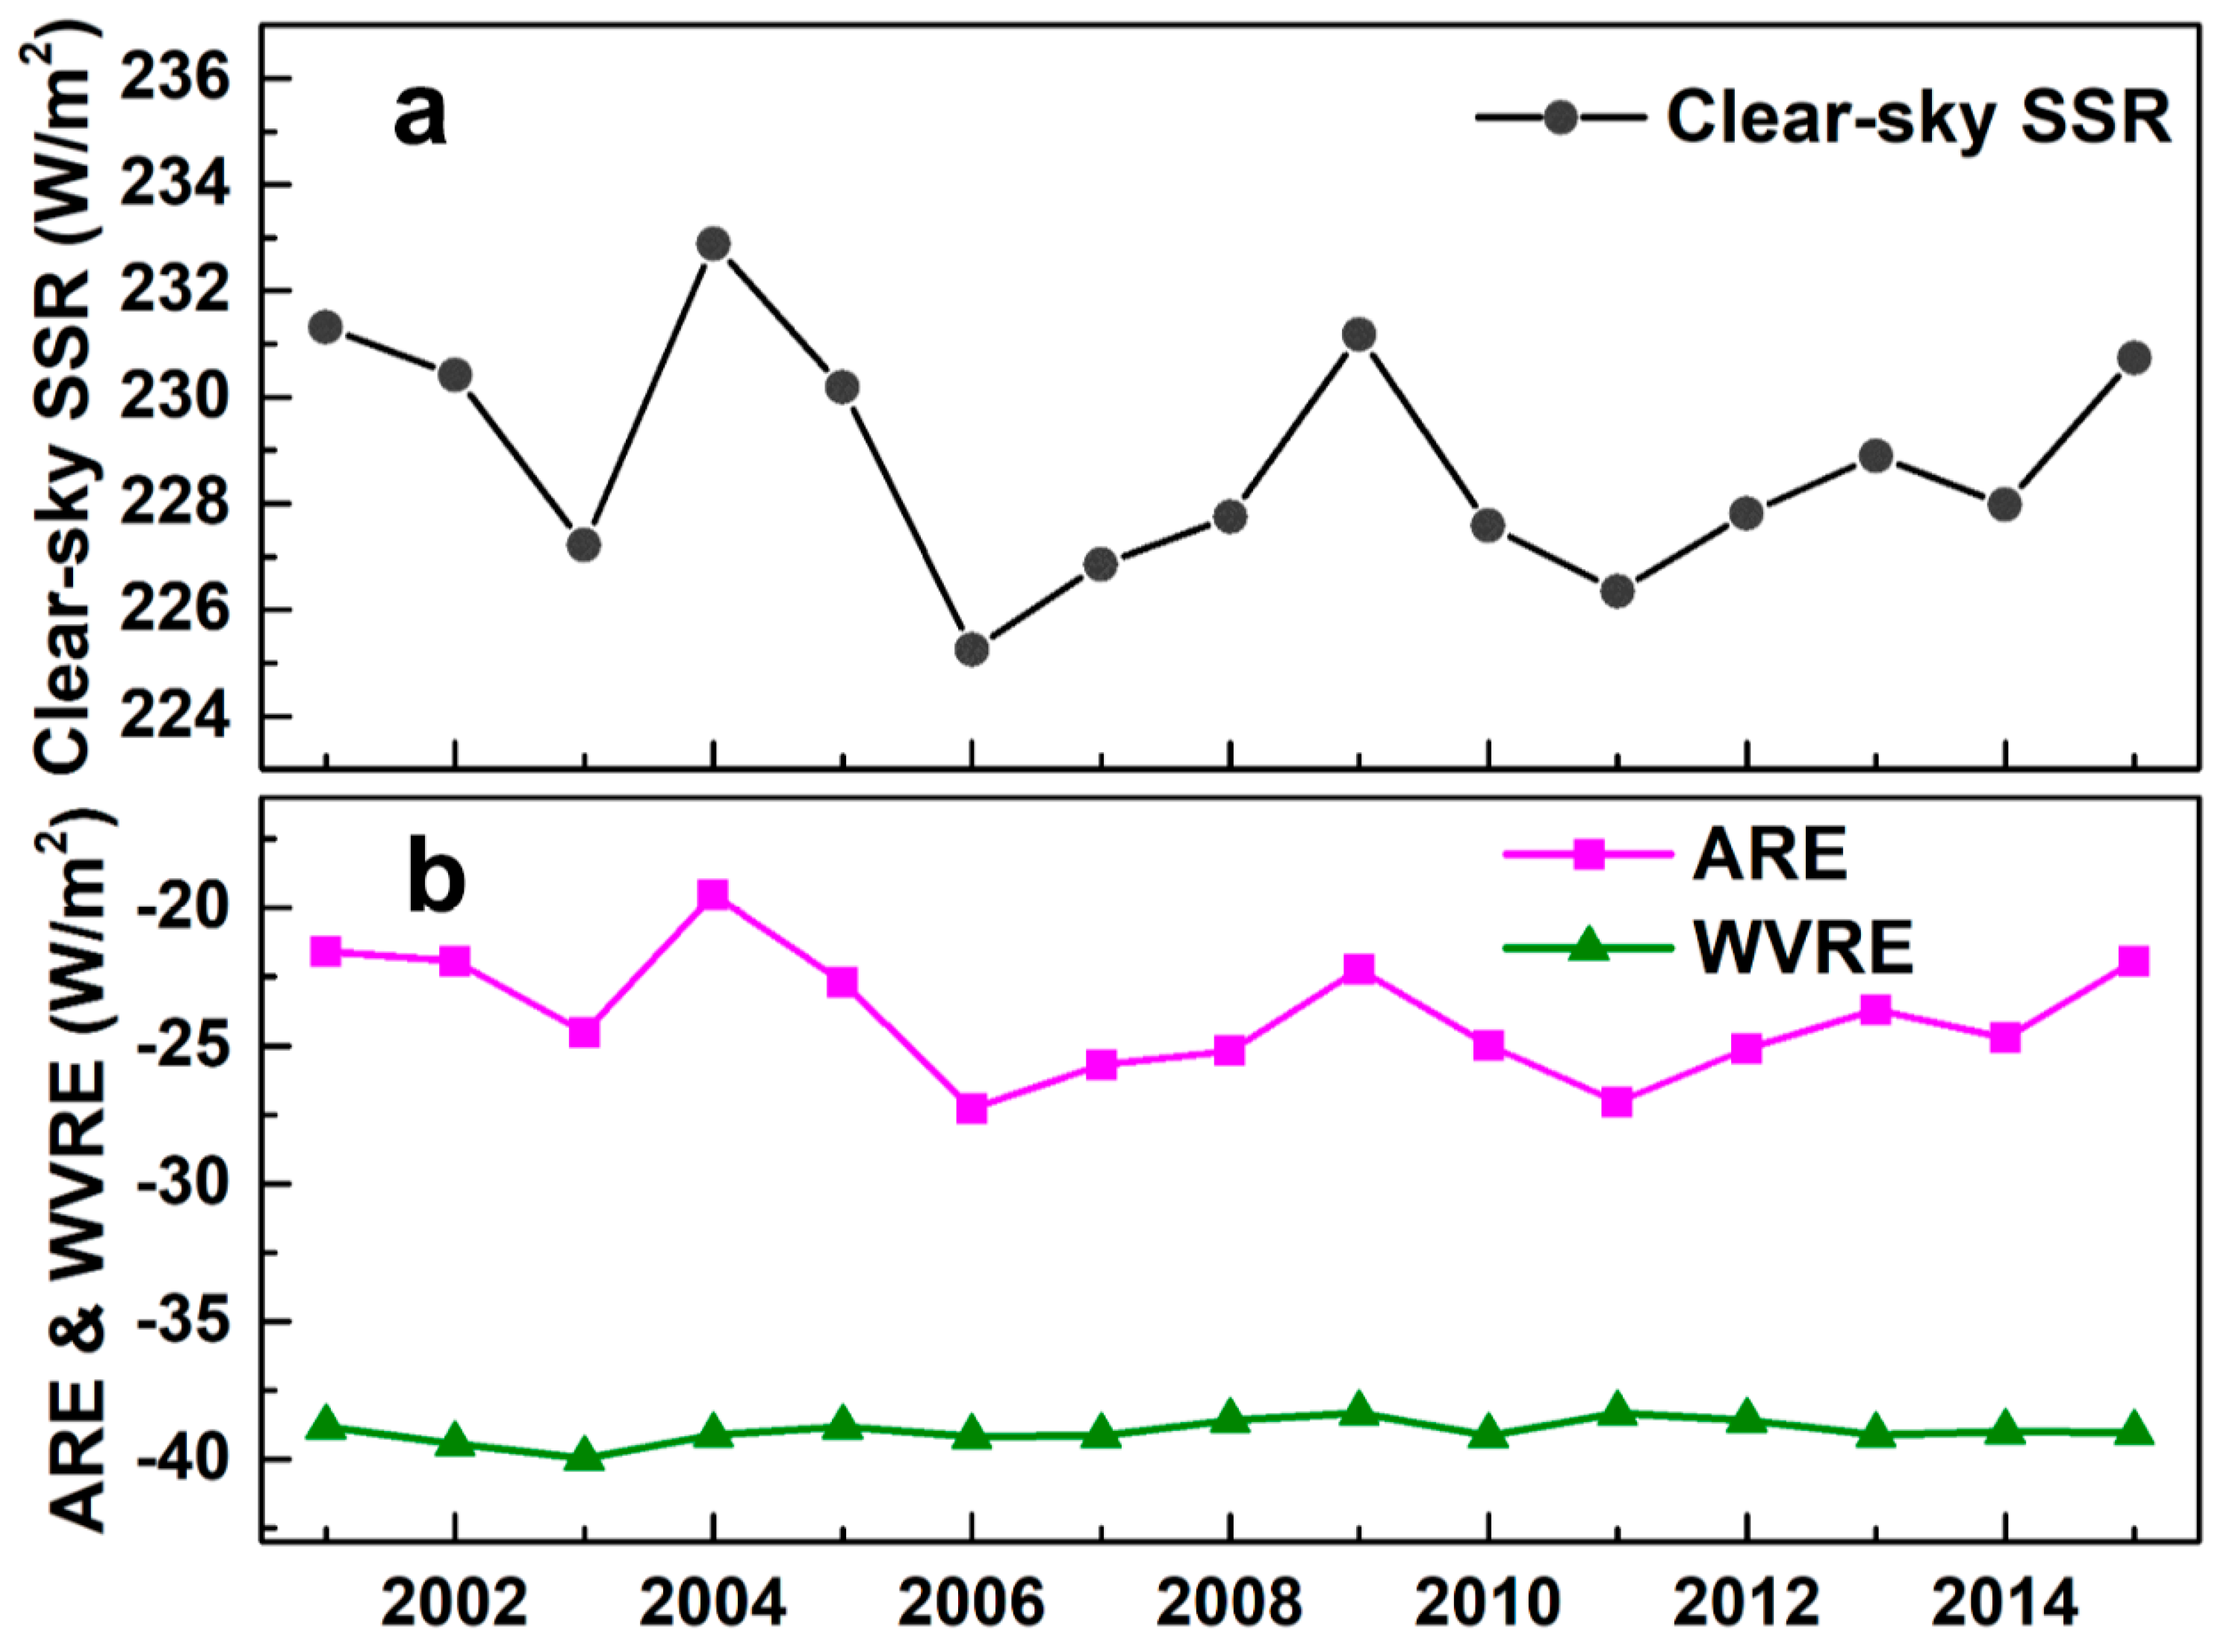
Figure 16.
Variations of annual (a) water vapor and (b) AOD in south-central Inner Mongolia, west-central Shandong, and the whole study area from 2001 to 2015.
Figure 16.
Variations of annual (a) water vapor and (b) AOD in south-central Inner Mongolia, west-central Shandong, and the whole study area from 2001 to 2015.

Figure 17.
Variations of annual surface (a) dust and (b) sulfate mass concentration in south-central Inner Mongolia, west-central Shandong, and the whole study area from 2001 to 2015.
Figure 17.
Variations of annual surface (a) dust and (b) sulfate mass concentration in south-central Inner Mongolia, west-central Shandong, and the whole study area from 2001 to 2015.


Table 1.
The statistical analysis between monthly observed and simulated clear-sky SSR.
| Stations | Correlation Equation | R2 | MAE (W/m2) | MAE(%) | RMSE (W/m2) | RMSE(%) | Ratio of Clear Sky |
|---|---|---|---|---|---|---|---|
| Datong | y = 1.01x + 5.39 | 0.99 | 10.98 | 4.44% | 12.92 | 5.22% | 25.16% |
| Taiyuan | y = 1.00x + 4.67 | 0.96 | 12.22 | 4.99% | 15.33 | 6.27% | 18.09% |
| Houma | y = 1.09x − 10.90 | 0.98 | 12.98 | 4.87% | 14.56 | 5.48% | 10.88% |
| Beijing | y = 1.02x − 3.43 | 0.99 | 6.25 | 2.89% | 7.72 | 3.57% | 29.12% |
| Tianjin | y = 1.00x − 3.24 | 0.97 | 8.68 | 4.09% | 13.44 | 6.33% | 35.16% |
| Laoting | y = 1.01x − 0.78 | 0.99 | 6.17 | 2.87% | 8.05 | 3.74% | 34.79% |
| Fushan | y = 1.03x − 1.31 | 0.99 | 7.00 | 3.15% | 8.57 | 3.86% | 30.87% |
| Jinan | y = 1.00x + 0.89 | 0.98 | 8.22 | 3.70% | 10.07 | 4.53% | 27.24% |
| JUxian | y = 1.04x − 1.02 | 0.99 | 7.93 | 3.58% | 9.33 | 4.22% | 26.34% |
| Zhengzhou | y = 1.04x − 4.82 | 0.99 | 6.63 | 2.96% | 8.36 | 3.73% | 25.68% |
| all | y = 1.03x − 2.71 | 0.98 | 8.14 | 3.62% | 10.60 | 4.17% | 26.33% |
Table 2.
Parameter perturbations used in radiative perturbation analysis and corresponding SSR changes.
Table 2.
Parameter perturbations used in radiative perturbation analysis and corresponding SSR changes.
| Parameter | Perturbation | Change of SSR (W/m2) | Change of SSR (%) |
|---|---|---|---|
| AOD | 0.14|−0.14 | −9.94|10.37 | −3.71|3.87 |
| SSA | 0.06|−0.06 | 12.18|−11.28 | 4.54|−4.21 |
| Water Vapor (kg/m2) | 2.80|−2.80 | −1.72|1.995 | −0.64|0.74 |
© 2020 by the authors. Licensee MDPI, Basel, Switzerland. This article is an open access article distributed under the terms and conditions of the Creative Commons Attribution (CC BY) license (http://creativecommons.org/licenses/by/4.0/).
Share and Cite
MDPI and ACS Style
Zhang, G.; Ma, Y. Clear-Sky Surface Solar Radiation and the Radiative Effect of Aerosol and Water Vapor Based on Simulations and Satellite Observations over Northern China. Remote Sens. 2020, 12, 1931. https://doi.org/10.3390/rs12121931
AMA Style
Zhang G, Ma Y. Clear-Sky Surface Solar Radiation and the Radiative Effect of Aerosol and Water Vapor Based on Simulations and Satellite Observations over Northern China. Remote Sensing. 2020; 12(12):1931. https://doi.org/10.3390/rs12121931
Chicago/Turabian StyleZhang, Guang, and Yingying Ma. 2020. "Clear-Sky Surface Solar Radiation and the Radiative Effect of Aerosol and Water Vapor Based on Simulations and Satellite Observations over Northern China" Remote Sensing 12, no. 12: 1931. https://doi.org/10.3390/rs12121931
Note that from the first issue of 2016, this journal uses article numbers instead of page numbers. See further details here.