US EPA EnviroAtlas Meter-Scale Urban Land Cover (MULC): 1-m Pixel Land Cover Class Definitions and Guidance


Abstract
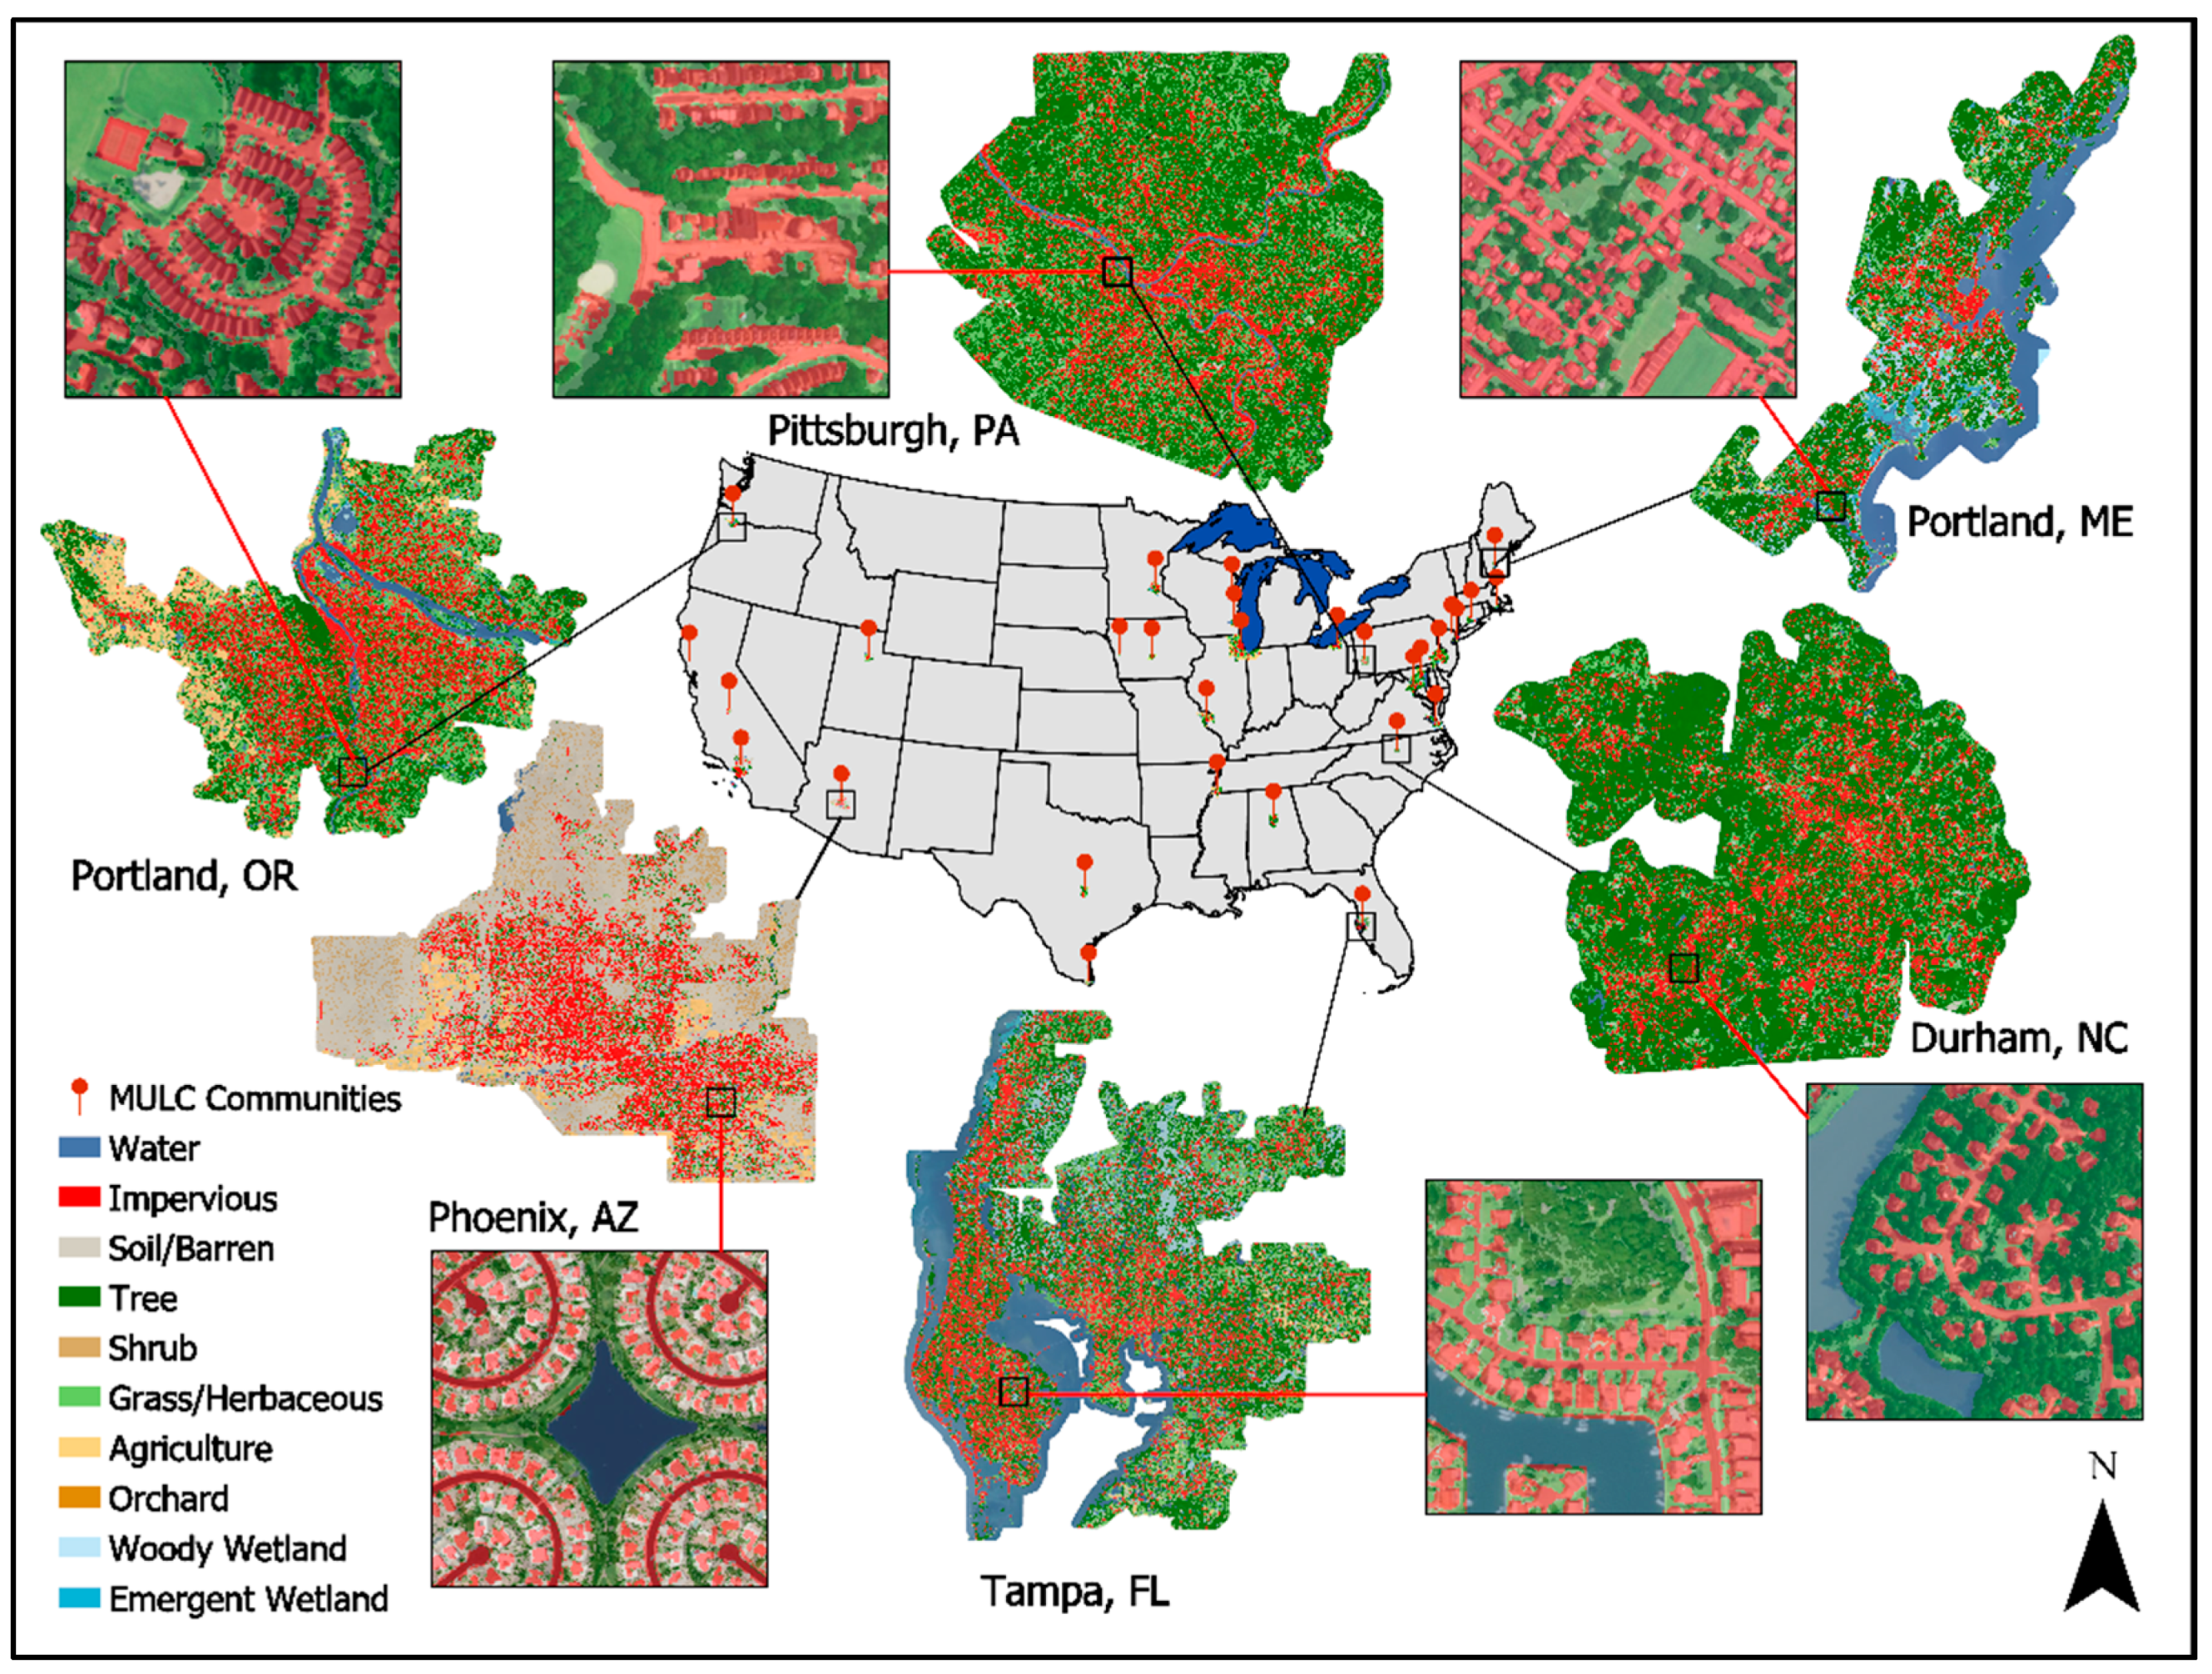
:1. Introduction
2. Materials and Methods
- encompass the LC types anticipated in US community landscapes;
- these LC classes are broadly recognized and understood by users;
- simplicity;
- the size of discrete landscape objects and features readily classifiable in single date, 1 × 1 m pixel imagery;
- minimal confusion between classes;
- broad range of potential applications.
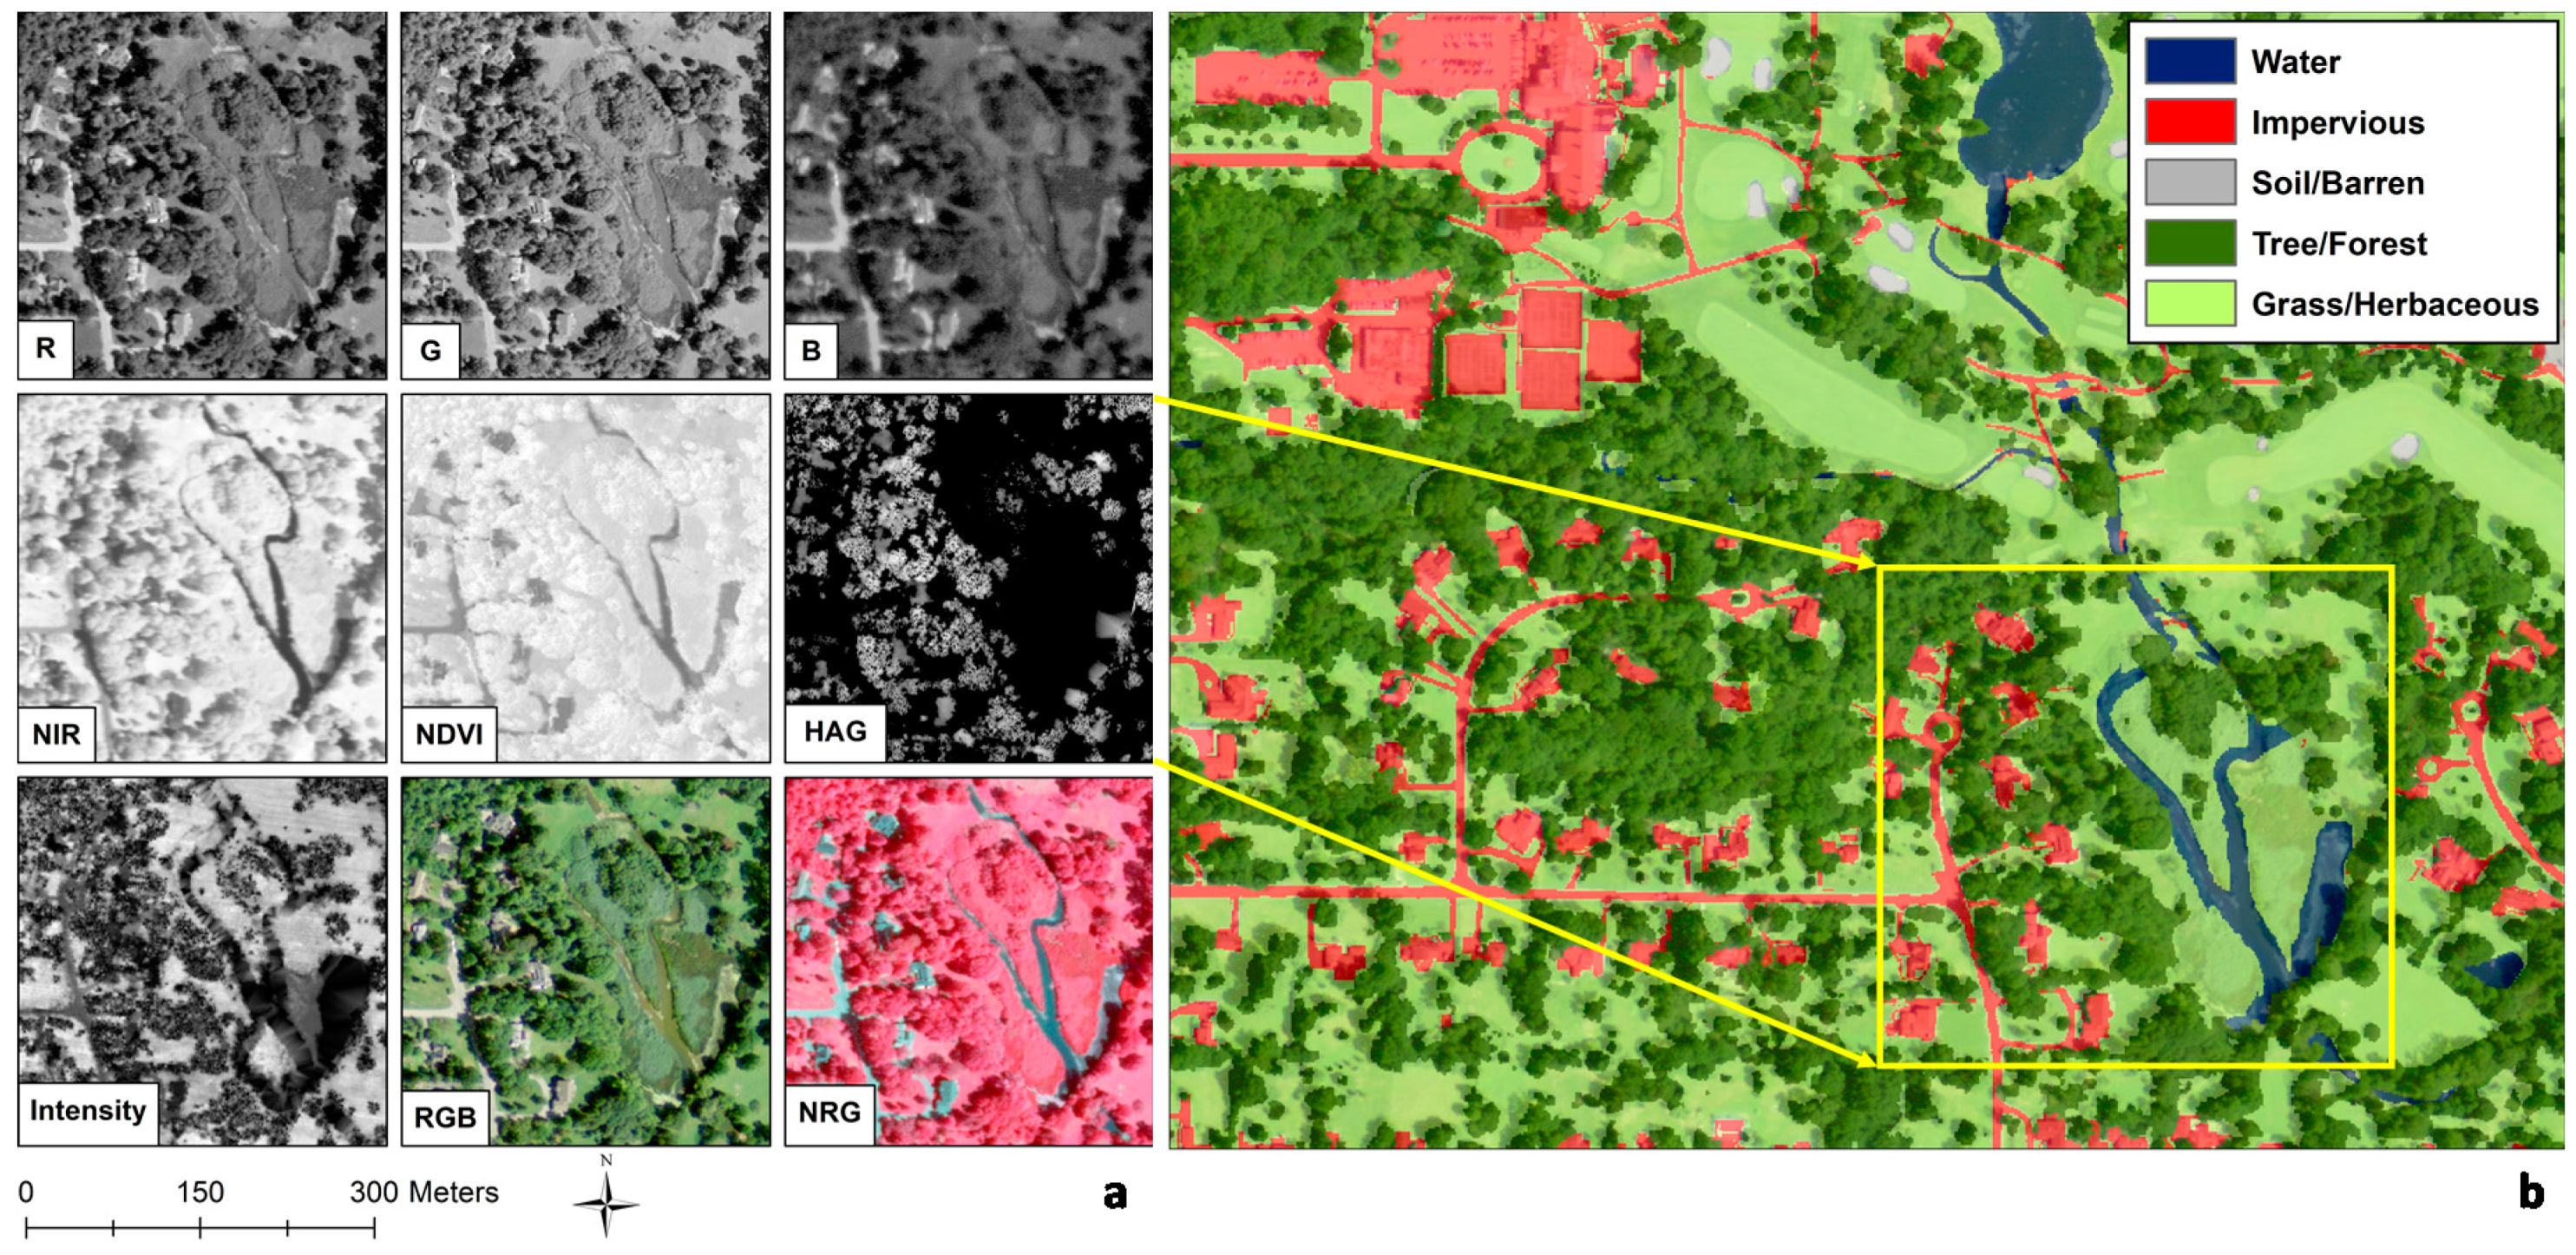
2.1. Input Data
- high spatial resolution: 1 × 1 m pixels (and finer in some recent imagery);
- free (no cost) and available for most of the US;
- updates every two to three years by state;
- adequate horizontal positional accuracy (≤6 m by specification) (in our experience, NAIP is co-registered within about two meters of other HR image sources such as Google, Bing and ESRI);
- four spectral bands: three visible light bands (blue, green, red) and one near-infrared (NIR) band, which is used to derive a normalized difference vegetation index (NDVI).
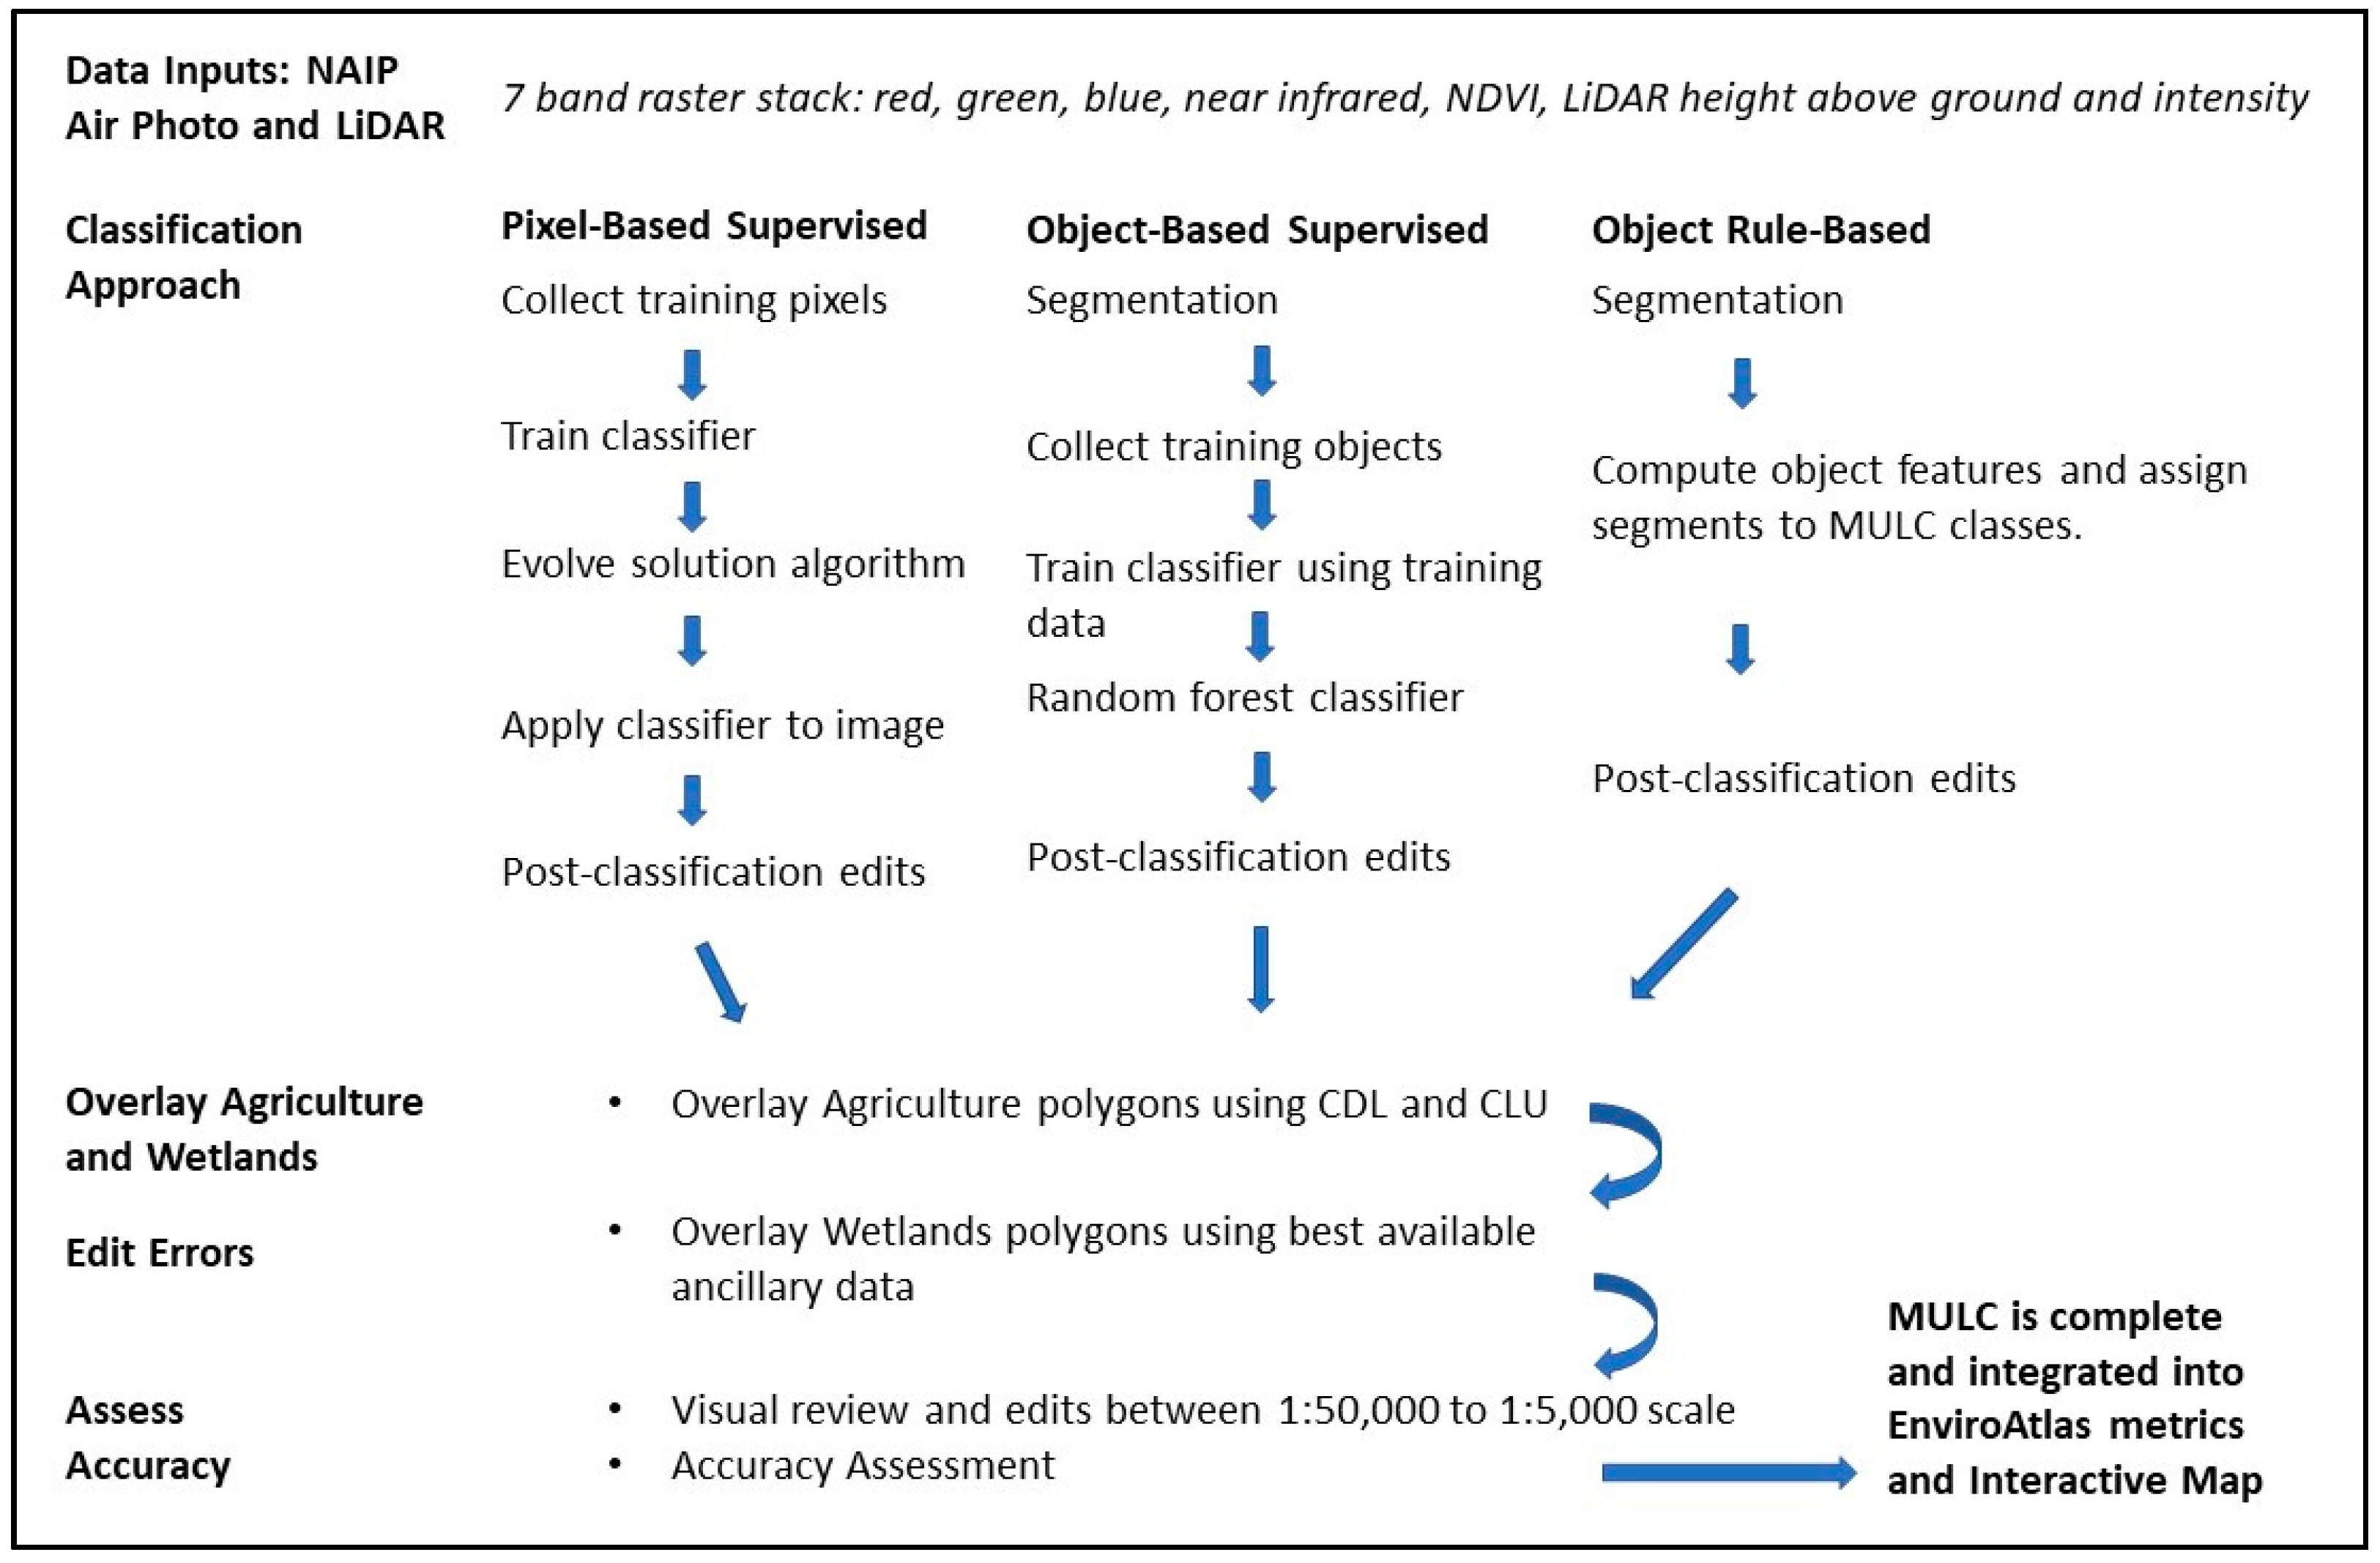
2.2. Image Classification
2.3. Post-Classification Operations
2.3.1. Post-Classification Operations
2.3.2. Fuzzy Accuracy Assessment
2.4. Definitions of MULC Classes
- The classes can be unambiguously translated to the MULC system;
- The data are at same or finer spatial resolution;
- The data are sufficiently contemporaneous with the EnviroAtlas period of study;
- The data have an overall target fuzzy accuracy ≥80%. (We perform the standard MULC accuracy assessment on externally developed LC data.)
2.4.1. Unclassified
2.4.2. Water
2.4.3. Impervious Surface
2.4.4. Soil-Barren
2.4.5. Tree
2.4.6. Shrub
2.4.7. Grass-Herbaceous
2.4.8. Agriculture
2.4.9. Wetlands
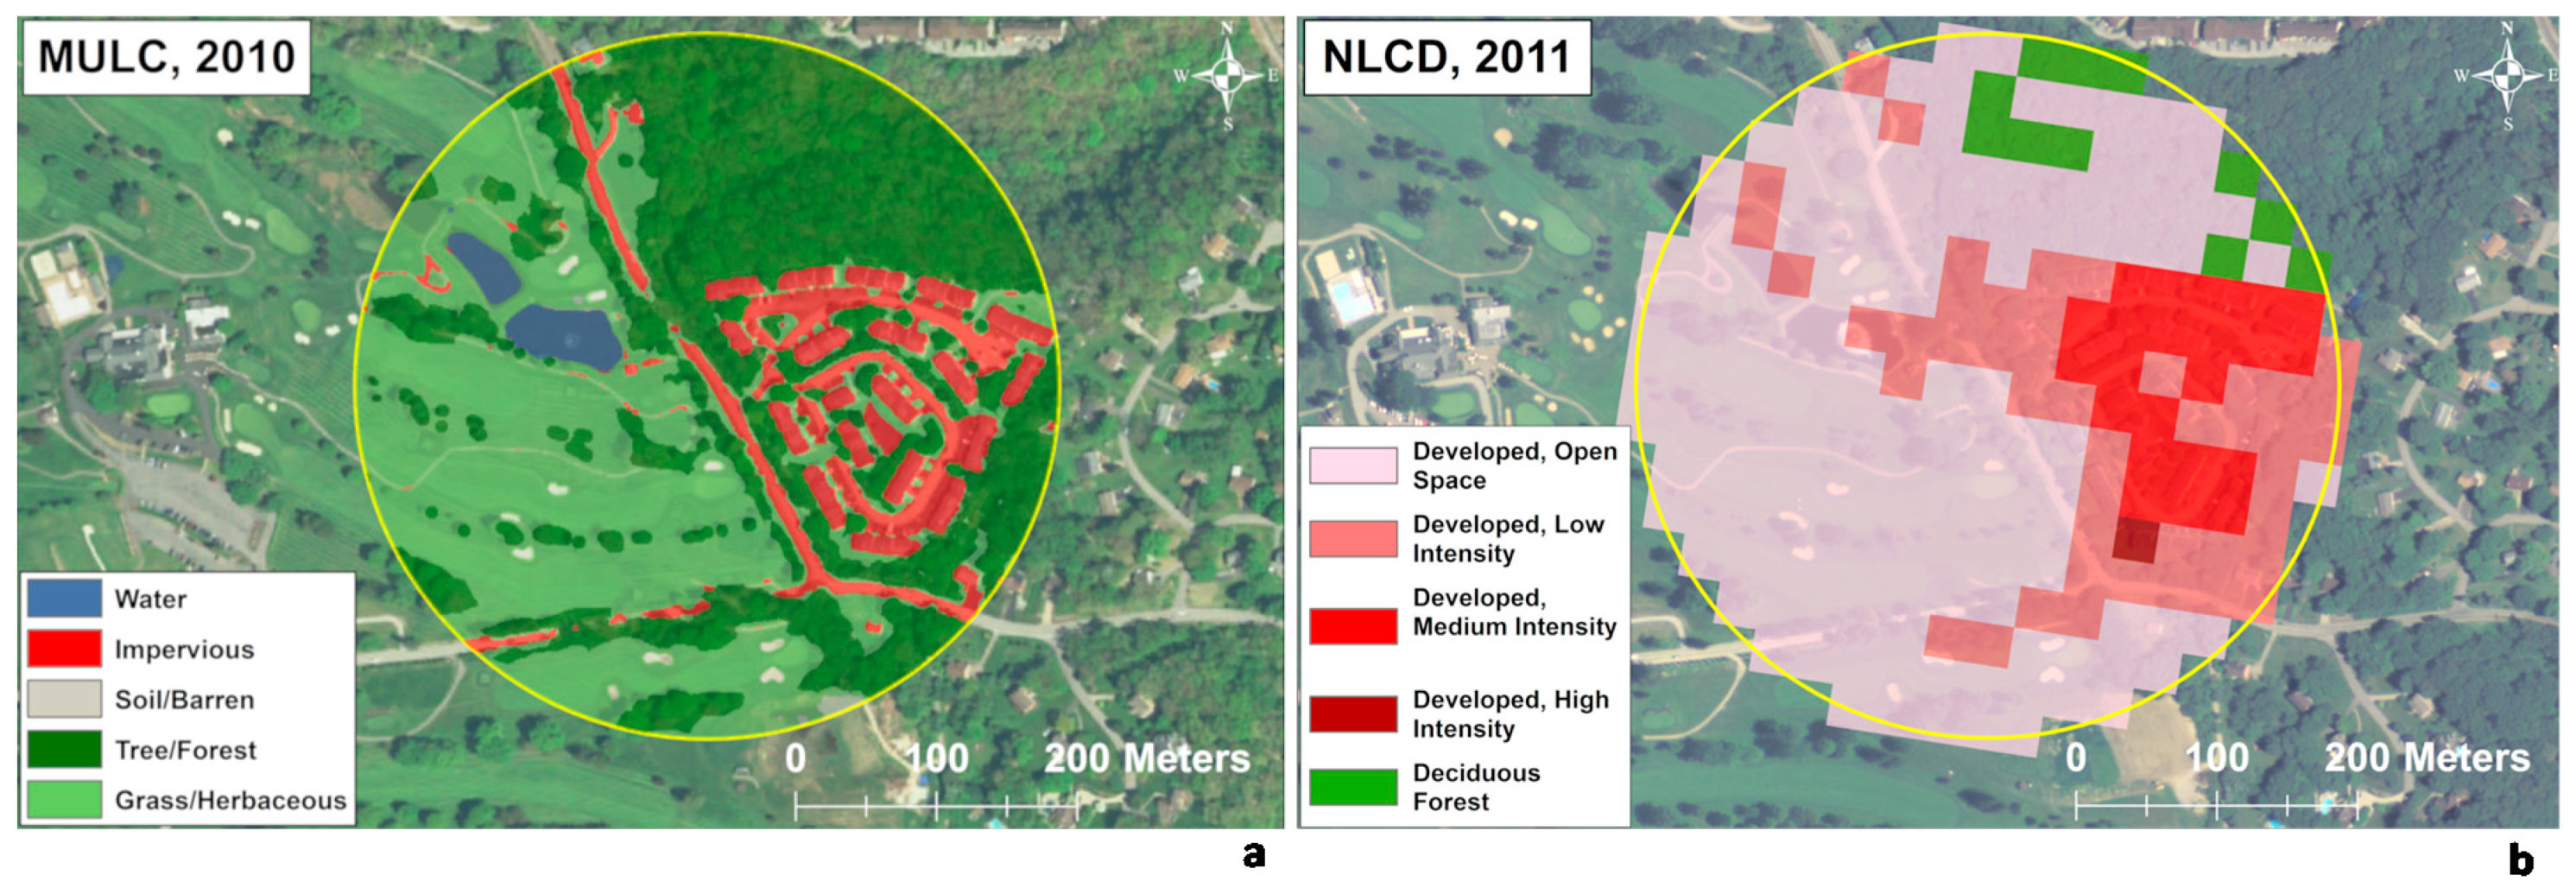
3. Results
4. Discussion
4.1. Uncertainty in MULC Data
4.2. Evaluation and Uncertainty in MULC
- True misclassification (e.g., the image pixel is composed of soil but the map labelled it grass);
- Non-exclusive class membership (the pixel is a mixture of soil and grass);
- Inter-observer error (the map developer and the accuracy assessor use different criteria (e.g., pixel color and brightness) for labeling an ambiguous pixel as either soil or grass)
- Severity of misclassification (for a specific user application, mistaking grass for tree may be less significant than mistaking soil for tree [i.e., vegetated versus non-vegetated] or water for impervious);
- Items 2 and 3 are allowed greater flexibility as a result of the fuzzy accuracy assessments employed for MULC datasets.
4.3. Grass-Soil Confusion
4.4. Soil-Impervious Confusion
4.5. Grass-Tree Confusion
4.6. Shadows
5. Conclusions
Author Contributions
Funding
Acknowledgments
Conflicts of Interest
Disclaimer
References
- Pickard, B.R.; Daniel, J.; Mehaffey, M.; Jackson, L.E.; Neale, A. EnviroAtlas: A new geospatial tool to foster ecosystem services science and resource management. Ecosyst. Serv. 2015, 14, 45–55. [Google Scholar] [CrossRef] [Green Version]
- Jackson, L.E.; Daniel, J.; McCorckle, B.; Sears, A.; Bush, K.F. Linking ecosystem services and human health: The Eco-Health Relationship Browser. Int. J. Public Health 2013, 58, 747–755. [Google Scholar] [CrossRef] [PubMed]
- Homer, C.; Huang, C.; Yang, L.; Wylie, B.; Coan, M. Development of a 2001 National Land-cover database for the United States. Photogramm. Eng. Remote Sens. 2004, 70, 829–840. [Google Scholar] [CrossRef] [Green Version]
- United States Census Bureau. Growth in Urban Population Outpaces Rest of Nation, Census Bureau Reports. Available online: https://www.census.gov/newsroom/releases/archives/2010_census/cb12-50.html (accessed on 15 May 2019).
- United States Census Bureau. 2010 Census Urban and Rural Classification and Urban Area Criteria. Available online: https://www.census.gov/programs-surveys/geography/guidance/geo-areas/urban-rural/2010-urban-rural.html (accessed on 15 May 2019).
- United States Department of Agriculture Farm Service Agency. National Agriculture Imagery Program (NAIP) Digital Ortho Photography; Aerial Photography Field Office: Salt Lake City, UT, USA; U.S. Department of Agriculture: Washington, DC, USA, 2016. [Google Scholar]
- United States Geological Survey. The National Map. Available online: https://www.usgs.gov/core-science-systems/national-geospatial-program/national-map (accessed on 15 July 2019).
- National Oceanic and Atmospheric Administration. NOAA Data Access Viewer. Available online: https://coast.noaa.gov/dataviewer/#/ (accessed on 15 July 2019).
- Myint, S.W.; Gober, P.; Brazel, A.; Grossman-Clarke, S.; Weng, Q. Per-pixel vs. object-based classification of urban land cover extraction using highspatial resolution imagery. Remote Sens. Environ. 2011, 115, 1145–1161. [Google Scholar] [CrossRef]
- ArcGIS Desktop. ESRI. Version 10.x. Available online: https://www.esri.com (accessed on 15 January 2020).
- ArcGIS Pro. ESRI. Version 2.x. Available online: https://pro.arcgis.com/ (accessed on 15 January 2020).
- ENVI. L3Harris. Version 5.x. Available online: https://www.harris.com/ (accessed on 15 January 2020).
- eCognition. Trimble Geospatial. Version 9.x. Available online: https://geospatial.trimble.com/products-and-solutions/ecognition (accessed on 15 January 2020).
- United States Department of Agriculture. Cropland Data Layer; United States Department of Agriculture: Washington, DC, USA, 2016. [Google Scholar]
- Gopal, S.; Woodcock, C. Theory and Methods for Accuracy Assessment of Thematic Maps Using Fuzzy Sets. Photogramm. Eng. Remote Sens. 1994, 60, 181–188. [Google Scholar] [CrossRef]
- Anderson, J.R.; Hardy, E.E.; Roach, J.T.; Witmer, R.E. A Land Use and Land Cover Classification System for Use with Remote Sensor Data. Geological Survey Professional Paper 964.; United States Department of the Interior: Washington, DC, USA, 1976. [Google Scholar]
- United States Department of Agriculture Farm Service Agency. Common Land Unit (CLU); United States Department of Agriculture Farm Service Agency: Washington, DC, USA, 2008. [Google Scholar]
- United States Environmental Protection Agency. How Wetlands are Defined and Identified under CWA Section 404. Available online: https://www.epa.gov/cwa-404/how-wetlands-are-defined-and-identified-under-cwa-section-404 (accessed on 15 July 2019).
- United States Environmental Protection Agency. Wetlands Protection and Restoration. Available online: https://www.epa.gov/wetlands (accessed on 15 July 2019).
- Cowardin, L.M.; Carter, V.; Golet, F.C.; LaRoe, E.T. Classification of Wetlands and Deepwater Habitats of the United States; United States Fish and Wildlife Service Report No. FWS/OBS/-79/31; Fish and Wildlife Service, US Department of the Interior: Washington, DC, USA, 1979. [Google Scholar]
- United States Fish and Wildlife Service. National Wetlands Inventory Website. Available online: http://www.fws.gov/wetlands/ (accessed on 15 January 2020).
- United States Environmental Protection Agency Office of Water and United States Geological Survey. NHDPlusV2; United States Environmental Protection Agency: Washington, DC, USA, 2012. [Google Scholar]
- United States Census Bureau. 2010 Total Population. Available online: https://data.census.gov/cedsci/ (accessed on 10 March 2020).
- United States Environmental Protection Agency. EnviroAtlas. Using EnviroAtlas to Identify Locations for Urban Heat Island Abatement. Available online: https://www.epa.gov/sites/production/files/2017-06/documents/urbanheatislandabatement.pdf (accessed on 3 December 2019).
- Almeter, A.; Tashie, A.; Procter, A.; McAlexander, T.; Browning, D.; Rudder, C.; Jackson, L.; Araujo, R. A Needs-Driven, Multi-Objective Approach to Allocate Urban Ecosystem Services from 10,000 Trees. Sustainability 2018, 10, 4488. [Google Scholar] [CrossRef] [PubMed] [Green Version]
- United States Environmental Protection Agency. EnviroAtlas. Prioritizing Tree Planting in Durham, NC. Available online: https://epa.maps.arcgis.com/apps/MapJournal/index.html?appid=0659c53852f4425fb3460e78de67a3ef (accessed on 3 December 2019).
- United States Environmental Protection Agency. EnviroAtlas. Evaluating a Proposed Policy to Promote Physical Fitness in Public Parks. Available online: https://www.epa.gov/sites/production/files/2018-02/documents/tampa_healthimpactassessment_feb2018.pdf (accessed on 3 December 2019).
- Tsai, W.; Davis, A.J.S.; Jackson, L.E. Associations between types of greenery along neighborhood roads and weight status in different climates. Ecosyst. Serv. 2019, 41, 104–117. [Google Scholar] [CrossRef] [PubMed]
- Myer, M.H.; Fizer, C.M.; Mcpherson, K.R.; Neale, A.C.; Pilant, A.N.; Rodriguez, A.; Whung, P.; Johnston, J.M. Mapping Aedes aegypti (Diptera: Culicidae) and Aedes albopictus Vector Mosquito Distribution in Brownsville, TX. J. Med. Entomol. 2019, 57, 231–240. [Google Scholar] [CrossRef] [PubMed]
- Angradi, T.R.; Williams, K.C.; Hoffman, J.C.; Bolgrien, D.W. Goals, beneficiaries, and indicators of waterfront revitalization in Great Lakes Areas of Concern and coastal communities. J. Great Lakes Res. 2019, 45, 851–863. [Google Scholar] [CrossRef]
- Foody, G.M. Valuing map validation: The need for rigorous land cover map accuracy assessment in economic valuations of ecosystem services. Ecol. Econ. 2015, 111, 23–28. [Google Scholar] [CrossRef]


| Acronym | Dataset Name | Comments/Usage |
|---|---|---|
| NAIP (Primary data layer used in classification.) | National Agricultural Imagery Program | 1 m pixel, five band raster stack red-green-blue-near infrared-NDVI. Approximately three year update cycle. |
| LiDAR (Primary data layer used in classification.) | Light detection and ranging | 1 m pixel, two-band raster stack of LiDAR height-above-ground and intensity bands. |
| NLCD | National Land Cover Dataset | Inform algorithms and analysis, 30 m pixel size. Five year update cycle. |
| CCAP | NOAA Coastal Change Analysis Program | Inform algorithms and analysis, 30 m pixels. Recently, 1 to 5 m pixel data. Variable update cycle. |
| NHDPlus v2 | National Hydrography Data Plus Version 2. | Water and wetland feature vectors. Variable update cycle. |
| NWI | National Wetlands Inventory | Water and wetland feature vectors. Variable update cycle. |
| CLU | Common Land Units | Unattributed parcel polygons emphasizing agriculture. Vintage 2008. |
| CDL | Cropland Data Layer | Crop information at 30 m pixel size. USDA. Updated annually. |
| Roads and infrastructure | Road and utilities data layers | Vector data, as available. |
| Building footprint | Building footprint layers | Vector data, as available. |
| Standard MULC Level 1 Class | Level 1 Code | Level 2 Codes | Short Description |
|---|---|---|---|
| Water | 10 Water | 11 Fresh Water 12 Salt Water 13 (available) 14 Drinking Water Reservoir | The water class includes all natural and some anthropogenic surface waters: rivers, streams, canals, ponds, reservoirs, lakes, bays, estuaries, and near-shore coastal waters. |
| Impervious Surface | 20 Impervious Surface | 21 Dark Impervious (low reflectance) 22 Light Impervious (high reflectance) 23 Road 24 Building 25 Parking Area 26 Soil and Gravel Impervious 27 Solar Panel | The impervious class includes buildings, paved roads, parking lots, driveways, sidewalks, roofs, swimming pools, patios, painted surfaces, wooden structures, solar farms and most asphalt and concrete surfaces. Swimming pools, and wastewater treatment tanks and basins, are labeled as Impervious as described in the text. |
| Soil-Barren | 30 Soil and Barren Land | 31 Developed Soil (soil in developed areas likely compacted and disturbed) 32 Bare Rock 33 Sand and Gravel 34 Quarry | The soil and barren class (“soil”) includes bare soil, bare rock, mud, clay, sand, barren agricultural fields (for communities with less than 5% agriculture), construction sites, quarries, gravel pits, mine lands, industrial land, parking lots, golf course sand traps, ball parks, playgrounds, stream and river sand bars, sand dunes, beaches and other bare soil and gravel surfaces. |
| Tree | 40 Tree | 41 Deciduous Tree/Forest 42 Evergreen Tree/Forest 43 Mixed Tree/Forest 45 Low Tree (height < 2 m) 46 Medium Tree (2 m ≤ height < 5 m) 47 High Tree (height ≥ 5 m) | Woody single stem vegetation ≥ 2 m height. “tall vegetation.” Generally, the branching starts above a specified trunk height, in contrast with shrubs where branching starts near ground level. Classes 45–47 are optional and subordinate to height thresholds defined in the text. The term Tree comprises trees of varying extent: individual trees, stands and forest. The codes 41–47 are provided as guidelines for potential future analyses; they have not been used in MULC data to date. |
| Shrub | 50 Shrubs or Shrubland | 51 Shrubland or Scrubland (undifferentiated Shrub, Soil and Grass) 52 Individual Shrub in Natural Environment 53 Individual Shrub in Built/Developed Environment. 55 Low Shrub (height ≤ 2 m) 56 Medium Shrub (2 m < height < 5 m) 57 High Shrub (height ≥ 5 m) | Woody multiple stem vegetation with height ≤ 2 m and > 0.5 m. “medium height vegetation.” Shrub mapping requires LiDAR height above ground except in known shrub land areas. |
| Grass-Herbaceous | 70 Grass | 71 Lawns and Other Managed Grass 72 Roadside Grass 73 Pasture 74 Natural Grassland (e.g., prairie) | Graminoids, forbs and herbs lacking persistent woody stems; includes residential lawns, golf courses, roadway medians and verges, park lands, transmission line and natural gas corridors, recent forest clear-cuts, meadows, pasture, grasslands and prairie grass. Also known as “low vegetation.” Grass classified in wetlands areas is recoded to emergent wetlands. |
| Agriculture | 81 Agriculture | 80 Row Crops 82 Orchard | Row crops (80) and orchards (82) (Note: agriculture class numbering departs from the norm.) Pixels classified as grass (70) are recoded to row crop (80) when the ancillary agricultural polygons are overlaid. |
| Wetlands | 90 Wetlands | 91 Emergent Wetland 92 Woody Wetland | Emergent (91) and woody (92) wetlands Wetlands polygons are overlaid on classified MULC using best available data (e.g., NWI, NHD+). Grass recodes to emergent wetland. Trees recode to woody wetland. Soil, water and impervious classes remain unchanged. Treatment of shrubs is indicated in metadata. |
| EnviroAtlas Community | Area (km2) | Population (2010 Census) | Overall Accuracy (Fuzzy) | Kappa (Fuzzy) | Overall Accuracy (Non-Fuzzy) | Kappa (Non-Fuzzy) | Imagery Date | LiDAR Dates |
|---|---|---|---|---|---|---|---|---|
| Austin, TX (PBS) | 2499 | 1,334,516 | 90.7 | 87.9 | 86.5 | 82.6 | 2010 | 2007 |
| Baltimore, MD (ORB) | 4545 | 2,252,753 | 92.7 | 90.5 | 90.1 | 87.1 | 2013 | 2004, 2005, 2011, 2015 |
| Birmingham, AL (PBS) | 2335 | 763,628 | 87.6 | 80.5 | 83.4 | 74.2 | 2011 | 2010, 2011, 2013 |
| Brownsville, TX (PBS) | 938 | 223,572 | 82.3 | 77.6 | 76.7 | 70.6 | 2014 | 2011, 2006 |
| Chicago, IL (ORB) | 14,687 | 9,203,201 | 86.8 | 83.6 | 80.8 | 76.0 | 2010, 2012, 2013 | 2006, 2007, 2008, 2010, 2013, 2014 |
| Cleveland, OH (PBS/ORB) | 2737 | 1,758,114 | 90.2 | 86.9 | 86.2 | 81.6 | 2011, 2013 | 2006 |
| Des Moines, IA (PBS) | 1130 | 456,017 | 84.6 | 80.4 | 77.6 | 73.5 | 1 m for 2008, 2009; 0.61 m for 2007, 2009, 2010 | 2009 |
| Durham, NC (PBS) | 569 | 340,851 | N/A | N/A | 83.0 | 78.8 | 2010 | N/A |
| Fresno, CA (PBS) | 753 | 659,628 | 86.9 | 83.5 | 81.1 | 76.2 | 2010 | 2012 |
| Green Bay, WI (PBS) | 857 | 219,947 | 94.1 | 92.7 | 90.4 | 87.9 | 2010 | 2010 |
| Los Angeles County (ORB) | 11,336 | 9,818,599 | 89.2 | 86.2 | 61.1 | 53.4 | 2014, 2016 | 2016 |
| Memphis, TN (PBS) | 2516 | 1,091,638 | 89.0 | 86.1 | 86.9 | 83.5 | 2012, 2013 | 2009, 2010, 2011, 2012 |
| Milwaukee, WI (ORB) | 2154 | 1,373,711 | 85.5 | 80.5 | 76.2 | 68.9 | 2010 | 2010 |
| Minneapolis/St. Paul, MN (ORB) | 3085 | 2,282,061 | 87.7 | 84.4 | 87.1 | 83.6 | 2010 | 2011 |
| New Bedford, MA (PBS) | 258 | 151,164 | 95.0 | 93.0 | 92.3 | 89.2 | 2010 | N/A |
| New Haven, CT (PBS) | 1422 | 578,536 | 92.0 | 88.8 | 89.0 | 83.2 | 2014 | 2006, 2010, 2011 |
| New York, NY (ORB) | 1109 | 8,175,131 | 87.4 | 83.2 | 84.2 | 79.0 | 2011 | 2010 |
| Paterson, NJ (PBS) | 47 | 146,199 | 92.5 | 89.2 | 86.8 | 81.2 | 2010 | N/A |
| Philadelphia, PA (ORB) | 7184 | 5,425,378 | 86.4 | 82.3 | 77.6 | 70.6 | 2005–2008, 2012–2015 | 2006–2008, 2011–2015 |
| Phoenix, AZ (ORB) | 5406 | 3,704,874 | 75.4 | 65.9 | 69.2 | 57.7 | 2010 | N/A |
| Pittsburgh, PA (PBS) | 1927 | 1,209,128 | 89.3 | 85.1 | 86.5 | 81.3 | 2010 | 2006 |
| Portland, ME (PBS) | 523 | 191,292 | N/A | N/A | 87.5 | 85.0 | 2010 | N/A |
| Portland, OR (PBS) | 2507 | 1,853,233 | 91.4 | 89.2 | 78.5 | 73.5 | 2011, 2012 | 2007, 2010 |
| Salt Lake City, UT (ORB) | 2244 | 1,030,599 | 82.5 | 77.0 | 78.7 | 72.0 | 2014 | 2006–2007, 2011, 2013–2014 |
| Sonoma County, CA (OBS) | 4910 | 483,878 | 80.9 | 75.8 | 79.0 | 73.4 | 2011,2013 | 2013 |
| St. Louis, MO (OBS) | 4188 | 2,174,437 | 90.4 | 87.9 | 82.3 | 77.7 | 2012, 2014–2016 | 2008–2010, 2012 |
| Tampa, FL (PBS) | 4492 | 2,517,798 | N/A | N/A | 70.6 | 65.2 | 2010 | N/A |
| Virginia Beach, VA (OBS) | 3255 | 1,541,779 | 84.1 | 80.6 | 83.5 | 79.9 | 2013, 2014 | 2015, 2010, 2013 |
| Washington, DC (ORB) | 5423 | 4,693,748 | 91.5 | 88.7 | 85.4 | 80.6 | 2013, 2014 | 2004, 2008, 2011, 2012, 2015, 2016 |
| Woodbine, IA (PBS) | 51 | 1555 | 90.2 | 84.4 | 87.0 | 79.3 | 2011 | 2009 |
| Mean | 3170 | 2,188,566 | 88.0 | 84.0 | 82.0 | 77.0 | ||
| Total | 95,088 | 65,656,965 |
| Agriculture | Grass | Impervious | Shrub | Soil | Tree | Water | |
|---|---|---|---|---|---|---|---|
| Fuzzy User Accuracy | 90.4 | 82.6 | 90.8 | 79.7 | 76 | 86.9 | 96.1 |
| Fuzzy Producer Accuracy | 94.8 | 78.5 | 85.7 | 80.9 | 82.4 | 88.6 | 95.7 |
| Non-Fuzzy User Accuracy | 82.5 | 75.1 | 87.8 | 71.6 | 63.2 | 83.5 | 95.3 |
| Non-Fuzzy Producer Accuracy | 82.6 | 68.7 | 83.3 | 71.7 | 73.8 | 85.3 | 94.2 |
| Reference Classes | ||||||||||
|---|---|---|---|---|---|---|---|---|---|---|
| Agriculture | Grass | Impervious | Shrub | Soil | Tree | Water | Row Total | User Accuracy | ||
| Land cover Classes | Agriculture | 1771 | 108 | 4 | 1 | 39 | 10 | 1 | 1934 | 0.92 |
| Grass | 19 | 3100 | 192 | 16 | 98 | 280 | 15 | 3720 | 0.83 | |
| Impervious | 2 | 111 | 2761 | 2 | 86 | 59 | 8 | 3029 | 0.91 | |
| Shrub | 3 | 46 | 20 | 441 | 24 | 11 | 0 | 545 | 0.81 | |
| Soil | 27 | 198 | 117 | 23 | 1446 | 24 | 24 | 1859 | 0.78 | |
| Tree | 5 | 351 | 129 | 29 | 21 | 4359 | 13 | 4907 | 0.89 | |
| Water | 0 | 17 | 8 | 0 | 22 | 12 | 1707 | 1766 | 0.97 | |
| Column Total | 1827 | 3931 | 3231 | 512 | 1736 | 4755 | 1768 | 17760 | ||
| Producer Accuracy | 0.97 | 0.79 | 0.86 | 0.86 | 0.83 | 0.92 | 0.97 | |||
| Overall Fuzzy Accuracy | 0.88 | |||||||||
| Kappa | 0.85 | |||||||||
© 2020 by the authors. Licensee MDPI, Basel, Switzerland. This article is an open access article distributed under the terms and conditions of the Creative Commons Attribution (CC BY) license (http://creativecommons.org/licenses/by/4.0/).
Share and Cite
Pilant, A.; Endres, K.; Rosenbaum, D.; Gundersen, G. US EPA EnviroAtlas Meter-Scale Urban Land Cover (MULC): 1-m Pixel Land Cover Class Definitions and Guidance. Remote Sens. 2020, 12, 1909. https://doi.org/10.3390/rs12121909
Pilant A, Endres K, Rosenbaum D, Gundersen G. US EPA EnviroAtlas Meter-Scale Urban Land Cover (MULC): 1-m Pixel Land Cover Class Definitions and Guidance. Remote Sensing. 2020; 12(12):1909. https://doi.org/10.3390/rs12121909
Chicago/Turabian StylePilant, Andrew, Keith Endres, Daniel Rosenbaum, and Gillian Gundersen. 2020. "US EPA EnviroAtlas Meter-Scale Urban Land Cover (MULC): 1-m Pixel Land Cover Class Definitions and Guidance" Remote Sensing 12, no. 12: 1909. https://doi.org/10.3390/rs12121909
APA StylePilant, A., Endres, K., Rosenbaum, D., & Gundersen, G. (2020). US EPA EnviroAtlas Meter-Scale Urban Land Cover (MULC): 1-m Pixel Land Cover Class Definitions and Guidance. Remote Sensing, 12(12), 1909. https://doi.org/10.3390/rs12121909