An Assessment of Global Forest Change Datasets for National Forest Monitoring and Reporting

 , and
, and
Abstract
1. Introduction
2. Materials and Methods
2.1. Study Area
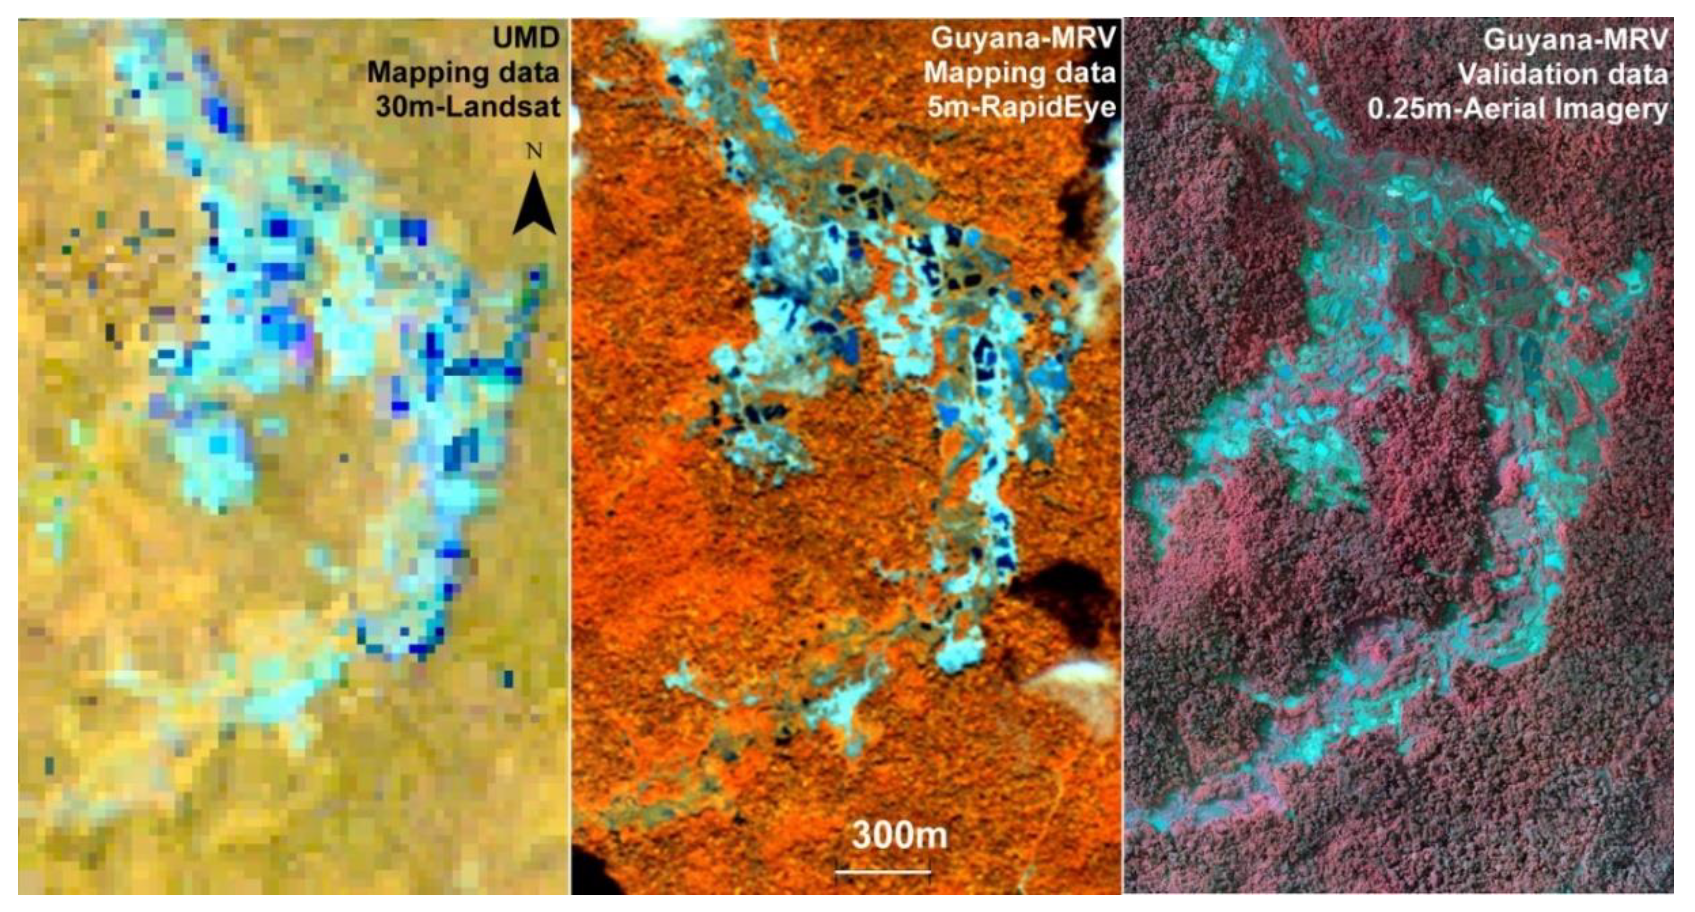
2.2. Mapping Data
2.2.1. University of Maryland (UMD) Global Forest Change Datasets.
2.2.2. Guyana-Measurement Reporting and Verification (MRV) System Maps
2.3. Reference Data
2.4. Data Preparation
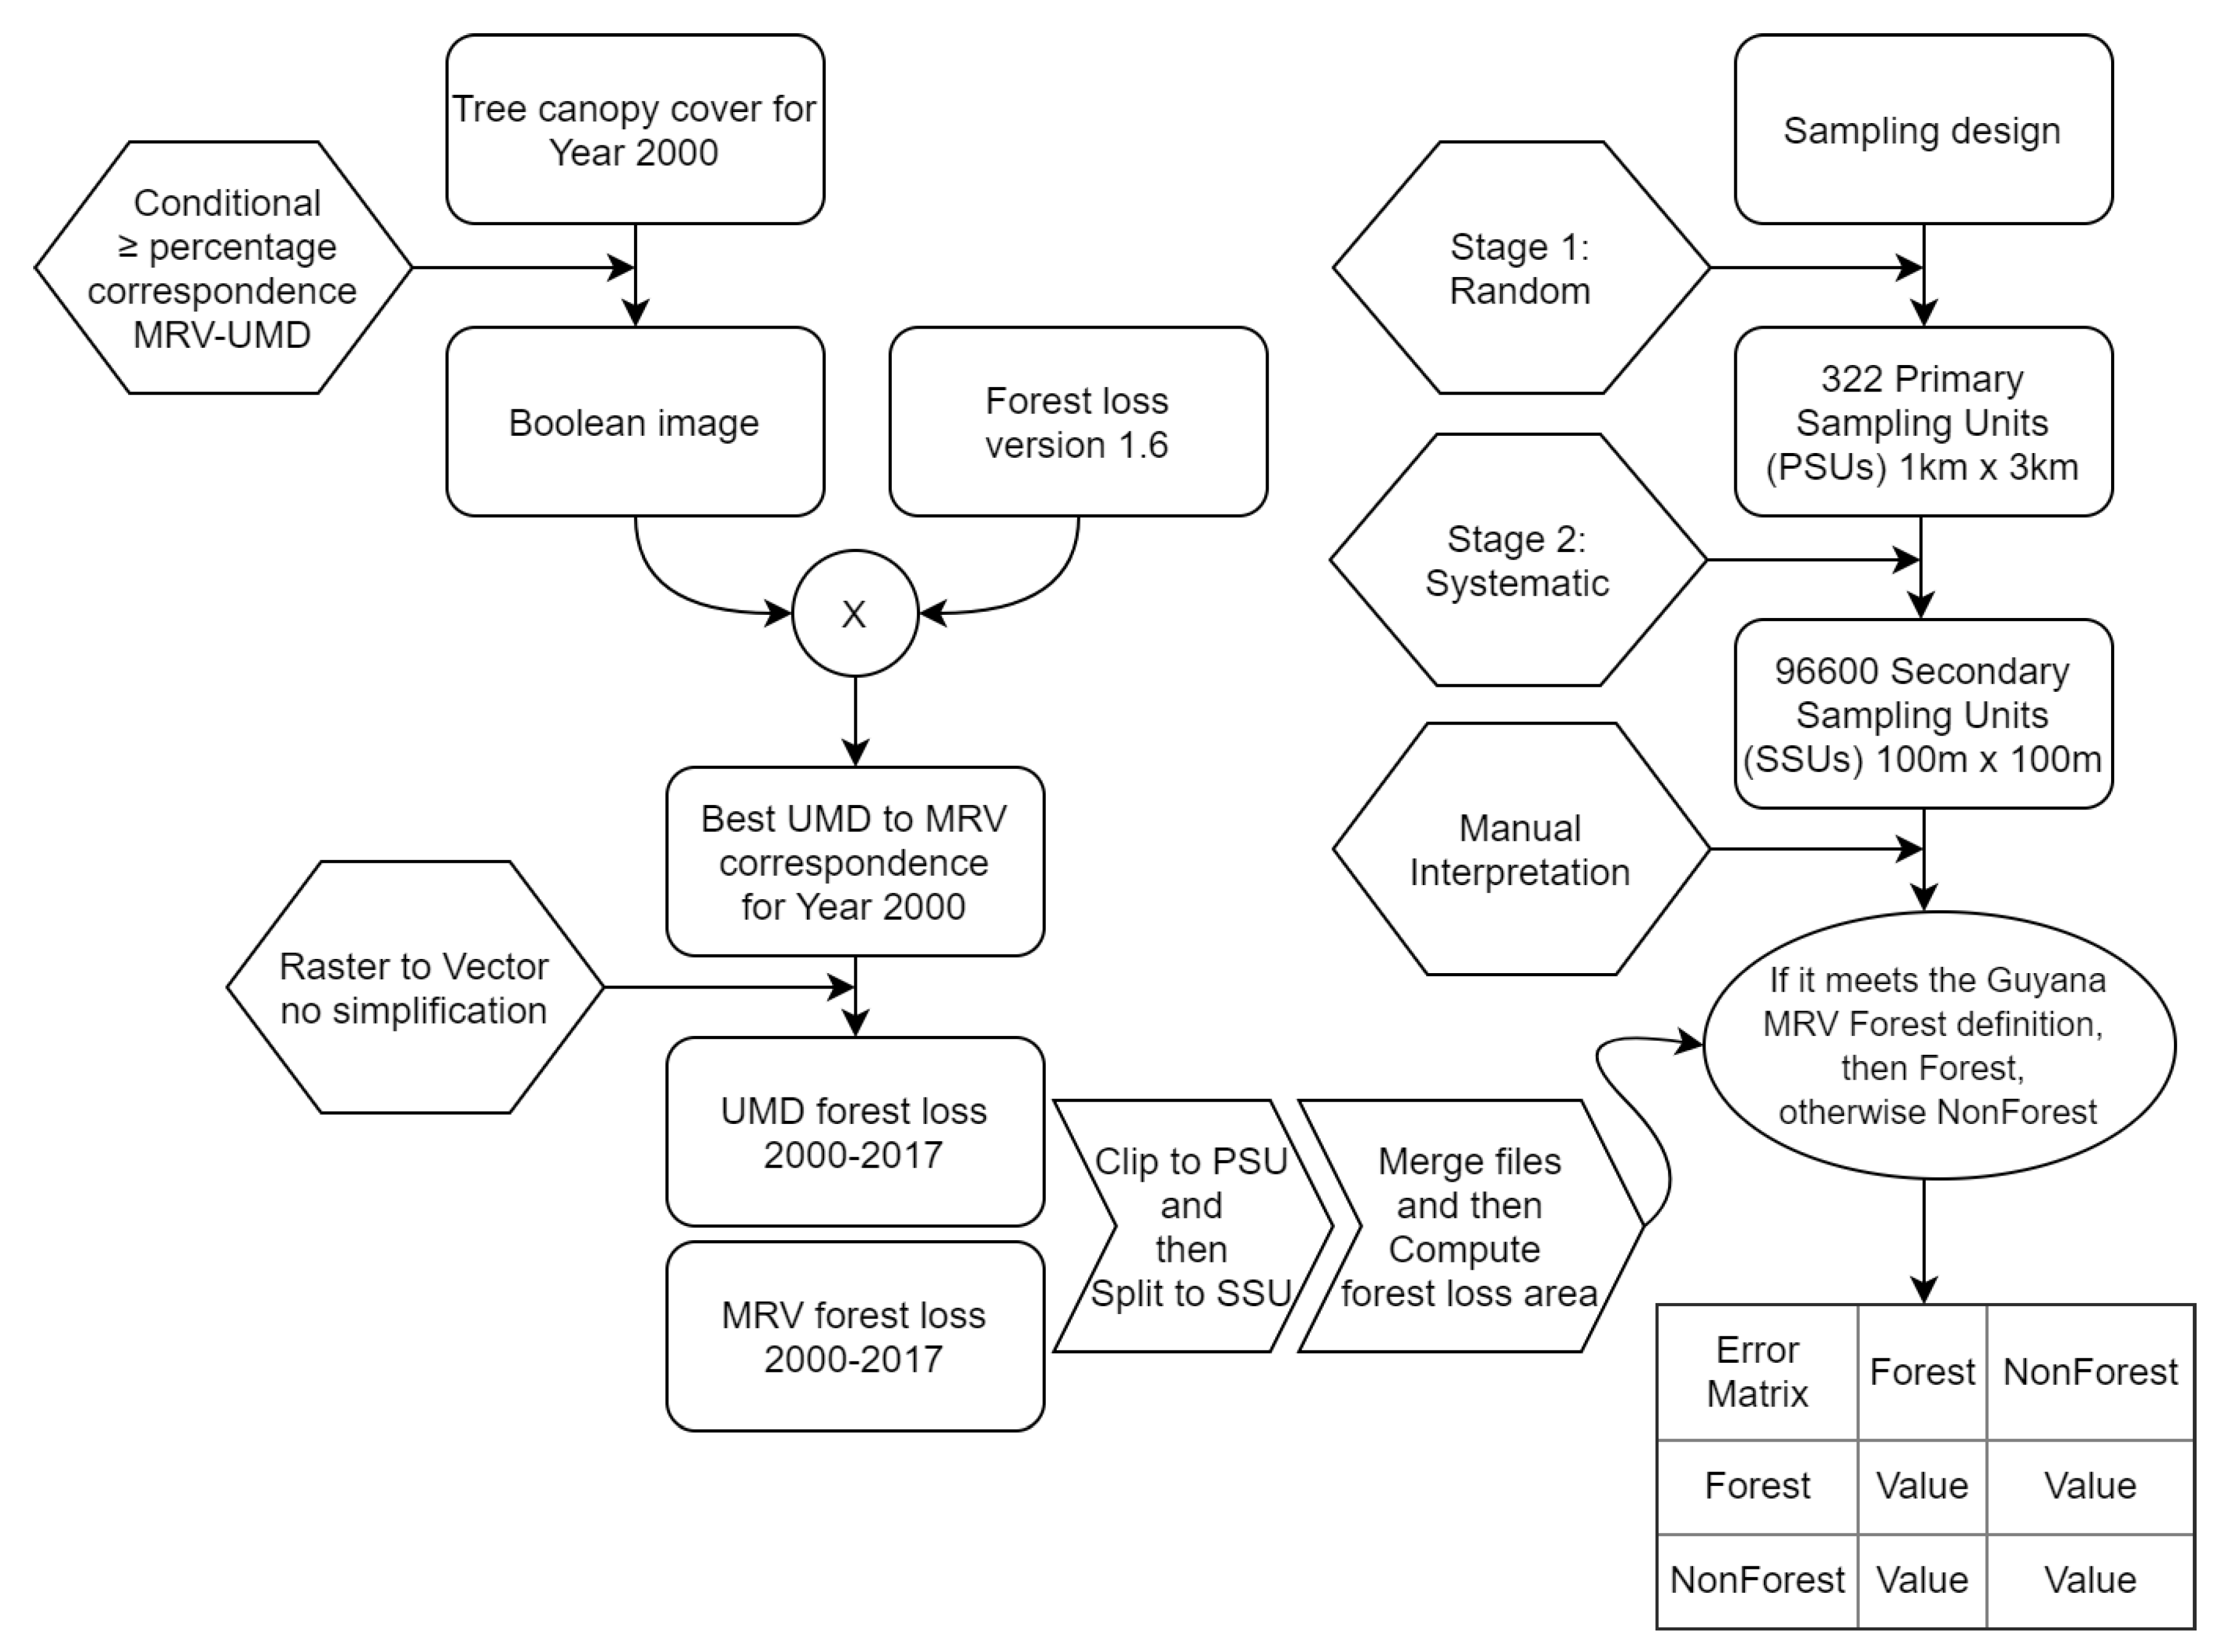
2.4.1. Preprocessing of the Global Forest Change Tree Canopy Cover Map for the Year 2000
- Prepare tree cover percentage maps for the year 2000 using the online Global Forest Change raster data:
- Download and review the Global Forest Change tree cover percentage raster datasets for the year 2000.
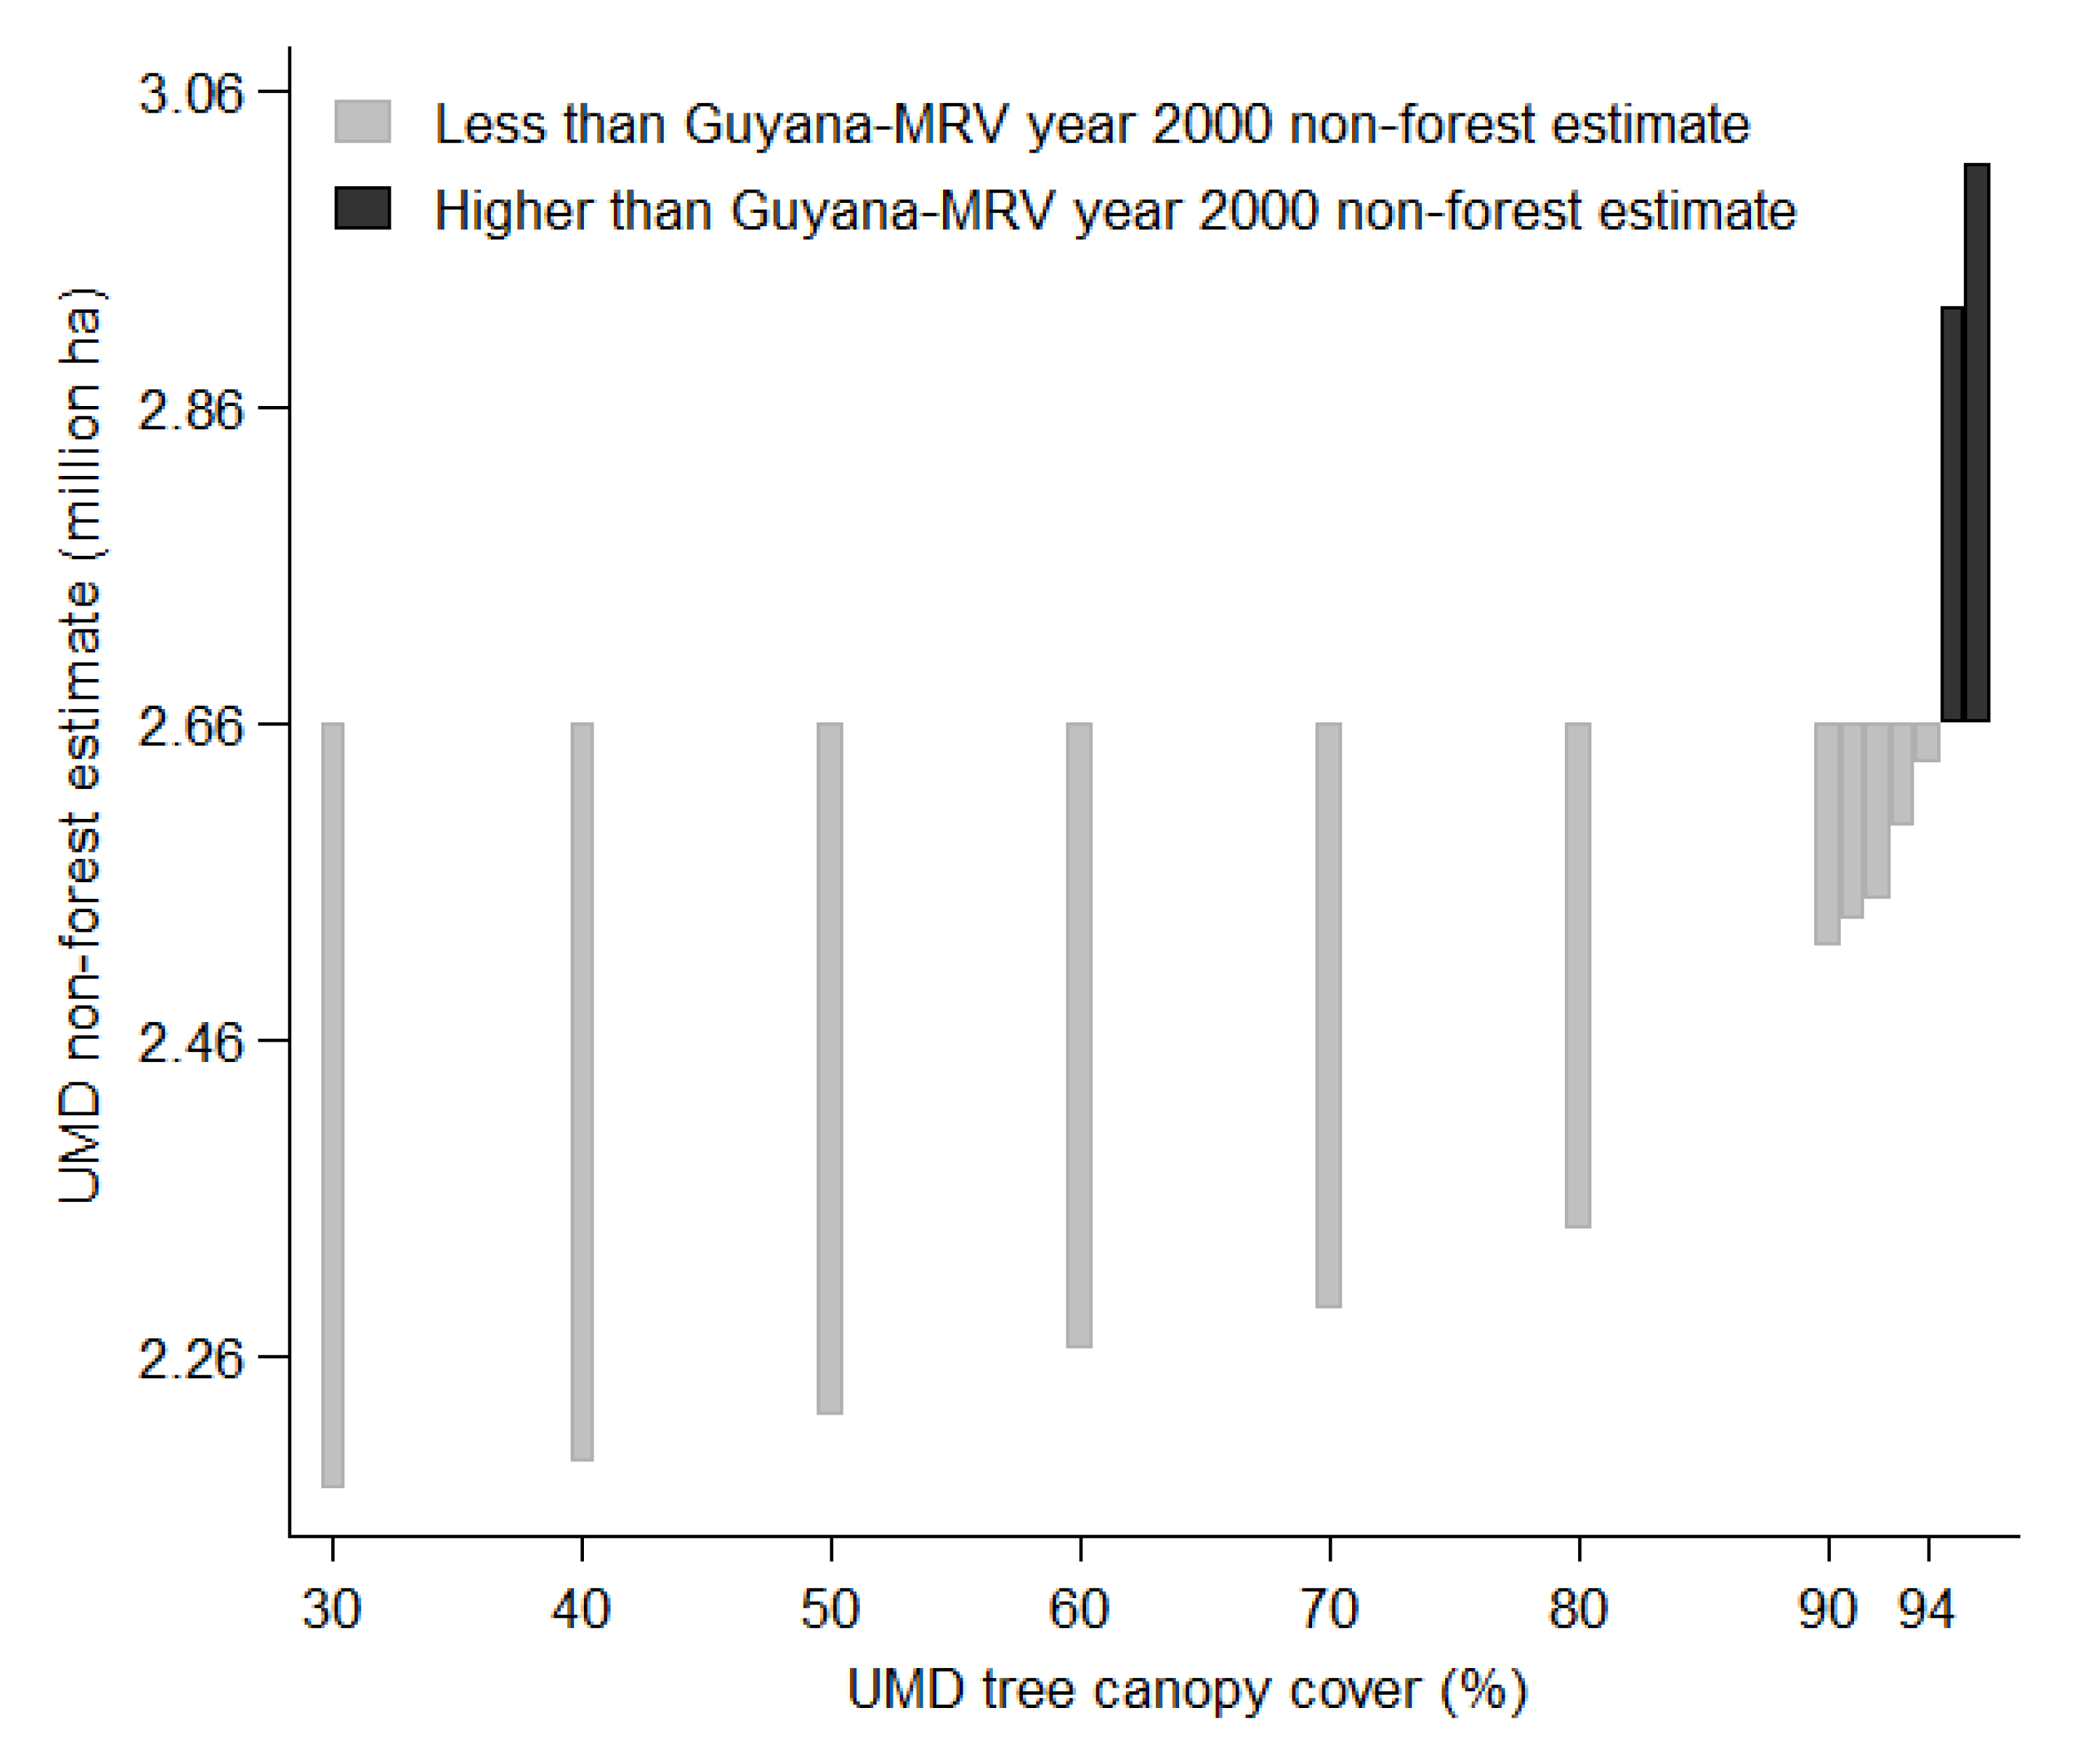
- Produce binary rasters of forest (1) and non-forest (0) area using threshold values of tree cover percentages in increments of 1 (one) starting from 30% to 100%.
- Vectorise the series of binary rasters of forest/non-forest classes.
- Calculate the area of forest and non-forest classes for each canopy cover percentage threshold starting from 30% through to 100%.
- Generate a non-forest map for year 2000 using data from the Guyana-MRV.
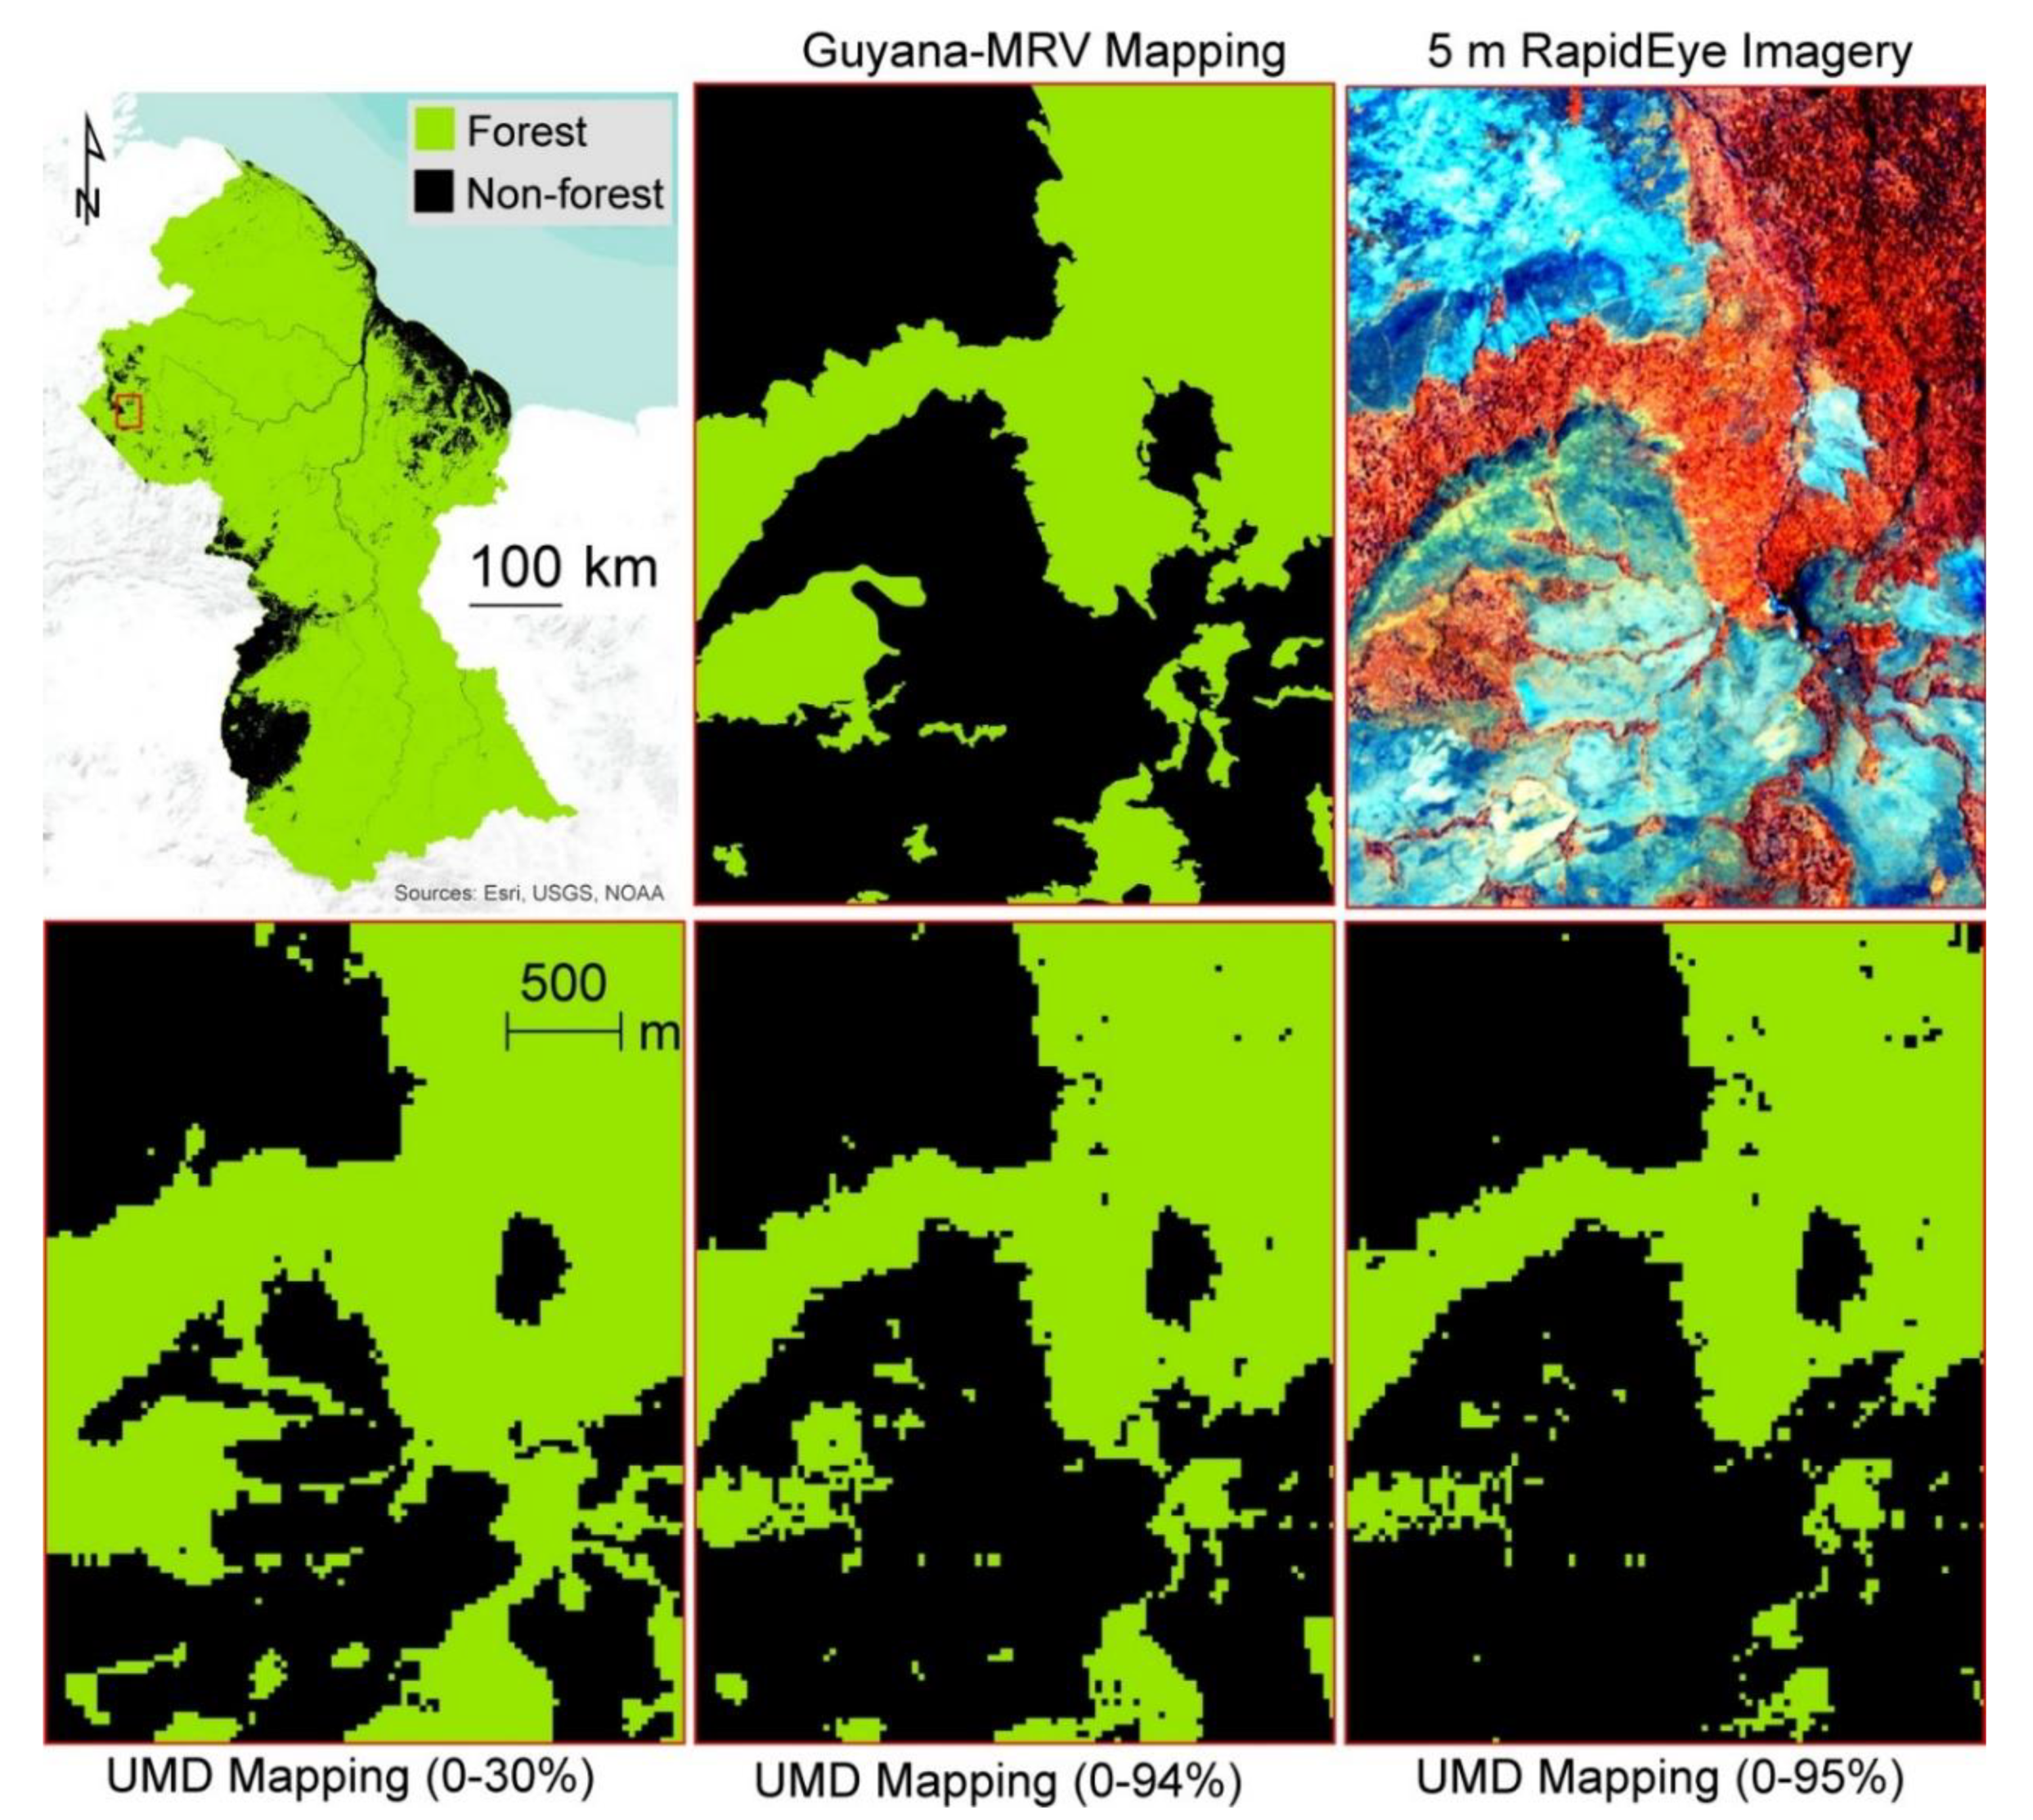
- The Guyana-MRV 2000 forest/non-forest map was prepared by combining two separate maps: the 1990 forest/non-forest map and the 1990–2000 forest loss map. These two maps were originally prepared using 30 m Landsat imagery. Subsequently, the forest/non-forest borders were refined using 5 m RapidEye imagery.
- The non-forest map only included areas that were mapped as a loss from a forest to a non-forest state during the period 1990–2000.
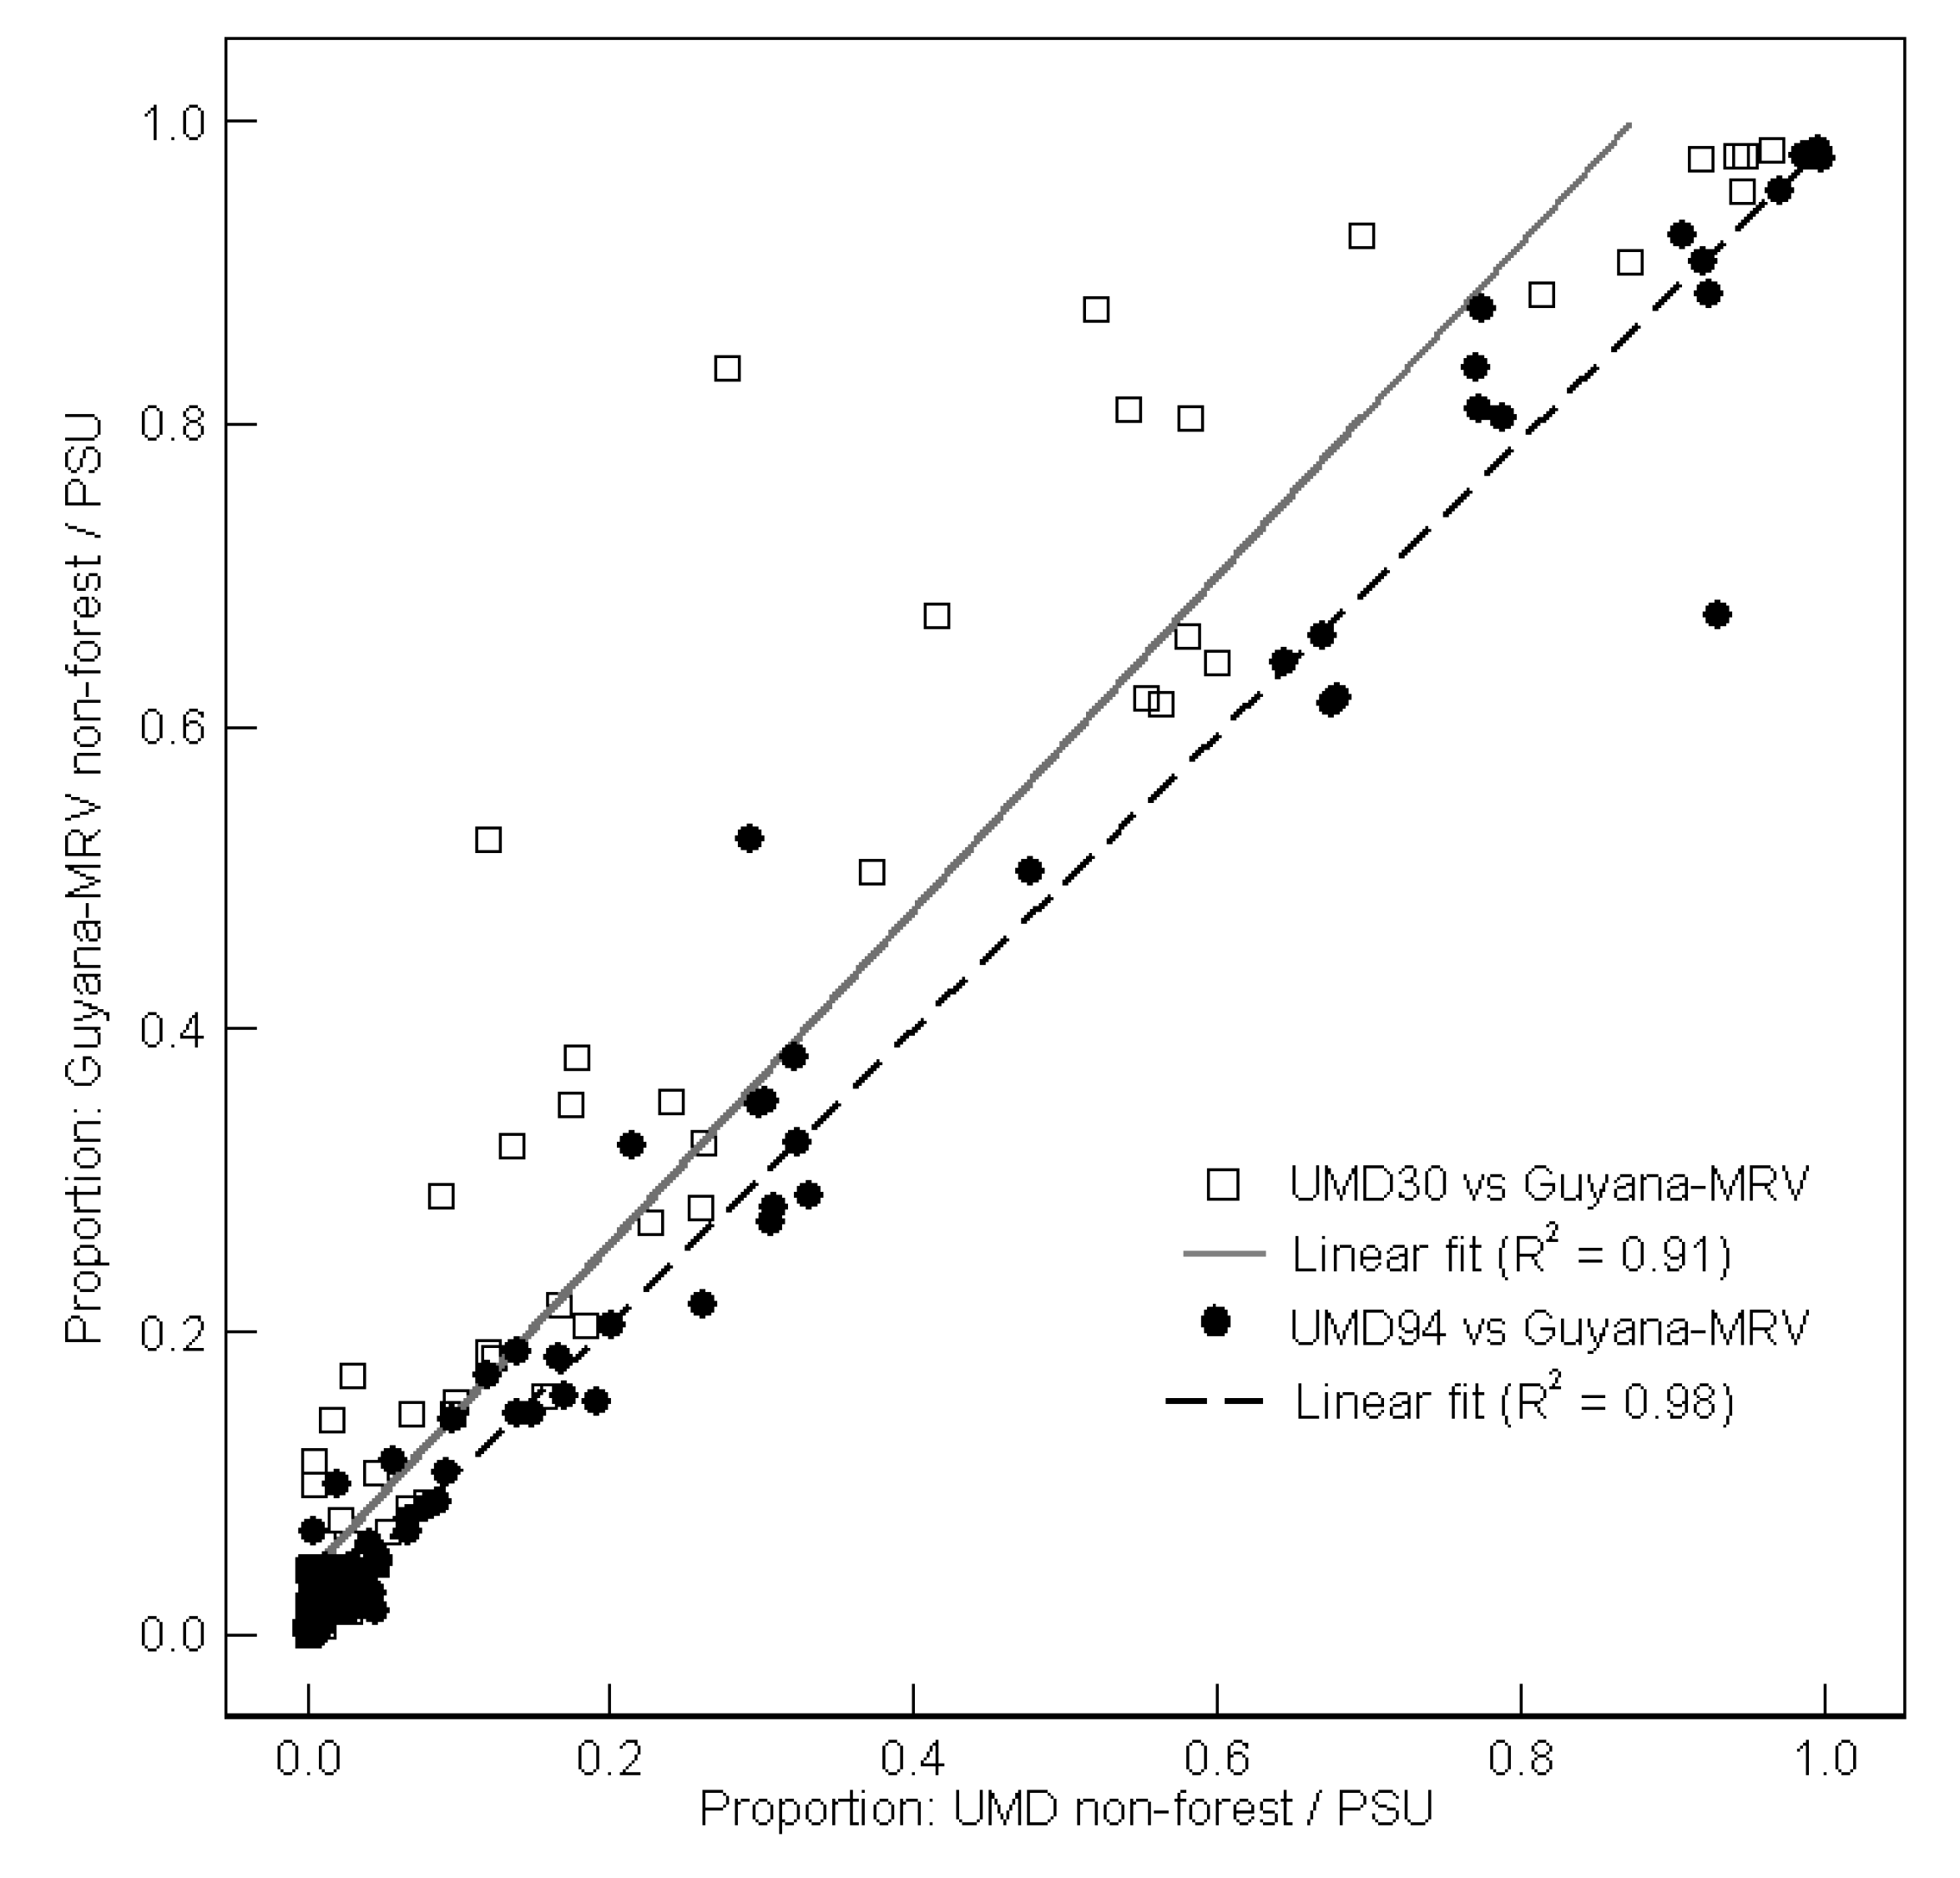
- Finally, the Global Forest Change and Guyana-MRV datasets were compared using the non-forest class from the year 2000 Global Forest Change data for tree canopy cover percent values from 30 to 100 (from step 1) and Guyana-MRV (from step 2).
2.4.2. Global Forest Change Maps 2001–2017
2.5. Determining Map Accuracy
3. Results
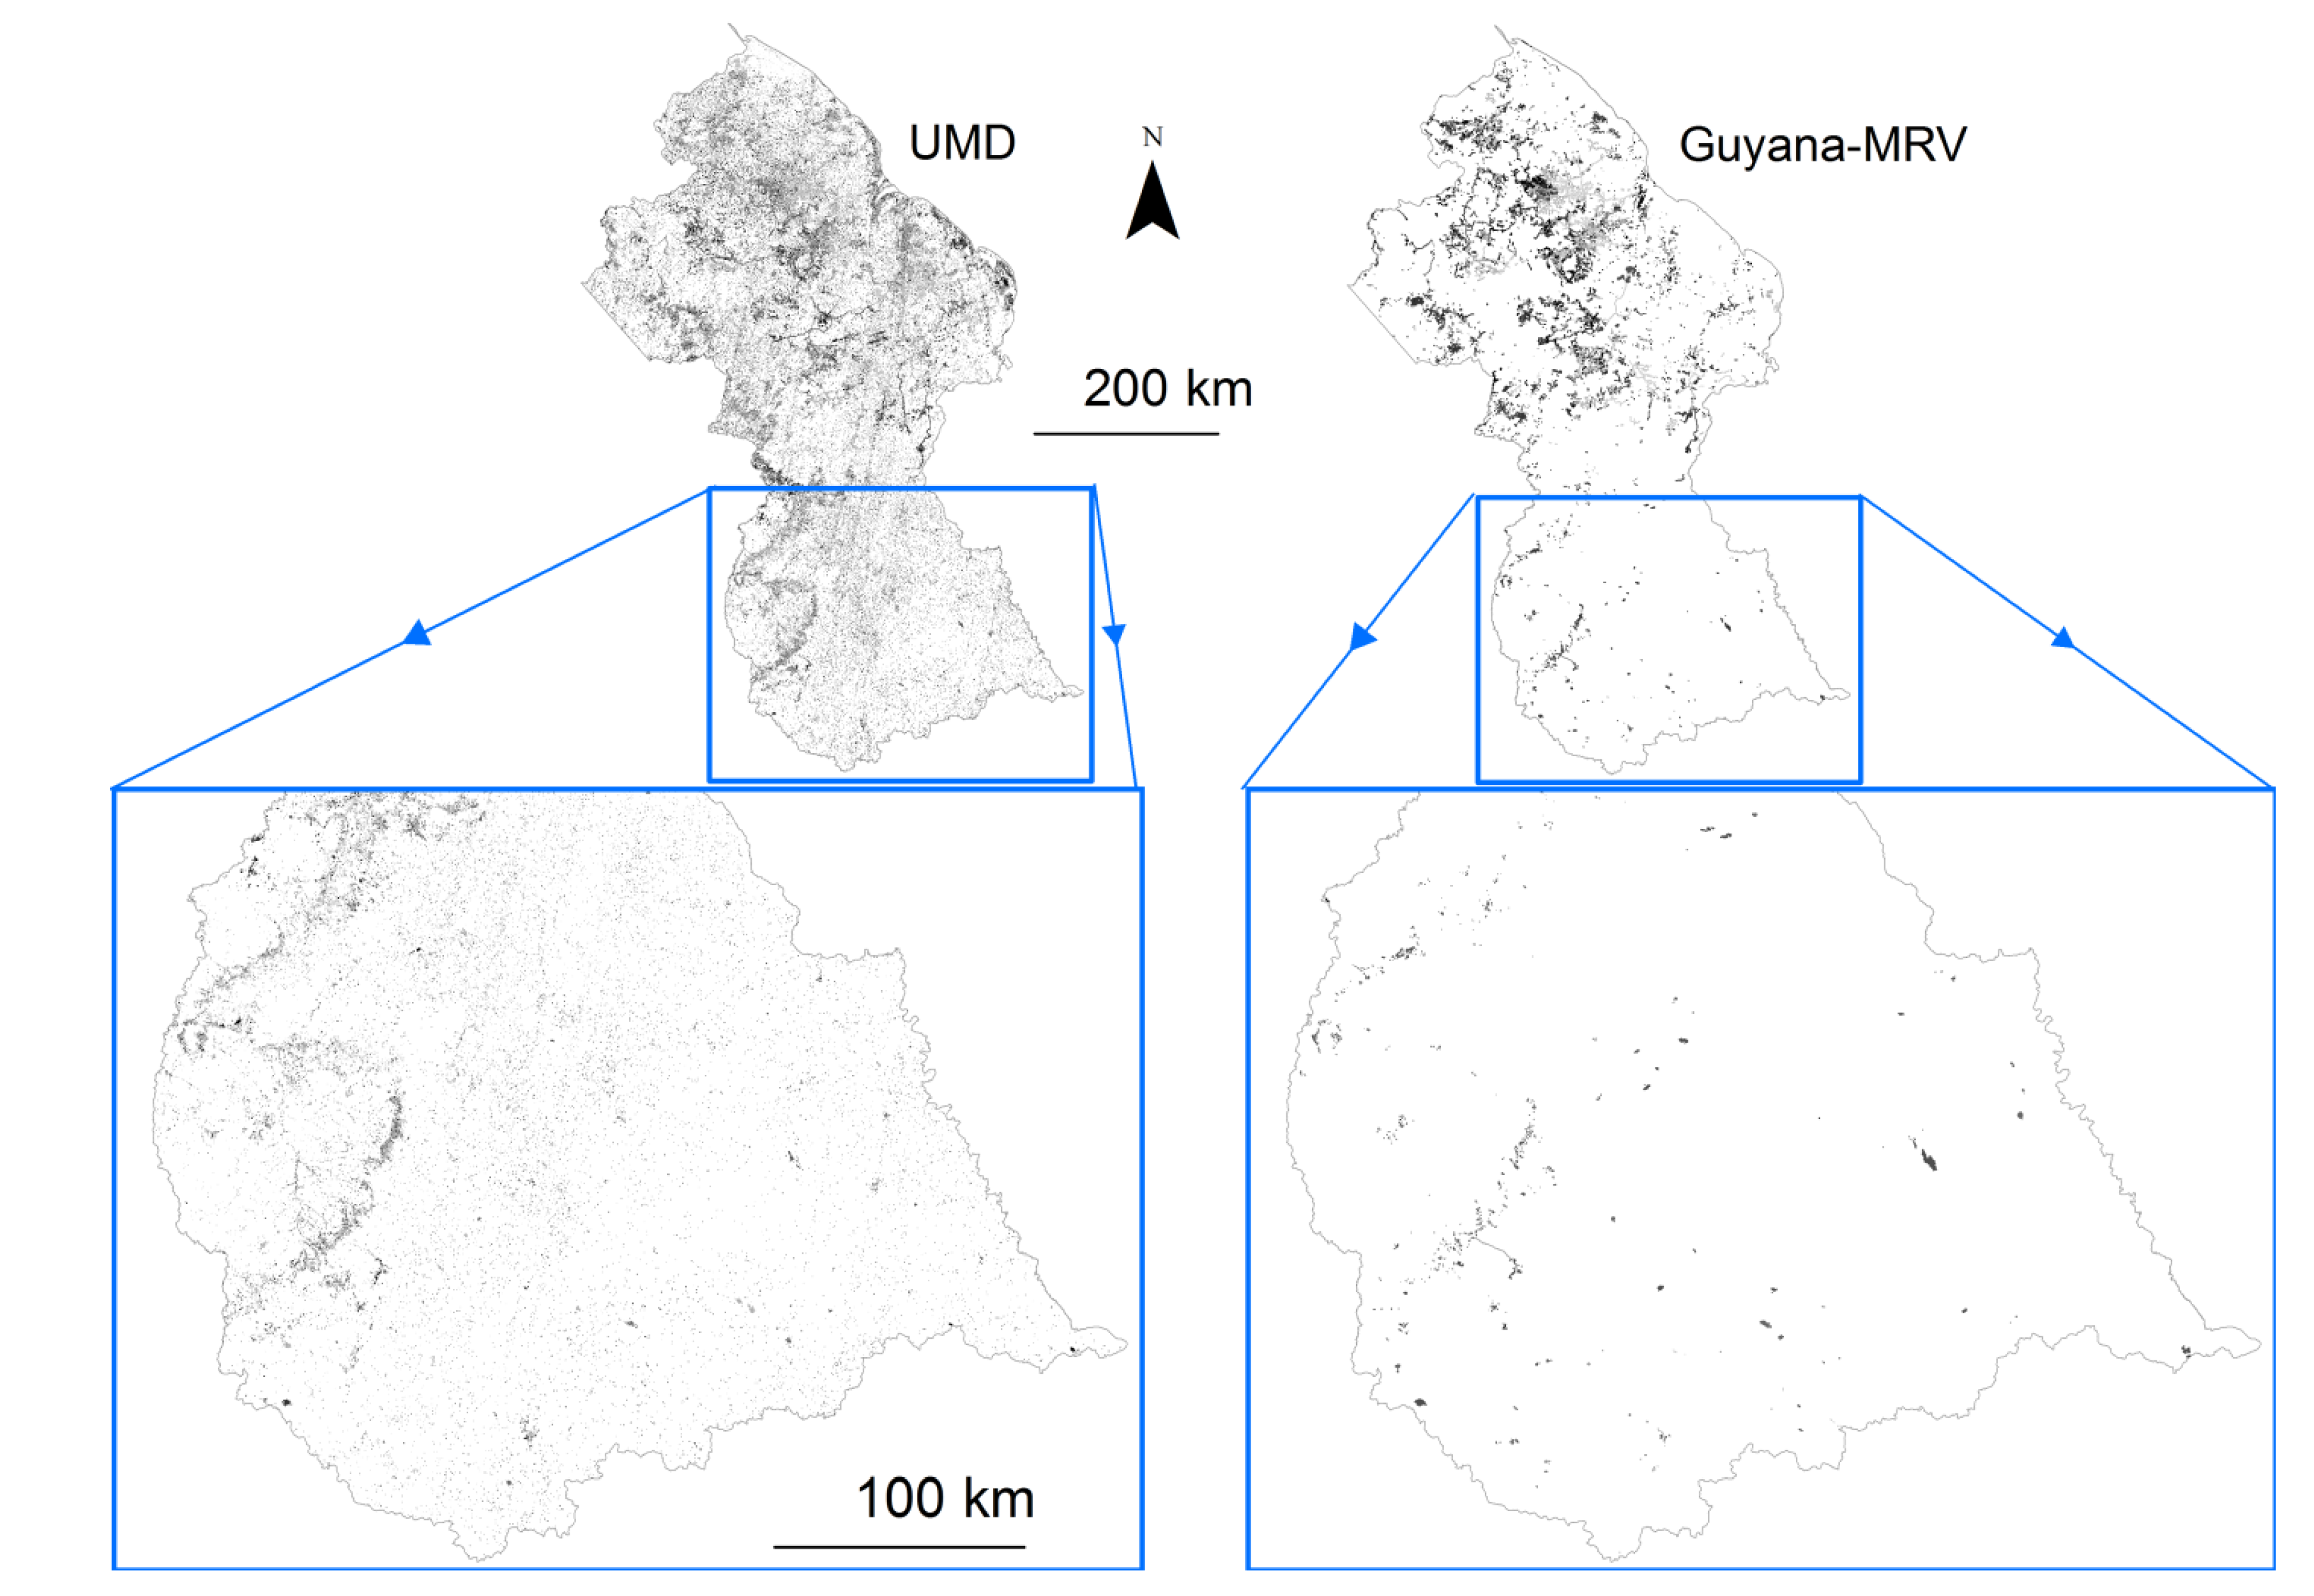
3.1. Comparison of Forest/Non-Forest Area for the Year 2000
3.2. Accuracy Assessment of the Year 2000 Global Forest Change Non-Forest Map
3.3. Accuracy of Forest Loss Maps 2001–2017
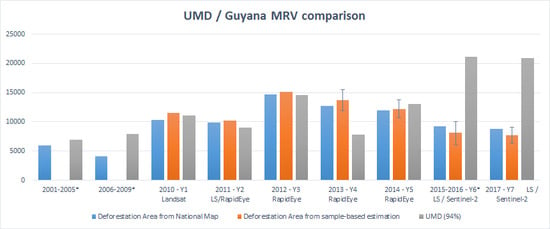
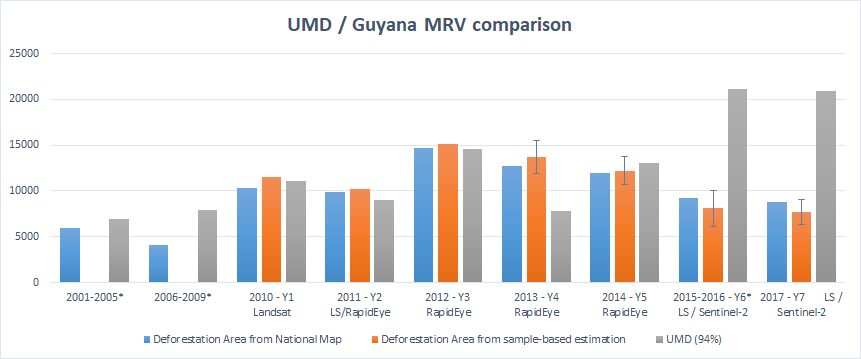
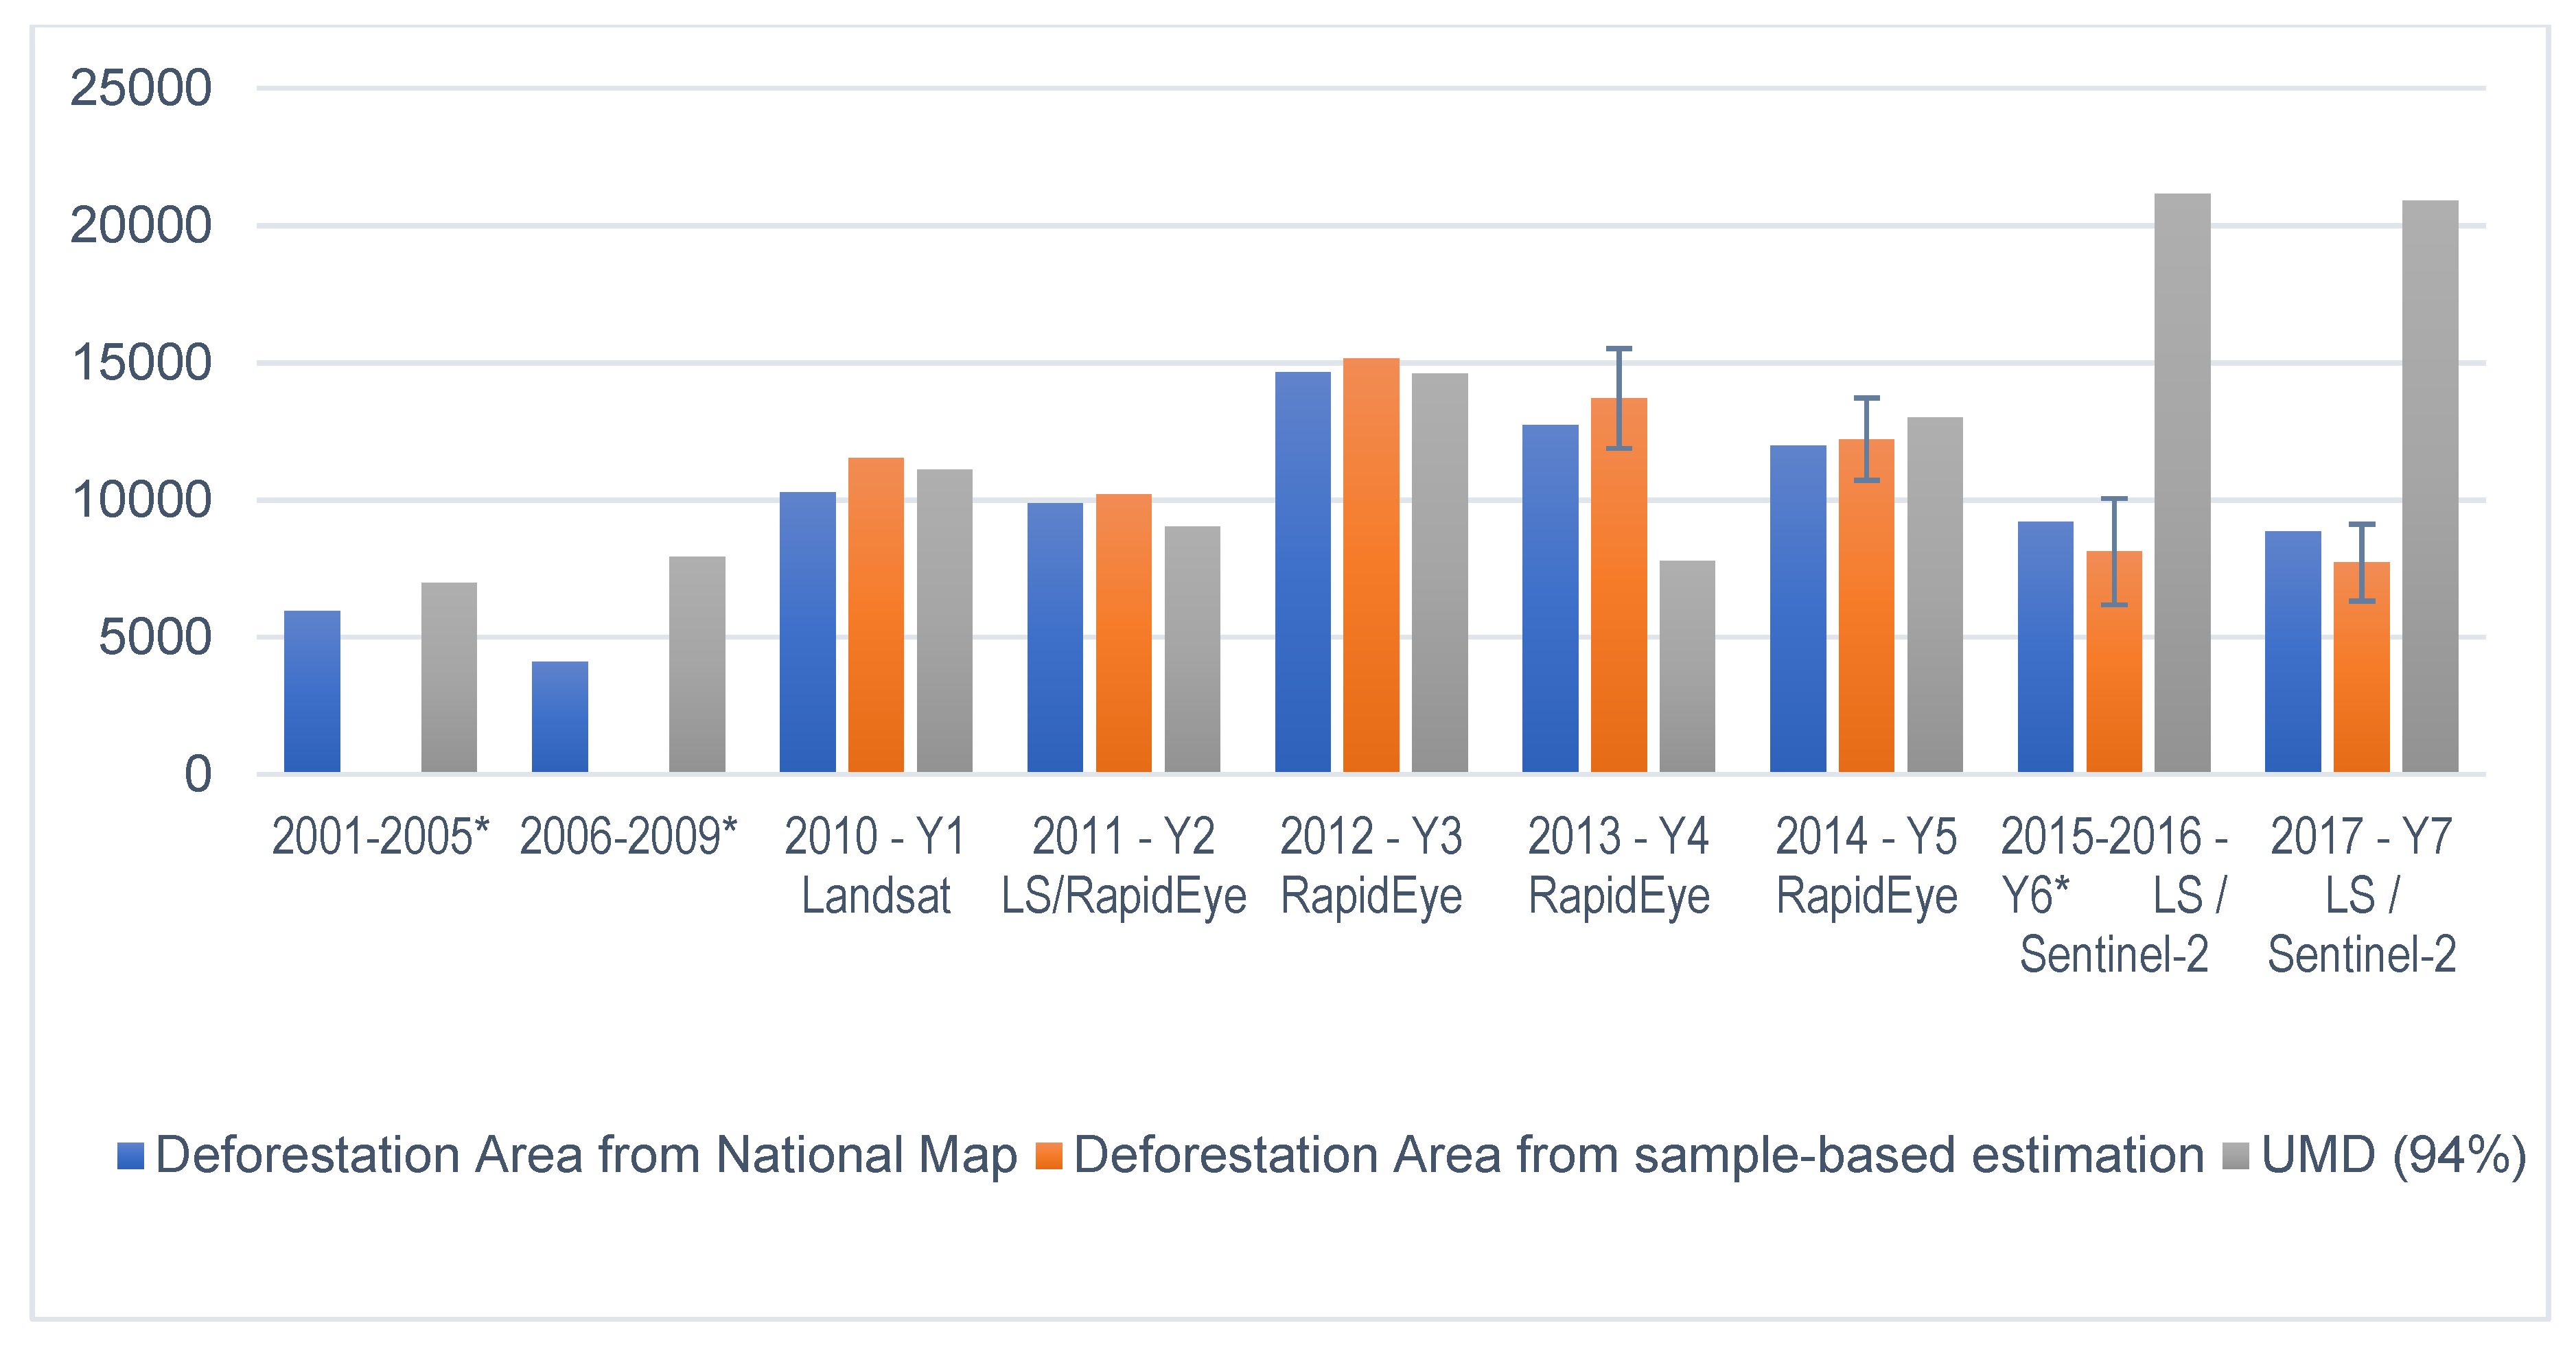
3.4. Forest Loss Estimates: 2001–2017
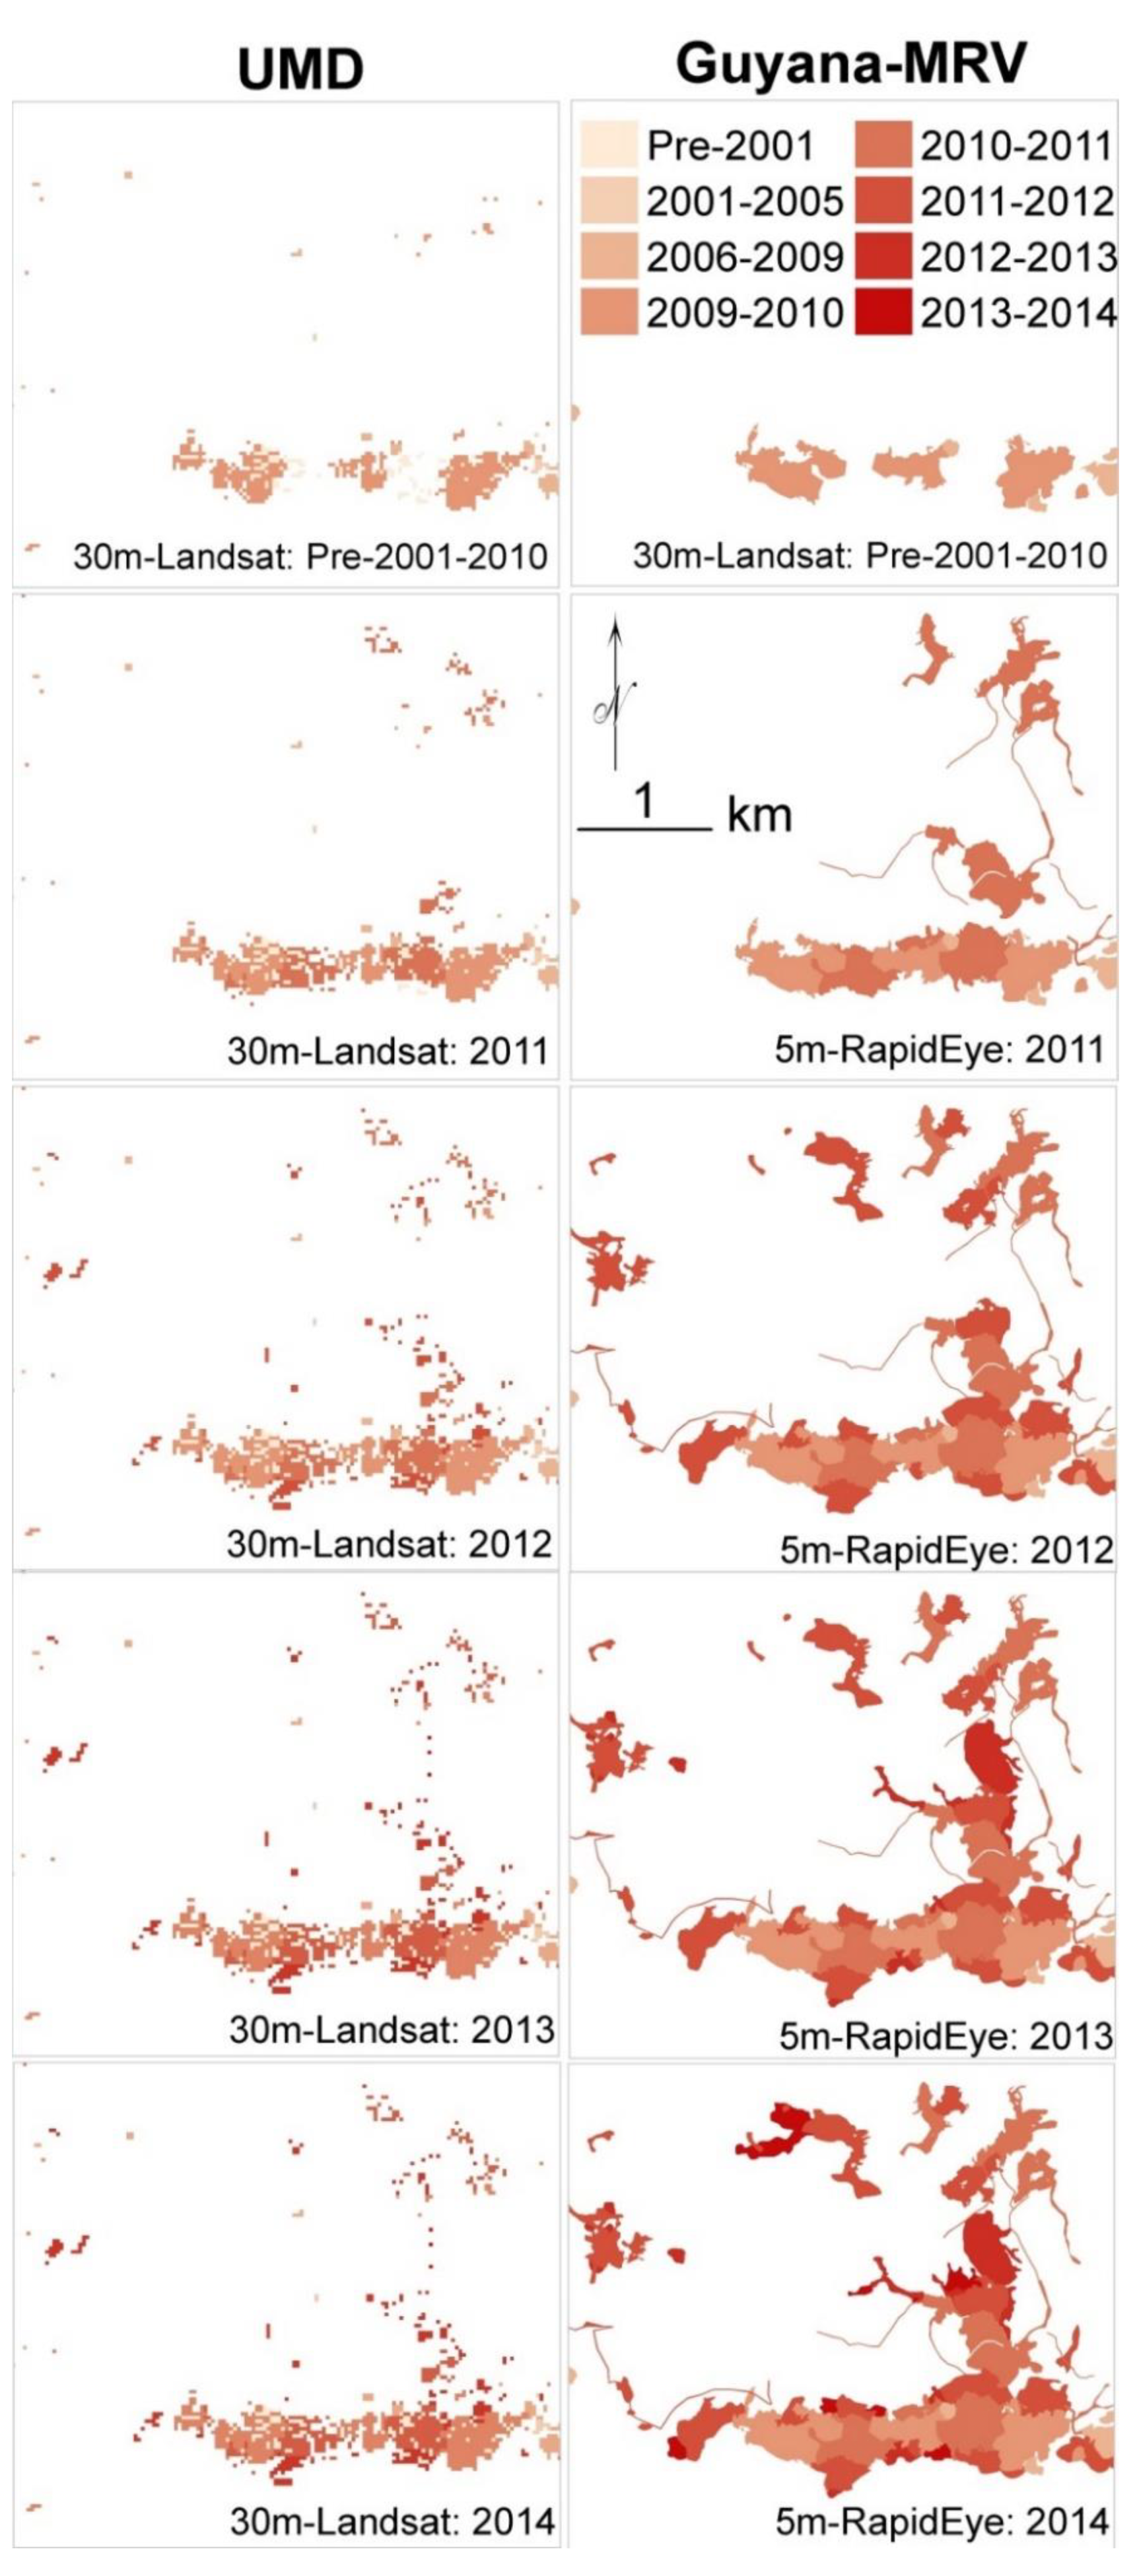
3.5. Quality of Annualized Forest Change Mapping: 2001–2017
4. Discussion
5. Conclusions
Author Contributions
Funding
Acknowledgments
Conflicts of Interest
References
- Van der Werf, G.R.; Morton, D.C.; DeFries, R.S.; Olivier, J.G.J.; Kasibhatla, P.S.; Jackson, R.B.; Collatz, G.J.; Randerson, J.T. CO2 emissions from forest loss. Nat. Geosci. 2009, 2, 737. [Google Scholar] [CrossRef]
- Achard, F.; Beuchle, R.; Mayaux, P.; Stibig, H.-J.; Bodart, C.; Brink, A.; Carboni, S.; Desclée, B.; Donnay, F.; Eva, H.D.; et al. Determination of tropical deforestation rates and related carbon losses from 1990 to 2010. Glob. Chang. Biol. 2014, 20, 2540–2554. [Google Scholar] [CrossRef] [PubMed]
- Tyukavina, A.; Baccini, A.; Hansen, M.C.; Potapov, P.V.; Stehman, S.V.; Houghton, R.A.; Krylov, A.M.; Turubanova, S.; Goetz, S.J. Aboveground carbon loss in natural and managed tropical forests from 2000 to 2012. Environ. Res. Lett. 2015, 10, 074002. [Google Scholar] [CrossRef]
- Federici, S.; Tubiello, F.N.; Salvatore, M.; Jacobs, H.; Schmidhuber, J. New estimates of CO2 forest emissions and removals: 1990–2015. For. Ecol. Manag. 2015, 352, 89–98. [Google Scholar] [CrossRef]
- Le Quéré, C.; Moriarty, R.; Andrew, R.M.; Peters, G.P.; Ciais, P.; Friedlingstein, P.; Jones, S.D.; Sitch, S.; Tans, P.; Arneth, A.; et al. Global carbon budget 2014. Earth Syst. Sci. Data 2015, 7, 47–85. [Google Scholar] [CrossRef]
- UNFCCC. Addendum. Part Two: Action taken by the Conference of the Parties at its fifteenth session. In Proceedings of the Report of the Conference of the Parties on Its Fifteenth Session, Copenhagen, Denmark, 7–19 December 2009; p. 43. [Google Scholar]
- UNFCCC. Addendum. Part Two: Action taken by the Conference of the Parties at its sixteenth session. In Proceedings of the Conference of the Parties (COP) Report of the Conference of the Parties on Its Sixteenth Session, Cancun, Mexico, 29 November–10 December 2010; p. 31. [Google Scholar]
- UNFCCC. Addendum. Part two: Action taken by the Conference of the Parties at its seventeenth session. In Proceedings of the Conference of the Parties (COP) Report of the Conference of the Parties on Its Seventeenth Session, Durban, South Africa, 28 November–11 December 2011; p. 63. [Google Scholar]
- UNFCCC. Addendum. Part two: Action taken by the Conference of the Parties at its twenty-first session. In Proceedings of the Report of the Conference of the Parties on Its Twenty-First Session, Paris, France, 30 November–13 December 2015; p. 36. [Google Scholar]
- Grainger, A. Difficulties in tracking the long-term global trend in tropical forest area. Proc. Natl. Acad. Sci. USA 2008, 105, 818–823. [Google Scholar] [CrossRef]
- Ramankutty, N.; Gibbs, H.K.; Achard, F.; Defries, R.; Foley, J.A.; Houghton, R.A. Challenges to estimating carbon emissions from tropical deforestation. Glob. Chang. Biol. 2007, 13, 51–66. [Google Scholar] [CrossRef]
- Hosonuma, N.; Herold, M.; Sy, V.D.; Fries, R.S.D.; Brockhaus, M.; Verchot, L.; Angelsen, A.; Romijn, E. An assessment of deforestation and forest degradation drivers in developing countries. Environ. Res. Lett. 2012, 7, 044009. [Google Scholar] [CrossRef]
- Baccini, A.; Goetz, S.J.; Walker, W.S.; Laporte, N.T.; Sun, M.; Sulla-Menashe, D.; Hackler, J.; Beck, P.S.A.; Dubayah, R.; Friedl, M.A.; et al. Estimated carbon dioxide emissions from tropical deforestation improved by carbon-density maps. Nat. Clim. Chang. 2012, 2, 182. [Google Scholar] [CrossRef]
- Keenan, R.J.; Reams, G.A.; Achard, F.; de Freitas, J.V.; Grainger, A.; Lindquist, E. Dynamics of global forest area: Results from the FAO Global Forest Resources Assessment 2015. For. Ecol. Manag. 2015, 352, 9–20. [Google Scholar] [CrossRef]
- GFOI Integration of Remote-Sensing and Ground-Based Observations for Estimation of Emissions and Removals of Greenhouse Gases in Forests: Methods and Guidance from the Global Forest Observations Initiative; 2.0; Food and Agriculture Organization: Rome, Italy, 2016.
- GOFC-GOLD. A Source Book of Methods and Procedures for Monitoring and Reporting Anthropogenic Greenhouse Gas Emissions and Removals Associated with Deforestation, Gains and Losses of Carbon Stocks in Forests Remaining Forests, and Forestation; GOFC-GOLD Report Version COP22-1; GOFC-GOLD Land Cover Project Office; Wageningen University: Wageningen, The Netherlands, 2016. [Google Scholar]
- Lieth, H.; Van der Maarel, E. Classifying and mapping the world’s vegetation. Vegetatio 1976, 32, 73–74. [Google Scholar] [CrossRef]
- Matthews, E. Global Vegetation and Land Use: New High-Resolution Data Bases for Climate Studies. J. Clim. Appl. Meteorol. 1983, 22, 474–487. [Google Scholar] [CrossRef]
- Wilson, M.F.; Henderson-Sellers, A. A global archive of land cover and soils data for use in general circulation climate models. J. Climatol. 1985, 5, 119–143. [Google Scholar] [CrossRef]
- DeFries, R.S.; Field, C.B.; Fung, I.; Justice, C.O.; Los, S.; Matson, P.A.; Matthews, E.; Mooney, H.A.; Potter, C.S.; Prentice, K.; et al. Mapping the land surface for global atmosphere-biosphere models: Toward continuous distributions of vegetation’s functional properties. J. Geophys. Res. Atmos. 1995, 100, 20867–20882. [Google Scholar] [CrossRef]
- DeFries, R.S.; Townshend, J.R.G. NDVI-derived land cover classifications at a global scale. Int. J. Remote Sens. 1994, 15, 3567–3586. [Google Scholar] [CrossRef]
- Hansen, M.C.; Defries, R.S.; Townshend, J.R.G.; Sohlberg, R. Global land cover classification at 1 km spatial resolution using a classification tree approach. Int. J. Remote Sens. 2000, 21, 1331–1364. [Google Scholar] [CrossRef]
- Hansen, M.C.; DeFries, R.S.; Townshend, J.R.G.; Carroll, M.; Dimiceli, C.; Sohlberg, R.A. Global Percent Tree Cover at a Spatial Resolution of 500 Meters: First Results of the MODIS Vegetation Continuous Fields Algorithm. Earth Interact. 2003, 7, 1–15. [Google Scholar] [CrossRef]
- Loveland, T.R.; Belward, A.S. The IGBP-DIS global 1km land cover data set, DISCover: First results. Int. J. Remote Sens. 1997, 18, 3289–3295. [Google Scholar] [CrossRef]
- Loveland, T.R.; Reed, B.C.; Brown, J.F.; Ohlen, D.O.; Zhu, Z.; Yang, L.; Merchant, J.W. Development of a global land cover characteristics database and IGBP DISCover from 1 km AVHRR data. Int. J. Remote Sens. 2000, 21, 1303–1330. [Google Scholar] [CrossRef]
- Townshend, J.R.G. Global data sets for land applications from the Advanced Very High Resolution Radiometer: An introduction. Int. J. Remote Sens. 1994, 15, 3319–3332. [Google Scholar] [CrossRef]
- Kim, D.-H.; Sexton, J.O.; Townshend, J.R. Accelerated deforestation in the humid tropics from the 1990s to the 2000s. Geophys. Res. Lett. 2015, 42, 3495–3501. [Google Scholar] [CrossRef] [PubMed]
- Stibig, H.-J.; Achard, F.; Carboni, S.; Raši, R.; Miettinen, J. Change in tropical forest cover of Southeast Asia from 1990 to 2010. Biogeosciences 2014, 11, 247–258. [Google Scholar] [CrossRef]
- Mayaux, P.; Pekel, J.F.; Desclée, B.; Donnay, F.; Lupi, A.; Achard, F.; Clerici, M.; Bodart, C.; Brink, A.; Nasi, R.; et al. State and evolution of the African rainforests between 1990 and 2010. Philos. Trans. R. Soc. B Biol. Sci. 2013, 368, 20120300. [Google Scholar] [CrossRef] [PubMed]
- Woodcock, C.E.; Allen, R.; Anderson, M.; Belward, A.; Bindschadler, R.; Cohen, W.; Gao, F.; Goward, S.N.; Helder, D.; Helmer, E.; et al. Free Access to Landsat Imagery. Science 2008, 320, 1011. [Google Scholar] [CrossRef] [PubMed]
- Hansen, M.C.; Potapov, P.V.; Moore, R.; Hancher, M.; Turubanova, S.A.; Tyukavina, A.; Thau, D.; Stehman, S.V.; Goetz, S.J.; Loveland, T.R.; et al. High-Resolution Global Maps of 21st-Century Forest Cover Change. Science 2013, 342, 850–853. [Google Scholar] [CrossRef] [PubMed]
- Shimada, M.; Itoh, T.; Motooka, T.; Watanabe, M.; Shiraishi, T.; Thapa, R.; Lucas, R. New global forest/non-forest maps from ALOS PALSAR data (2007–2010). Remote Sens. Environ. 2014, 155, 13–31. [Google Scholar] [CrossRef]
- Morley, P.J.; Donoghue, D.N.M.; Chen, J.-C.; Jump, A.S. Quantifying structural diversity to better estimate change at mountain forest margins. Remote Sens. Environ. 2019, 223, 291–306. [Google Scholar] [CrossRef]
- Mahmood, A.R.J. Forest Change in the Mangroves of the Ganges-Brahmaputra Delta 1906–2014. Ph.D. Thesis, Durham University, Durham, UK, 2015. [Google Scholar]
- Lindquist, E.J.; D’Annunzio, R.; Gerrand, A.; MacDicken, K.G.; Achard, F.; Beuchle, R.; Brink, A.; Eva, H.D.; Mayaux, P.; San-Miguel-Ayanz, J.; et al. Global Forest Land-Use Change 1990–2005; FAO Forestry Paper; Food and Agriculture Organization of the United Nations and European Commission Joint Research Centre: Rome, Italy, 2012. [Google Scholar]
- Gong, P.; Wang, J.; Yu, L.; Zhao, Y.; Zhao, Y.; Liang, L.; Niu, Z.; Huang, X.; Fu, H.; Liu, S.; et al. Finer resolution observation and monitoring of global land cover: First mapping results with Landsat TM and ETM+ data. Int. J. Remote Sens. 2013, 34, 2607–2654. [Google Scholar] [CrossRef]
- Sexton, J.O.; Song, X.-P.; Feng, M.; Noojipady, P.; Anand, A.; Huang, C.; Kim, D.-H.; Collins, K.M.; Channan, S.; DiMiceli, C.; et al. Global, 30-m resolution continuous fields of tree cover: Landsat-based rescaling of MODIS vegetation continuous fields with lidar-based estimates of error. Int. J. Digit. Earth 2013, 6, 427–448. [Google Scholar] [CrossRef]
- Kim, D.-H.; Sexton, J.O.; Noojipady, P.; Huang, C.; Anand, A.; Channan, S.; Feng, M.; Townshend, J.R. Global, Landsat-based forest-cover change from 1990 to 2000. Remote Sens. Environ. 2014, 155, 178–193. [Google Scholar] [CrossRef]
- UNFCCC. Addendum. Part two: Action taken by the Conference of the Parties. In Proceedings of the Report of the Conference of the Parties on its seventh session, Marrakesh, Morocco, 29 October–10 November 2001; Volume I, p. 69. [Google Scholar]
- Herold, M.; Woodcock, C.E.; Mayaux, P.; Belward, A.S.; Latham, J.; Schmullius, C.C. A joint initiative for harmonization and validation of land cover datasets. IEEE Trans. Geosci. Remote Sens. 2006, 44, 1719–1727. [Google Scholar] [CrossRef]
- Olofsson, P.; Foody, G.M.; Herold, M.; Stehman, S.V.; Woodcock, C.E.; Wulder, M.A. Good practices for estimating area and assessing accuracy of land change. Remote Sens. Environ. 2014, 148, 42–57. [Google Scholar] [CrossRef]
- Foody, G.M. Assessing the accuracy of land cover change with imperfect ground reference data. Remote Sens. Environ. 2010, 114, 2271–2285. [Google Scholar] [CrossRef]
- Powell, R.L.; Matzke, N.; de Souza, C.; Clark, M.; Numata, I.; Hess, L.L.; Roberts, D.A. Sources of error in accuracy assessment of thematic land-cover maps in the Brazilian Amazon. Remote Sens. Environ. 2004, 90, 221–234. [Google Scholar] [CrossRef]
- Sannier, C.; McRoberts, R.E.; Fichet, L.-V. Suitability of Global Forest Change data to report forest cover estimates at national level in Gabon. Remote Sens. Environ. 2016, 173, 326–338. [Google Scholar] [CrossRef]
- Bos, A.B.; Sy, V.; de Duchelle, A.E.; Herold, M.; Martius, C.; Tsendbazar, N.-E. Global data and tools for local forest cover loss and REDD+ performance assessment: Accuracy, uncertainty, complementarity and impact. Int. J. Appl. Earth Obs. Geoinf. 2019, 80, 295–311. [Google Scholar] [CrossRef]
- Stehman, S.V.; Czaplewski, R.L. Design and Analysis for Thematic Map Accuracy Assessment: Fundamental Principles. Remote Sens. Environ. 1998, 64, 331–344. [Google Scholar] [CrossRef]
- Cochran, W.G. Sampling Techniques, 3rd ed.; Wiley series in probability and mathematical statistics; Wiley: New York, NY, USA, 1977. [Google Scholar]
- Donoghue, D.N.M.; Galiatsatos, N. Accuracy Assessment Report Year 7 Guyana REDD+ MRVS. 2018. Available online: https://www.forestry.gov.gy/wp-content/uploads/2018/11/Accuracy-Assessment-Guyana-MRVS-Year-7.pdf (accessed on 7 September 2019).
- Magdon, P.; Fischer, C.; Fuchs, H.; Kleinn, C. Translating criteria of international forest definitions into remote sensing image analysis. Remote Sens. Environ. 2014, 149, 252–262. [Google Scholar] [CrossRef]
- Tyukavina, A.; Stehman, S.V.; Potapov, P.V.; Turubanova, S.A.; Baccini, A.; Goetz, S.J.; Laporte, N.T.; Houghton, R.A.; Hansen, M.C. National-scale estimation of gross forest aboveground carbon loss: A case study of the Democratic Republic of the Congo. Environ. Res. Lett. 2013, 8, 044039. [Google Scholar] [CrossRef]
- Bovolo, C.I.; Donoghue, D.N.M. Has regional forest loss been underestimated? Environ. Res. Lett. 2017, 12, 111003. [Google Scholar] [CrossRef]
- Broich, M.; Stehman, S.V.; Hansen, M.C.; Potapov, P.; Shimabukuro, Y.E. A comparison of sampling designs for estimating deforestation from Landsat imagery: A case study of the Brazilian Legal Amazon. Remote Sens. Environ. 2009, 113, 2448–2454. [Google Scholar] [CrossRef]
- Pickering, J.; Stehman, S.V.; Tyukavina, A.; Potapov, P.; Watt, P.; Jantz, S.M.; Bholanath, P.; Hansen, M.C. Quantifying the trade-off between cost and precision in estimating area of forest loss and degradation using probability sampling in Guyana. Remote Sens. Environ. 2019, 221, 122–135. [Google Scholar] [CrossRef]
- Stehman, S.V. Model-assisted estimation as a unifying framework for estimating the area of land cover and land-cover change from remote sensing. Remote Sens. Environ. 2009, 113, 2455–2462. [Google Scholar] [CrossRef]
- Stehman, S.V. Impact of sample size allocation when using stratified random sampling to estimate accuracy and area of land-cover change. Remote Sens. Lett. 2012, 3, 111–120. [Google Scholar] [CrossRef]
- McRoberts, R.E.; Walters, B.F. Statistical inference for remote sensing-based estimates of net deforestation. Remote Sens. Environ. 2012, 124, 394–401. [Google Scholar] [CrossRef]
- Olofsson, P.; Foody, G.M.; Stehman, S.V.; Woodcock, C.E. Making better use of accuracy data in land change studies: Estimating accuracy and area and quantifying uncertainty using stratified estimation. Remote Sens. Environ. 2013, 129, 122–131. [Google Scholar] [CrossRef]
- Stehman, S.V. Selecting and interpreting measures of thematic classification accuracy. Remote Sens. Environ. 1997, 62, 77–89. [Google Scholar] [CrossRef]
- Friedl, M.A.; McIver, D.K.; Hodges, J.C.F.; Zhang, X.Y.; Muchoney, D.; Strahler, A.H.; Woodcock, C.E.; Gopal, S.; Schneider, A.; Cooper, A.; et al. Global land cover mapping from MODIS: Algorithms and early results. Remote Sens. Environ. 2002, 83, 287–302. [Google Scholar] [CrossRef]
- Milodowski, D.T.; Mitchard, E.T.A.; Williams, M. Forest loss maps from regional satellite monitoring systematically underestimate deforestation in two rapidly changing parts of the Amazon. Environ. Res. Lett. 2017, 12, 094003. [Google Scholar] [CrossRef]
- Asner, G.P.; Llactayo, W.; Tupayachi, R.; Luna, E.R. Elevated rates of gold mining in the Amazon revealed through high-resolution monitoring. Proc. Natl. Acad. Sci. USA 2013, 110, 18454. [Google Scholar] [CrossRef]
- MacDicken, K.G. Global Forest Resources Assessment 2015: What, why and how? For. Ecol. Manag. 2015, 352, 3–8. [Google Scholar] [CrossRef]


| Product | Validation | Accuracy | Ref. |
|---|---|---|---|
| RSS 2010 | Expert validation | 77%–81% | [35] |
| FROM-GLC | MODIS-EVI and Google Earth | 65% | [36] |
| Global Forest Change | Landsat, MODIS, Google Earth, GLAS-ICEsat | 99.6% | [31] |
| Continuous fields of tree cover | LiDAR | Root mean square error: 16.8% (MODIS) and 17.4% (Landsat) | [37] |
| Global Land Survey (1990–2000) | Landsat | 88% | [38] |
| Periods | MRV Data Sets | |
|---|---|---|
| Mapping Data | Reference Data | |
| 1990–2000 | Landsat from 1990 and 2000 | Landsat from 1990 and 2000 |
| 2001–2005 & 2006–2010 | Landsat | Landsat |
| 2010–2011 | Landsat & DMC | Landsat, RapidEye, CBERS, IKONOS, WorldView, & DMC |
| 2011–2012 | RapidEye | Aerial imagery, WorldView, QuickBird, & RapidEye |
| 2012–2015 annually | RapidEye | Aerial imagery & RapidEye |
| 2015–2017 annually | Sentinel-2 | Aerial imagery & PlanetScope |
| Overall Error Matrix for Global Forest Change | |||||
|---|---|---|---|---|---|
| Global Forest Change | Reference data | Total | Users accuracy | ||
| Forest | Non-forest | ||||
| Forest | 86,777 | 522 | 87,299 | 99.40% | |
| Non-forest | 114 | 8714 | 8828 | 98.71% | |
| Total | 86,891 | 9236 | 96,127 | ||
| Producer accuracy | 99.87% | 94.35% | 99.34% | ||
| Overall error matrix for Guyana-MRV | |||||
| Guyana-MRV | Reference data | Total | User accuracy | ||
| Forest | Non-forest | ||||
| Forest | 86,651 | 375 | 87,026 | 99.57% | |
| Non-forest | 240 | 8861 | 9101 | 97.36% | |
| Total | 86,891 | 9236 | 96,127 | ||
| Producer accuracy | 99.72% | 95.94% | 99.36% | ||
| Global Forest Change | Guyana-MRV | Total | Users Accuracy | ||
|---|---|---|---|---|---|
| Forest | Non-Forest | ||||
| Forest | 86,918 | 404 | 87,322 | 99.54% | |
| Non-Forest | 349 | 8546 | 8895 | 96.08% | |
| Total | 87,267 | 8950 | 96,217 | ||
| Producer accuracy | 99.60% | 95.49% | 99.22% | ||
© 2020 by the authors. Licensee MDPI, Basel, Switzerland. This article is an open access article distributed under the terms and conditions of the Creative Commons Attribution (CC BY) license (http://creativecommons.org/licenses/by/4.0/).
Share and Cite
Galiatsatos, N.; Donoghue, D.N.M.; Watt, P.; Bholanath, P.; Pickering, J.; Hansen, M.C.; Mahmood, A.R.J. An Assessment of Global Forest Change Datasets for National Forest Monitoring and Reporting. Remote Sens. 2020, 12, 1790. https://doi.org/10.3390/rs12111790
Galiatsatos N, Donoghue DNM, Watt P, Bholanath P, Pickering J, Hansen MC, Mahmood ARJ. An Assessment of Global Forest Change Datasets for National Forest Monitoring and Reporting. Remote Sensing. 2020; 12(11):1790. https://doi.org/10.3390/rs12111790
Chicago/Turabian StyleGaliatsatos, Nikolaos, Daniel N.M. Donoghue, Pete Watt, Pradeepa Bholanath, Jeffrey Pickering, Matthew C. Hansen, and Abu R.J. Mahmood. 2020. "An Assessment of Global Forest Change Datasets for National Forest Monitoring and Reporting" Remote Sensing 12, no. 11: 1790. https://doi.org/10.3390/rs12111790
APA StyleGaliatsatos, N., Donoghue, D. N. M., Watt, P., Bholanath, P., Pickering, J., Hansen, M. C., & Mahmood, A. R. J. (2020). An Assessment of Global Forest Change Datasets for National Forest Monitoring and Reporting. Remote Sensing, 12(11), 1790. https://doi.org/10.3390/rs12111790