Article

Elevation and Climate Effects on Vegetation Greenness in an Arid Mountain-Basin System of Central Asia

1
Faculty of Geographical Science, Beijing Normal University, Beijing 100875, China
2
Department of Environmental Sciences, University of Virginia, Charlottesville, VA 22903, USA
*
Author to whom correspondence should be addressed.
Remote Sens. 2020, 12(10), 1665; https://doi.org/10.3390/rs12101665
Submission received: 7 April 2020 / Revised: 14 May 2020 / Accepted: 20 May 2020 / Published: 22 May 2020

Abstract

:
Mountain-basin systems (MBS) in Central Asia are unique and complex ecosystems, wherein their elevation gradients lead to high spatial heterogeneity in vegetation and its response to climate change. Exploring elevation-dependent vegetation greenness variation and the effects of climate factors on vegetation has important theoretical and practical significance for regulating the ecological processes of this system. Based on the MODIS NDVI (remotely sensed normalized difference vegetation index), and observed precipitation and temperature data sets, we analyzed vegetation greenness and climate patterns and dynamics with respect to elevation (300–3600 m) in a typical MBS, in Altay Prefecture, China, during 2000–2017. Results showed that vegetation exhibited a greening (NDVI) trend for the whole region, as well as the mountain, oasis and desert zones, but only the desert zone reached significant level. Vegetation in all elevation bins showed greening, with significant trends at 400–700 m and 2600–3500 m. In summer, lower elevation bins (below 1500 m) had a nonsignificant wetting and warming trend and higher elevation bins had a nonsignificant drying and warming trend. Temperature trend increased with increasing elevation, indicating that warming was stronger at higher elevations. In addition, precipitation had a significantly positive coefficient and temperature a nonsignificant coefficient with NDVI at both regional scale and subregional scale. Our analysis suggests that the regional average could mask or obscure the relationship between climate and vegetation at elevational scale. Vegetation greenness had a positive response to precipitation change in all elevation bins, and had a negative response to temperature change at lower elevations (below 2600 m), and a positive response to temperature change at higher elevations. We observed that vegetation greenness was more sensitive to precipitation than to temperature at lower elevations (below 2700 m), and was more sensitive to temperature at higher elevations.

Graphical Abstract

1. Introduction

As an important part of ecosystem, vegetation affects land cover, water and carbon cycle, and the near-stratigraphic climate [1,2]. Meanwhile, climate change such as precipitation, temperature and radiation, by changing the energy and water available for plant growth, have an impact on the carbon accumulation process, water cycle process, and soil organic carbon decomposition and conversion process, and thus affect the growth process and distribution pattern of vegetation [3,4]. Exploring the spatial and temporal pattern of vegetation greenness and discussing the driving role of climate factors has become one of the main contents of current global change research, which has important theoretical and practical significance for evaluating the quality of terrestrial ecosystems and regulating the ecological processes of vegetation.
Previous studies have given a substantial attention to vegetation variation and the effects of climate factors. With the advantages of large-scale, long-term, and relatively continuous observations, remote sensing (RS) has become an effective means of vegetation greenness monitoring [5,6]. Vegetation indices derived from satellite images have been used to monitor vegetation greenness. Among them, the normalized difference vegetation index (NDVI), based on the reflectance in the red and near-infrared bands, closely related to photosynthetically active radiation [7,8], leaf area index [9,10,11], and biomass [12,13,14], and has been widely used as a proxy parameter of vegetation greenness over both regional and continental scales. Enhanced vegetation index (EVI) was designed to overcome the disadvantage of being saturated in high vegetation areas, and susceptible to noise of NDVI [15,16]. To explore the effects of climate factors to NDVI, the correlation coefficients between them were widely used, including simple linear correlation coefficient, partial correlation coefficient, and complex correlation coefficient [17,18,19]. Generally, the climatic factors affecting vegetation greenness mainly include precipitation temperature and radiation, which vary from place to place [20]. The dominant factor in rainforests is radiation, in arid and semiarid regions is precipitation, and in the high latitudes of the northern hemisphere is temperature [21,22,23].
Central Asia is far from the influence of any ocean, and one of the most arid regions in the world [24], containing fragile and sensitive ecosystems due to scarce precipitation and high evaporation [25]. This region is rich in vegetation, including forests, grasslands, shrublands and croplands [26,27]. An alternating distribution of mountains and basins is the basic feature of the natural geography in Central Asia. This has been defined as a mountain-basin system (MBS), consisting of mountain, oasis, and desert zones [28,29]. The oasis zone covers the irrigated agricultural oasis belt and the oasis–desert transition belt, which is irrigated by glacial melt-water and mountain precipitation in the form of surface runoff and subsurface flow. These oasis areas are conducive to crops and artificial grasslands due to their proximity to rivers and lakes, and also are the place where people live, and the center of economy, culture, and transportation [30]. Strong and varied elevation gradients yield the unique landform of the MBS [31]. Elevation gradients lead to differing climatic conditions, forming the vertical zonality of vegetation. Furthermore, climate changes are elevation-dependent and would result in diverging responses of vegetation at different elevations. It is therefore necessary to consider the spatial heterogeneity when exploring vegetation changes in response to climate change in Central Asia.
Previous studies have given some attention to vegetation variation and its driving factors in Central Asia. Li et al. found that NDVI in Central Asia during 1982–2013 had an increasing trend. To improve this trend interpretation [32], De Beurs et al. analyzed land surface dynamics using multiple remote sensing indicators and found that NDVI, EVI, and tasseled cap greenness have very similar dynamics (r > 0.8), and the variation of vegetation indices and their influencing factors have obvious spatial heterogeneity [31]. As for driving factors, precipitation and temperature are the main climate factors [33], although grazing pressure and land abandonment are key anthropogenic factors [34]. Additionally, a number of studies focused on vegetation variation for certain area of Central Asia, particularly the Xinjiang Uygur Autonomous Region [35,36,37] and the Qinghai-Tibetan Plateau [38,39,40]. However, previous studies usually treated these study areas as uniform entities, without consideration of spatial heterogeneity. Numerous studies about other regions have shown that vegetation changes have obvious spatial and temporal heterogeneity, and that the impacts of climate change on vegetation are also varied spatially and temporally. Barriopedro et al. analyzed the tempo-spatial pattern of vegetation in southwestern China from September 2009 until March 2010, and found that there was significant tempo-spatial variability in the range and intensity of impact of one drought event [41]. Based on GIMMS-NDVI3g data and Arctic bioclimate subzones (essentially latitudinal-based), Reichle et al. found different patterns of arctic tundra vegetation and temperature dynamics over North American and Eurasian continents [42]. Vegetation changes across China’s silk road economic belt during 1982 to 2015 were examined using an AVHRR NDVI dataset; vegetation greenness was positively and negatively related to precipitation and temperature respectively in both semiarid and arid regions, but the opposite relationships were found for subhumid regions [43]. To date, some studies have evaluated the ecosystem services of different subregions of the MBS, according to the division into desert, oasis, and mountain zones [30,44]. However, the elevational heterogeneity of vegetation greenness variation and the effects of climate factors in MBS are unclear. Considering that vegetation dynamics (and the effects of climate changes) should be elevation-dependent, it is necessary to examine the elevational heterogeneity of vegetation greenness variation and the effects of climate factors in these systems.
Altay Prefecture is located in northernmost China and is a typical representation of MBS. It has substantial vegetation coverage and is the source of the Ulungur River and the Irtysh River, which play an important role in the regional ecological environment. The elevation gradient within Altay leads to clear vertical distribution characteristics of climate and vegetation. The purpose of this study is to quantify vegetation greenness variation and the effects of climate factors along an elevation gradient in a MBS in Altay Prefecture, China, from 2000 to 2017, which can provide us with evidence for ecological environmental management for this region and other similar arid mountain-basin systems. More specifically, we address the following questions:
  • What are the spatial and temporal patterns of vegetation greenness in the MBS of Altay Prefecture during 2000–2017? How did vegetation greenness vary, and how did it change across an elevation gradient?
  • How did precipitation and temperature change throughout the Altay Prefecture and along the elevation gradient during 2000–2017?
  • How do precipitation and temperature affect the dynamics of vegetation greenness at the regional scale, subregional scale (desert, oasis, and mountain zones), and along the elevation gradient?

2. Materials and Methods
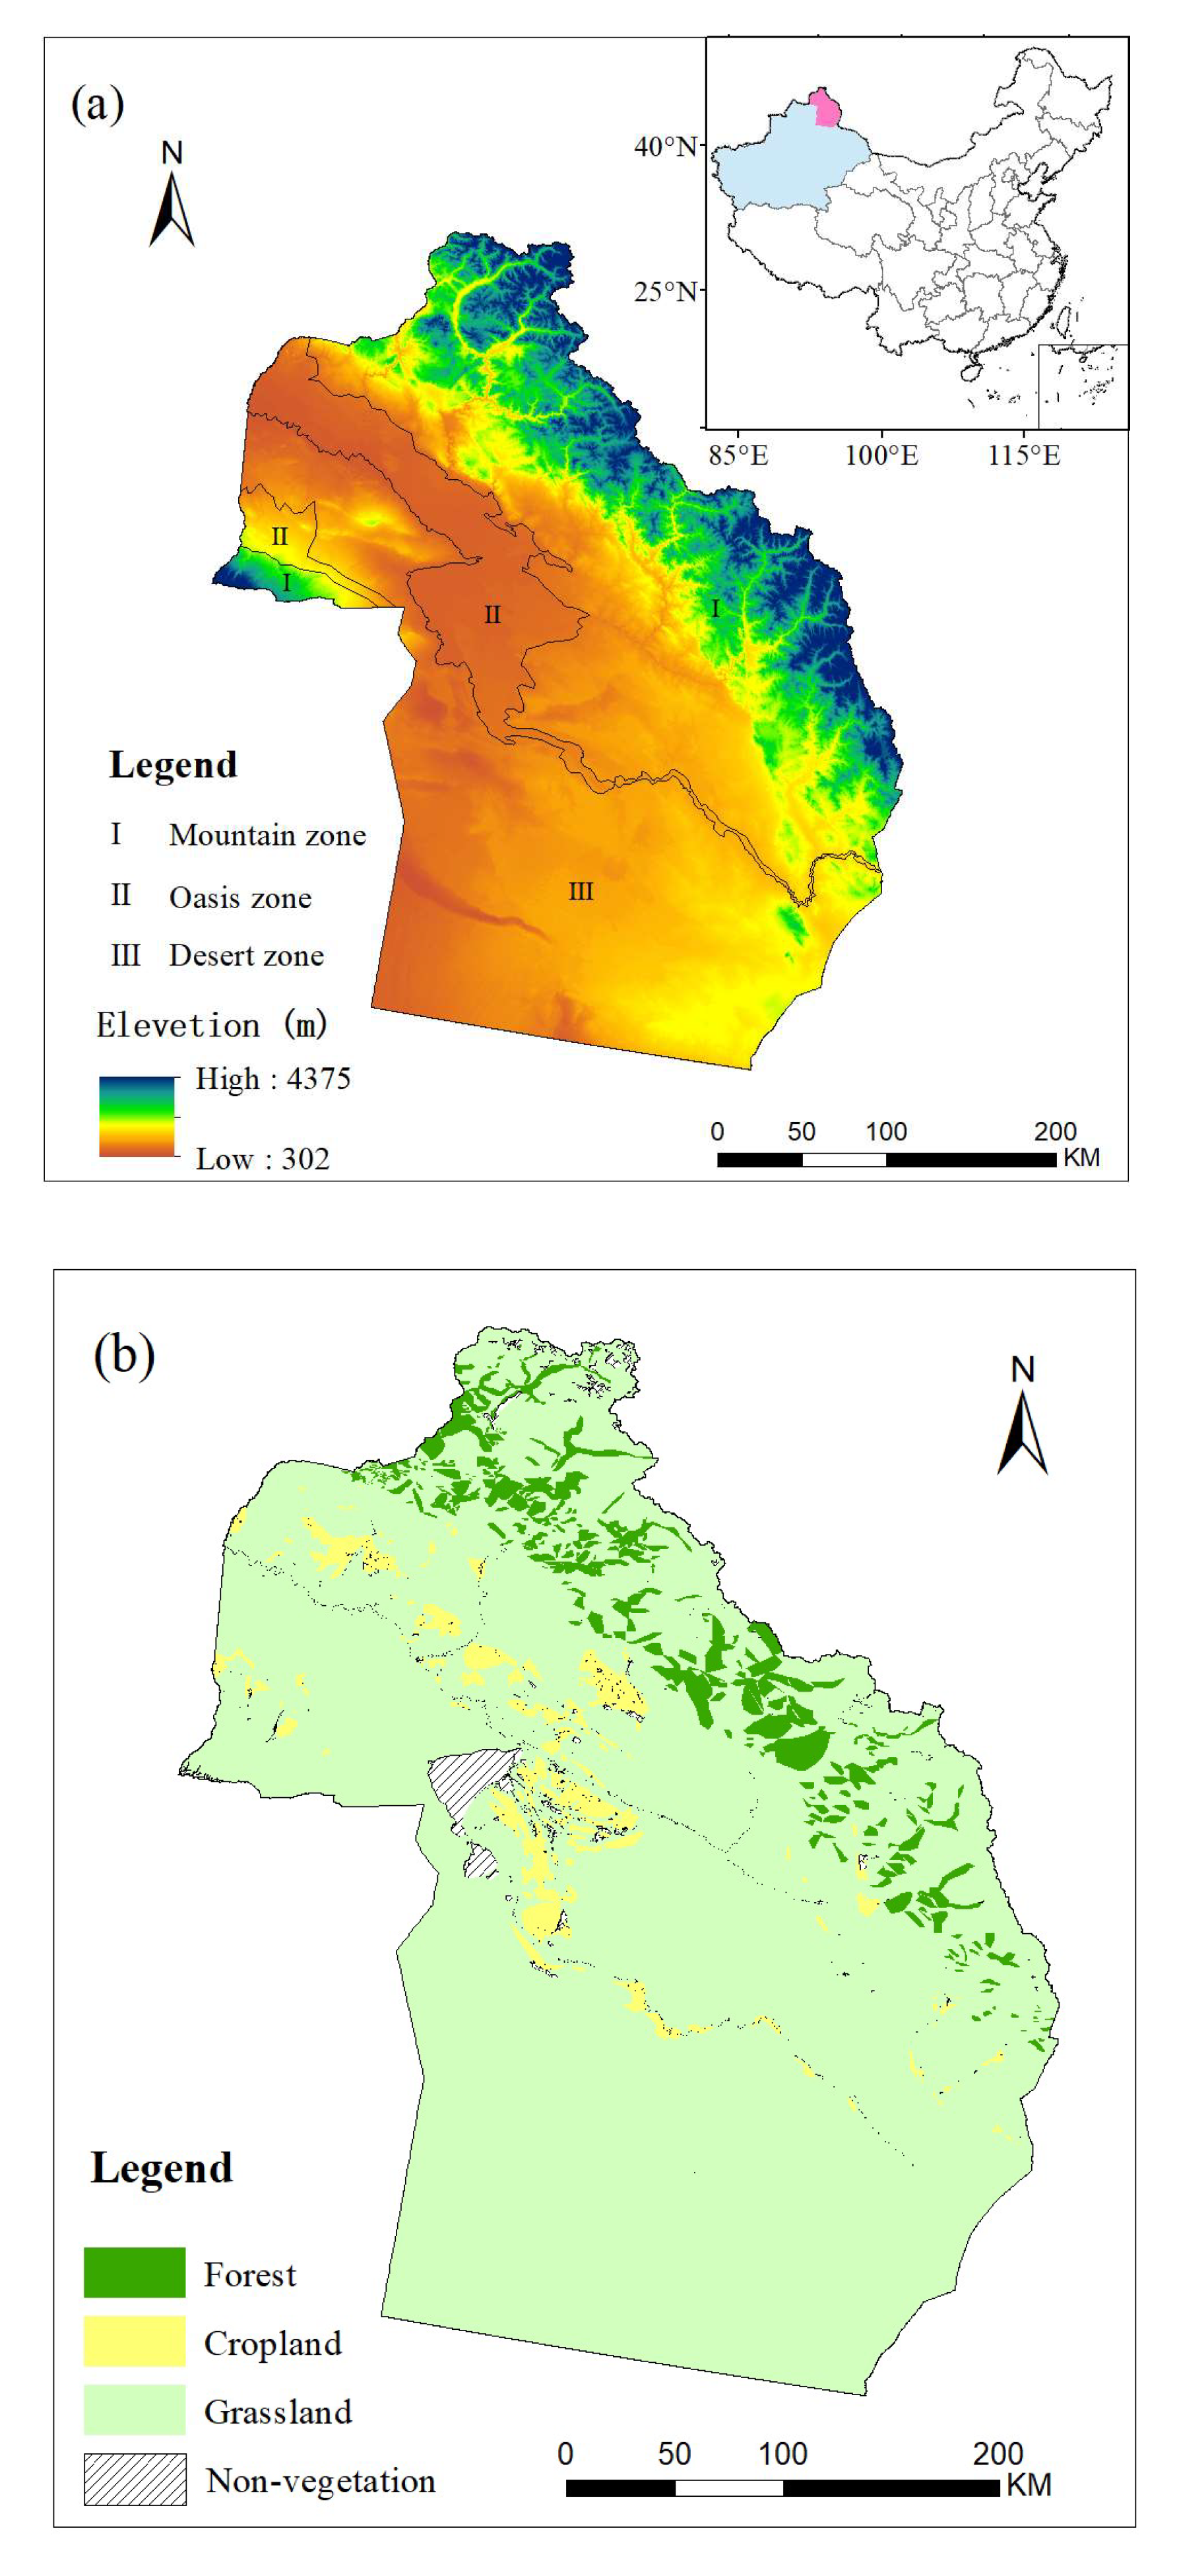
2.1. Study Area

Altay Prefecture (44°59′35″−49°10′45″N, 85°31′57″−91°01′15″E) belongs to the Xinjiang Uygur Autonomous Region, which is located in northernmost China, bordering Kazakhstan, Russia, and Mongolia. The region has a typical temperate continental climate, with an annual precipitation ranging from 164.93 mm to 327.19 mm and an annual average temperature ranging from 2.31 °C to 5.04 °C (2000–2017). The total area is approximately 118,000 km2, and the elevation gradually declines from northeast to southwest (the range is 302–4375 m). This region extends from the southern foothills of Altai Mountain to the northern margin of Junggar Basin, which is a typical representation of MBS [44]. Based on the difference of physical geographical conditions in Altay region, DEM, vegetation type map and geomorphologic type map were used as references to divide the study area into three zones: mountain zone (I), oasis zone (II) and desert zone (III) (Figure 1a). According to land use data from 2000, Altay has vegetation cover of 97.30%. Grasslands occupy the largest proportion (60.48%), followed by forest (34.62%), and cropland occupies only 2.20%. Due to the effect of desert climate, desert grasslands are the main grassland type and account for over 70% of the total grassland area. Ecosystems that have developed in high, cold and dry environments are fragile and vulnerable to climate change and human activity. Low precipitation and high evapotranspiration resulted in sparse vegetation, soil erosion, and frequent sandstorm activities [45]. Additionally, human disturbance such as grazing and mining have had negative consequences on the fragile ecological environment [46].

2.2. Data

2.2.1. NDVI Time Series Data

NDVI and EVI have been widely used as a proxy of vegetation greenness over both regional and continental scales. In arid or semiarid areas where vegetation coverage is low, there is little difference in the monitoring capability of the two indexes [15]. In this study, NDVI was chosen to descript vegetation greenness. The NDVI data set for the period from 2000 to 2017 was extracted from the MOD13Q1 Version 6 product (from the Moderate-Resolution Imaging Spectroradiometer (MODIS)), which was downloaded from the United States Geological Survey Land Processes Distributed Active Archive Center (https://lpdaac.usgs.gov/). The NDVI data have a spatial resolution of 250 m and a temporal resolution of 16 days (maximum value composite). To eliminate the effects of snow and clouds, the study focuses on annual maximum NDVI (hereafter referred to simply as NDVI).

2.2.2. Climate Data

The climate data sets were obtained from the China Meteorological Information Center (https://data.cma.cn/). Daily precipitation and temperature data from 18 weather stations inside and around the study area during 2000–2017 were downloaded and aggregated to annual and summer variables (Figure S1). Considering the annual maximum NDVI generally occurs in summer, we calculate and analyze total summer precipitation (TSP) and mean summer temperature (MST) in addition to total annual precipitation (TAP) and mean annual temperature (MAT). Then, the aggregated data were interpolated to generate spatially continuous data sets with a 250 m spatial resolution, to match the NDVI data, with ANUsplin software (using the thin-plate smoothing splines method) [47,48]. This software has a higher accuracy than other interpolation methods for mountainous areas, because a covariate of elevation is used in the interpolation process.

2.2.3. Land Use Data

Land use data for 2000 were derived from the Data Center of Resources and Environmental Sciences, Chinese Academy of Sciences (http://www.resdc.cn/). The land use data with a resolution of 1 km were produced by supervised classification and manual correction of Landsat TM images. We extracted three vegetation types: grassland, forest, and cropland. There is a conflict however between these land use data and the grassland resource type map from the Altay grassland station; there are some sparse grasslands classified as unused land in the land use data. Therefore, we adjusted the range of grasslands according to the local grassland resource type map. Finally, we obtained the vegetation coverage boundary, and nonvegetation coverage was displayed in Figure 1b.

2.2.4. Elevation Data

We downloaded the advanced spaceborne thermal emission and reflection radiometer (ASTER) global digital elevation data from https://earthexplorer.usgs.gov/. The data were resampled from a 30 m spatial resolution to a 250 m resolution with bilinear method to match the other data sets. Then, the resampled data were used as the basis for binning elevation (from 300–400 m to 3900–4000 m) and as the covariate for interpolating climate data. To avoid the influence caused by an insufficient number of pixels for a given elevation bin, we excluded elevation bins with pixels fewer than 100 (3600–3700 m, 3700–3800 m, 3800–3900 m, 3900–4000 m).

2.3. Methodology

In this study, linear regression was used to analyze the change trends of NDVI, precipitation, and temperature for the whole study area, each zone, each elevation bin, and each pixel. Then, the significance of the trend was determined by the F test to represent the confidence level of trend variation. This method is used to model the relationship between an independent variable (year) and a dependent variable based on the least squares linear regression method, which has been widely used in trend analysis [17,49]. The NDVI trend was calculated as follows:
T = n × i = 1 n i × NDVI i i = 1 n i i = 1 n NDVI i n × i = 1 n i 2 i = 1 n i 2
where T represents the temporal change trend of NDVI, n is the cumulative number of years in the study period (in this study the n is 18), and i is the number of the year (i = 1,2,3,…,n). A positive T value indicates an increased trend in vegetation greenness and a negative value indicates a decreased trend. The larger the absolute value of T is, the larger the change. The trends of precipitation and temperature were determined in a similar manner.
To compare the effects of annual and summer climate factors on vegetation greenness, standardized regression coefficients between NDVI and annual or summer climate data were calculated. To compare the effects of precipitation and temperature on vegetation, we quantified the effects of precipitation and temperature on vegetation greenness variation using standardized regression coefficients in a multiple regression [50].
y y ¯ STD y = a 1 x 1 x 1 ¯ STD x 1 + a 2 x 2 x 2 ¯ STD x 2 + b
where y is a dependent variable array, y is the mean value of y; x1 and x2 are concurrent arrays of two independent variables, x1 and x2 are the mean values of x1 and x2, respectively; STDy, STDx1 and STDx2 are the standard deviations (STD) of y, x1 and x2, respectively; b is the intercept, and a1 and a2 are the standardized regression coefficients of two independent variables, respectively.

3. Results

3.1. Spatiotemporal Variation of Vegetation Greenness

Figure 2a shows spatial attribution of mean annual NDVI values in Altay Prefecture during 2000–2017. Clearly, NDVI had a strong spatial heterogeneity throughout the region, ranging from 0 to 0.93. The areas with high NDVI values were mainly distributed in the mountain and oasis zones, whereas the values in the desert zone are low. More than 80 percent of the region had a positive NDVI trend (Figure 2b, Table S1). Stable (between −0.001 year−1 and 0.001 year−1) and slightly greening (between 0.001 and 0.002 year−1) areas were mainly located in the desert zone. Moderate greening (between 0.002 and 0.01 year−1) was largely distributed in the mountain zone, and strong greening (>0.01 year−1) was found in the oasis zone. Less than 10 percent had browning with a trend <−0.001 year−1, which scattered throughout the region. NDVI for the entire region and three zones all showed an increasing trend, but only the increase in the oasis area was significant (p < 0.001) (Figure S2).
In order to explore the distribution and change characteristics of NDVI along the elevation gradient, we divided the study area into 33 elevation bins of 100 m (300–3600 m). Two peak values of NDVI appeared along the elevation gradient, at 400–500 m and 2100–2200 m (Figure 3a). NDVI sharply increased from about 0.13 at 300–400 m to approximately 0.32 at 400–500 m, decreased to ~0.17 at 800–900 m, then gradually increased to 0.71 at 2100–2200 m, and finally decreased to 0.06 at 3500–3600 m. The vegetation in all elevation bins was generally greening, with significant levels at 400–700 m and 2600–3500 m (Figure 3b). The smallest trend (0.0007 year−1) occurred at 1500–1600 m, while the greatest trend (0.0038 year−1, 5.43 times the minimum) appeared at 500–600 m.

3.2. Spatiotemporal Variation of Precipitation and Temperature

Figure 4 displays the values and trends of precipitation and temperature along the elevation gradient. The distribution of precipitation and temperature in annual and summer were clearly dependent on elevation. As the elevation increases, the precipitation increases and the temperature decreases. Total annual precipitation and summer precipitation both had wetting trends in lower elevation bins and a drying trend in higher elevation bins (Figure 4c,d). The maximum precipitation trend appeared at 800–900 m. The trends of annual precipitation were negative above 2400 m, while they became negative above 1500 m for summer precipitation. We can see from Figure 4e,f that all elevation bins showed warming trends in both the annual and summer periods except 300–400 m in summer. The temperature trend increased with increasing elevation, indicating that warming was stronger at higher elevations.

3.3. Response of Vegetation Greenness to Climate Factors

For most elevation bins, climate in summer had better correlation coefficients with NDVI than annual values (Table S2), so we therefore focused on summer climate when analyzing the effects of climate factors. As shown in Table 1, for the whole region, the standardized coefficient of TSP was positive and statistically significant, and the standardized coefficient of MST was nonsignificantly negative. The relative contribution ratio of TSP to MST for NDVI was 2.98, indicating that precipitation plays a more important role than temperature. Similarly, in the mountain, oasis and desert zones, precipitation had a significantly positive coefficient and a nonsignificant coefficient with NDVI. Figure 5 depicts the regression correlation coefficient between vegetation and precipitation, and temperature. Standardized coefficients of TSP for all elevation bins were positive and reached significant levels below 2000 m; standardized coefficients of MST were negative at lower elevation bins and became positive above 2600 m, but only reached significant levels above 3200 m (Figure 5). The ratio of precipitation to temperature effects on NDVI were >1 below 2700 m and <1 above 2700 m, indicating that vegetation greenness was more sensitive to precipitation at lower elevations and more sensitive to temperature at higher elevations.

4. Discussion

4.1. Dynamics of NDVI, Precipitation, and Temperature

Our results demonstrate that vegetation showed greening over the period 2000–2017, which is consistent with previous studies [51,52]. However, the increasing rate of NDVI (0.002 year−1) observed in this study is higher than that observed by Du et al. [52] (0.0003 year−1, during 1982–2012) and Zhang et al. [52] (0.001 year−1, during 2003–2011). The difference can be explained by several possible reasons. First, the difference in the study area might lead to the difference in value. Previous studies regarded the Xinjiang Uygur Autonomous Region as the study area. In this study, Altay Prefecture was selected as study area, which is part of the Xinjiang Uygur Autonomous Region. Second, the difference in study period might be another cause. In addition, the difference in NDVI calculation could be also cause difference in results. Previous studies used mean NDVI of the growing season when analyzing interannual vegetation greenness. In this study, we used maximum NDVI to avoid the effects of snow and clouds.
According to our results, pixels with a higher NDVI generally distributed in the mountain zone and oasis zone, which can be explained by main vegetation types in these two zones (Table S3). In the mountain zone, meadows, forests, and mountain steppe are the main vegetation type, accounting for more than 70%. Cropland is the main vegetation type in the oasis zone. These vegetation types have a higher NDVI than desert types that make up more than 90% the desert zone. Vegetation exhibited a greening trend for the whole region, as well as the mountain, oasis and desert zones, but only the oasis zone had a significant greening trend. The development and expansion of agriculture in the oasis zone should be related to the increase of vegetation greenness.
Climate data used in our study were obtained from weather stations. Because weather stations conducting long-term meteorological observations are scarce in and near Altay Prefecture, the reliability of the spatial interpolation of precipitation and temperature data are challenging to verify. In order to ensure the reliability of our climate data, we compared the results with previous research and found that the wetting and warming in this study is supported by earlier studies [26,53].

4.2. Vegetation Greenness Patterns in Relation to Elevation

In our results, vegetation greenness presented a bimodal curve with increased elevation. Peak values occurred at 400–500 m and 2100–2200 m. This is closely related to the distribution of vegetation types in elevation gradient. As indicated in Figure 6, desert grassland had lowest NDVI value (0.18), followed by alpine meadow, cropland, mountain meadow, and forest. According to Figure S3a, desert grassland is mainly distributed in 300–1300 m. This is why the NDVI is low on these elevation gradients. Above 1300 m, with the disappearance of desert grassland and the increased proportions of mountain meadow and forest, NDVI increased along the elevations until 2200 m. Above 2200 m, the appearance of alpine meadow led to decreases in NDVI. This change in vegetation type is also a response to climate change in elevation graduation. The unimodal pattern essentially was caused by differences in precipitation and temperature at different elevations [54], mainly the precipitation increase and temperature decrease with elevation. At lower elevations, where precipitation is scarce and temperatures are high (greater evapotranspiration), drought limits the growth of vegetation. With the increase of elevation, precipitation increases, temperature decreases, drought stress eases, and vegetation greenness increases. Decreasing temperatures at higher elevations result in decreasing vegetation greenness. It is noteworthy that there was a smaller peak in greenness at 400–500 m, near the Ulungur Lake and Irtysh River, which might be attributed to the distribution of cropland. Water availability is the main reason for the phenomena. The advantage position close to rivers and lakes brought higher water availability, which is conducive to the growth of vegetation.
As shown in Figure 3b, we found that all elevation bins had a greening trend, and significant greening trends were found at 400–700 m, near the lake and rivers. This could be attributed to higher water availability and anthropological intervention. On the one hand, the dramatic wetting trend at these elevations, in addition to ice and snow melt caused by warming at higher elevations, has increased the water availability in these locations. On the other hand, anthropological reason, such as the expansion of cropland and the establishment of artificial grasslands, also enhanced vegetation greenness.

4.3. Climate Change in Relation to Elevation

According to our findings, the annual precipitation had a wetting trend at lower elevation bins, whereas there was a drying trend at higher elevation bins; with the most dramatic wetting occurring at 800–900 m. The summer precipitation trend had similar patterns. Atmospheric water vapor in Altay Prefecture mainly comes from the north Atlantic, which forms a warm air mass over the European continent that enters Central Asia from the gap in the northwest edge of the Junggar Basin and encounters cold air to form precipitation [55]. The North Atlantic Oscillation (NAO) is therefore the direct cause of precipitation variability in Altay Prefecture [56]. Stronger airflow leads to more water vapor in the low altitude areas and hence greater precipitation. However, as elevation increases, the airflow gradually weakens.
Annual and summer temperature at all elevation bins had a warming trend, except for summer temperature at 300–400 m. In addition, warming trends became stronger with increasing elevation, especially in summer. Previous studies have shown similar findings in other mountain areas or high-elevation plateaus, such as the Tibetan Plateau [57], the Colorado Rocky Mountains [58,59], and the Swiss Alps [60,61]. Elevation-dependent warming could be attributed to snow/ice albedo feedbacks, cloud cover, water vapor, radiative fluxes, and aerosols [62].

4.4. Effects of Climate Change on Vegetation Greenness

Precipitation played a more important role than temperature in affecting vegetation greenness for the whole region, the mountain zone, the oasis zone, and the desert zone. These findings are somewhat consistent with a previous study [47] finding that precipitation is the dominant climatic factor affecting the vegetation dynamics of Xinjiang. In general, water availability is the driving factor for vegetation growth in arid regions [63]. Precipitation is the main water source, directly determines the water availability, and is closely related to vegetation growth. Altay Prefecture is an arid area, has scarce precipitation, which limits vegetation productivity. Therefore, precipitation is the dominant factor influencing vegetation greenness at the regional and subregional scales.
Our analysis suggests that the regional average could mask or obscure the relationship between climate and vegetation that occurs at the elevational scale. In different elevations, the dominant driving factors of vegetation greenness change are different. In this study, we found that vegetation greenness had a positive response to precipitation change in all elevation bins, and had a negative response to temperature change at lower elevations, and a positive response to temperature change at higher elevations (above 2600 m). In addition, vegetation greenness was more sensitive to precipitation than to temperature at lower elevations, and more sensitive to temperature at higher elevations. These results differ from previous findings in Li et al. [25] and Tao et al. [64]. The phenomenon that elevation-dependent effects vary across different regions is caused by different thermal regimes and disparate water sources [65,66]. In Altay, at lower elevations, scarce precipitation and high temperature limited the vegetation growth by influencing water availability [67]. Precipitation is the main source of water and directly affects the water availability. Temperature indirectly affects water availability by affecting evaporation. Remarkably, precipitation is more influential because changes in precipitation could bring more changes in water availability than that in temperature. With the elevation increase, precipitation increases and temperature drops, and low temperature becomes the more important factor constraining vegetation growth [68]. Small increase in temperature might represent relative larger increase in thermal balance in colder regions [69], which can explain the finding that vegetation greenness is more sensitive to temperature at higher elevations. On the one hand, warming at higher elevations could directly stimulate vegetation growth by enhancing the decomposition of vegetation litter, soil organic matter and nitrogen mineralization [70]. On the other hand, an increase in temperature might bring higher water availability by declining snowpacks and shifting snow disappearance earlier [71,72]. In summary, in our study region, the wetting trends at lower elevation bins could promote vegetation growth, while warming trends have a negative effect on vegetation growth. On the contrary, the warming trends at higher elevation bins could encourage vegetation growth, while the drying trend inhibits the greening trend to some extent. It is noteworthy that above 2600 m, temperature plays a negative role in greenness, and it is from this elevation that alpine meadow becomes the main vegetation type with a proportion of more than 90% (Figure S3d). It can be proved that the alpine meadow has a positive response to temperature change.

4.5. Limitations and Future Work

In this study, we only analyzed the impact of precipitation and temperature on vegetation, without considering the impact of human activities, such as grazing and mining, which can be taken into account in future studies. Furthermore, climate data used in this study were obtained from weathers stations. Because the weather stations conducting long-time meteorological observations are scarce in and near Altay Prefecture, the reliability of spatial interpolation data of precipitation and temperature can only be verified by comparison with the results in the previous study. Climate datasets from remote sensing images that have a good relationship with observation data [73] can be explored in future studies.

5. Conclusions

We investigated vegetation greenness dynamics and the effects of climate factors at the regional, subregional and elevational scales in a mountain-basin system, in Altay Prefecture, China from 2000 to 2017. We found that vegetation exhibited a greening trend for the whole region, as well as the mountain, oasis and desert zones, but only the desert zone reached significant level, which is attributed to the higher water availability and the expansion of agriculture. Accordingly, vegetation greenness presented a bimodal curve with increased elevation; all elevation bins showed greening, with significant trends at 400–700 m and 2600–3500 m. The elevation dependence of NDVI is closely related to vegetation type, but is essentially caused by climate change, including temporal and spatial changes. In summer, lower elevation bins (below 1500 m) had a nonsignificant wetting and warming trend, and higher elevation bins had a nonsignificant drying and warming trend. Additionally, the temperature trend increased with increasing elevation, indicating that warming was stronger at higher elevations. At the regional scale and subregional scale, precipitation and temperature together led to the vegetation greenness change, but precipitation played a more important role. Vegetation greenness had a positive response to precipitation change in all elevation bins, and had a negative response to temperature change at lower elevations, and a positive response to temperature change at higher elevations. Finally, vegetation greenness was more sensitive to precipitation than to temperature at lower elevations, and more sensitive to temperature at higher elevations. Our analysis suggests that the regional average could mask or obscure the phenomenon that occurs at the elevational scale. Monitoring the elevation-dependent variation of vegetation greenness and the effects of climate factors in a MBS can significantly improve our understanding of the relationships between vegetation and climate, and provide us with evidence for ecological environmental management for this region and other similar arid mountain-basin systems.

Supplementary Materials

The following are available online at https://www.mdpi.com/2072-4292/12/10/1665/s1, Figure S1: Location of weather station inside or near Altay Prefecture, Table S1: Results of the NDVI trend of all pixels in Altay Prefecture during 2000–2017, Figure S2: Trends of NDVI of Altay Prefecture from 2000 to 2017, Table S2: Correlation coefficient and P-value between NDVI and annual, summer climate data of Altay Prefecture from 2000 to 2017, Table S3: Main vegetation types of three zones in Altay Prefecture, Figure S3: Percentage of main vegetation types in every elevation bin.

Author Contributions

B.L. contributed to funding acquisition; X.T. designed the framework of this study, completed the data collection, formal analysis, and writing the manuscript; H.E.E. and B.L. provided some useful suggestions; H.E.E. modified the manuscript. All authors have read and agreed to the published version of the manuscript.

Funding

This research was supported by the National Science and Technology Support Plan of China (No. 2014BAC15B04).

Acknowledgments

The authors gratefully acknowledge the University of Virginia for the support provided. We gratefully acknowledge financial support from the China Scholarship Council. We would like to thank the anonymous reviewers for their valuable comments.

Conflicts of Interest

The authors declare no conflict of interest.

References

  1. Tim, N. Future effects of climate and land-use change on terrestrial vertebrate community diversity under different scenarios. Proc. R. Soc. B Biol. Sci. 2018, 285, 20180792. [Google Scholar]
  2. Sterling, S.M.; Ducharne, A.; Polcher, J. The impact of global land-cover change on the terrestrial water cycle. Nat. Clim. Change 2012, 3, 385–390. [Google Scholar] [CrossRef]
  3. Cramer, W.; Bondeau, A.; Woodward, F.I.; Prentice, I.C.; Betts, R.A.; Brovkin, V.; Cox, P.M.; Fisher, V.; Foley, J.A.; Friend, A.D.; et al. Global response of terrestrial ecosystem structure and function to CO2 and climate change: Results from six dynamic global vegetation models. Glob. Chang. Biol. 2001, 7, 357–373. [Google Scholar] [CrossRef] [Green Version]
  4. Linscheid, N.; Estupinan-Suarez, L.M.; Brenning, A.; Carvalhais, N.; Mahecha, M.D. Towards a global understanding of vegetation-climate dynamics at multiple time scales. Biogeosciences 2020, 17, 945–962. [Google Scholar] [CrossRef]
  5. Pettorelli, N.; Vik, J.O.; Mysterud, A.; Gaillard, J.M.; Tucker, C.J.; Stenseth, N.C. Using the satellite-derived NDVI to assess ecological responses to environmental change. Trends Ecol. Evol. 2005, 20, 503–510. [Google Scholar] [CrossRef]
  6. Hüttich, C.; Herold, M.; Schmullius, C.; Egorov, V.; Bartalev, S.A. Indicators of Northern Eurasia’s land-cover change trends from SPOT-VEGETATION time-series analysis 1998–2005. Int. J. Remote Sens. 2007, 28, 4199–4206. [Google Scholar] [CrossRef]
  7. Tucker, C.J.; Fung, I.Y.; Keeling, C.D.; Gammon, R.H. Relationship between atmospheric CO2 variations and a satellite-derived vegetation index. Nature 1986, 319, 195–199. [Google Scholar] [CrossRef]
  8. Wang, S.; Zhang, L.; Huang, C.; Qiao, N. An NDVI-based vegetation phenology is improved to be more consistent with photosynthesis dynamics through applying a light use efficiency model over boreal high-latitude forests. Remote Sens. 2017, 9, 695. [Google Scholar] [CrossRef] [Green Version]
  9. Qiao, K.; Zhu, W.; Xie, Z.; Li, P. Estimating the seasonal dynamics of the leaf area index using piecewise LAI-VI relationships based on phenophases. Remote Sens. 2019, 11, 689. [Google Scholar] [CrossRef] [Green Version]
  10. Ricci, G.F.; Romano, G.; Leronni, V.; Gentile, F. Effect of check dams on riparian vegetation cover: A multiscale approach based on field measurements and satellite images for Leaf Area Index assessment. Sci. Total Environ. 2019, 657, 827–838. [Google Scholar] [CrossRef]
  11. Richetti, J.; Boote, K.J.; Hoogenboom, G.; Judge, J.; Johann, J.A.; Uribe-Opazo, M.A. Remotely sensed vegetation index and LAI for parameter determination of the CSM-CROPGRO-Soybean model when in situ data are not available. Int. J. Appl. Earth Obs. Geoinf. 2019, 79, 110–115. [Google Scholar] [CrossRef]
  12. Myneni, R.B.; Keeling, C.D.; Tucker, C.J.; Asrar, G.; Nemani, R.R. Increased plant growth in the northern high latitudes from 1981 to 1991. Nature 1997, 386, 698–702. [Google Scholar] [CrossRef]
  13. Jansen, V.; Kolden, C.; Schmalz, H. The development of near real-time biomass and cover estimates for adaptive rangeland management using Landsat 7 and Landsat 8 surface reflectance products. Remote Sens. 2018, 10, 1057. [Google Scholar] [CrossRef] [Green Version]
  14. Pandit, S.; Tsuyuki, S.; Dube, T. Landscape-scale aboveground biomass estimation in buffer zone community forests of central Nepal: Coupling in situ measurements with Landsat 8 satellite data. Remote Sens. 2018, 10, 1848. [Google Scholar] [CrossRef] [Green Version]
  15. Huete, A.; Didan, K.; Miura, T.; Rodriguez, E.P.; Gao, X.; Ferreira, L.G. Overview of the radiometric and biophysical performance of the MODIS vegetation indices. Remote Sens. Environ. 2002, 83, 195–213. [Google Scholar] [CrossRef]
  16. Huete, A.; Justice, C.O.; Liu, H. Development of vegetation and soil indices for MODIS-EOS. Remote Sens. Environ. 1994, 49, 224–234. [Google Scholar] [CrossRef]
  17. Sarmah, S.; Jia, G.; Zhang, A. Satellite view of seasonal greenness trends and controls in South Asia. Environ. Res. Lett. 2018, 13, 034026. [Google Scholar] [CrossRef]
  18. Gaughan, A.E.; Stevens, F.R.; Gibbes, C.; Southworth, J.; Binford, M.W. Linking vegetation response to seasonal precipitation in the Okavango-Kwando-Zambezi catchment of southern africa. Int. J. Remote Sens. 2012, 33, 6783–6804. [Google Scholar] [CrossRef]
  19. Jong, R.D.; Verbesselt, J.; Schaepman, M.E.; Bruin, S.D. Trend changes in global greening and browning: Contribution of short-term trends to longer-term change. Glob. Chang. Biol. 2012, 18, 642–655. [Google Scholar] [CrossRef]
  20. Craine, J.M.; Nippert, J.B.; Elmore, A.J.; Skibbe, A.M.; Hutchinson, S.L.; Brunsell, N.A. Timing of climate variability and grassland productivity. Proc. Natl. Acad. Sci. USA 2012, 109, 3401–3405. [Google Scholar] [CrossRef] [Green Version]
  21. Nemani, R.R.; Keeling, C.D.; Hashimoto, H.; Jolly, W.M.; Piper, S.C.; Tucker, C.J.; Myneni, R.B.; Running, S.W. Climate-driven increases in global terrestrial net primary production from 1982 to 1999. Science 2003, 300, 1560–1563. [Google Scholar] [CrossRef] [Green Version]
  22. Fensholt, R.; Langanke, T.; Rasmussen, K.; Reenberg, A.; Prince, S.D.; Tucker, C.; Scholes, R.J.; Le, Q.B.; Bondeau, A.; Eastman, R.; et al. Greenness in semi-arid areas across the globe 1981–2007—an earth observing satellite based analysis of trends and drivers. Remote Sens. Environ. 2012, 121, 144–158. [Google Scholar] [CrossRef]
  23. Slayback, D.A.; Pinzon, J.E.; Los, S.O.; Tucker, C.J. Northern hemisphere photosynthetic trends 1982-99. Glob. Chang. Biol. 2003, 9, 1–15. [Google Scholar] [CrossRef]
  24. Piao, S.; Wang, X.; Ciais, P.; Zhu, B.; Wang, T.A.O.; Liu, J.I.E. Changes in satellite-derived vegetation growth trend in temperate and boreal Eurasia from 1982 to 2006. Glob. Chang. Biol. 2011, 17, 3228–3239. [Google Scholar] [CrossRef]
  25. Li, J.X.; Chen, Y.N.; Xu, C.C.; Li, Z. Evaluation and analysis of ecological security in arid areas of Central Asia based on the emergy ecological footprint (EEF) model. J. Clean. Prod. 2019, 235, 664–677. [Google Scholar] [CrossRef]
  26. Huang, X.; Peng, W.; Rudaya, N.; Grimm, E.C.; Chen, X.; Cao, X.; Zhang, J.; Pan, X.; Liu, S.; Chen, C.; et al. Holocene vegetation and climate dynamics in the Altai Mountains and surrounding areas. Geophys. Res. Lett. 2018, 45, 6628–6636. [Google Scholar] [CrossRef]
  27. Jiang, L.; Bao, A.; Jiapaer, G.; Guo, H.; Zheng, G.; Gafforov, K.; Kurban, A.; De Maeyer, P. Monitoring land sensitivity to desertification in Central Asia: Convergence or divergence? Sci. Total Environ. 2019, 658, 669–683. [Google Scholar] [CrossRef]
  28. Chen, F.; Chen, J.; Huang, W.; Chen, S.; Huang, X.; Jin, L.; Jia, J.; Zhang, X.; Chengbang, A.; Zhang, J.; et al. Westerlies Asia and monsoonal Asia: Spatiotemporal differences in climate change and possible mechanisms on decadal to sub-orbital timescales. Earth Sci. Rev. 2019, 192, 337–354. [Google Scholar] [CrossRef]
  29. Zhang, X.S. Ecological restoration and sustainable agricultural paradigm of mountain-oasis-ecotone-desert system in the north of the Tianshan Mountains. Acta Bot. Sin. 2001, 43, 1294–1299. [Google Scholar]
  30. Fu, Q.; Li, B.; Hou, Y.; Bi, X.; Zhang, X. Effects of land use and climate change on ecosystem services in Central Asia’s arid regions: A case study in Altay Prefecture, China. Sci. Total Environ. 2017, 607, 633–646. [Google Scholar] [CrossRef]
  31. De Beurs, K.M.; Henebry, G.M.; Owsley, B.C.; Sokolik, I. Using multiple remote sensing perspectives to identify and attribute land surface dynamics in Central Asia 2001–2013. Remote Sens. Environ. 2015, 170, 48–61. [Google Scholar] [CrossRef]
  32. Li, Z.; Chen, Y.; Li, W.; Deng, H.; Fang, G. Potential impacts of climate change on vegetation dynamics in Central Asia. J. Geophys. Res. Atmos. 2015, 120, 12345–12356. [Google Scholar] [CrossRef]
  33. Zhang, C.; Lu, D.; Chen, X.; Zhang, Y.; Maisupova, B.; Tao, Y. The spatiotemporal patterns of vegetation coverage and biomass of the temperate deserts in Central Asia and their relationships with climate controls. Remote Sens. Environ. 2016, 175, 271–281. [Google Scholar] [CrossRef]
  34. Zhou, Y.; Zhang, L.; Xiao, J.; Williams, C.A.; Vitkovskaya, I.; Bao, A. Spatiotemporal transition of institutional and socioeconomic impacts on vegetation productivity in Central Asia over last three decades. Sci. Total Environ. 2019, 658, 922–935. [Google Scholar] [CrossRef] [PubMed]
  35. Liang, S.; Yi, Q.; Liu, J. Vegetation dynamics and responses to recent climate change in Xinjiang using leaf area index as an indicator. Ecol. Indic. 2015, 58, 64–76. [Google Scholar]
  36. Liu, Y.; Li, L.; Chen, X.; Zhang, R.; Yang, J. Temporal-spatial variations and influencing factors of vegetation cover in Xinjiang from 1982 to 2013 based on GIMMS-NDVI3g. Glob. Planet. Change 2018, 169, 145–155. [Google Scholar] [CrossRef]
  37. Yao, J.; Hu, W.; Chen, Y.; Huo, W.; Zhao, Y.; Mao, W.; Yang, Q. Hydro-climatic changes and their impacts on vegetation in Xinjiang, Central Asia. Sci. Total Environ. 2019, 660, 724–732. [Google Scholar] [CrossRef]
  38. Li, P.; Peng, C.; Wang, M.; Luo, Y.; Li, M.; Zhang, K.; Zhang, D.; Zhu, Q. Dynamics of vegetation autumn phenology and its response to multiple environmental factors from 1982 to 2012 on Qinghai-Tibetan Plateau in China. Sci. Total Environ. 2018, 637, 855–864. [Google Scholar] [CrossRef]
  39. Li, C.; de Jong, R.; Schmid, B.; Wulf, H.; Schaepman, M.E. Spatial variation of human influences on grassland biomass on the Qinghai-Tibetan plateau. Sci. Total Environ. 2019, 665, 678–689. [Google Scholar] [CrossRef]
  40. Zhang, Z.; Chang, J.; Xu, C.Y.; Zhou, Y.; Wu, Y.; Chen, X.; Jiang, S.; Duan, Z. The response of lake area and vegetation cover variations to climate change over the Qinghai-Tibetan Plateau during the past 30 years. Sci. Total Environ. 2018, 635, 443–451. [Google Scholar] [CrossRef]
  41. Barriopedro, D.; Gouveia, C.M.; Trigo, R.M.; Wang, L. The 2009/10 drought in China: Possible causes and impacts on vegetation. J. Hydrometeorol. 2012, 13, 1251–1267. [Google Scholar] [CrossRef] [Green Version]
  42. Reichle, L.M.; Epstein, H.E.; Bhatt, U.S.; Raynolds, M.K.; Walker, D.A. Spatial heterogeneity of the temporal dynamics of arctic tundra vegetation. Geophys. Res. Lett. 2018, 45, 9206–9215. [Google Scholar] [CrossRef] [Green Version]
  43. Qi, X.; Jia, J.; Liu, H.; Lin, Z. Relative importance of climate change and human activities for vegetation changes on China’s silk road economic belt over multiple timescales. Catena 2019, 180, 224–237. [Google Scholar] [CrossRef]
  44. Fu, Q.; Hou, Y.; Wang, B.; Bi, X.; Li, B.; Zhang, X. Scenario analysis of ecosystem service changes and interactions in a mountain-oasis-desert system: A case study in Altay Prefecture, China. Sci. Rep. 2018, 8, 12939. [Google Scholar] [CrossRef] [PubMed]
  45. Wu, Y.F.; Bake, B.; Li, W.; Wei, X.Q.; Wozatihan, J.; Rasulov, H. Spatio-temporal variation of drought condition during 1961 to 2012 based on composite index of meteorological drought in Altay region, China. Chin. J. Appl. Ecol. 2015, 26, 512–520. [Google Scholar]
  46. Bi, X.; Li, B.; Fu, Q.; Fan, Y.; Ma, L.; Yang, Z.; Nan, B.; Dai, X.; Zhang, X. Effects of grazing exclusion on the grassland ecosystems of mountain meadows and temperate typical steppe in a mountain-basin system in Central Asia’s arid regions, China. Sci. Total Environ. 2018, 630, 254–263. [Google Scholar] [CrossRef]
  47. Hutchinson, M.F. Interpolating mean rainfall using thin plate smoothing splines. Int. J. Geogr. Inf. Syst. 1995, 9, 385–403. [Google Scholar] [CrossRef]
  48. Hutchinson, M.F. ANUSPLIN Version 4.3. User Guide; The Australian National University, Centre for Resources and Environmental Studies: Canberra, Australia, 2004. [Google Scholar]
  49. Ma, M.; Chang, R. Temperature drive the altitudinal change in soil carbon and nitrogen of montane forests: Implication for global warming. Catena 2019, 182, 104126. [Google Scholar] [CrossRef]
  50. Bring, J. How to standardize regression coefficients. Am. Stat. 1994, 48, 209–213. [Google Scholar]
  51. Du, J.; Shu, J.; Yin, J.; Yuan, X.; Jiaerheng, A.; Xiong, S.; He, P.; Liu, W. Analysis on spatio-temporal trends and drivers in vegetation growth during recent decades in Xinjiang, China. Int. J. Appl. Earth Obs. Geoinf. 2015, 38, 216–228. [Google Scholar] [CrossRef]
  52. Zhang, R.; Ouyang, Z.T.; Xie, X.; Guo, H.Q.; Tan, D.Y.; Xiao, X.M.; Qi, J.G.; Zhao, B. Impact of climate change on vegetation growth in arid northwest of China from 1982 to 2011. Remote Sens. 2016, 8, 364. [Google Scholar] [CrossRef] [Green Version]
  53. Zhang, X.; Li, J.; Gao, M.; Jin, L. Simulated precipitation changes in Central Asia since the Last Glacial Maximum. Quat. Int. 2018, 490, 82–97. [Google Scholar] [CrossRef]
  54. Chen, X.Y.; Fu, B.H.; Shi, P.L. Tempo-spatial changes of vegetation coverage using remote sensing in Altay, China. In IOP Conference Series: Earth and Environmental Science; IOP Publishing: Sanya, China, 2017; Volume 74, p. 012008. [Google Scholar]
  55. Qiao, S.; Hu, P.; Feng, T.; Cheng, J.; Han, Z.; Gong, Z.; Zhi, R.; Feng, G. Enhancement of the relationship between the winter Arctic oscillation and the following summer circulation anomalies over central East Asia since the early 1990s. Clim. Dyn. 2018, 50, 3485–3503. [Google Scholar] [CrossRef]
  56. Yan, D.; Xu, H.; Lan, J.; Zhou, K.; Ye, Y.; Zhang, J.; An, Z.; Yeager, K.M. Solar activity and the westerlies dominate decadal hydroclimatic changes over arid Central Asia. Glob. Planet. Change 2019, 173, 53–60. [Google Scholar] [CrossRef]
  57. Liu, X.; Cheng, Z.; Yan, L.; Yin, Z.Y. Elevation dependency of recent and future minimum surface air temperature trends in the Tibetan Plateau and its surroundings. Glob. Planet. Change 2009, 68, 164–174. [Google Scholar] [CrossRef]
  58. Clow, D.W. Changes in the timing of snowmelt and streamflow in Colorado: A response to recent warming. J. Clim. 2010, 23, 2293–2306. [Google Scholar] [CrossRef]
  59. Gutmann, E.D.; Rasmussen, R.M.; Liu, C.; Ikeda, K.; Gochis, D.J.; Clark, M.P.; Dudhia, J.; Thompson, G. A comparison of statistical and dynamical downscaling of winter precipitation over complex terrain. J. Clim. 2012, 25, 262–281. [Google Scholar] [CrossRef] [Green Version]
  60. Ceppi, P.; Scherrer, S.C.; Fischer, A.M.; Appenzeller, C. Revisiting Swiss temperature trends 1959–2008. Int. J. Climatol. 2012, 32, 203–213. [Google Scholar] [CrossRef] [Green Version]
  61. Jungo, P.; Beniston, M. Changes in the anomalies of extreme temperature anomalies in the 20th century at Swiss climatological stations located at different latitudes and altitudes. Theor. Appl. Climatol. 2001, 69, 1–12. [Google Scholar] [CrossRef]
  62. Rangwala, I.; Miller, J.R. Climate change in mountains: A review of elevation-dependent warming and its possible causes. Clim. Change 2012, 114, 527–547. [Google Scholar] [CrossRef]
  63. Chen, T.; Bao, A.; Jiapaer, G.; Guo, H.; Zheng, G.; Jiang, L.; Chang, C.; Tuerhanjiang, L. Disentangling the relative impacts of climate change and human activities on arid and semiarid grasslands in Central Asia during 1982–2015. Sci. Total Environ. 2019, 653, 1311–1325. [Google Scholar] [CrossRef]
  64. Tao, J.; Xu, T.; Dong, J.; Yu, X.; Jiang, Y.; Zhang, Y.; Huang, K.; Zhu, J.; Dong, J.; Xu, Y.; et al. Elevation-dependent effects of climate change on vegetation greenness in the high mountains of southwest China during 1982–2013. Int. J. Climatol. 2018, 38, 2029–2038. [Google Scholar] [CrossRef]
  65. Dong, J.; Tao, F.; Zhang, G. Trends and variation in vegetation greenness related to geographic controls in middle and eastern Inner Mongolia, China. Environ. Earth Sci. 2011, 62, 245–256. [Google Scholar] [CrossRef]
  66. Zhang, X.; Jin, L.; Chen, J.; Chen, F.; Park, W.; Schneider, B.; Latif, M. Detecting the relationship between moisture changes in arid central Asia and East Asia during the Holocene by model-proxy comparison. Quat. Sci. Rev. 2017, 176, 36–50. [Google Scholar] [CrossRef]
  67. Guo, H.; Bao, A.; Liu, T.; Ndayisaba, F.; Jiang, L.; Kurban, A.; De Maeyer, P. Spatial and temporal characteristics of droughts in Central Asia during 1966–2015. Sci. Total Environ. 2018, 624, 1523–1538. [Google Scholar] [CrossRef]
  68. Ma, J.; Xiao, X.; Miao, R.; Li, Y.; Chen, B.; Zhang, Y.; Zhao, B. Trends and controls of terrestrial gross primary productivity of China during 2000–2016. Environ. Res. Lett. 2019, 14, 084032. [Google Scholar] [CrossRef] [Green Version]
  69. Palazzi, E.; Filippi, L.; Von Hardenberg, J. Insights into elevation-dependent warming in the tibetan plateau-himalayas from cmip5 model simulations. Clim. Dyn. 2017, 48, 3991–4008. [Google Scholar] [CrossRef] [Green Version]
  70. Li, L.; Zhang, Y.; Wu, J.; Li, S.; Zhang, B.; Zu, J.; Zhang, H.; Ding, M.; Paudel, B. Increasing sensitivity of alpine grasslands to climate variability along an elevational gradient on the Qinghai-Tibet Plateau. Sci. Total Environ. 2019, 678, 21–29. [Google Scholar] [CrossRef] [PubMed]
  71. Dye, D.G.; Tucker, C.J. Seasonality and trends of snow-cover, vegetation index, and temperature in northern eurasia. Geophys. Res. Lett. 2003, 30, 1405. [Google Scholar] [CrossRef]
  72. Harpold, A.A.; Molotch, N.P. Sensitivity of soil water availability to changing snowmelt timing in the western US. Geophys. Res. Lett. 2015, 42, 8011–8020. [Google Scholar] [CrossRef]
  73. Yang, Y.; Tang, J.; Xiong, Z.; Dong, X. Evaluation of high-resolution gridded precipitation data in arid and semiarid regions: Heihe River basin, Northwest China. J. Hydrometeorol. 2017, 18, 3075–3101. [Google Scholar] [CrossRef]
Figure 1. Location map of the study area and distribution map of mountain, oasis, and desert zones (a), distribution map of vegetation and nonvegetation in Altay Prefecture (b).
Remotesensing 12 01665 g001
Figure 2. Spatial distribution of mean annual normalized difference vegetation index (NDVI) values in Altay Prefecture during 2000–2017 (a) and trend map of NDVI values in Altay Prefecture during 2000–2017 (b).
Remotesensing 12 01665 g002
Figure 3. Average NDVI during 2000–2017 for each elevation bin (a), and mean NDVI trend for each elevation bin (b); the red dots indicate that the trend is statistically significant (p < 0.05).
Remotesensing 12 01665 g003
Figure 4. Average annual precipitation and temperature (a), average summer precipitation and temperature (b), annual precipitation trend (c), summer precipitation trend (d), annual temperature trend (e), and summer temperature trend (f) during 2000–2017 for each elevation bin.
Remotesensing 12 01665 g004aRemotesensing 12 01665 g004b
Figure 5. Standardized regression coefficients between NDVI and total summer precipitation (TSP), mean summer temperature (MST) at each elevation bin.
Remotesensing 12 01665 g005
Figure 6. Average NDVI value for main vegetation types during 2000–2017 in Altay Prefecture.
Remotesensing 12 01665 g006
Table 1. Standardized regression coefficients between NDVI and total summer precipitation, mean summer temperature.
AreaFactorUnstandardized CoefficientStandardized CoefficientP-Value
Whole regionTSP0.00040.623<0.01
MST−0.005−0.2090.331
Mountain zoneTSP0.00040.514<0.05
MST−0.003−0.1470.533
Oasis zoneTSP0.0010.475<0.05
MST0.0080.1810.430
Desert zoneTSP0.00040.677<0.01
MST−0.006−0.2330.212

