Mapping Paddy Fields in Japan by Using a Sentinel-1 SAR Time Series Supplemented by Sentinel-2 Images on Google Earth Engine

Abstract

1. Introduction
2. Materials and Methods
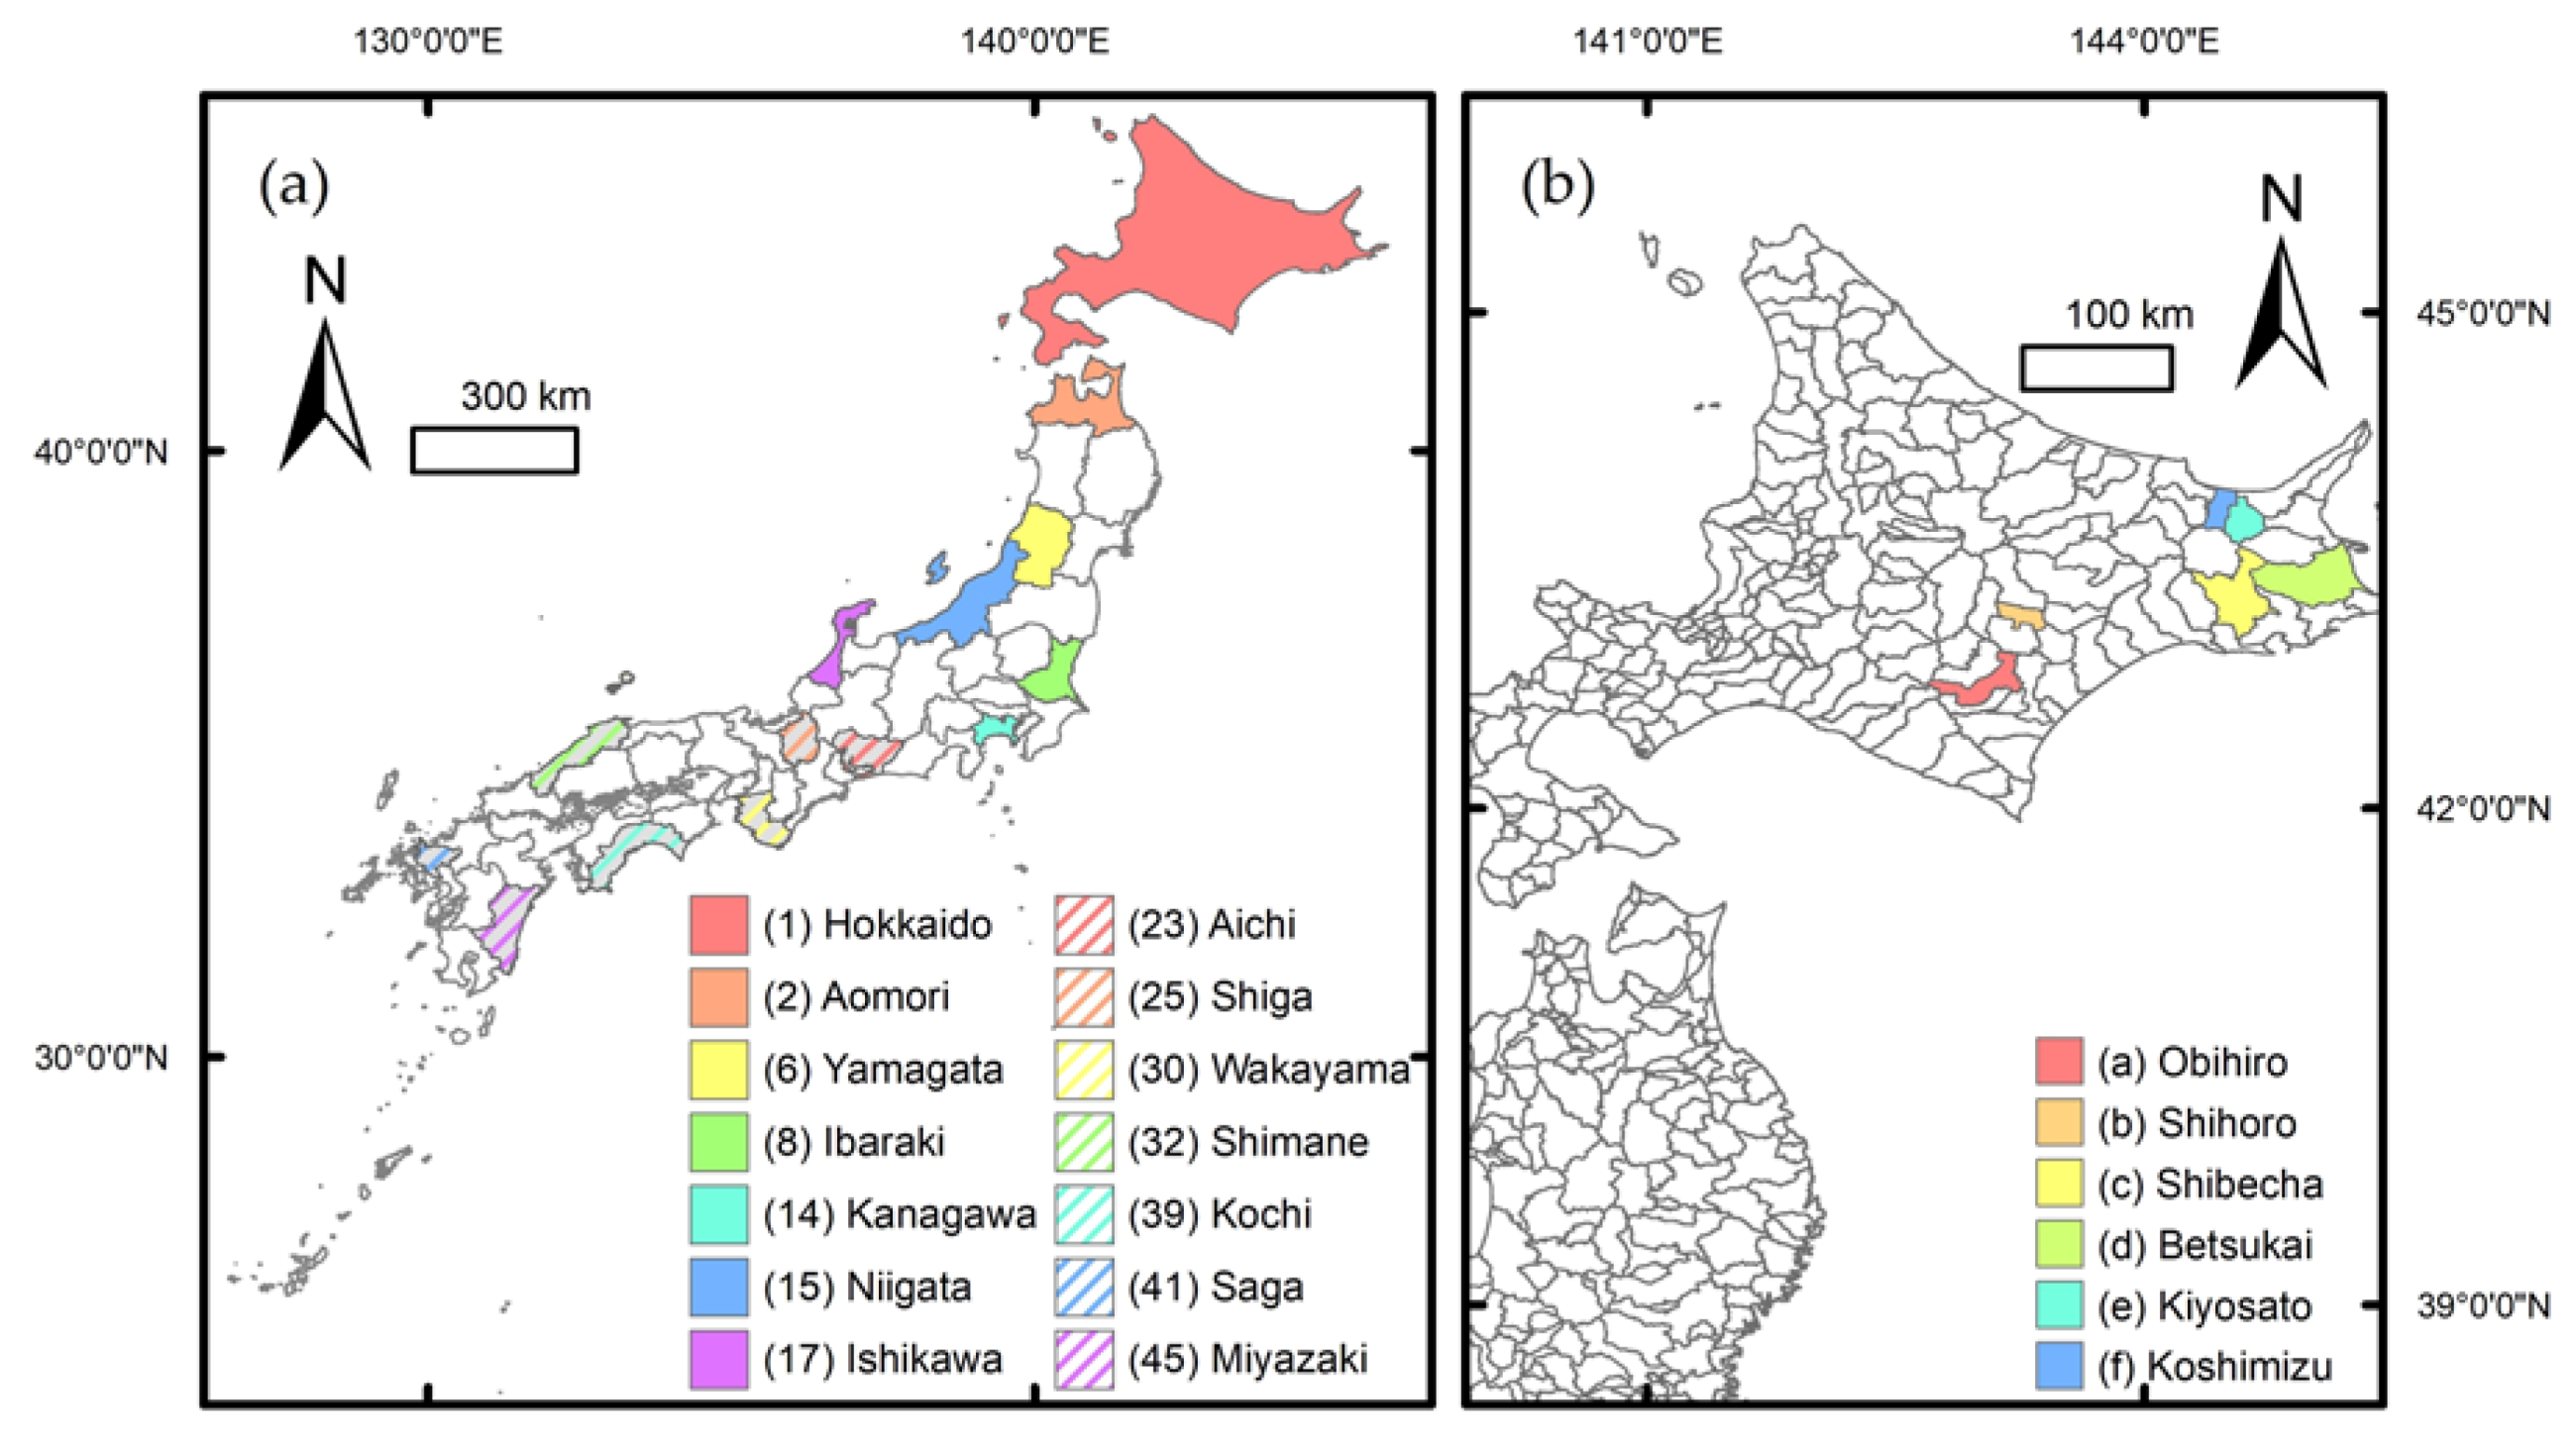
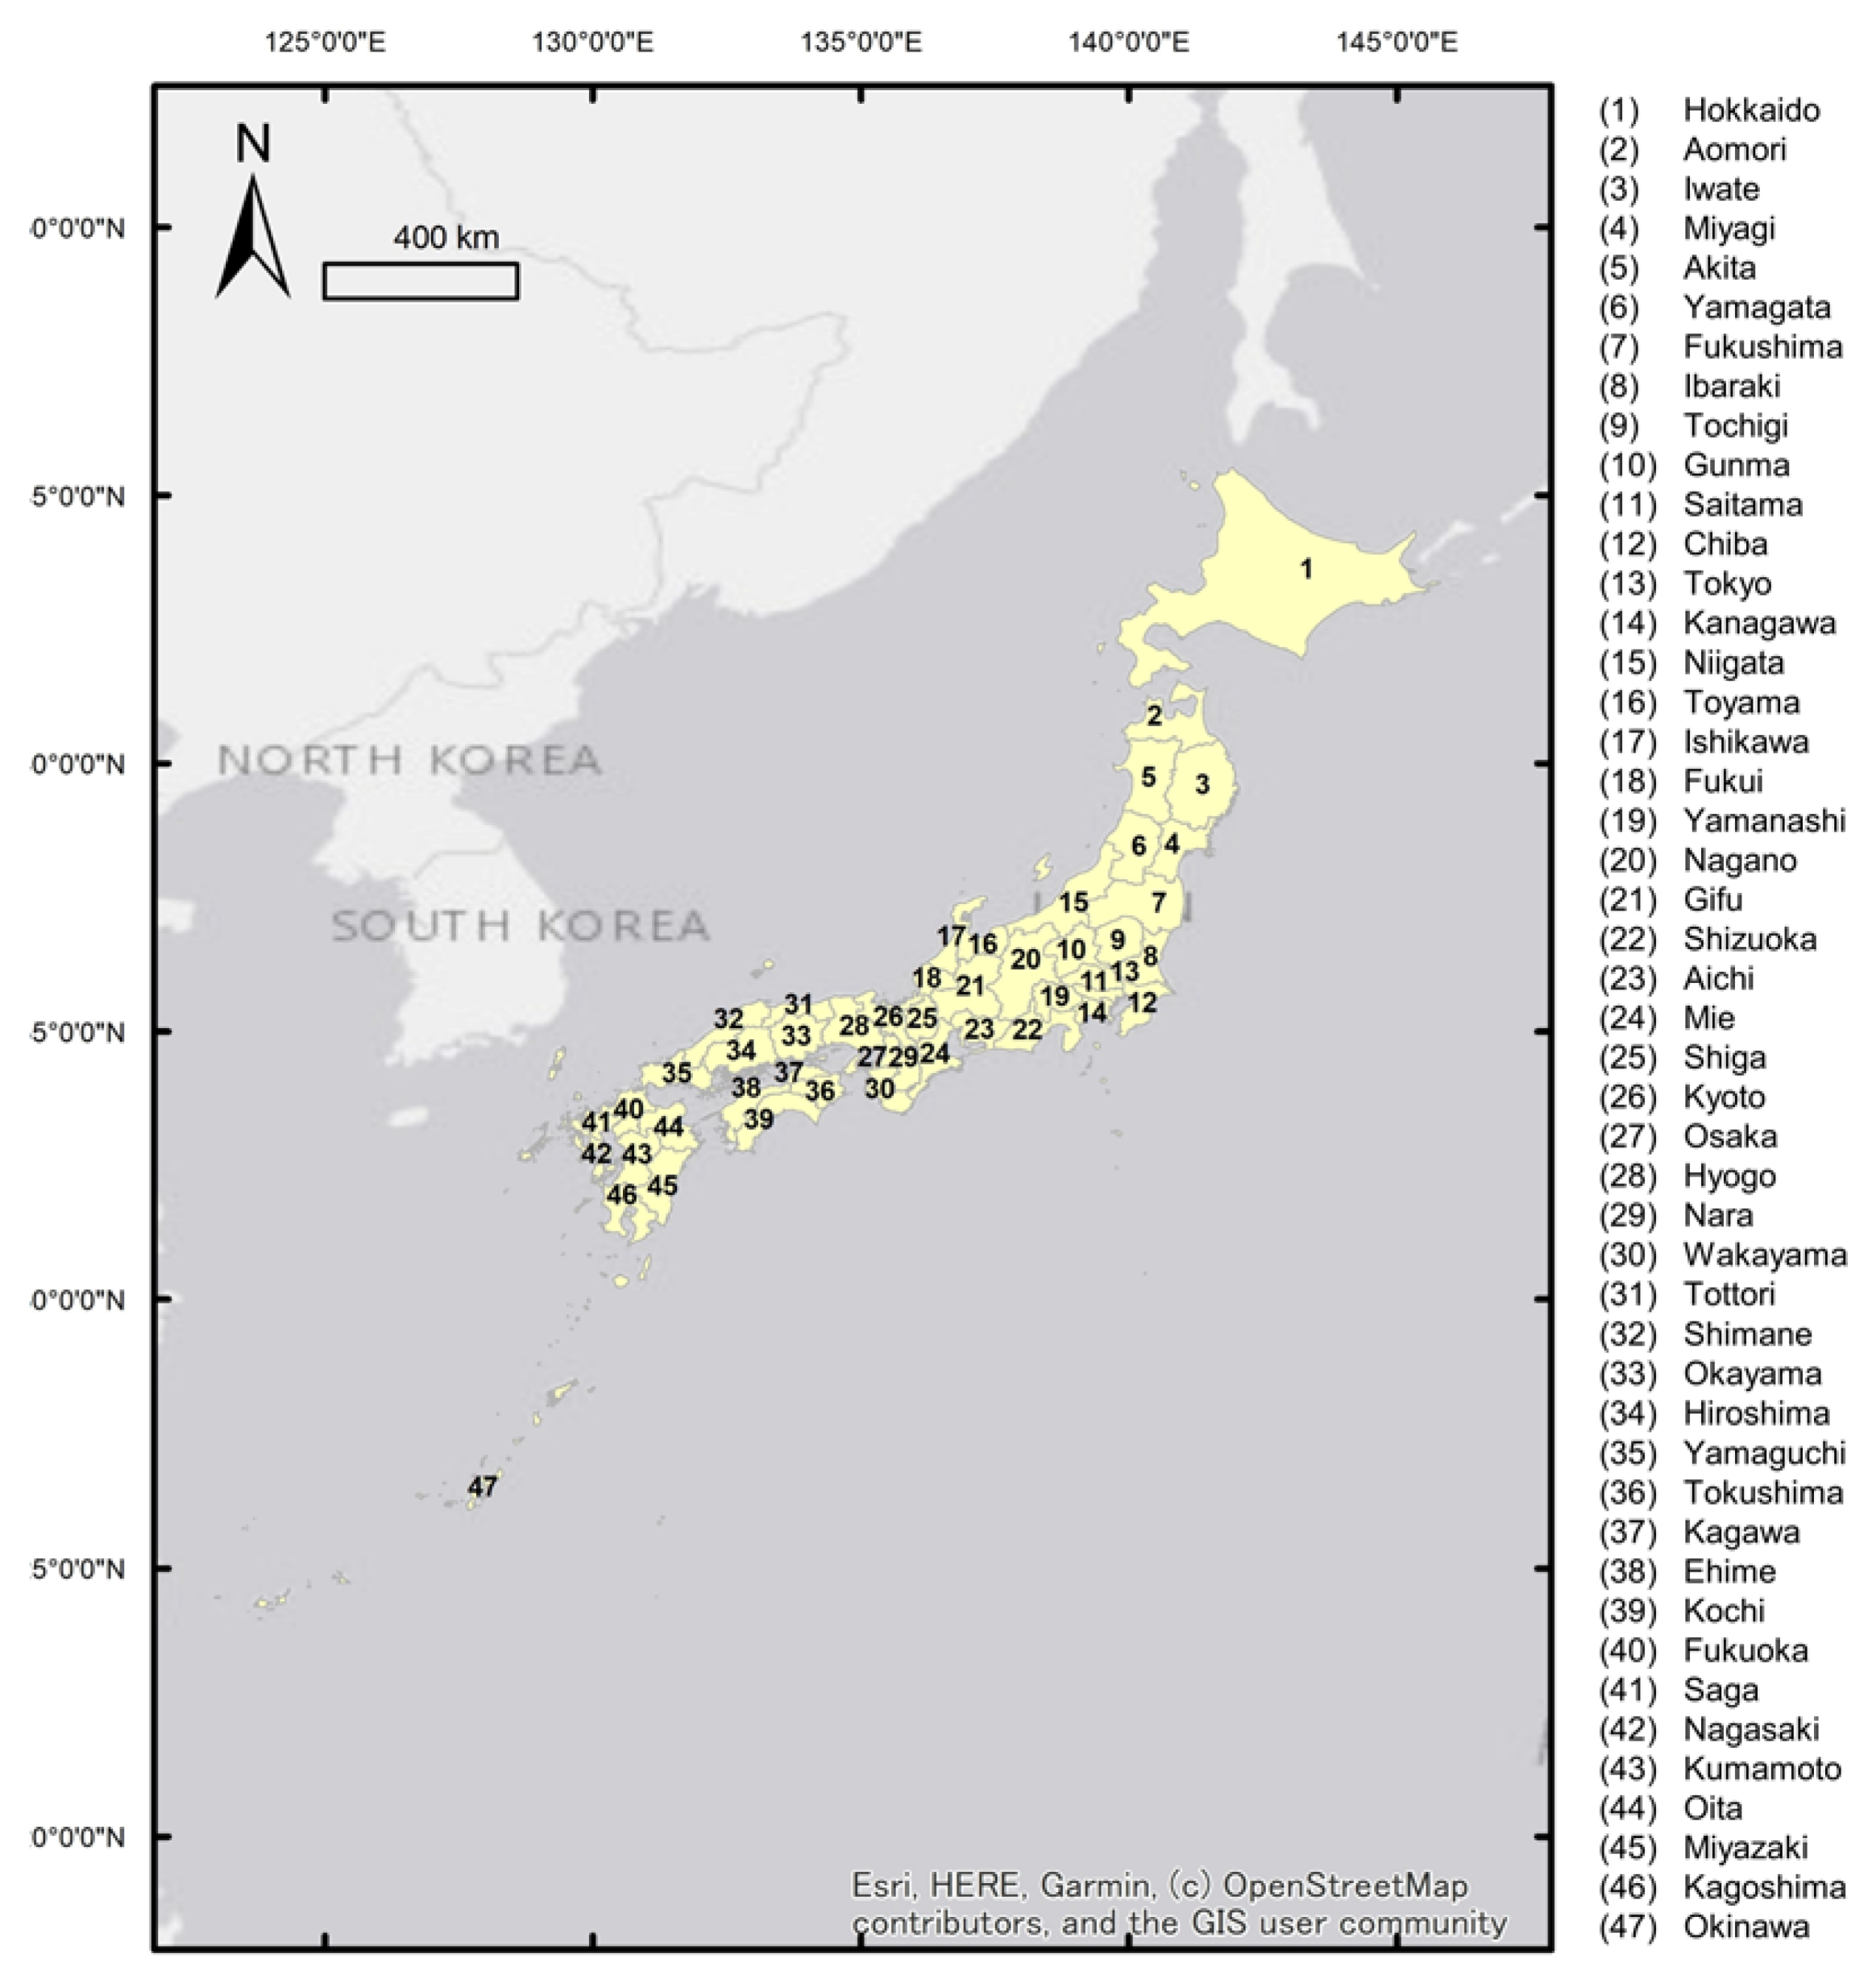
2.1. Study Area
2.2. Satellite Data
2.2.1. Sentinel-1 Time Series
2.2.2. Sentinel-2 Multispectral Imager
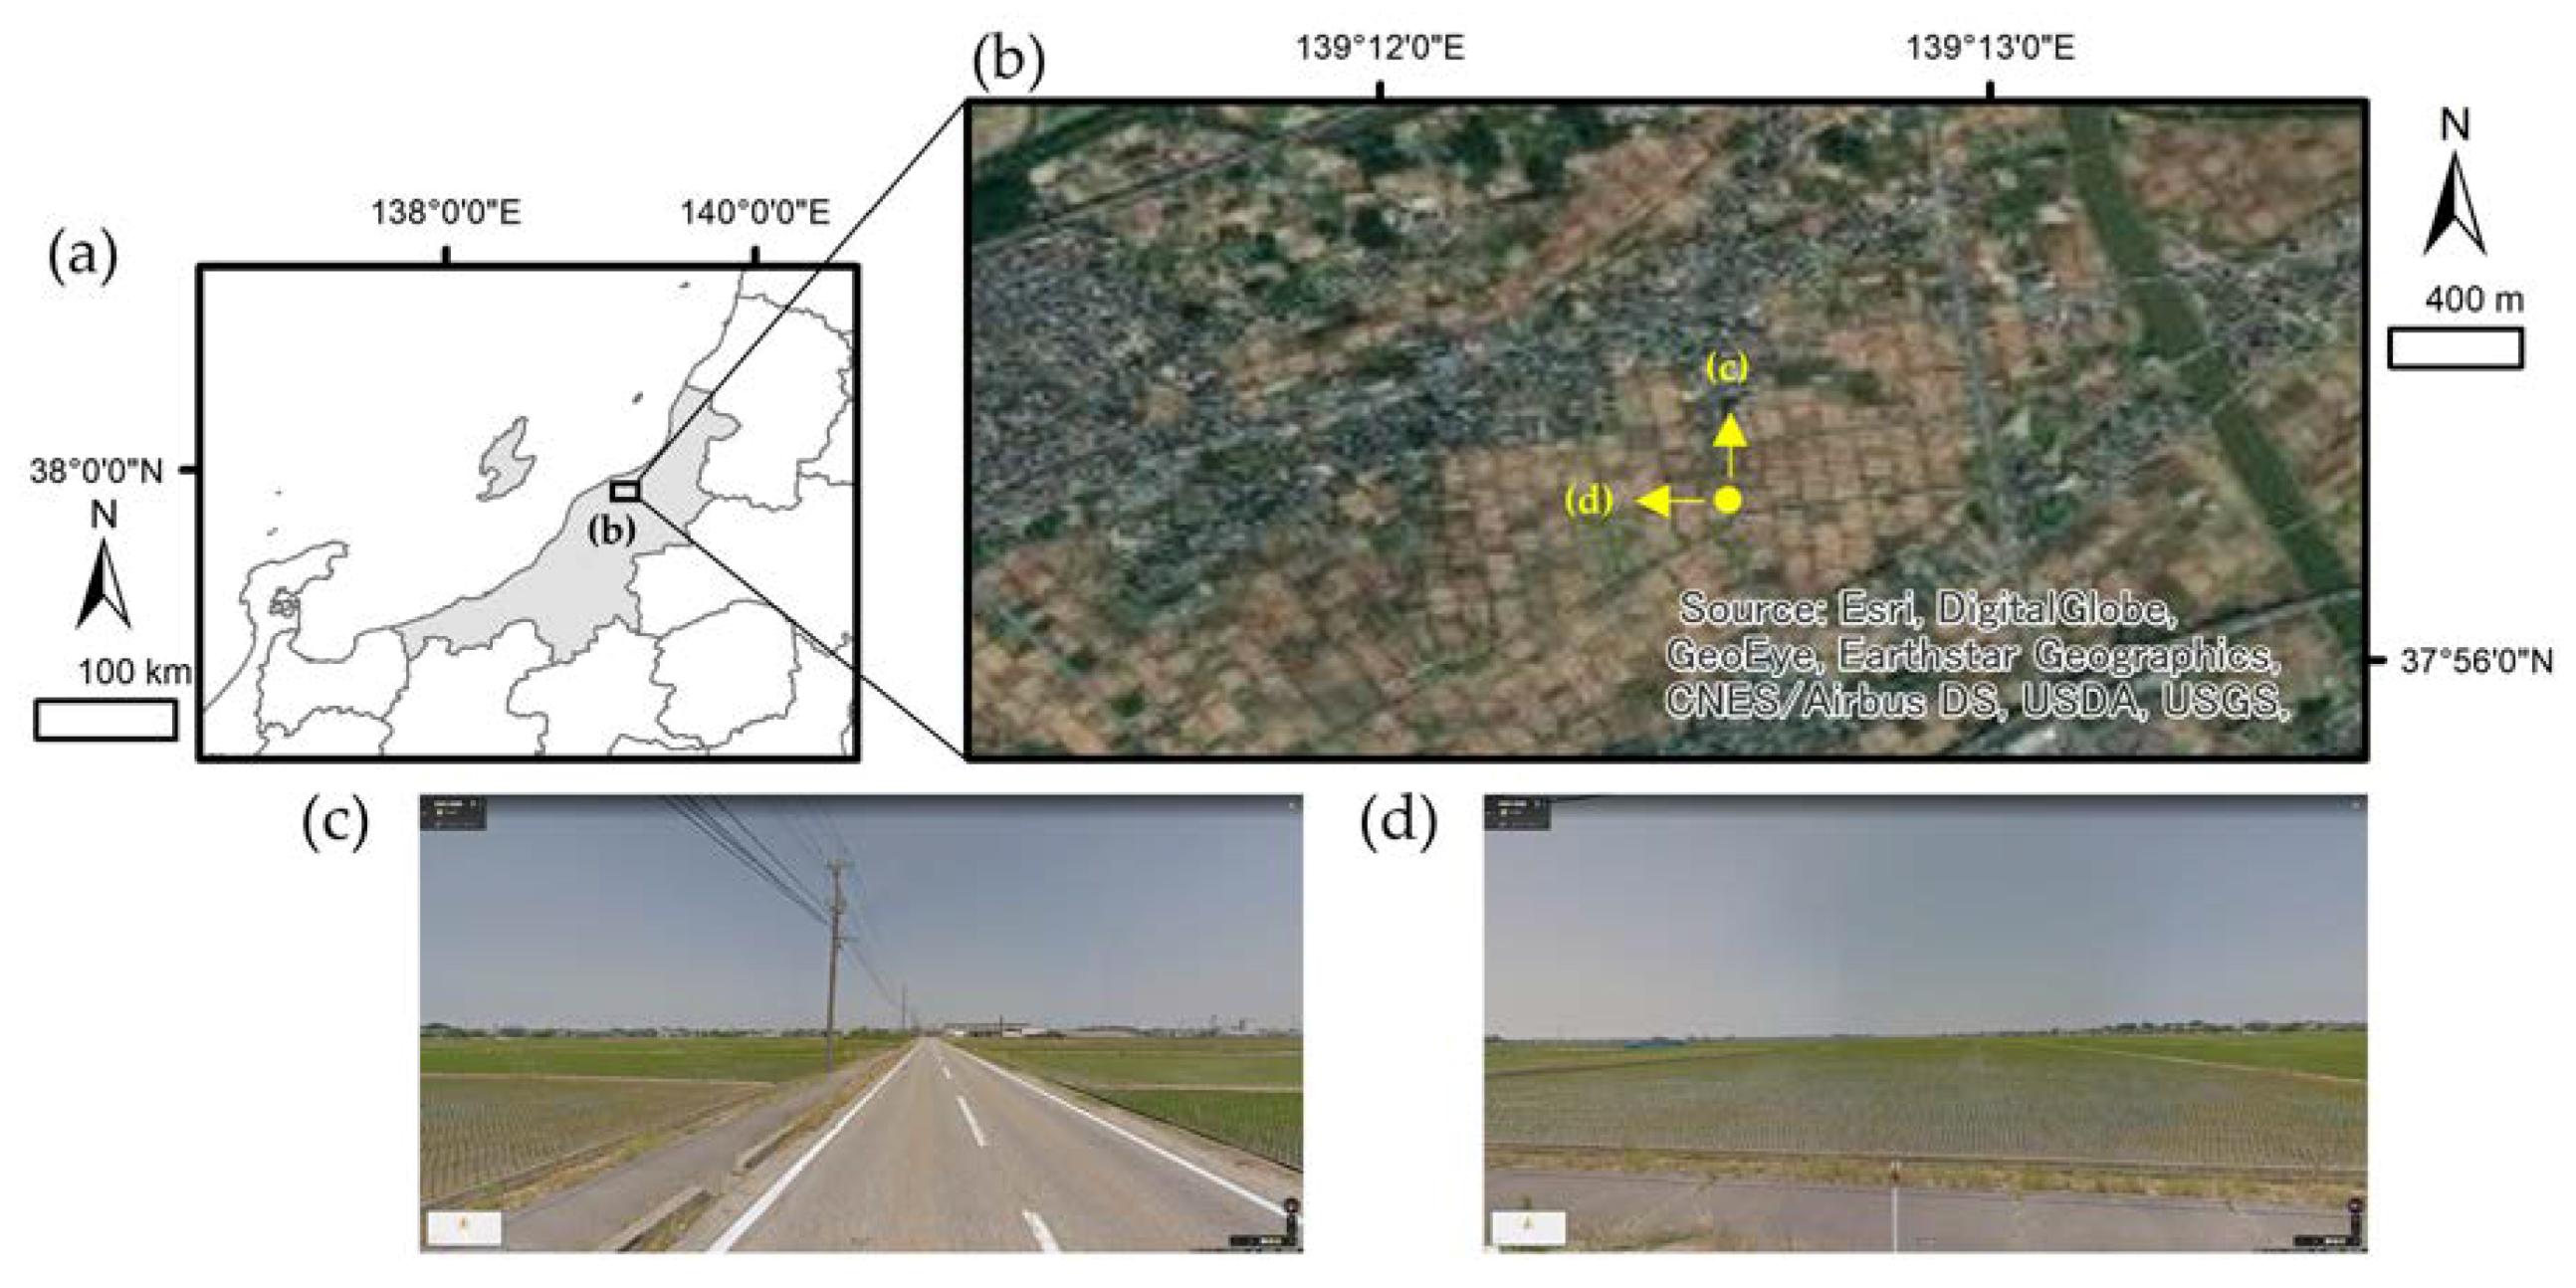
2.3. Reference Agricultural Fields
2.4. Existing Paddy Field Maps
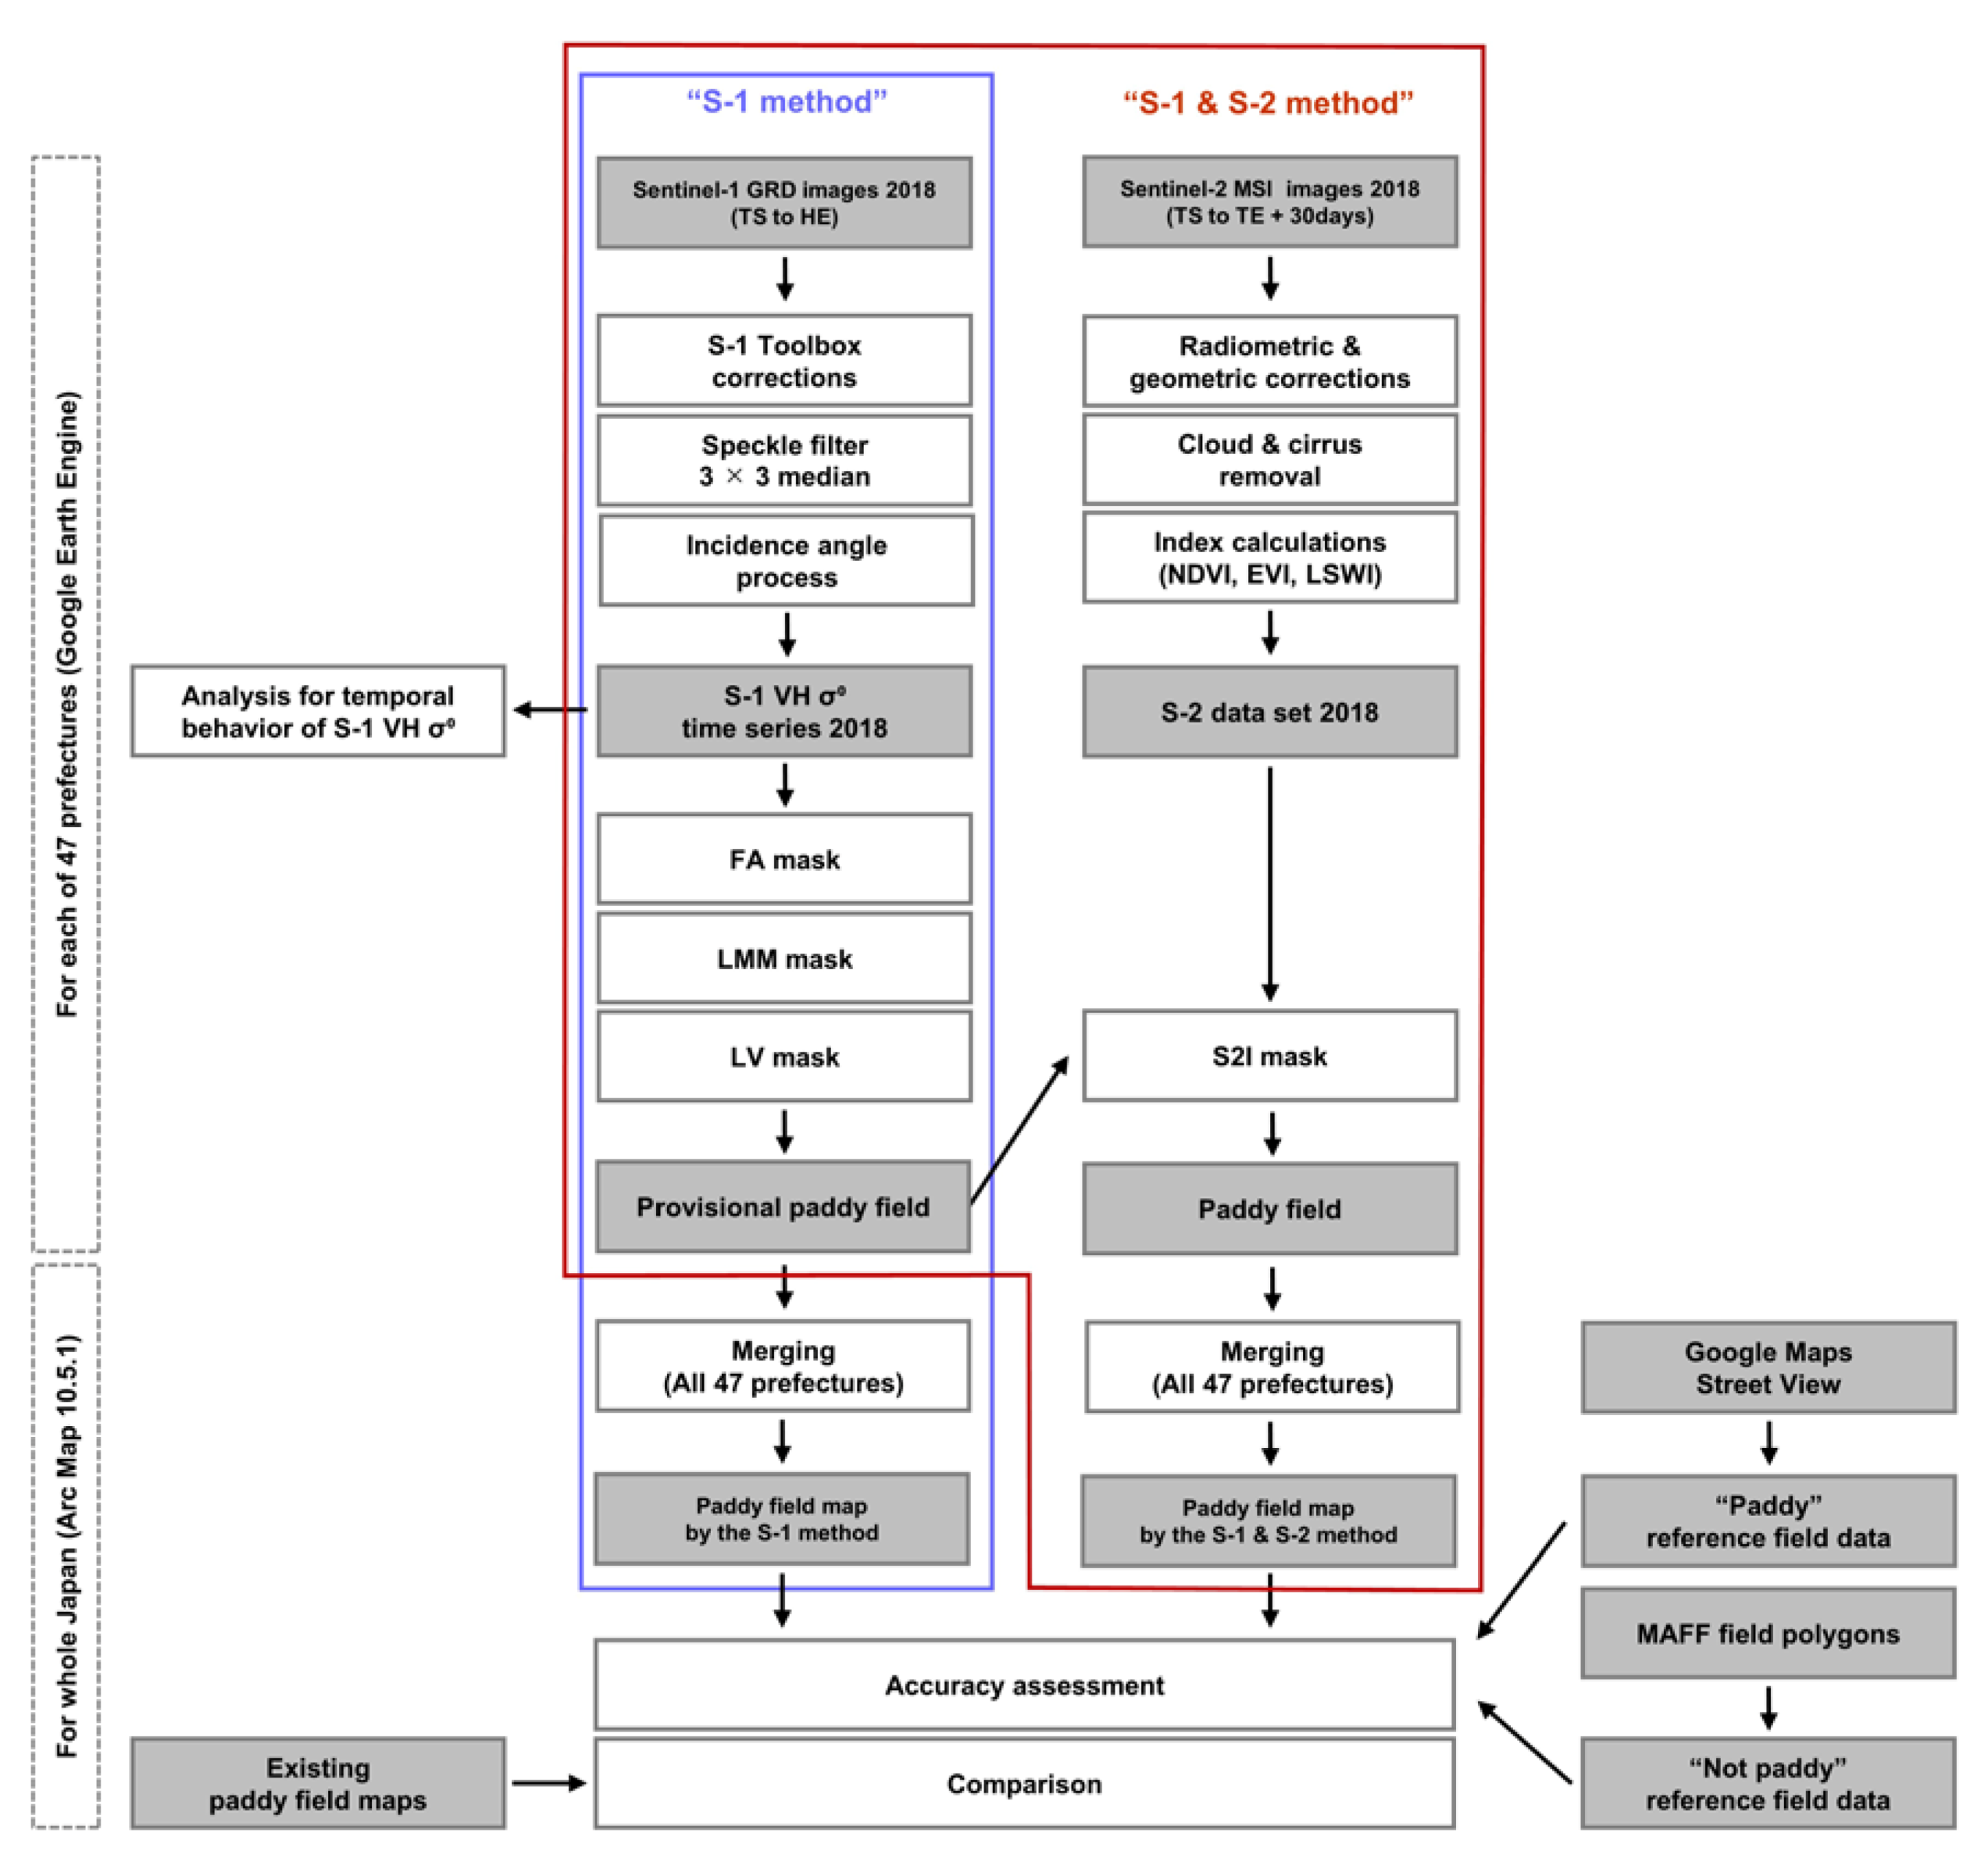
2.5. Methods
2.5.1. Preprocessing
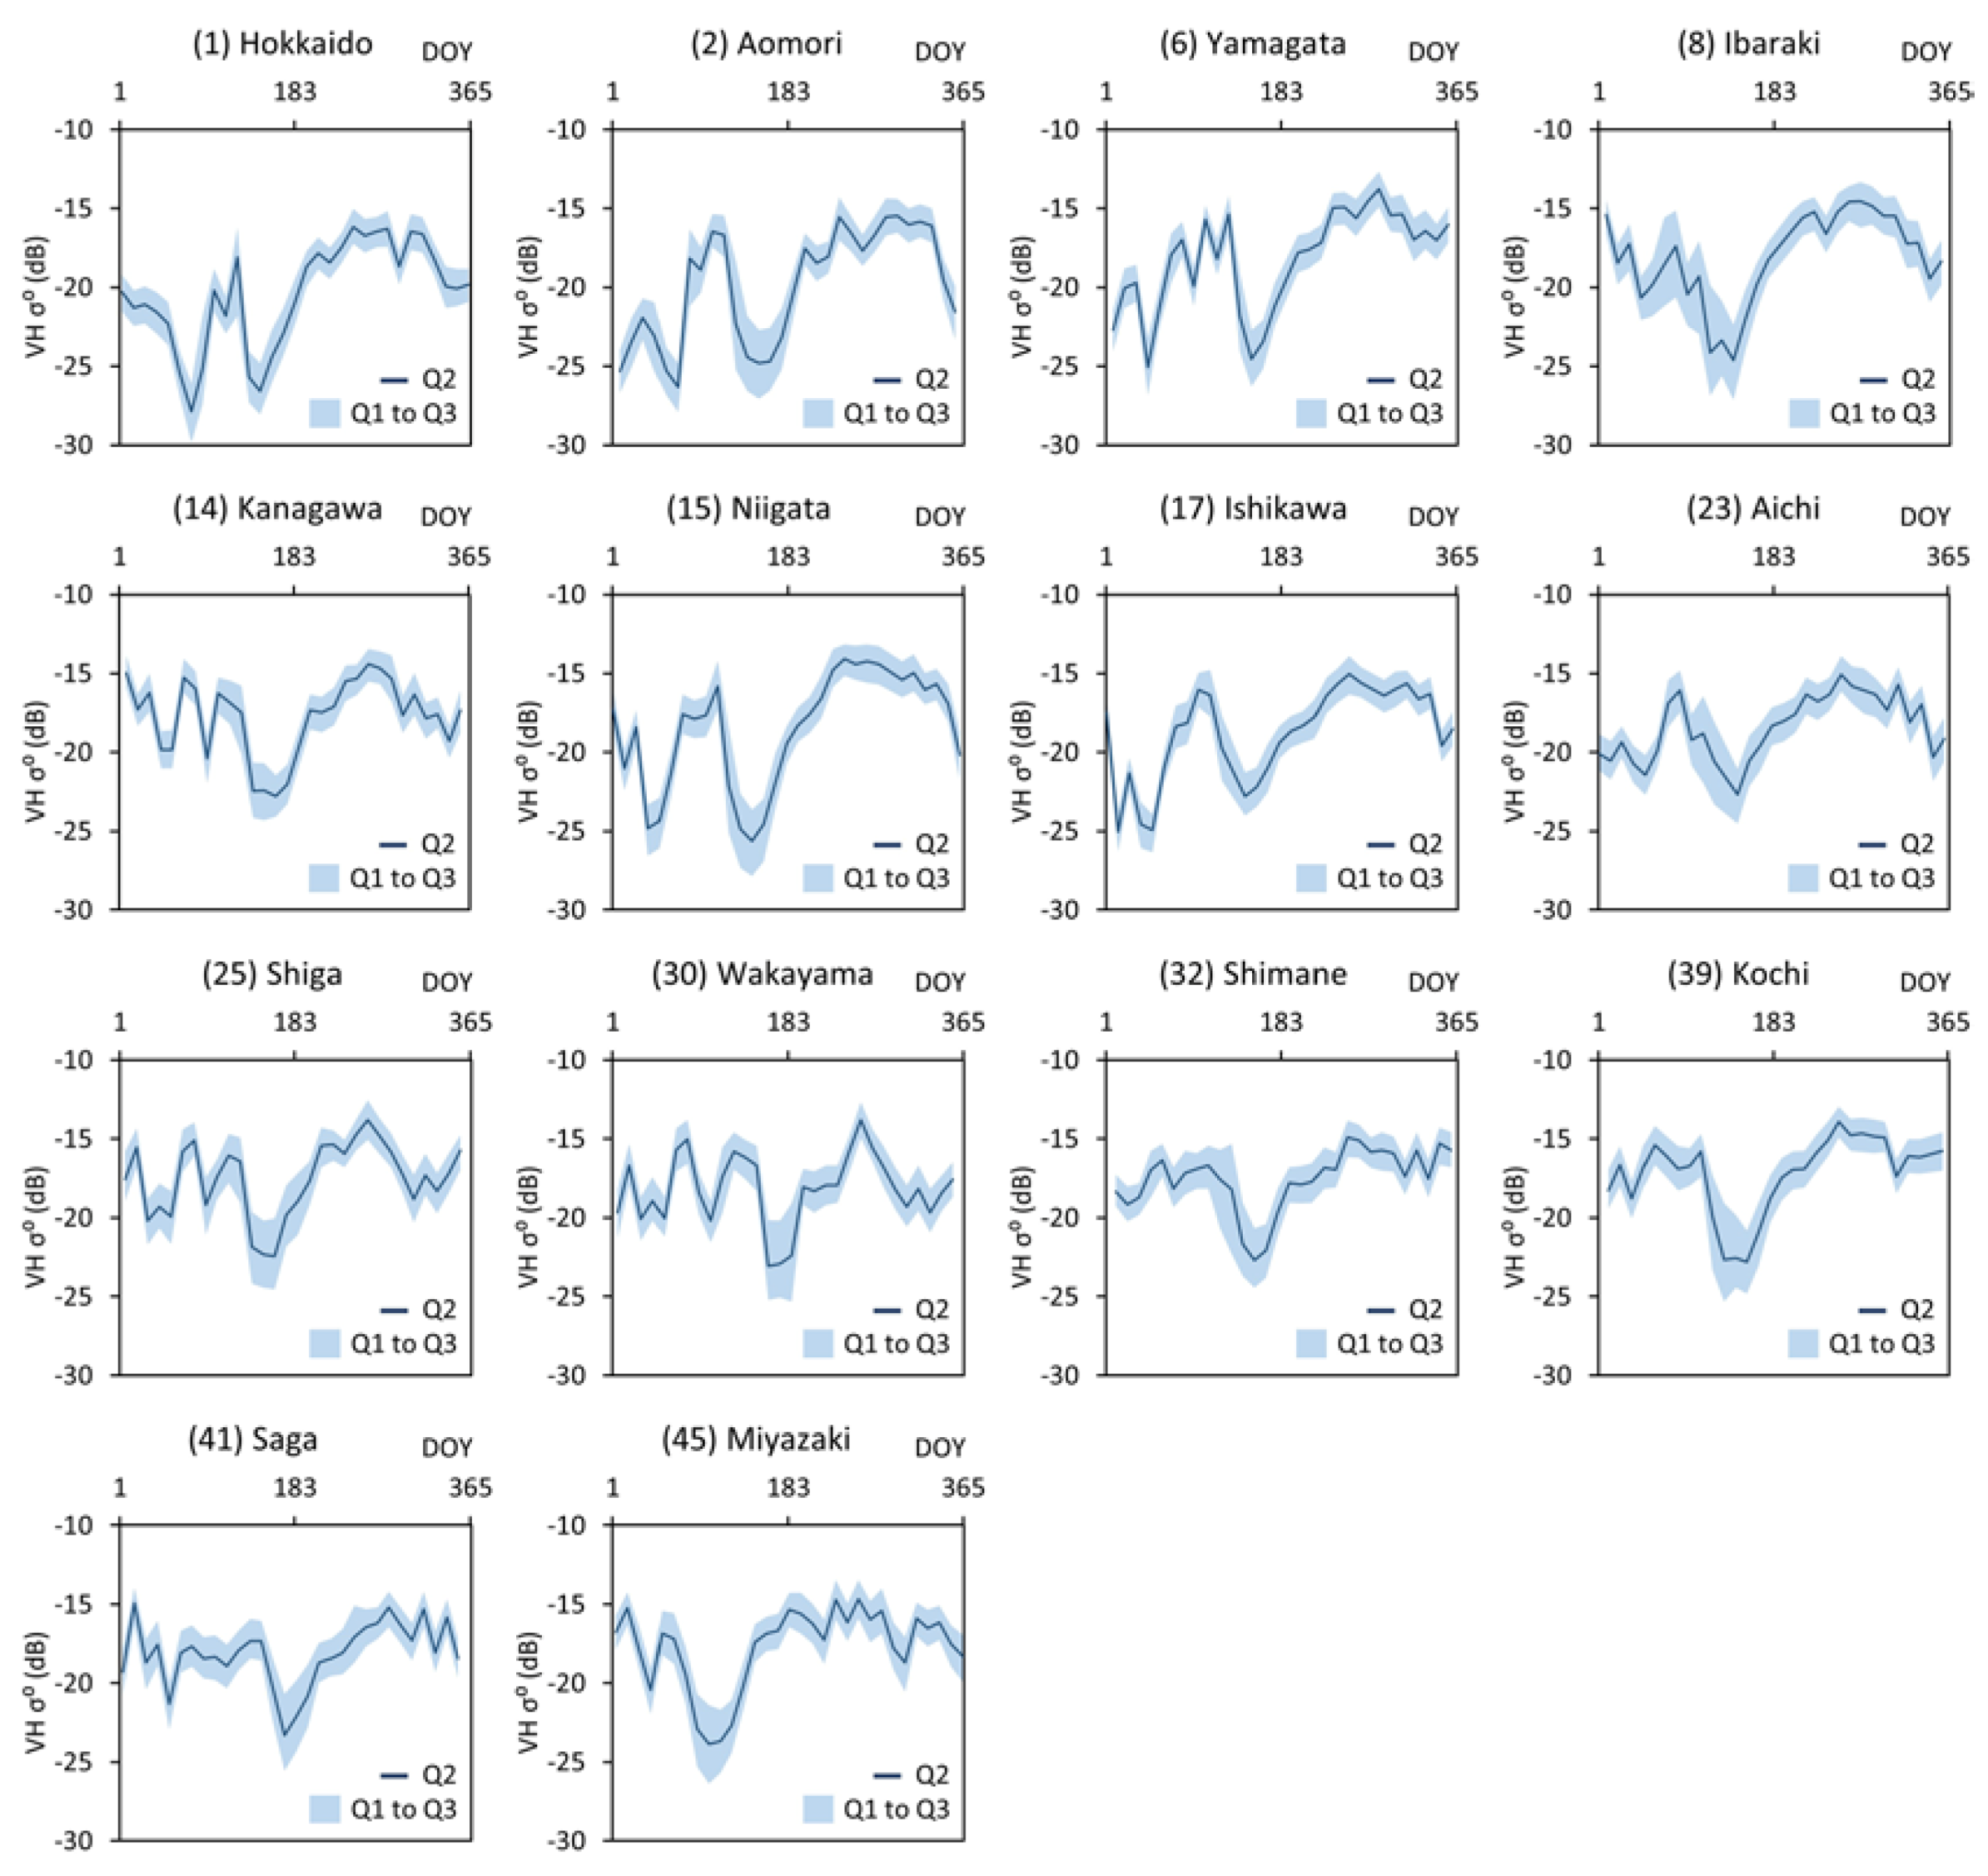
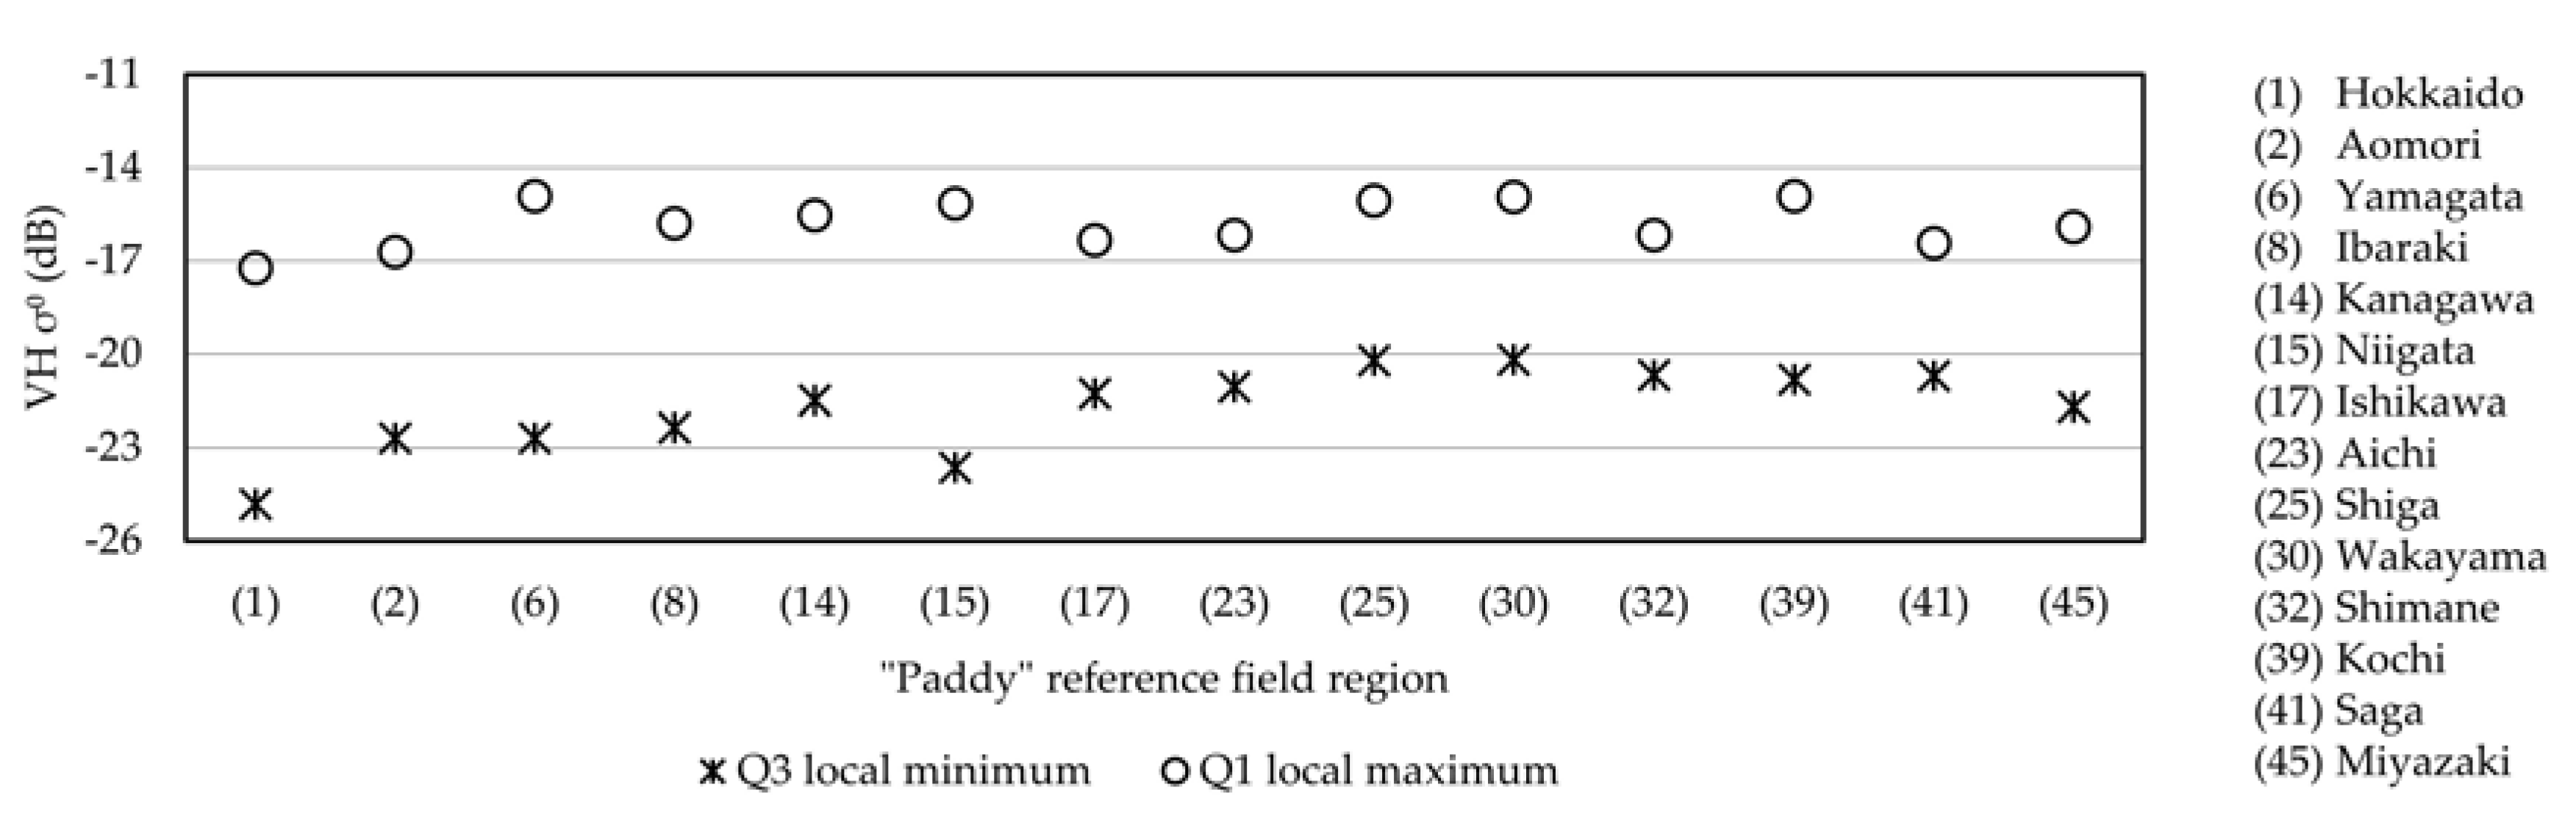
2.5.2. Analysis of the Temporal Behavior of Sentinel-1 VH σ0 Values of “Paddy” Reference Fields
2.5.3. Masks Used for Provisional Extraction of Paddy Fields
2.5.4. Mask Based on Sentinel-2 MSI Environmental Indexes
2.6. Accuracy Assessment
3. Results
3.1. Accuracy Assessments in Reference Agricultural Fields
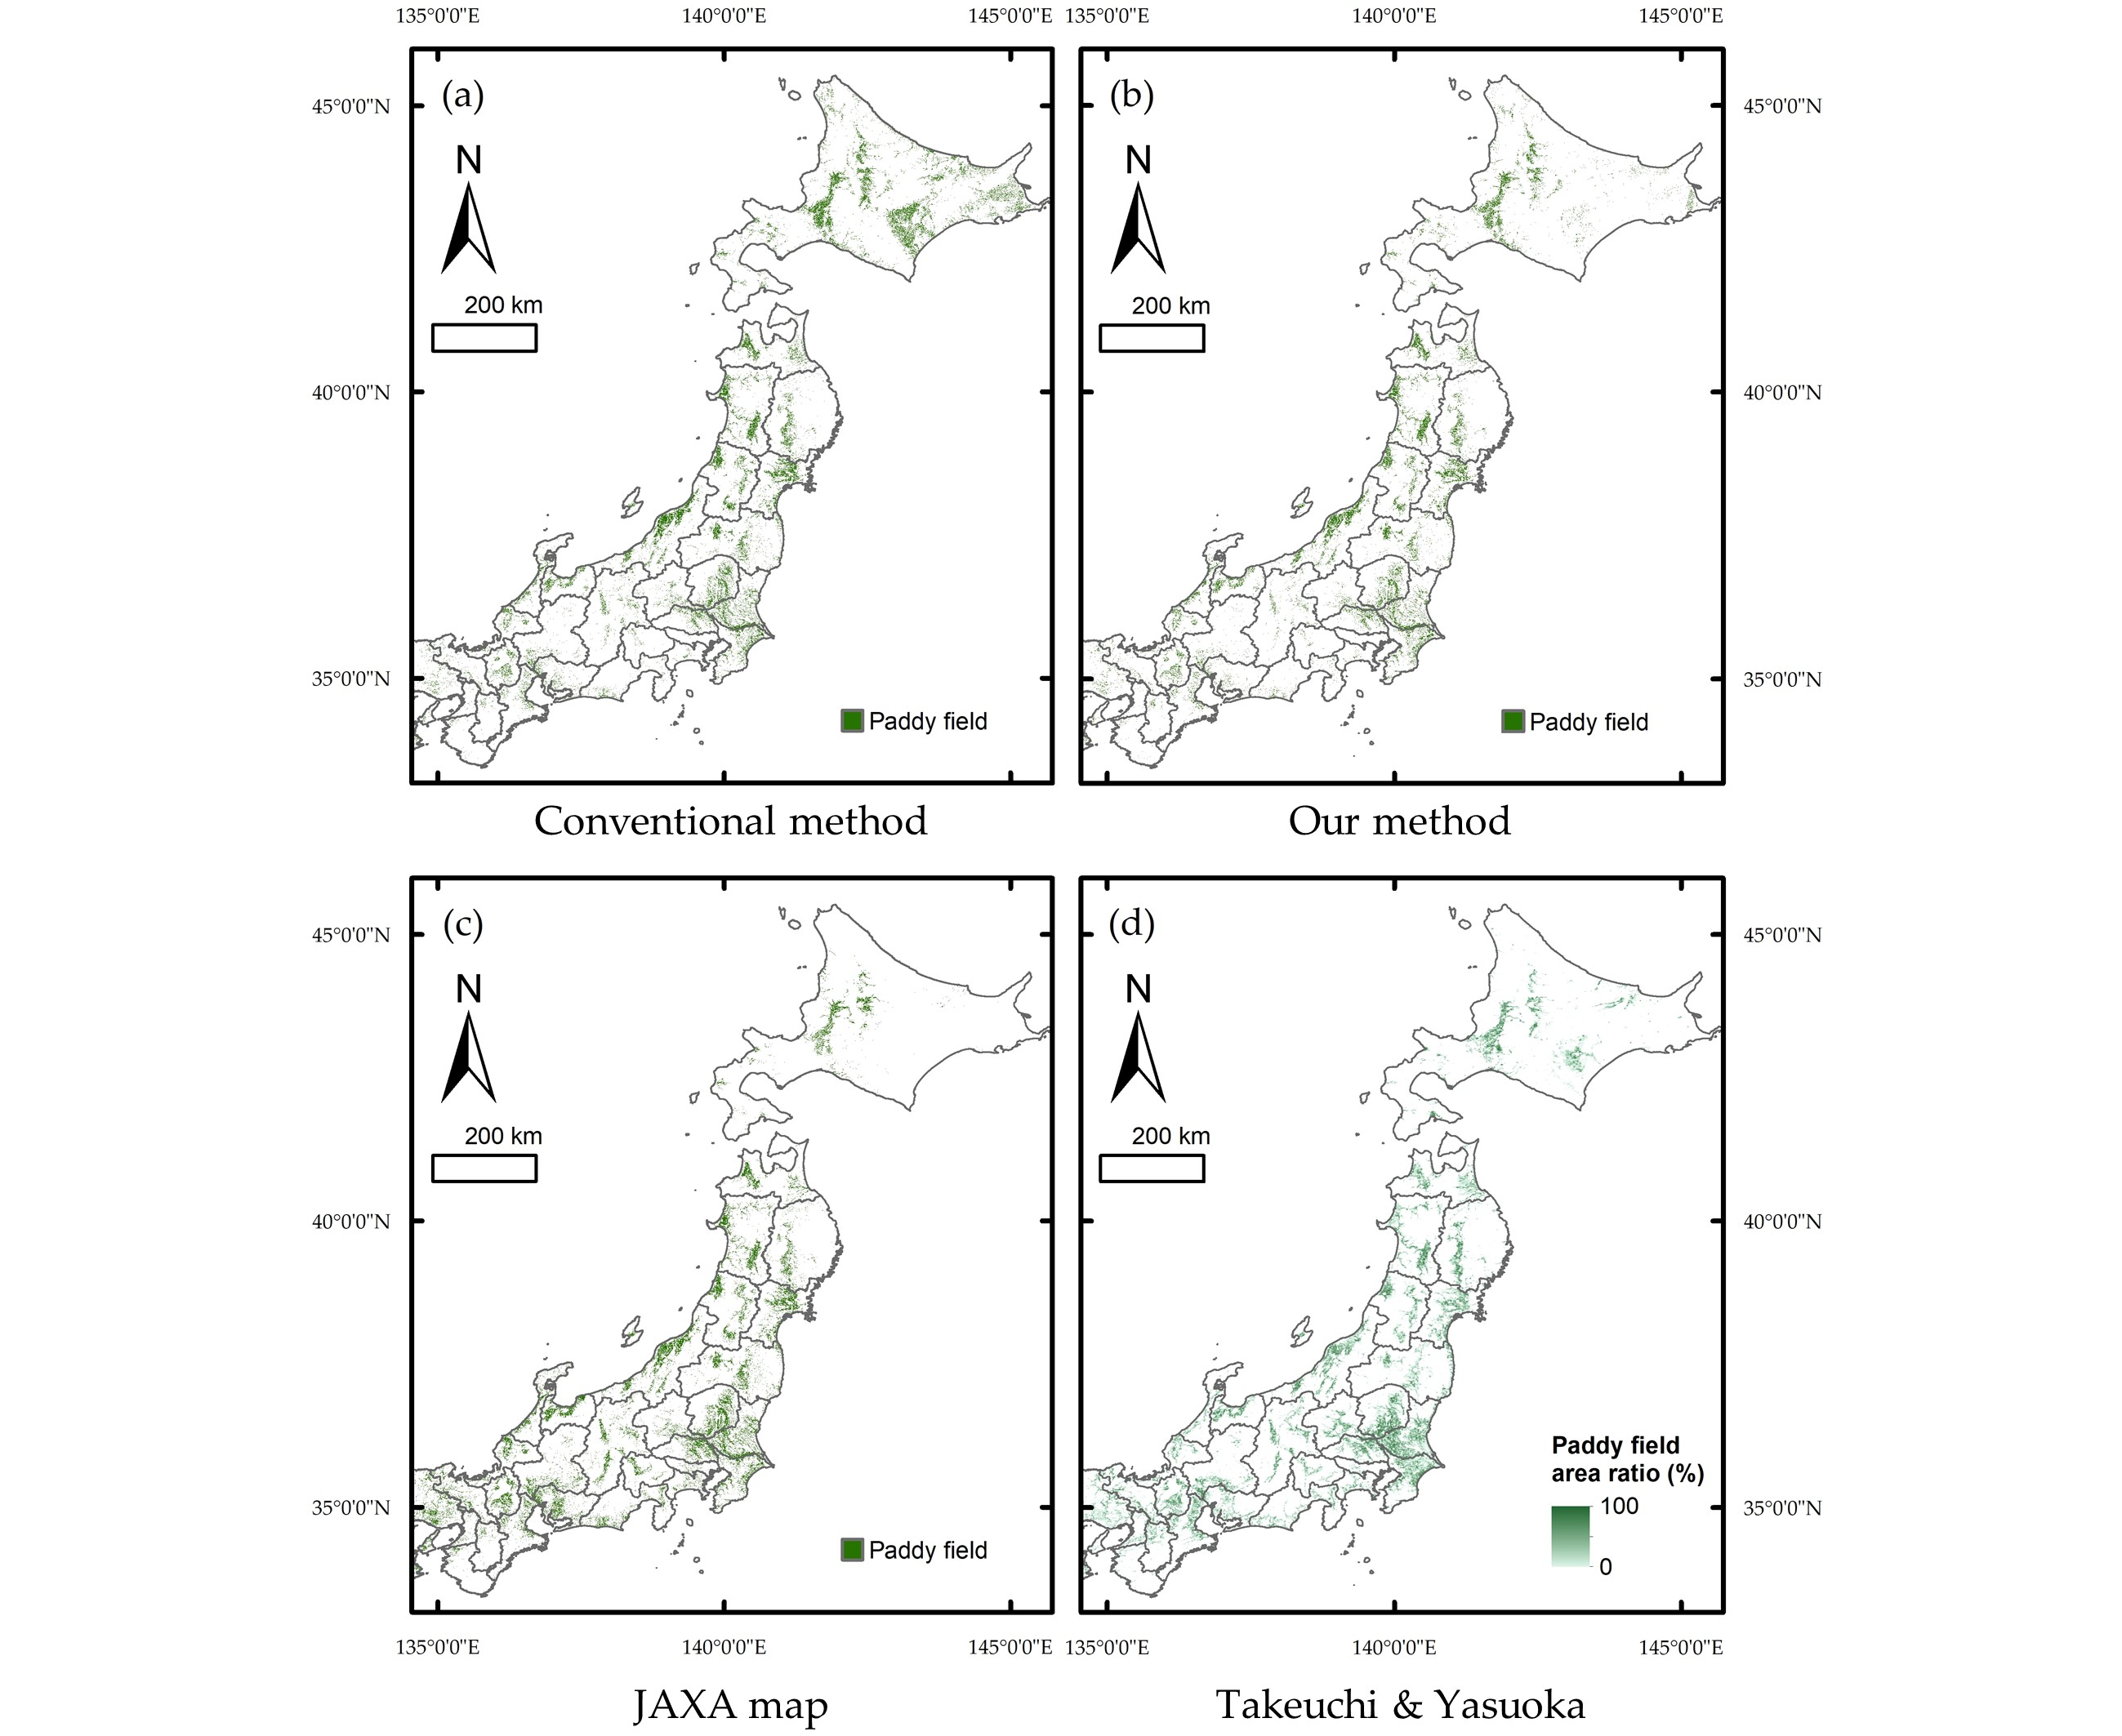
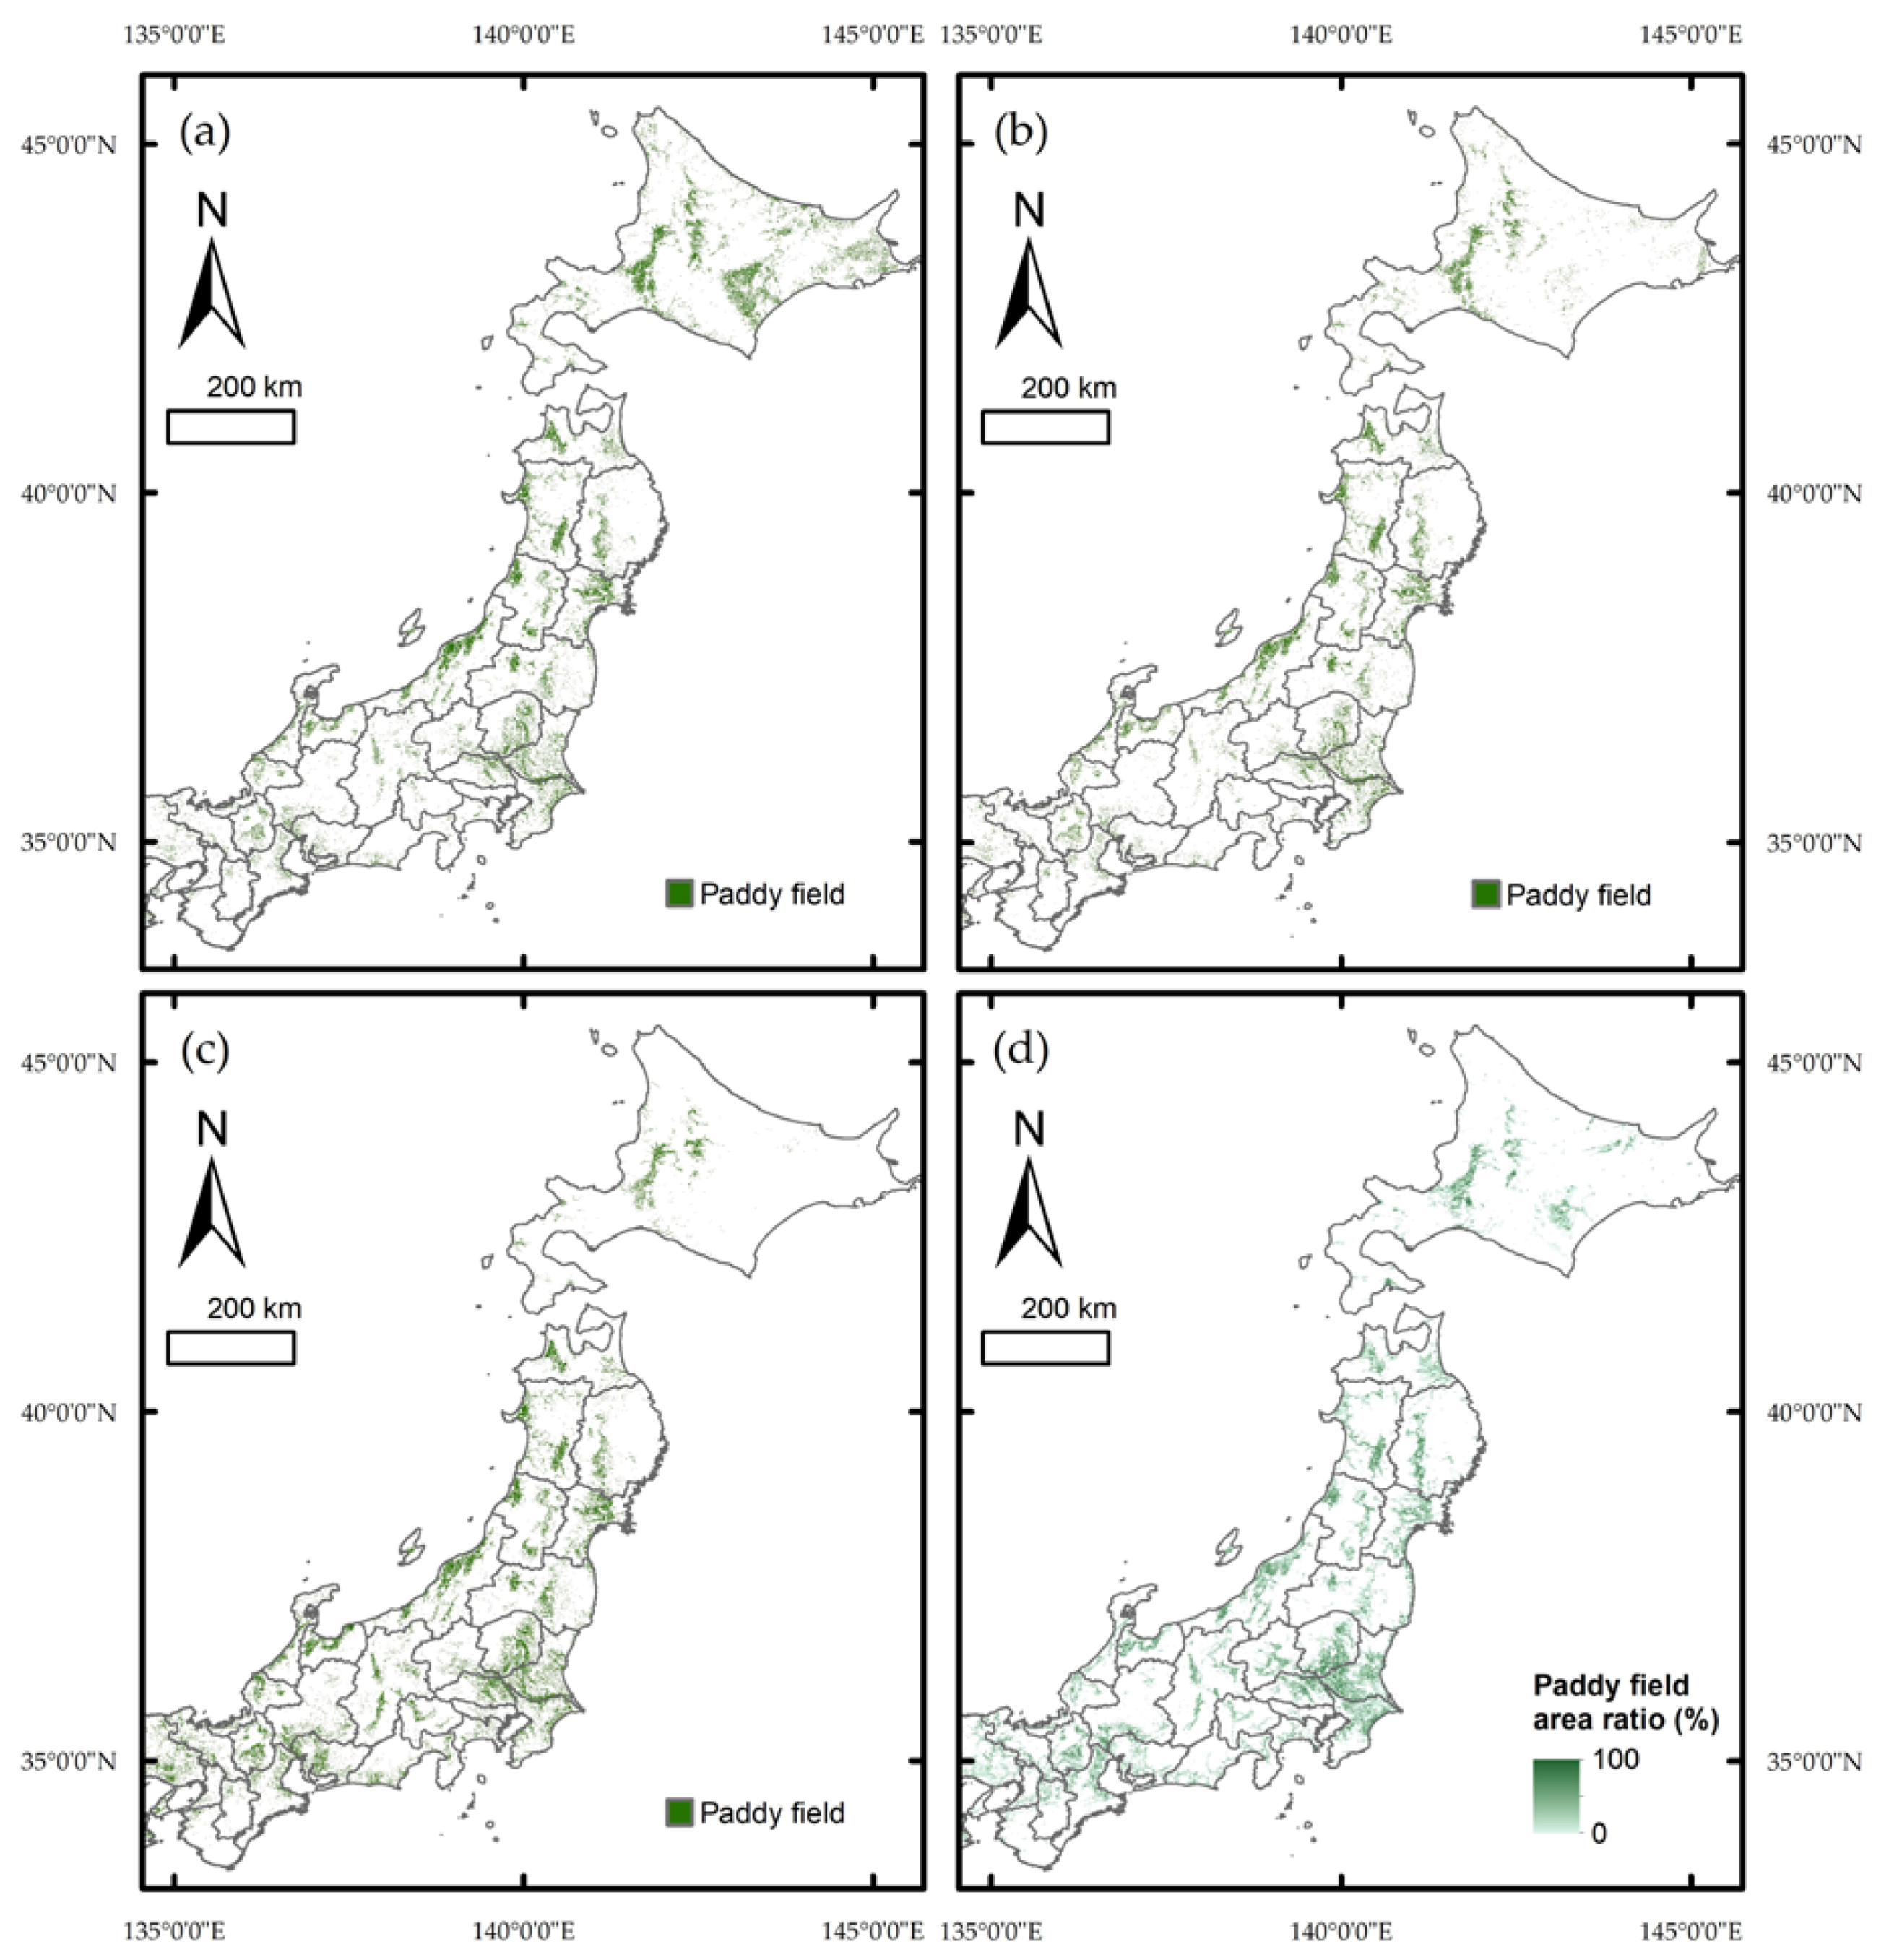
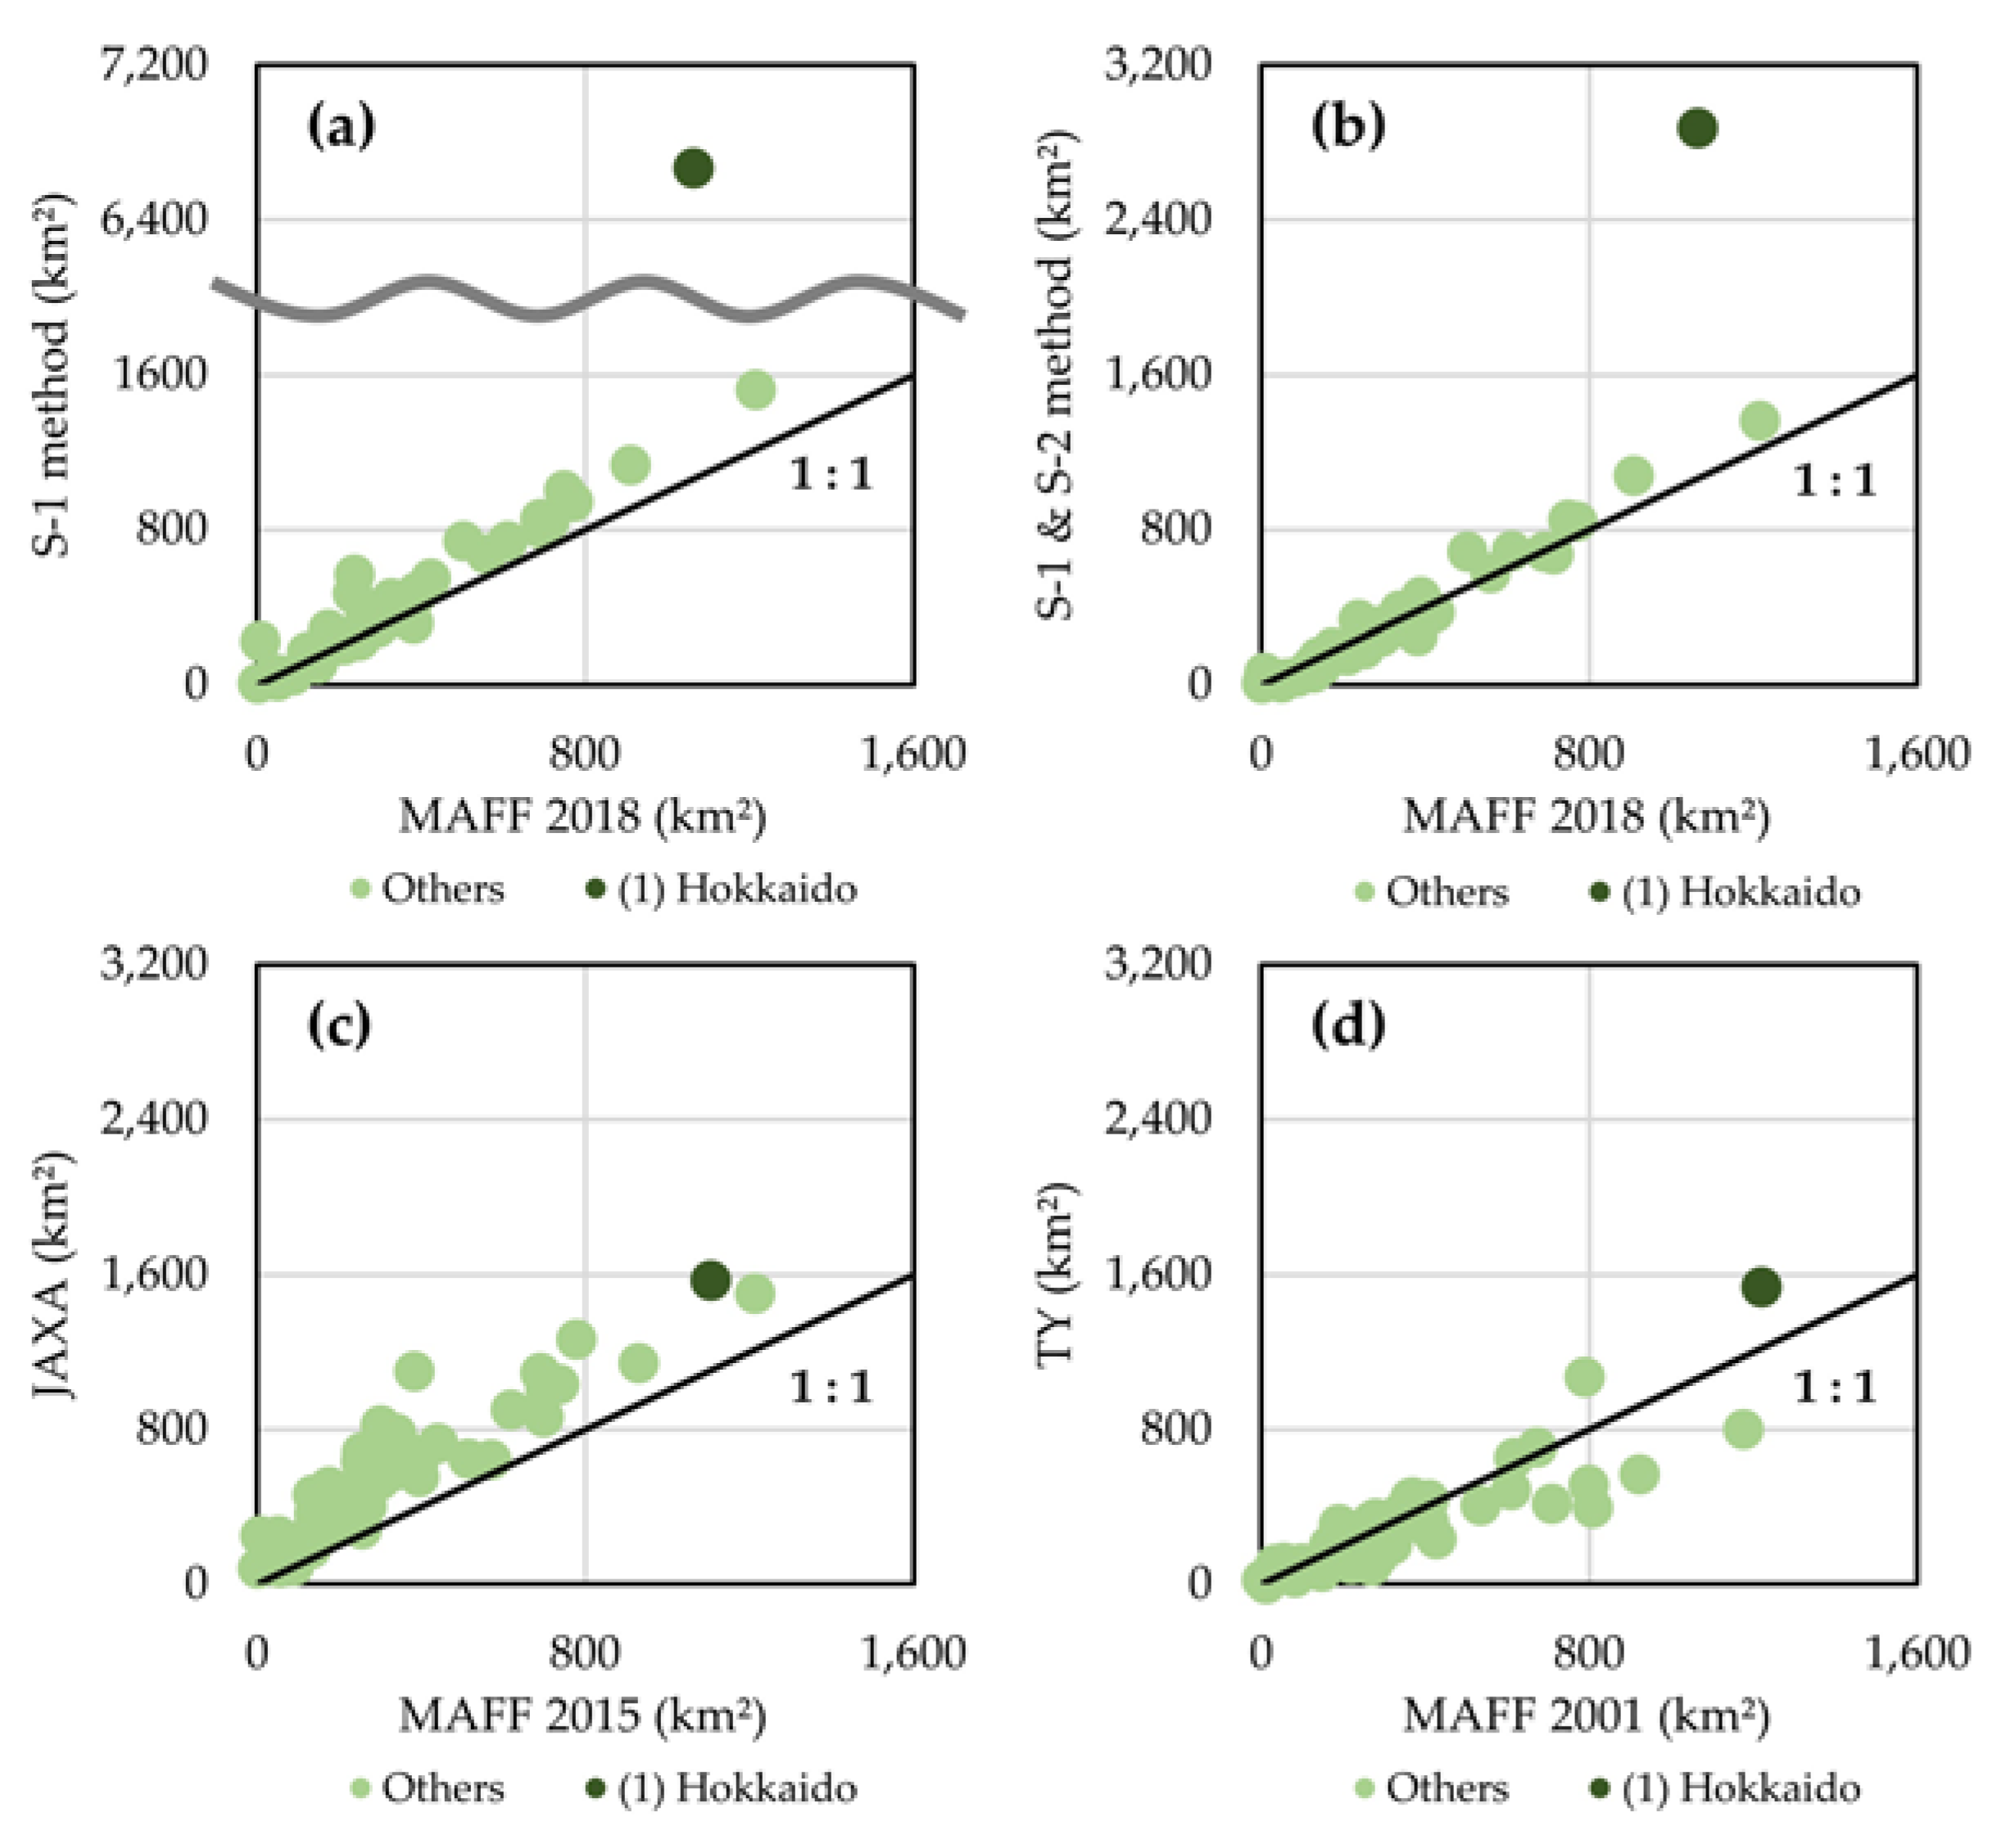
3.2. Comparison with Existing Paddy Field Maps
4. Discussion
5. Conclusions
Author Contributions
Funding
Acknowledgments
Conflicts of Interest
Appendix A

References
- Elert, E. Rice by the numbers: A good grain. Nature 2014, 514, S50–S51. [Google Scholar] [CrossRef] [PubMed]
- Bouman, B.A.M.; Humphreys, E.; Tuong, T.P.; Barker, R. Rice and Water. In Advances in Agronomy; Sparks, D.L., Ed.; Academic Press: Cambridge, MA, USA, 2007; Volume 92, pp. 187–237. [Google Scholar]
- Kiritani, K. Integrated Biodiversity Management in Paddy Fields: Shift of Paradigm from IPM toward IBM. Integr. Pest Manag. Rev. 2000, 5, 175–183. [Google Scholar] [CrossRef]
- Lu, J.; Li, X. Review of rice–fish-farming systems in China—One of the Globally Important Ingenious Agricultural Heritage Systems (GIAHS). Aquaculture 2006, 260, 106–113. [Google Scholar] [CrossRef]
- Stocker, T.F.; Qin, D.; Plattner, G.K.; Tignor, M.; Allen, S.K.; Boschung, J.; Nauels, A.; Xia, Y.; Bex, V.; Midgley, P.M. Climate Change 2013: The Physical Science Basis. In Contribution of Working Group I to the Fifth Assessment Report of the Intergovernmental Panel on Climate Change; IPCC, Cambridge University: Cambridge, MA, USA, 2013; p. 509. [Google Scholar]
- Ito, A.; Tohjima, Y.; Saito, T.; Umezawa, T.; Hajima, T.; Hirata, R.; Saito, M.; Terao, Y. Methane budget of East Asia, 1990–2015: A bottom-up evaluation. Sci. Total Environ. 2019, 676, 40–52. [Google Scholar] [CrossRef] [PubMed]
- LP DAAC—MCD12Q1. Available online: https://lpdaac.usgs.gov/products/mcd12q1v006/ (accessed on 13 May 2020).
- Thenkabail, P.S.; Knox, J.W.; Ozdogan, M.; Gumma, M.K.; Congalton, R.G.; Wu, Z.T.; Milesi, C.; Finkral, A.; Marshall, M.; Mariotto, I.; et al. Assessing future risks to agricultural productivity, water resources and food security: How can remote sensing help? PE&RS Photogramm. Eng. Remote Sens. 2012, 78, 773–782. [Google Scholar]
- Xiao, X.; Boles, S.; Liu, J.; Zhuang, D.; Frolking, S.; Li, C.; Salas, W.; Moore, B. Mapping paddy rice agriculture in southern China using multi-temporal MODIS images. Remote Sens. Environ. 2005, 95, 480–492. [Google Scholar] [CrossRef]
- Xiao, X.; Boles, S.; Frolking, S.; Li, C.; Babu, J.Y.; Salas, W.; Moore, B. Mapping paddy rice agriculture in South and Southeast Asia using multi-temporal MODIS images. Remote Sens. Environ. 2006, 100, 95–113. [Google Scholar] [CrossRef]
- Clauss, K.; Yan, H.; Kuenzer, C. Mapping Paddy Rice in China in 2002, 2005, 2010 and 2014 with MODIS Time Series. Remote Sens. 2016, 8, 434. [Google Scholar] [CrossRef]
- Ozdogan, M.; Gutman, G. A new methodology to map irrigated areas using multi-temporal MODIS and ancillary data: An application example in the continental US. Remote Sens. Environ. 2008, 112, 3520–3537. [Google Scholar] [CrossRef]
- Sun, H.; Huang, J.; Huete, A.R.; Peng, D.; Zhang, F. Mapping paddy rice with multi-date moderate-resolution imaging spectroradiometer (MODIS) data in China. J. Zhejiang Univ.-Sci. A 2009, 10, 1509–1522. [Google Scholar] [CrossRef]
- Zhang, G.; Xiao, X.; Biradar, C.M.; Dong, J.; Qin, Y.; Menarguez, M.A.; Zhou, Y.; Zhang, Y.; Jin, C.; Wang, J.; et al. Spatiotemporal patterns of paddy rice croplands in China and India from 2000 to 2015. Sci. Total Environ. 2017, 579, 82–92. [Google Scholar] [CrossRef] [PubMed]
- Takeuchi, W.; Yasuoka, Y. Mapping of fractional coverage of paddy fields over East Asia using MODIS data. J. Jpn. Soc. Photogramm. Remote Sens. 2004, 43, 20–33. [Google Scholar] [CrossRef]
- Takeuchi, W.; Yasuoka, Y. 11 Subpixel Mapping of Rice Paddy Fields over Asia Using MODIS Time Series. Remote Sens. Glob. Crop. Food Secur. 2009, 2009, 281–296. [Google Scholar]
- Dong, J.; Xiao, X.; Menarguez, M.A.; Zhang, G.; Qin, Y.; Thau, D.; Biradar, C.; Moore, B. Mapping paddy rice planting area in northeastern Asia with Landsat 8 images, phenology-based algorithm and Google Earth Engine. Remote Sens. Environ. 2016, 185, 142–154. [Google Scholar] [CrossRef] [PubMed]
- Xiong, J.; Thenkabail, P.S.; Gumma, M.K.; Teluguntla, P.; Poehnelt, J.; Congalton, R.G.; Yadav, K.; Thau, D. Automated cropland mapping of continental Africa using Google Earth Engine cloud computing. ISPRS J. Photogramm. Remote Sens. 2017, 126, 225–244. [Google Scholar] [CrossRef]
- Zhang, X.; Wu, B.; Ponce-Campos, G.E.; Zhang, M.; Chang, S.; Tian, F. Mapping up-to-Date Paddy Rice Extent at 10 M Resolution in China through the Integration of Optical and Synthetic Aperture Radar Images. Remote Sens. 2018, 10, 1200. [Google Scholar] [CrossRef]
- Gorelick, N.; Hancher, M.; Dixon, M.; Ilyushchenko, S.; Thau, D.; Moore, R. Google Earth Engine: Planetary-scale geospatial analysis for everyone. Remote Sens. Environ. 2017, 202, 18–27. [Google Scholar] [CrossRef]
- Torbick, N.; Chowdhury, D.; Salas, W.; Qi, J. Monitoring Rice Agriculture across Myanmar Using Time Series Sentinel-1 Assisted by Landsat-8 and PALSAR-2. Remote Sens. 2017, 9, 119. [Google Scholar] [CrossRef]
- Onojeghuo, A.O.; Blackburn, G.A.; Wang, Q.; Atkinson, P.M.; Kindred, D.; Miao, Y. Mapping paddy rice fields by applying machine learning algorithms to multi-temporal Sentinel-1A and Landsat data. Int. J. Remote Sens. 2018, 39, 1042–1067. [Google Scholar] [CrossRef]
- Minh, H.V.T.; Avtar, R.; Mohan, G.; Misra, P.; Kurasaki, M. Monitoring and Mapping of Rice Cropping Pattern in Flooding Area in the Vietnamese Mekong Delta Using Sentinel-1A Data: A Case of An Giang Province. ISPRS Int. J. Geo-Inf. 2019, 8, 211. [Google Scholar] [CrossRef]
- Tian, H.; Wu, M.; Wang, L.; Niu, Z. Mapping Early, Middle and Late Rice Extent Using Sentinel-1A and Landsat-8 Data in the Poyang Lake Plain, China. Sensors 2018, 18, 185. [Google Scholar] [CrossRef]
- Nguyen, D.B.; Gruber, A.; Wagner, W. Mapping rice extent and cropping scheme in the Mekong Delta using Sentinel-1A data. Remote Sens. Lett. 2016, 7, 1209–1218. [Google Scholar] [CrossRef]
- Clauss, K.; Ottinger, M.; Kuenzer, C. Mapping rice areas with Sentinel-1 time series and superpixel segmentation. Int. J. Remote Sens. 2018, 39, 1399–1420. [Google Scholar] [CrossRef]
- Bazzi, H.; Baghdadi, N.; El Hajj, M.; Zribi, M.; Minh, D.H.T.; Ndikumana, E.; Courault, D.; Belhouchette, H. Mapping Paddy Rice Using Sentinel-1 SAR Time Series in Camargue, France. Remote Sens. 2019, 11, 887. [Google Scholar] [CrossRef]
- Mandal, D.; Kumar, V.; Bhattacharya, A.; Rao, Y.S.; Siqueira, P.; Bera, S. Sen4Rice: A Processing Chain for Differentiating Early and Late Transplanted Rice Using Time-Series Sentinel-1 SAR Data with Google Earth Engine. IEEE Geosci. Remote Sens. Lett. 2018, 15, 1947–1951. [Google Scholar] [CrossRef]
- Singha, M.; Dong, J.; Zhang, G.; Xiao, X. High resolution paddy rice maps in cloud-prone Bangladesh and Northeast India using Sentinel-1 data. Sci. Data 2019, 6, 1–10. [Google Scholar] [CrossRef]
- Mansaray, L.R.; Huang, W.; Zhang, D.; Huang, J.; Li, J. Mapping Rice Fields in Urban Shanghai, Southeast China, Using Sentinel-1A and Landsat 8 Datasets. Remote Sens. 2017, 9, 257. [Google Scholar] [CrossRef]
- FAOSTAT. Available online: http://www.fao.org/faostat/en/#data/QC (accessed on 13 May 2020).
- E-Stat. Available online: https://www.e-stat.go.jp/stat-search/?page=1 (accessed on 13 May 2020).
- MAFF. Available online: https://www.maff.go.jp/j/study/suito_sakugara/ (accessed on 13 May 2020).
- ESA. Available online: https://earth.esa.int/web/guest/home (accessed on 13 May 2020).
- Li, X.; Zhang, C.; Li, W. Building block level urban land-use information retrieval based on Google Street View images. GIScience Remote Sens. 2017, 54, 819–835. [Google Scholar] [CrossRef]
- Berland, A.; Lange, D.A. Google Street View shows promise for virtual street tree surveys. Urban For. Urban Green. 2017, 21, 11–15. [Google Scholar] [CrossRef]
- Oda, K.; Rupprecht, C.D.D.; Tsuchiya, K.; McGreevy, S.R. Urban Agriculture as a Sustainability Transition Strategy for Shrinking Cities? Land Use Change Trajectory as an Obstacle in Kyoto City, Japan. Sustainability 2018, 10, 1048. [Google Scholar] [CrossRef]
- JAXA ALOS Projects. Available online: https://www.eorc.jaxa.jp/ALOS/lulc/lulc_jindex.htm (accessed on 13 May 2020).
- Hansen, M.C.; Potapov, P.V.; Moore, R.; Hancher, M.; Turubanova, S.A.; Tyukavina, A.; Thau, D.; Stehman, S.V.; Goetz, S.J.; Loveland, T.R.; et al. High-Resolution Global Maps of 21st-Century Forest Cover Change. Science 2013, 342, 850–853. [Google Scholar] [CrossRef] [PubMed]
- Chandrasekar, K.; Sai, M.V.R.S.; Roy, P.S.; Dwevedi, R.S. Land Surface Water Index (LSWI) response to rainfall and NDVI using the MODIS Vegetation Index product. Int. J. Remote Sens. 2010, 31, 3987–4005. [Google Scholar] [CrossRef]
- Carlson, T.N.; Ripley, D.A. On the relation between NDVI, fractional vegetation cover, and leaf area index. Remote Sens. Environ. 1997, 62, 241–252. [Google Scholar] [CrossRef]
- Huete, A.; Didan, K.; Miura, T.; Rodriguez, E.P.; Gao, X.; Ferreira, L.G. Overview of the radiometric and biophysical performance of the MODIS vegetation indices. Remote Sens. Environ. 2002, 83, 195–213. [Google Scholar] [CrossRef]
- Jin, C.; Xiao, X.; Dong, J.; Qin, Y.; Wang, Z. Mapping paddy rice distribution using multi-temporal Landsat imagery in the Sanjiang Plain, northeast China. Front. Earth Sci. 2016, 10, 49–62. [Google Scholar] [CrossRef] [PubMed]
- Story, M.; Congalton, R.G. Accuracy assessment: A user’s perspective. Photogramm. Eng. Remote Sens. 1986, 52, 397–399. [Google Scholar]
- MAFF. Available online: https://www.maff.go.jp/j/wpaper/w_maff/h22_h/trend/part1/chap2/c7_01_05.html (accessed on 13 May 2020).


| Sensor | Provider | Band | Resolution | Wavelength | Use | |
|---|---|---|---|---|---|---|
| Satellite data | Sentinel-1 SAR | ESA | C (VH) | 10 m | Interferometric Wide Mode | |
| Sentinel-2 MSI | ESA | B2 | 10 m | 490 nm | Blue | |
| B4 | 10 m | 665 nm | Red | |||
| B8 | 10 m | 842 nm | Near-infrared | |||
| B11 | 20 m | 1610 nm | Short-wave infrared 1 |
| Method | (1) | (2) | (6) | (8) | (14) | (15) | (17) |
|---|---|---|---|---|---|---|---|
| Hokkaido | Aomori | Yamagata | Ibaraki | Kanagawa | Niigata | Ishikawa | |
| S-1 | 81.7% | 84.5% | 86.6% | 92.9% | 98.2% | 100.0% | 70.9% |
| S-1& S-2 | 77.1% | 84.5% | 79.2% | 91.1% | 98.2% | 98.3% | 70.9% |
| Method | (23) | (25) | (30) | (32) | (39) | (41) | (45) |
| Aichi | Shiga | Wakayama | Shimane | Kochi | Saga | Miyazaki | |
| S-1 | 68.6% | 77.4% | 76.1% | 84.9% | 82.3% | 75.3% | 91.1% |
| S-1& S-2 | 68.1% | 74.8% | 70.3% | 76.1% | 79.5% | 70.3% | 74.8% |
| Method | (a) | (b) | (c) | (d) | (e) | (f) |
|---|---|---|---|---|---|---|
| Obihiro | Shihoro | Shibecha | Betsukai | Kiyosato | Koshimizu | |
| S-1 | 47.5% | 78.4% | 71.6% | 29.6% | 64.8% | 58.4% |
| S-1& S-2 | 97.1% | 93.2% | 94.9% | 90.7% | 97.6% | 88.0% |
| All of Japan | Excluding Hokkaido | ||||
|---|---|---|---|---|---|
| S-1 | S-1 & S-2 | JAXA | TY | S-1 & S-2 | |
| Slope | 1.87 | 1.26 | 1.50 | 0.86 | 1.06 |
| R2 | 1.87 | 1.26 | 1.50 | 0.86 | 1.06 |
| MSE (km2 × km2) | 682,924 | 73,513 | 77,310 | 23,474 | 3894 |
© 2020 by the authors. Licensee MDPI, Basel, Switzerland. This article is an open access article distributed under the terms and conditions of the Creative Commons Attribution (CC BY) license (http://creativecommons.org/licenses/by/4.0/).
Share and Cite
Inoue, S.; Ito, A.; Yonezawa, C. Mapping Paddy Fields in Japan by Using a Sentinel-1 SAR Time Series Supplemented by Sentinel-2 Images on Google Earth Engine. Remote Sens. 2020, 12, 1622. https://doi.org/10.3390/rs12101622
Inoue S, Ito A, Yonezawa C. Mapping Paddy Fields in Japan by Using a Sentinel-1 SAR Time Series Supplemented by Sentinel-2 Images on Google Earth Engine. Remote Sensing. 2020; 12(10):1622. https://doi.org/10.3390/rs12101622
Chicago/Turabian StyleInoue, Shimpei, Akihiko Ito, and Chinatsu Yonezawa. 2020. "Mapping Paddy Fields in Japan by Using a Sentinel-1 SAR Time Series Supplemented by Sentinel-2 Images on Google Earth Engine" Remote Sensing 12, no. 10: 1622. https://doi.org/10.3390/rs12101622
APA StyleInoue, S., Ito, A., & Yonezawa, C. (2020). Mapping Paddy Fields in Japan by Using a Sentinel-1 SAR Time Series Supplemented by Sentinel-2 Images on Google Earth Engine. Remote Sensing, 12(10), 1622. https://doi.org/10.3390/rs12101622