Article

Evaluating Elevation Change Thresholds between Structure-from-Motion DEMs Derived from Historical Aerial Photos and 3DEP LiDAR Data

1
U.S. Geological Survey, Florence Bascom Geoscience Center, Reston, VA 20192, USA
2
Natural Systems Analysts, Inc. contracted to the U.S. Geological Survey, Florence Bascom Geoscience Center, Reston, VA 20192, USA
*
Author to whom correspondence should be addressed.
Remote Sens. 2020, 12(10), 1625; https://doi.org/10.3390/rs12101625
Submission received: 1 April 2020 / Revised: 6 May 2020 / Accepted: 15 May 2020 / Published: 19 May 2020
(This article belongs to the Special Issue Environmental Monitoring and Mapping Using 3D Elevation Program Data)

Abstract

:
This study created digital terrain models (DTMs) from historical aerial images using Structure from Motion (SfM) for a variety of image dates, resolutions, and photo scales. Accuracy assessments were performed on the SfM DTMs, and they were compared to the United States Geological Survey’s three-dimensional digital elevation program (3DEP) light detection and ranging (LiDAR) DTMs to evaluate geomorphic change thresholds based on vertical accuracy assessments and elevation change methodologies. The results of this study document a relationship between historical aerial photo scales and predicted vertical accuracy of the resultant DTMs. The results may be used to assess geomorphic change thresholds over multi-decadal timescales depending on spatial scale, resolution, and accuracy requirements. This study shows that if elevation changes of approximately ±1 m are to be mapped, historical aerial photography collected at 1:20,000 scale or larger would be required for comparison to contemporary LiDAR derived DTMs.

1. Introduction

There is growing recognition of the importance of geomorphological mapping of three-dimensional (3D) change, particularly in the context of anthropogenic landscapes in urban environments [1,2,3,4,5,6,7]. One of the most significant advancements in geomorphological mapping over the past decade has been the increased availability of high-resolution digital elevation models (DEMs) produced from light detection and ranging (LiDAR) and other sources. Programs such as the United States Geological Survey’s (USGS) three-dimensional digital elevation program (3DEP) aim to achieve nation-wide LiDAR coverage through data acquisition coordinated between the USGS National Geospatial Program (NGP) and partner-funded LiDAR collections [8]. The USGS 3DEP also strives to create consistency amongst the multitude of LiDAR collects through the development of specific data quality guidelines [9]. However, since most topographic LiDAR acquisition has occurred only relatively recently (within the past 10-15 years), there are few historical elevation datasets with the spatial resolution and accuracy suitable for change detection over multi-decadal to century time-scales. Coarser-resolution DEMs are available that represent previous eras (e.g., the Shuttle Radar Topography Mission (SRTM), the Advanced Spaceborne Thermal Emission and Reflection (ASTER) Global DEM, etc.); however, there are limitations to comparing coarse-resolution DEM data with fine-resolution data to map geomorphic change [10,11,12]. Even amongst the available 3DEP LiDAR datasets there is variability in the collection parameters and thereby the quality and accuracy as well as the temporal resolution of the data.
Structure from motion (SfM) technology offers new, improved, and highly accurate techniques for image matching, triangulation, and elevation point cloud extraction from stereo aerial imagery [13,14,15], particularly where camera calibration information may be lacking. Thus, SfM software is comparitavely low cost and presents low barriers-to-entry for analytic use. SfM photogrammetry differs from traditional photogrammetric approaches by determining internal camera geometry and camera position and orientation without the need for external control points. Designed to work on image sets from video or rapid burst cameras, SfM requires a high degree of overlap between images, similar to the standard 60% endlap and 30% sidelap of traditional aerial images; however, in most cases, the overlap acquired by sets of historical aerial images is sufficient for image matching [13].
This study focused on addressing three main questions. 1. How accurate are DTMs developed from SfM DEMs using publicly avialable historical aerial photography, and are they comparable to LiDAR data? 2. What methods of comparison may be reliably used to calculate elevation change between sequential SfM DEMs and contemporary LiDAR data to ensure that observed changes are actual geomorphic changes and not the cummmulative sum of errors inherent in each DEM? 3. What relationship exisits between the vertical error inherent in output SfM DEMs and the aerial photo scale, image resolution, and image date?
To address these questions, this study created DTMs from seven sets of publicly available historical aerial imagery over the past 68 years, with varying photo scales. Accuracy assessments were performed on the SfM DTMs and were compared to 3DEP LiDAR DTMs to evaluate geomorphic change thresholds based on vertical accuracy assessments and elevation change methodologies. This study evaluated the relationship between historical aerial photo scale and predicted vertical accuracy that may be used to assess geomorphic change thresholds over multi-decadal time-scales depending on mapping accuracy requirements.

2. Study Area

This study was conducted in the Piney Branch watershed in Vienna, Virginia, a suburb of Washington D.C., located in Fairfax County (Figure 1). Piney Branch is a tributary of the Difficult Run River and ultimately the Potomac River. It is a small watershed of approximately 10 km2 with approximately 70 m of topographic relief. While native vegetation in this region is primarily mixed forest and grassy open areas, the area has been substantially modified by anthropogenic activities [7]. From the 1950s onward small farms have been replaced by urbanization and development expanding from the Washington, D.C. metropolitan area. Today, landcover in the watershed is primarily suburban, with major transportation corridors and single-family housing communities throughout.

3. Data

Data used in this study consisted of reference DEMs developed from 3DEP LiDAR point cloud source data, high-resolution orthoimagery, seven sets of historical aerial stereoscopic photographs, and the most recent, 2018, 3DEP LiDAR dataset for long-term temporal comparison. Details about each of these datasets are described in the following sections. In this paper, the term DEM refers broadly to multiple types of elevation data. The term digital surface model (DSM) is used when referring to DEMs that include vegetation, structures, and other non-ground features. Digital terrain model (DTM) is used to describe DEMs where vegetation and non-ground features have been removed either through filtering or LiDAR point-cloud classification routines.

3.1. Reference Elevation from LiDAR

At the time of this research, four different LiDAR datasets were available in the study area: 2008, 2012, 2014, and 2018. Data from 2008, 2012, and 2018 were used in this study. Table 1 provides additional details about the horizontal and vertical resolution and an explanation of how each dataset was used in this project [9].
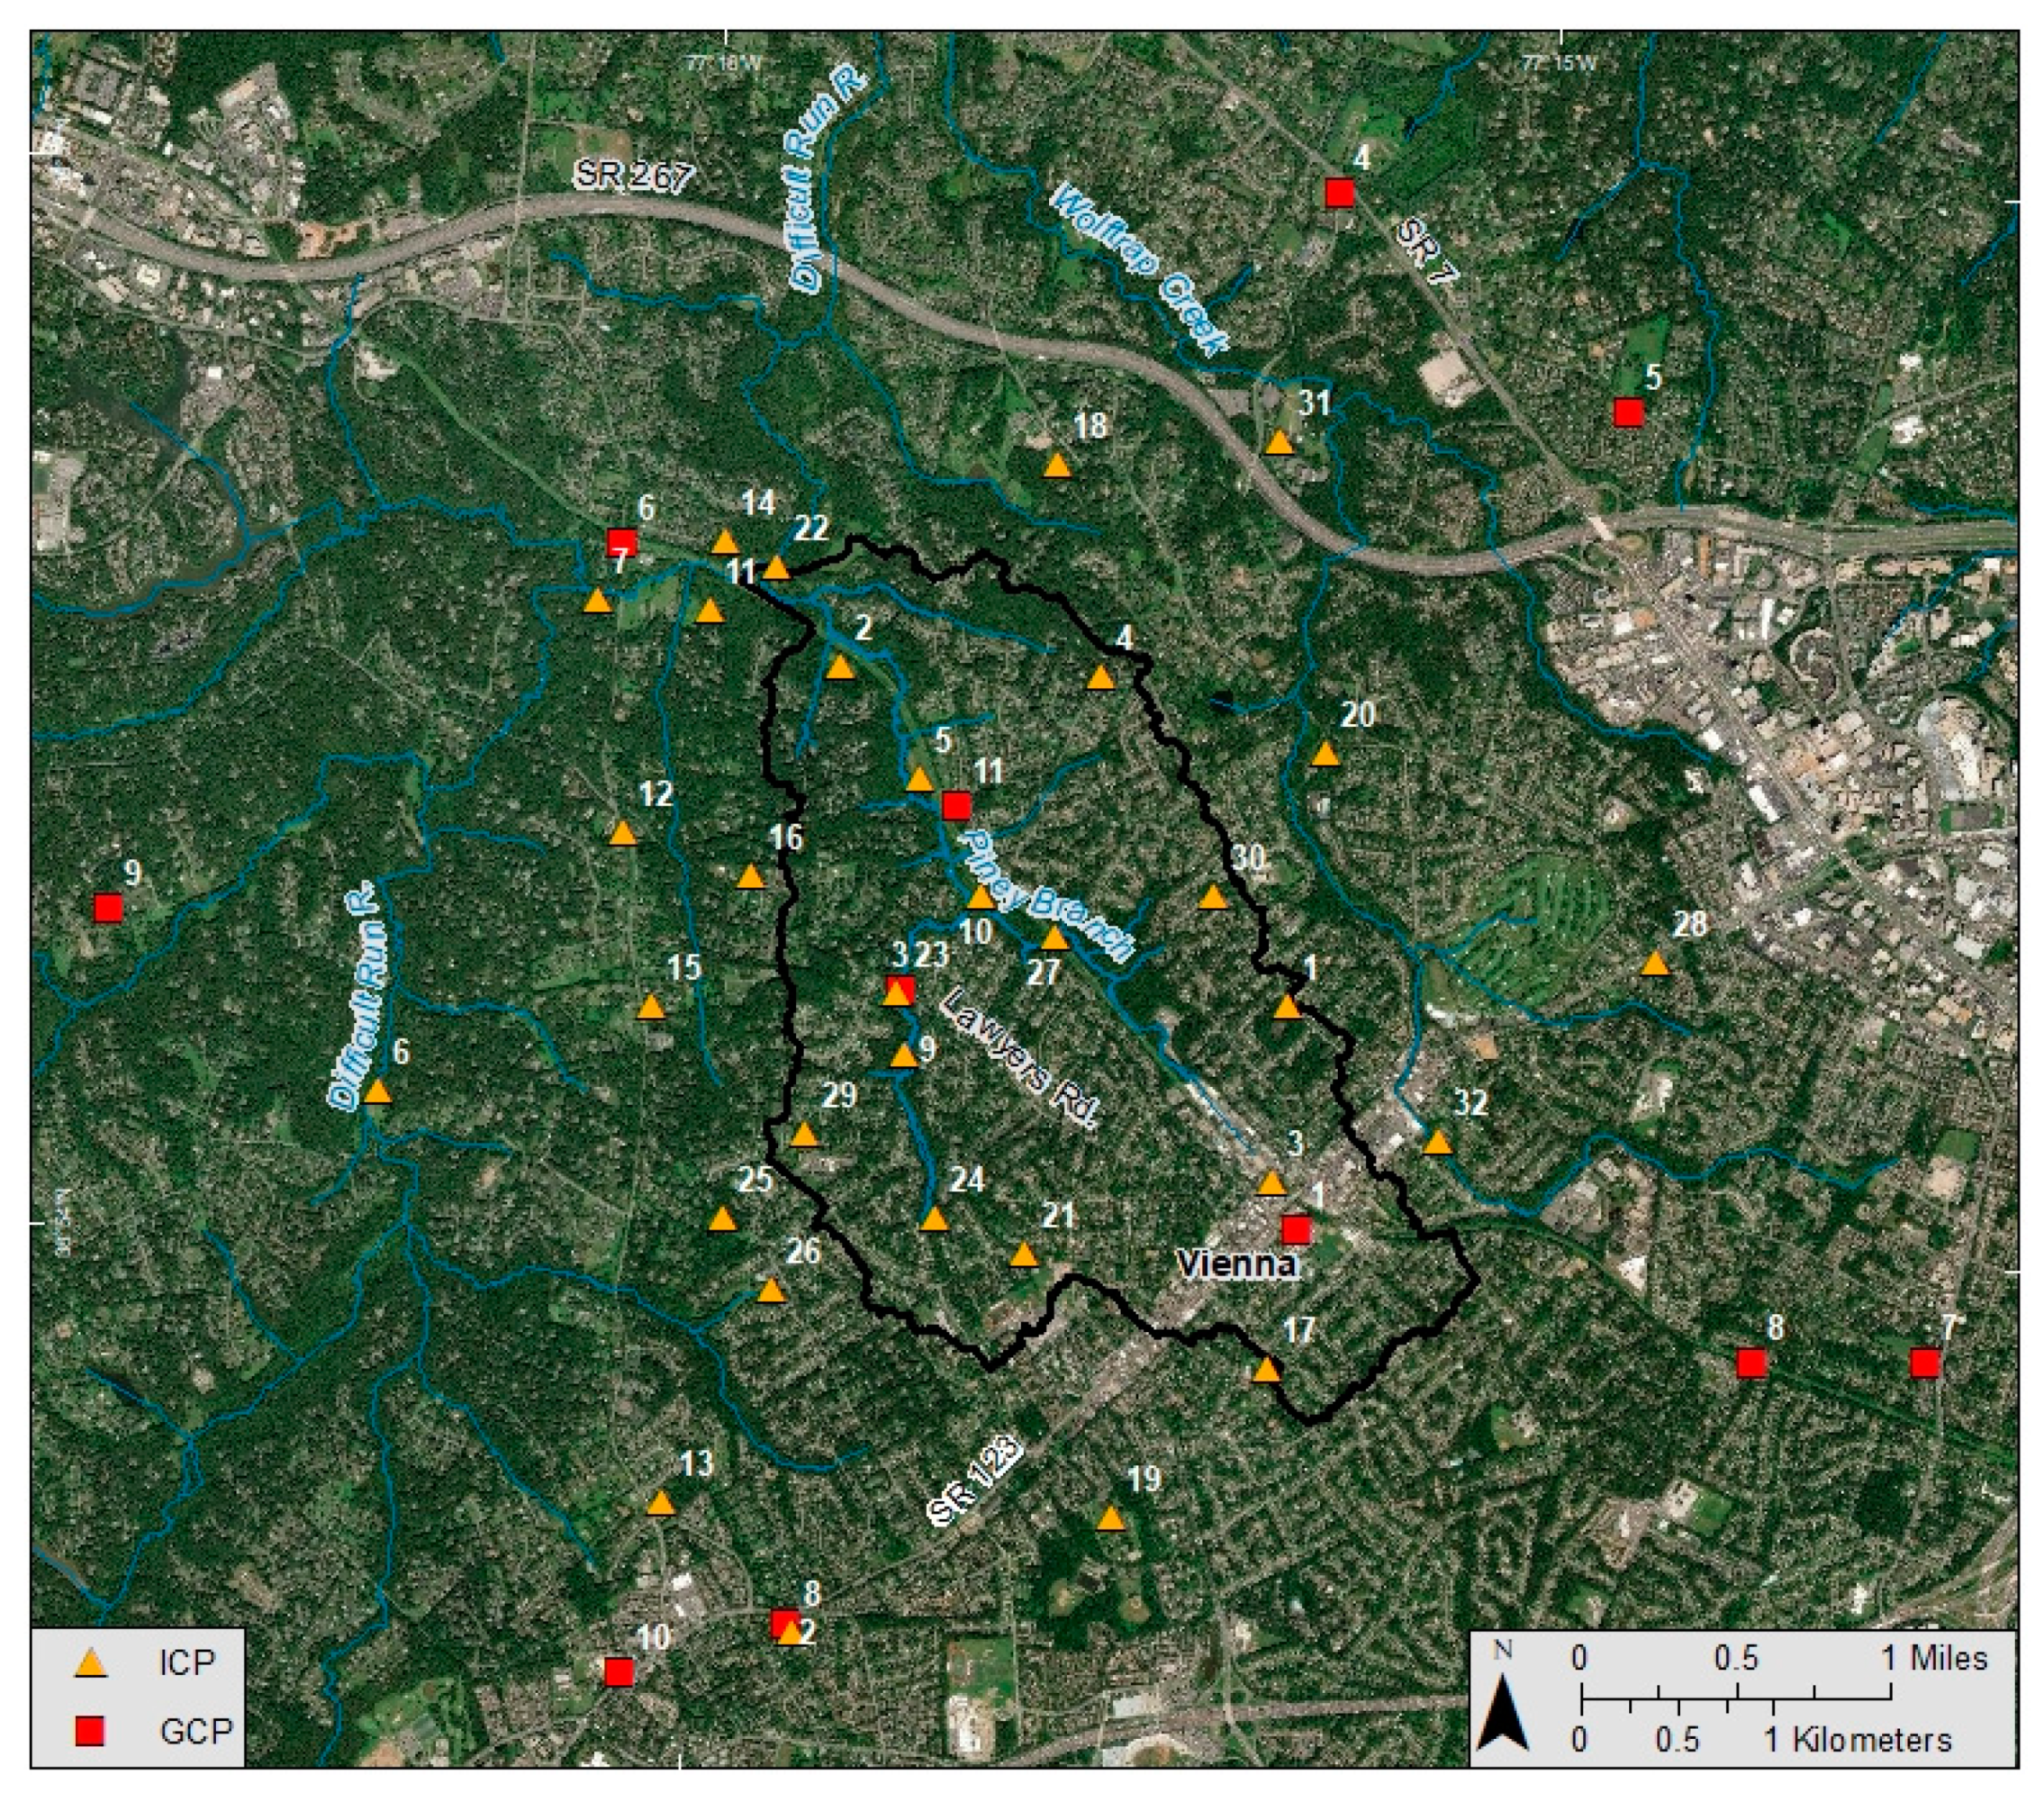
The 2008 USGS 3DEP LiDAR DTM, with a vertical accuracy of ±0.30 m and a horizontal resolution of 3 m, was used to produce a set of ground control points and independent check points (GCPs and ICPs respectively). The 11 GCPs (Table 2) were selected in locations that have experienced minimal topographic change (as interpreted from high-resolution orthoimagery, historical analysis, and fieldwork). These GCPs were used as control in SfM model development for each set of historical aerial images. Additionally, a set of 32 ICPs were selected in locations that were free of vegetation or structures as check points from which the vertical accuracy of the output SfM DEMs were evaluated. The locations of the GCPs and ICPs are shown on the map in Figure 2. GCPs and ICPs were derived primarily from manmade features that appeared to have not changed over the 68-year period. Features selected for control points and check points were primarily corners of paved walking paths and road intersections on the grounds of cemeteries, churches, and schools. Natural features were avoided since natural landscape change could not be ruled out. Features with any significant height, such as buildings, fences, or large trees, were not used to avoid positions that may be represented by parallax in image sets or otherwise may not represent ground elevations. The 2018 LiDAR point cloud was used to produce a 3 m DTM, which was ultimately compared to the 1950 SfM DTM to determine the total topographic change in the study area.

3.2. Historical Aerial Stereo Image Processing

The USGS maintains an archive of over 4.3 million frames of aerial photography collected by different federal agencies from the mid-1930s to the present. Referred to as the ‘Single Aerial Photo Frames’ collection, it contains aerial imagery ranging in scale, size, film type, quality, and coverage. In addition, a second archive contains the collection of an additional 1.3 million frames of National Aerial Photography Program (NAPP) imagery collected from 1987 to 2007 at 1:40,000 scale. For both archives, imagery was acquired with stereo coverage on cloud-free days, and most sets have a minimum forward overlap of 60% and sidelap of 30%. From these archives, individual photo frames were scanned by the USGS Earth Resources Observation and Science (EROS) Data Center using a digital scanning back system at a resolution of 25 microns, or 400 dpc (1016 dpi). After image scanning, a geometric calibration was applied to each image to correct for distortions caused by the scanning process (not a lens distortion correction) [16].
Stereo photo sets of multiple scales were acquired from the USGS Single Aerial Frame Photo and NAPP archives for seven different dates ranging from 1950 to 2002. Table 3 shows the scales, acquisition dates, and extent of stereo coverage with respect to the Piney Branch watershed boundary for each set of stereo aerial imagery used in the study.

4. Methods

4.1. DSM Development and Accuracy Assessment

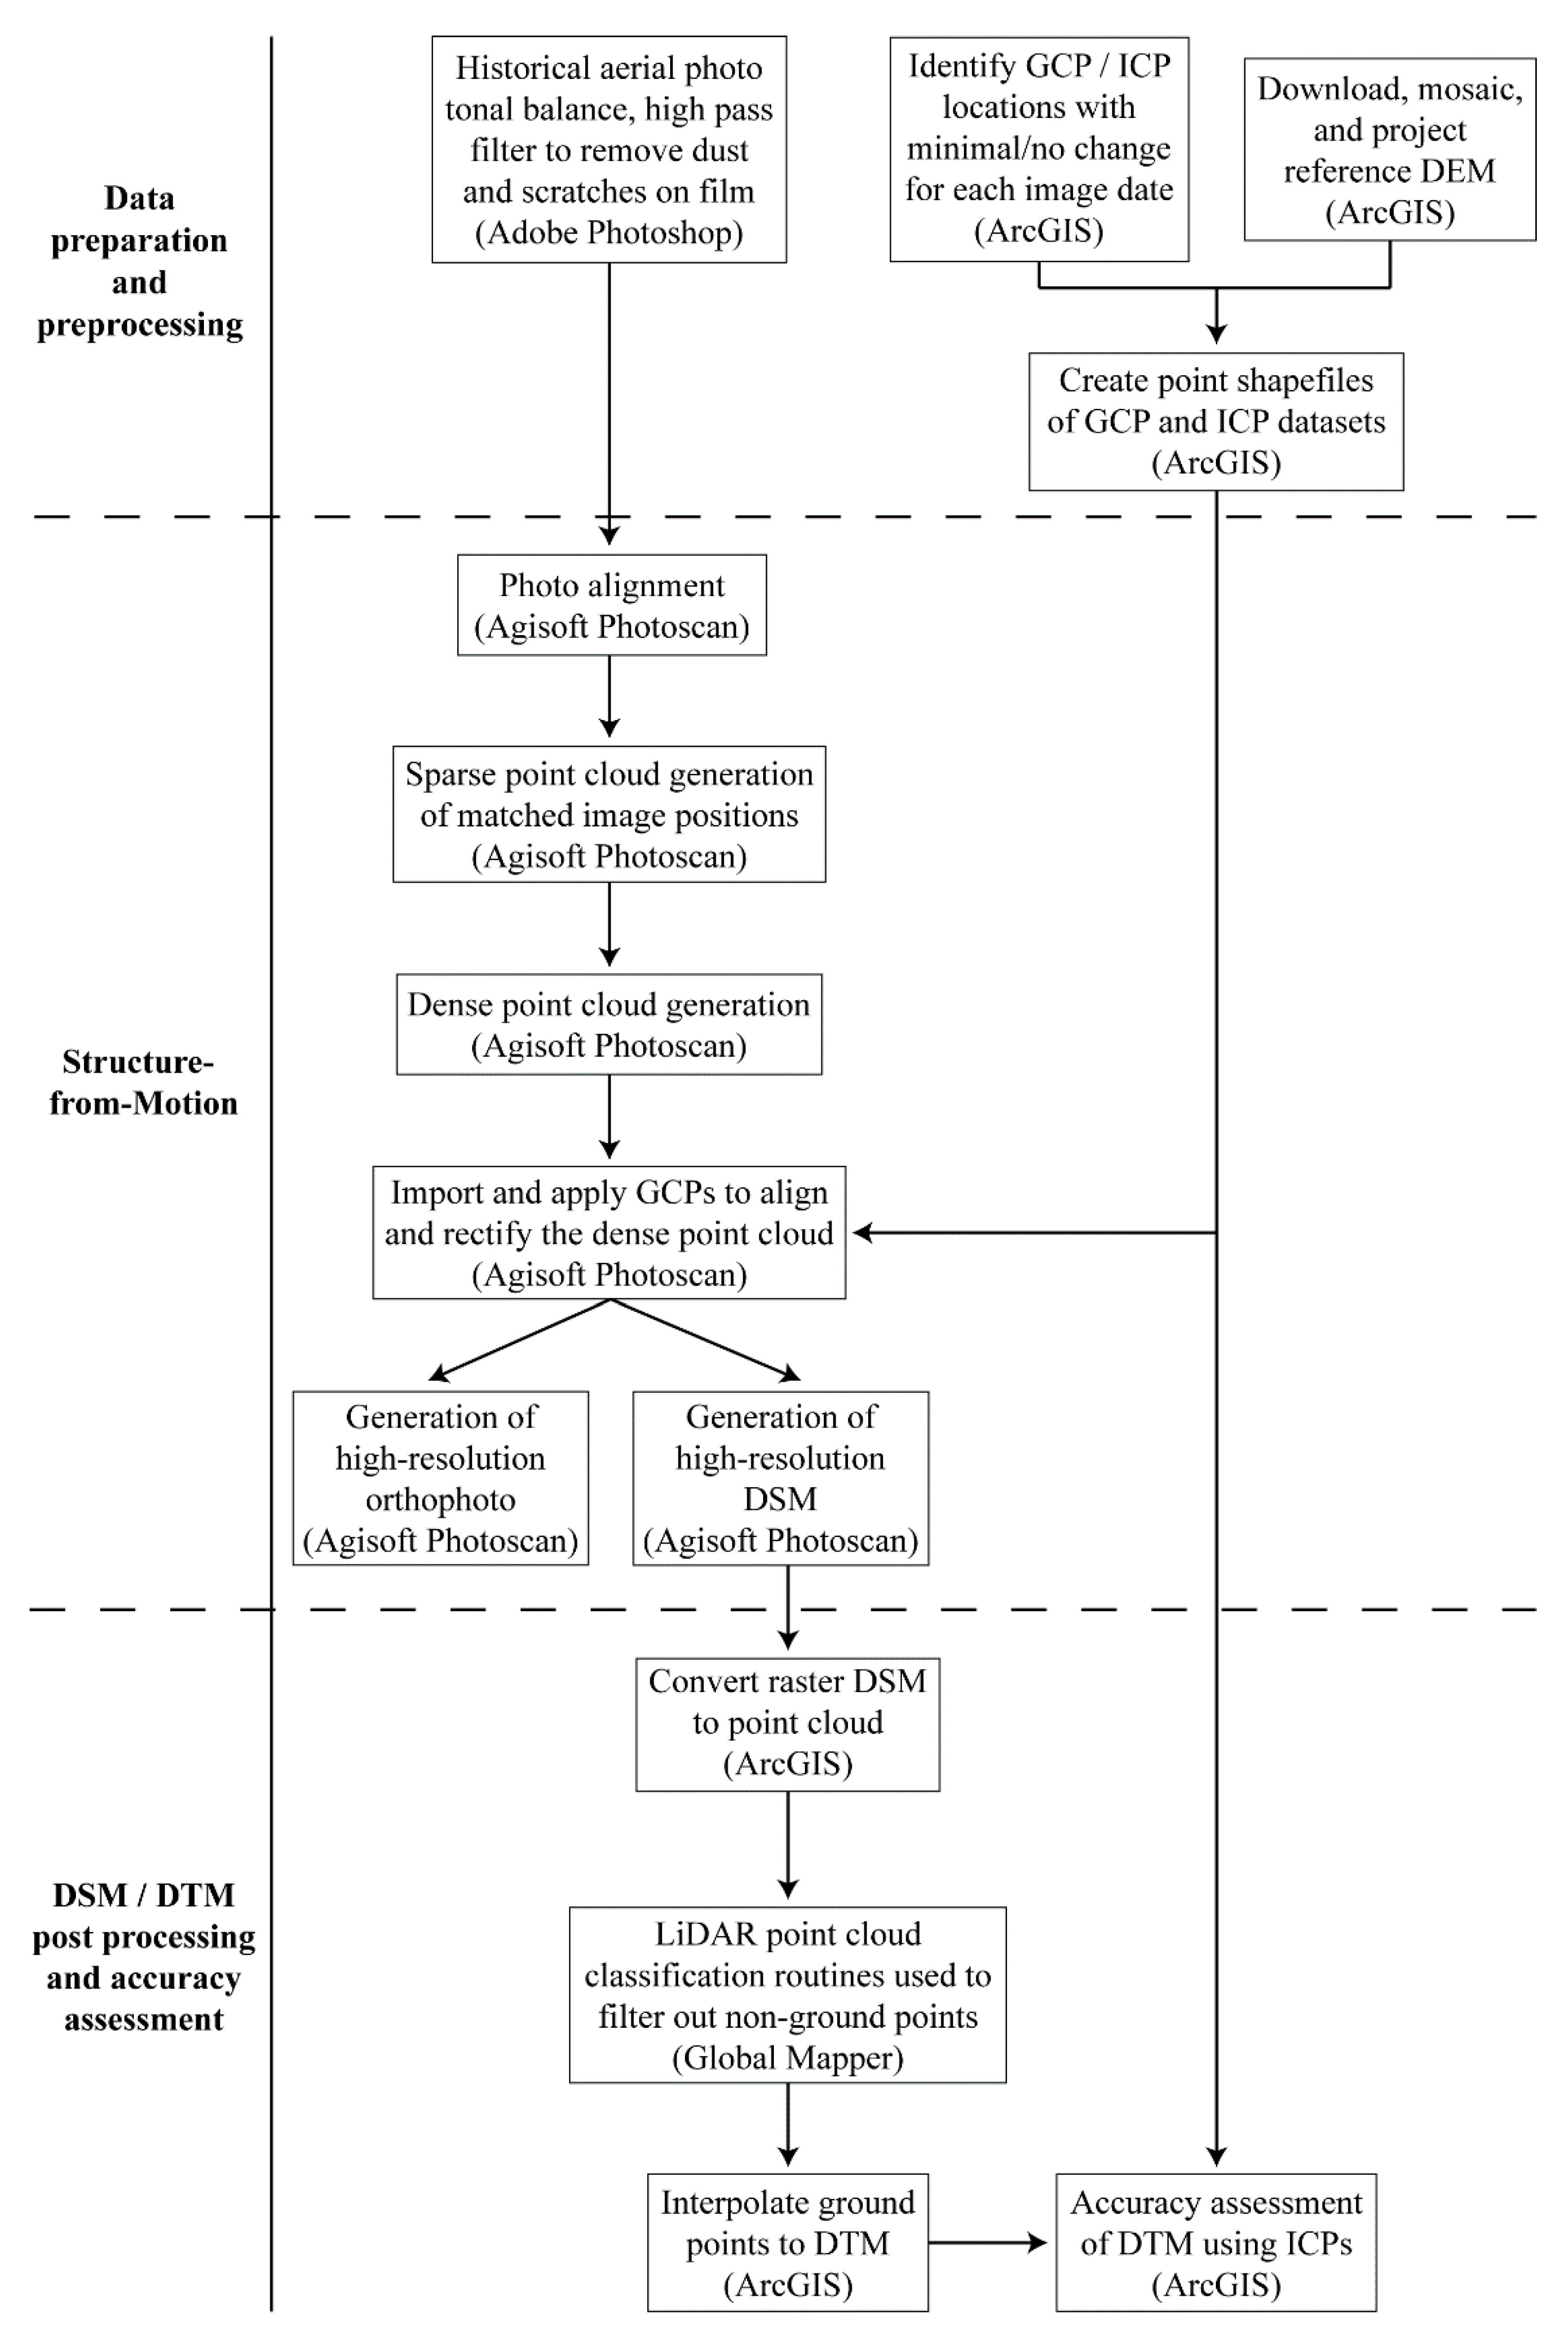
Figure 3 shows a workflow diagram that graphically illustrates the general processing steps in the methodology. Prior to processing, all aerial images were cropped using Adobe Photoshop to remove the frame and fiducial information. SfM processing was done using Agisoft Metashape Pro to produce a DSM and orthophoto from each set of images. SfM begins with a photo alignment process, wherein all the images in a set are matched for coincident points using the scale invariant feature transform algorithm (SIFT) [17]. SIFT processing results in three-dimensional orientation of the photo positions in space. Next, bundle adjustment of these images generates a sparse point cloud [18] of matched image positions. Multi-View Stereo algorithms (MVS) then perform dense cloud extraction on the matched areas.
From the dense point cloud, an ultra-fine resolution orthophoto and DSM were generated for each set of historical aerial photographs. The resolution of each DSM and orthophoto was automatically calculated by the Agisoft Metashape software based on input image resolution. The GCPs derived from the 2008 LiDAR-based high-resolution DEM and 2014 high-resolution orthoimagery (HRO) were used to rectify and adjust the output model.
DEMs have unique error characteristics that depend substantially on the source data and methods used to develop them. Since this error is compounded when DEMs are directly compared, it is necessary to document and account for the error in both the input datasets and the difference dataset [19]. Robust accuracy assessment is essential to ensure that actual physical changes in landform elevation can be distinguished from noise and errors in the individual DEMs [20].
Because the elevation output product of SfM procedures is a DSM and the reference elevation surface is a DTM, the inclusion of elevation values from surficial features such as trees and structures could greatly affect the accuracy assessment of the ground surface modeled by the DSM. For this reason, the SfM DSMs were processed to remove, or greatly reduce, the above ground-surface features present in the elevation model following the methods of [21]. These methods utilized GlobalMapper’s (v.17) LiDAR automatic non-ground classification routines to filter the DSMs to DTMs. The routine conducts an initial point classification to remove outlier point values, followed by classification of the remaining points as either ground or non-ground. A point was classified as non-ground if the plane between it and the nearest two ground points exceeded user-derived slope parameters. This “planarity”-based evaluation was performed for a local window throughout the study area for each dataset. After the planarity filtering, remaining areas of vegetation that persisted in the DSM were noted, and a negative vertical offset, determined from the average canopy height, was applied to remove these patches. While automated filtering of the DSM using these tools cannot completely eliminate the effect of vegetation, structures, etc. on the elevation model, filtering procedures create a close approximation of a DTM for each historical DSM that can be compared to a LiDAR-based DTM.
Accuracy was assessed at a set of points independent of the GCPs used in SfM modeling. Referred to as ICPs, these accuracy assessment locations were selected in open areas that exhibited little or no evidence of topographic change over time. The vertical accuracy of the DSMs developed from historic aerial imagery was assessed using the root-mean-square error (RMSE) metric, calculated as
R M S E = i = 1 n ( x i x ^ i ) 2 n
where x i is the elevation value from the reference DEM, x ^ i is the elevation value from the SfM DSM, and n is the number of observations

4.2. Topographic Change Detection: Thresholding the DEM of Difference

Topographic change was quantified by direct comparison of two DTMs by subtracting the older DTM from the more recent DTM resulting in a DEM of Difference (DoD) where the values indicate the amount of vertical change in the elevation surface between two datasets [22]. Due to differing vertical accuracies of each DTM, it is necessary to specify a threshold value for the DoD that characterizes this combined vertical inaccuracy. The thresholding of the DoD accounts for the uncertainty in each of the input datasets and allows for the interpretation of changes with an understanding of the margin of error. While many methods of estimating uncertainty in the DoD have been suggested (for a review see [23]), this study used two common methods of establishing an error threshold for the DoD: combined RMSE and the Root of the Sum in Quadrature (RSiQ).
The first method for establishing the amount of error in DoD values is to add the RMSE values of the two input DEMs. Elevation values within the range of the RMSE sum are interpreted as not able to be distinguished from error in the DoD. Therefore, this method provides a relatively conservative estimate of the potential error in the DoD, as it assumes the maximum potential for error in the combined DoD. A less conservative estimate of the possible error inherent in DoDs utilizes the RSiQ method [23,24,25,26], which is conceptually similar to the RMSE accuracy metric but assumes that, in two datasets with errors that are normally distributed, there is low probability of comparing data in the extreme tails of the distribution against one another. Assuming the vertical errors of individual DEM data are random errors and independent of one another, the RSiQ method can be used to calculate the values in the DoD that cannot be distinguished from combined error values. This RSiQ value for each dataset is calculated as
δ q = δ x 2 + δ x ^ 2
where δ q is the Root of Sum in Quadrature, δ x 2 is the vertical RMSE of the more recent DEM, and δ x ^ 2 is the vertical RMSE of the older DEM
Building upon this equation, some research has pointed to the use of a probabilistic thresholding technique using the RSiQ, which takes the form of a statistical z-score equation to assess the significance of different ranges of DoD error [27] and can provide useful information regarding the significance of difference values, which include both error and elevation change. Using this method, the user may map elevation change at the 68% confidence interval (t ≥ 1) and at the 95% confidence interval (t ≥ 1.96) depending on the mapping requirements for significance of topographic change:
t = x x ^ δ x 2 + δ x ^ 2
where t is the threshold value, x is the more recent DEM value, x ^ is the older DEM vale, δ x 2 is the vertical RMSE of the more recent DEM, and δ x ^ 2 is the vertical RMSE of the older DEM.

5. Results

5.1. Resolution and Accuracy of DSMs Produced from Historical Aerial Imagery

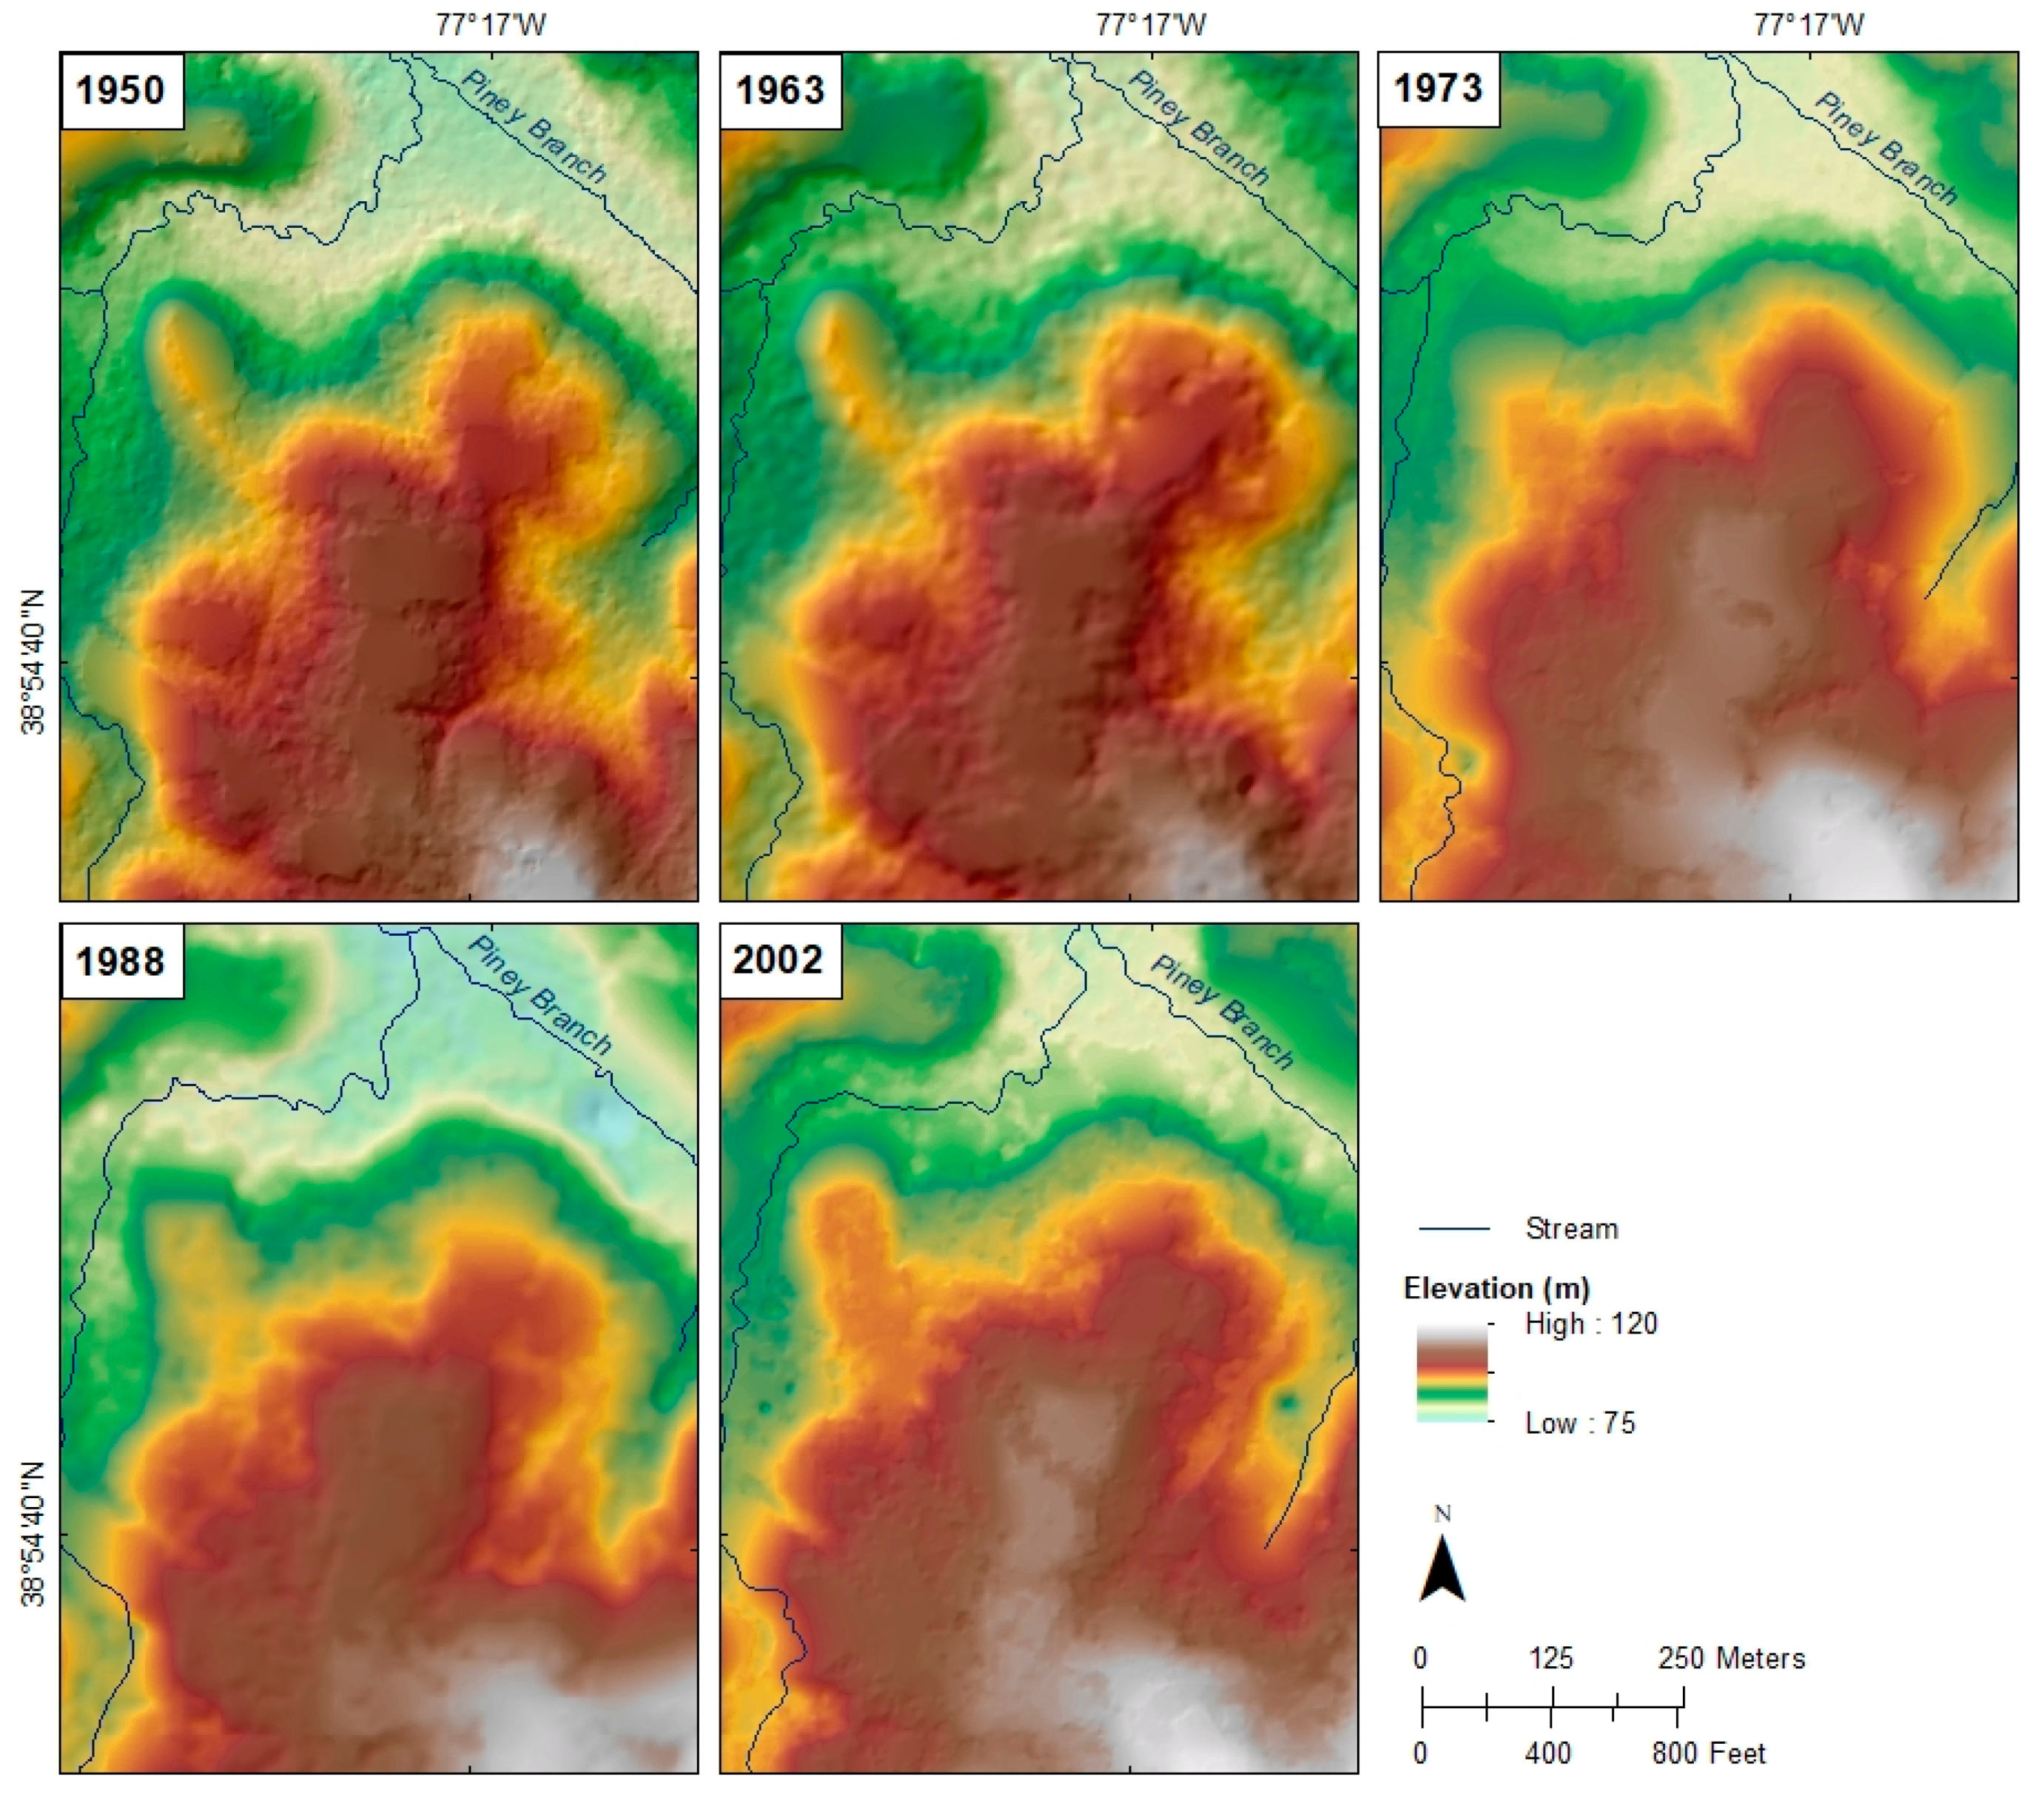
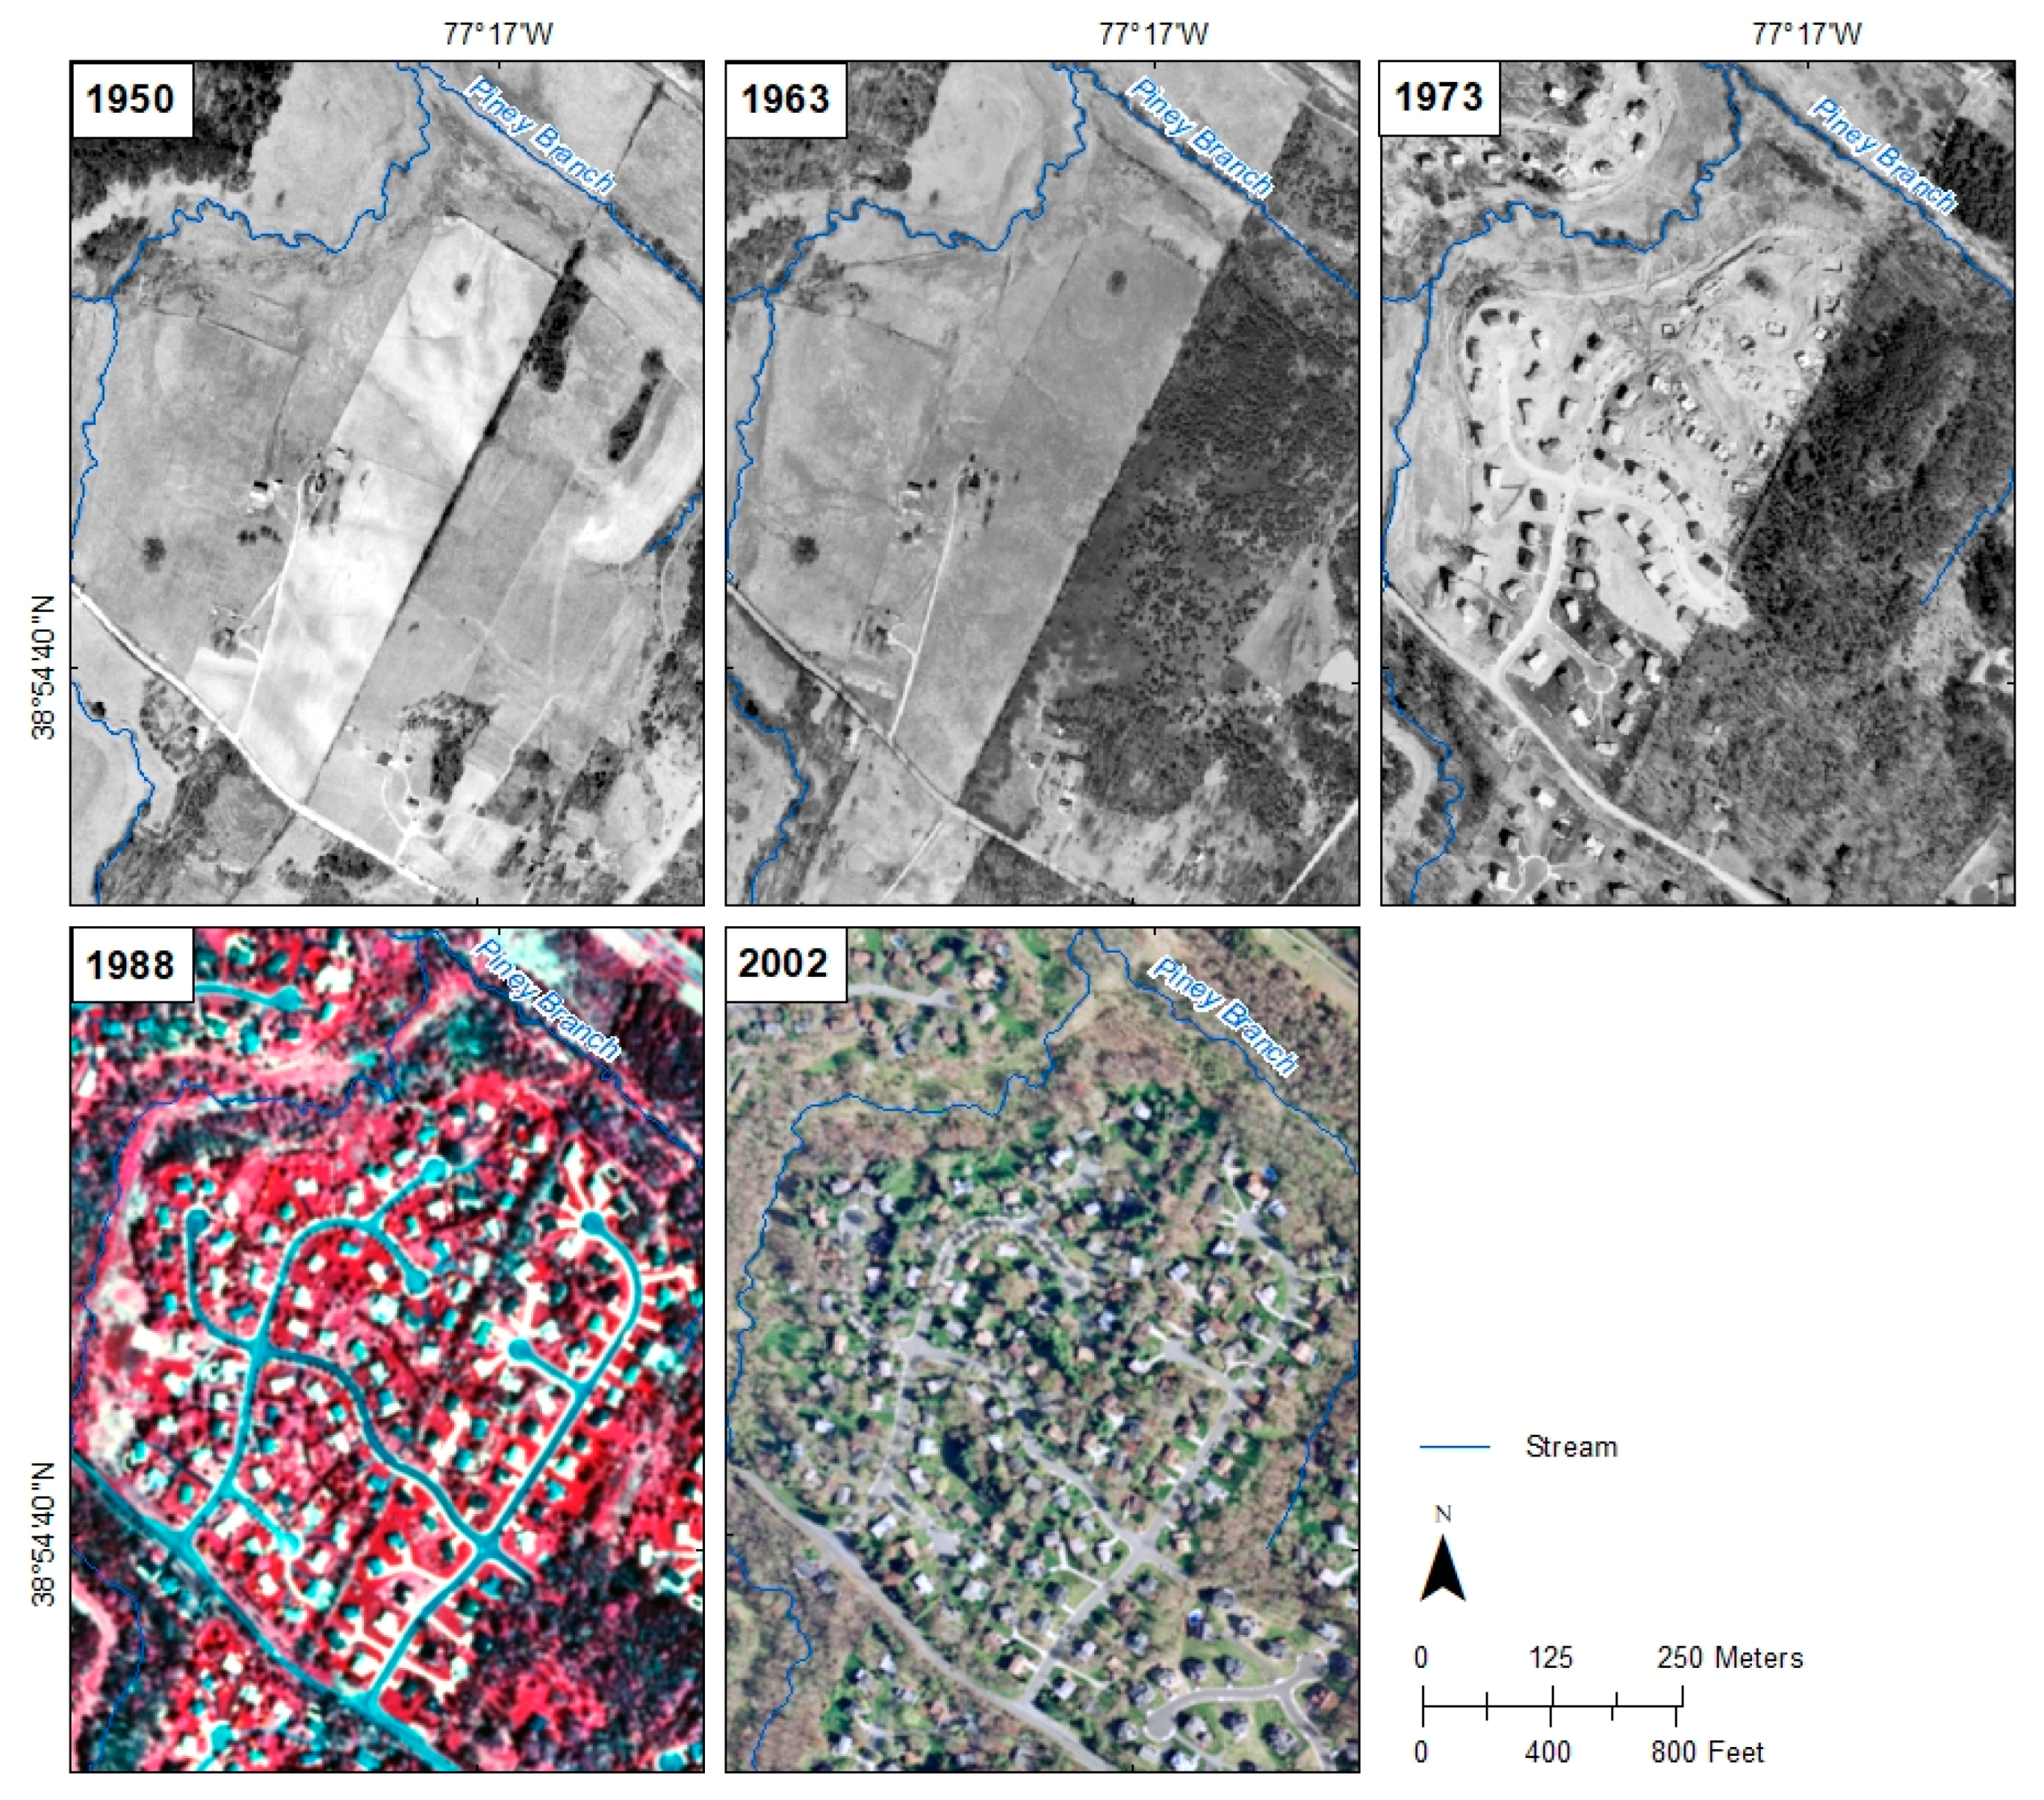
A representative portion of DTMs produced by SfM analysis and subsequent filtering are shown in Figure 4, and the corresponding orthoimages produced are shown in Figure 5. Elevation data for the seven dates of historical aerial photography used in this study are available as supplementary materials. The stream channel interpreted from each date of orthoimage is overlain on top of the DTM and orthoimage for reference.
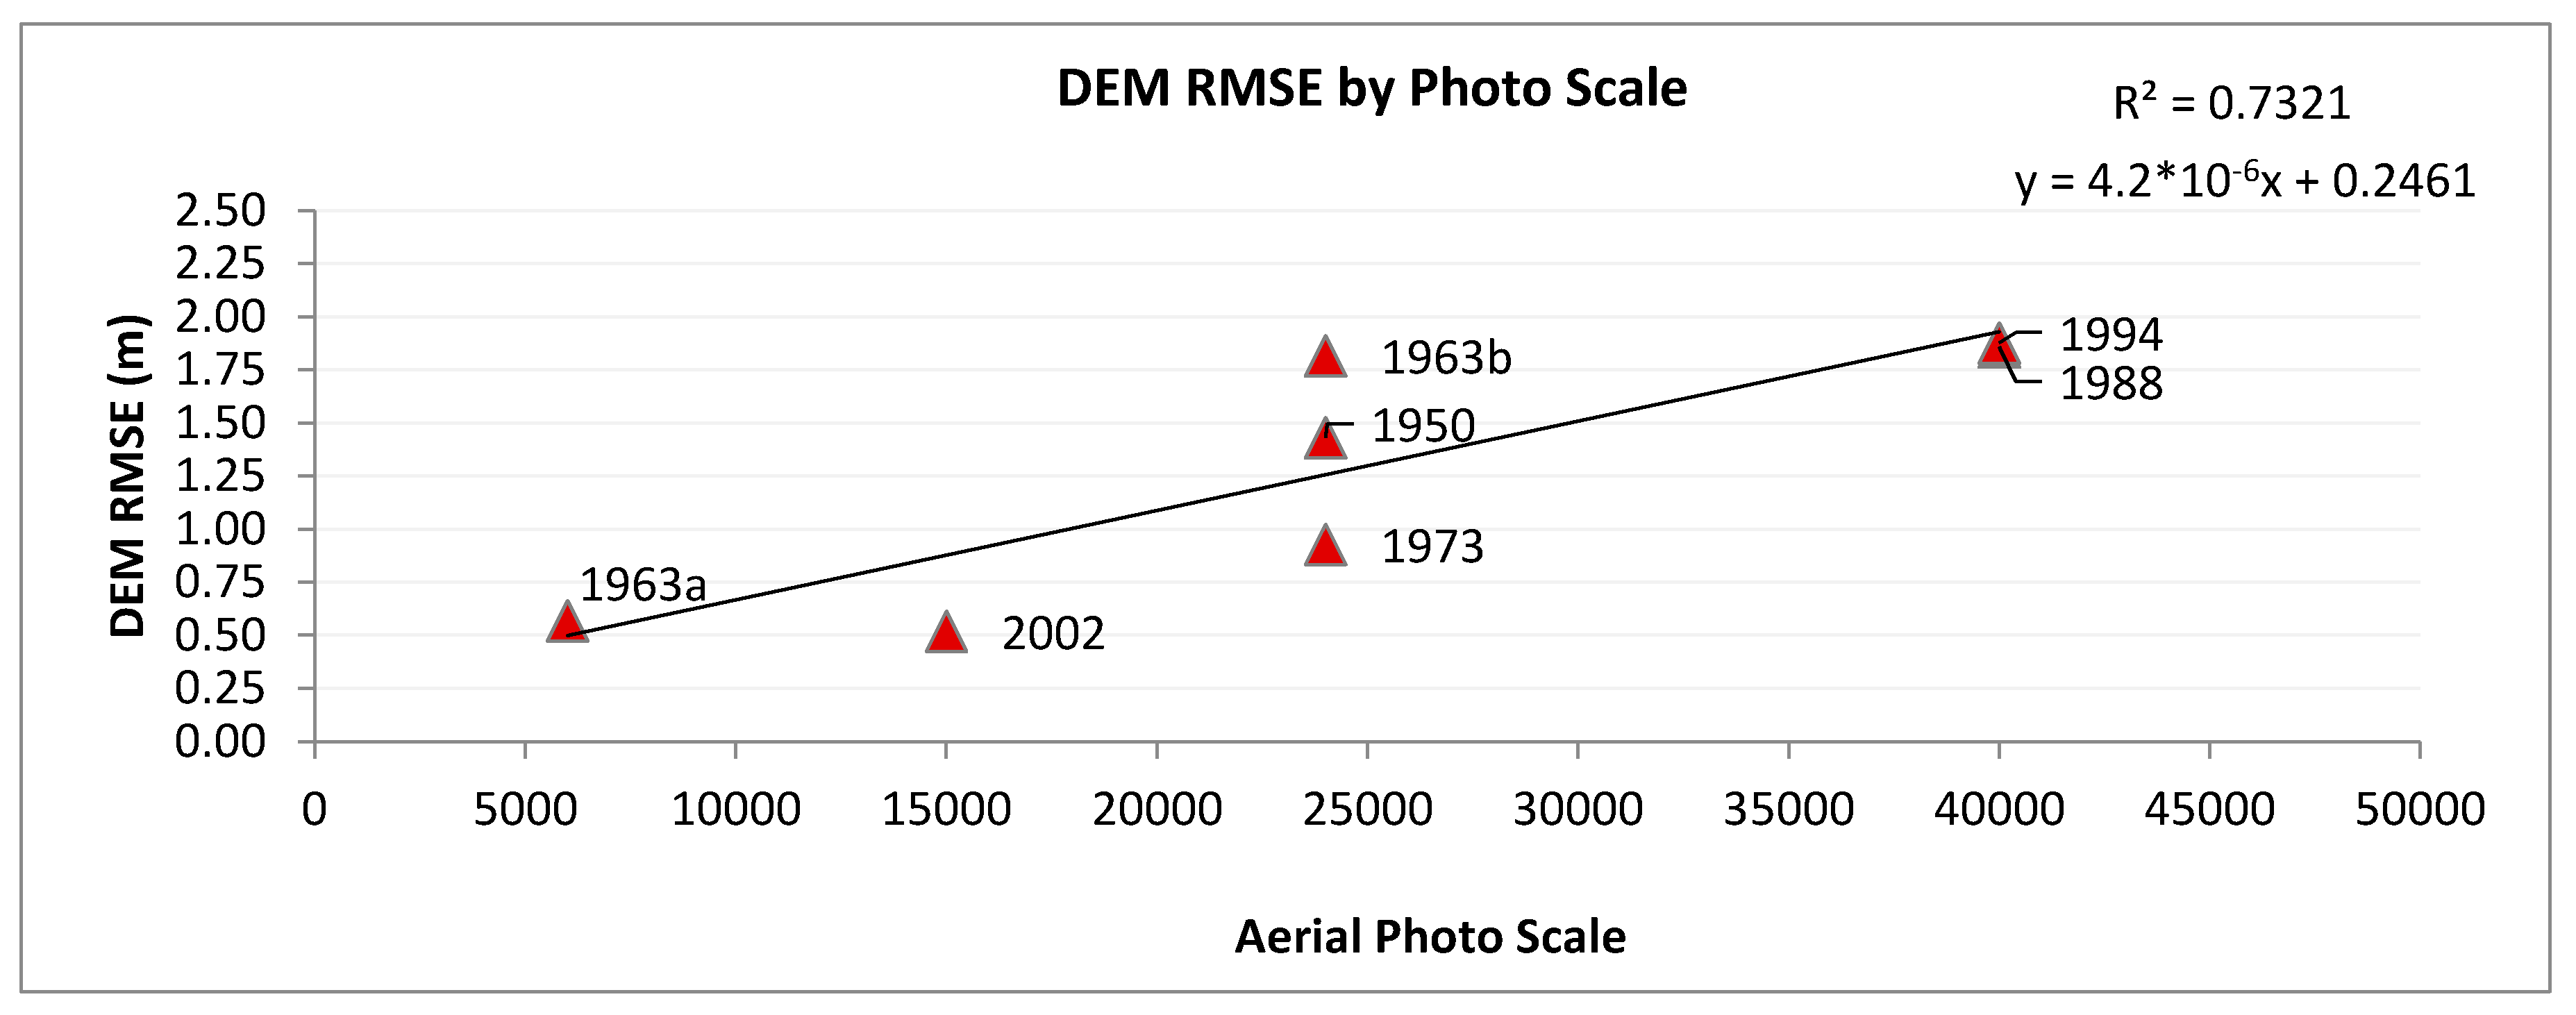
The results of DTM accuracy assessments by date and scale of imagery are shown in Table 4 and include the calculated accuracy in the Agisoft SfM software based on GCPs as well as the vertical accuracy based on the ICP evaluation. The horizontal resolution of the historical DTMs ranged from 0.3 m in the 1:6000 scale 1963a imagery to 2.04 m in the 1:40,000 scale 1988 imagery. Historical imagery collected at 1:24,000 scale resulted in a resolution of approximately 1.2 m (1.17, 1.22, and 1.21 m for 1950, 1963, and 1973 respectively). Imagery collected at 1:40,000 resulted in a horizontal resolution of approximately 2 m (2.04 and 1.95 m for 1988 and 1994, respectively). Vertical RMSE values ranged from 0.52 m in the DTM created from 1:15,000 scale 2002 imagery to 1.88 m in the DSM created from 1:40,000 scale 1994 imagery. There is a clear relationship between vertical DTM accuracy and imagery scale. This relationship is shown in the scatterplot graph in Figure 6.

5.2. Topographic Change Detection and Thresholding

Table 5 documents the results of the topographic change threshold analysis for different time periods. The table highlights the varying combinations of DTMs for a series of possible time intervals along with RMSE, combined RMSE, and RSiQ threshold values. Time intervals of 6 years up to 68 years are represented. The lowest RSiQ value (0.58) was for the 55-year time interval comparison of the 2018-1963a DTMs. Similarly, RSiQ values of 0.92 and 1.43 were achieved for the 2018-1973 DTM comparison and the 2018-1950 DTM comparison, respectively. These three dataset comparisons represent the longest time interval periods in this study from which change can be detected ranging from 45 to 68 years.
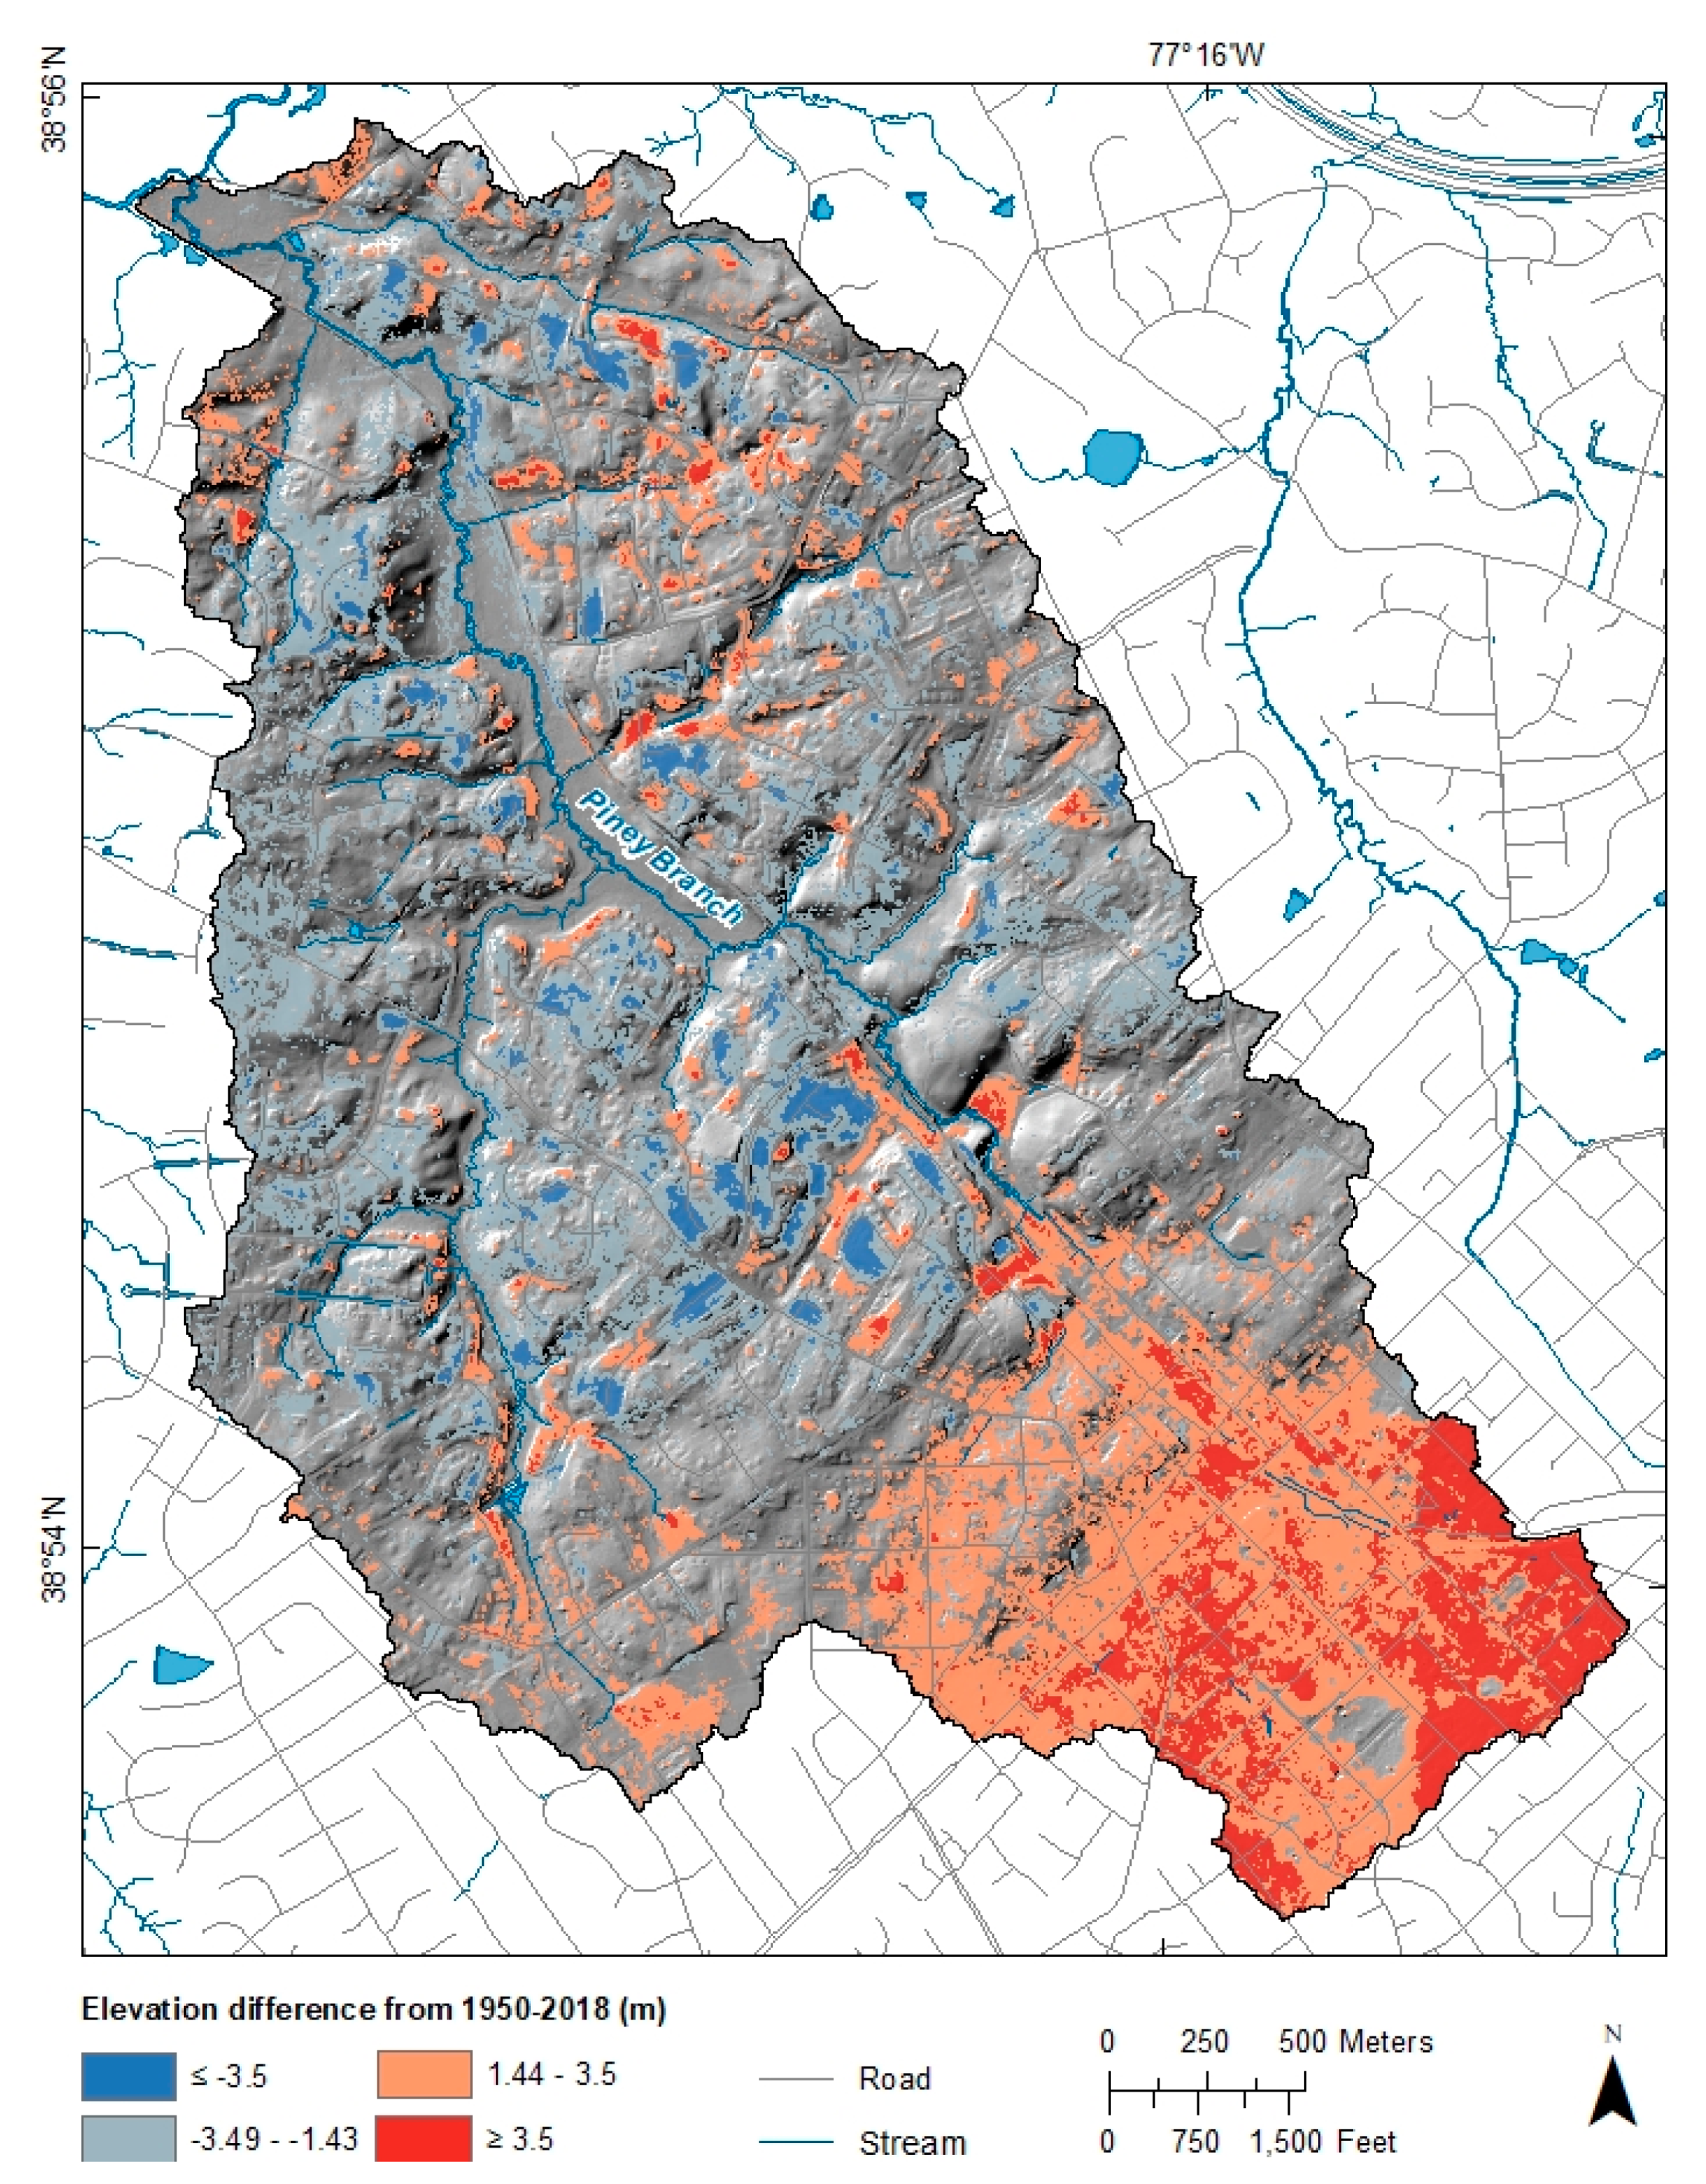
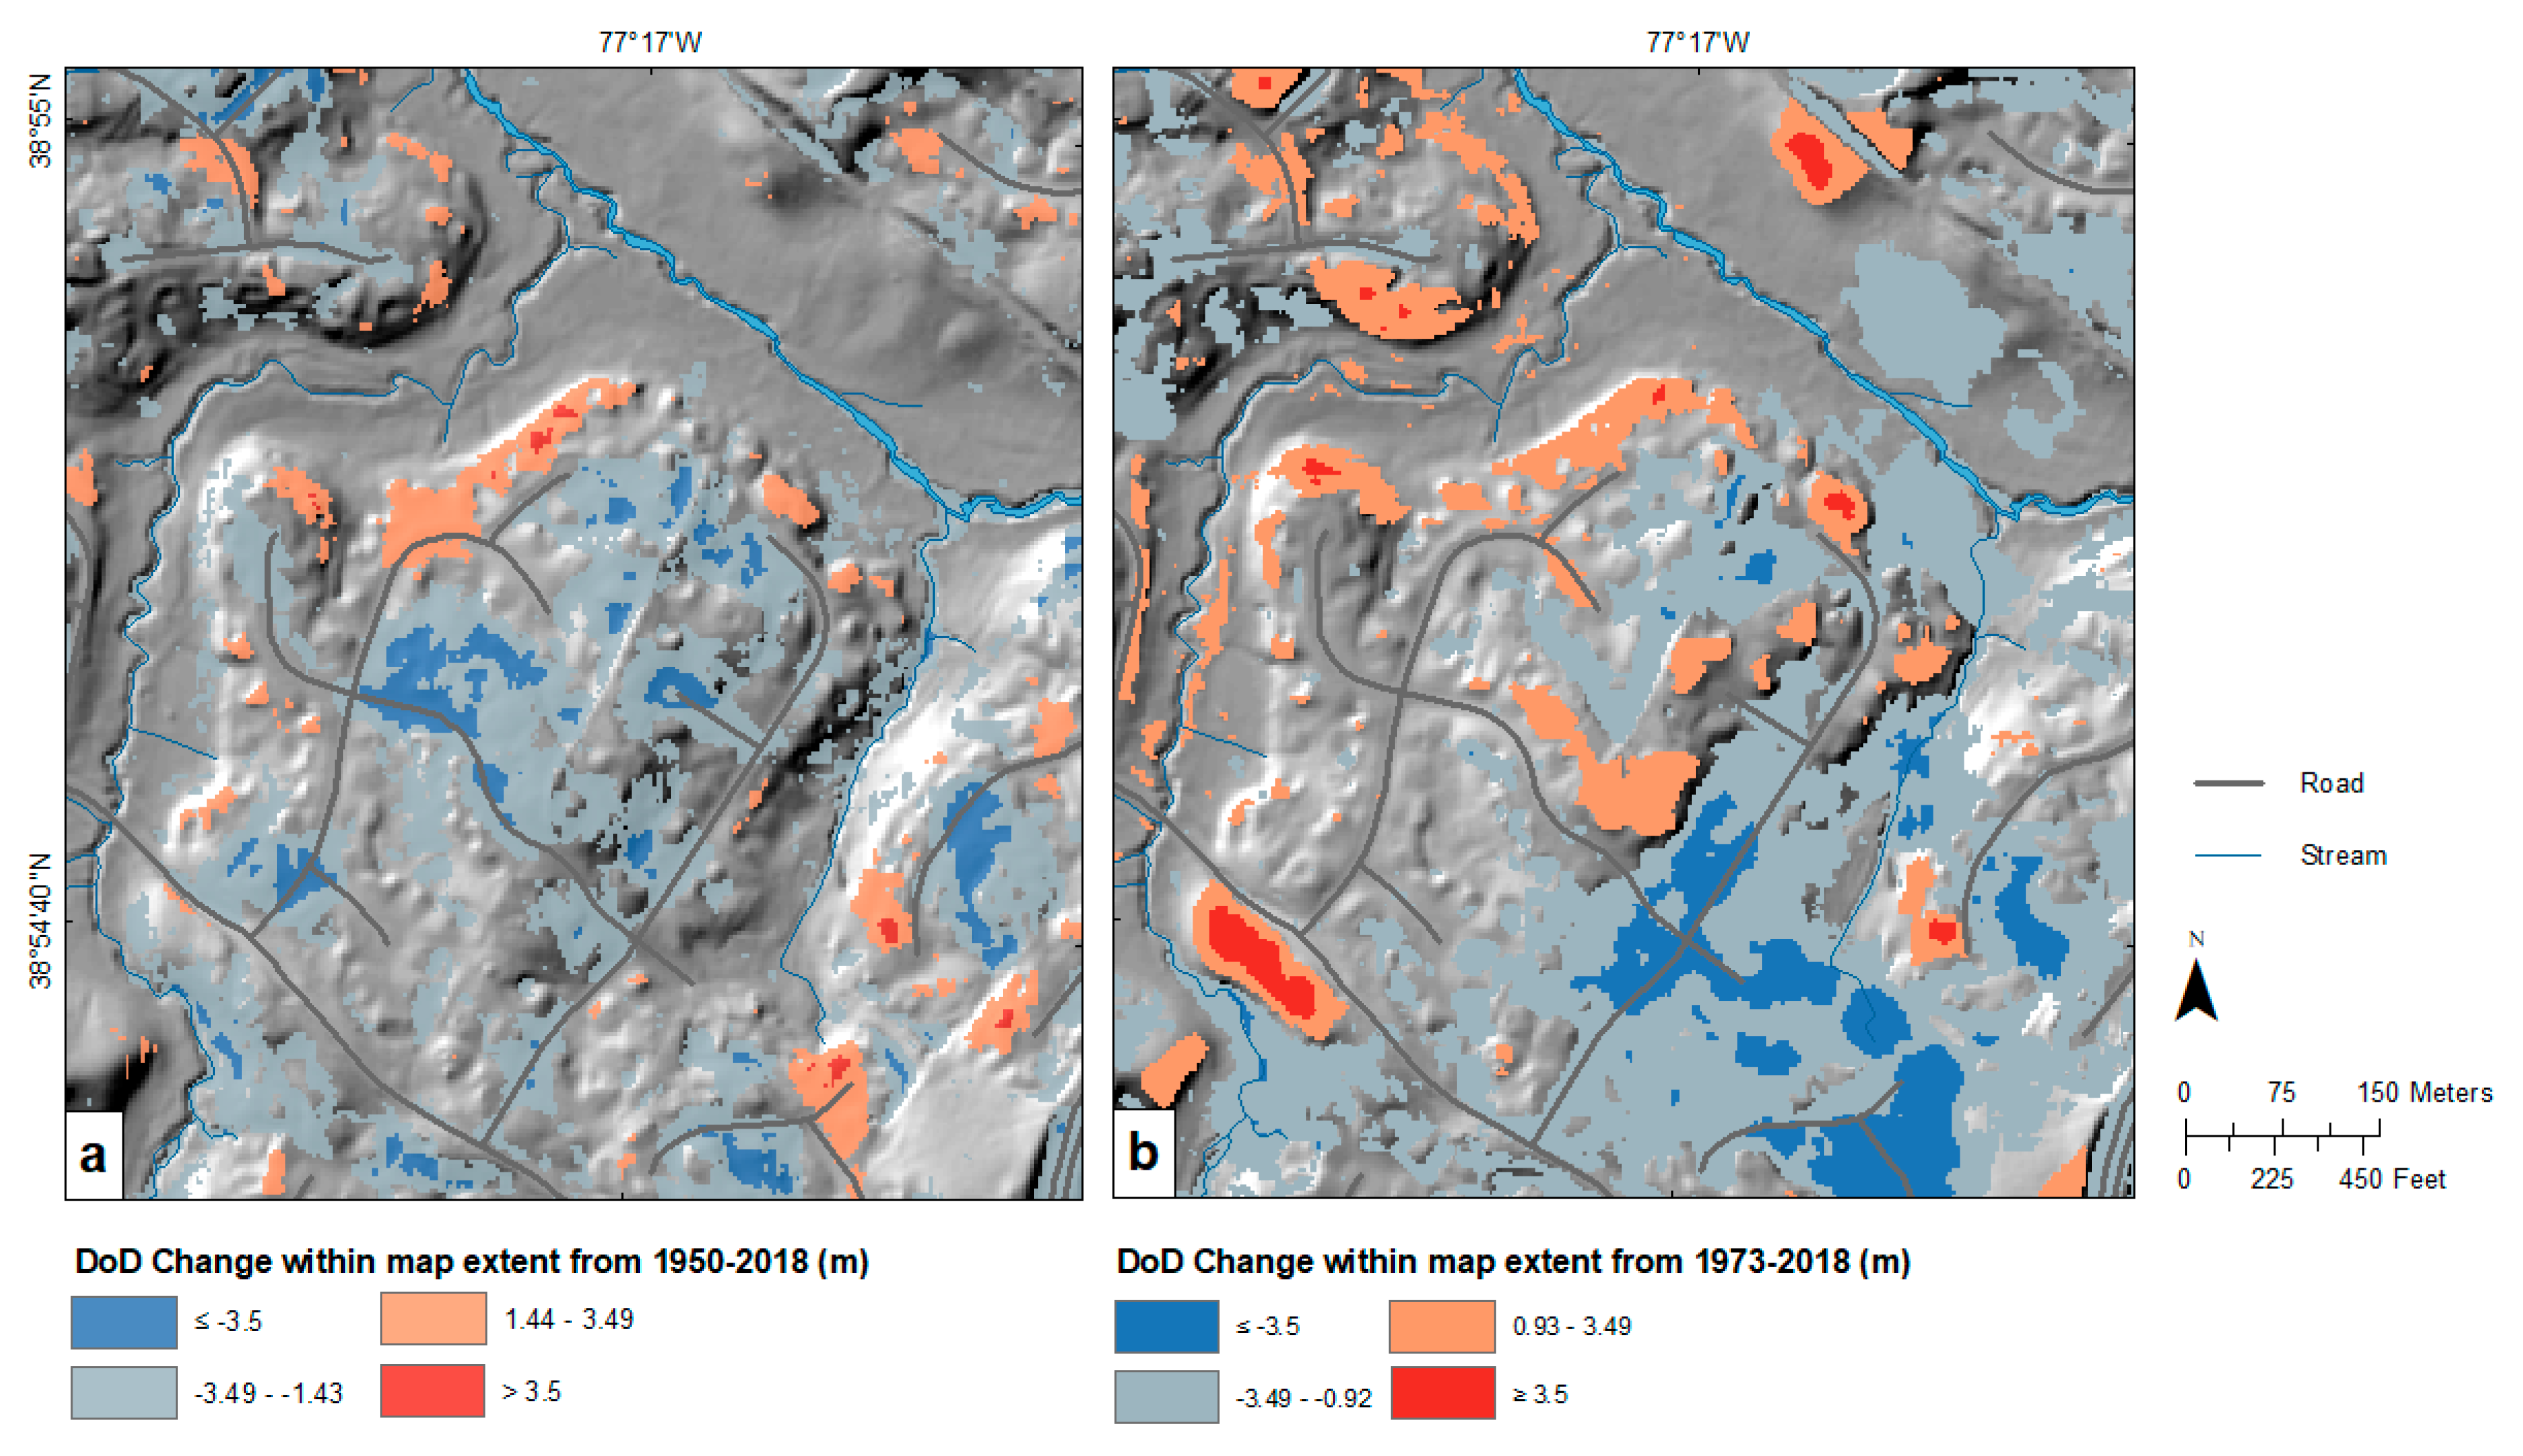
The results of topographic change between 2018 and 1950 are shown in Figure 7 and Figure 8. These two figures represent topographic change employing the RSiQ method. Figure 7 utilizes the ± 1.43 threshold for the 2018-1950 interval. Areas of negative (−) change depict loss of elevation and are symbolized in shades of blue, whereas positive (+) changes depict accretion and are symbolized in shades of red. Within the extent of the study area, the most substantial elevation loss was -9.79 m, and the most substantial elevation gain was 8.18 m. Figure 8 highlights a sub-area within the watershed where two different time intervals and two different RSiQ threshold values were applied.

6. Conclusions

SfM is a viable and low-cost/low barrier-to-entry method for producing DSM/DTMs from historical aerial photography. DTMs produced from SfM and aerial photography are comparable to LiDAR elevation data for assessing geomorphic change over multi-decadal timescales. USGS aerial photo archives and 3DEP LiDAR data are world-class sources for historical geomorphic change analysis and are also highly accessible to researchers since each dataset is publicly available at no cost.
The quality of resultant SfM DTMs was found to be dependent upon the scale of input aerial photography. Larger-scale photography (1:24,000 or larger) generally had lower vertical error (lower RMSE) values and, thus, is considered more closely comparable to 3DEP LiDAR data. However, depending on the scale of analysis, smaller-scale photography (for example, 1:40,000) may be adequate for detecting elevation change of a certain magnitude.
This study found variability in vertical RMSE values of DTM data produced from imagery of the same photo scale. Values are shown in Table 4 for both the calculated RMSE from the Agisoft software as well as the assessment done using ICPs. The results show lower error calculated in Agisoft than is calculated by the ICP assessment. This likely is due to several factors, but one important one is that the Agisoft RMSE values measure the accuracy of the overall modeled parameters, and the RMSE values developed from the ICPs measure vertical differences of the filtered DTM data. Filtering of elevation data changes the values inherent in the output DTM. Based on the ICP analysis, DTM RMSE values derived from 1:24,000 scale aerial photography ranged from ±0.92 to ±1.81 m. Using the linear function formula from Figure 6 (y = 4.2 × 10⁻⁶x + 0.2461), calculation of the y intercept for 1:24,000 scale photography predicts a vertical RMSE of ±1.25. This value is roughly equivalent to the output DTM horizontal resolution. The linear function formula provides a tool for researchers assessing the magnitude of elevation changes that one might expect based solely upon photo scale. For example, if elevation changes of approximately ±1 m are required to be mapped, then calculation of the y intercept indicates that historical aerial photography of 1:20,000 scale or larger would be required. Similarly, 1:10,000 scale photography would be predicted to yield DTM vertical RMSE values of ±0.68. However, this study also shows that aerial photography at 1:24,000 scale produced DTM data of < 1m vertical RMSE (±0.92 m for the 1973 dataset). This result indicates that the quality of output DTMs is reliant upon other factors beyond the photo scale; thus, additional observations and tests deriving DTMs from historical photography in different settings will enhance the understanding of their quality and accuracy.
Other factors to consider for assessing quality of SfM DTMs from historical aerial photography are the original image quality of photo and the quality of the image scanning. The photo geometry (exterior orientation), amount of stereo overlap, and the number of photo frames all contribute to the ability of the SfM software to align photos in the stereo model. The study area itself is also a factor, and its topographic relief and landcover characteristics (type and amount of vegetation or manmade features) may contribute to the quality of output data. With regards to quantifying topographic change, the filtering mechanisms used to remove vegetation or anthropogenic features are vitally important because this process can introduce error into the DEM and may cause areas to appear as having changed when little or no change has occurred. Finally, the quality and location of control points is an important consideration, especially in historical research, since most features and ground area has experienced some change over multiple decades. These changes may not always be adequately documented or otherwise known; thus, error may be introduced if these areas are selected for control points.
The values of the DoD indicate changes in elevation detectable from the source data and must be evaluated together with the uncertainty of the input DTMs. It can be difficult, depending the accuracy of the DTMs used in the analysis, to differentiate between ‘real’ elevation gain or loss and ‘noise’ caused by the propagation of error to the DoD. Thresholding the DoD provides a means of establishing the minimum amount of change that can be measured, given the accuracies of the input DTMs. When particularly conservative thresholding methods are used, the amount of error may almost entirely overwhelm the amount of elevation change. Thus, it is important to try to reduce the error inherent in the historical DEMs.
There are also challenges in assessing the distribution of errors in resultant DEMs as a result of significant topographic changes. It can be extremely difficult to find control point locations that have not changed over multiple decades. Even seemingly insignificant changes caused by subsidence, erosion, or vegetation succession can substantially affect the analysis of change over time, notwithstanding larger changes associated with urban development such as road or infrastructure construction. This severely limits the ability to acquire large sets of randomly assigned locations from which to evaluate elevation error and impacts the resultant RMSE values in each of the historical datasets.
This study specifically investigated two different methods of distinguishing topographic change from error in the two input DEMs, namely the combined RMSE and the RSiQ methods. While the summed RMSE method is commonly used, possibly due to its simplicity to implement and explain, the RSiQ method is useful because it assumes that the error in a DoD pixel is not the combined extremes of errors from the input DEMs. Moreover, the RSiQ value can be used to evaluate the comparability of available DEMs in historic topographic change analysis, as it represents the detectable level of change in DEM differencing. While changes beneath this RSiQ value theoretically cannot be distinguished from noise, the DoD values may still be useful in establishing the pattern of elevation changes, and thus useful for visual interpretation of patterns of change.
The orthoimages produced by the SfM process have additional utility for visual interpretation of land cover changes as well. In particular, changes in stream channel patterns were apparent through comparison of the channel visible in each subsequent SfM orthoimage. These changes are evident when the streams interpreted from each year are overlaid (Figure 4 and Figure 5). Mapping stream channel changes and other feature-based changes may enable better discrimination of DoD error differences if change can be associated with specific land-use land cover transitions.
Though other factors beyond photo scale contribute to expected error and data quality, this research produced a valuable tool that may be used to assess anthropogenic changes for planning and research purposes [7]. Areas of further study include investigations into improvements of SfM modeling using historical aerial photographs. Pre-processing improvements including better methods for cropping fiducial information from photo frames (for example, those demonstrated by [28]), adding camera calibration information in SfM software, and other techniques to optimize photo alignment may improve the interior orientation modeling parameters. Mean filtering of the original photo frames may also be helpful in improving the quality of image matching and photo alignment to assist with correlation and extraction of elevation values from pixels. Improvements could also be made in identifying an appropriate number and location of control points, and testing and analyzing the distribution of error would aid in understanding how that error propagates through to the output DTM datasets.
In summary, programs such as USGS 3DEP respond to growing mapping needs by providing recent, highly accurate, and high-spatial resolution elevation data using LiDAR technology. The applicability and potential use of 3DEP LiDAR data for mapping geomorphic and anthropogenic change are increased by the integration of SfM DEM data using historical aerial photography.

Supplementary Materials

The following are available online at https://www.mdpi.com/2072-4292/12/10/1625/s1. Digital elevation models (DEMs) for the seven dates of historical aerial photography used in this study are available online at: Chirico, P.G., Bergstresser, S.B, DeWitt, J.D., and Alessi, M.A., 2020, Data release for structure-from-motion DEMs derived from historical aerial photographs and their use in geomorphological mapping: U.S. Geological Survey data release, https://doi.org/10.5066/P9XPAAVF.

Author Contributions

Conceptualization: P.C. Methodology: P.C., J.D. Analysis: P.C, J.D., S.B. Data Curation: S.B., J.D. Writing—Original Draft Preparation: J.D, P.C. Writing—Review and Editing: P.C, J.D., S.B. Visualization: S.B. All authors have read and agreed to the published version of the manuscript.

Funding

This research received no external funding.

Acknowledgments

The authors would like to recognize Daniel K. Jones (USGS) for valuable comments on an early version of the manuscript; Kathleen M. Boston (NSA, contractor to USGS) for review of data products and metadata; Marissa A. Alessi (USGS) for contributions to data release; three anonymous peer reviewers for their thoughtful reviews and comments that helped to improve the manuscript. Any use of trade, firm, or product names is for descriptive purposes only and does not imply endorsement by the U.S. Government.

Conflicts of Interest

The authors declare no conflict of interest.

Disclaimer

This work was authored as part of the Contributor’s official duties as an Employee of the United States Government and is therefore a work of the United States Government. In accordance with 17 U.S.C. 105, no copyright protection is available for such works under U.S. Law.

References

  1. Brown, E.H.; Atkinson, B.W.; Wolf, P.O.; Rodda, J.C.; Collins, M.P.; Penning-Rowsell, E.C.; Lee, D.O.; Brunsden, D.; Hollis, G.E.; Francis, M.; et al. Physical Problems of the Urban Environment: A Symposium: Discussion. Geogr. J. 1976, 142, 72. [Google Scholar] [CrossRef]
  2. Lee, E.M. Geomorphological mapping. Geol. Soc. Lond. Eng. Geol. Spéc. Publ. 2001, 18, 53–56. [Google Scholar] [CrossRef]
  3. Lóczy, D.; Sütő, L. Human Activity and Geomorphology. In The SAGE Handbook of Geomorphology; SAGE Publications: London, UK, 2012; pp. 260–278. [Google Scholar]
  4. Faccini, F.; Robbiano, A.; Roccati, A.; Angelini, S. Engineering geological map of the Chiavari city area (Liguria, Italy). J. Maps 2012, 8, 41–47. [Google Scholar] [CrossRef]
  5. Del Monte, M.; D’Orefice, M.; Luberti, G.M.; Marini, R.; Pica, A.; Vergari, F. Geomorphological classification of urban landscapes: The case study of Rome (Italy). J. Maps 2016, 12, 178–189. [Google Scholar] [CrossRef] [Green Version]
  6. Brandolini, P.; Faccini, F.; Paliaga, G.; Piana, P. Urban Geomorphology in Coastal Environment: Man-Made Morphological Changes in a Seaside Tourist Resort (Rapallo, Eastern Liguria, Italy). Quaest. Geogr. 2017, 36, 97–110. [Google Scholar] [CrossRef] [Green Version]
  7. Chirico, P.G.; Bergstresser, S.E.; DeWitt, J.D.; Alessi, M.A. Geomorphological mapping and anthropogenic landform change in an urbanizing watershed using structure-from-motion photogrammetry and geospatial modeling techniques. J. Maps 2020, 1–12. [Google Scholar] [CrossRef] [Green Version]
  8. Gesch, D.B.; Maune, D. The national elevation dataset. In Digital Elevation Model Technologies and Applications: The DEM Users Manual; American Society for Photogrammetry and Remote Sensing: Bethesda: Rockville, MD, USA, 2007; pp. 99–118. [Google Scholar]
  9. Heidemann, H.K. Lidar base specification. In Techniques and Methods; US Geological Survey: Reston, VA, USA, 2012; p. 4. [Google Scholar]
  10. James, L.A.; Hodgson, M.E.; Ghoshal, S.; Latiolais, M.M.; James, A. Geomorphic change detection using historic maps and DEM differencing: The temporal dimension of geospatial analysis. Geomorphology 2012, 137, 181–198. [Google Scholar] [CrossRef]
  11. DeWitt, J.D.; Warner, T.; Conley, J. Comparison of DEMS derived from USGS DLG, SRTM, a statewide photogrammetry program, ASTER GDEM and LiDAR: Implications for change detection. GIScience Remote. Sens. 2015, 52, 179–197. [Google Scholar] [CrossRef]
  12. Smith, M.J.; Keesstra, S.; Rose, J. Use of legacy data in geomorphological research. GeoResJ 2015, 6, 74–80. [Google Scholar] [CrossRef] [Green Version]
  13. Westoby, M.; Brasington, J.; Glasser, N.F.; Hambrey, M.; Reynolds, J. ‘Structure-from-Motion’ photogrammetry: A low-cost, effective tool for geoscience applications. Geomorphology 2012, 179, 300–314. [Google Scholar] [CrossRef] [Green Version]
  14. Fonstad, M.A.; Dietrich, J.; Courville, B.C.; Jensen, J.L.; Carbonneau, P.E. Topographic structure from motion: A new development in photogrammetric measurement. Earth Surf. Process. Landforms 2013, 38, 421–430. [Google Scholar] [CrossRef] [Green Version]
  15. Gomez, C.; Hayakawa, Y.; Obanawa, H. A study of Japanese landscapes using structure from motion derived DSMs and DEMs based on historical aerial photographs: New opportunities for vegetation monitoring and diachronic geomorphology. Geomorphology 2015, 242, 11–20. [Google Scholar] [CrossRef] [Green Version]
  16. USGS EROS Customer Services USGS EROS Archive-Aerial Photography-Aerial Photo Single Frames. Available online: https://doi.org/10.5066/F7610XKM (accessed on 18 March 2020).
  17. Lowe, D. Object recognition from local scale-invariant features. In Proceedings of the Seventh IEEE International Conference on Computer Vision, Kerkyra, Greece, 20–27 September 1999; Volume 2, p. 1150. [Google Scholar]
  18. Snavely, N.; Seitz, S.M.; Szeliski, R. Modeling the World from Internet Photo Collections. Int. J. Comput. Vis. 2007, 80, 189–210. [Google Scholar] [CrossRef] [Green Version]
  19. Burrough, P.A.; McDonnell, R.A. Creating continuous surfaces from point data. In Principles of Geographic Information Systems; Oxford University Press: Oxford, UK, 1998. [Google Scholar]
  20. Lane, S.N.; Westaway, R.M.; Hicks, D.M. Estimation of erosion and deposition volumes in a large, gravel-bed, braided river using synoptic remote sensing. Earth Surf. Process. Landf. 2003, 28, 249–271. [Google Scholar] [CrossRef]
  21. DeWitt, J.D.; Warner, T.A.; Chirico, P.G.; Bergstresser, S.E. Creating high-resolution bare-earth digital elevation models (DEMs) from stereo imagery in an area of densely vegetated deciduous forest using combinations of procedures designed for lidar point cloud filtering. GIScience Remote. Sens. 2017, 54, 1–21. [Google Scholar] [CrossRef]
  22. Etzelmüller, B. On the Quantification of Surface Changes using Grid-based Digital Elevation Models (DEMs). Trans. GIS 2000, 4, 129–143. [Google Scholar] [CrossRef]
  23. Wheaton, J.; Brasington, J.; Darby, S.E.; Sear, D.A. Accounting for uncertainty in DEMs from repeat topographic surveys: Improved sediment budgets. Earth Surf. Process. Landf. 2009, 35, 136–156. [Google Scholar] [CrossRef]
  24. Taylor, J. An Introduction to Error Analysis: The Study of Uncertainties in Physical Measurements; Physics-chemistry-engineering, University Science Books: Sausalito, CA, USA, 1997. [Google Scholar]
  25. Chandler, J. Technical Communication: Effective application of automated digital photogrammetry for geomorphological research. Earth 1999, 24, 51–63. [Google Scholar]
  26. Lane, S.N.; James, T.; Crowell, M.D. Application of Digital Photogrammetry to Complex Topography for Geomorphological Research. Photogramm. Rec. 2000, 16, 793–821. [Google Scholar] [CrossRef]
  27. Williams, R. DEMs of difference. Geomorphol. Tech. 2012, 2, 1–17. [Google Scholar]
  28. Salach, A. SAPC–application for adapting scanned analogue photographs to use them in structure from motion technology. Int. Arch. Photogramm. Remote Sens. Spatial Inf. Sci. 2017, XLII-1/W1, 197–204. [Google Scholar] [CrossRef] [Green Version]
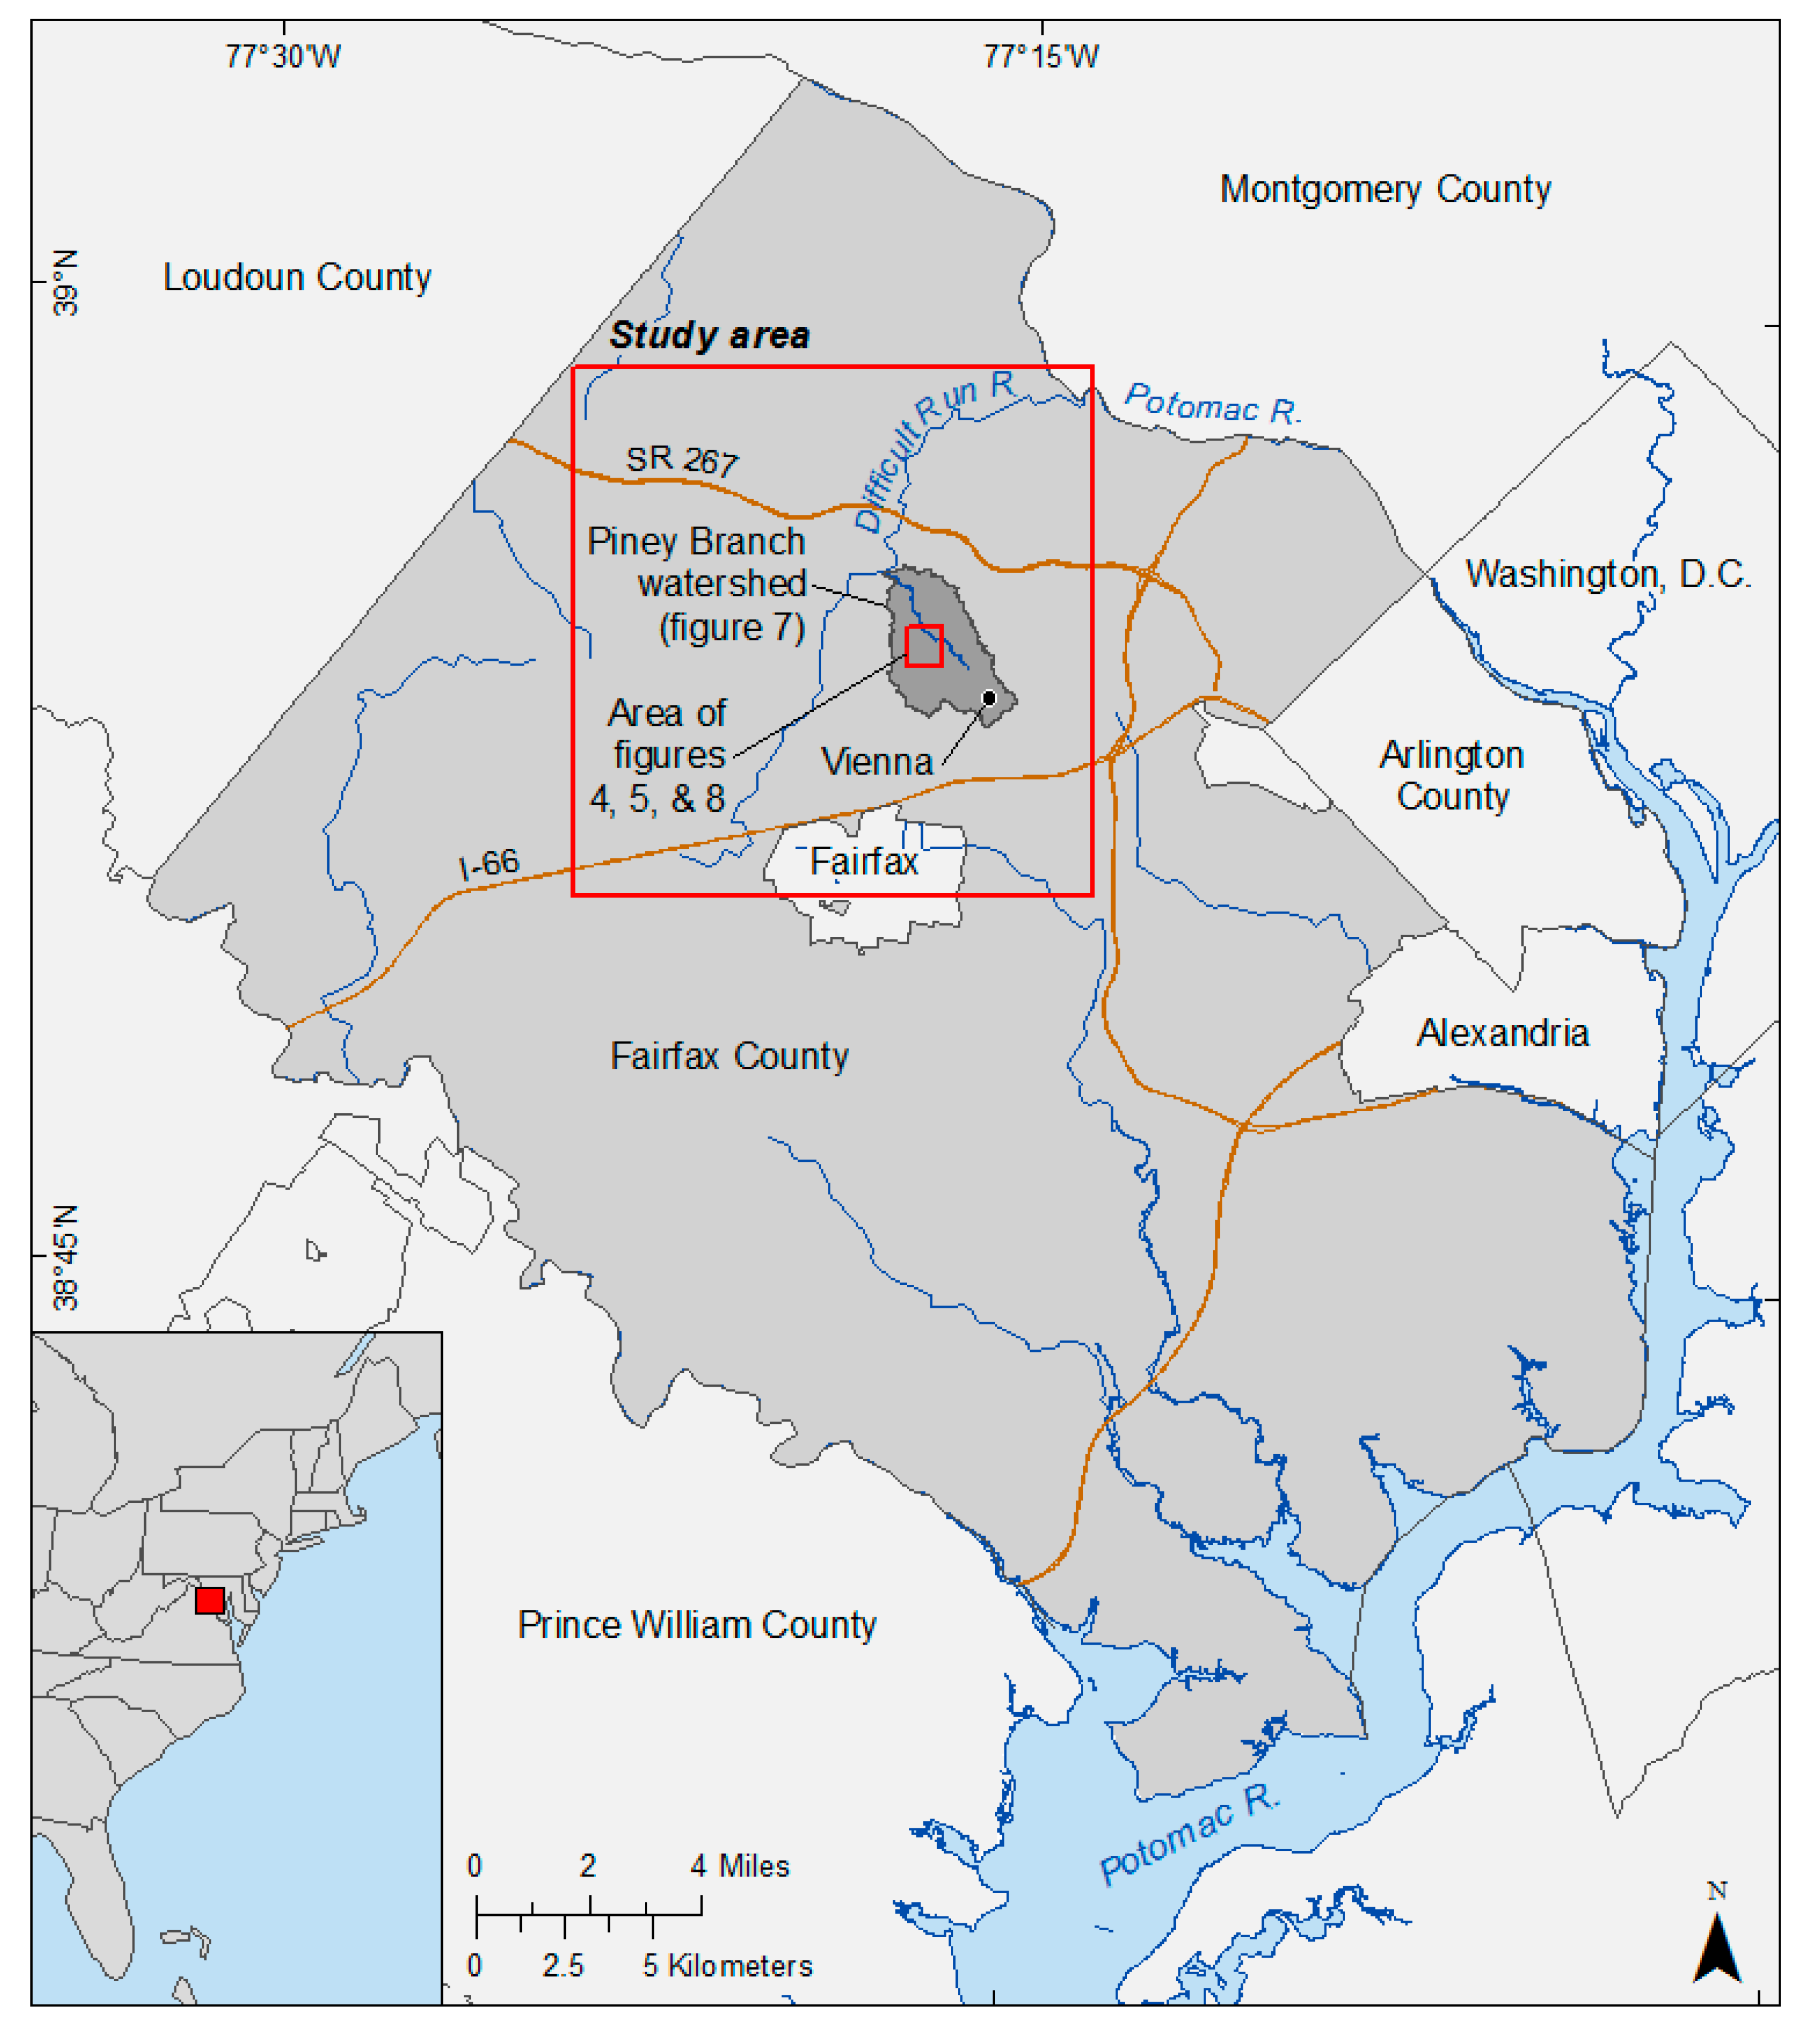
Figure 1. Map of the Piney Branch watershed in Fairfax County, Virginia, where this study was conducted.
Remotesensing 12 01625 g001
Figure 2. Map showing the locations of the ground control points (GCPs) and independent check points (ICPs).
Remotesensing 12 01625 g002
Figure 3. Graphical diagram showing the general processing steps of the methodology.
Remotesensing 12 01625 g003
Figure 4. DTMs produced by SfM analysis of historical aerial images and subsequent filtering.
Remotesensing 12 01625 g004
Figure 5. Orthoimages produced by SfM analysis.
Remotesensing 12 01625 g005
Figure 6. Scatterplot of accuracy values (RMSE in m) and aerial photo scales.
Remotesensing 12 01625 g006
Figure 7. DEM of Difference (DoD) result from 1950 to 2018 analysis of topographic change for Piney Branch watershed. Elevation loss is symbolized in blue, while elevation gain is symbolized in red.
Remotesensing 12 01625 g007
Figure 8. DoD result of topographic change for Piney Branch watershed using RSiQ methods as the thresholds from 1950 to 2018 (a) and 1973-2018 (b). Elevation loss is symbolized in blue, while elevation gain is symbolized in red.
Remotesensing 12 01625 g008
Table 1. Reference digital elevation datasets.
YearHorizontal Resolution (m)Vertical Resolution (m)NameUsed for
20083m0.3LiDAR-based DEM collected by USGS for Washington DC Metro AreaGround Control Point (GCP) elevation values, Independent Control Point (ICP) elevation values
20123m0.19LiDAR-based DEM collected by FEMABare earth DTM for comparison
20181 m0.088VA Fairfax CountyTopographic Change comparison
Table 2. GCPs used as control in SfM model development for historic aerial images. Elevation values were derived from a 3m DTM created from the 2008 lidar point cloud.
GCP IDEasting (X)Northing (Y)GCP Elevation
1303,680.62714,308,232.6065114.1401
2301,027.84314,306,197.5232126.4983
3301,632.68824,30,9477.694389.9634
4303,907.15704,313,620.5091114.5788
5305,415.11654,312,479.0262114.0912
6300,184.38224,311,806.119975.4243
7306,952.88174,307,551.1839140.7249
8306,046.59204,307,541.1486126.9768
9297,523.19094,309,900.5517102.3453
10300,172.46214,305,943.5796128.8150
11301,921.82644,310,440.549491.1252
Table 3. Stereo aerial imagery sets used in the study.
Photo ScaleAcquisition DateExtent of Stereo CoverageProjectFlying Height (ft)Focal Length (mm)Image TypeNumber Images
1:6,0001963 MAR 25 Remotesensing 12 01625 i001VARK03,000153.34B&W15
1:15,0002002 APR 07 Remotesensing 12 01625 i002WAS007,500152.99Color8
1:24,0001950 MAR 30 Remotesensing 12 01625 i003KA00012,000155.07B&W6
1:24,0001963 MAR 29 Remotesensing 12 01625 i004VAQW012,000153.34B&W5
1:24,0001973 MAR 23 Remotesensing 12 01625 i005VDGQ012,000152.58B&W9
1:40,0001988 APR 20 Remotesensing 12 01625 i006NAPP 20,000152.82CIR4
1:40,0001994 MAR 17 Remotesensing 12 01625 i007NAPP 942220,000153.14CIR4
Table 4. Summary of SfM results for each set of historical aerial imagery.
YearScaleNumber of Photo FramesPhoto Resolution (m)SfM Model RMSESfM Orthoimage Resolution (m)SfM DEM Resolution (m)Number of ICPsDEM Vertical RMSE
195024,00060.600.7100.591.17321.430
1963a6000150.150.4690.150.3013 *0.569
1963b24,00050.601.3100.611.22281.816
197324,00090.600.0420.601.21310.928
198840,00041.001.9431.022.04321.859
199440,00041.002.1240.971.95291.877
200215,00080.380.0210.370.7415 *0.520
* denotes fewer ICPs due to smaller image areal extent.
Table 5. Evaluation of topographic change thresholds associated with different temporal intervals.
DEM Comparison DatesTemporal Interval (years)RMSErecentRMSEolderCombined RMSE (m)RSiQ (m)
1963b-1950131.811.4303.2402.31
1973-1963b100.921.8102.7302.03
1988-1973151.850.9202.7702.07
1994-198861.871.8503.7202.63
2002-199460.521.8702.3901.94
1973-1950230.921.4302.3501.70
1994-1973211.871.8103.6802.60
2018-1994240.0881.8701.9581.87
2018-1973450.0880.9201.0080.92
2018-1963a550.0880.5690.6570.58
2018-1950680.0881.4301.5181.43