Abstract
CryoSat-2 altimetry has become a valuable tool for monitoring the water level of lakes. In this study, a concentrated probability density function (PDF) method was proposed for preprocessing CryoSat-2 Geophysical Data Record (GDR) data. CryoSat-2 altimetry water levels were preprocessed and evaluated by in situ gauge data from 12 lakes in China. Results showed that the accuracy of the raw GDR data was limited due to outliers in most of the along-track segments. The outliers were generally significantly lower than the in situ values by several meters, and some by more than 30 m. Outlier detection, therefore, improves upon the accuracy of CryoSat-2 measurements. The concentrated PDF method was able to greatly improve the accuracy of CryoSat-2 measurements. The preprocessed CryoSat-2 measurements were able to observe lake levels with a high accuracy at nine of the twelve lakes, with an absolute mean difference of 0.09 m, an absolute standard deviation difference of 0.04 m, a mean root mean square error of 0.27 m, and a mean correlation coefficient of 0.84. Overall, the accuracy of CryoSat-2-derived lake levels was validated in China. In addition, the accuracy of Database for Hydrological Time Series of Inland Waters (DAHITI) and HYDROWEB water level products was also validated by in situ gauge data.
1. Introduction
Lakes are a key component of the earth’s surface system and serve as a meeting point for the atmosphere, geosphere, hydrosphere, and biosphere. Changes in lakes and their induced environmental evolutions are the result of global and regional climate events, to which they show great sensitivity. It is, therefore, important to continuously monitor the water levels of lakes. In situ gauge stations provide precise water-level observations, but they are limited to relatively few lakes because they are expensive, especially in remote areas. In addition, in situ water-level data are usually managed by government institutions who sometimes make data access difficult. Therefore, satellite altimetry has become a valuable tool to monitor the water levels of lakes.
There are two types of satellite altimeters: radar altimeters and laser altimeters. A laser altimeter has only been carried on the Ice, Cloud, and land Elevation (ICESat) platform, launched in 2003 [1]. The short temporal coverage (2003–2009) and limited temporal resolution (two or three monthly) impede the investigation of water-level changes over longer timescales [2]. The new version ICESat-2 was launched in September 2018, and it is able to monitor inland water levels [3]. All other satellite altimetry missions have carried radar altimeters, including SeaSat, Geosat, TOPEX/Poseidon, and Jason-1/2/3 from the National Aeronautics and Space Administration (NASA), and European Remote Sensing (ERS), Environmental Satellite (Envisat), Cryosat-2, and Sentinel-3 from the European Space Agency (ESA). A summary of satellite altimetry missions can be found in [4].
Cryosat-2 has a new type of synthetic aperture interferometric radar altimeter (SIRAL), which can be operated in synthetic aperture radar (SAR) mode and SAR interferometric (SARIn) mode. These two modes have a finer along-track resolution compared to traditional pulse-limited altimeters [5]. In addition, it also has different shaped waveforms than conventional altimeters because of its much faster decay rate [6]. This enables the altimeter to estimate the water levels of smaller lakes, even under a low resolution mode (LRM). Cryosat-2′s orbit drifts through all angles to the Sun over a period of approximately 16 months. This drifting ground track pattern enables the altimeter to monitor more lakes [4].
In addition to its main design objective being to measure ice sheet elevation change and sea surface levels, satellite altimetry has also been widely used for estimating the water levels of lakes and rivers [7,8,9]. Water levels derived from satellite radar altimetry have been evaluated and validated in inland water bodies worldwide. The root mean square error (RMSE) ranges from a few centimeters to tens of centimeters in lakes, reservoirs, and wetlands [10,11,12,13,14,15], and it ranges from a few centimeters to more than one meter in rivers [16,17,18,19], depending on the size of the water body and wind conditions. For CryoSat-2, Nielsen et al. [8] evaluated altimetry measurements by in situ data at five lakes, and found that the precision of the CryoSat-2-derived water levels is better than that of Envisat, even for smaller lakes (with surface areas ranging from 9 to 40 km2). Göttl et al. [20] evaluated CryoSat-2 altimetry using in situ data from four lakes, with areas ranging from 390 to 2600 km2. They found the RMSE was between 3 and 90 cm. Bogning et al. [21] assessed the performance of five altimetry missions in terms of measured water levels, namely ERS-2, Envisat, Cryosat-2, Satellite with ARgos and ALtiKa (SARAL), and Sentinel-3A. Their results shown that Cryosat-2 displayed the best agreement with in situ data (R2 = 0.96 and RMSE = 0.25 m). An RMSE accuracy of a few centimeters can be achieved over large lakes (e.g., 4.4 cm over Lake Superior, North America, with an area of 82,000 km2) [9]. This is because the size of these lakes leads to ocean-like conditions and, hence, only a few altimeter measurements near the lake’s shore would be contaminated by land [9]. The evaluation of CryoSat-2 altimetry by in situ data for Namco Lake, China (~2000 km2) showed a high correlation coefficient (CC) of 0.71, a mean error of −12 cm, and an RMSE of 18 cm [22].
When applying satellite altimetry measurements, outlier detection is important for data pre-processing. In spite of careful data selection through the classification and in the height retrieval, some of the observed water levels have to be considered as outliers [23], since outliers may lead to a significant error in the height retrieval. Therefore, it is important for outlier detection to be carried out before the use of altimetry data [20]. Outliers are generally detected for each individual along-track segment. One of the most common techniques for outlier detection is the mean and standard deviation (MSD) method. It calculates the mean (μ) and the standard deviation (SD) of a path segment [24]. Data that are outside the limits of μ ± kSD, where k is a constant, are deemed to be outliers. For example, Kleinherenbrink et al. [25] used a 3 SD threshold to identify measurements of land surfaces as outliers. An RMSE value of 3 was also used to identify outliers, but in some cases this resulted in values several hundreds of meters above the water level, especially in areas with strong topography [1]. This method loses its usefulness in such regions, and a subjective threshold would need to be used instead of an RMSE value of 3. In addition, since both the mean and the SD are particularly sensitive to outliers, this mean-based method is problematic. Leys et al. [26] proposed the median absolute deviation (MAD) method for outlier detection. For example, Frappart et al. [19] and Passaro et al. [27] used the MAD method to check and eliminate outliers from the Envisat altimetry products. Schwatke et al. [9] used an absolute deviation around the median as the threshold for valid (lake) and invalid (non-lake) data. The random sample consensus algorithm, which is commonly used in computer vision, has also been applied to handle outliers [16]. In addition, a subjective threshold could also be used for outlier detection [23]. Based on the inferred probability density function, Nielsen et al. [8] used a mixed distribution between a Gaussian and a Cauchy distribution, where observations far away from the mean were given a relatively high probability. Then, outliers were reflected by a fraction parameter between the two distributions. The resulting fraction parameter was subjectively chosen to equal 0.3. However, as mentioned above, the mean-based distribution is also sensitive to outliers.
The most distinguishing feature of water surfaces compared with land surfaces is that a water surface is generally flat. Therefore, “correct” altimetry water levels tend to have a small range, meaning they are concentrated in the resulting histogram of estimated values. In this study, we propose an alternative concentrated probability density function (PDF)-based method for outlier detection within individual along-track segments that takes advantage of the flat surface of the water in lakes.
The main objective of this study is to evaluate CryoSat-2 altimetry water levels by using in situ gauging data in China. A concentrated PDF method is proposed and used to preprocess CryoSat-2 data and identify mean water levels. Then, the identified altimetry-derived water levels were compared with in situ data from 12 lakes in China. The performance of the proposed method is also compared with two other common methods of outlier detection mentioned above, namely the MSD method and the MAD method. Finally, the preprocessed CryoSat-2 results are assessed through their comparisons against in situ gauge station records, based on the evaluation criteria of the mean value, the SD, the RMSE, and the CC. Two widely used hydrological databases, which include the Database for Hydrological Time Series of Inland Waters (DAHITI) and HYDROWEB, are also evaluated by in situ data.
2. Materials and Methods
2.1. Data
2.1.1. CryoSat-2
Level 2 Geophysical Data Record (GDR) data were used in this study. They were distributed by ESA and are available for download via ftp at ftp://science-pds.cryosat.esa.int. GDR data are delivered less than 30 days after data acquisition and are available for periods since July 2010. The GDR contained the time of measurement, the ground location, and the height of the surface above the reference ellipsoid. The height was fully corrected for instrumental effects, propagation delays, measurement geometry, and other geophysical effects. The geophysical corrections included dry and wet troposphere corrections, the inverse barometric correction, dynamic atmospheric corrections, ionospheric corrections, and corrections for tidal effects. They were applied to compensate for the interaction of the radar signal with the atmosphere and the lake’s surface. GDR data were retracked with the SAMOSA retracker. The spatial resolution along the track was approximately 300 m. The reference ellipsoid was WGS84. A detailed description of the CryoSat-2 GDR data can be found in [28]. Water-level measurements over lakes were extracted by lake masks identified from Landsat remote sensing images by an automatic identification method [29]. Based on the availability of images, Landsat images were selected for low lake levels according to in situ data. In addition, the boundary of each lake mask was reduced by 500 m to avoid the contamination of the signals by lakeshores (seen in Figure 1).
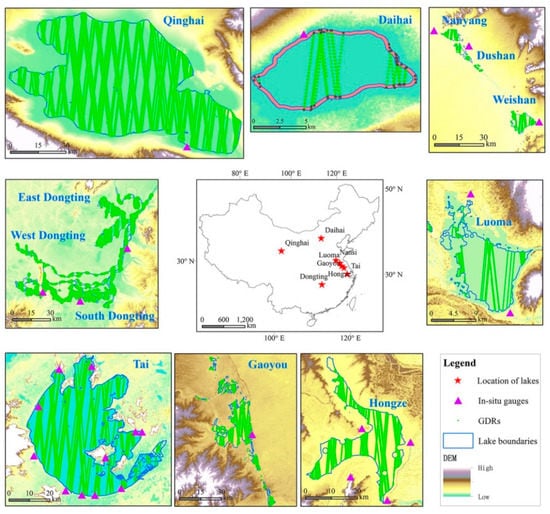
Figure 1.
The locations of the studied lakes, in situ gauges, and CryoSat-2 geophysical data record (GDR) tracks.
2.1.2. Hydrological Databases
There were two global hydrological databases used in this study, including the DAHITI [9] and HYDROWEB [30]. DAHITI and HYDROWEB provide water level time series of lakes from multi-mission satellite altimetry for hydrological applications. Altimeter missions included Topex, Jason, GFO, Envisat, ERS, Cryosat, IceSAT, SARAL/Altika, and Sentinel. Water level time series of three lakes (Tai, Qinghai, and South Dongting) with normal heights were obtained from the DAHITI website (https://dahiti.dgfi.tum.de/en/). Products of two lakes (East Dongting and Hongze) were also obtained from the HYDROWEB site (http://hydroweb.theia-land.fr/). The series used in this study were from 2010 to 2015. Altimetry water levels were observed with SARAL at Tai and Qinghai lakes, while water levels were measured by Jason-2 at South Dongting, East Donting and Hongze lakes.
2.1.3. In Situ Data
In situ gauge data were used to evaluate and validate CryoSat-2 altimetry-derived water levels. Data were obtained from the China Hydrological Yearbook. There were 26 national in situ gauges located at 12 lakes in China. Almost all of the gauge data were referenced to the Chinese height system, including the “National datum plane 1985” (NDL 85), the Yellow Sea datum plane, and the Wusong datum plane. The only exception was the Sansumu gauge at Daihai Lake. A height system was not available at this lake, and the gauge measured the lake surface height based on an assumed datum plane. Since the absolute lake surface height was unknown, the focus was on the evaluation of height variations at this lake. In order to compare all of these observations with the CryoSat-2 GDR data, all gauge data were transformed to the NDL 85 system. It should be noted that the GDR data were measured with respect to ellipsoidal heights above WGS84, where there is was difference of 0.357 m between the NDL85 system and the WGS84 quasigeoid in China [31].
2.1.4. Study Area
The proposed method was applied to the 12 lakes that had gauge observations, whose locations are shown in Figure 1. Locations of the ground tracks were also displayed in this figure. Qinghai Lake was observed in SAR mode, and the other lakes were covered in LRM. The lakes were chosen because of their size and availability of in situ data for validation. The lakes had surface areas ranging from 31.6 to 4149.8 km2. These lakes provided the opportunity to investigate the performance of CryoSat-2 over larger lakes (>500 km2, e.g., Qinghai Lake), medium lakes (50–500 km2, e.g., Luoma Lake), and smaller lakes (<50 km2, e.g., Dai Lake).
2.2. Method
2.2.1. The Concentrated Probability Density Function (PDF) Method for Each Along-Track Geophysical Data Record (GDR)
It is necessary to detect outliers in each relevant along-track segment of the GDR data before their application to determine altimetry-derived water levels. Each measurement could either represent the correct lake level, or it could be affected by a contaminated signal. In general, outlier detection methods were used to identify contaminated signals. As mentioned above, “correct” altimetry water levels tended to be concentrated within the resulting histogram because of the relatively flat water surface. The concentrated altimetry water levels could effectively represent actual lake levels. Therefore, we proposed the concentrated PDF method, which set out to detect the “correct” altimetry water levels to represent the lake level in each along-track segment.
The concentrated PDF method also rejected altimetry measurements that did not represent the flat-water level of the lake target, which was detected by the median absolute deviation (MAD) method. Details for the MAD method can be found in [26]. MAD has been proven to be more robust than the mean and standard deviation (MSD) in the detection of outliers [26]. This can also be validated by our evaluations, as will be shown in the Results section. The histogram is a classical nonparametric PDF estimator [32]. To construct a histogram, the first step was to identify the bins (intervals). Four estimators [32,33,34,35] that predicted the optimal bin width were compared in this study. The performance of the four estimators showed little difference. This was because the concentrated PDF method aimed to detect the majority of “correct” altimetry water levels by the continuous cumulative frequency >50%. This reduced the effect of bin width on the final result. Based on these results, the Bendat and Piersol estimator, which showed a slightly better performance than the other three estimators, was selected to calculate the optimal bin width in this study.
The concentrated PDF method is described as follows (Figure 2):
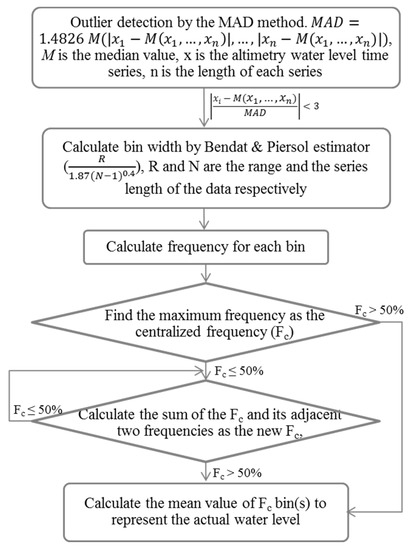
Figure 2.
The procedure of the concentrated probability density function (PDF) method.
- Outlier detection for each along-track by the MAD method. MAD is calculated by Equation (1) according to [26].where M is the median value of a series, x is the altimetry water level time series, and n is the length of each series. If , or , then these GDR points were deleted as outliers.
- For the remaining GDR heights, if the number of GDR heights in the along-track segment was larger than 5, then we calculated the bin width using the Bendat and Piersol estimator [33]. If the number of heights was less than or equal to 5, the along-track data were abandoned.
- Calculate the frequency (F) for each bin. , in which nb is the number of heights in a bin, and N is the number of heights in an along-track segment.
- Find the maximum frequency as the concentrated frequency (Fc). If Fc > 50%, then go to step 6, otherwise, go to step 5. This step aimed to detect the majority of “correct” altimetry water levels.
- Calculate the sum of the Fc and its adjacent two frequencies as the new Fc. If the new Fc > 50% then go to step 6, otherwise repeat step 5 until the new Fc > 50%.
- Calculate the mean value of the Fc bin(s) to represent the actual water level.
2.2.2. Evaluation Criteria
The concentrated PDF method was evaluated and validated by in situ lake level data. In addition, the performance of the raw GDR data and the two common outlier detection methods, the MSD and the MAD, was also evaluated by in situ data. For the MSD method, a limit of μ ± 3SD was used to detect outliers.
The evaluation criteria included the mean difference (Equation (2)), the SD difference (Equation (3)), the RMSE (Equation (4)), and the CC (Equation (5)).
where n is the number of GDR heights in an along-track segment, and WLai and WLgi are the ith values of the altimetry and in situ gauge-observed water level time series, respectively.
3. Results
3.1. Evaluation of Different Pre-Processing Methods of the CryoSat-2 GDR Water Levels
The altimetry measurements might be contaminated by non-lake surface reflections because of the large altimeter footprint size, where the antenna beam width of CryoSat-2 across the track was approximately 1.63 km in the LRM and SAR modes. The MAD and MSD methods were used to detect these contaminated altimetry measurements. The absolute mean of all evaluation criteria as well as for each lake showed a better performance for the MAD method than for the MSD method (Table 1). Therefore, the MAD method was used for outlier detection in each along-track before the application of the concentrated PDF method. The outliers were generally located near lake shores or islands. However, there were also a few outliers located at the center of the lake (Figure 3). The contaminated altimetry measurements (outliers) were generally much lower than the in situ gauge values by several meters, and some even by more than 30 m (Figure 4).

Table 1.
Evaluation results of the CryoSat-2 water levels by in situ gauge data. Note: “GDR” is raw GDR.
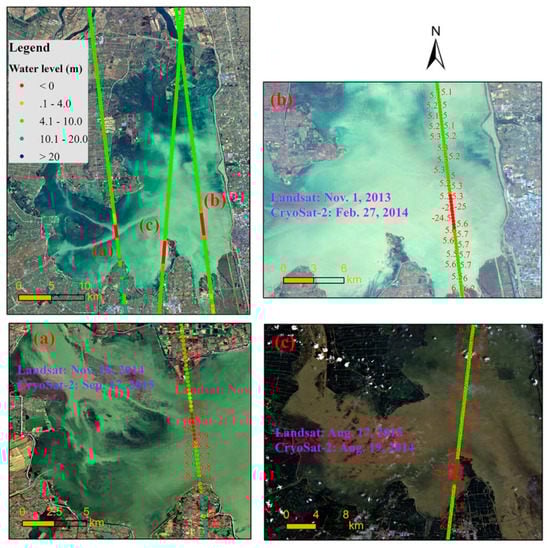
Figure 3.
Outliers in the center of Gaoyou Lake. Note: the base map was obtained from Landsat OLI images. The red dots represent outliers.
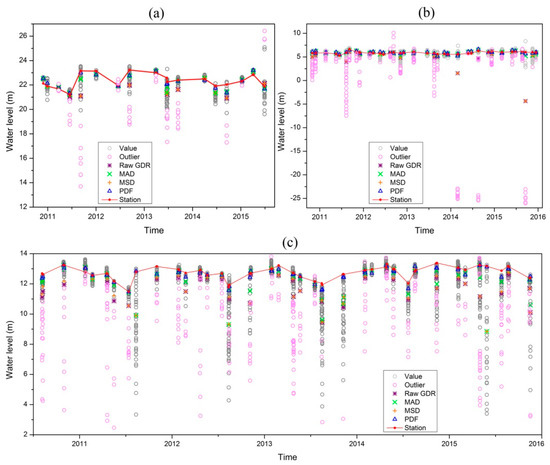
Figure 4.
Altimetry and in situ station gauging lake levels for (a) Luoma Lake, (b) Gaoyou Lake, and (c) Hongze Lake. Circles are GDR values for each along-track segment, in which the light magenta circles are outliers. Red dots are station gauging water levels, while blue triangles, green “×”, orange “+”, and purple “∗” are altimetry water levels detected by the concentrated PDF, the median absolute deviation (MAD) method, the mean and standard deviation (MSD) method, and the raw GDR, respectively.
The performances of the three considered pre-processing methods (namely MAD, MSD, and concentrated PDF) for the altimetry water levels, which were evaluated by in situ gauge data for the time period 8 April 2010 to 31 December 2015, are presented in Table 1. The three methods were: (1) the mean of remaining values after MAD outlier detection, (2) the mean of remaining values after MSD outlier detection, and (3) the concentrated PDF on remaining values after MAD outlier detection. In addition, the performance of raw GDR data, which was the mean of all values inside the lake mask without any outlier detection, was also represented in the table. With respect to the in situ gauge data, all three methods could improve the accuracy of the CryoSat-2 GDR water levels, especially the concentrated PDF and MAD methods. The mean difference of the raw GDR water levels with respect to the in situ data ranged from −1.04 to 0.98 m for each lake. The average absolute value of these means was 0.40 m for all lakes. It was improved to 0.16 m, 0.25 m, and 0.37 m by applying the concentrated PDF, MAD, and MSD methods, respectively. The mean SD absolute difference of all lakes was 0.36 m for the raw GDR data. The concentrated PDF and MAD methods were able to improve this to 0.06 m and 0.19 m, respectively. The mean RMSE of all lakes was 0.70 m for the raw GDR data, while the concentrated PDF method was able to improve it to 0.27 m. The mean CC of all lakes was only 0.57 for the raw GDR data. However, the concentrated PDF method was able to improve this to 0.86. Overall, the concentrated PDF method could greatly improve upon the accuracy of the GDR water levels.
Figure 4 and Figure 5 show lake levels monitored by CryoSat-2 and the in situ gauge stations at each lake. The concentrated PDF method generally showed the best performance in monitoring the water levels in each lake and along-track segment (Figure 4 and Figure 5), with its values closer to the in situ gauge lake levels compared with the MSD, MAD, and raw GDR values. The MAD method was also able to accurately monitor water levels for most along-track segments; however, it was not able to do so for some of them, with the largest differences being more than 15 m (Figure 5h). The raw GDR only had the capacity to observe lake levels for a few along-track segments, which displayed a low SD (e.g., <1 m), where it tended to underestimate lake levels. The MSD method only slightly improved upon the performance of the raw GDR.
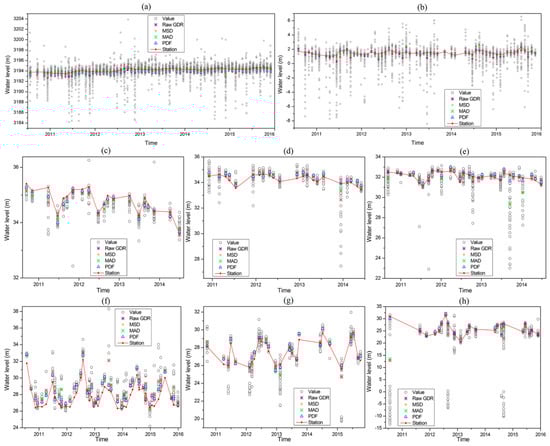
Figure 5.
Altimetry and in situ gauge lake levels for (a) Qinghai Lake, (b) Tai Lake, (c) Nanyang Lake, (d) Dushan Lake, (e) Weishan Lake, (f) West Dongting Lake, (g) South Dongting Lake, and (h) East Dongting Lake. The symbols are the same as Figure 4.
It can be seen from Figure 4 and Figure 5 that the altimetry errors of the raw GDR had a strong correlation with the SD of each along-track segment. Figure 6 shows a scatter plot of the SD for each along-track segment against the absolute difference of the raw GDR by comparing them with the in situ water levels of all lakes. The mean SD of all along-track segments was 0.80 m. The R2 of the raw GDR was 0.79 and 0.83 for the linear and polynomial regressions, respectively. Overall, the altimetry errors of the raw GDR showed a strong positive correlation with the SD of each along-track segment. In other words, the greater the SD, the greater the error. The concentrated PDF method improved the altimetry lake levels more for the along-track segments with larger SDs (Figure 4 and Figure 5). However, this positive correlation was lower at some lakes, including the Nanyang, the Dushan, the South Dongting, the Qinghai, and the Tai lakes. This indicated that the effects of the SD on the accuracy of the raw GDR were comparatively lower at these lakes, although the raw GDR heights displayed a relatively higher accuracy. This was verified by the RMSE results, since the RMSE was also lower at these lakes (<0.4 m). These five lakes could, therefore, be classified into three categories. First were the lakes with a lower SD for each along-track segment (<0.3 m), including the first two lakes. The second was the larger lakes, including the last two lakes. The third was South Dongting Lake, which only had approximately 10 GDR measurements in each along-track segment, as its width in the along-track direction was only around 3~4 km.
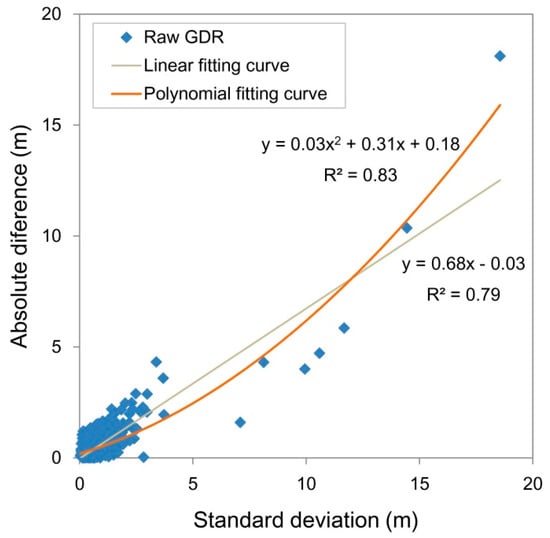
Figure 6.
Scatter plot of the standard deviation for each along-track segment against the absolute difference of the raw GDR compared with in situ gauge measurements.
3.2. Validation of the CryoSat-2 GDR Water Levels
The raw GDR data were able to measure lake levels in a few lakes with RMSE values less than 0.4 m, including the Nanyang, the Dushan, the Tai, and the Qinghai lakes. The Qinghai and Tai lakes, whose surfaces covered approximately 2000 and 4000 km2, respectively, could be large enough to provide reliable altimetry-derived water level time series. However, there were also some contaminated altimetry measurements, whose differences from the in situ gauge lake levels were up to ten meters (Figure 5). The raw GDR data performed poorly in the other lakes, especially for the Gaoyou, the Hongze, the West Dongting, and the East Dongting lakes, with the RMSE being greater than 0.8 m. Considering these examples, Hongze Lake was characterized as being shallow and widely covered by grasses, which might have contaminated the altimetry measurements. The West Dongting Lake was characterized by a narrow width and many islands because of the decline of the local water table. Altimetry measurements would therefore be contaminated by the presence of these islands. For the Gaoyou and the East Dongting lakes, the contamination of the altimetry measurements may have been caused by extreme deviations in several of the along-track segments (Figure 4b and Figure 5h). It should be noted that, except for the Dongting and the Tai lakes, the lakes located in northern China may freeze partially in winter. Frozen ice over the lakes would contaminate the altimetry measurements, and cause an underestimation of lake levels by the raw GDR data. Some underestimations in winter may be explained partially in this manner, for example, the along-track of 27 February 2014 at the Gaoyou Lake (Figure 4b), 27 November 2014 at the Qinghai Lake (Figure 5a), and 13 December 2013 at the Dushan Lake (Figure 5d).
Although the raw GDR data lacked the ability to accurately monitor water levels for most of the considered lakes, the optimized GDR data from the concentrated PDF method were able to do so with little difference when compared to in situ gauge data (see Figure 4 and Figure 5). The average absolute value of mean and the SD differences of all lakes were 0.16 and 0.06 m, respectively. The mean RMSE of all lakes was 0.27 m. The concentrated PDF method showed a relatively better performance for nine of the twelve lakes, since the RMSE was lower than 0.30 m in each lake, with the mean RMSE of these nine lakes being 0.23 m. It showed a comparatively poorer performance for the West, the South, and the East Dongting lakes. These three lakes belonged to Dongting Lake, which is connected to the Yangtze River, the largest river in China. The water levels changed significantly in this lake, since its SD was obviously greater than the other lakes (Table 1). There were also many islands in the lakes, which was a main reason for the poorer quality altimetry water level values.
Water level products of the DAHITI and HYDROWEB were also evaluated by in situ gauge data. Results are shown in Table 2. In general, DAHITI products showed good agreement with in situ data, with a mean RMSE of 0.21 at three lakes. HYDROWEB products were also able to capture in situ data at Hongze Lake, with RMSE and SD difference of 0.25 and 0.03, respectively. But it showed a relatively poorer performance at East Dongting Lake (RMSE = 0.84). Overall, two products also showed a comparatively poorer performance at the South and the East Dongting lakes. This was similar to CryoSat-2 data, as shown in Table 1. Compared with CryoSat-2 GDR data preprocessed by the concentrated PDF method, these two products showed similar performances at five observed lakes, especially for the Tai, Hongze, and South Dongting lakes. In other words, the accuracy of DAHITI and HYDROWEB water level products was also validated by in situ data.
Table 2.
Evaluation results of the Database for Hydrological Time Series of Inland Waters (DAHITI) and HYDROWEB water levels by in situ gauge data.
4. Discussion
The CryoSat-2 altimetry measurements have been evaluated by in situ gauge data, and were found to accurately monitor water levels at many lakes [1,8,9,18,36]. However, these lakes are mainly located in Europe and North America, where gauge measurements are available for most lakes. In this study, the CryoSat-2 water levels were evaluated by in situ gauge measurements of absolute heights at 12 lakes in China. Our results showed that the CryoSat-2 measurements were able to monitor robustly lake levels. However, there are more than 690 lakes with areas larger than 10 km2 in China [37], while gauge measurements are only available for a few. Some gauges even measure without reference to the geoid. Therefore, CryoSat-2 altimetry would be valuable for monitoring water levels at lakes without any in situ gauges. In addition, it measures absolute heights over a global scale by using the WGS84 reference ellipsoid. This makes it available for comparative studies of different regions on a global scale.
While altimetry measurements are generally evaluated by in situ gauge data, there are four aspects contributing to the mismatches between the altimetry and in situ gauge measurements, including the mismatch of temporal and spatial scales, reference system transformation, and ground locations. First, altimetry measures an instantaneous lake level, while in situ gauge measurements provide the mean lake level over a given period (e.g., daily). For example, according to in situ gauge records, the water level difference is usually relatively small at Tai Lake, although it can reach up to 0.3 m, with a mean value of 0.12 m during the flood period. Second, altimetry measurements cover a footprint area, while in situ gauges only measure lake levels at a specific site. Third, a constant transformation value (0.357 m) between in situ and altimetry system deviations was used for the study area due to data limitation. But the system deviation changes from 0.272 to 0.547 m in China [31]. It increases from east to west, and increases from south to north in China [31]. Fourth, the CryoSat-2 ground tracks are usually not coincident with in situ gauges because of its drifting ground track pattern (as shown in Figure 1). Again, considering Tai Lake, the spatial difference of the water levels is relatively small, but it still displays a mean difference of 0.1 m from east to west. All of these mismatches might explain the differences that have been identified between the CryoSat-2 and in situ gauge measurements. Although the RMSE was from 0.1 to 0.3 m for most lakes considered in this study, the CryoSat-2 altimetry measurements could be expected to have a very high precision in monitoring actual lake levels (if these mismatches could be overcome).
Contaminated altimetry measurements (outliers) were found in all of the 12 considered lakes. The outliers were generally significantly lower than the in situ gauge values by several meters, and some by even more than 30 m. Hence, these outliers would greatly affect altimetry water level results. Altimetry measurements could be contaminated by land, ships, or frozen ice in winter [9,38]. Therefore, it is necessary to detect outliers before the application of altimetry data. This was validated by this study. Other causes of contamination include thick grasses, as in the case of Hongze lake. There were also some outliers located at the center of lakes without any of the effects mentioned above, for example, East Dongting Lake. Some of these outliers were lower than the in situ gauge values by more than 20 m. Hence, the reasons behind these effects are still in need of further research.
Overall, the concentrated PDF method was able to greatly improve upon the accuracy of the CryoSat-2 GDR measurements, when compared with raw GDR data. CryoSat-2 measurements showed the best performance at Tai Lake, which is large enough to provide reliable altimetry water levels for each along-track and is without any frozen ice coverage. However, the concentrated PDF method showed little improvement in the altimetry measurements for those lakes with a narrow width (e.g., the South Dongting lakes), which saw limited GDR data points in the relevant along-track segments. Altimetry measurements showed relatively larger differences against the in situ lake levels at the three Dongting lakes, with a mean RMSE of 0.38 m. This might be caused by two reasons. One was the large spatial difference of water levels resulting from the great length of the lake. The mean spatial difference of the lake levels was greater than 4 m (Figure 7) along the lake’s length of 90 km. The altimetry ground tracks were generally several kilometers to tens of kilometers away from the in situ gauges, hence, this explains part of this difference. The other reason is the large daily differences in water levels. According to in situ gauge records, the mean daily difference of water levels was 0.20 m, with the maximum value reaching up to 0.77 m, offering an explanation for the significant difference between instantaneous altimetry measurements and in situ daily lake levels.
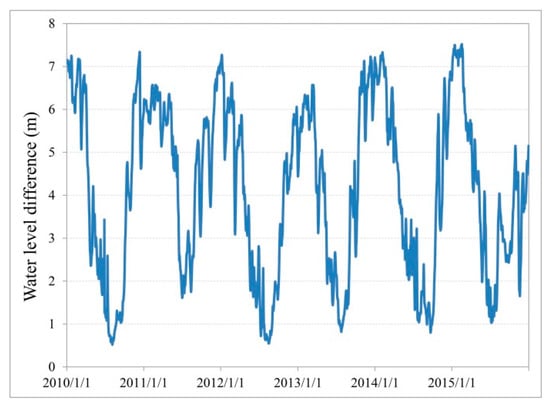
Figure 7.
Daily water level differences between West and East Dongting lakes.
5. Conclusions
CryoSat-2 altimetry measurements have been widely used for monitoring lake levels around the world. However, the accuracy of the raw GDR data is limited when compared to in situ gauge data. In this study, an alternative data pre-processing method (the concentrated PDF method) was proposed and validated for CryoSat-2 GDR data. This method takes advantage of the flat nature of the water surfaces of lakes, which is the most unique feature of lakes compared with other underlying surfaces. CryoSat-2 altimetry water levels were evaluated and validated by in situ gauge data from 12 lakes in China. Based on this analysis, several conclusions may be made:
(1) It is necessary to consider outliers before applying CryoSat-2 GDR data, since these were detected in most along-track segments for all lakes and would greatly affect altimetry water level estimates. The outliers were generally lower than the in situ gauge values by several meters, some by more than 30 m. Altimetry measurements may be contaminated by land, thick grasses, ships, or frozen ice. Outlier detection could improve the accuracy of CryoSat-2 GDR measurements when evaluated by in situ gauge data. The MAD method showed a better performance than the MSD method in detecting outliers.
(2) The concentrated PDF method was able to greatly improve the accuracy of CryoSat-2 water levels. The mean values of the mean differences, the SD differences, the RMSE, and the CC for all lakes were improved from 0.40, 0.36, 0.70, and 0.57 m to 0.16, 0.06, 0.27, and 0.86 m, respectively. It generally showed the best performance in monitoring water levels for each along-track segment in all lakes. The raw GDR was only able to observe lake levels at an appropriate accuracy for a few along-track segments, which showed a low SD (e.g., <1 m). The MAD method also showed comparatively better performance for most along-track segments. The MSD method showed limited ability in improving the performance of the raw GDR.
(3) The evaluation of CryoSat-2 GDR water levels with in situ lake level observations indicated that the pre-processed CryoSat-2 measurements were able to observe lake levels with a high accuracy at nine of the twelve lakes, with an absolute mean difference of 0.09 m, an absolute SD difference of 0.04 m, a mean RMSE of 0.23 m, and a mean CC of 0.84. Although it showed a relatively lower performance with a mean RMSE of 0.38 m, it indicated a high CC of 0.97 (p < 0.001) at the three Dongting lakes. Overall, the accuracy of CryoSat-2-derived water levels was validated by in situ lake data from China.
(4) The accuracy of DAHITI and HYDROWEB water level products were also validated by in situ gauge data. The two products showed similar performance with CryoSat-2 GDR data preprocessed by the concentrated PDF method.
Author Contributions
Z.L. and Z.Y. conceived, designed, and performed the experiments; Z.L. and R.W. analyzed the data; Z.L. wrote the paper.
Funding
This study was funded by National Natural Science Foundation of China, grant number 41571027, 41561144012, and 41661144030.
Acknowledgments
We would like to thank the European Space Agency for providing the Level 2 Geophysical Data Record data. We also thank Salvatore Dinardo for his help on dealing with data.
Conflicts of Interest
The authors declare no conflict of interest.
References
- Kleinherenbrink, M.; Ditmar, P.G.; Lindenbergh, R.C. Retracking Cryosat data in the SARIn mode and robust lake level extraction. Remote Sens. Environ. 2014, 152, 38–50. [Google Scholar] [CrossRef]
- Schutz, B.E.; Zwally, H.J.; Shuman, C.A.; Hancock, D.; DiMarzio, J.P. Overview of the ICESat mission. Geophys. Res. Lett. 2005, 32, 1–4. [Google Scholar] [CrossRef]
- Neuenschwander, A.; Pitts, K. The ATL08 land and vegetation product for the ICESat-2 Mission. Remote Sens. Environ. 2019, 221, 247–259. [Google Scholar] [CrossRef]
- Jiang, L.; Schneider, R.; Andersen, O.B.; Bauer-Gottwein, P. CryoSat-2 altimetry applications over rivers and lakes. Water 2017, 9, 211. [Google Scholar] [CrossRef]
- Ricker, R.; Hendricks, S.; Helm, V.; Gerdes, R. Classification of CryoSat-2 radar echoes. In Towards an Interdisciplinary Approach in Earth System Science; Lohmann, G., Meggers, H., Unnithan, V., Wolf-Gladrow, D., Notholt, J., Bracher, A., Eds.; Springer: Cham, Switzerland, 2015; pp. 149–158. [Google Scholar]
- Raney, R.K. The delay/doppler radar altimeter. IEEE Trans. Geosci. Remote Sens. 1998, 36, 1578–1588. [Google Scholar] [CrossRef]
- Crétaux, J.F.; Bergé-Nguyen, M.; Calmant, S.; Romanovski, V.V.; Meyssignac, B.; Perosanz, F.; Tashbaeva, S.; Arsen, A.; Fund, F.; Martignago, N.; et al. Calibration of envisat radar altimeter over Lake Issykkul. Adv. Space Res. 2013, 51, 1523–1541. [Google Scholar] [CrossRef]
- Nielsen, K.; Stenseng, L.; Andersen, O.B.; Villadsen, H.; Knudsen, P. Validation of CryoSat-2 SAR mode based lake levels. Remote Sens. Environ. 2015, 171, 162–170. [Google Scholar] [CrossRef]
- Schwatke, C.; Dettmering, D.; Bosch, W.; Seitz, F. DAHITI—An innovative approach for estimating water level time series over inland waters using multi-mission satellite altimetry. Hydrol. Earth Syst. Sci. 2015, 19, 4345–4364. [Google Scholar] [CrossRef]
- Birkett, C.M.; Beckley, B. Investigating the performance of the Jason-2/OSTM radar altimeter over lakes and reservoirs. Mar. Geod. 2010, 33, 204–238. [Google Scholar] [CrossRef]
- Crétaux, J.F.; Calmant, S.; Del-Rio, R.A.; Kouraev, A.; Bergé-Nguyen, M.; Maisongrande, P. Lakes studies from satellite altimetry. In Coastal Altimetry; Vignudelli, S., Kostianoy, A.G., Cipollini, P., Benveniste, J., Eds.; Springer: Berlin/Heidelberg, Germany, 2011; pp. 509–533. [Google Scholar]
- Dettmering, D.; Schwatke, C.; Boergens, E.; Seitz, F. Potential of ENVISAT radar altimetry for water level monitoring in the pantanal wetland. Remote Sens. 2016, 8, 596. [Google Scholar] [CrossRef]
- Fernandes, M.J.; Lázaro, C.; Nunes, A.L.; Scharroo, R. Atmospheric corrections for altimetry studies over inland water. Remote Sens. 2014, 6, 4952–4997. [Google Scholar] [CrossRef]
- Sridevi, T.; Sharma, R.; Mehra, P.; Prasad, K.V.S.R. Estimating discharge from the Godavari River using ENVISAT, Jason-2, and SARAL/AltiKa radar altimeters. Geophys. Res. Lett. 2016, 7, 348–357. [Google Scholar] [CrossRef]
- Frappart, F.; Biancamaria, S.; Normandin, C.; Blarel, F.; Bourrel, L.; Aumont, M.; Azemar, P.; Vu, P.L.; Toan, T.L.; Lubac, B.; et al. Influence of recent climatic events on the surface water storage of the Tonle Sap Lake. Sci. Total Environ. 2018, 636, 1520–1533. [Google Scholar] [CrossRef]
- Boergens, E.; Dettmering, D.; Schwatke, C.; Seitz, F. Treating the hooking effect in satellite altimetry data: A case study along the Mekong River and its tributaries. Remote Sens. 2016, 8, 91. [Google Scholar] [CrossRef]
- Hossain, F.; Siddique-E-Akbor, A.; Mazumder, L.C.; ShahNewaz, S.M.; Biancamaria, S.; Lee, H.; Shum, C. Proof of concept of an altimeter-based river forecasting system for transboundary flow inside Bangladesh. IEEE J. Sel. Top. Appl. Earth Obs. Remote Sens. 2014, 7, 587–601. [Google Scholar] [CrossRef]
- Passaro, M.; Rose, S.K.; Andersen, O.B.; Boergens, E.; Calafat, F.M.; Dettmering, D.; Benveniste, J. ALES+: Adapting a homogenous ocean retracker for satellite altimetry to sea ice leads, coastal and inland waters. Remote Sens. Environ. 2018, 211, 456–471. [Google Scholar] [CrossRef]
- Frappart, F.; Calmant, S.; Cauhopé, M.; Seyler, F.; Cazenave, A. Preliminary results of ENVISAT RA-2-derived water levels validation over the Amazon basin. Remote Sens. Environ. 2006, 100, 252–264. [Google Scholar] [CrossRef]
- Göttl, F.; Dettmering, D.; Müller, F.L.; Schwatke, C. Lake level estimation based on CryoSat-2 SAR altimetry and multi-looked waveform classification. Remote Sens. 2016, 8, 885. [Google Scholar] [CrossRef]
- Bogning, S.; Frappart, F.; Blarel, F.; Niño, F.; Mahé, G.; Bricquet, J.P.; Seyler, F.; Onguéné, R.; Etamé, J.; Paiz, M.C.; et al. Monitoring water levels and discharges using radar altimetry in an ungauged river basin: The case of the Ogooué. Remote Sens. 2018, 10, 350. [Google Scholar] [CrossRef]
- Song, C.; Ye, Q.; Cheng, X. Shifts in water-level variation of Namco in the central Tibetan Plateau from ICESat and CryoSat-2 altimetry and station observations. Sci. Bull. 2015, 60, 1287–1297. [Google Scholar] [CrossRef]
- Boergens, E.; Nielsen, K.; Andersen, O.B.; Dettmering, D.; Seitz, F. River levels derived with CryoSat-2 SAR data classification—A case study in the Mekong River Basin. Remote Sens. 2017, 9, 1238. [Google Scholar] [CrossRef]
- Sheese, P.E.; Boone, C.D.; Walker, K.A. Detecting physically unrealistic outliers in ACE-FTS atmospheric measurements. Atmos. Meas. Tech. 2015, 8, 741–750. [Google Scholar] [CrossRef]
- Kleinherenbrink, M.; Lindenbergh, R.C.; Ditmar, P.G. Monitoring of lake level changes on the Tibetan Plateau and Tian Shan by retracking Cryosat SARIn waveforms. J. Hydrol. 2015, 521, 119–131. [Google Scholar] [CrossRef]
- Leys, C.; Ley, C.; Klein, O.; Bernard, P.; Licata, L. Detecting outliers: Do not use standard deviation around the mean, use absolute deviation around the median. J. Exp. Soc. Psychol. 2013, 49, 764–766. [Google Scholar] [CrossRef]
- Passaro, M.; Cipollini, P.; Benveniste, J. Annual sea level variability of the coastal ocean: The Baltic Sea-North Sea transition zone. J. Geophys. Res. Oceans 2015, 120, 3061–3078. [Google Scholar] [CrossRef]
- Bouzinac, C. CryoSat Product Handbook. Available online: https://earth.esa.int/documents/10174/125272/CryoSat_Product_Handbook (accessed on 20 February 2019).
- Liu, Z.; Yao, Z.; Wang, R. Automatic identification of the lake area at Qinghai–Tibetan Plateau using remote sensing images. Quat. Int. 2019, 503, 136–145. [Google Scholar] [CrossRef]
- Cretaux, J.F.; Jelinski, W.; Calmant, S.; Kouraev, A.V.; Vuglinski, V.V.; Bergé-Nguyen, M.; Gennero, M.C.; Nino, F.; Abarca-Del-Rio, R.; Cazenave, A.; et al. SOLS: A lake database to monitor in near real time water level and storage variations from remote sensing data. J. Adv. Space Res. 2011, 47, 1497–1507. [Google Scholar] [CrossRef]
- Guo, H.R.; Jiao, W.H.; Yang, Y.X. The systematic difference and its distribution between the 1985 national height datum and the global quasigeoid. Acta Geod. Cartogr. Sin. 2004, 33, 100–104, (In Chinese but with English Abstract). [Google Scholar]
- Scott, D.W. On optimal and data-based histograms. Biometrika 1979, 66, 605–610. [Google Scholar] [CrossRef]
- Bendat, J.S.; Piersol, A.G. Measurements and Analysis of Random Data; John Wiley and Sons: New York, NY, USA, 1966. [Google Scholar]
- Doane, D.P. Aesthetic frequency classifications. Am. Stat. 1976, 30, 181–183. [Google Scholar]
- Sturges, H.A. The choice of a class interval. J. Am. Stat. Assoc. 1926, 21, 65–66. [Google Scholar] [CrossRef]
- Nielsen, K.; Stenseng, L.; Andersen, O.B.; Knudsen, P. The performance and potentials of the CryoSat-2 SAR and SARIn modes for lake level estimation. Water 2017, 9, 374. [Google Scholar] [CrossRef]
- Ma, R.H.; Yang, G.S.; Duan, H.T.; Jiang, J.H.; Wang, S.M.; Feng, X.Z.; Li, A.N.; Kong, F.X.; Xue, B.; Wu, J.L.; et al. China’s lakes at present: Number, area and spatial distribution. Sci. China Earth Sci. 2011, 54, 283–289. [Google Scholar] [CrossRef]
- Jiang, L.; Nielsen, K.; Andersen, O.B.; Bauer-Gottwein, P. CryoSat-2 radar altimetry for monitoring freshwater resources of China. Remote Sens. Environ. 2017, 200, 125–139. [Google Scholar] [CrossRef]
© 2019 by the authors. Licensee MDPI, Basel, Switzerland. This article is an open access article distributed under the terms and conditions of the Creative Commons Attribution (CC BY) license (http://creativecommons.org/licenses/by/4.0/).