Article

Building Damage Assessment Based on the Fusion of Multiple Texture Features Using a Single Post-Earthquake PolSAR Image

1
Lanzhou Institute of Seismology, China Earthquake Administration, Lanzhou 730000, China
2
Key Laboratory of Loess Earthquake Engineering of China Earthquake Administration, Lanzhou 730000, China
3
Northwest Institute of Eco-Environment and Resources, Chinese Academy of Sciences, Lanzhou 730000, China
*
Author to whom correspondence should be addressed.
Remote Sens. 2019, 11(8), 897; https://doi.org/10.3390/rs11080897
Submission received: 1 March 2019 / Revised: 25 March 2019 / Accepted: 10 April 2019 / Published: 12 April 2019
(This article belongs to the Section Remote Sensing Image Processing)

Abstract

:
After a destructive earthquake, most of the casualties are brought about by building collapse. Our work is focused on using a single postevent PolSAR (full-polarimetric synthetic aperture radar) imagery to extract the building damage information for effective emergency decision-making. PolSAR data is subject to sunlight and contains richer backscatter information. The undamaged buildings whose orientation is not parallel to the SAR flight pass and the collapsed buildings share similar dominated scattering mechanisms, i.e., volume scattering, so they are easily confused. However, the two kinds of buildings have different textures. For a more accurate classification of damaged buildings and undamaged buildings, the OPCE (optimization of polarimetric contrast enhancement) algorithm is employed to enhance the contrast ratio of the textures for the two kinds of buildings and the precision-weighted multifeature fusion (PWMF) method is proposed to merge the multiple texture features. The experiment results show that the accuracy of the proposed novel method is improved by 8.34% compared to the traditional method. In general, the proposed PWMF method can effectively merge the multiple features and the overestimation of the building collapse rate can be reduced using the proposed method in this study.

1. Introduction

As a natural hazard [1] with great destructive power, an earthquake often leads to heavy casualties and great loss of property [2,3]. In recent years, the economic losses and casualties caused by earthquakes are on the rise, with more and more earthquakes occurring all over the world [4]. Earthquakes cannot be predicted with current technology and knowledge [5]. Quick and efficient earthquake emergency response is thus an effective way to reduce casualties. During an earthquake, most deaths and injuries are caused by building collapse [6,7]. Therefore, building damage information should be quickly acquired at the time of the emergency response, and building damage estimation is one of the most important parts of earthquake damage evaluation [8]. Quick rescue efforts based on accurate building damage information can greatly reduce the number of involved people [9].
Both the efficiency and timeliness of disaster information collection are crucial. Remote sensing technology is playing an increasingly important role in disaster information investigation, because it has the advantages of speed and extensiveness [10]. However, when an earthquake occurs at night or in severe weather, optical images cannot be used for the earthquake damage assessment (EDA) [11,12]. In that case, synthetic aperture radar (SAR), with its all-weather and day-and-night superiorities, can be used to investigate the destruction situation and performance of structures interacting with natural hazards, so that the timeliness and efficiency of EDA can be guaranteed [13,14]. Compared to single-polarimetric SAR data, PolSAR image include much more information. PolSAR data not only contains four different combinations of vertical (V) and horizontal (H) polarizations which are VV, VH, HV, and HH [15], but also consists of the amplitude and phase information for each transmitting-receiving polarization. Therefore, the EDA accuracy can be increased by the use of PolSAR data.
Many studies have used post- and pre-event multitemporal PolSAR data for EDA based on the change detection of polarimetric features. Yamaguchi [16] and Chen et al. [17] used the change of the scattering mechanism (SM) to extract the damage information. Chen et al. [18], Park et al. [19], Watanabe et al. [20], and Sato et al. [21] extracted the earthquake damage information by constructing certain polarimetric features and then analyzing these features. Singh et al. [22] used color-coded images of the scattering power decomposition scheme to interpret the changes after an earthquake. Watanabe et al. [23] used the interferometric SAR coherence-change detection technique to detect the damaged buildings (DB) after the 2015 Gorkha Earthquake. Zhang et al. [24] proposed a modified detection method for collapsed buildings (CB) by using both the interferometric information and the polarimetric information extracted from two single polarimetric SAR images and one PolSAR image.
The requirement for multitemporal PolSAR data sometimes cannot be satisfied in practice. Image registration is also unavoidable when using multitemporal data to extract earthquake damage information. In order to avoid these issues, many researchers have now started to only use one postearthquake PolSAR image for building damage information extraction. Li et al. [25] and Guo et al. [26,27] all used polarimetric correlation coefficients, including both linear-polarization correlation coefficients and circular-polarization correlation coefficients, to analyze and extract the building damage information. Masaka et al. [28] combined the angles α ¯ , β ¯ obtained by eigenvalue/eigenvector analysis to investigate and detect the deformed/inclined buildings. Chen et al. [29] used modified Freeman decomposition and the contribution of the double-bounce scattering (PD/span) to interpret the spatial distribution of the damaged buildings. Zhai et al. [30] and Li et al. [31] proposed the novel building damage evaluation methods introducing texture features of statistical models. Shen et al. [32] recognized the DB based on feature template matching as the image retrieval method. Zhai et al. [6] and Zhai and Huang [33] proposed certain polarimetric features, including the normalized difference of the dihedral component (NDDC) and the difference in the relative contribution change rate of scattering components before and after polarization orientation angle compensation (CRDbl–Vol), to extract the building damage information. Zhang et al. [34] proposed a novel approach for building collapse information extraction based on the optimization of polarimetric contrast enhancement (OPCE) algorithm. In addition, Zhang et al. [35] proposed a new framework for building damage recognition by jointly using polarimetric information and azimuth time-frequency analysis. The above studies mainly used the polarimetric information of PolSAR data to identify the building damage information. Shi et al. [36], and Sun et al. [37] used a lot of texture features and the random forest classifier to distinguish the building damage level (BDL), and their research results proved that the texture features can be effective for quantifying the extent of building collapse.
In an earthquake-hit region, according to the building orientation, the undamaged buildings (UDB) will include both the oriented buildings (OB) whose orientation is nonparallel to the flight direction and the parallel buildings (PB) that are parallel to the flight path. The PB are featured by double-bounce scattering (DBS). However, the OB are also featured by volume scattering (VS), which is similar to the CB [30]. Therefore, the scattering power (SP) of both the CB and the OB is weaker than the SP of the undamaged PB. That is to say, the CB are very similar to the OB for both SM and SP. For resolving this confusion, based on the above research findings, we introduce texture features to distinguish the CB from the undamaged OB. The new method, named the precision-weighted multi-feature fusion (PWMF) method, is proposed to effectively fuse the multiple texture features. In addition, in order to further enhance the texture feature differences of the two kinds of buildings, the OPCE algorithm is also employed.
Above all, our main research aim in this study is building collapse information extraction from a single postearthquake PolSAR image (SPEPI) using the PWMF method to fuse the multiple texture features. The experimental results reveal that the proposed method requires only a small number of features to acquire a better building damage assessment (BDA) accuracy, and the undamaged OB and CB are effectively distinguished.

2. Materials and Methods

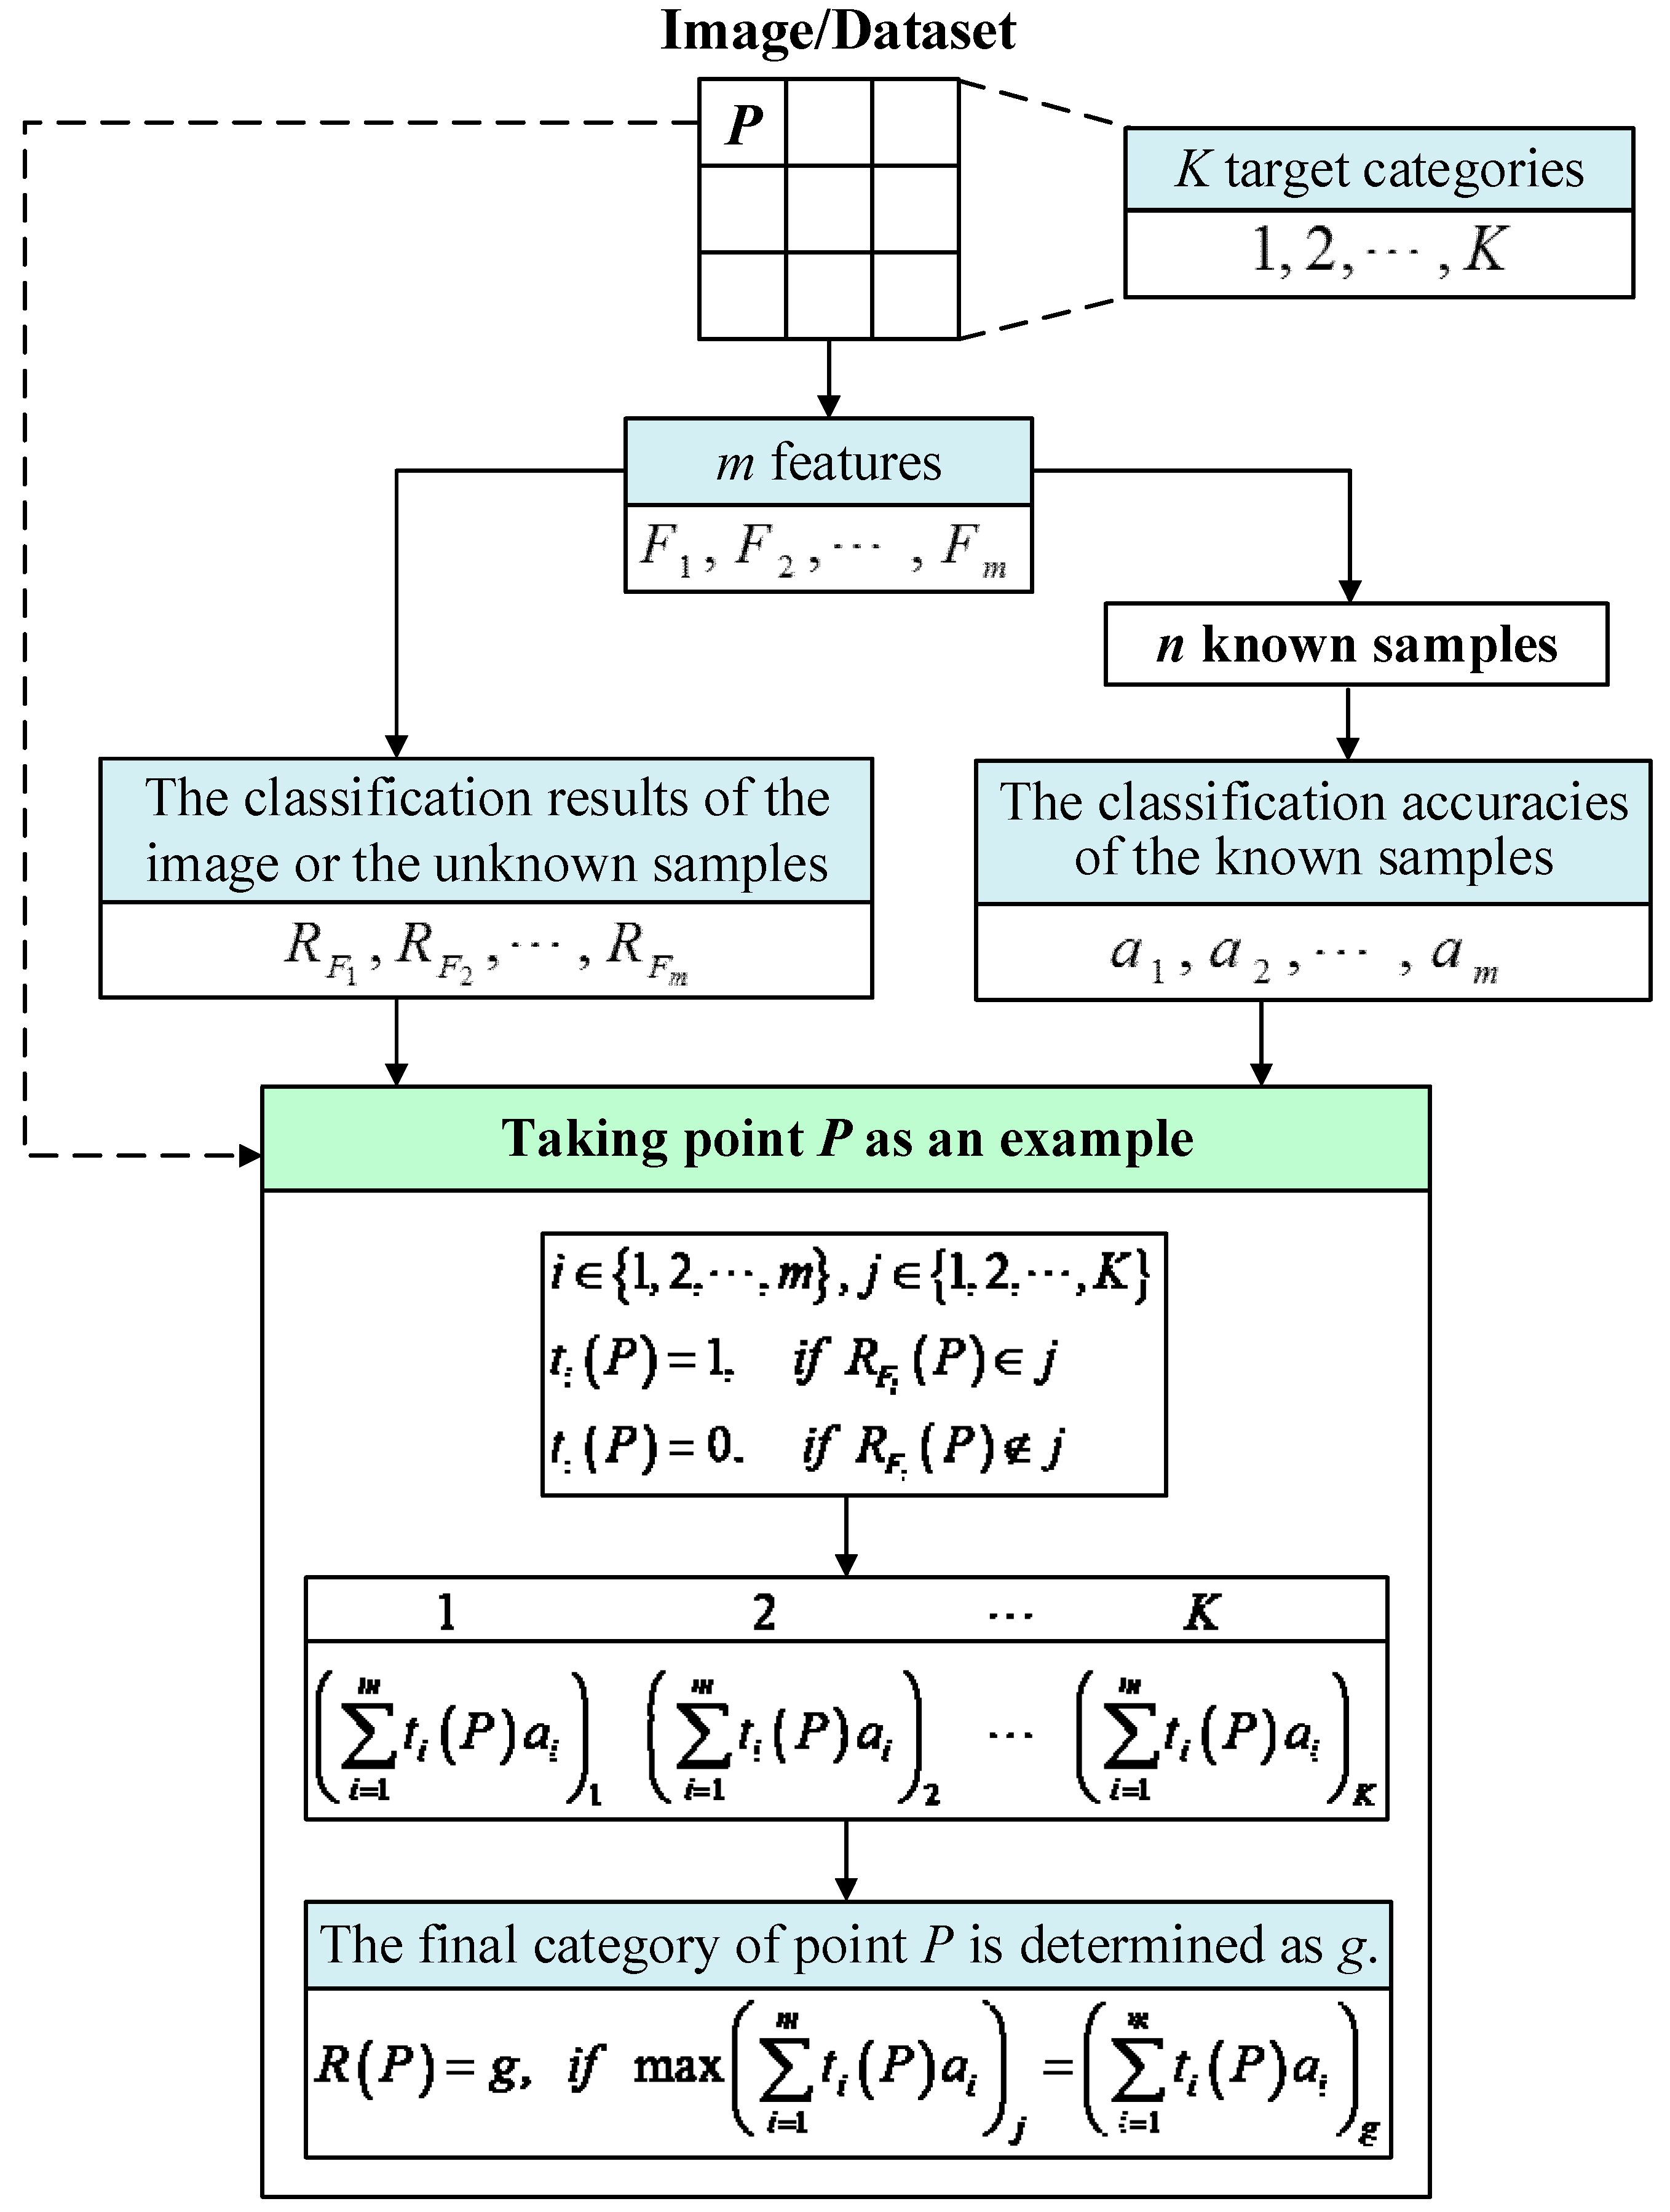
2.1. Multifeature Fusion Algorithm

Multiple features have a better ability to discriminate objects than the use of only one feature. In view of this, multiple features can be fused to allow us to better discriminate undamaged OB and CB. Therefore, in this study, the PWMF method is proposed to fuse the multiple features.
The PWMF method can be used to fuse the classification results of the multiple features. In the PWMF method, after obtaining the classification accuracy of the known samples for each feature, according to the classification accuracy of the different features, the weight values are specified for the corresponding features, and the classification results of the features with higher weight values are considered to have a higher credibility. The schematic diagram of the PWMF method is shown in Figure 1. In the following paragraphs, the principles and processes involved in the PWMF method are described in detail.
There are m features F1, F2, …, Fm extracted from the image. In the image, the ground objects are classified into K classes. In other words, K is the desired number of target classes. The classification accuracies of F1, F2, …, Fm for the known samples are a1, a2, …, am, respectively. R F 1 , R F 2 , , R F m are the classification results of F1, F2, …, Fm, respectively. R(x) represents the final classification result of point x in the image. P is one of the points in the image. ti(x) indicates the category of point x after the image has been classified using feature Fi.
Firstly, n known samples are selected and classified using the m features F1, F2, …, Fm. The accuracy assessment for F1, F2, …, Fm is then undertaken, and the classification accuracies a1, a2, …, am corresponding to F1, F2, …, Fm are acquired.
Secondly, the image or dataset is classified using features F1, F2, …, Fm, respectively, and the classification results R F 1 , R F 2 , , R F m corresponding to F1, F2, …, Fm are acquired. In addition, the unknown samples can also take the place of the image or dataset to be classified using features F1, F2, …, Fm, respectively, and the classification results R F 1 , R F 2 , , R F m are acquired.
Thirdly, a1, a2, …, am serve as the weight coefficients, and the accumulation operation of a1, a2, …, am for each point in the image is performed. The classification results R F 1 , R F 2 , , R F m control whether the weight coefficients participate in the accumulation operation or not. The category with the highest accumulation accuracy is the final category of the point. Taking point P of the image as an example, a detailed description is given below. In R F i , which is the classification result of feature Fi, if point P is classified as the jth class, ti(P) = 1, else ti(P) = 0. We compute ( i = 1 m t i ( P ) a i ) j ,   j { 1 , 2 , , K } for each of the K classes {1, 2, …, K}, and the K weighted accuracy values ( i = 1 m t i ( P ) a i ) can be obtained. The class g corresponding to the maximum weighted accuracy value ( i = 1 m t i ( P ) a i ) g in ( i = 1 m t i ( P ) a i ) j ,   j { 1 , 2 , , K } is assigned as the final class of point P. In this way, the operation of point P is performed on every point of the image, the final class of each point in the image is acquired, and the classification result of the image is obtained.
What needs to be stressed is that the classification method or clustering method chosen for the image or unknown samples should be the same as that used with the known samples. This is because the classification accuracy of each feature generated from the known samples is used for the classification of the unknown samples in the PWMF method. For the known samples, the clustering method used for the samples with labels should be an unsupervised classification method, because there is no training process. The purpose of this classification for the known samples is that the classification accuracy of each feature can be obtained. This is because the classification accuracy of each feature (as the weight value) needs to be assigned to a thematic class after obtaining the classification results of the unknown samples using the same unsupervised clustering method as the known samples. In order to decide the class label for each pixel in the classification results of the unknown samples using the unsupervised clustering method, the cluster centers established from the known samples are used for the classification of the unknown samples. In this way, during the process of the classification of the unknown samples using the unsupervised clustering method, the cluster centers are established, and the assigned class of each pixel is the class of the closest cluster center.

2.2. Methodology Development for the Building Damage Assessment

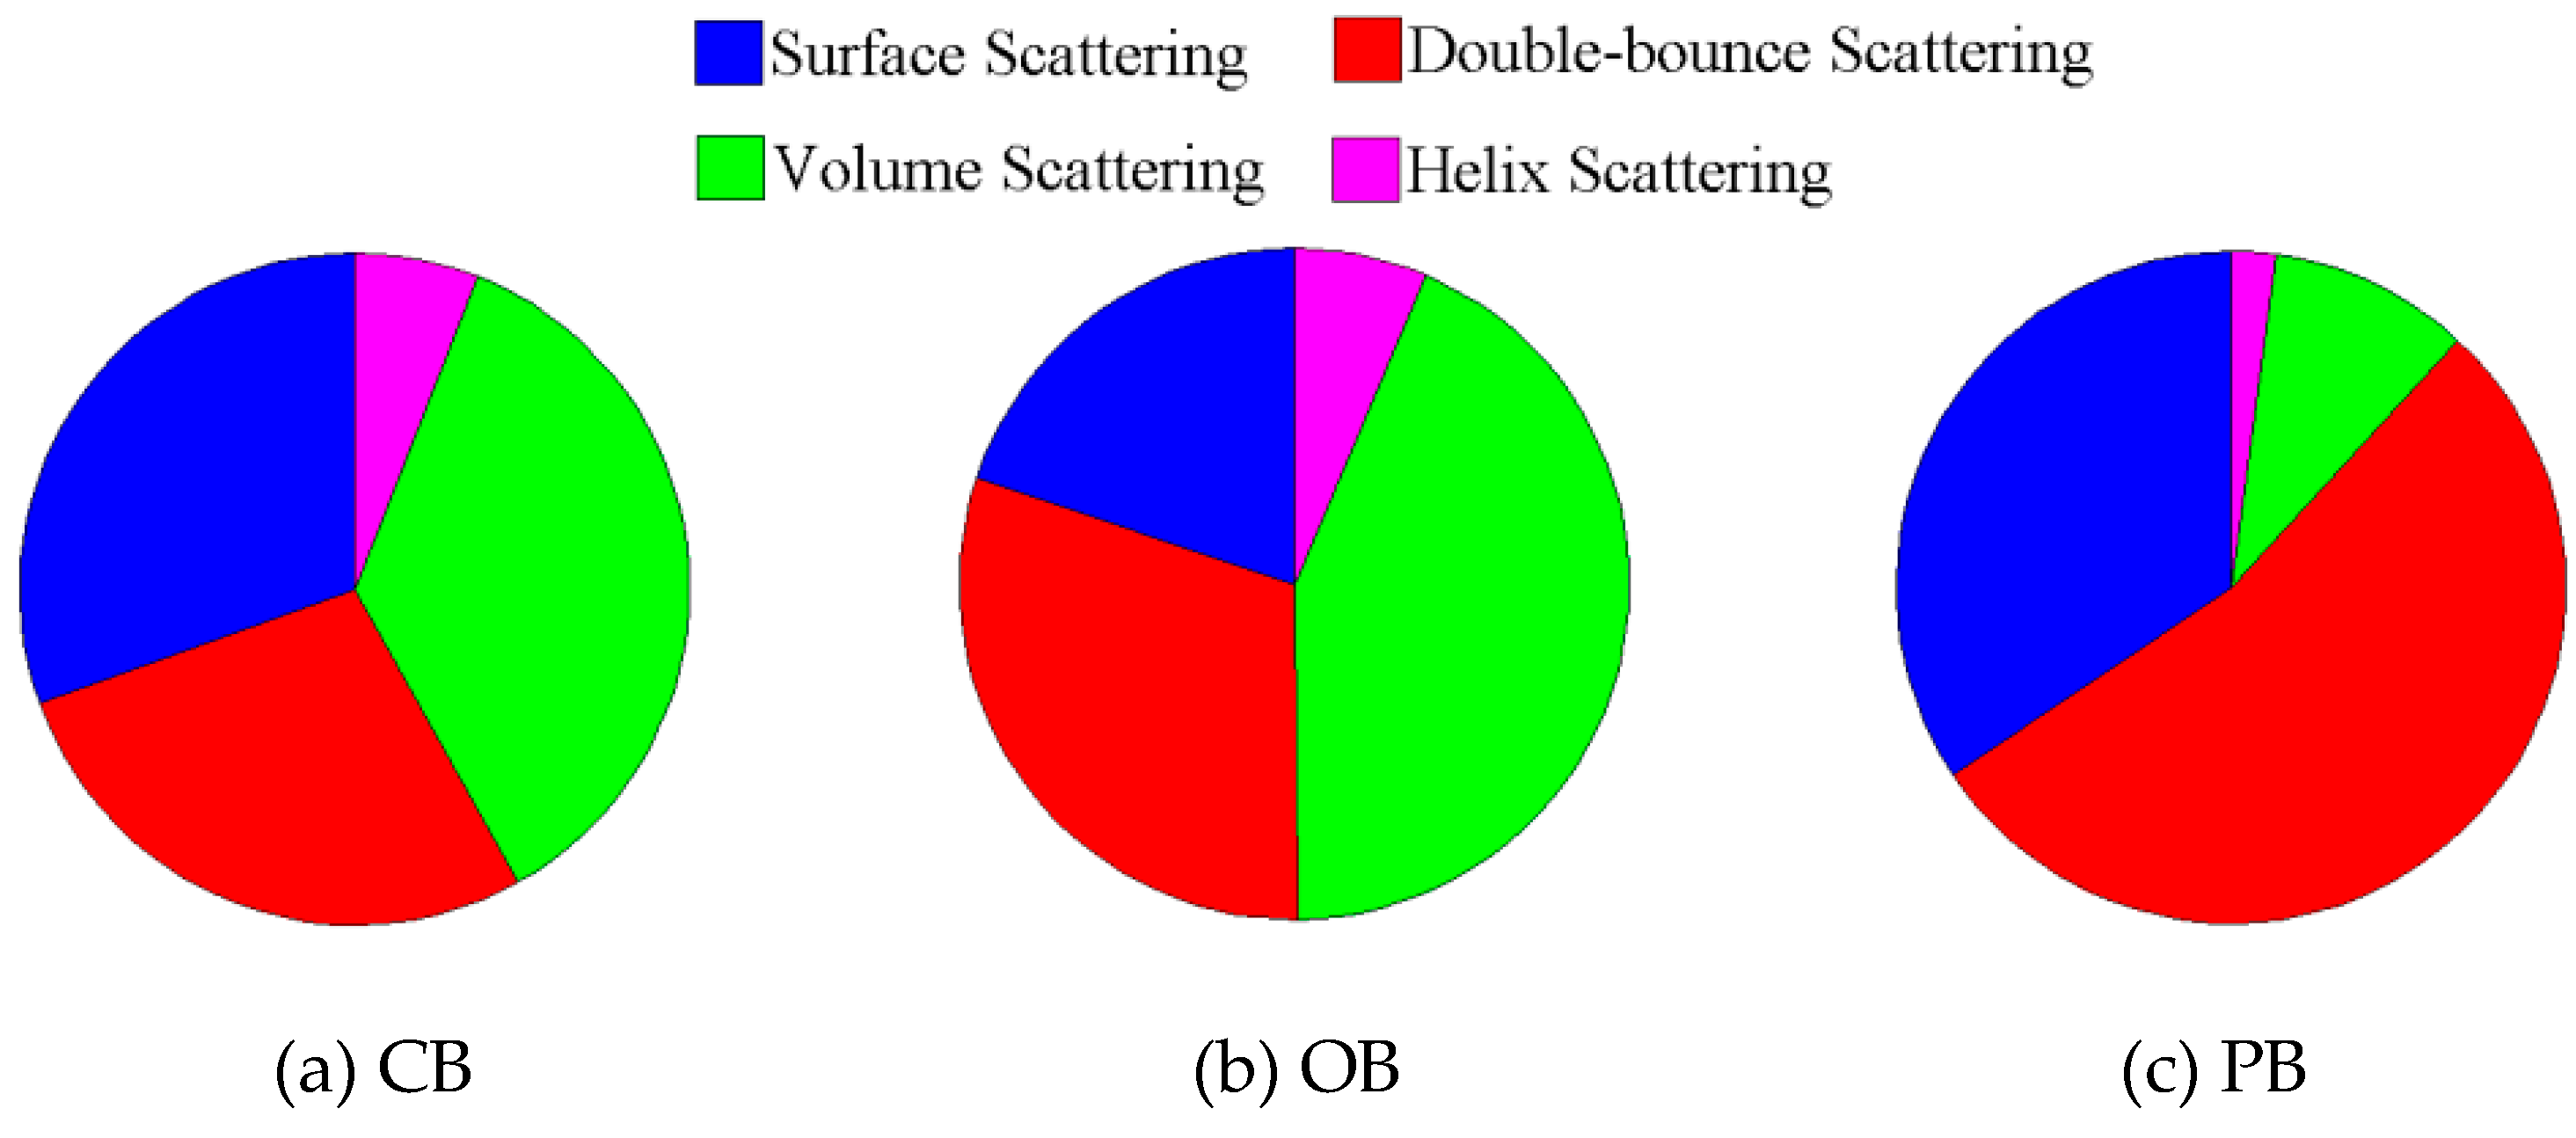
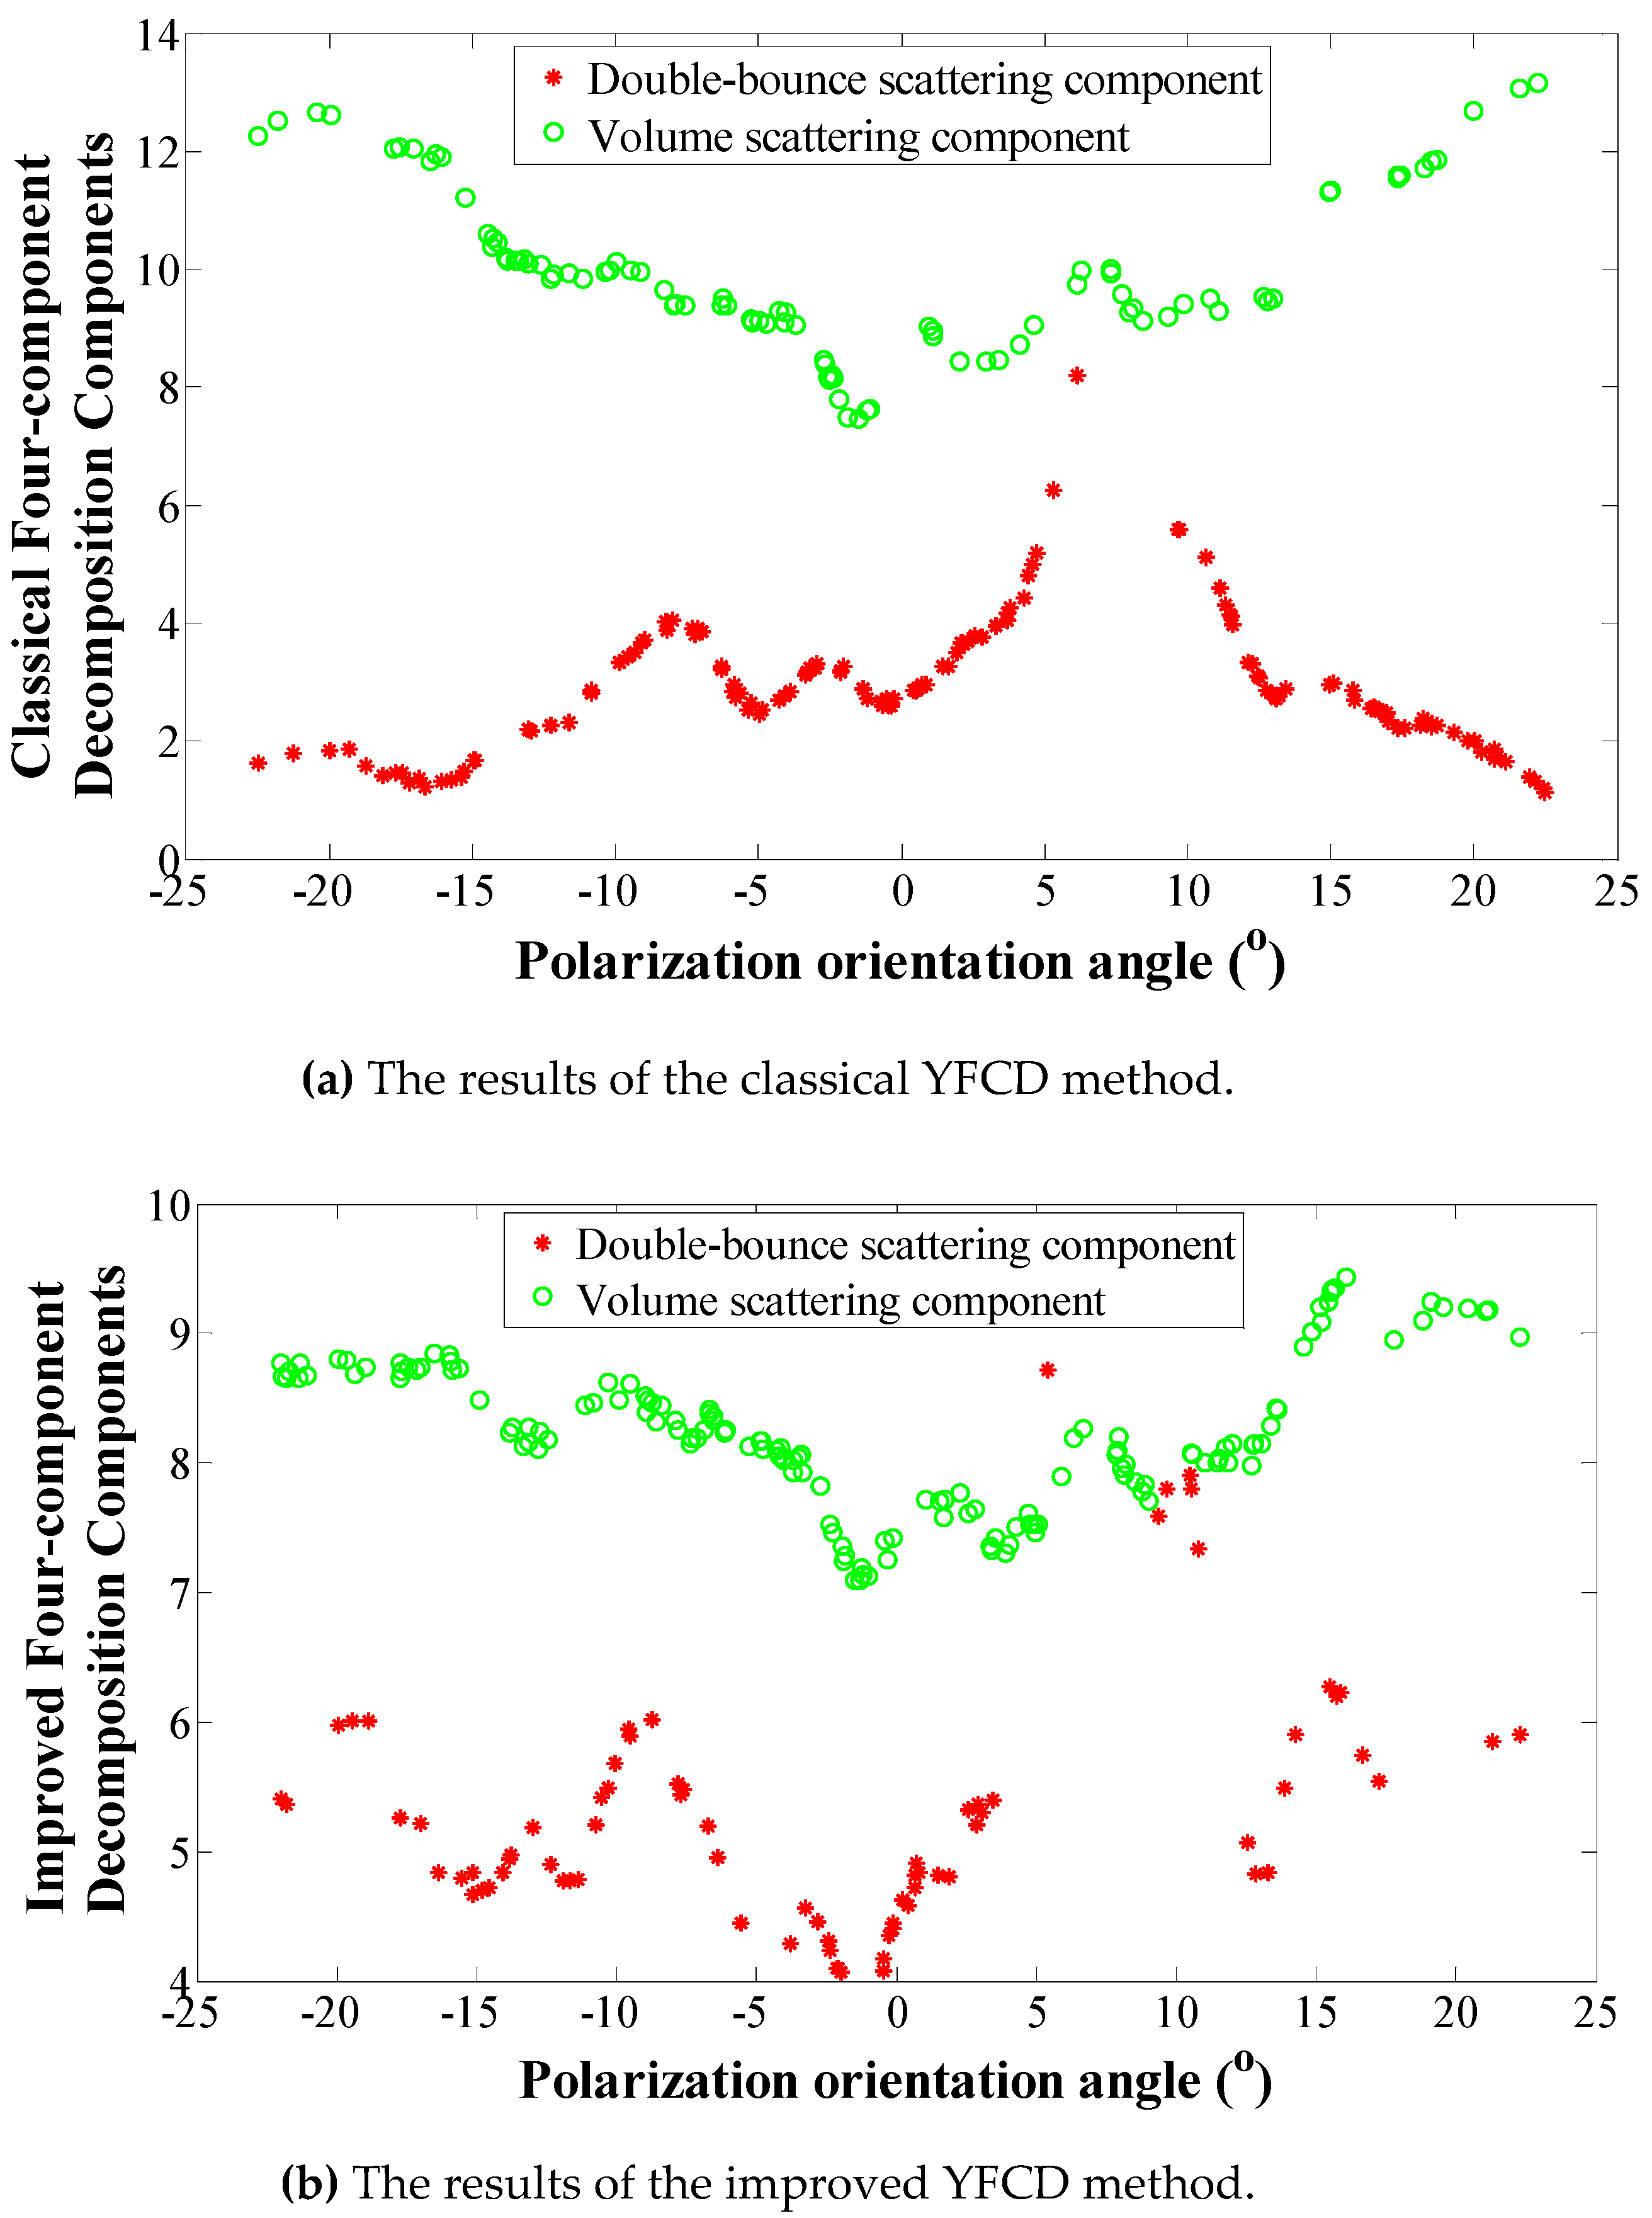
2.2.1. Polarimetric Decomposition

In an earthquake-hit region, there will be both CB and intact buildings, which consist of both PB and OB. Compared to the Freeman three-component decomposition method (FTCD) [38], the Yamaguchi four-component decomposition method (YFCD) contains the component of helix scattering (HS), and it is more appropriate for urban regions. Thus, YFCD is preferred for analyzing building SM in earthquake-hit regions. In the results of the classical YFCD method [39,40], the predominant scattering component of CB, PB, and OB is VS, DBS, and VS, respectively. The wall of a parallel building and the ground forms a dihedral structure, so the PB are dominated by the DBS mechanism, and their SP is particularly strong. The dihedral structure of CB is destroyed, and the polarization basis of OB is rotated. Therefore, both CB and OB are dominated by the VS mechanism, and their SP is relatively weak. Yamaguchi et al. [41] modified the classical YFCD method to improve the recognition performance for OB. Therefore, the improved YFCD method is employed as the polarimetric decomposition approach of this work, and the details about improved YFCD method can be found in the reference written by Yamaguchi et al. [41].
We used the improved YFCD method to decompose the scattering components (SC) of each sample for the three kinds of buildings marked in Figure 10 into surface scattering, DBS, VS, and HS. The relative contributions of the different SC for the three samples were then calculated, as shown in Figure 2. In addition, a comparison diagram for the DBS component and the VS component obtained from the classical YFCD method and the improved YFCD method is shown in Figure 3. Based on the same pixel, the polarization orientation angle (POA) value is shown in horizontal axis and the SC generated from YFCD method are corresponding to vertical axis.
As can be seen in Figure 2, even though the improved YFCD method is employed to identify the buildings in the earthquake-hit area, the leading SM of the undamaged OB is VS, and the CB and the undamaged OB are still easily mixed up. At the same time, as shown in Figure 3, for the OB, the overall gap between the DBS and the VS is shortened, but the VS is still greater than the DBS, on the whole, regardless of the size of the POA. That is to say, the improved YFCD method can only partially improve the discernment performance for OB. Many OB cannot be identified exactly using the improved YFCD method.
From Figure 2 and Figure 3, we can see that VS still acts as the leading scattering component of the undamaged OB, and the confusion between CB and undamaged OB is unchanged by the use of the improved YFCD method. If the undamaged OB are not separated from the CB, the building damage will be greatly overestimated, especially in the built-up regions with a lot of OB.

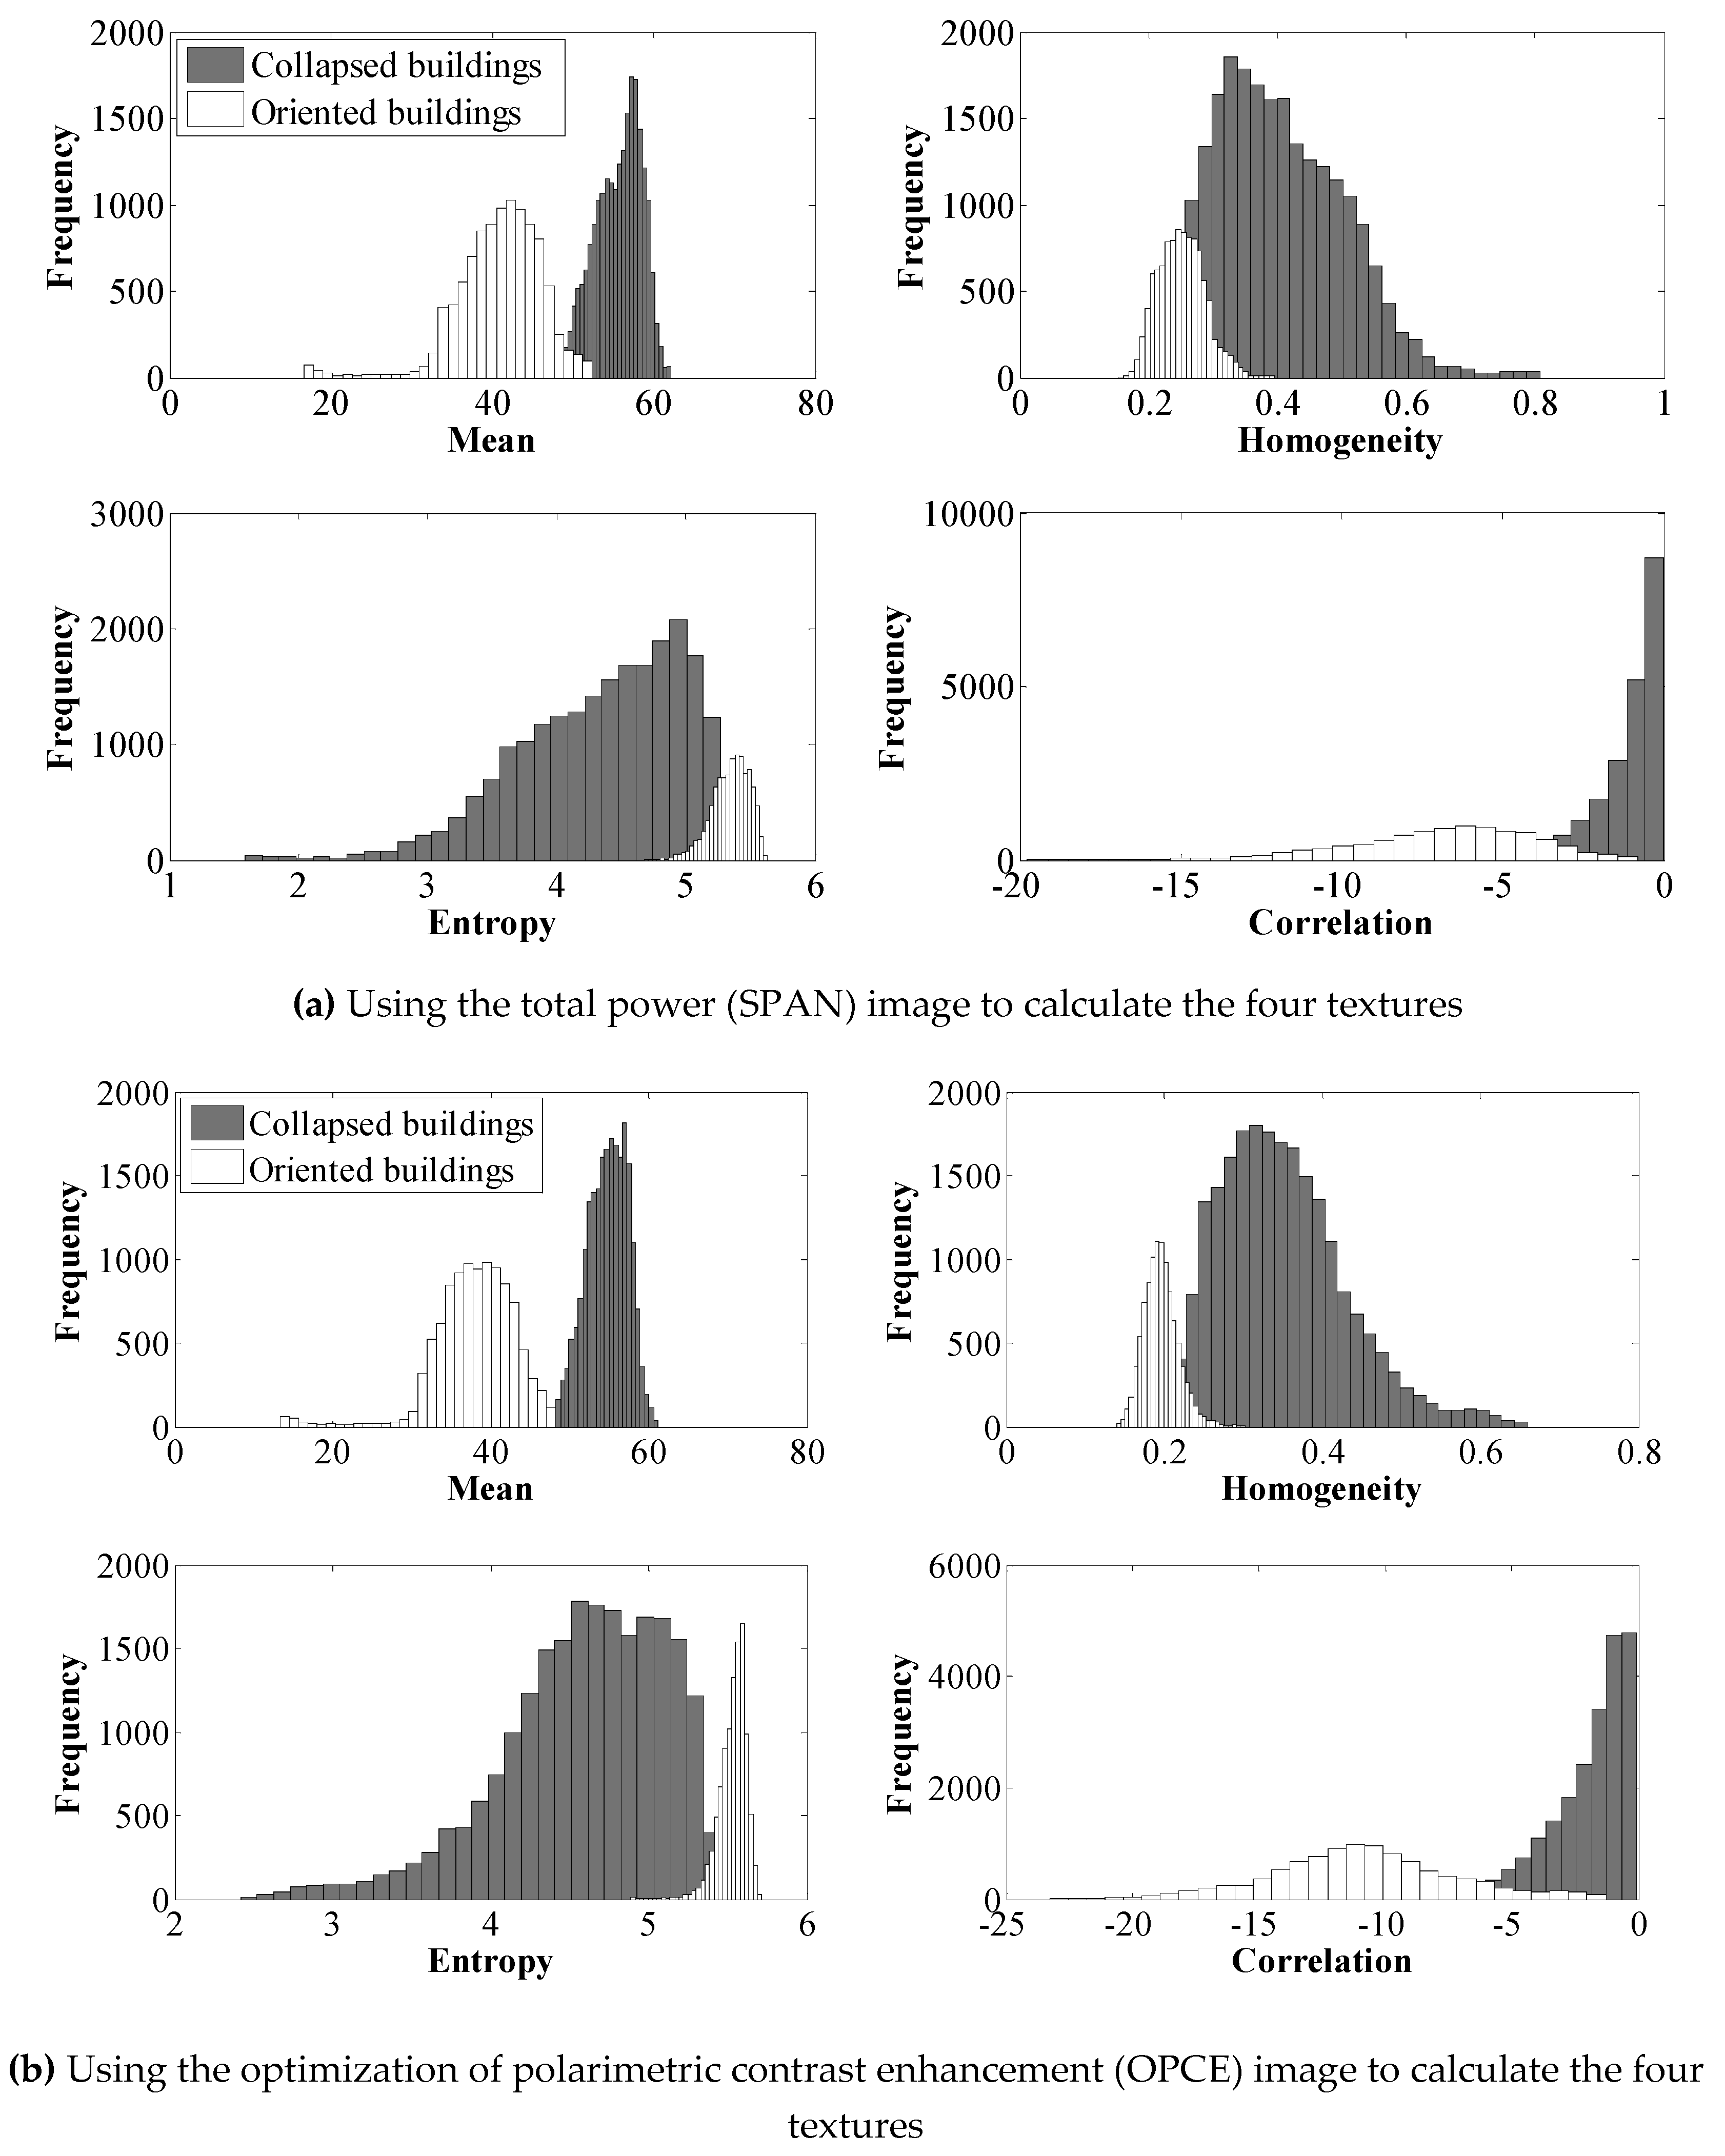
2.2.2. Texture Feature Extraction

In addition to polarimetric features, abundant texture features can also be extracted from PolSAR images. Because the texture features of buildings are obvious in PolSAR images, they can be used for building recognition [42]. Furthermore, there is a clear difference between the CB and the OB in texture. Here, the OB are the UDB, so they have the basic characteristics of general buildings and present relatively regular textures. However, the CB show a disordered distribution, and their textures are irregular. To overcome the dilemma of the easily mixed class problem, the texture features can be used to differentiate the undamaged OB from the CB. Gray Level Co-occurrence Matrix (GLCM) [43] is a very popular statistical approach used to get features from the image texture. Generally, the eight second-order statistical texture parameters of variance, mean, contrast, homogeneity, entropy, dissimilarity, correlation, and second moment can be achieved based on GLCM. Comparing the histograms of the two kinds of buildings for the eight texture features based on GLCM in Figure 4, it can be found that the four texture features of homogeneity, mean, entropy, and correlation have a better ability to separate the two kinds of buildings.
Because the improved YFCD is employed to obtain the ground objects dominated by DBS and VS, the coherency matrix (CM) for extracting the total power (SPAN) image should be rotated in coordination with the polarimetric decomposition method. The CM rotation algorithm is described as follows:
Assuming that the CM is:
[ T ] = [ T 11 T 12 T 13 T 21 T 22 T 23 T 31 T 32 T 33 ]
According to the reference [41], the rotation angle θ is then:
θ = 1 4 tan 1 ( 2 Re ( T 23 ) T 22 T 33 ) ,   π 4 θ π 4
where “Re” denotes the real part of the complex number.
The rotation matrix Ro(θ) is:
[ R o ( θ ) ] = [ 1 0 0 0 cos 2 θ sin 2 θ 0 sin 2 θ cos 2 θ ]
The rotated CM T(θ) rotated by the rotation angle θ can be obtained by:
[ T ( θ ) ] = [ R o ( θ ) ] [ T ] [ R o ( θ ) ] T
where the superscript T stands for the matrix transpose operation.
The OPCE scheme can be used to enhance the desired targets (targets) with regard to the undesired targets (clutter) by controlling the optimal polarization states of the transmitter and the receiver [44]. In order to increase the texture feature differences between the CB and the undamaged OB, the OPCE algorithm is introduced to enhance the contrast ratio of the CB and the undamaged OB, and the contrast of the four texture features is also increased.
There are likely to be some scatterers with high scattering intensity in CB, so the power of CB is generally higher than the power of OB. This fact is reflected by the histogram comparison of the mean texture feature between the OB and the CB in Figure 5a. Therefore, the CB and the OB serve as the targets and the clutter, respectively, during the OPCE operation.
We let [KCB] and [KOB] denote the average Kennaugh matrices of the CB and OB, respectively. Jr = [1, h1, h2, h3]T (where the superscript T stands for the transpose operation) and Jt = [1, g1, g2, g3]T denote the Stokes vectors of the polarization states of the receiving and transmitting antennas, respectively. The received power ratio CCB-OB of the CB and the OB can be expressed as:
C C B O B = P C B P O B = J r T [ K C B ] J t J r T [ K O B ] J t
where PCB and POB denote the power received by the CB and the OB, respectively.
Enhancing the CB with regard to the OB with polarimetric optimization can be converted into the following mathematical problem [45]:
maximize   J r T [ K C B ] J t J r T [ K O B ] J t subject   to   g 1 2 + g 2 2 + g 3 2 = 1 h 1 2 + h 2 2 + h 3 2 = 1
In this work, we use a numerical method based on the sequential unconstrained minimization technique (SUMT) to solve the OPCE problem shown in Equation (6), which is an approach that was proposed by Yang and colleagues [46,47], because the method has good convergence and is easy to calculate and program. Details of the numerical method based on SUMT used to solve the OPCE problem can be found in the reference written by Yang et al. [46].
In order to visually show the separation performance, taking the samples marked in Figure 10 as an example, the histograms of the four texture features for the two kinds of buildings extracted from the OPCE image and from the SPAN image are shown in Figure 5. Texture extraction from the SPAN image and from the OPCE image represent before and after using the OPCE algorithm to enhance the contrast, respectively. Comparing Figure 5a and Figure 5b, it can be seen that, for all four texture features, the differences between the two kinds of buildings are clearly enhanced by the use of the OPCE image.
In Figure 5a, the mean texture feature shows a good ability to separate the two kinds of buildings, but the discriminative ability is inferior to that of the mean texture feature in Figure 5b. The homogeneity texture feature and the entropy texture feature show little ability to separate the two kinds of buildings in Figure 5a, but their discriminative ability is greatly improved in Figure 5b. The performance of the correlation texture feature for separating the two kinds of buildings is not satisfactory in Figure 5a, but it is improved in Figure 5b.
Figure 5 and the above corresponding statement are the qualitative representation. The histogram distance is used to make a quantitative description for the discriminative performance after implementing the OPCE contrast enhancement operation. The histogram distance can be used to measure the differences between two histograms. A bigger histogram distance usually corresponds to a bigger difference, and vice versa. Here, the histogram distance method is employed to prove that the OPCE method for contrast enhancement can improve the separation properties between the OB and the CB of the four texture features. In this work, the Euclidean distance is used to compute the histogram distance. The Euclidean distance d between histogram e and histogram f can be modeled as [48]:
d 2 ( e , f ) = ( e f ) 2
Therefore, using the Euclidean distance to compute the histogram distance between the OB and CB can be expressed as:
h d O B _ C B = i = 1 n ( h o i h c i ) 2
where hdOB_CB, ho, and hc respectively denote the histogram distance between the OB and the CB, the histogram of the OB, and the histogram of the CB.
Taking the samples marked in Figure 10 as an example, the histogram distances between the two kinds of buildings, before and after employing the OPCE algorithm to enhance the contrast, are displayed in Figure 6. From the figure, it is evident that the histogram distance values of the four texture features are increased after implementing the OPCE method. This reveals that the differences between the two kinds of buildings are increased, and the properties of the four textures for separating the OB and the CB are improved after the OPCE operation. Both Figure 5 and Figure 6 indicate that the differences between the OB and CB become bigger after using the OPCE algorithm to enhance the contrast for all four texture features. Therefore, the OPCE image will be employed for calculating the four textures.
Although the mean texture feature separates the two kinds of buildings better than the other features in Figure 5b, the three other texture features also show good ability to separate CB and OB. The aim of the proposed method is to fuse multiple features with good identification abilities to better classify the objects. Normally, the uncertainty of classification results decided by only one feature is higher than that of multiple features. Furthermore, the PWMF method cannot function with only one feature. If the four texture features are fused using the PWMF method to recognize CB and OB, the features both supplement and restrain each other during the process of determining the class labels, and the classification results from the four texture features after fusion will be more reliable than those obtained using only the mean texture feature. Therefore, in order to obtain more reliable classification results, the four texture features are used together to distinguish the two kinds of buildings.

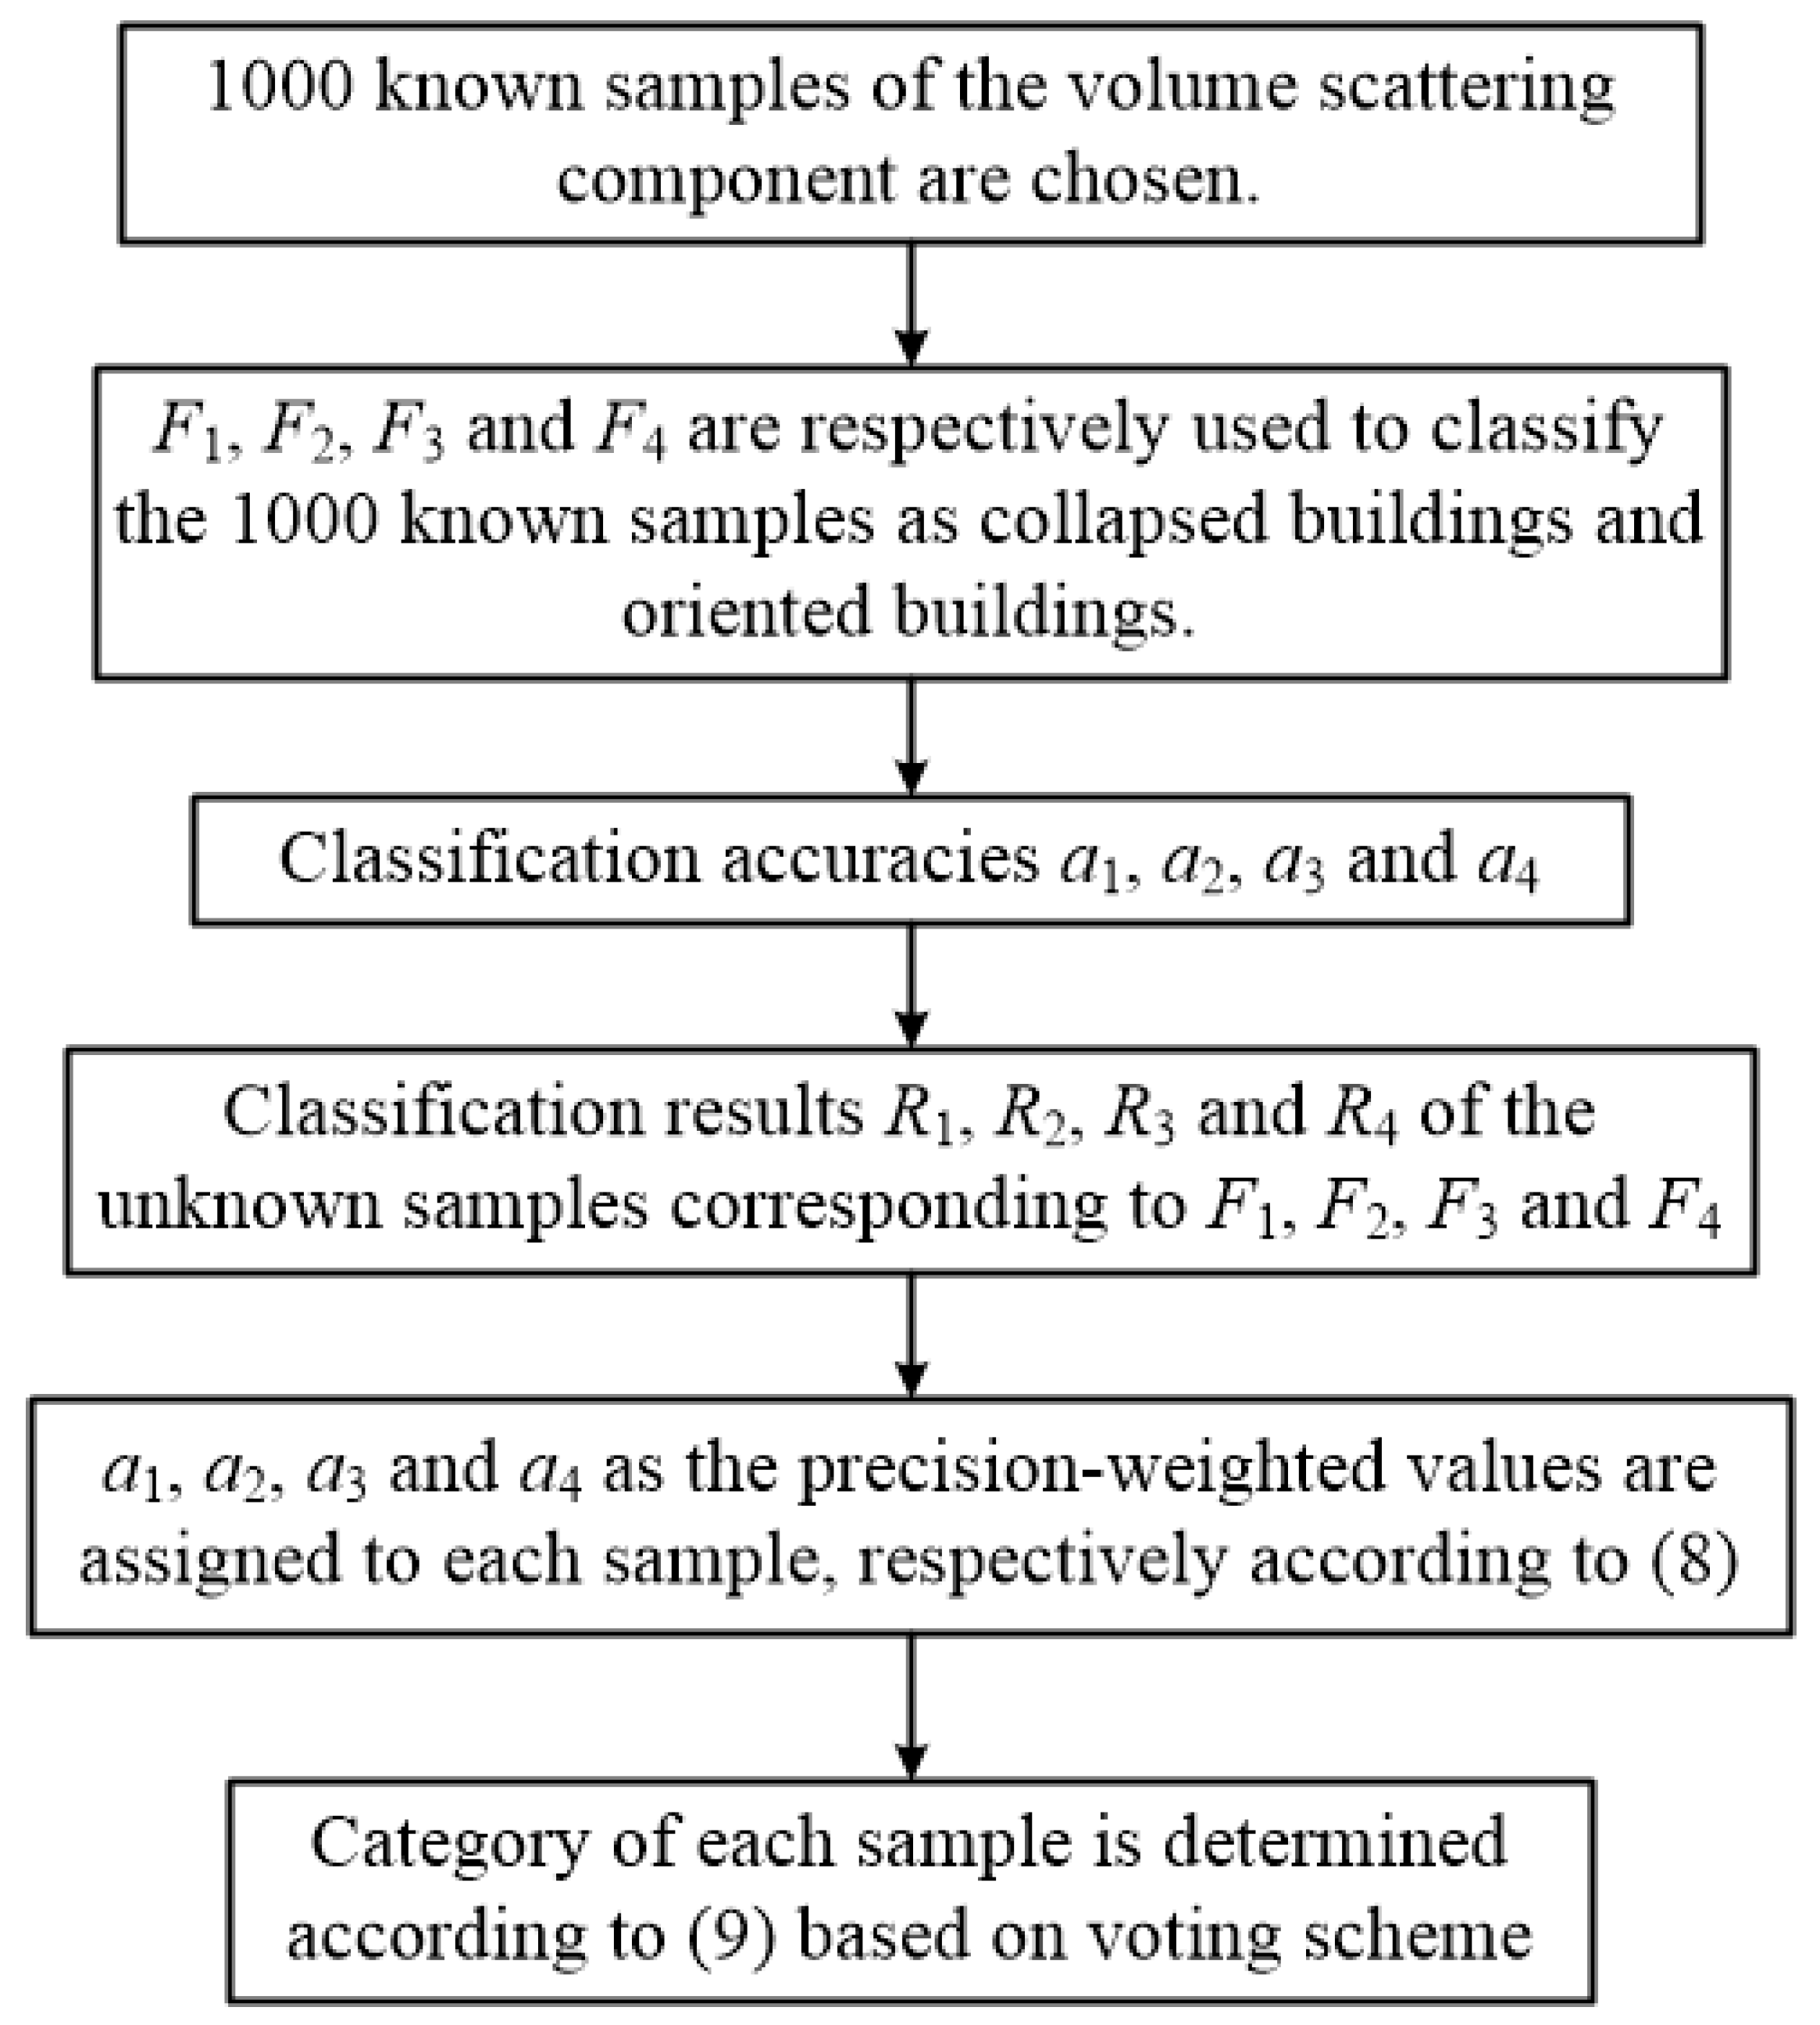
2.2.3. Fusion of the Multiple Texture Features Using the PWMF Method

Although all of the above-mentioned texture features have the ability to discriminate CB and undamaged OB, the use of only one texture feature does not work well for discriminating the two kinds of buildings. If the four texture features are combined, the classification results for the two kinds of building will be more accurate. Therefore, the PWMF method is used to fuse the four texture features of mean, homogeneity, entropy, and correlation.
The detailed algorithm process of the PWMF method presented in Figure 1 is described in Section 2.1. The flowchart of discerning CB and undamaged OB using the PWMF method is presented in Figure 7. The detailed process of using the PWMF method to fuse the four texture features of mean, homogeneity, entropy, and correlation for extracting CB and undamaged OB is given below.
(1) Because the leading SM of both CB and undamaged OB is VS, the improved YFCD method is first performed on the image. One thousand known samples are then chosen from the ground objects predominated by the VS component, including 540 known collapsed building samples and 460 known oriented building samples.
(2) The four texture features of mean, homogeneity, entropy, and correlation are labeled as F1, F2, F3, and F4, respectively. Each of the four texture features is employed to classify the 1000 known samples as CB and OB. In this work, the employed classification method is the k-means clustering algorithm. The classification accuracy is then calculated for each of the four texture features, which is the ratio of the correctly classified collapsed building and oriented building samples to total samples. The classification accuracies of F1, F2, F3, and F4 are labeled as a1, a2, a3, and a4, respectively, and they can be expressed as:
a i = c i + o i t n ,   i { 1 , 2 , 3 , 4 }
where ci and oi denote the correctly classified collapsed building samples and the correctly classified oriented building samples obtained using Fi to classify the known samples as CB and OB, respectively, and tn stands for the total number of known samples.
(3) F1, F2, F3, and F4 are used to classify the volume-dominated samples of the unknown category as CB and OB, respectively. The k-means clustering algorithm is again used as the classification method. The four kinds of classification results corresponding to the four features can then be obtained. The four kinds of classification results are tagged as R1, R2, R3, and R4, corresponding to F1, F2, F3, and F4, respectively.
(4) There are two target classes—CB and OB—so the CB are tagged with “−1” and the OB are tagged with “1”. According to R1, R2, R3, and R4, the data sample x in the volume-dominated samples with unknown category is assigned a precision-weighted value based on a1, a2, a3, and a4. This can be expressed as:
  i n   R i , i { 1 , 2 , 3 , 4 } i f x CB , x = a i × ( 1 ) , i { 1 , 2 , 3 , 4 } i f x OB , x = a i × 1 , i { 1 , 2 , 3 , 4 }
The sum of the precision-weighted values of x for the collapsed building category and the oriented building category is calculated, respectively, and the absolute values are compared to determine the category of x. In fact, this step is the same as a voting scheme. This can be expressed as:
i f | a i × 1 | < | a i × ( 1 ) | , i { 1 , 2 , 3 , 4 } x CB i f | a i × 1 | > | a i × ( 1 ) | , i { 1 , 2 , 3 , 4 } x OB

2.2.4. Building Collapse Rate Calculation

Because the speckle noise in the SAR image has an impact on the outline and the shape of buildings, the outlines of the individual buildings in the PolSAR image considered in this paper are obscure. Therefore, it is hard to evaluate the damage for an individual building, and damage evaluation of a single building would produce blunder. In order to obtain a more precise assessment, the BDLs are weighed at the scale of city block. Furthermore, taking city blocks as the basic units to measure BDLs and evaluate the precision of the proposed method is an effective means to surmount the data differences from various data source. The overall BDL of one block is measured by the building earthquake damage index, building block collapse rate (BBCR). The BBCR is defined as the ratio of CB to the total buildings in a city block. The total buildings are the sum of UDB and CB. Each block is endowed with a BBCR value for evaluating the block BDL. The BBCR of the ith block can be written as:
B B C R i = T C i T B i
where TCi denotes the sum of the collapsed building pixels in the ith block; and TBi denotes the sum of the building pixels of the ith block.
In this study, the BDLs are divided into slight damage level (SLD), moderate damage level (MOD), and serious damage level (SED) based on the threshold values of BBCR. The BDLs can be expressed as:
{ i f   B B C R i ε 1 , b l o c k i SLD i f   ε 1 < B B C R i ε 2 , b l o c k i MOD i f   B B C R i > ε 2 ,     b l o c k i SED
where ε1 and ε2 are the thresholds of BBCR for partitioning the three BDLs.
Using the BBCR to evaluate the BDLs of city blocks can be applied to SAR images with multiple resolutions. This approach can therefore expand the application scope and enhance the flexibility, and is conducive to the formulation and deployment of comprehensive programs in the process of emergency rescue response.

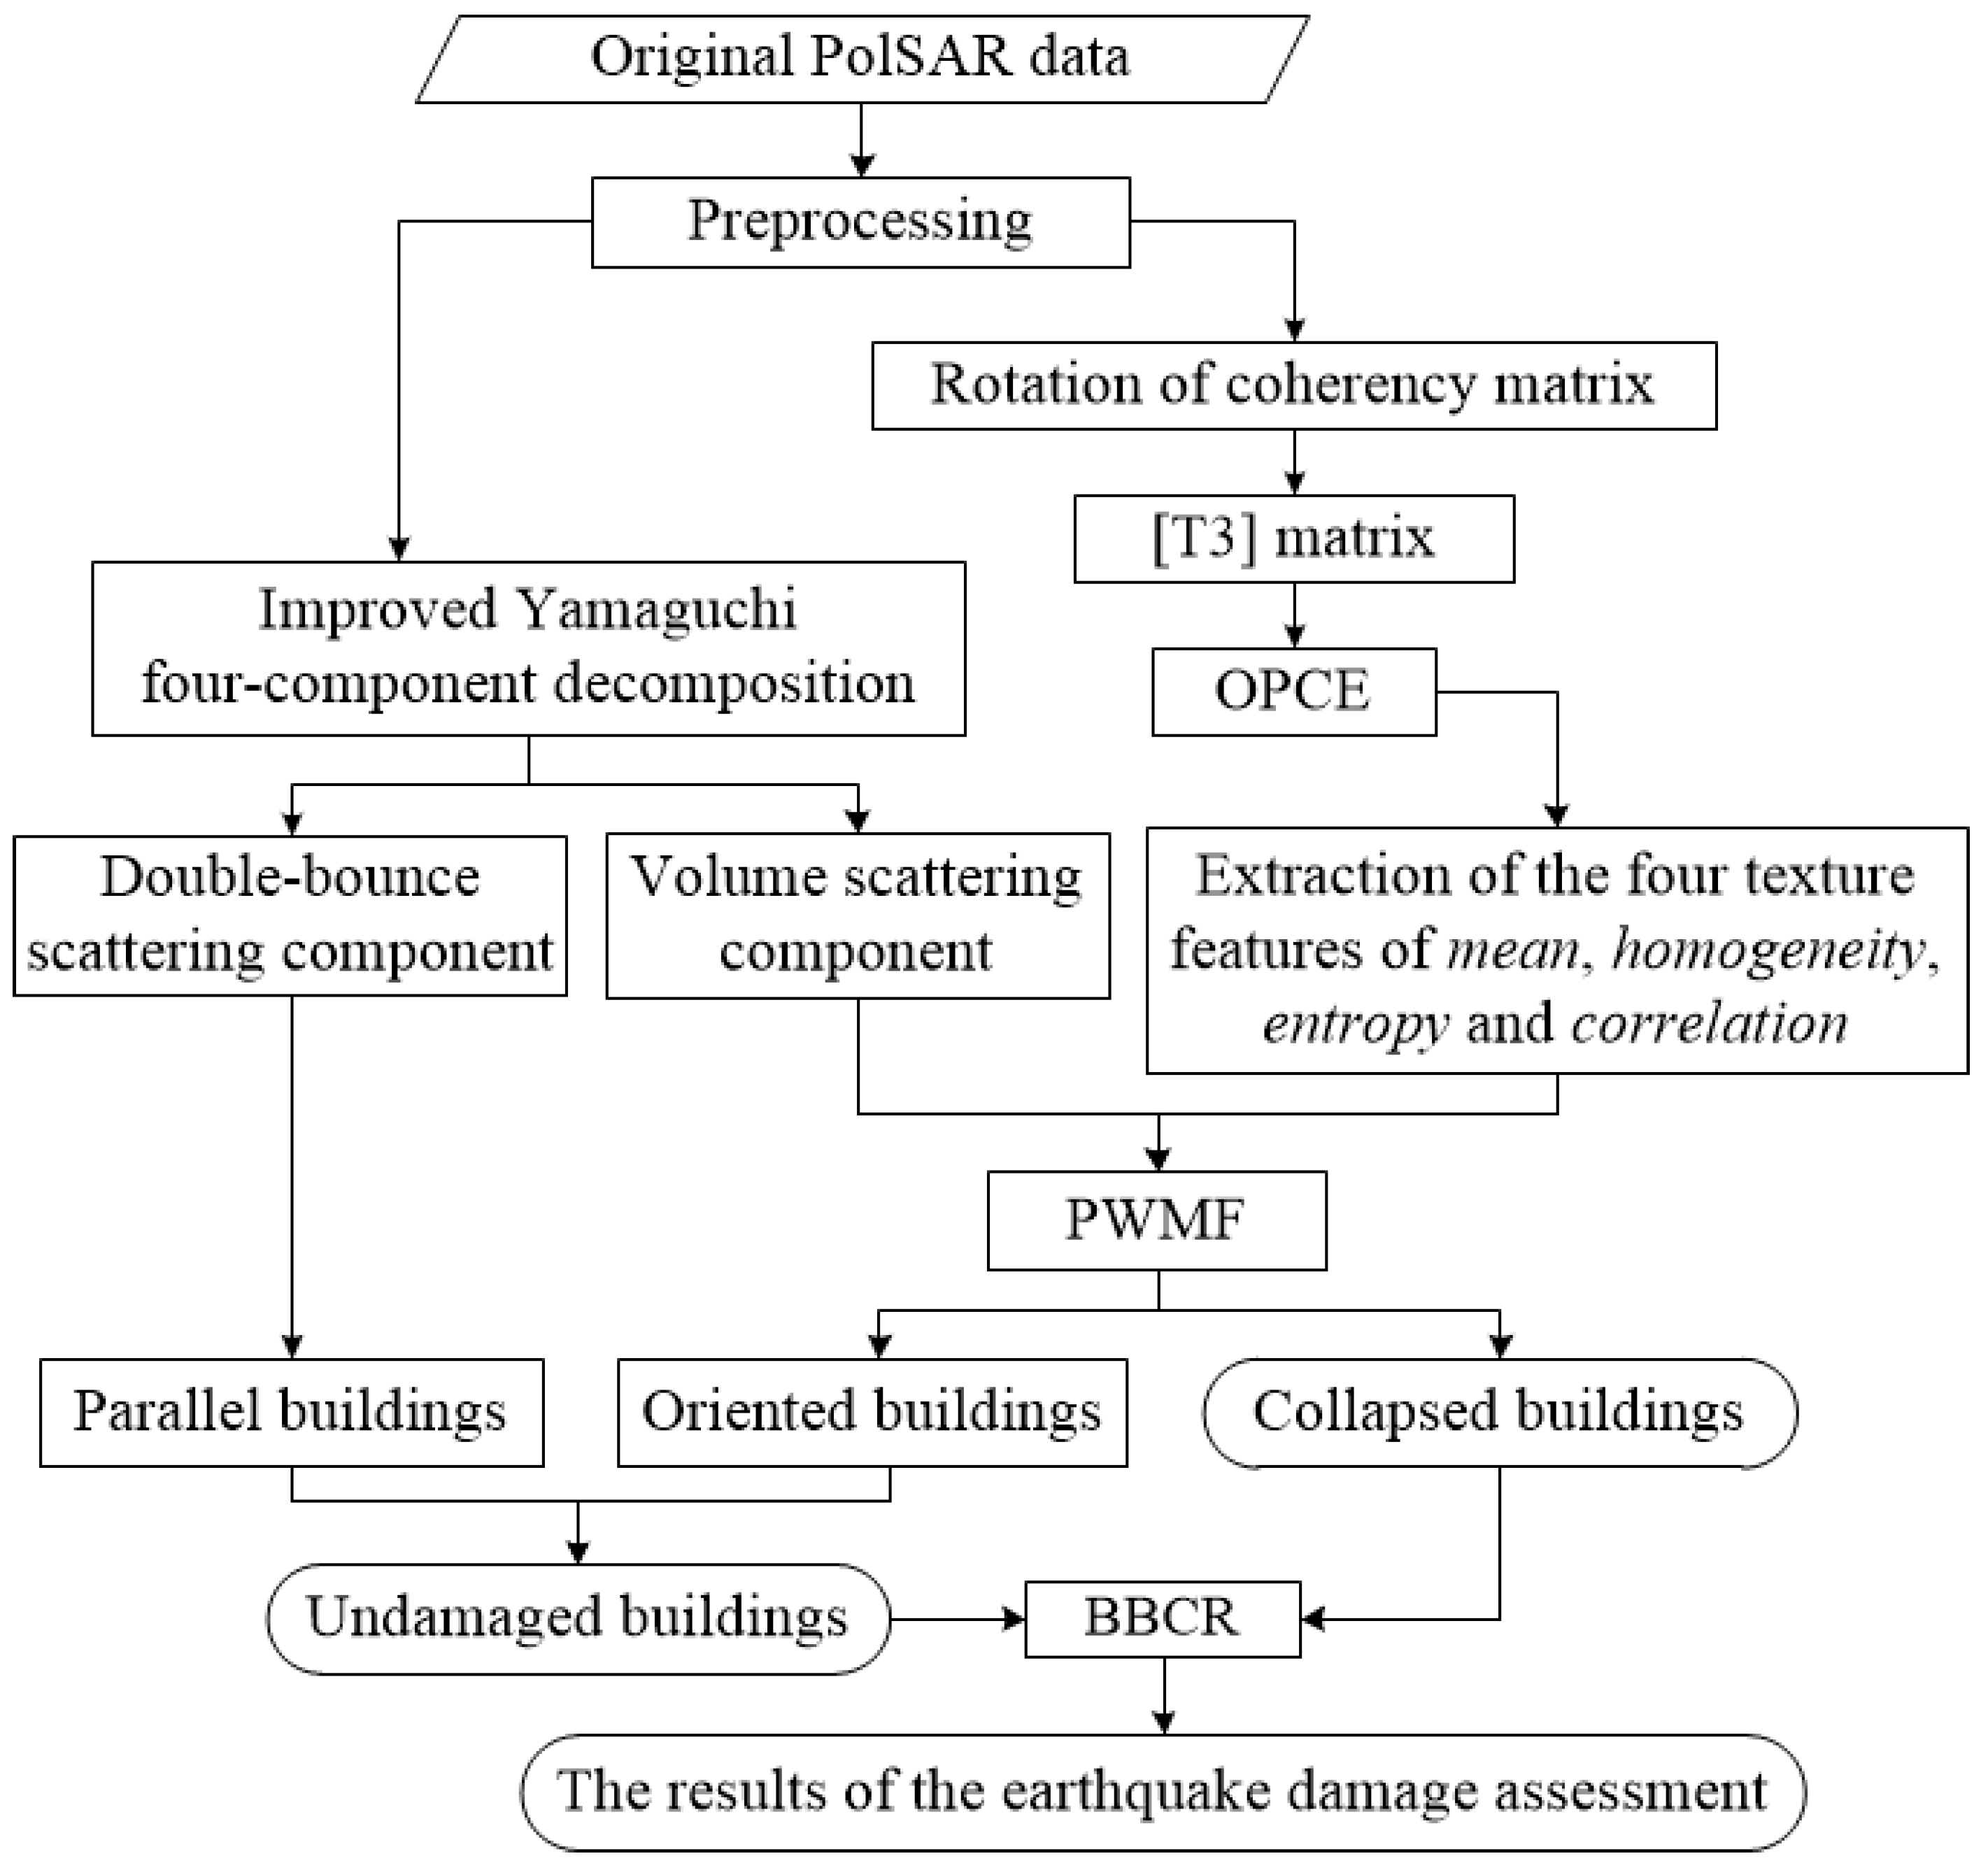
2.2.5. Building Damage Assessment Framework

The procedure of BDA is displayed in Figure 8. There are four critical steps in the BDA procedure proposed in this paper.
The first procedure is polarization decomposition. According to Equations (1)–(4), the CM T is rotated by rotation angle θ, and the rotated CM T(θ) is obtained. The method of improved YFCD [41] is then executed on the PolSAR image after preprocessing. In this process, the objects predominated by VS and DBS are obtained, and the objects dominated by DBS are directly classified as PB.
The second step is texture feature extraction. The OPCE algorithm described in Section 2.2.2 is performed on the PolSAR image after the CM is rotated to enhance the power contrast of the undamaged OB and the CB, and the OPCE power image is acquired. The four texture features of mean, homogeneity, entropy, and correlation are extracted from the OPCE power image.
The third step is multiple texture feature fusion using the PWMF method introduced in Section 2.1. The ground objects predominated by VS generated from the first step are classified into CB and undamaged OB using the PWMF method, according to the statements in Section 2.2.3. In this way, the classification results of CB and OB are obtained.
The last procedure is building earthquake damage evaluation based on the BBCR. The PB and the undamaged OB are combined as the UDB. Except for the UDB and the CB, the rest of the objects are categorized to the nonbuildings (NB) class. The BBCR values for all of the blocks are computed based on Equation (12), and the BDL of each city block in the research area is acquired based on Equation (13).

3. Results

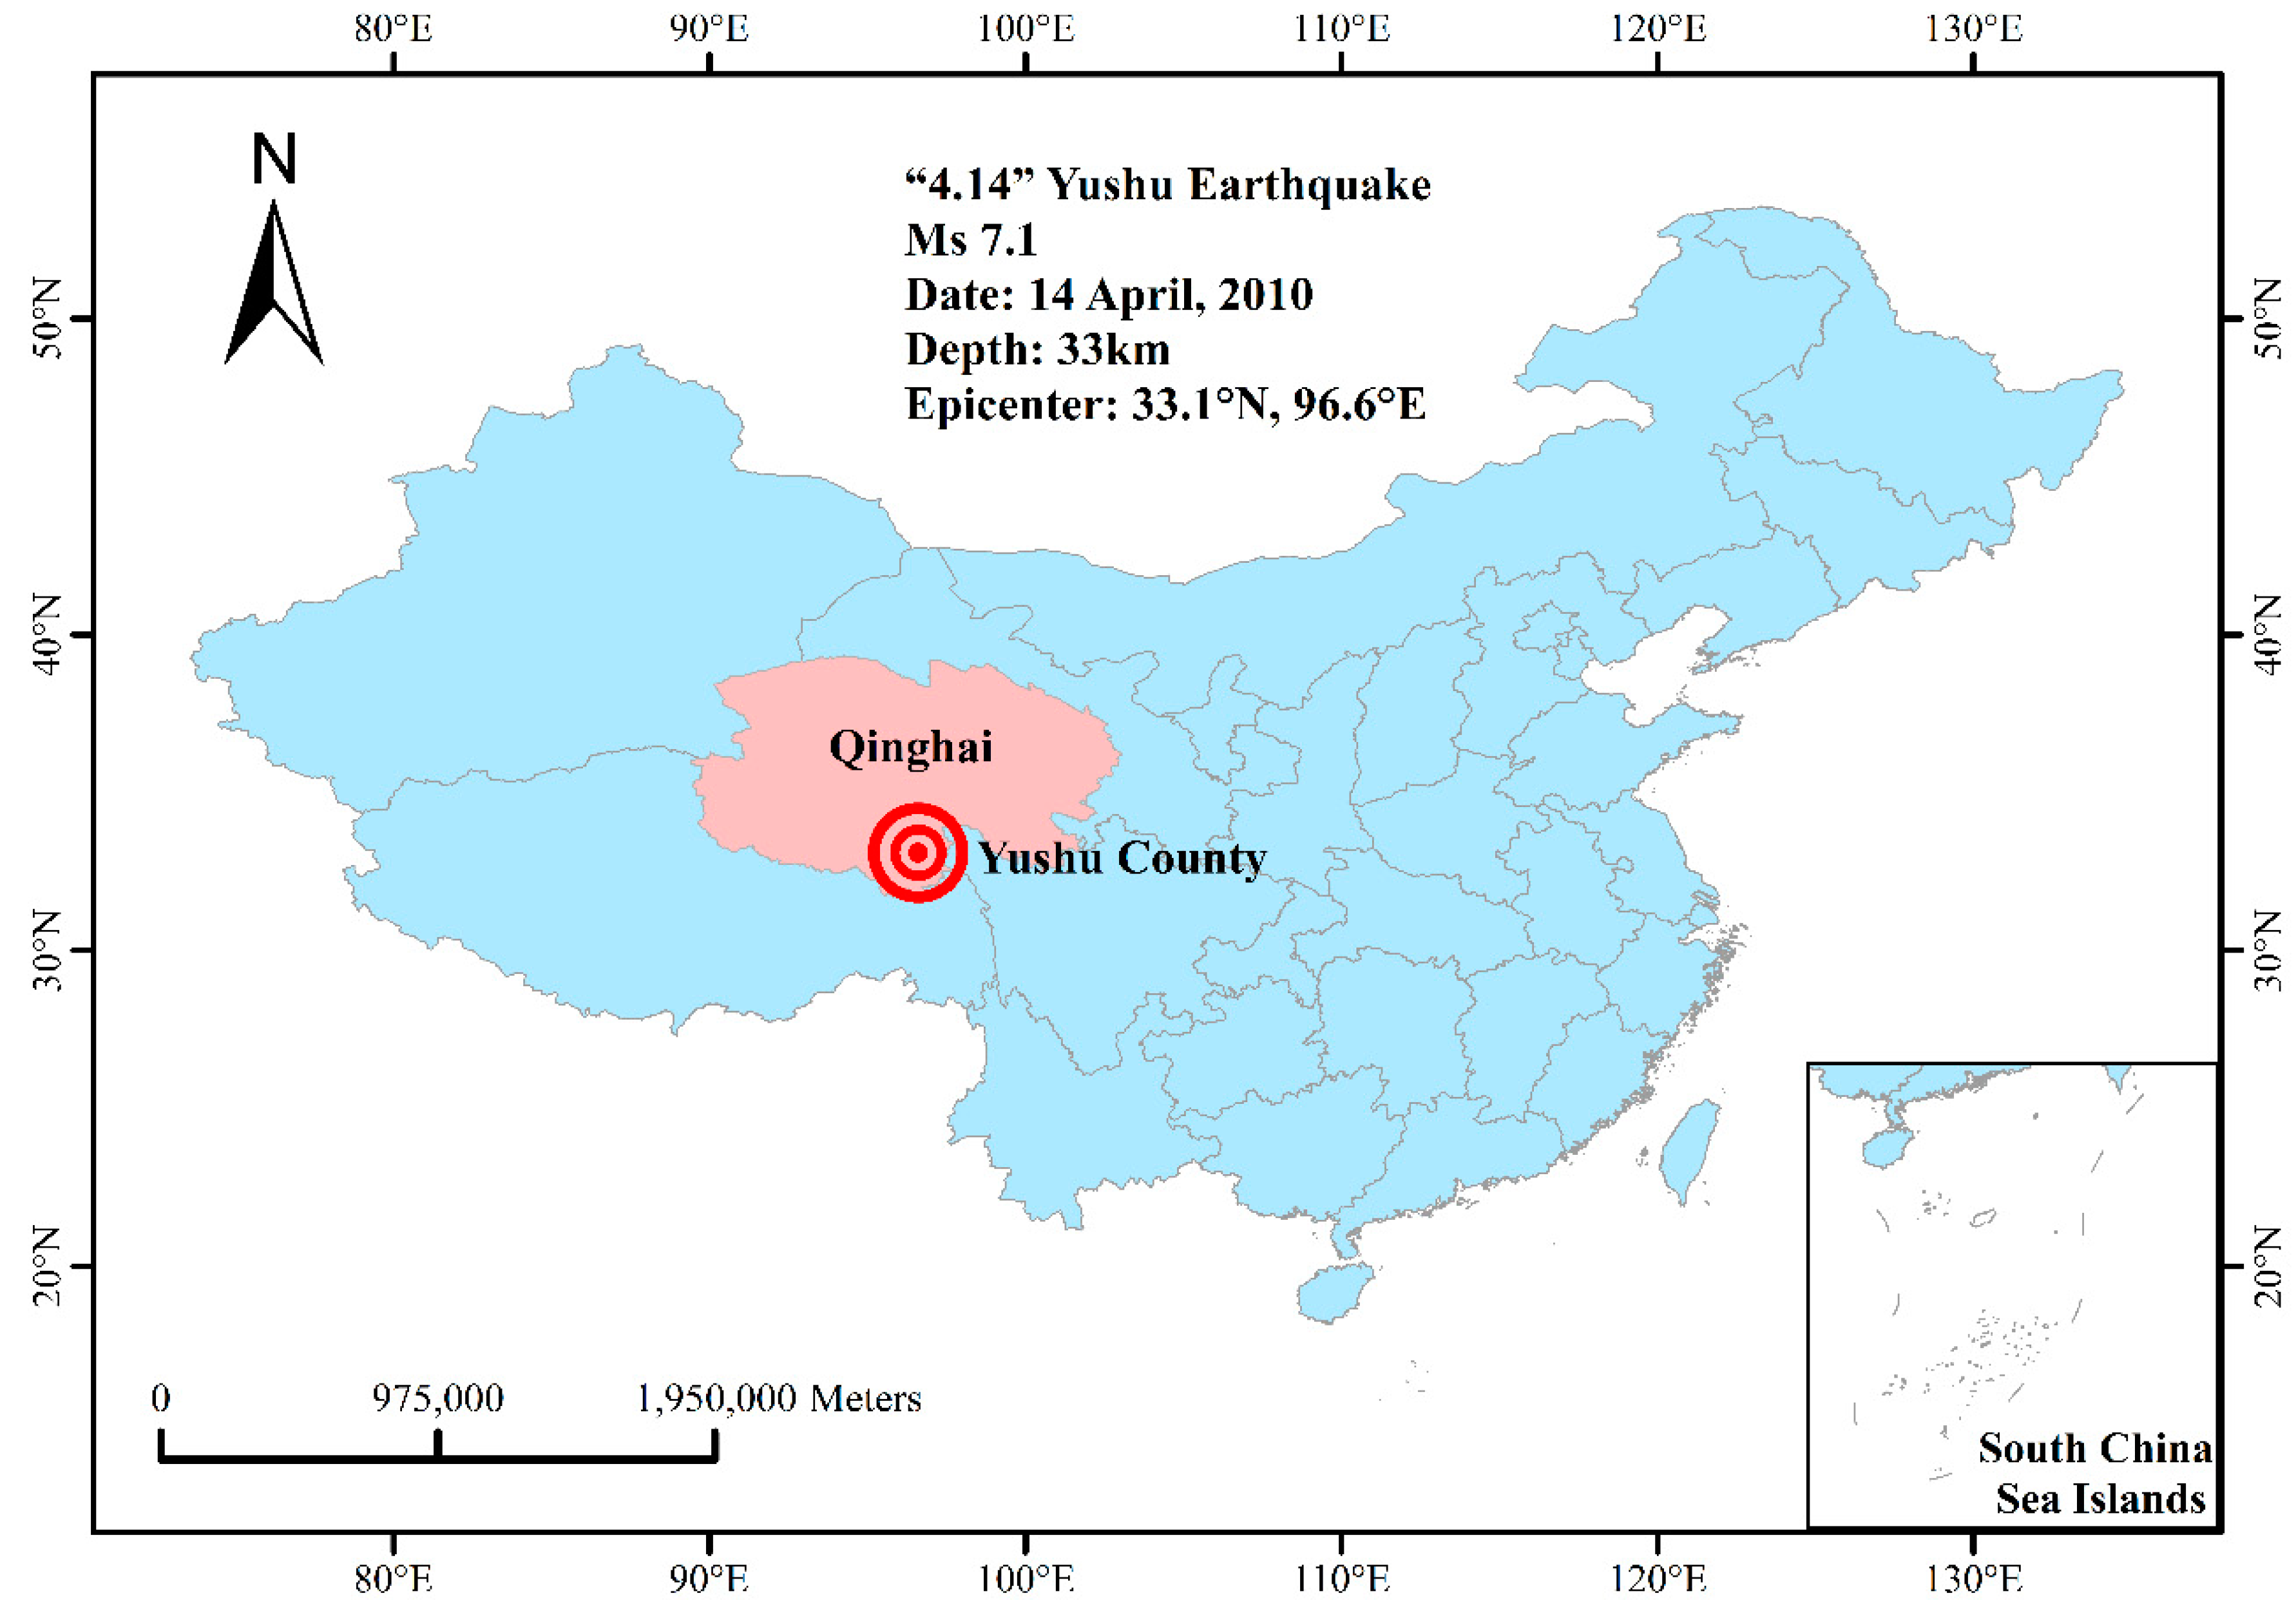
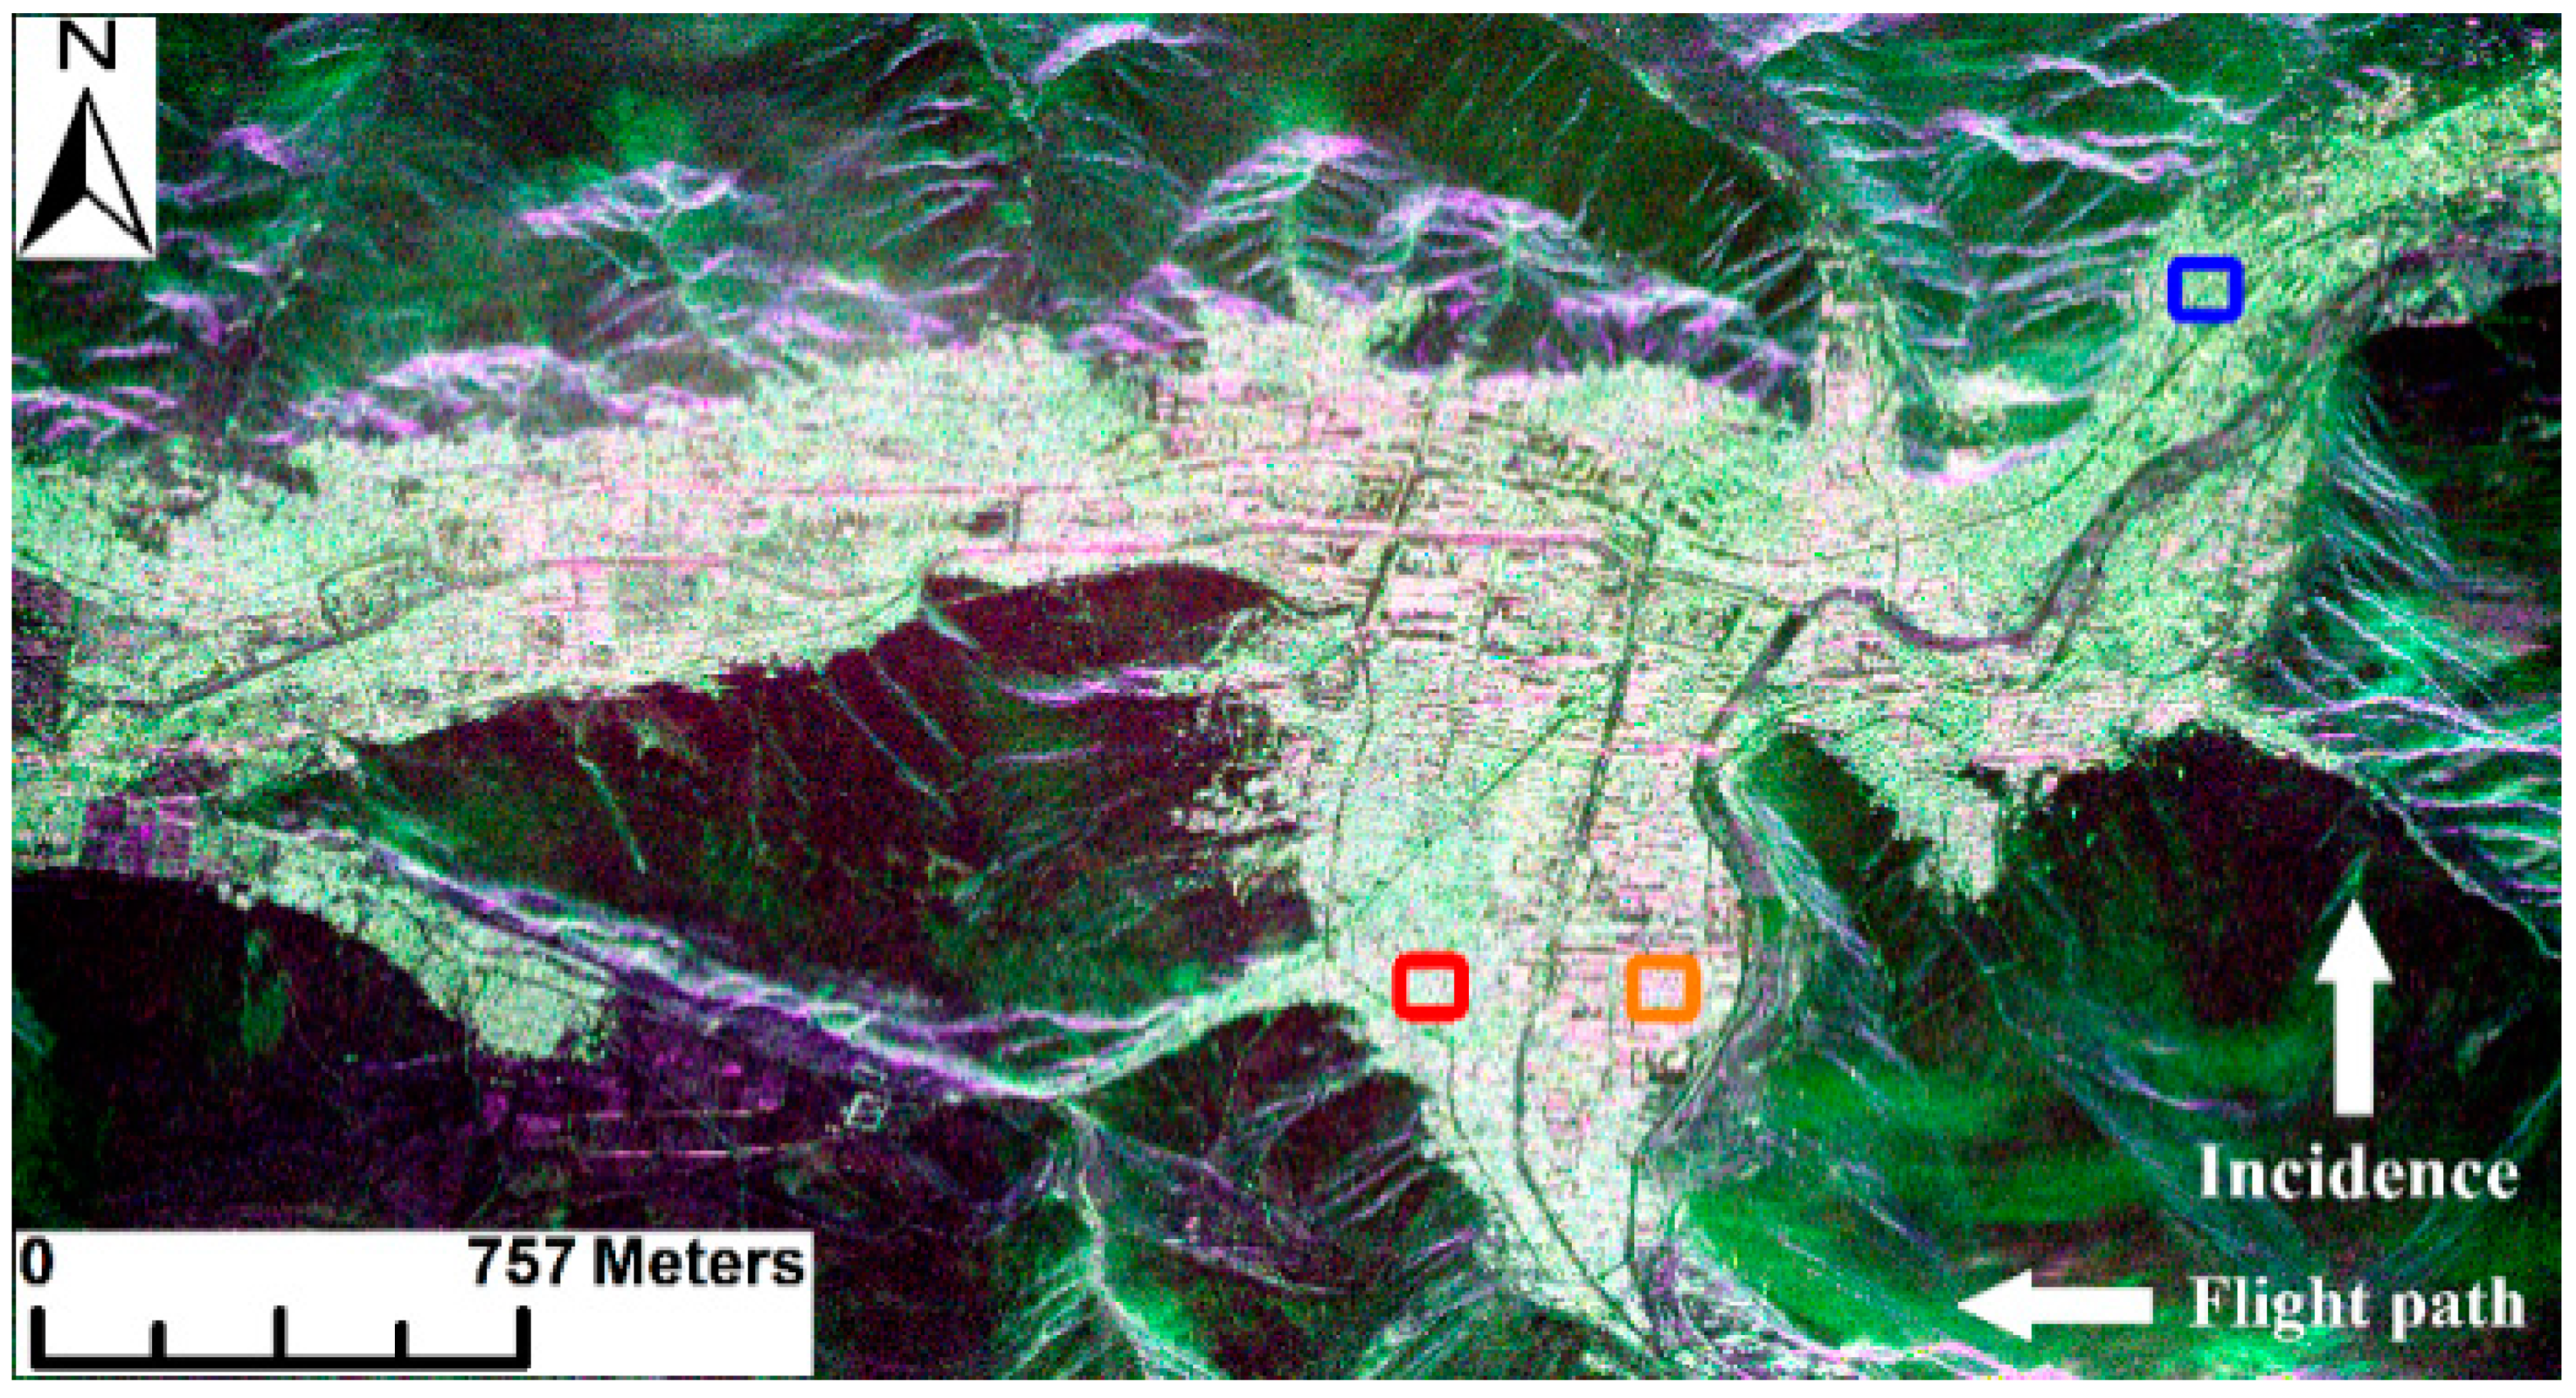
3.1. Study Area Description and Data Preparation

The study case and the experimental data are introduced in this section to facilitate the analysis in the following sections. In this paper, the magnitude 7.1 Yushu earthquake that occurred on April 14, 2010, in Yushu County (Qinghai province, China) is used as the study case. The epicenter location of the Yushu earthquake was in 33.1°N and 96.6°E. The map of Yushu County location is displayed in Figure 9. The Yushu earthquake-induced damage in this region is huge. More than 2600 people died and many building were damaged during this earthquake. The total of the direct economic losses reached more than 22 billion CNY. The urban area in Yushu County is selected as the study area for this paper. Yushu County is located in Qinghai-Tibet Plateau with high altitude, and it belongs to an arid area. As a result, the vegetation of the study area is low-level and very sparse, so it was neglected in our experiment. The buildings in the study region are mainly simple low-rise residential buildings.
The experiment was performed on the postearthquake airborne PolSAR data, and the effectiveness of the proposed method for BDA after an earthquake was validated in the experiment. The experimental data is the high-resolution airborne P-band PolSAR imagery which was obtained on April 14, 2010 by the Chinese airborne SAR mapping system (SARMapper). Both the azimuth resolution and the range resolution were approximately 1 m. The flight path was from east to west horizontally. The incidence angle is 50°. Figure 10 is the Pauli RGB false color image has the size of 8192 × 4384 pixels, which is established with the color composition of |HH+VV|(blue), |HV|(green), and |HH–VV|(red). The preprocessing steps of geometric correction and radiometric correction were not carried out for the PolSAR data, because the user permission for the PolSAR data used in this paper is partially restricted and some SAR system parameters are lacking. In Figure 10, the three regions of interest (ROIs) selected for the three kinds of buildings are marked with the three colored rectangles are the samples of CB in red, OB in blue, and PB in orange.
In the PolSAR data, the mountains surrounding the urban region were removed by masking, and then only the urban area was kept for our experiment. Being subject to the resolution of the PolSAR image and the tremendous amount of buildings in the study region, instead of identifying the damage extent of single buildings, the city block damage level was the investigation target. For the sake of the accuracy assessment, the whole urban area was divided into 72 city blocks by the roads in the urban region based on the comparability of the built-up blocks. The BDA reference information is displayed in Figure 11 according to the references [49,50]. The BDLs of the 72 city blocks were divided into SLD, MOD, and SED according to the reference [51]. If the CB in a city block are less than one-third of the total buildings, the block will be considered as SLD. SED is defined as more than half of the buildings collapsed in a city block. If the BDL of a city block is between SLD and SED, the block will be regarded as MOD.

3.2. Experiment Demonstration

According to the procedure of BDA described in Section 2.2.5, the BDLs of the Yushu urban region were evaluated using the postearthquake PolSAR data and the proposed approach.
The sigma speckle filter developed by Lee [52] as a preprocessing step for PolSAR data was first applied for speckle noise filtering, before the application of the improved YFCD.

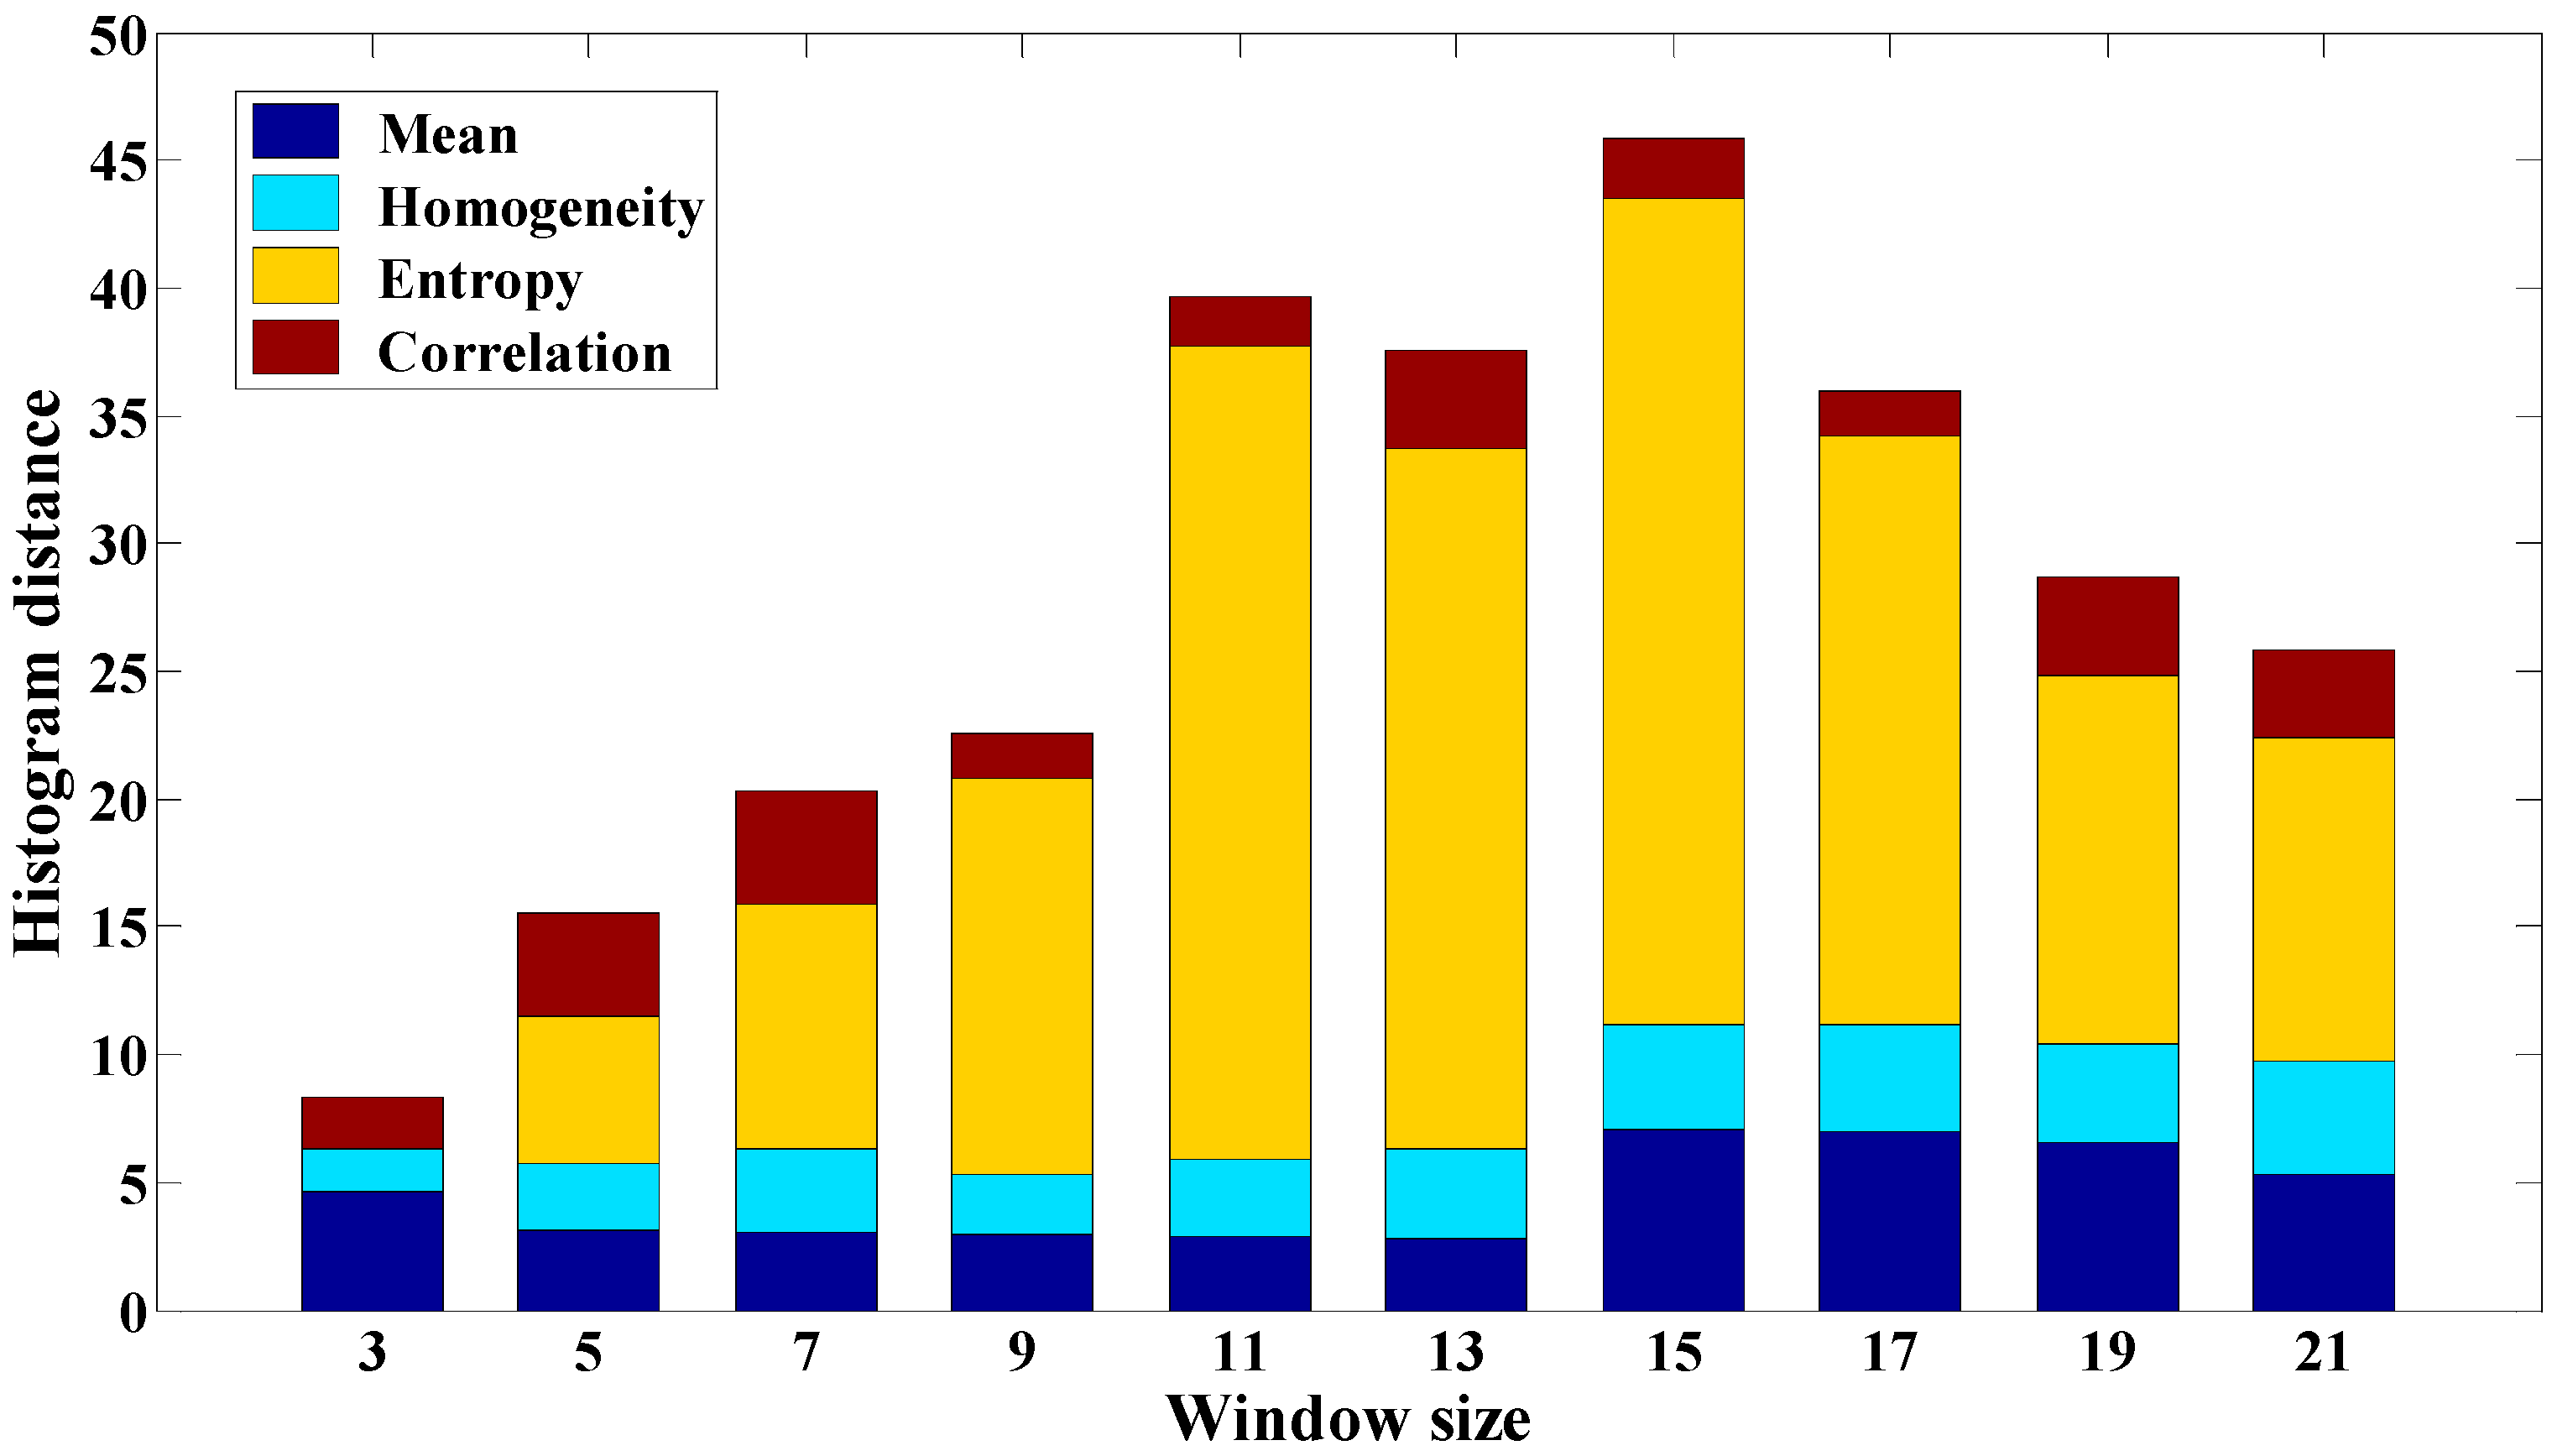
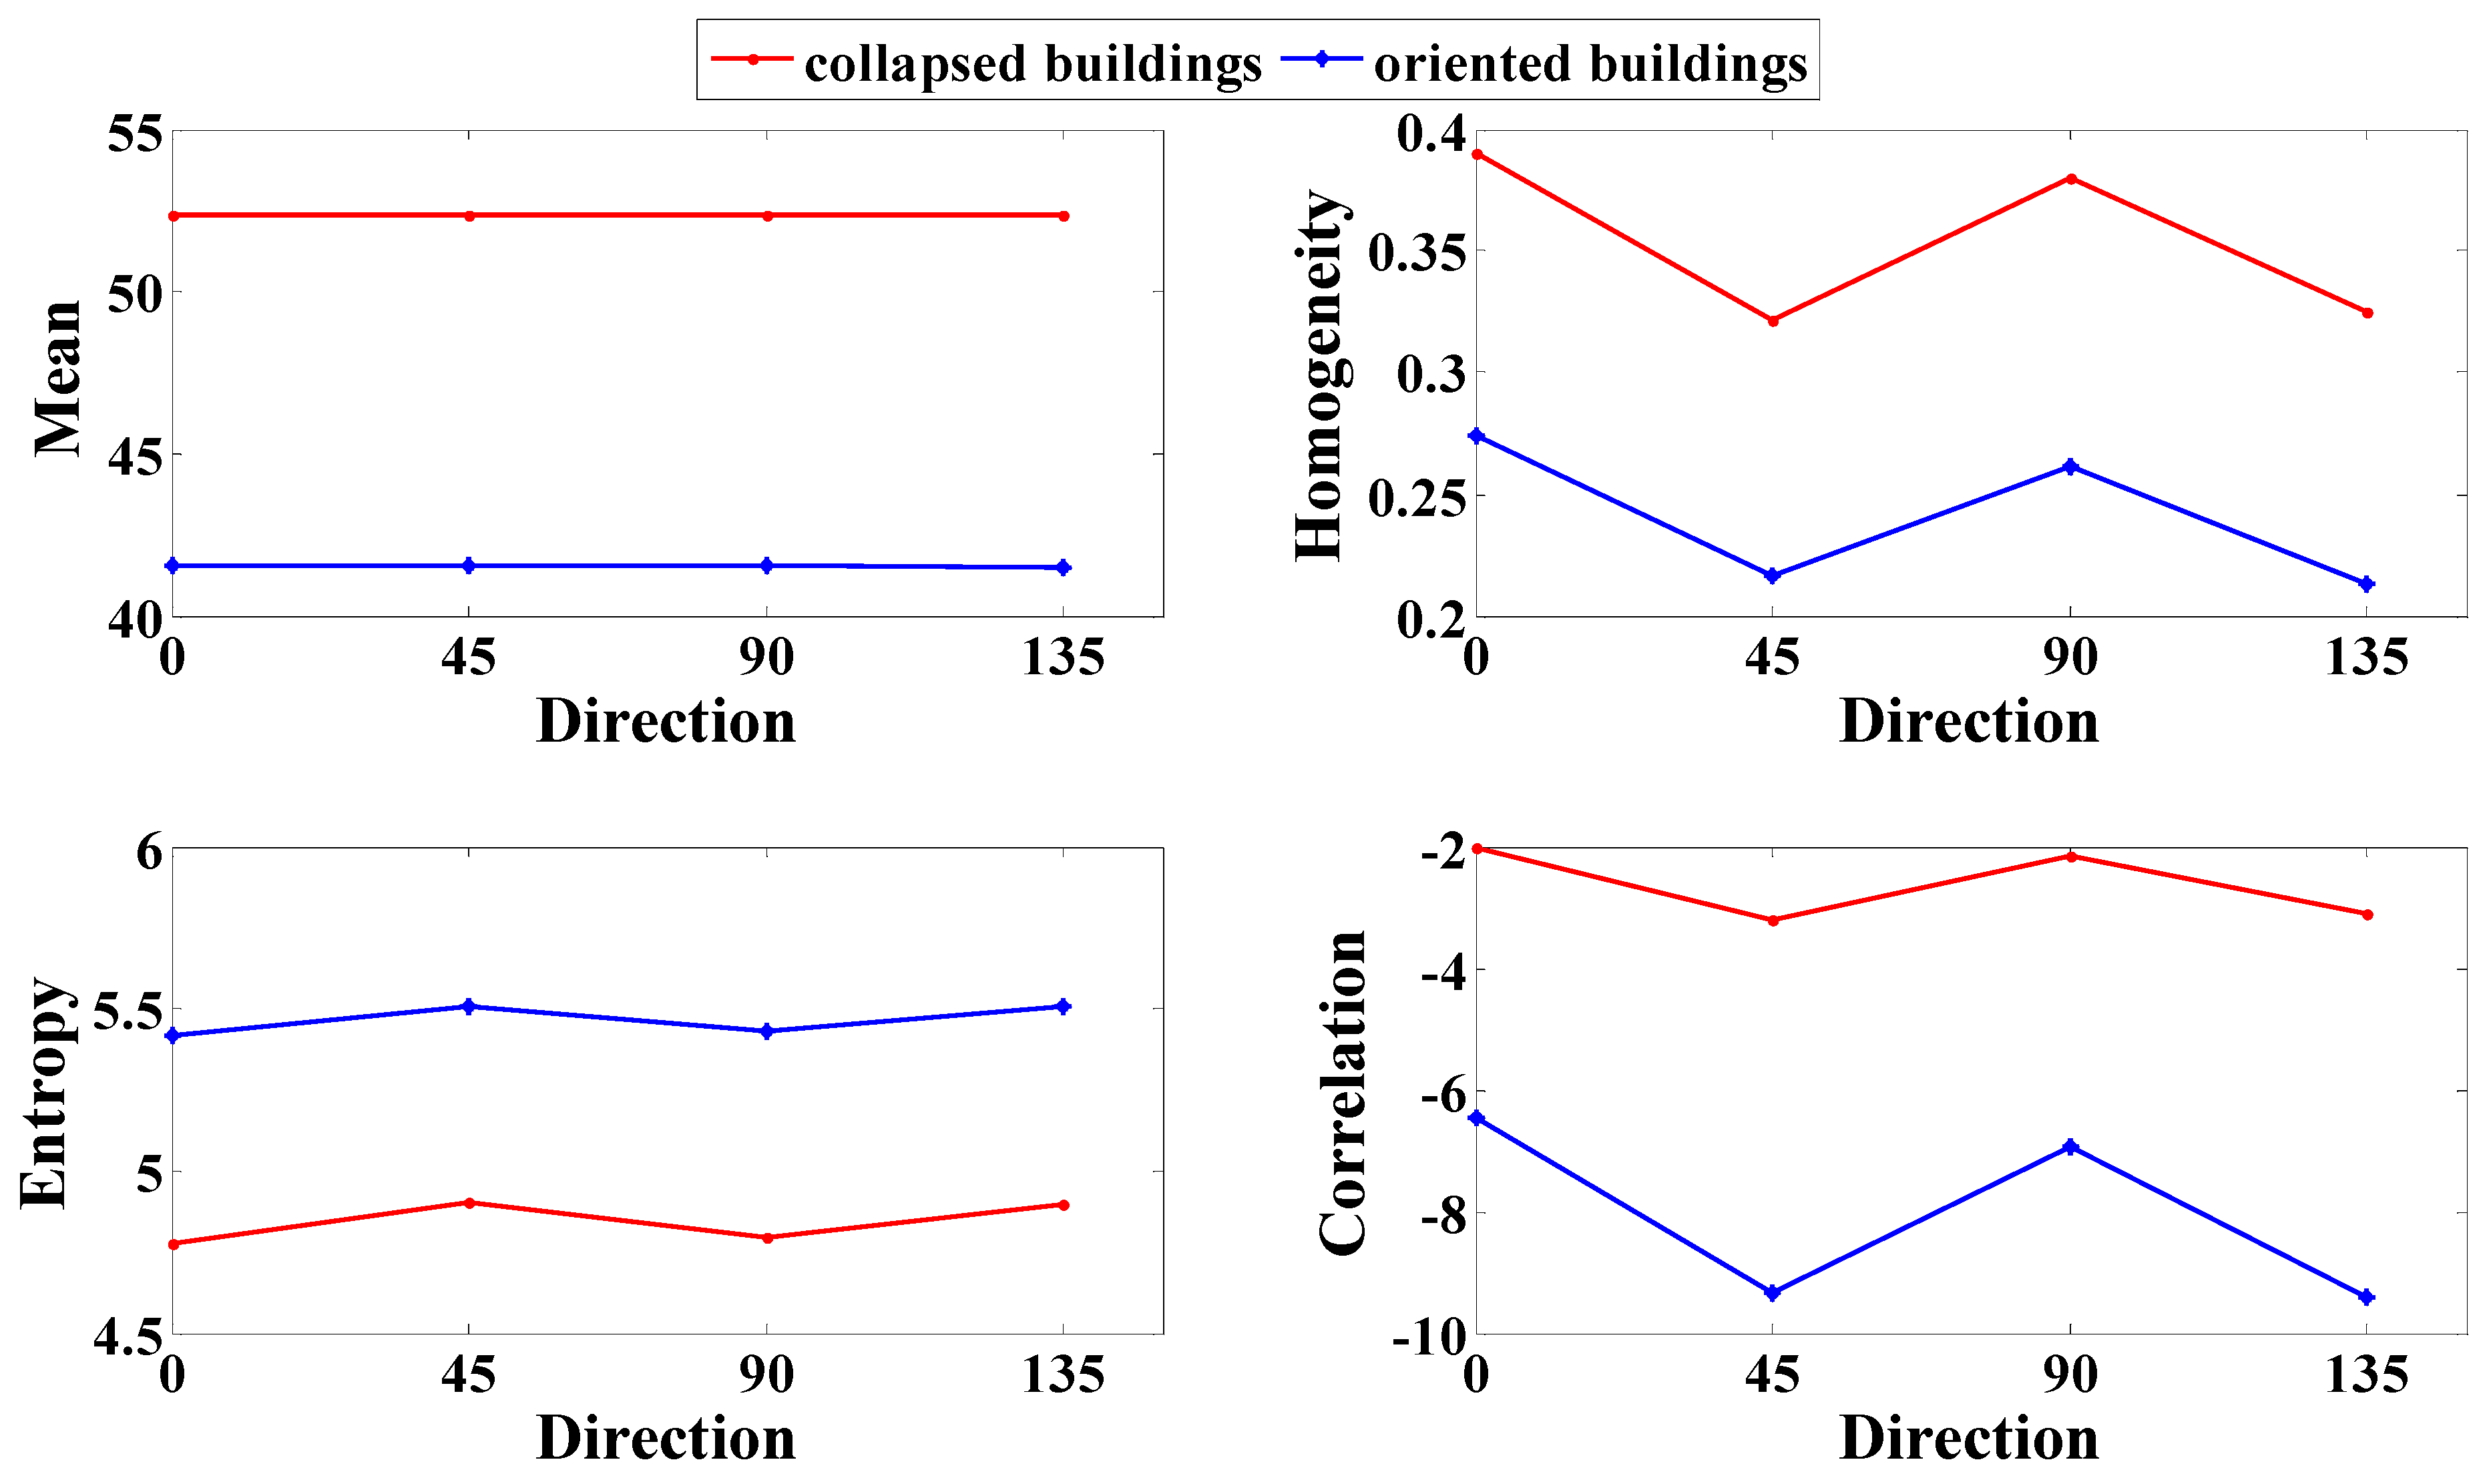
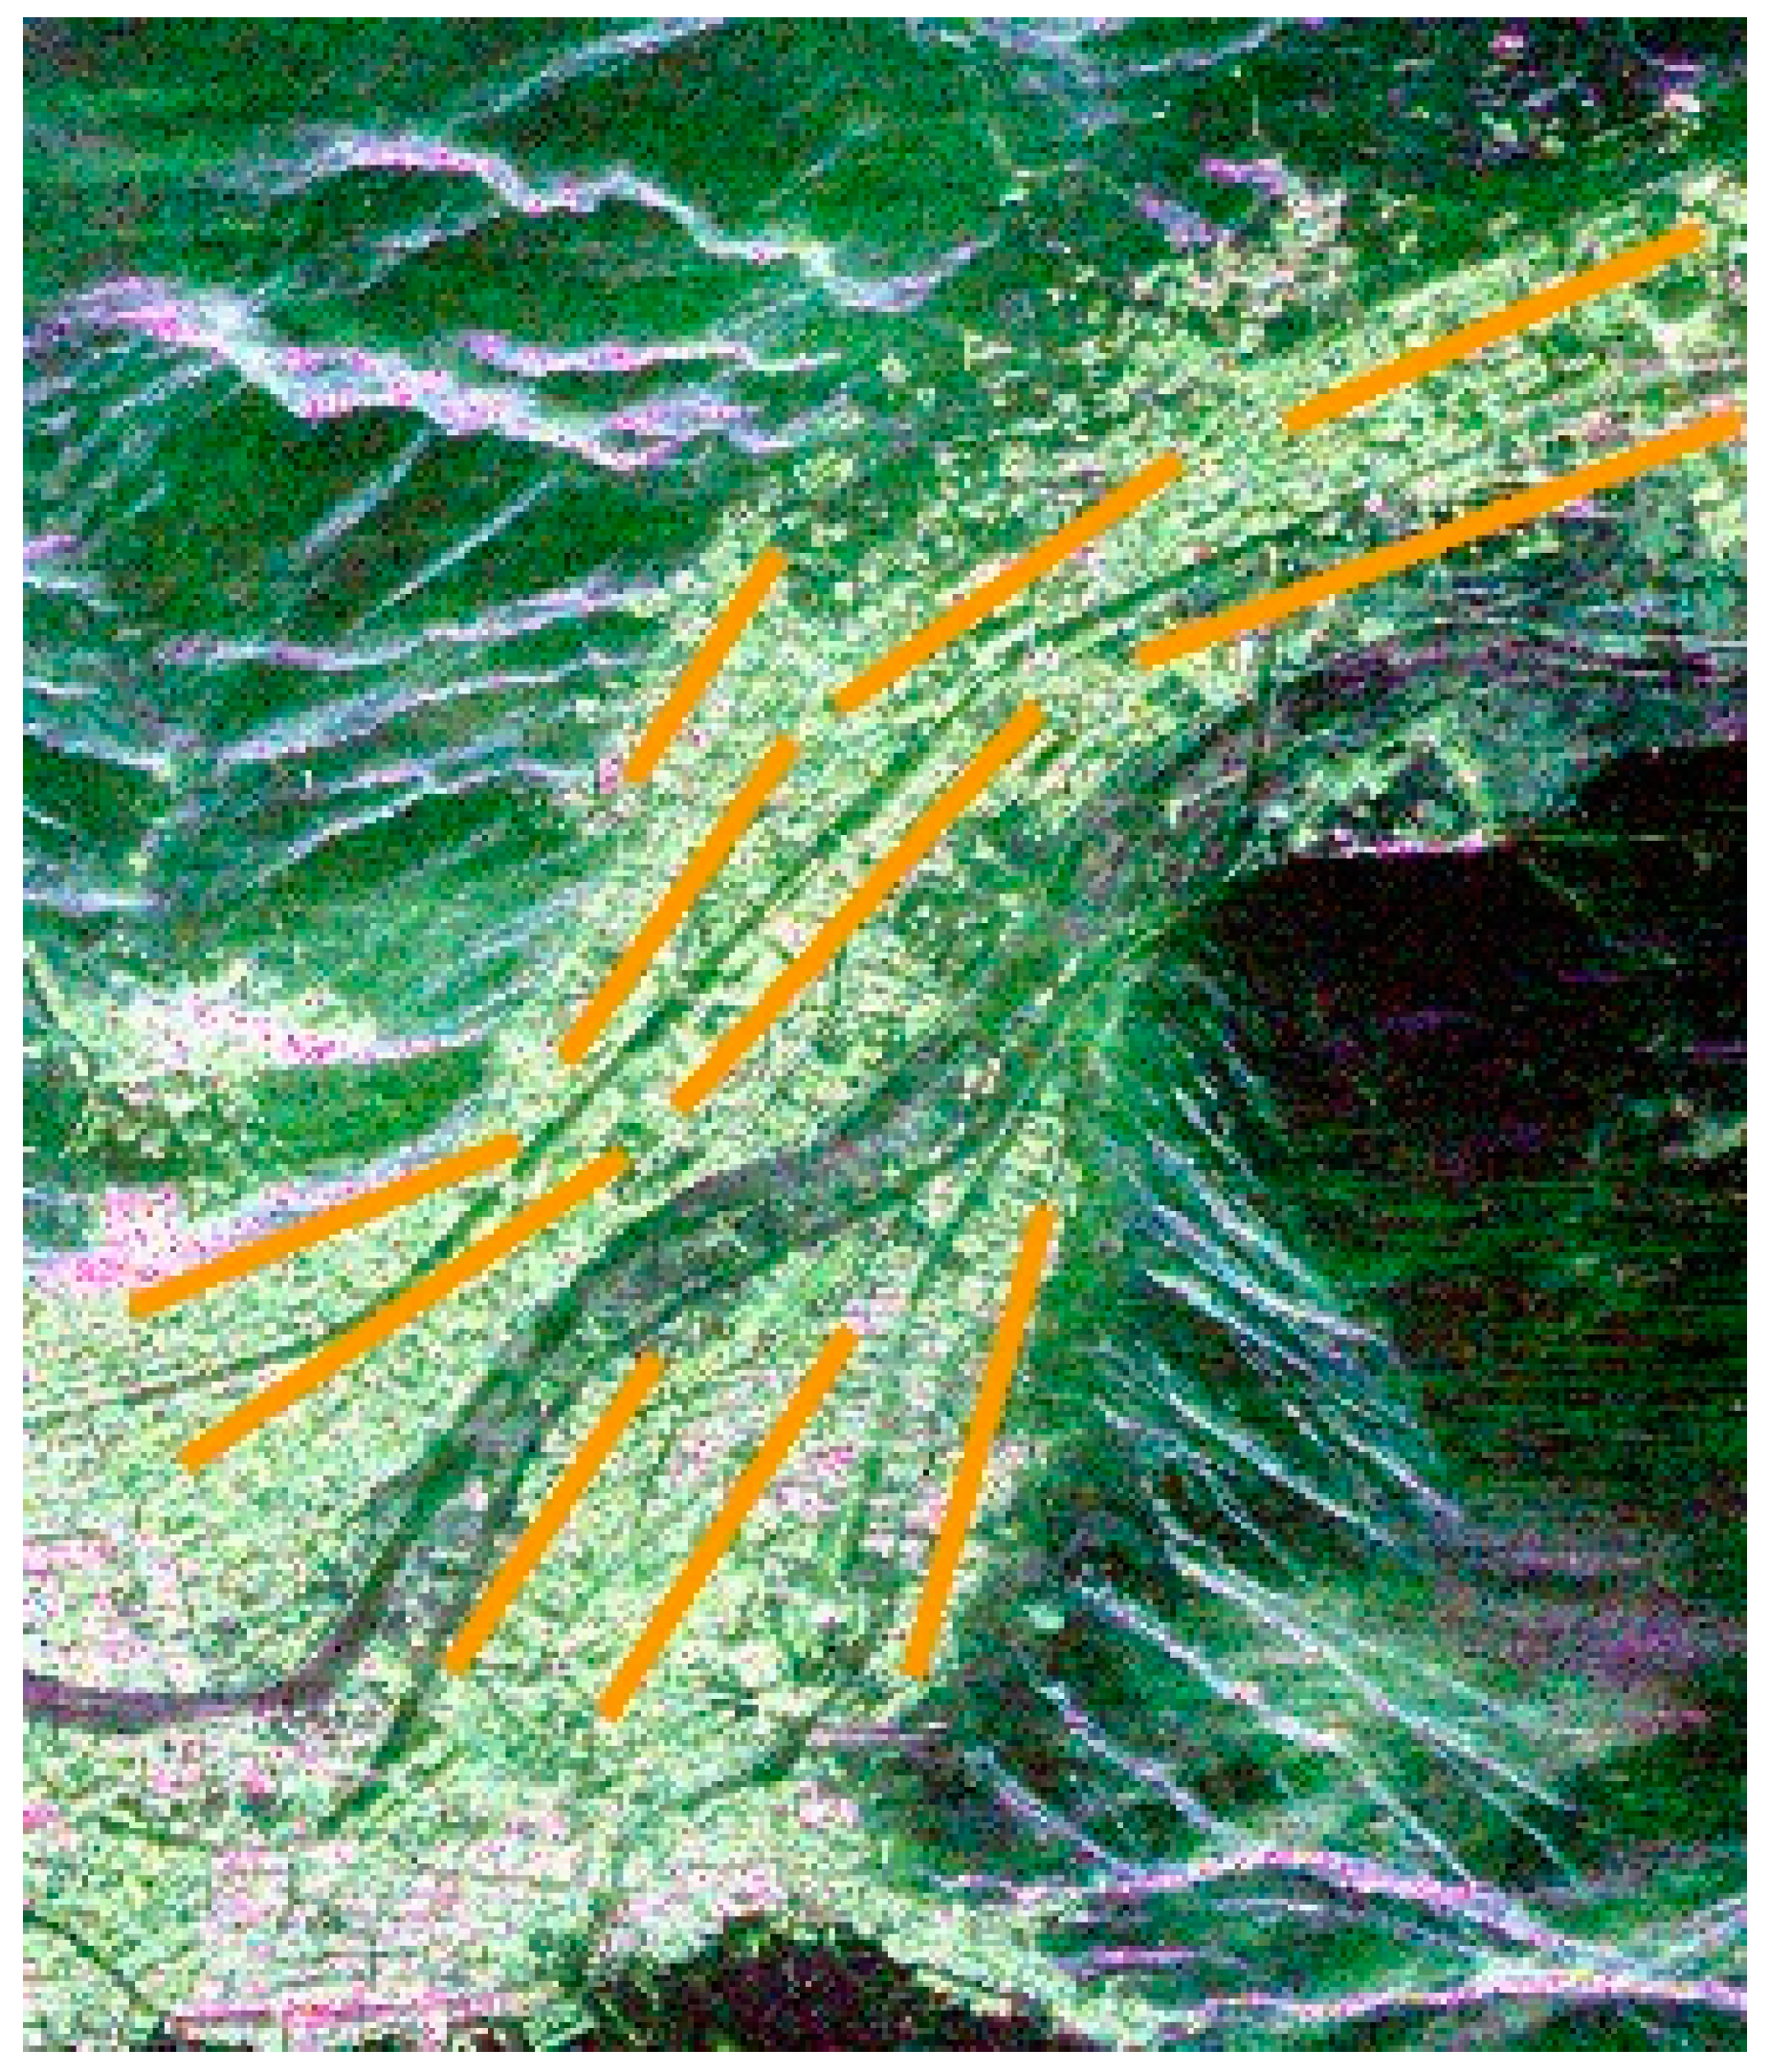
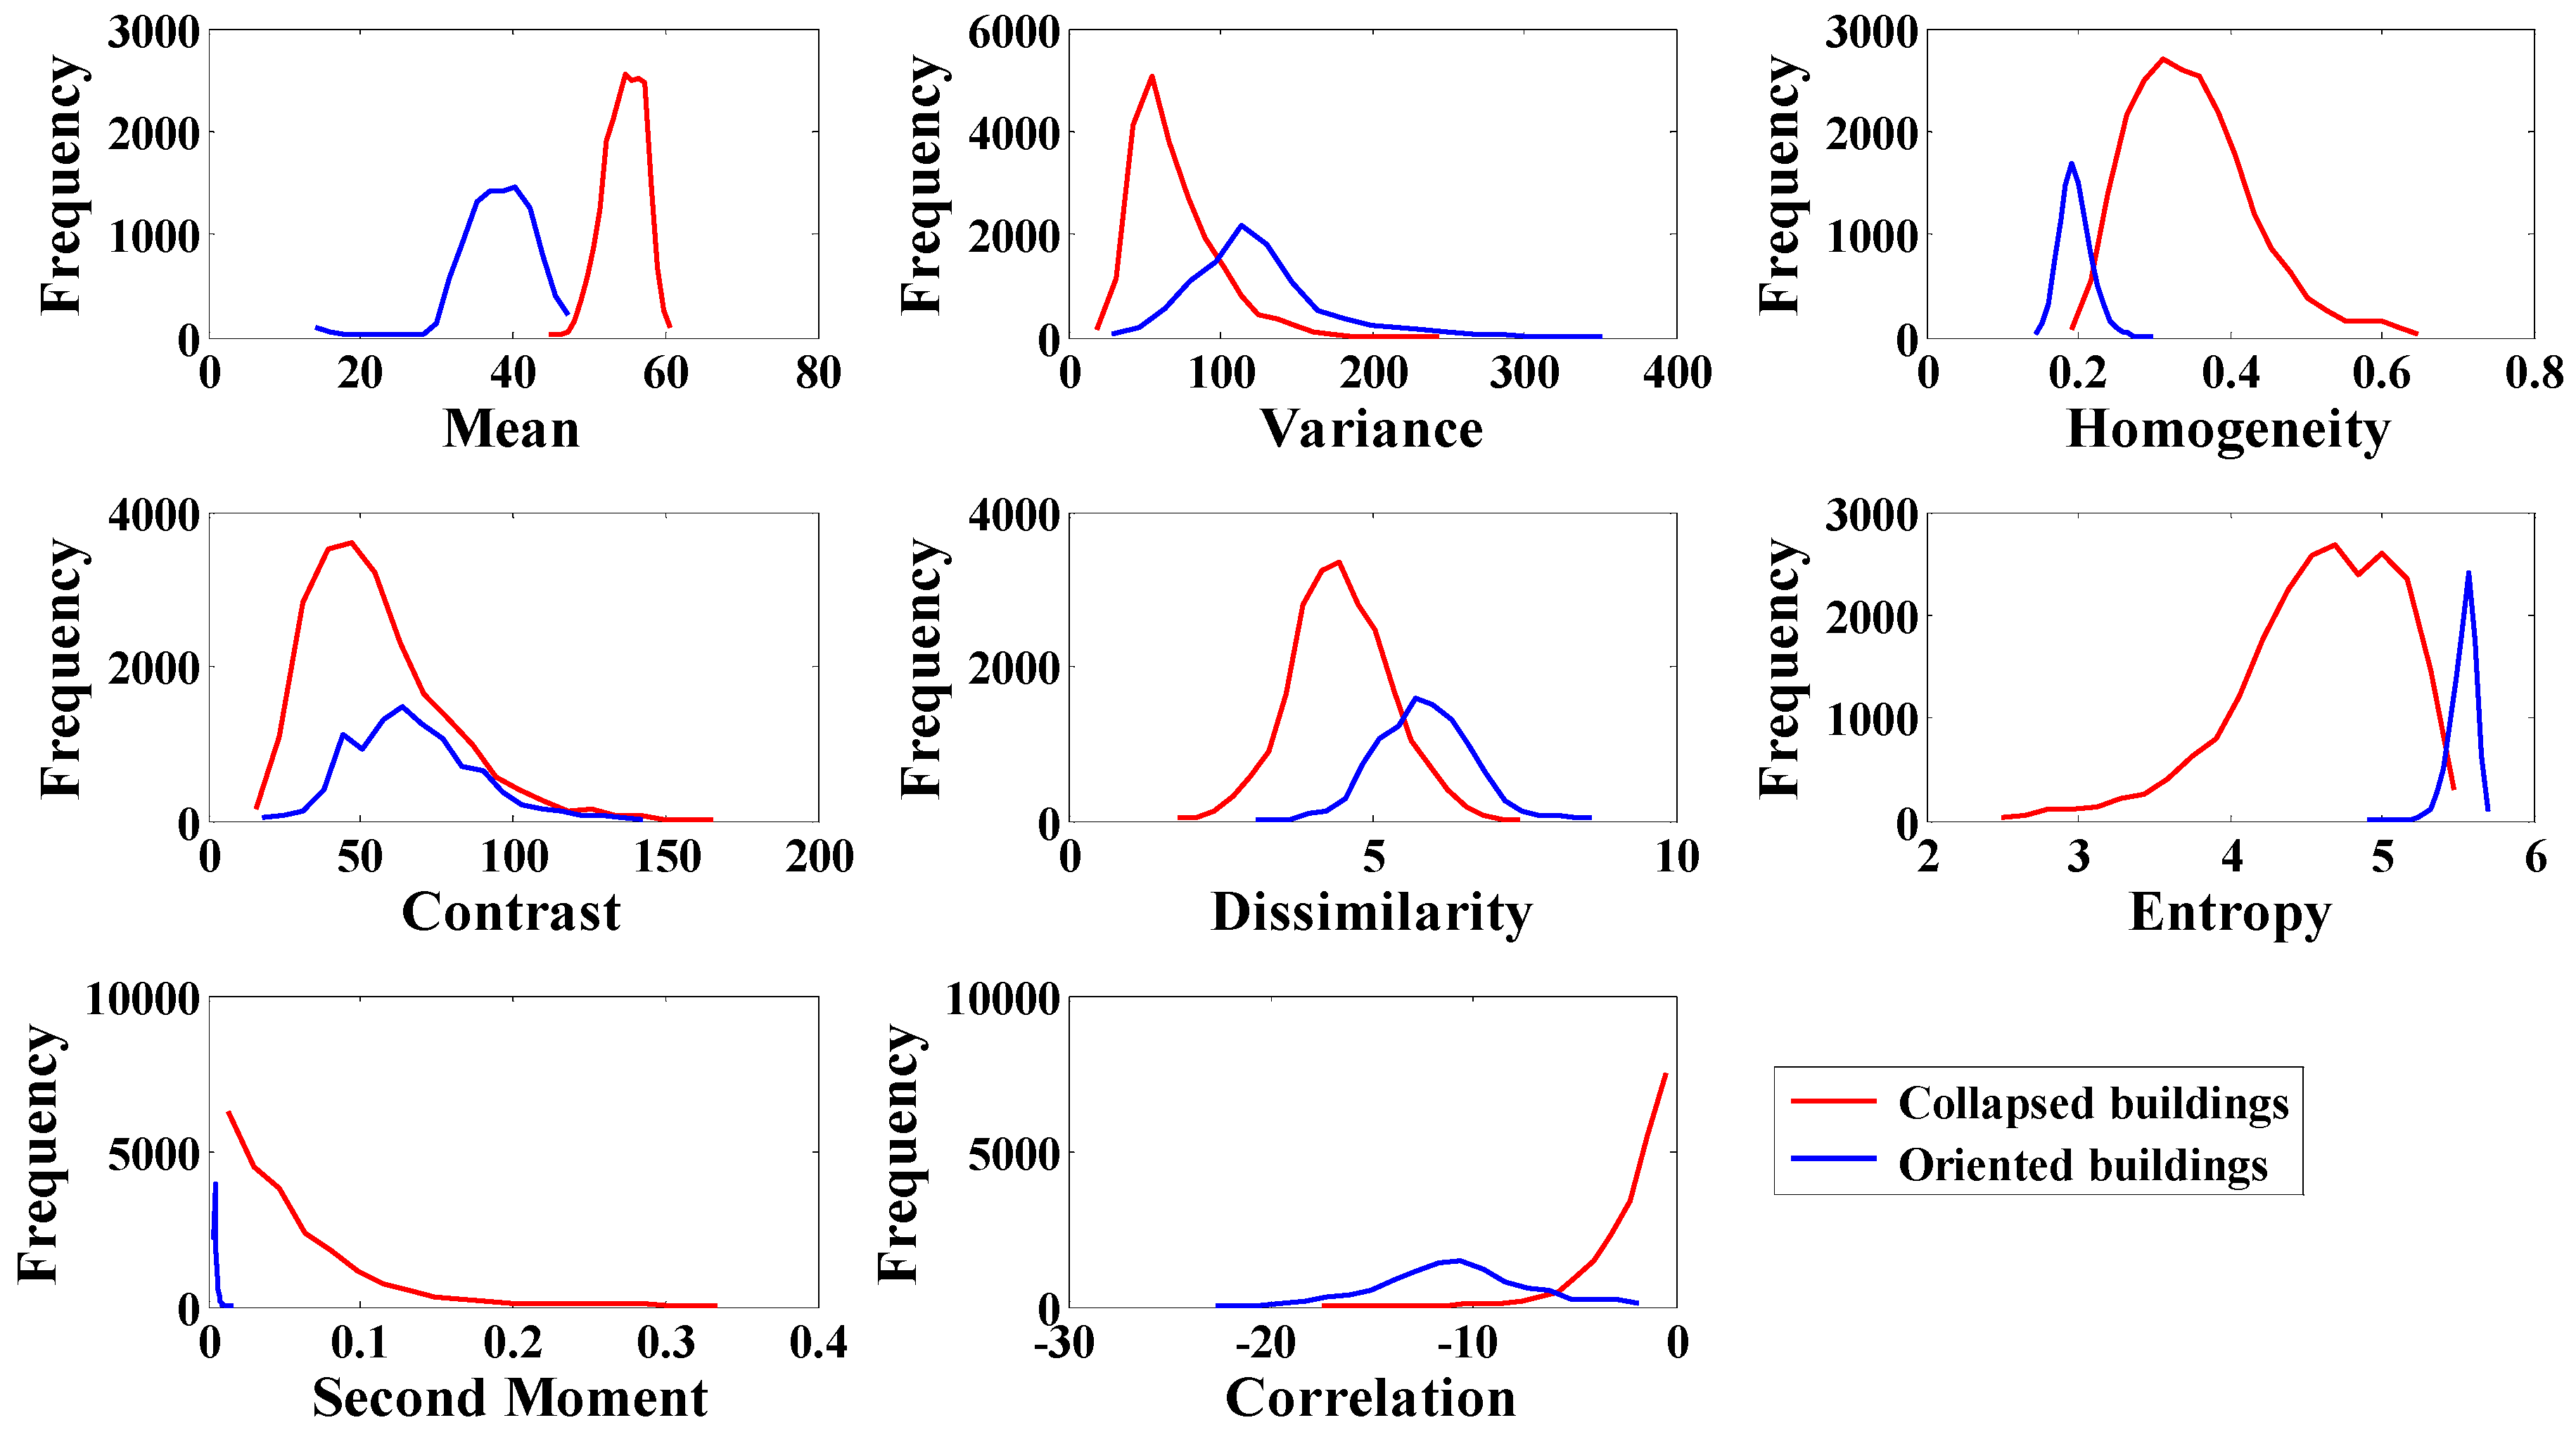
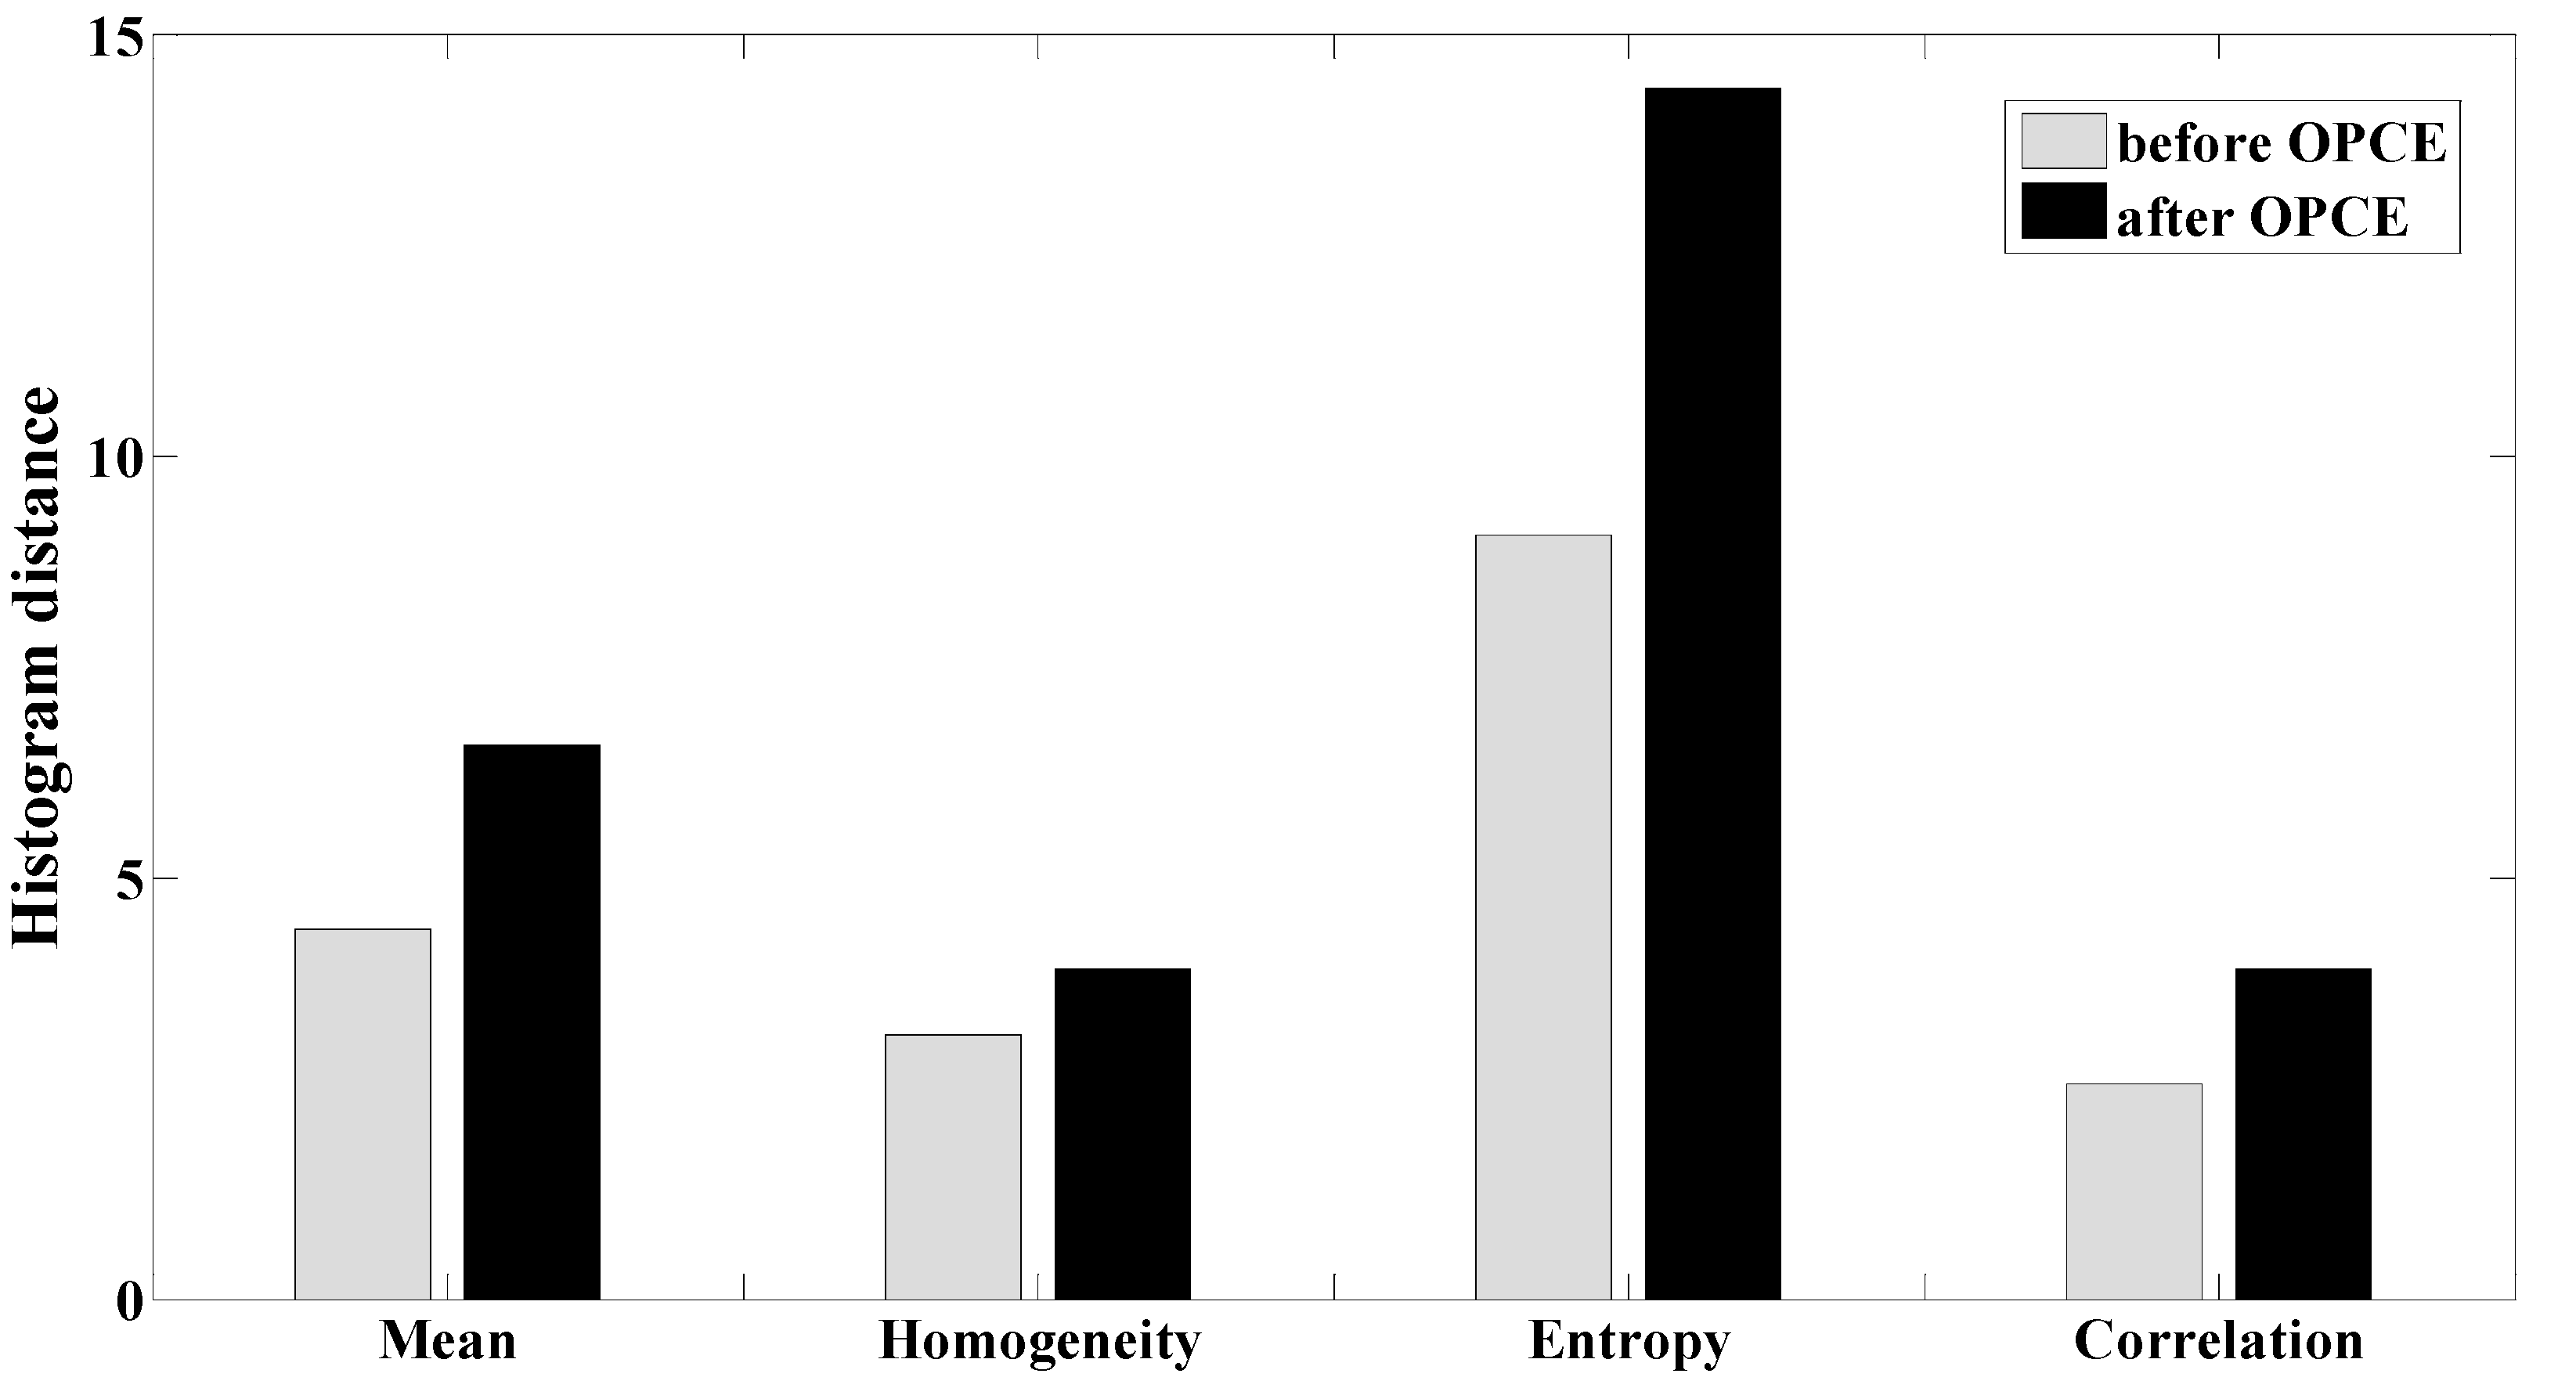
3.2.1. Texture Feature Extraction and Fusion Using OPCE Image

The OPCE power image was acquired after enhancing the undamaged OB with regard to the CB, according to Section 2.2.2. When solving the OPCE problem, the samples of CB and OB were chosen from the ROIs marked in Figure 10 with the red and blue rectangular boxes. The initial power ratio CCB-OB between the CB and the OB was 1.7, and the power ratio CCB-OB was increased to 2.1 after the OPCE operation. The contrast ratio of the CB versus the OB was therefore increased by 0.4 after employing the OPCE algorithm.
The four texture features of mean, homogeneity, entropy, and correlation were then extracted from the OPCE power image, with a window size of 15 × 15, in the direction of 45°.
The histogram distance method mentioned in the previous section was employed to select the window size of the texture extraction. In order to compare the separability between the CB and the OB of the four texture features with different window sizes, a stacked bar chart of the histogram distance for the four textures with different window sizes is shown in Figure 12. The separation performance of the four texture features increases with the height of the bar. It can be seen from Figure 12 that the sum of the histogram distance reaches its maximum value at the window size of 15. Therefore, the window size for calculating the four texture features was set as 15.
As can be seen from Figure 13, the differences between CB and OB in the different directions are the same for the mean, homogeneity, and entropy, but the difference in the directions of 45° and 135° is larger than the difference in the directions of 0° and 90° for correlation. In addition, the alignment direction of the OB marked with the orange lines in Figure 14 is close to 45°. Taking the two factors into consideration, the direction of 45° was selected as the texture calculation direction.
According to the procedure of the PWMF method mentioned in Section 2.2.3, CB and OB were then extracted. In the procedure of PWMF operation, the initial thresholds of the mean, homogeneity, entropy, and correlation were set as 50, 0.23, 5.3, and −5, respectively, to separate the OB from the CB according to the difference in the histograms between OB and CB shown in Figure 5b. The classification method for both the known samples and unknown samples was the k-means clustering algorithm.

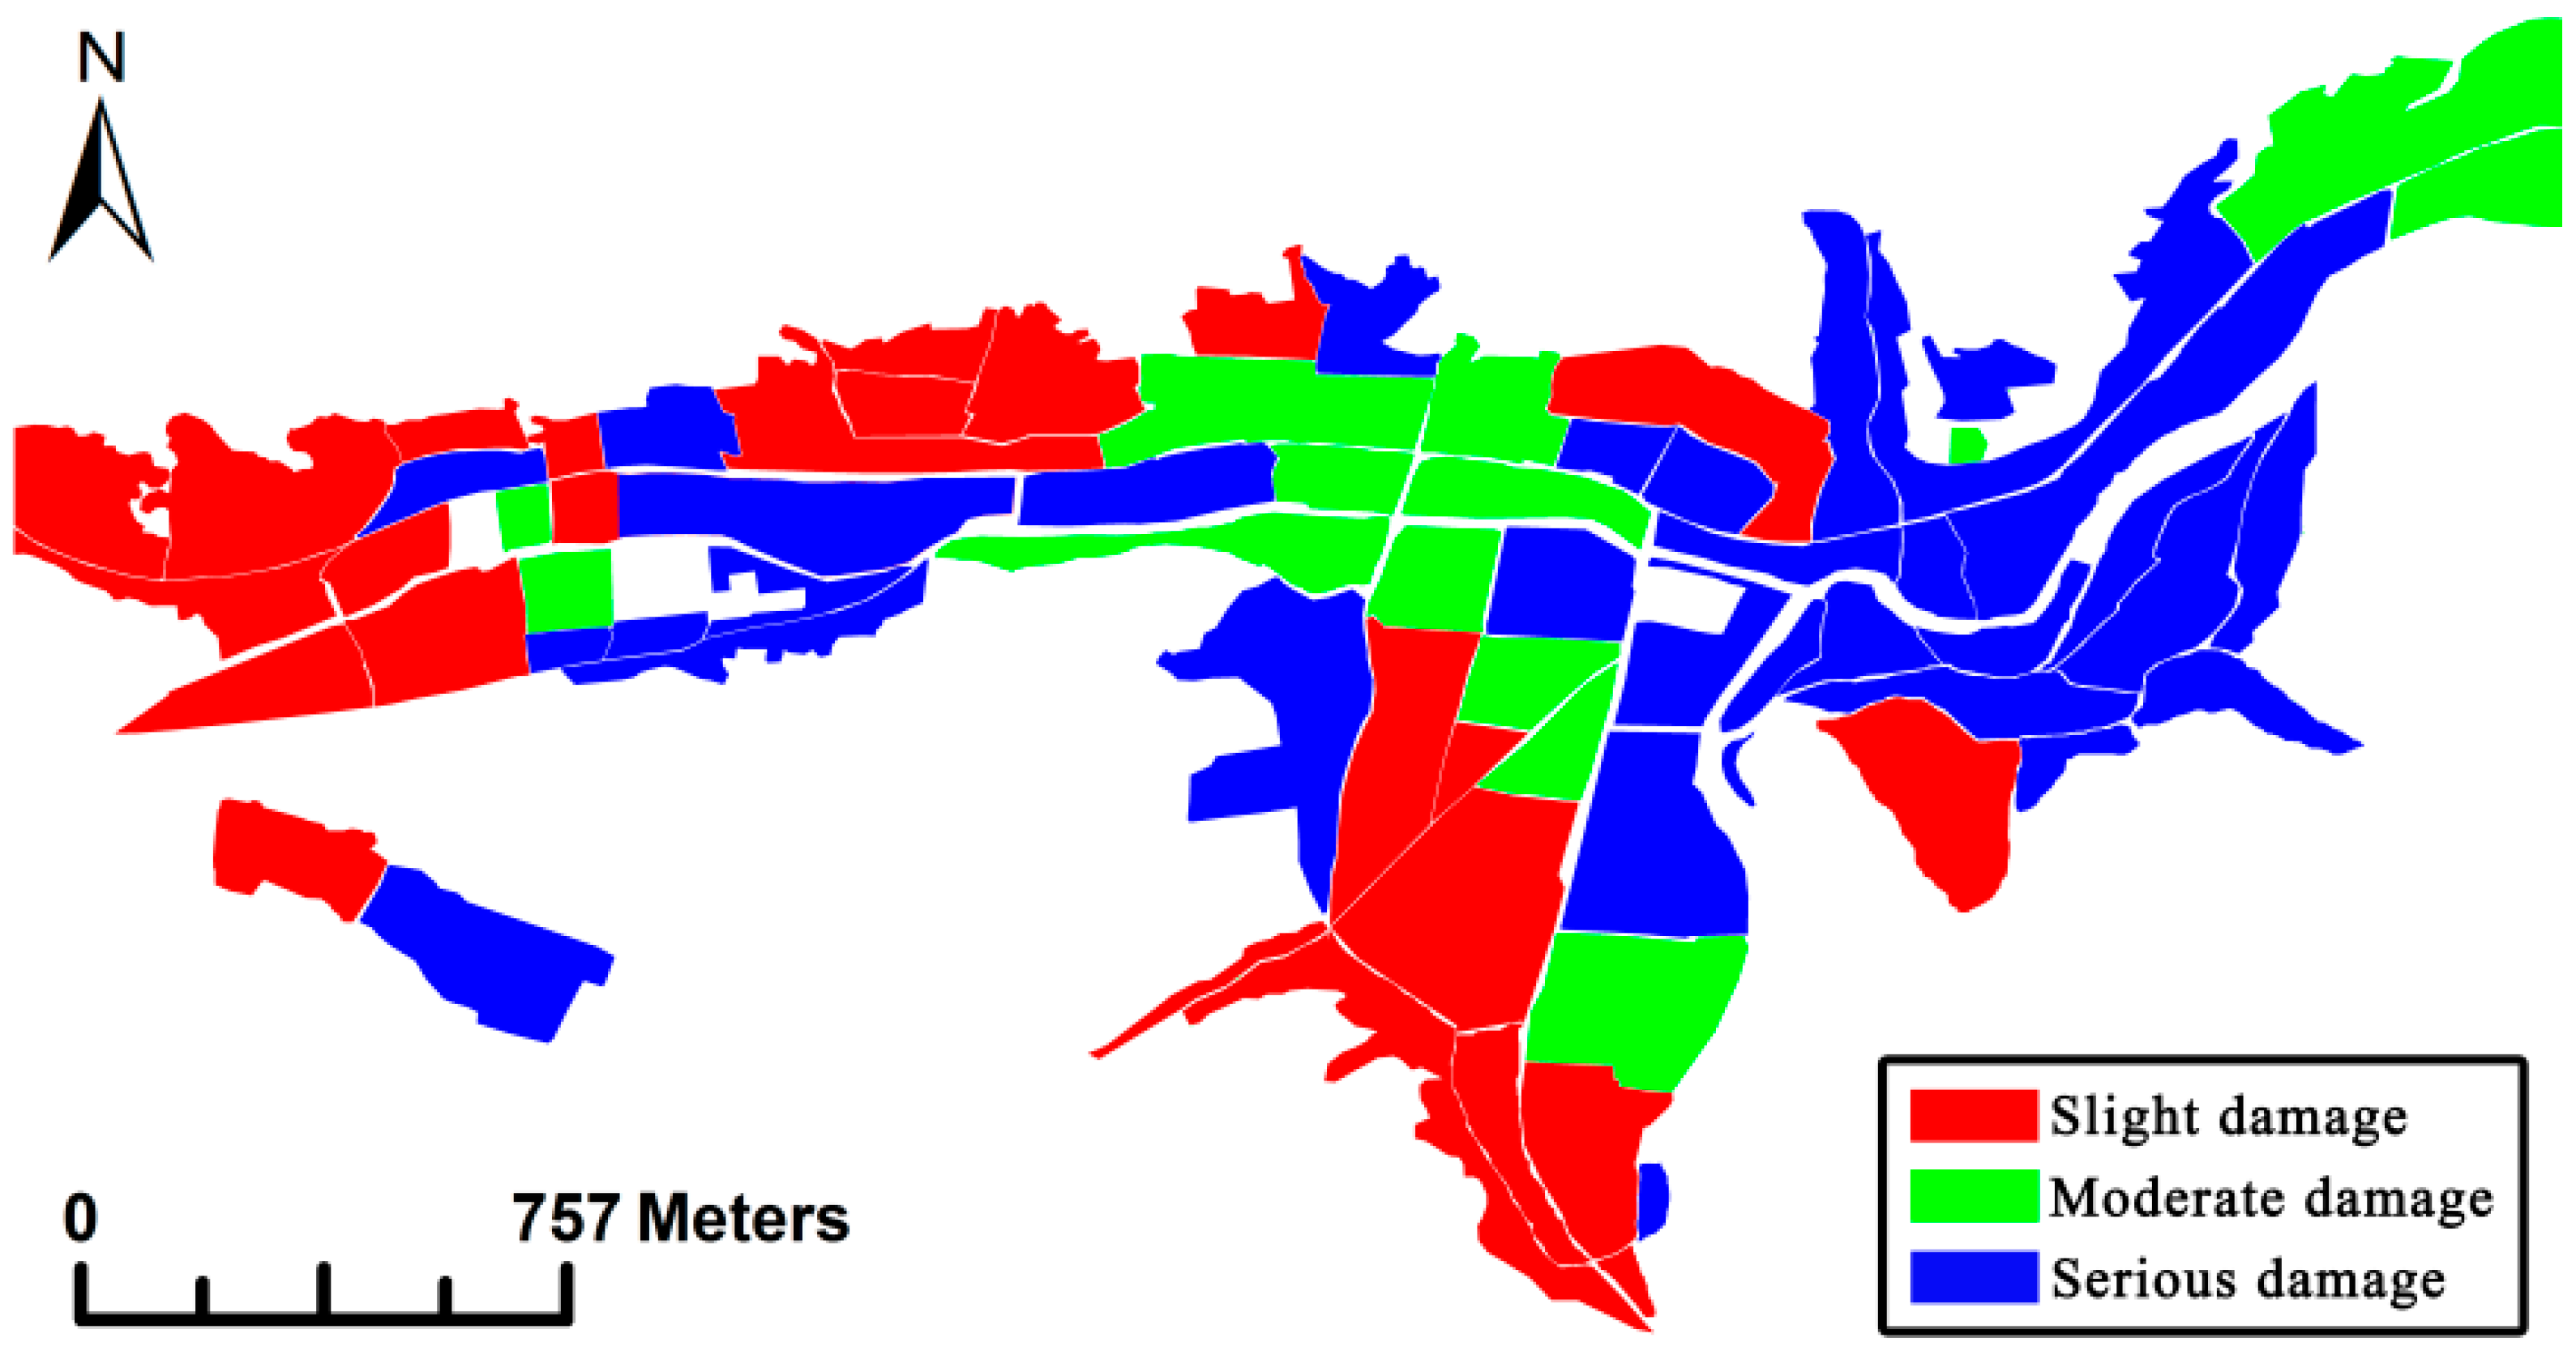
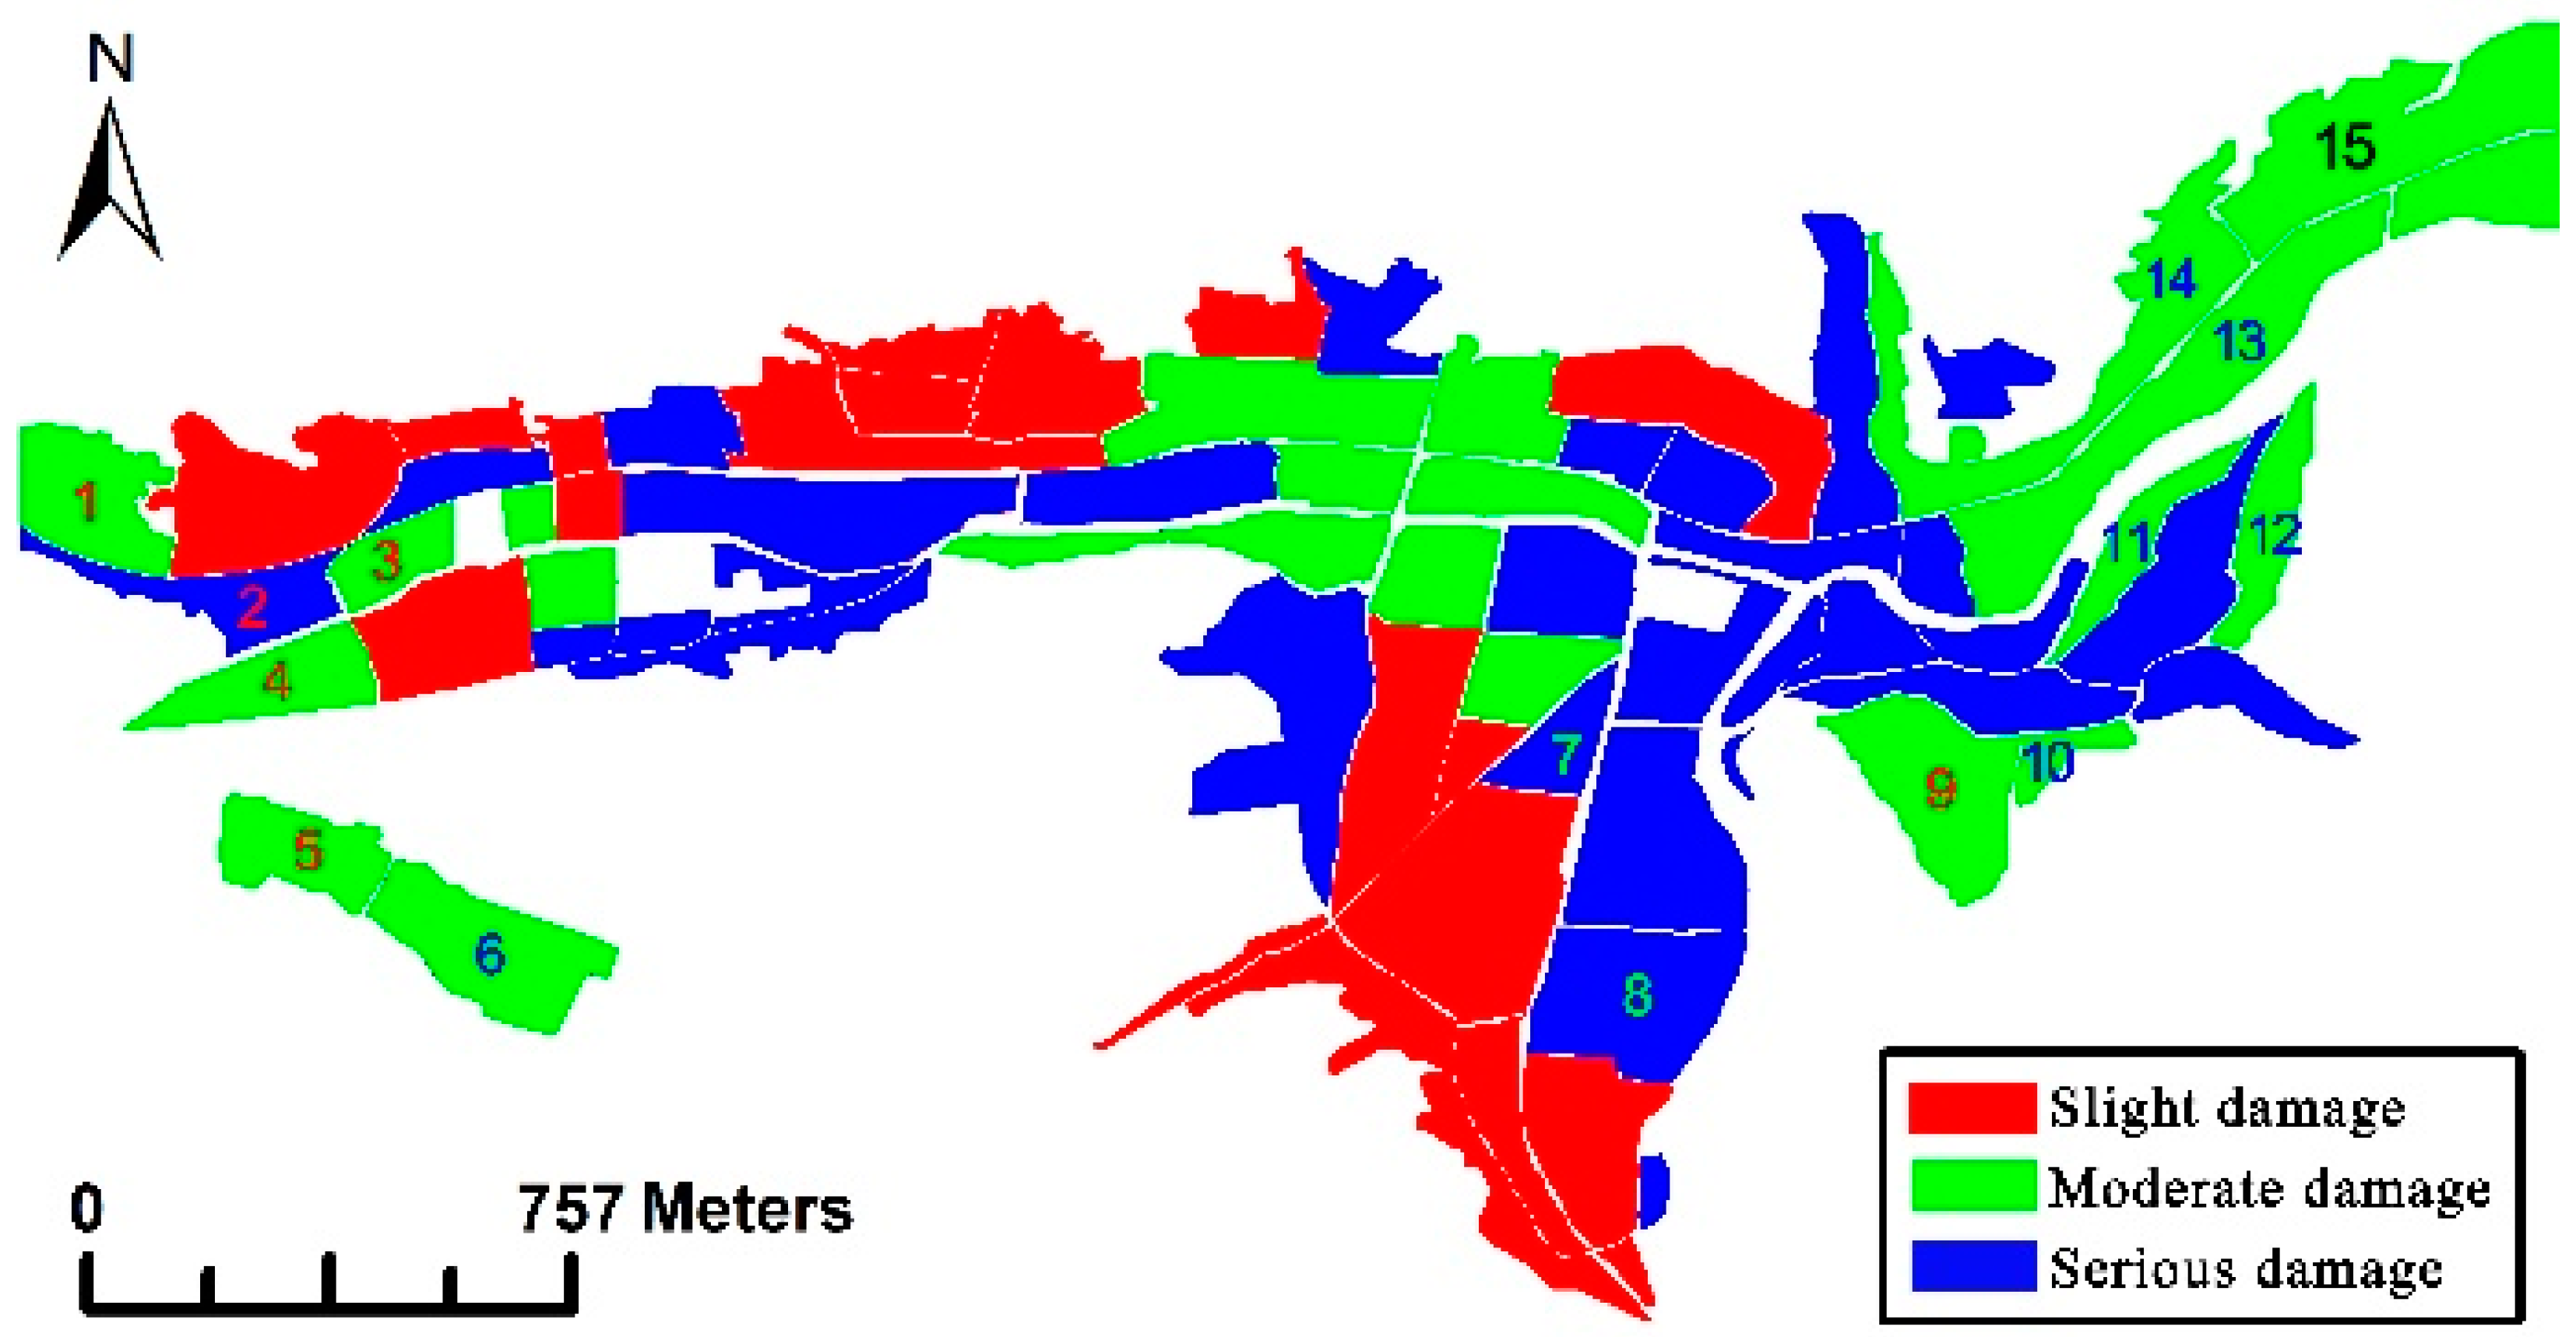
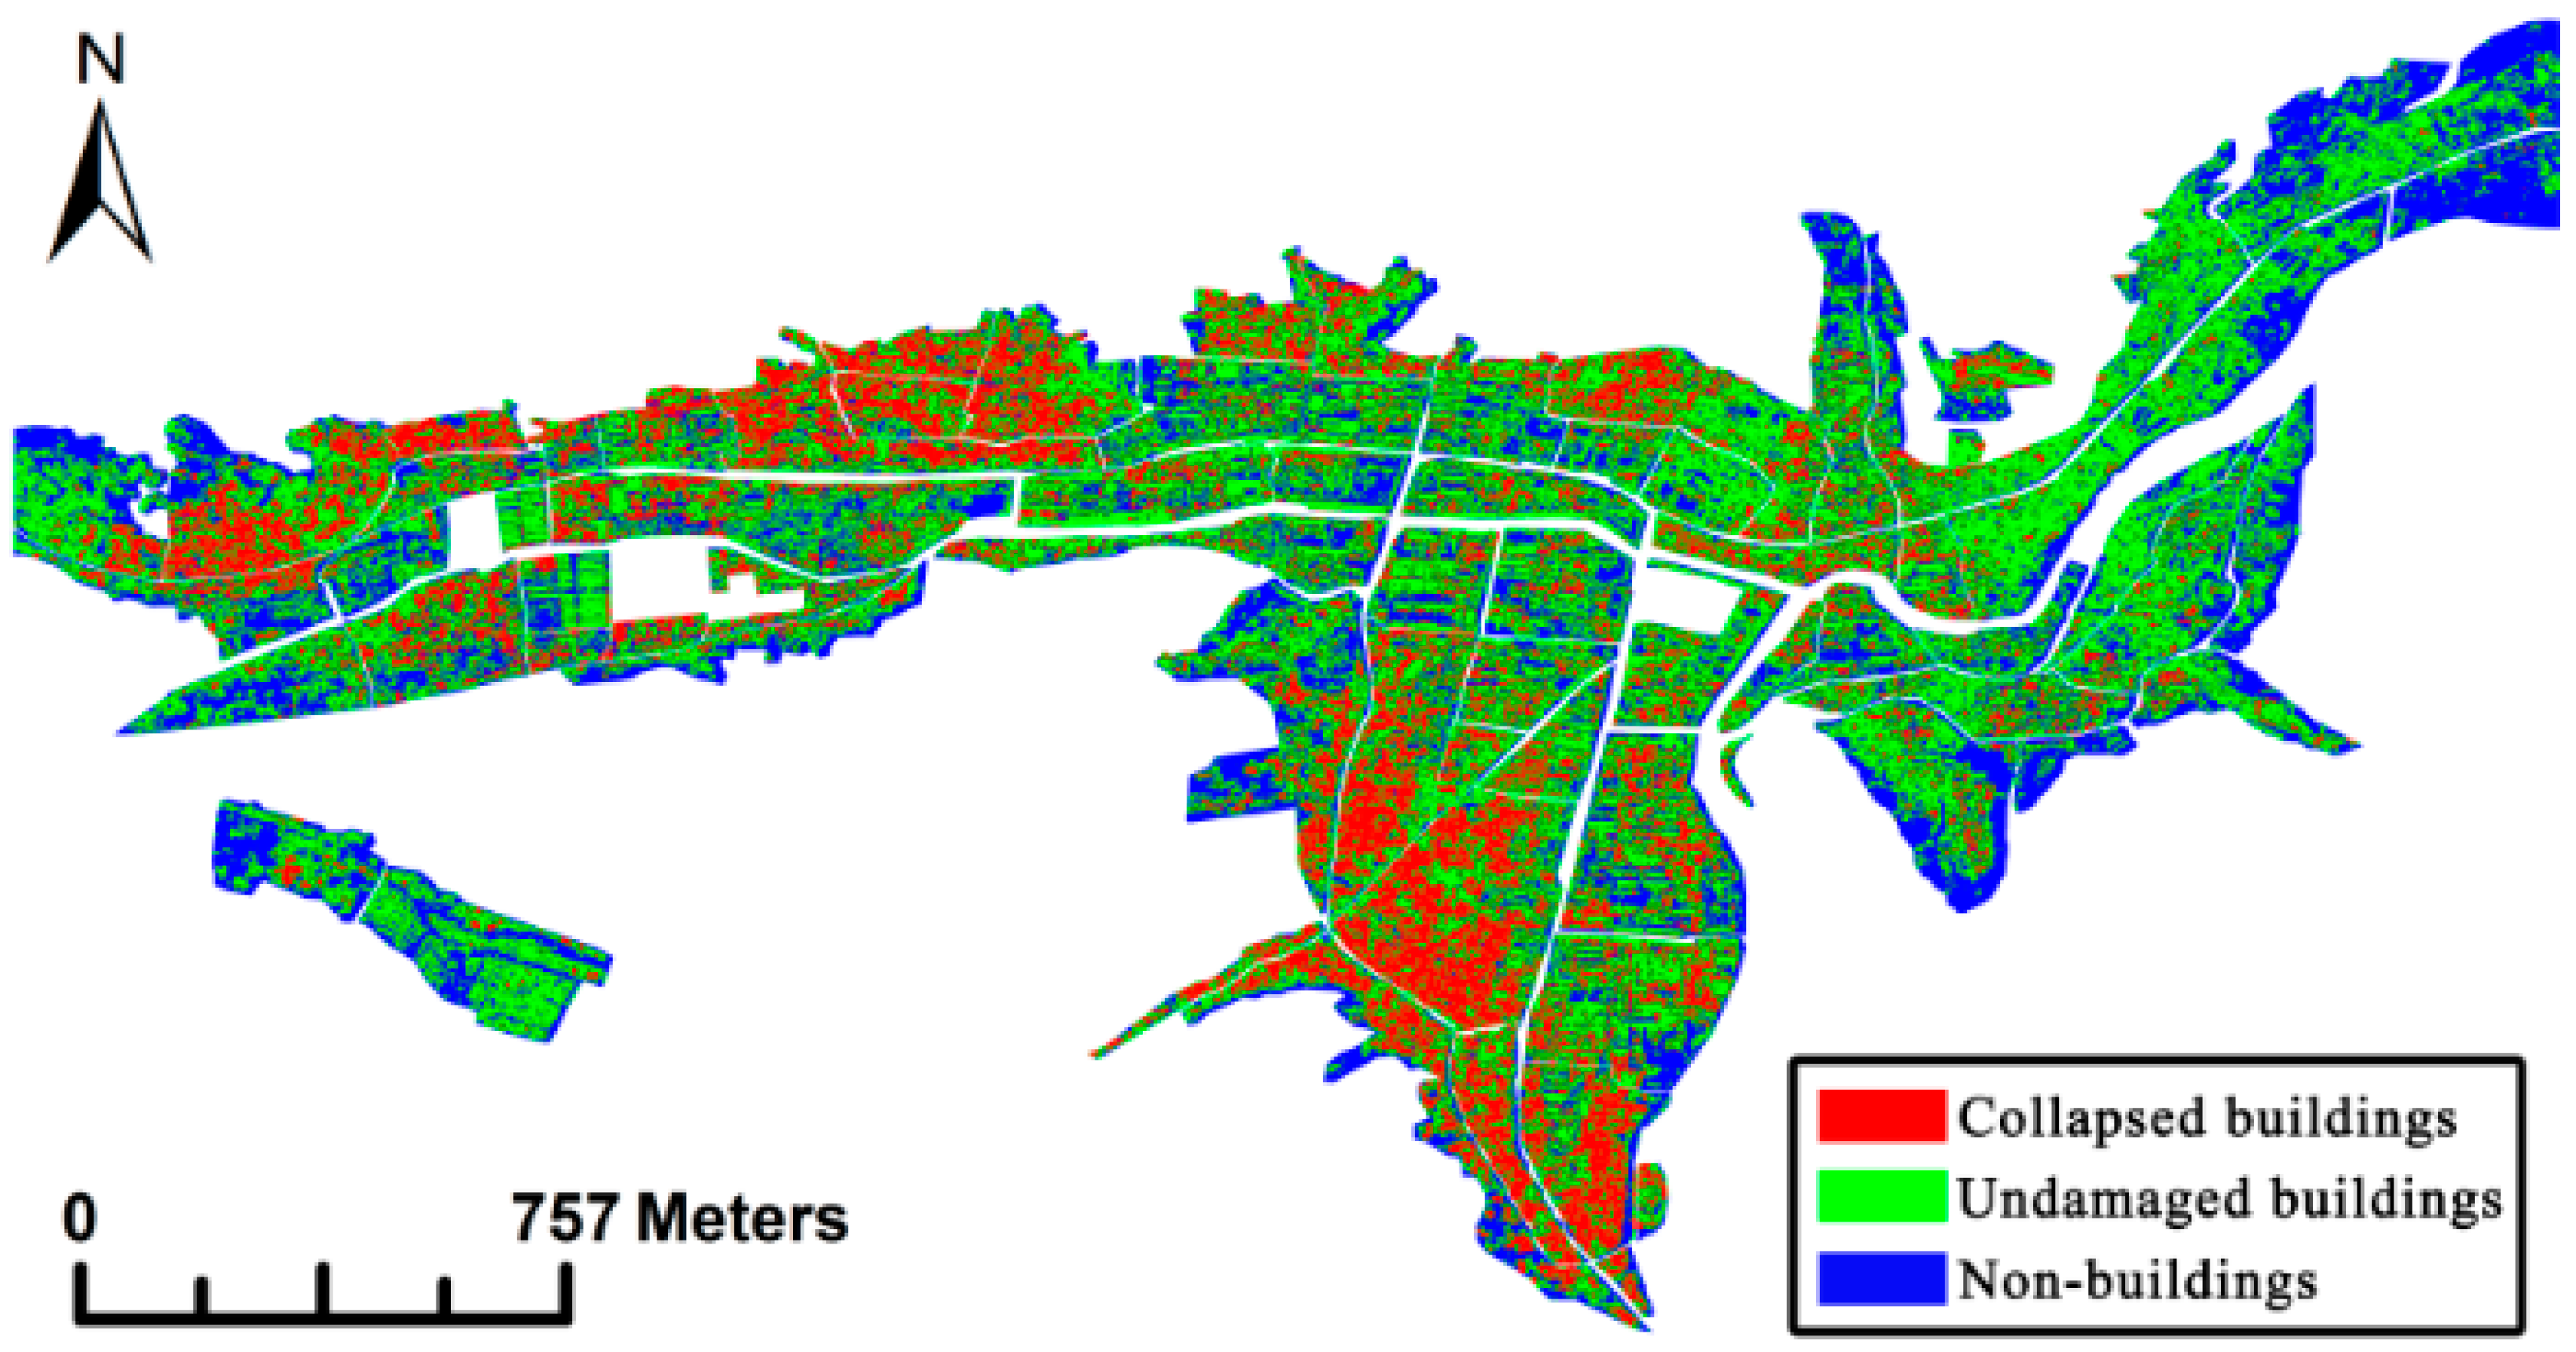
3.2.2. Building Damage Assessment Results

The PB and the OB were then combined as the UDB. With the exception of the UDB and the CB, the remaining ground objects were considered to be NB. The distribution map of the CB, the UDB, and the NB in the urban region of Yushu County is displayed in Figure 15. The blue regions, the green regions, and the red regions in Figure 15 denote NB, UDB, and CB, respectively.
Finally, each block’s BBCR was computed based on the extraction results of the CB and the UDB, and the BDLs of the blocks were determined according to the BBCR values. In keeping with the determination criteria for the BDLs, as shown in Figure 11, the threshold values ɛ1 and ɛ2 in Equation (13) were set as 0.3 and 0.5 according to the China Seismic Intensity Scale [51], respectively. This can be written as the following formula:
{ i f   B B C R i 0.3 , b l o c k i SLD i f   0.3 < B B C R i 0.5 , b l o c k i MOD i f   B B C R i > 0.5 , b l o c k i SED
The building damage grade distribution map, which is the BDA results of the Yushu urban area at the scale of the city block, is displayed in Figure 16, according to the BDLs defined in Equation (14). The accuracy evaluation was performed on the experimental results shown in Figure 16 by comparing these results with the BDA reference map displayed in Figure 11. The results of BDA accuracy are shown in Table 1, where the BDA overall accuracy (OA) is 80.56%. In order to show the advantage of the proposed approach in this paper, the accuracy assessment results of directly using the improved YFCD method without fusing the texture features (abbreviated as IYFD) are also shown in Table 1.

4. Discussion

It can be seen from Table 1 that the OA of the proposed method is increased by 8.34% for the BDA compared to the IYFD method. This indicates that the texture features can effectively increase the assessment accuracy of BDA, because the texture features can be used to effectively separate the undamaged OB from the CB, and the overextraction of CB can be suppressed.
As listed in Table 1, 19 blocks are extracted using the proposed approach, while 33 blocks are extracted by the IYFD method, but there are actually 25 blocks with the SED. The proposed approach underestimates only six blocks with the SED, which is a minority of the blocks with the SED. In the six underestimated blocks, there is one block which is underestimated by one damage level, i.e., as MOD. The blocks with MOD are also regarded as the key areas in the field survey of EDA [53], so as only one block is underestimated as MOD, this does not have a great impact on the EDA. Although the other five blocks underestimated as SLD do affect the EDA task, the correct recognition rate of the blocks with SED is still close to 80%. Moreover, the correct recognition rates of the slightly damaged blocks and moderately damaged blocks are 85.7% and 81.8%, respectively, for the proposed method, but the corresponding rates are 64.3% and 63.6%, respectively, for the IYFD method. For the blocks with SLD and MOD, compared to the IYFD approach, the correct recognition rates of the proposed method are increased by 21.4% and 18.2%, respectively. This indicates that the identification accuracies of the slightly damaged blocks and the moderately damaged blocks are greatly improved by the use of the proposed approach. Therefore, the proposed approach can effectively abate the overestimation of the building collapse rate, and the effectiveness of the presented methodology for BDA is confirmed by the experiment results acquired from real PolSAR data.
As shown in Figure 16 and Table 1, among the 72 blocks, 14 blocks are misclassified. In Figure 16, the blocks labelled with color figures from 1 to 14 are misclassified, and the color of the number stands for the color of the correct BDL. Among the 14 blocks, blocks 1, 3–5, and 9, which should be SED, are misclassified as SLD, and block no. 2, for which the actual damage grade is SED, is misclassified as MOD. Block nos. 6 and 10–14, which should be MOD, are misclassified as SLD. Block nos. 7–8, which should be SLD, are misclassified as MOD. On the whole, the BDL of blocks nos. 1–6 and 9–14 are underestimated, while the BDL of block nos. 7–8 are overestimated. That is, there are 12 underestimated blocks and two overestimated blocks. This shows that the damage levels of most of the blocks misclassified are underestimated. In the 12 underestimated blocks, there are five blocks whose damage levels are underestimated by two levels, where the SED is underestimated as the SLD, and there are seven blocks whose damage levels are underestimated by one level, where the MOD is underestimated as the SLD. For the two overestimated blocks, their actual SLD is misestimated as the MOD.
In short, the main misclassification situation for the 14 blocks misclassified is that the block BDLs are reduced. The main reason is the overextraction of UDB and the misidentification of CB. There are a number of reasons for the overextraction of UDB: (1) the remaining parallel walls of the CB are misclassified as parallel UDB during the process of obtaining the ground objects dominated by DBS using the improved YFCD method; (2) the residual oriented walls (OW) of the CB are misclassified as oriented UDB using the PWMF methodology, and the overestimated OB are mainly the residual OW of CB; (3) the DBS power of the OW of some CB is enlarged, and these CB are mistakenly recognized as PB when the improved YFCD is carried out; and (4) the threshold selection is not precise enough, or there may exist overiteration during the procedure of performing the PWMF methodology. These are the reasons for the overestimation of UDB, and they are also the main reasons for the underestimation of the BDLs.
In general, using the proposed approach, the four texture features are extracted and fused to recognize CB and OB, and the building damage information of the earthquake-hit area is obtained. Although overextraction of OB takes place when using the proposed method, the overestimation of the UDB results in the underestimation of the BDLs. Furthermore, although the recognition accuracy of the city blocks with the SED is reduced, the recognition accuracies of the city blocks with the SLD and the MOD are generally improved, and the recognition OA is improved. The texture information is effectively applied in the proposed approach. Therefore, the method proposed in this work is better suited to PolSAR images with abundant and conspicuous texture features.

5. Conclusions

Only using a SPEPI for BDA has the advantage of accurately and rapidly acquiring earthquake damage information. The leading SM of both the undamaged OB and the CB is VS, and the characteristics of the OB are very similar with the CB in PolSAR data. Although the improved YFCD is executed on the PolSAR imagery to enhance the DBS power of the OB, the dominant SM of OB is still VS. Fortunately, through experimental analysis, we found that there are differences for the texture features between the undamaged OB and the CB. Therefore, in this work, the PWMF method is proposed to fuse the four texture features of mean, homogeneity, entropy, and correlation, for BDA accuracy improvement. Before this, the OPCE algorithm is employed to improve the contrast ratio of undamaged OB and CB, and the differences of the texture features are also increased. The OPCE power image is used to extract the four texture features of mean, homogeneity, entropy, and correlation, which can improve the discrimination performance for the undamaged OB and the CB. The approach proposed in this paper was validated in an experiment using SPEPI of Yushu County. The experiment results revealed that the approach proposed in this paper can obtain a higher BDA accuracy, i.e., 80.56%. Compared to the IYFD approach, the accuracy is improved by 8.34% with the proposed method. Therefore, the PWMF method assisted by the OPCE algorithm can be applied for BDA, and the BDA accuracy can be significantly improved.
Using the proposed methodology of this paper reduces the mixing of the undamaged OB and the CB, and improves the BDA accuracy. At the same time, effective multifeature fusion is realized using the proposed method, and the different features have different effects on the final classification results, according to their classification performance in the process of multifeature fusion using the PWMF method. That is to say, the proposed methodology can make the best use of each feature, and the features with a better classification performance play a greater role in the final classification results. The proposed method is also flexible. If the proposed method is implemented on other dataset, only the classification threshold values in the process of PWMF operation need to be adjusted. Except for the classification threshold values, the proposed method and the process of building damage information extraction do not need to be changed. However, a drawback of the proposed method is that the OB are overextracted. While the false alarm rate of the CB is reduced, the missed alarm rate of the CB is increased. Therefore, how to control the overextraction of OB will need further consideration in our future work. The focus of our future research work will be to control the overextraction of OB, ensuring that the collapsed building extraction accuracy is as high as possible, while the mixing of CB and undamaged OB is reduced. In this future research work, the residual OW of the DB will be a research priority. In addition, we will refer to the strategy of adaptive weighting proposed in the reference [54] to redefine the weighted accuracy coefficients in the PWMF method and improve the stability of the multifeature fusion.

Author Contributions

W.Z. drafted the manuscript and was responsible for the research design, the writing of the source code, the data analysis, and interpretation of the results. C.H. designed the structures of the paper. W.P. edited and reviewed the manuscript.

Funding

This research was funded by the Strategic Priority Research Program of the Chinese Academy of Sciences (XDA19040504); the Science for Earthquake Resilience of China Earthquake Administration (grant number XH18049); the National Natural Science Foundation of China (grant number 41601479); the Earthquake Science and Technology Development Fund Program of Lanzhou Earthquake Research Institute, China Earthquake Administration (grant number 2015M02); the Object-oriented High Trusted SAR Processing System of the National 863 Subject Program; and the Airborne Multiband Polarimetric Interferometric SAR Mapping System of the National Major Surveying and Mapping Science and Technology Special Program.

Acknowledgments

The authors would like to thank the Chinese Academy of Surveying and Mapping for providing the experimental data. We would also like to thank the anonymous reviewers for their advice on improving the quality of this paper.

Conflicts of Interest

The authors declare no conflict of interest.

References

  1. Peduto, D.; Ferlisi, S.; Nicodemo, G.; Reale, D.; Pisciotta, G.; Gullà, G. Empirical fragility and vulnerability curves for buildings exposed to slow-moving landslides at medium and large scales. Landslides 2017, 14, 1993–2007. [Google Scholar] [CrossRef]
  2. Dell’Acqua, F.; Polli, D.A. Post-event only VHR radar satellite data for automated damage assessment. Photogramm. Eng. Remote Sens. 2011, 77, 1037–1043. [Google Scholar] [CrossRef]
  3. Zhang, J.Q. Design of Earthquake Loss Value Evaluation Model Based on Big Data. China Earthq. Eng. J. 2018, 40, 356–362. [Google Scholar] [CrossRef]
  4. Huang, F.Q.; Li, M.; Ma, Y.C.; Han, Y.Y.; Tian, L.; Yan, W.; Li, X.F. Studies on earthquake precursors in China: A review for recent 50 years. Geod. Geodyn. 2017, 8, 1–12. [Google Scholar] [CrossRef]
  5. Ferrentino, E.; Marino, A.; Nunziata, F.; Migliaccio, M. A dual–polarimetric approach to earthquake damage assessment. Int. J. Remote Sens. 2019, 40, 197–217. [Google Scholar] [CrossRef]
  6. Zhai, W.; Shen, H.F.; Huang, C.L.; Pei, W.S. Building earthquake damage information extraction from a single post–earthquake PolSAR image. Remote Sens. 2016, 8, 171. [Google Scholar] [CrossRef]
  7. Xia, R.F.; Cheng, G.Q. Application of the LM-BP Neural Network in the Economic Loss Assessment Model for Post-earthquake Buildings. China Earthq. Eng. J. 2019, 41, 208–214. [Google Scholar] [CrossRef]
  8. Balz, T.; Liao, M.S. Building-damage detection using post-seismic high-resolution SAR satellite data. Int. J. Remote Sens. 2010, 31, 3369–3391. [Google Scholar] [CrossRef]
  9. Karimzadeh, S.; Mastuoka, M. Building Damage Assessment Using Multisensor Dual-Polarized Synthetic Aperture Radar Data for the 2016 M 6.2 Amatrice Earthquake, Italy. Remote Sens. 2017, 9, 330. [Google Scholar] [CrossRef]
  10. Ferrentino, E.; Nunziata, F.; Migliaccio, M.; Vicari, A. A sensitivity analysis of dual-polarization features to damage due to the 2016 Central-Italy earthquake. Int. J. Remote Sens. 2018, 6846–6863. [Google Scholar] [CrossRef]
  11. Miura, H.; Midorikawa, S.; Matsuoka, M. Building damage assessment using high–resolution satellite SAR images of the 2010 Haiti earthquake. Earthq. Spectra 2016, 32, 591–610. [Google Scholar] [CrossRef]
  12. Shen, H.; Li, X.; Cheng, Q.; Zeng, C.; Yang, G.; Li, H.F.; Zhang, L.P. Missing information reconstruction of remote sensing data: A technical review. IEEE Geosci. Remote Sens. Mag. 2015, 3, 61–85. [Google Scholar] [CrossRef]
  13. Wang, C.; Zhang, H.; Wu, F.; Zhang, B.; Tang, Y.X.; Wu, H.G.; Wen, X.Y.; Yan, D.M. Disaster phenomena of Wenchuan earthquake in high resolution airborne synthetic aperture radar images. J. Appl. Remote Sens. 2009, 3, 1–16. [Google Scholar] [CrossRef]
  14. Peduto, D.; Nicodemo, G.; Maccabiani, J.; Ferlisi, S. Multi-scale analysis of settlement-induced building damage using damage surveys and DInSAR data: A case study in The Netherlands. Eng. Geol. 2017, 218, 117–133. [Google Scholar] [CrossRef]
  15. Zhai, W.; Shen, H.F.; Huang, C.L.; Pei, W.S. Fusion of polarimetric and texture information for urban building extraction from fully polarimetric SAR imagery. Remote Sens. Lett. 2015, 7, 31–40. [Google Scholar] [CrossRef]
  16. Yamaguchi, Y. Disaster monitoring by fully polarimetric SAR data acquired with ALOS–PALSAR. Proc. IEEE 2012, 100, 2851–2860. [Google Scholar] [CrossRef]
  17. Chen, S.W.; Wang, X.S.; Sato, M. Urban Damage Level Mapping Based on Scattering Mechanism Investigation Using Fully Polarimetric SAR Data for the 3.11 East Japan Earthquake. IEEE Trans. Geosci. Remote Sens. 2016, 54, 6919–6929. [Google Scholar] [CrossRef]
  18. Chen, S.W.; Sato, M. Tsunami damage investigation of built–up areas using multitemporal spaceborne full polarimetric SAR images. IEEE Trans. Geosci. Remote Sens. 2013, 51, 1985–1997. [Google Scholar] [CrossRef]
  19. Park, S.E.; Yamaguchi, Y.; Kim, D. Polarimetric SAR remote sensing of the 2011 Tohoku earthquake using ALOS/PALSAR. Remote Sens. Environ. 2013, 132, 212–220. [Google Scholar] [CrossRef]
  20. Watanabe, M.; Motohka, T.; Miyagi, Y.; Yonezawa, C.; Shimada, M. Analysis of urban areas affected by the 2011 off the Pacific Coast of Tohoku earthquake and tsunami with L–band SAR full–polarimetric mode. IEEE Geosci. Remote Sens. Lett. 2012, 9, 472–476. [Google Scholar] [CrossRef]
  21. Sato, M.; Chen, S.W.; Satake, M. Polarimetric SAR analysis of tsunami damage following the March 11, 2011 East Japan earthquake. Proc. IEEE 2012, 100, 2861–2875. [Google Scholar] [CrossRef]
  22. Singh, G.; Yamaguchi, Y.; Boerner, W.M.; Park, S.E. Monitoring of the March 11, 2011, off–Tohoku 9.0 Earthquake with super–Tsunami disaster by implementing fully polarimetric high–resolution POLSAR techniques. Proc. IEEE 2013, 101, 831–846. [Google Scholar] [CrossRef]
  23. Watanabe, M.; Thapa, R.B.; Ohsumi, T.; Fujiwara, H.; Yonezawa, C.; Tomii, N.; Suzuki, S. Detection of damaged urban areas using interferometric SAR coherence change with PALSAR-2. Earth Planets Space 2016, 68, 131. [Google Scholar] [CrossRef]
  24. Zhang, H.Z.; Wang, Q.; Zeng, Q.M.; Jiao, J. A new method for building collapse detection jointly using interferometric and polarimetric information. In Proceedings of the IEEE International Geoscience and Remote Sensing Symposium (IGARSS), Milan, Italy, 26–31 July 2015. [Google Scholar] [CrossRef]
  25. Li, X.W.; Guo, H.D.; Zhang, L.; Chen, X.; Liang, L. A new approach to collapsed building extraction using RADARSAT-2 polarimetric SAR imagery. IEEE Geosci. Remote Sens. Lett. 2012, 9, 677–681. [Google Scholar] [CrossRef]
  26. Guo, H.D.; Li, X.W.; Zhang, L. Study of detecting method with advanced airborne and spaceborne synthetic aperture radar data for collapsed urban buildings from the Wenchuan earthquake. J. Appl. Remote Sens. 2009, 3, 031695. [Google Scholar] [CrossRef]
  27. Guo, H.D.; Wang, X.Y.; Li, X.W.; Liu, G.; Zhang, L.; Yan, S.Y. Yushu earthquake synergic analysis using multimodal SAR datasets. Chin. Sci. Bull. 2010, 55, 3499–3503. [Google Scholar] [CrossRef]
  28. Masaka, M.; Yamaguchi, Y.; Yamada, H. Experimental study on detecting deformed man–made objects based on eigenvalue/eigenvector analysis. In Proceedings of the IEEE 5th Asia-Pacific Conference on Synthetic Aperture Radar (APSAR), Singapore, 1–4 September 2015. [Google Scholar] [CrossRef]
  29. Chen, Q.H.; Li, L.L.; Jiang, P.; Liu, X.G. Building collapse extraction using modified freeman decomposition from post–disaster polarimetric SAR image. In Proceedings of the IEEE International Geoscience and Remote Sensing Symposium (IGARSS), Beijing, China, 10–15 July 2016. [Google Scholar] [CrossRef]
  30. Zhai, W.; Shen, H.F.; Huang, C.L. Collapsed Buildings Extraction from the PolSAR Image based on the Analysis of Texture Features. Remote Sens. Technol. Appl. 2016, 31, 975–982. [Google Scholar] [CrossRef]
  31. Li, L.L.; Liu, X.G.; Chen, Q.H.; Yang, S. Building damage assessment from PolSAR data using texture parameters of statistical model. Comput. Geosci. 2018, 113, 115–126. [Google Scholar] [CrossRef]
  32. Shen, J.C.; Xu, X.; Dong, H.; Gui, R.; Song, C. Collapsed Building Extraction from Single Full Polarimetric SAR Image after Earthquake. Sci. Technol. Eng. 2015, 15, 86–91. [Google Scholar]
  33. Zhai, W.; Huang, C.L. Fast building damage mapping using a single post–earthquake PolSAR image: A case study of the 2010 Yushu earthquake. Earth Planets Space 2016, 68, 86. [Google Scholar] [CrossRef]
  34. Zhang, H.Z.; Wang, Q.; Zeng, Q.M.; Jiao, J. A novel approach to building collapse detection from post–seismic polarimetric SAR imagery by using optimization of polarimetric contrast enhancement. In Proceedings of the IEEE International Geoscience and Remote Sensing Symposium (IGARSS), Milan, Italy, 26–31 July 2015. [Google Scholar] [CrossRef]
  35. Zhang, H.Z.; Zeng, Q.M.; Jiao, J.; Gao, S. A new framework of building collapse extraction based on azimuth time–frequency analysis. In Proceedings of the IEEE International Geoscience and Remote Sensing Symposium (IGARSS), Beijing, China, 10–15 July 2016. [Google Scholar] [CrossRef]
  36. Shi, L.; Sun, W.D.; Yang, J.; Li, P.X.; Lu, L.J. Building collapse assessment by the use of postearthquake Chinese VHR airborne SAR. IEEE Geosci. Remote Sens. Lett. 2015, 12, 2021–2025. [Google Scholar] [CrossRef]
  37. Sun, W.D.; Shi, L.; Yang, J.; Li, P.X. Building collapse assessment in urban areas using texture information from postevent SAR data. IEEE J. Sel. Top. Appl. Earth Obs. Remote Sens. 2016, 9, 3792–3808. [Google Scholar] [CrossRef]
  38. Freeman, A.; Durden, S.L. A three-component scattering model for polarimetric SAR. IEEE Trans. Geosci. Remote Sens. 1998, 36, 963–973. [Google Scholar] [CrossRef]
  39. Yamaguchi, Y.; Moriyama, T.; Ishido, M.; Yamada, H. Four-component scattering model for polarimetric SAR image decomposition. IEEE Trans. Geosci. Remote Sens. 2005, 43, 1699–1706. [Google Scholar] [CrossRef]
  40. Yamaguchi, Y.; Yajima, Y.; Yamada, H. A four-component decomposition of POLSAR images based on the coherency matrix. IEEE Geosci. Remote Sens. Lett. 2006, 3, 292–296. [Google Scholar] [CrossRef]
  41. Yamaguchi, Y.; Sato, A.; Boerner, W.M.; Sato, R.; Yamada, H. Four-component scattering power decomposition with rotation of coherency matrix. IEEE Trans. Geosci. Remote Sens. 2011, 49, 2251–2258. [Google Scholar] [CrossRef]
  42. Moya, L.; Zakeri, H.; Yamazaki, F.; Liu, W.; Mas, E.; Koshimura, S. 3D gray level co-occurrence matrix and its application to identifying collapsed buildings. ISPRS J. Photogramm. Remote Sens. 2019, 149, 14–28. [Google Scholar] [CrossRef]
  43. Haralick, R.M.; Shanmugam, K.; Dinstein, I.H. Textural features for image classification. IEEE Trans. Syst., Man Cybern. 1973, 610–621. [Google Scholar] [CrossRef]
  44. Yang, J.; Peng, Y.N. Recent development of the optimization of polarimetric contrast enhancement. Remote Sens. Technol. Appl. 2005, 20, 38–41. [Google Scholar]
  45. Yang, J.; Dong, G.W.; Peng, Y.N.; Yamaguchi, Y.; Yamada, H. Generalized optimization of polarimetric contrast enhancement. IEEE Geosci. Remote. Sens. Lett. 2004, 1, 171–174. [Google Scholar] [CrossRef]
  46. Yang, J.; Yamaguchi, Y.; Boerner, W.M.; Lin, S.M. Numerical methods for solving the optimal problem of contrast enhancement. IEEE Trans. Geosci. Remote Sens. 2000, 38, 965–971. [Google Scholar] [CrossRef]
  47. Yang, J. On Theoretical Problems in Radar Polarimetry. Ph.D. Thesis, Department of Information Engineering, Niigata University, Niigata, Japan, 1999. [Google Scholar]
  48. Dou, J.J.; Wen, J.; Liu, C.Q. Histogram-based color image retrieval. Infrared Laser Eng. 2005, 34, 84–88. [Google Scholar]
  49. Guo, H.D.; Zhang, B.; Lei, L.P.; Zhang, L.; Chen, Y. Spatial distribution and inducement of collapsed buildings in Yushu earthquake based on remote sensing analysis. Sci. China Earth Sci. 2010, 53, 794–796. [Google Scholar] [CrossRef]
  50. Preliminary Remote Sensing Results of Qinghai Yushu Earthquake Emergency. Available online: http://www.cea.gov.cn/manage/html/8a8587881632fa5c0116674a018300cf/_content/10_04/17/1271485532211.html (accessed on 20 June 2017).
  51. China National Standardization Management Committee. The Chinese Seismic Intensity Scale GB/T 17742-2008; China National Standardization Management Committee: Beijing, China, 2008.
  52. Lee, J.S.; Lee, J.S.; Wen, J.H.; Ainsworth, T.L.; Chen, K.S.; Chen, A.J. Improved sigma filter for speckle filtering of SAR imagery. IEEE Trans. Geosci. Remote Sens. 2009, 47, 202–213. [Google Scholar] [CrossRef]
  53. Wu, J.C.; Zheng, S.M.; Li, H.; Cai, Y.J. Building damage characteristics during the Zigui, Hubei M4.7 Earthquake on March 30, 2014. China Earthq. Eng. J. 2016, 38, 669–672. [Google Scholar] [CrossRef]
  54. Shen, H.F.; Meng, X.C.; Zhang, L.P. An integrated framework for the spatio–temporal–spectral fusion of remote sensing images. IEEE Trans. Geosci. Remote Sens. 2016, 54, 7135–7148. [Google Scholar] [CrossRef]
Figure 1. Schematic diagram of the precision-weighted multi-feature fusion (PWMF) method.
Remotesensing 11 00897 g001
Figure 2. Relative contributions proportion of the four scattering mechanisms (SMs) from the Yamaguchi four-component decomposition (YFCD) method for the three kinds of building samples.
Remotesensing 11 00897 g002
Figure 3. Scatter diagrams for the double-bounce scattering (DBS) component and the volume scattering (VS) component of the oriented building samples generated by the two decomposition methods.
Remotesensing 11 00897 g003
Figure 4. Comparison of the histogram curves of the collapsed building (CB) samples and the oriented building (OB) samples for eight texture features.
Remotesensing 11 00897 g004
Figure 5. The histogram comparison of the four texture features for the samples of CB and OB.
Remotesensing 11 00897 g005
Figure 6. Bar chart of the histogram distance between CB and OB of the four texture features, before and after using the OPCE algorithm to enhance the contrast.
Remotesensing 11 00897 g006
Figure 7. The flowchart of discerning CB and OB using the PWMF method.
Remotesensing 11 00897 g007
Figure 8. The process flow diagram of the building damage assessment.
Remotesensing 11 00897 g008
Figure 9. The location of Yushu County in China.
Remotesensing 11 00897 g009
Figure 10. The Pauli RGB pseudocolor image for the full-polarimetric SAR data of Yushu County urban region. The areas in the red, blue, and orange rectangles are the samples of CB, OB, and parallel buildings (PB), respectively.
Remotesensing 11 00897 g010
Figure 11. Building damage assessment (BDA) reference map at the scale of city blocks for the Yushu urban area. If the CB in a city block are less than one-third of the total buildings, the block will be considered as slight damage level (SLD). Serious damage level (SED) is defined as more than half of the buildings collapsed in a city block. If the building damage level (BDL) of a city block is between SLD and SED, the block will be regarded as moderate damage level (MOD).
Remotesensing 11 00897 g011
Figure 12. Stacked bar chart of the histogram distance between CB and OB for the four texture features with different window sizes.
Remotesensing 11 00897 g012
Figure 13. Trend plots of the CB samples and the OB samples at different directions for the four texture features.
Remotesensing 11 00897 g013
Figure 14. The regions of OB. The orange lines denote the alignment directions of the OB.
Remotesensing 11 00897 g014
Figure 15. Extraction results of CB, undamaged buildings (UDB), and nonbuildings (NB) in the earthquake-hit urban area of Yushu County.
Remotesensing 11 00897 g015
Figure 16. BDA results of the Yushu urban area at the scale of city block. The misclassification blocks are the numbered blocks with nos. 1–14, and the color of the colored numbers stands for the color of the correct BDA. The block with black no. 15 is the area where the OB are clustered.
Remotesensing 11 00897 g016
Table 1. Accuracy evaluation of the BDA for the proposed method and IYFD method.
The Proposed MethodIYFD
(Experiment)
SlightModerateSeriousSlightModerateSerious
(No. of Blocks)(No. of Blocks)
Reference
Slight1220941
Moderate627022110
Serious51191222
Overall accuracy: 80.56%Overall accuracy: 72.22%

