1. Introduction
Several satellites in operation are equipped with high-frequency microwave sensors, including the Advanced Microwave Sounding Unit B (AMSU-B) [
1] or Microwave Humidity Sounder (MHS) on the National Oceanic and Atmospheric Administration (NOAA) and Metop satellite series [
2], Advanced Technology Microwave Sounder (ATMS) on the Suomi National Polar-orbiting Partnership (SNPP) and Joint Polar Satellite System (JPSS)-1 satellites [
3], and MicroWave Humidity and temperature Sounder (MWHTS) on the Chinese FengYun-3 C (FY-3C) satellite [
4]. Satellite-based observations provide expanded opportunities for atmospheric profile retrievals and hydro-meteorological monitoring through measuring brightness temperature over land and ocean at global scale.
Accurate profile and hydrometeor retrievals are crucial for applications in extreme weather events such as hurricanes. Microwave observations from radiometers can be used to produce physically reasonable retrievals through estimating the direct interaction between the radiation and atmospheric parameters in the atmospheric columns. A physical-based retrieval algorithm was introduced by Petty [
5], aiming to invert multichannel microwave radiances to determine the physical information on temperature and hydrometeors. The Goddard Profiling Algorithm (GPROF) is another noteworthy system that uses a Bayesian inversion for all surface types, and now has been evolved to a fully parametric approach implemented operationally for Global Precipitation Measurement (GPM) Microwave Imager (GMI) [
6]. The microwave-integrated retrieval system (MiRS,
https://www.star.nesdis.noaa.gov/mirs/), which has been operational in NOAA since 2007, is an inversion algorithm based on physical forward modeling and can simultaneously invert observed multichannel radiances to determine key components of the atmosphere and surface state [
7]. At present, traditional mathematical modeling methods, such as multi-analysis and time series analysis, are widely used in the statistical prediction approaches to forecast typhoon track [
8]. Therein, the future state of prediction object is forecasted through a statistical equation. Ensemble numerical prediction (ENP) is a novel technique developed in the past decade. In general, the ENP model consists of many different ensemble members, either created by using model configurations with different model physical process parameterization schemes or by different model initial conditions from a Monte Carlo approach [
9].
Commonly, there are two basic approaches for assimilating information obtained from satellites into a data assimilation system [
10]. The primary method of satellite data assimilation is to incorporate conventional retrievals from satellite measurements into the assimilation system, which can lead to improved hydrometeor process and cloud properties in the forecast fields [
11]. However, certain prior information and restrictive assumptions are generally required in the conversion process, resulting in some retrieval problems [
12]. The second approach is to assimilate the satellite radiances directly into the data assimilation system, which requires a nonlinear observation operator represented by a forward radiative transfer equation that transforms model-state variables into radiances. However, it should be noted that direct assimilation of cloud-affected radiances is very challenging due to limited understanding of the vertical structure of hydrometeor parameters and uncertainties associated with the nonlinearity of the moist physical process. Comparison of radiance and three-layer precipitable water from the Advanced Himawari Imager (AHI) in the same assimilation model was conducted by Wang et al. [
13], with results indicating a similar or comparable performance on precipitation forecasting.
The Atlantic hurricane is tropical cyclone that forms in the Atlantic Ocean, usually between June and November. During 1–9 October 2016, hurricane Matthew moved along the southeastern coast of the U.S., causing major flooding and significant damages, even to farther north away from the storm’s winds. Various observations, such as tide gauge data, cable measurements of the Florida Current (FC) transport, satellite altimeter data and high-frequency radar data, have been analyzed to evaluate the impact of this hurricane event [
14]. However, passive microwave observations from satellite platform have not been extensively investigated. Therefore, this study focused on the observations from MWHTS onboard the FY-3C satellite. This study was also motivated by the fact that the FY-3C data are now assimilated in the European Centre for Medium-Range Weather Forecasts (ECMWF) system and have brought positive impact on the Numerical Weather Prediction (NWP) model.
This paper is organized as follows. The microwave instrument on board the FY-3C satellite is introduced in
Section 2, and it is demonstrated that multiple receiver arrays can be used to multiplex a large set of channels onto a single spot on the ground. An overview of the datasets and physical models used in the simulation is provided in
Section 3, including data processing, data clustering and mapping. We next point out that 118 GHz, as the unique adoption on polar-orbiting commercial meteorological satellite, provides abundant layered information about temperature and humidity parameters. Thus, this study adopted a combined method to realize profile retrievals before data assimilation and then compared those with radiance assimilated separately during a hurricane event.
Section 6 summarizes the main findings of this study and suggests directions for future research using the MWHTS data.
2. Description of Instrument
The FY-3C satellite is polar orbiting with an equatorial crossing time of 10:00 (descending) and carries the microwave humidity and temperature sounders, MWHTS, which is similar to the ATMS temperature and humidity sounder onboard the Suomi-NPP satellite, except that MWHTS has additional channels at 118 GHz and lacks 23–60 GHz. The MWHTS has been in operation onboard the FY-3C satellite since 30 September 2013 [
15]. It is a cross-track scanning radiometer that has 98 Fields of View (FOV) with a swath width of 2650 km, wider than that for MHS (2310 km) and ATMS (2580 km). The absolute visiting period is 5.5 days. The limitation threshold of matching domain (i.e., accuracy in domain selection for comparison) is 0.05 degree for both latitude and longitude in the spatial dimension, and 30 min in the temporal dimension. The MWHTS instrument is a self-calibrating total-power passive microwave system. It can operate in three different modes: pointing mode, constant speed scanning mode and variable speed scanning mode. It is a cross-track scanner with variable speed and the antenna reflectors execute one complete revolution every 8/3 s. As illustrated in
Figure 1, the scan view angle of earth field is within ±53.35° from the nadir direction. The cold space view angle is 106.1° and the zenith direction where the blackbody target is located is 180°.
Figure 2 shows the scanning pixels of MWHTS, which has an instantaneous field-of-view of 1.1 or 2 degree and scans from nadir with 49 different viewing angles on each side, providing a nominal spatial resolution of 15 km at its nadir and 41X27 km for first and last pixel.
The MWHTS has 15 channels and is mainly designed to provide information on atmospheric temperature and humidity profiles, rainfall and typhoon monitoring [
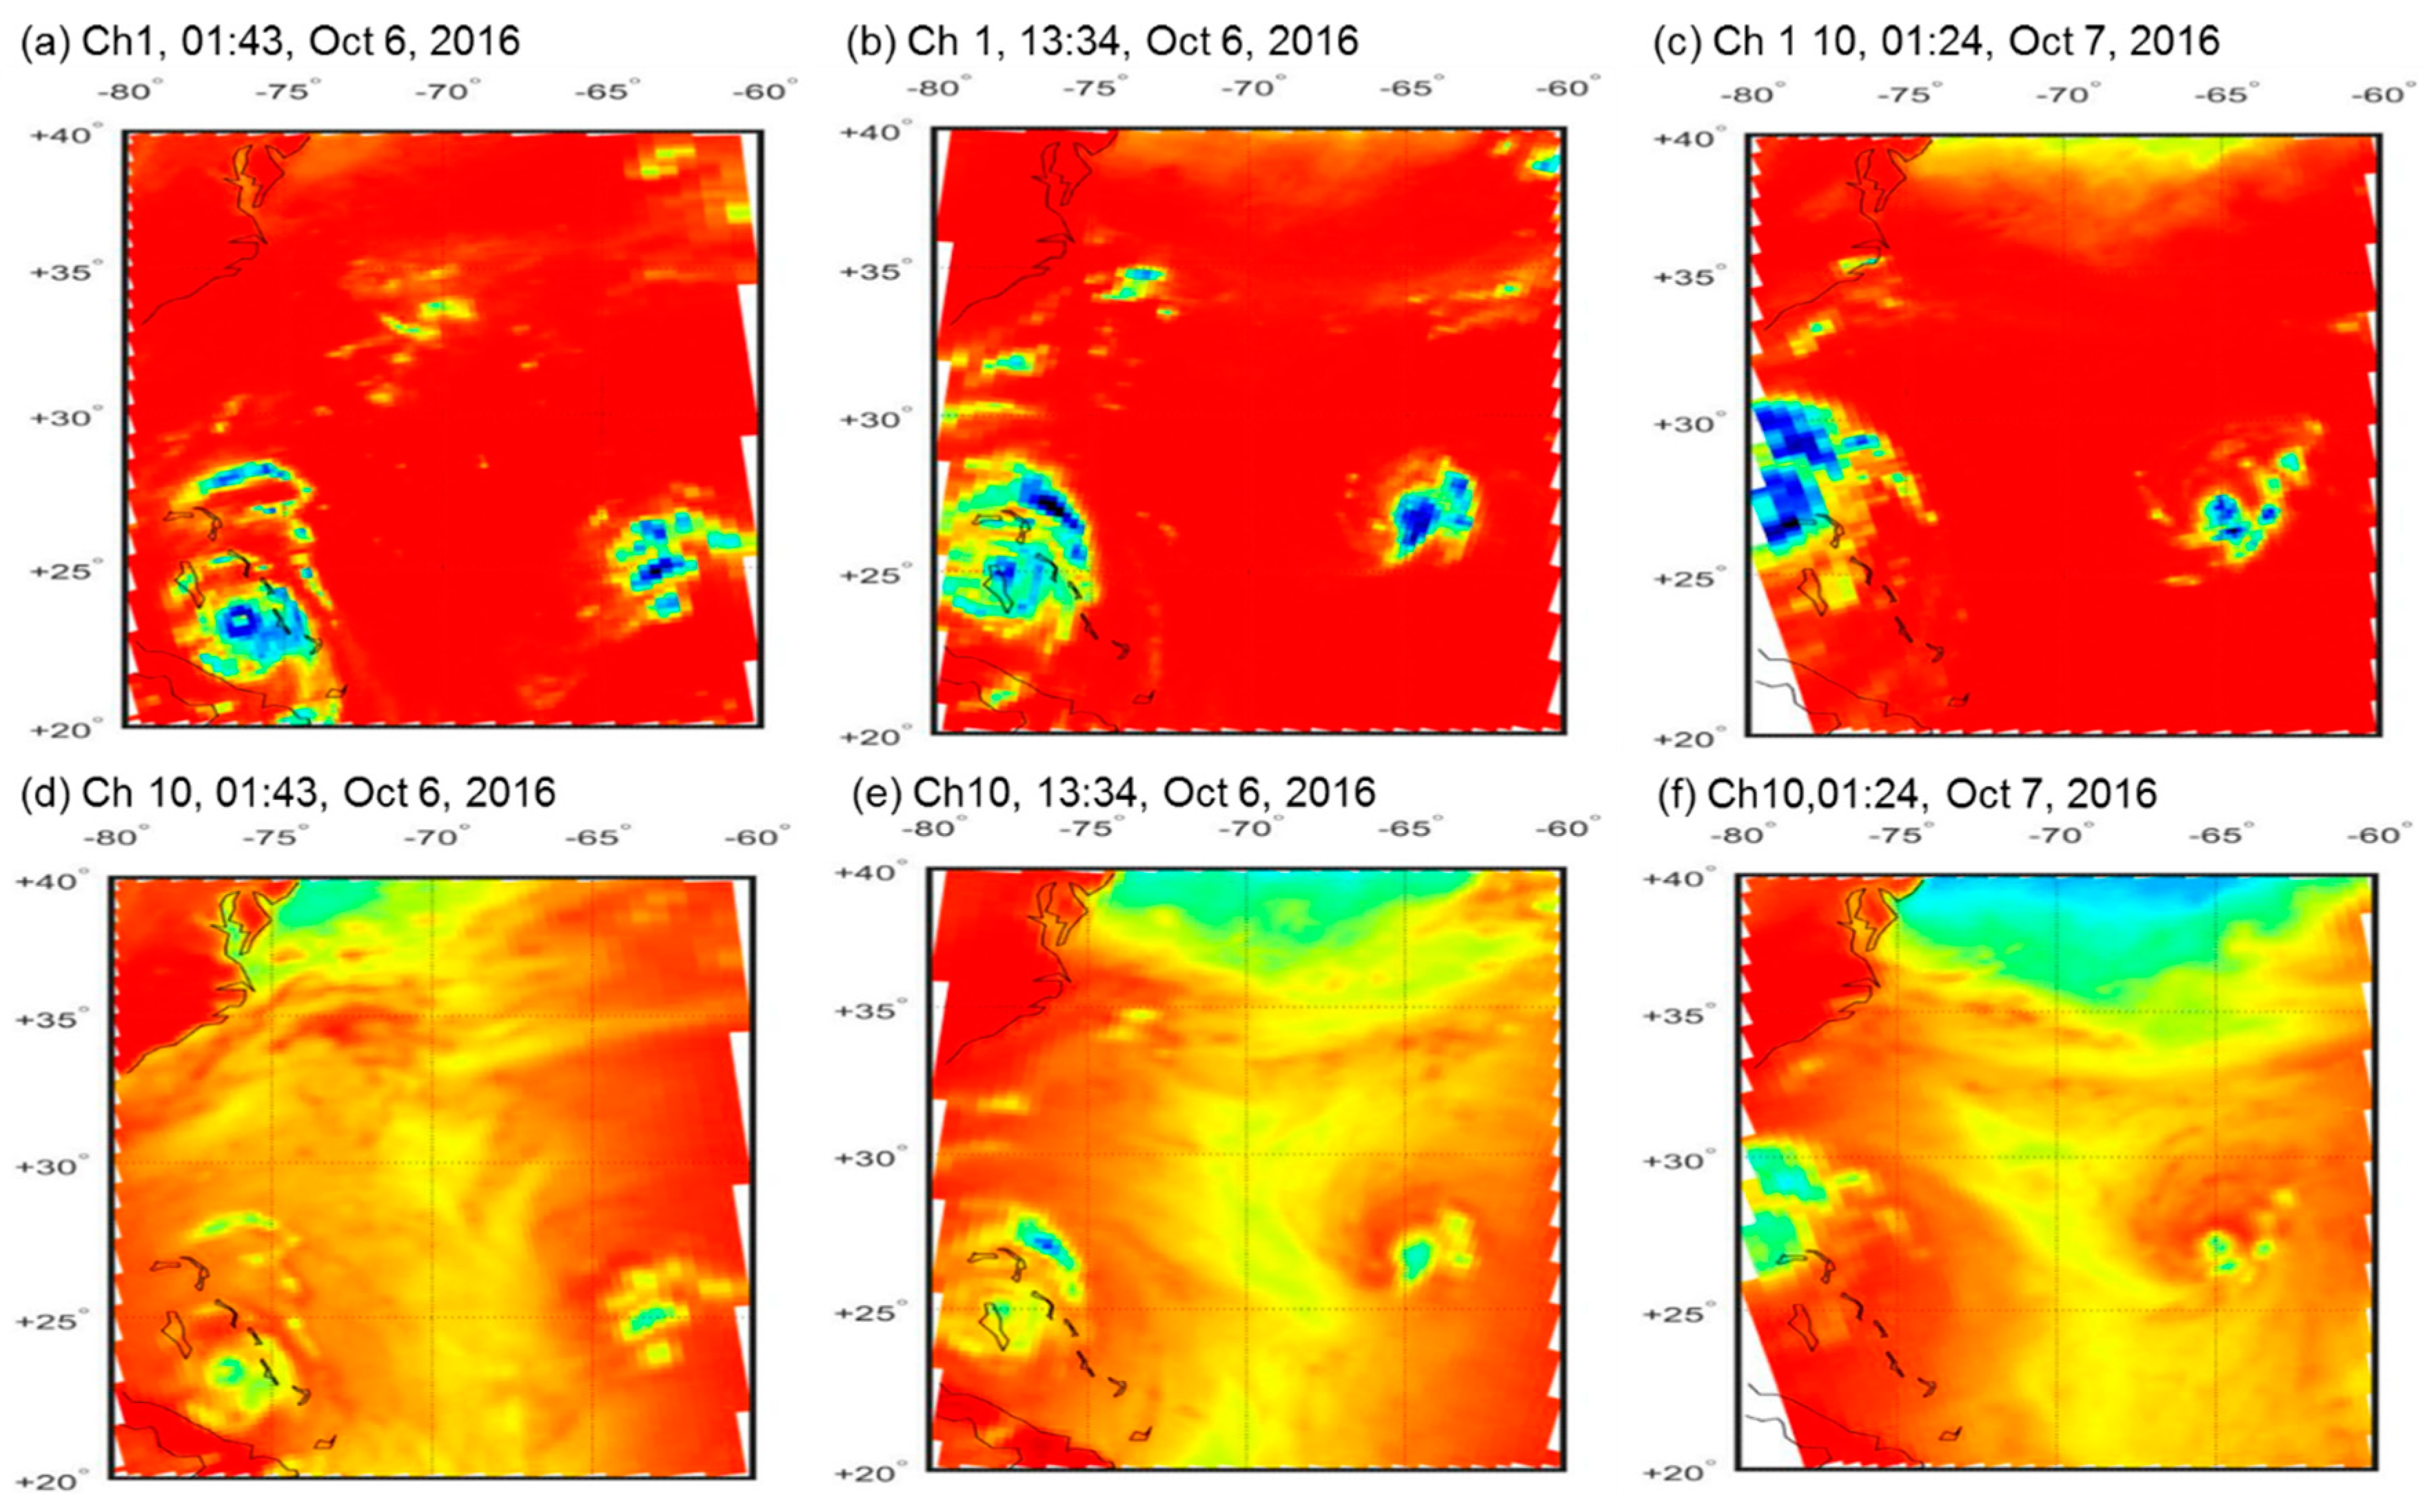
16]. The instrument measures thermal radiation at microwave frequencies ranging 89–190.0 GHz. Atmospheric temperature profiles are obtained primarily based on the measurements at channels near 118.75 GHz, which is an oxygen absorption band. In particular, the MWHTS sounding channels 2–9 respond to the thermal radiation at various altitudes as according to their weighting function distributions. As window channels, channels 1 and 10 mainly detect radiation background, clouds, precipitation, and surface properties. Since the satellite provides a nominal spatial resolution of 15 km at its nadir, the temperature perturbations from synoptic to mesoscale can be reasonably depicted. The instrument also contains five channels (11–15) that provide atmospheric humidity profiles, as shown in
Table 1.
The fifteen channels from MWHTS are designed for sounding atmospheric temperature and water vapor in all weather conditions except for heavy precipitation [
17,
18]. Since these instruments are designed as cross-track scanners, the instrument viewing angle is different from pixel to pixel along a scan line, as shown in
Figure 1. A combination of several imaging channels at 89 and 150 GHz frequencies is utilized to determine cloud liquid and ice water content since they directly respond to the emission from liquid droplets and the scattering from ice particles. The MWHTS channels are non-polarized at nadir and mix-polarized off nadir. That is, the observed brightness temperature is only affected by one polarization state at nadir, but it is affected by both horizontal and vertical polarization off nadir. The polarization mixture reduces the angular dependence of the surface emissivity.
4. Retrieval Methodology
In satellite remote sensing, both statistical and physical retrieval methodologies are applied to deal with the regression problems and retrieve the atmospheric temperature profiles [
12]. From the statistical point of view, the Neural Network (NN) algorithm is a typical approach used in the community [
24], while the one-dimensional variational (1D-var) method is commonly used as a representative physical approach [
25]. Both can obtain the nonlinear relationship between the satellite observation and the atmospheric profiles. In particular, the NN, which generally includes a few key steps, namely initialization, training, optimization and simulation of neural networks, is a powerful tool to reflect the nonlinear relation between the input and target spaces. Using the Back Propagation (BP) NN based on the error (BP) learning algorithm, one can learn and establish functions when the analytical relationships between inputs and outputs are complicated. For the 1D-var algorithm, it mainly includes two parts under the general term of physical concept: the radiative transfer model for brightness temperature simulations and the minimization of the cost function used for weighting the relative contribution of background information and satellite observations (see the right part of Equation (1)).
where
is the background state variable;
is the background covariance matrix;
is the sum of the sensor noise and the covariance error in the radiance simulations;
represents the matrix transpose;
is the forward operator that simulates the satellite observations at the atmospheric state variable
; and
O stands for the observations.
Assuming the errors in the observations and the background information are neither biased nor correlated Gaussian distributions and there is a local linearity around
, the minimization of the cost function can be solved by:
This results in the following solution to
,
where
is the tangent linear function of
at point
;
is the iteration index. From Equation (3), the final solution
is affected by the a priori information, including the background covariance matrix
, the background state variable
, the initial guess, the bias (
between observation and simulation, and the observation covariance matrix
.
In this study, a combined methodology based on the above two methods was proposed and validated through the case study for hurricane Matthew. For background error covariance matrix , we calculated it using the atmospheric temperature and humidity profiles within 20–40N and 60–80W from 28 September to 10 October 2016, where and when hurricane Matthew was formed.
The formula of covariance is given by:
where
is arbitrary element in the covariance matrix
at row
i and column
j, respectively; and
is the number of atmospheric profiles used in this study. We took the mean of the atmospheric temperature and humidity profiles used in Equation (4) to calculate the background error covariance B
in the retrieval system. The initial guess of
when
n = 1 (i.e.,
) in Equation (3) was obtained from NWP model outputs.
The brightness temperatures simulated using ARTS model were taken as the input vector . The length L of the input vector is 15 for all the MWHTS sounding channels. The atmospheric temperature and humidity profiles extracted from NWP model were taken as the output vector XM, and the length M of the output vector equalled to 32 pressure levels for profiles. The pairs of input/output vector were then used to train the BP NNs, and the steepest descent method was adopted in the training process. In particular, 90% of the random pairs (training data) were used to determine the weights and biases in the NN model, and the other 10% (testing data) of pairs were used to validate and evaluate the trained model. With detailed comparison and analysis, the number of hidden nodes in the hidden layer was determined as 28 for MWHTS in this study.
Before and after the launch of MWHTS, a series of tests were carried out, such as sensitivity, nonlinear correction factor, calibration accuracy and Allan deviation between observations and simulation model for each channel. In this study, all of these factors were considered when computing the observation error covariance matrix
. With the assumption that the measurements in one channel are uncorrelated to those from others, the diagonal elements of
can be expressed as:
where
is the square root of the diagonal elements of
;
is the instrument channel noise (including all factors that cause calibration inaccuracy); and
is the forward model error.
In an actual case, the errors in the observations and the background information are correlated with bias, thus it no longer works for Equation (2). The convergence criterion adopted in this study is:
When the relative difference of the cost function within two iterations was less than 0.01, the iteration process was terminated with a reasonable result. Otherwise, if the maximum iteration number reached 100, we assumed a mathematical solution failure occurred for the case.
5. Retrievals and Data Assimilation for Case Study
5.1. Study Domain and WRF Configuration
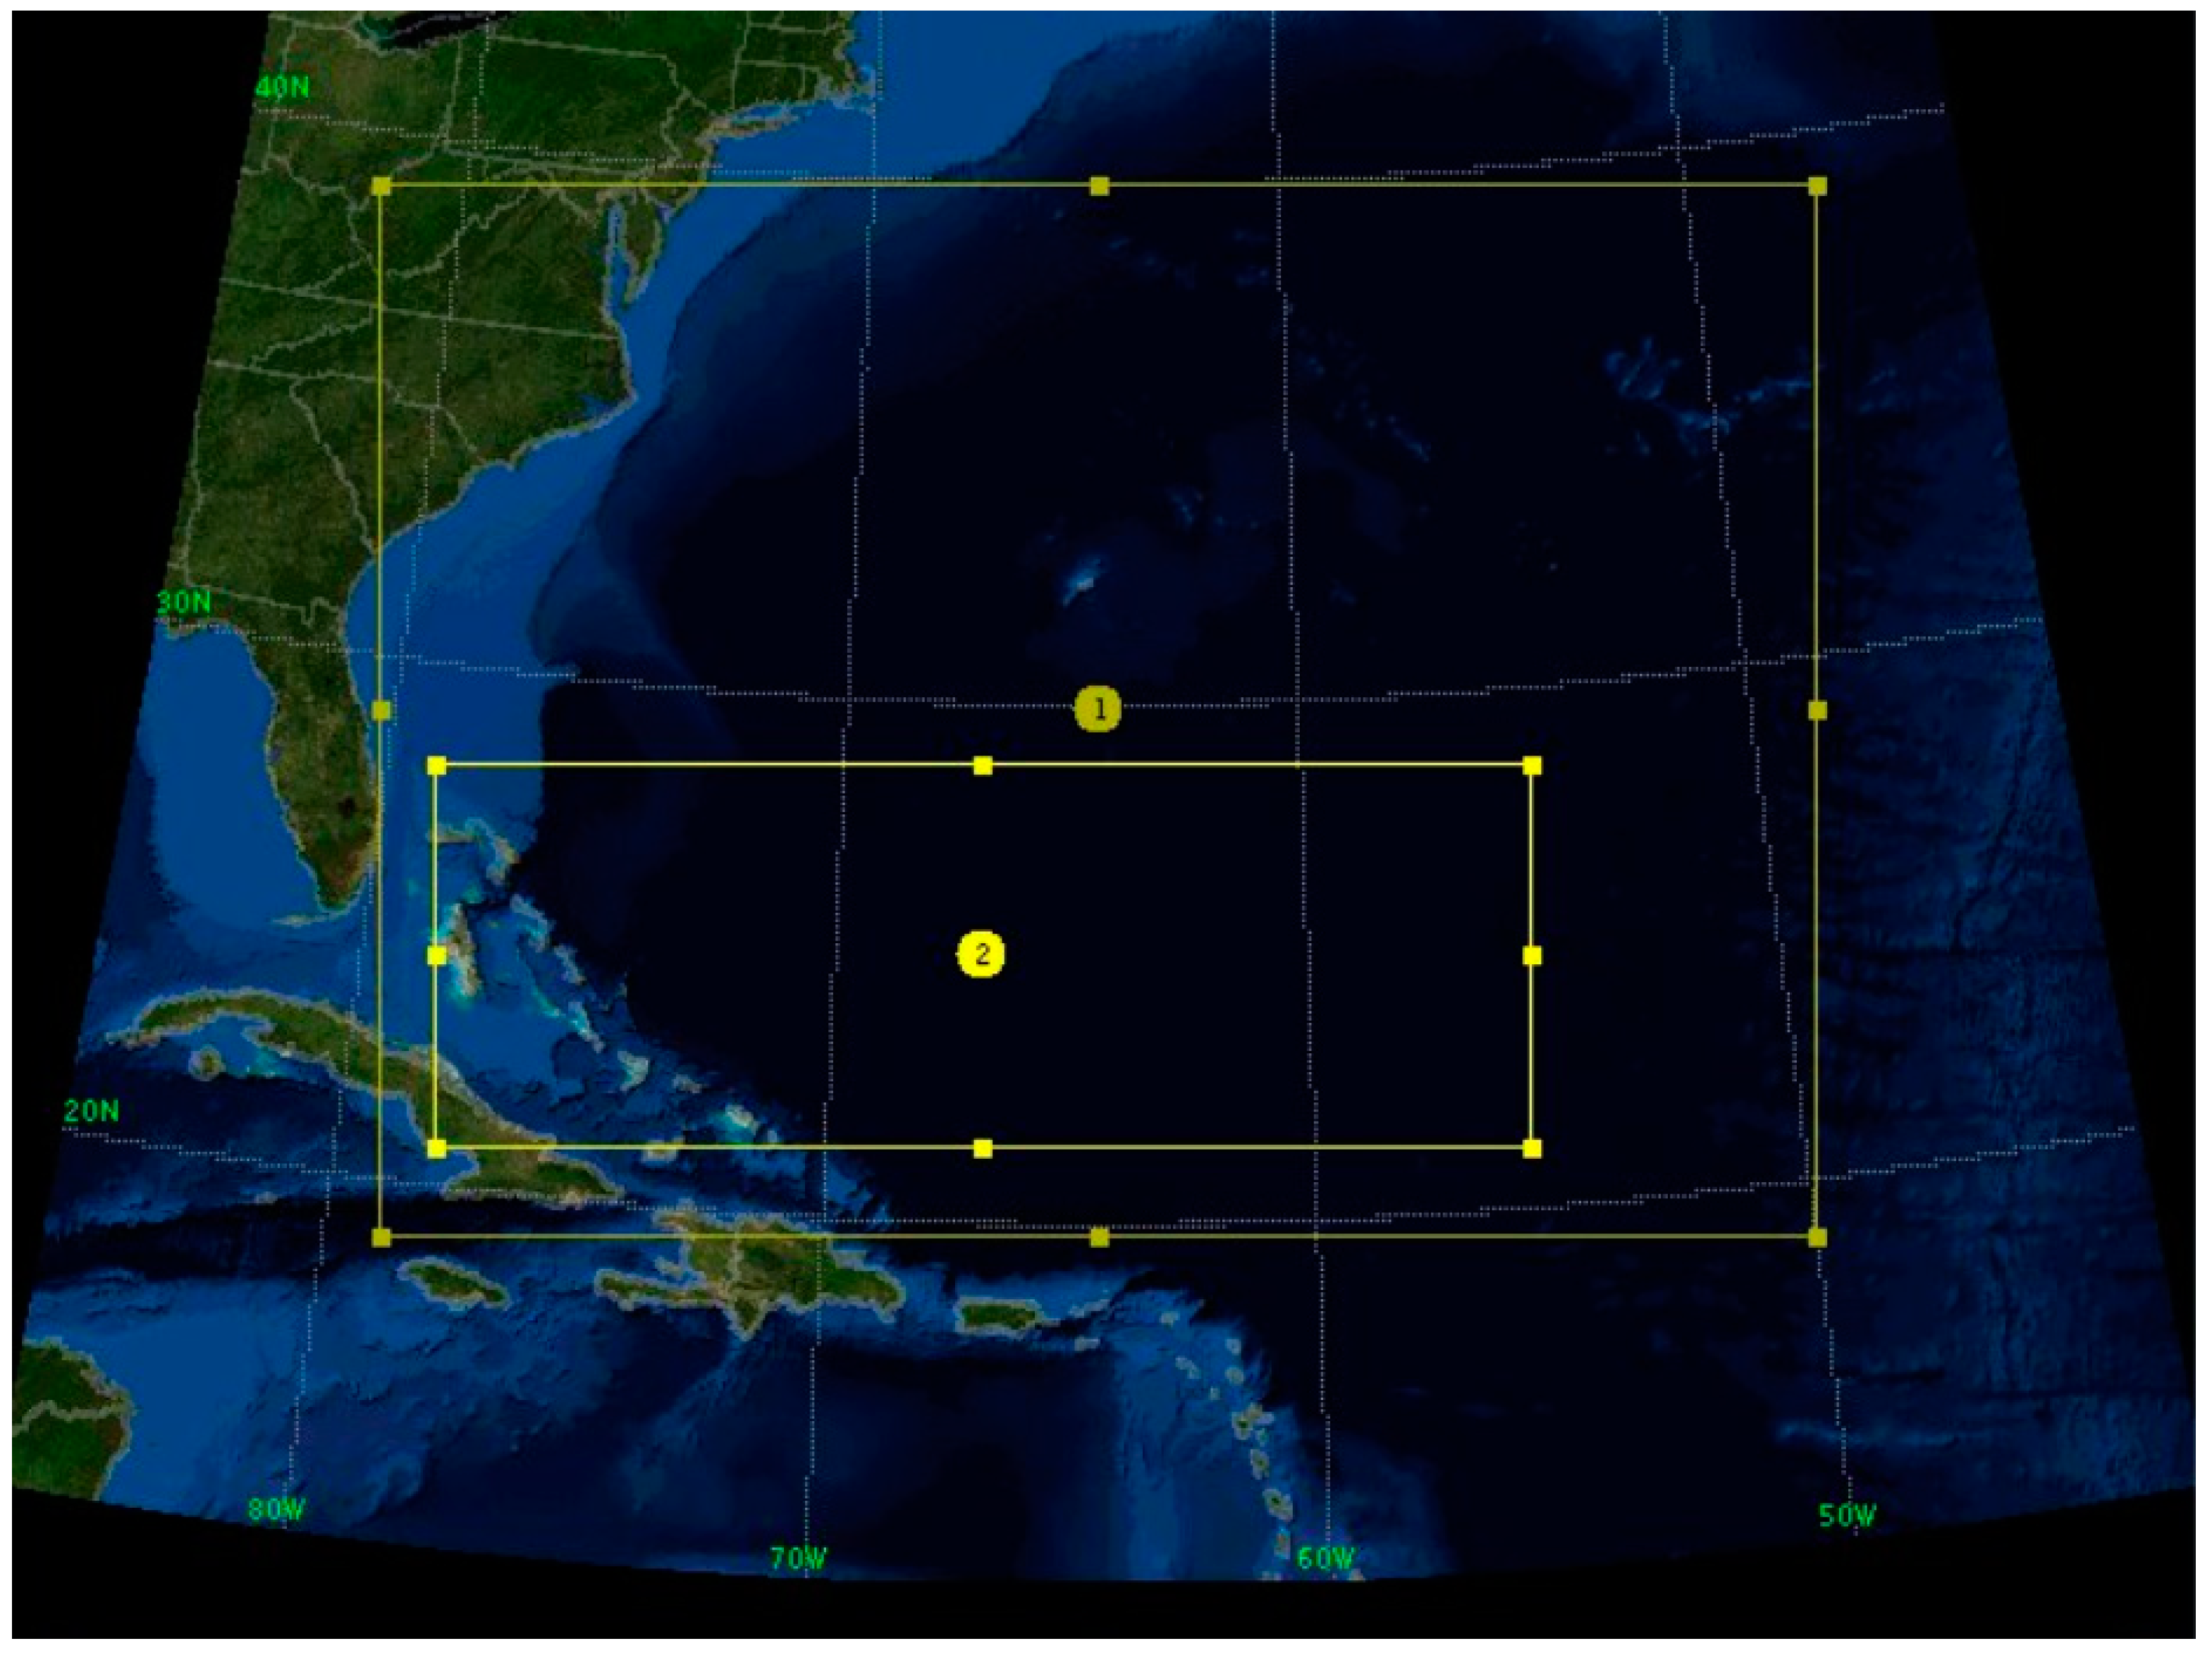
As shown in
Figure 5, the study area is located within 20–40N and 50–80W over the North Atlantic Ocean. For demonstration purpose, we selected the hurricane Matthew event for case study. Hurricane Matthew was a powerful and devastating tropical cyclone, which became the first Category 5 Atlantic hurricane since Hurricane Felix in 2007. This event evolved from 28 September to 10 October 2016, wrought widespread destruction and catastrophic loss of life during its journey across the Western Atlantic, including parts of Haiti, Cuba, Dominican Republic, the Lucayan Archipelago, the southeastern United States and Canadian Maritimes.
Numerous studies focus on various forecasting methods, including numerical model of dynamic prediction, objective statistical forecast, and subjective experience forecast. As mentioned in
Section 3.1, this study used NCEP 6-h reanalysis data as input to WRF. The WRF model configuration consisted of a 15-km resolution parent domain and a 5-km nested grid with 32 vertical levels from the surface to 100 millibars. The model was configured with a Lambert Conformal (LCC) projection, centered at 29.25N, −65.878W.
Figure 5 shows the modeling domains for the WRF simulations with the inner nested domains focused over the Atlantic Ocean. The Kain–Fritsch cumulus parameterization scheme was used on the 15-km domain only, while convection was explicitly simulated on the 5-km nested domains. The WSM6 microphysics scheme, the Yonsei University (YSU) PBL scheme, and the Noah land surface model were implemented for both domains. The NCEP 1-degree final analysis (FNL) data were used for the initial and lateral boundary conditions along with the NCEP Real Time Gridded 1/12-degree sea surface temperature data. Three-dimensional data assimilation was applied in all simulations using the FNL gridded analysis data. By using the WRF model, the evolution process and thermodynamic and hydrometric features of tropical cyclone with the highest resolution of 5 km were obtained and integrated to 72 h (three days).
5.2. Data Matching
The satellite observations used for retrieval in this study were collected from 28 September to 10 October 2016. The Level 1 data of FY-3C meteorological satellite are recorded once every 102 min for each orbit. The data can be obtained from
http://satellite.nsmc.org.cn/portalsite/Data/FileShow.aspx. The required WRF inputs were obtained from the NCEP archival database. These inputs were: (1) 6-h reanalysis data for atmospheric profiles; (2) 1-degree final analysis data for initial and lateral boundary conditions; and (3) real-time gridded data for sea surface temperature [
19]. Each WRF forecast started with the initial and boundary conditions provided by NCEP reanalyses, creating 24 forecasts (with time interval of 15 min) at 5 km spatial grids for each initial atmospheric state. Hence, each pixel of MWHTS observations could be matched in the chosen domain within 30 min.
Considering that the invalid pixels should be deleted in the retrieval process, prior to retrieving, the first step Was to carry out quality control and screening. In particular, the footprint of MWHTS was flagged as invalid if brightness temperature for that pixel is less than 50 K or greater than 400 K. For data matching, the observations were screened if latitude is greater than 40N or smaller than 20N, or if the longitude is smaller than 50W or larger than 80W. The data from FY-3C satellite and WRF runs were matched in both spatial and temporal perspectives. The matched datasets were then used for further retrievals.
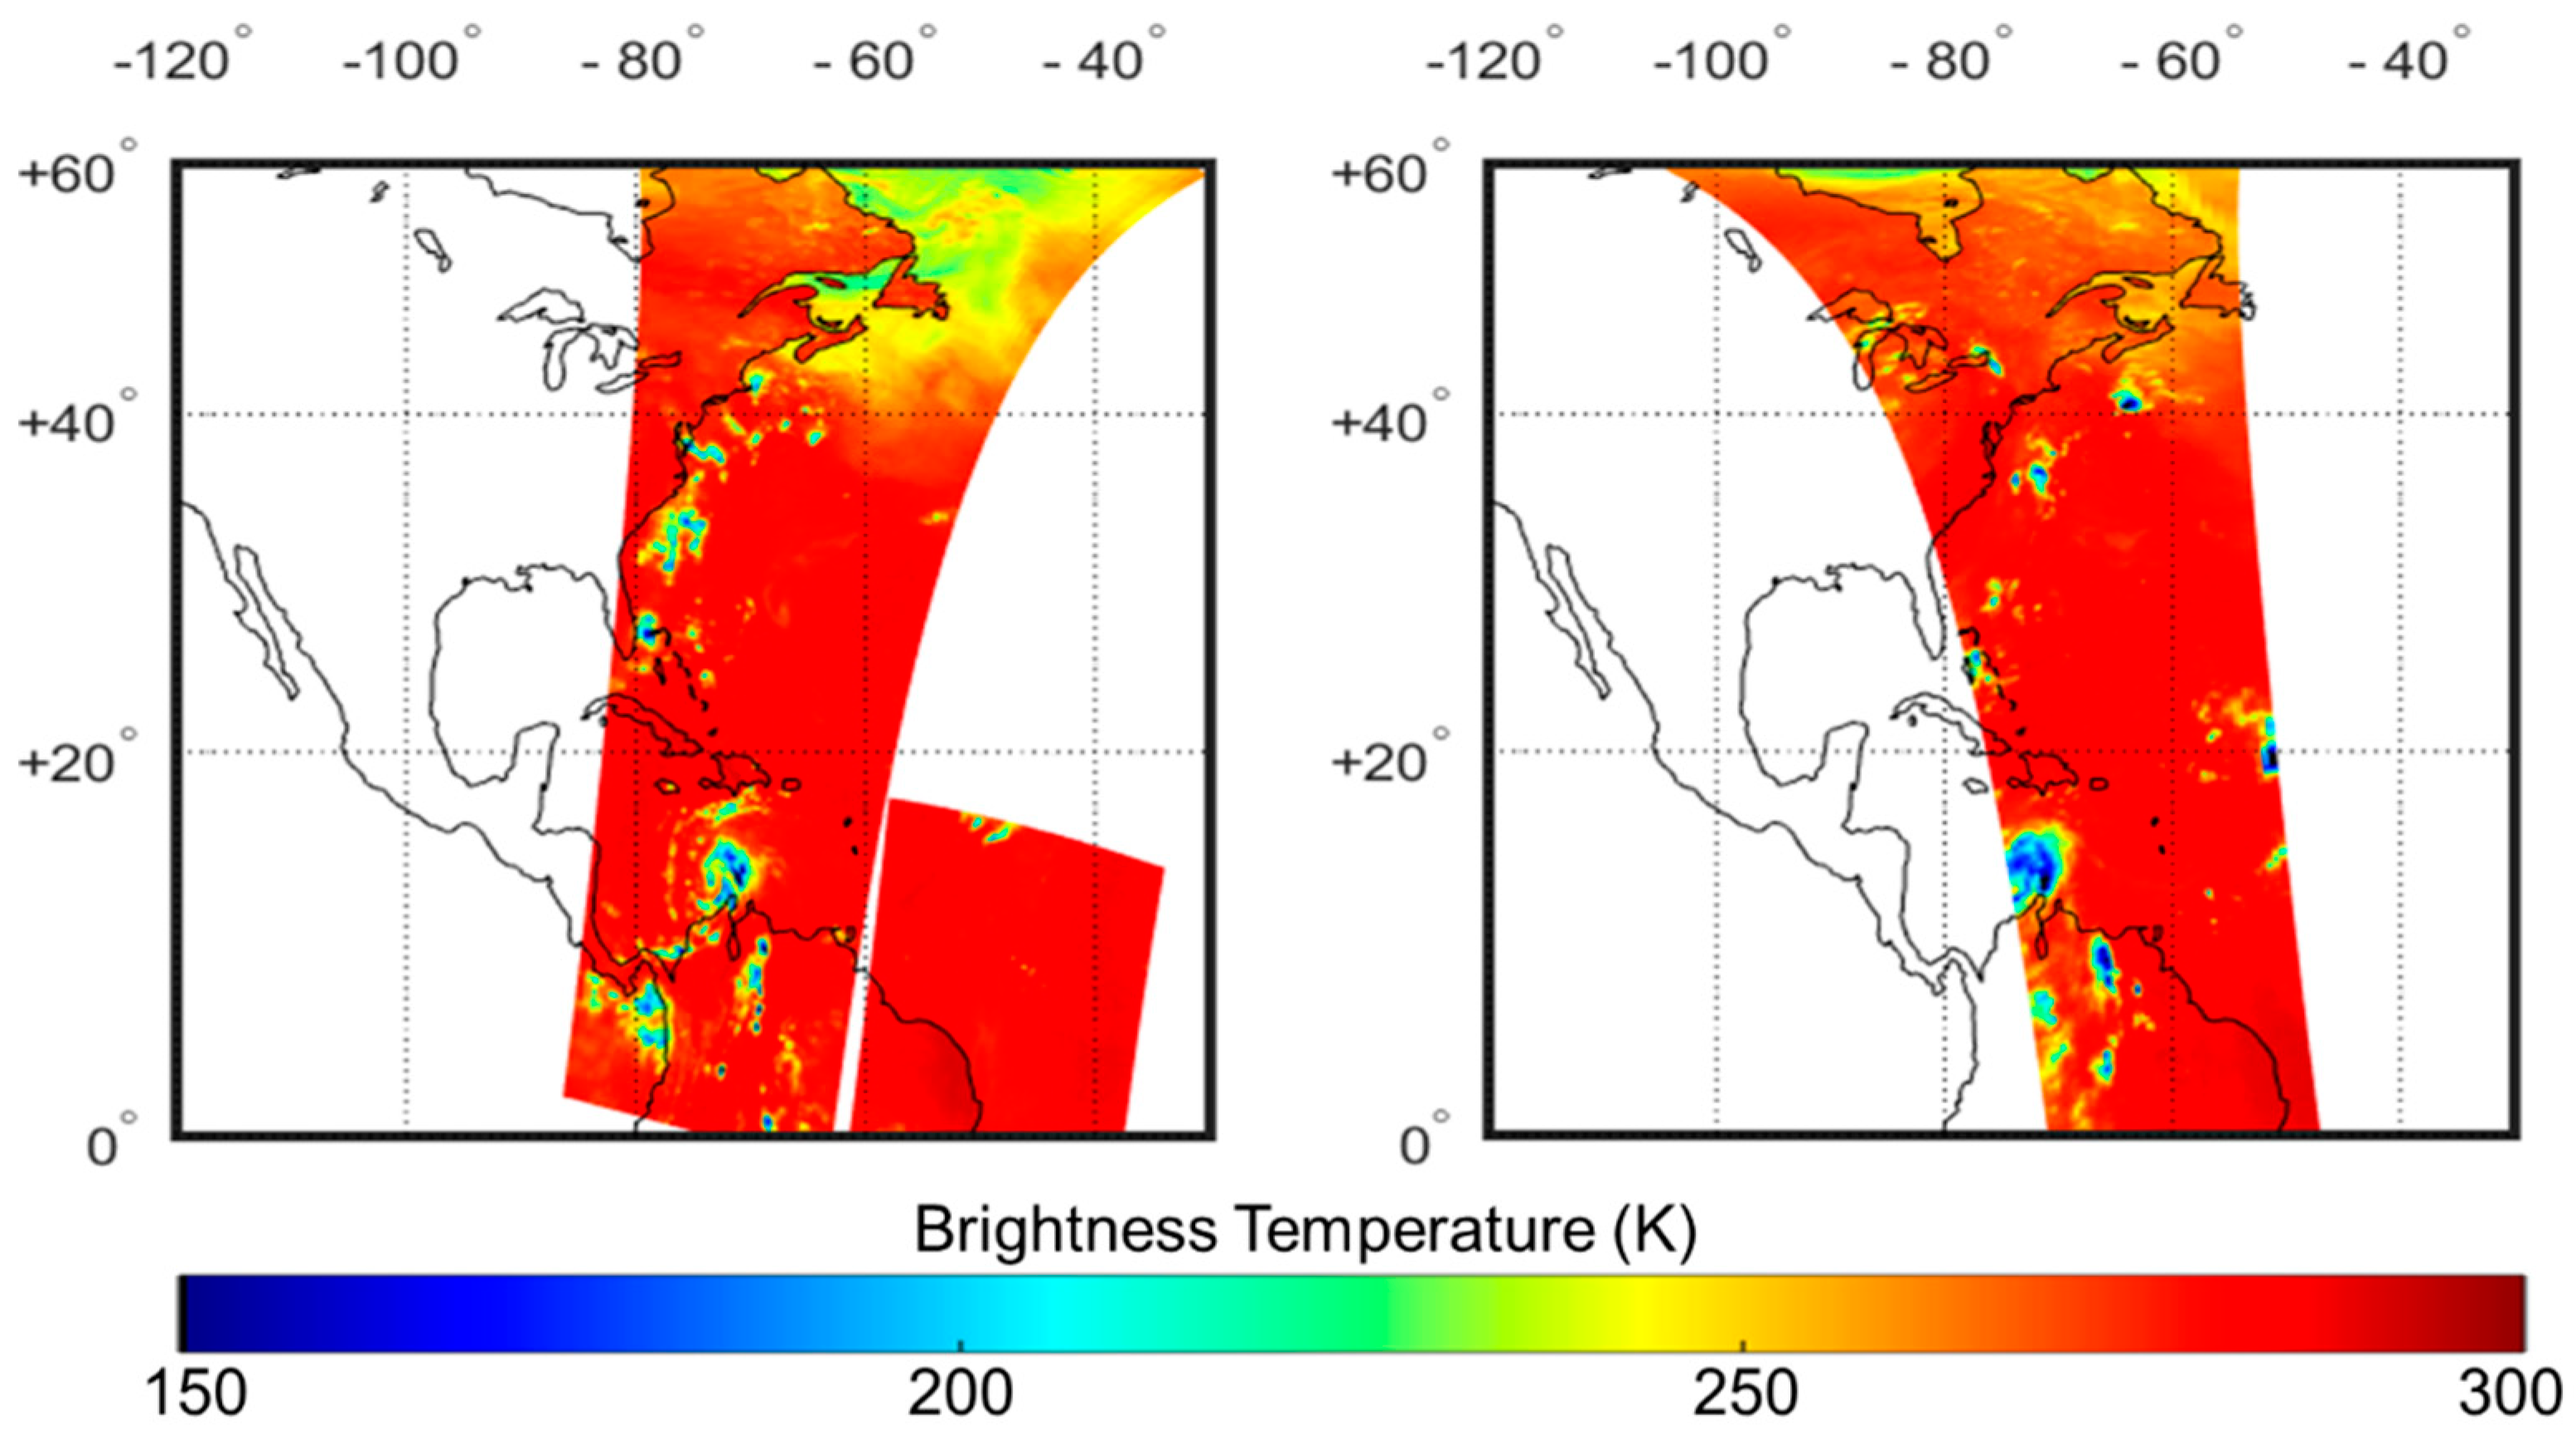
Figure 6 illustrates sample matching data for this particular study case.
In addition, since the Level 1 datasets of FY-3C MWHTS are archived with surface type (ocean and land) and the Level 2 dataset includes rain detection product with same view in time and space, we considerrf both the surface type and rain and no-rain conditions in data assimilation for the following retrieving. In total, after matching the FY-3C MWHTS and WRF output data, 502,400 matched data pairs were obtained.
5.3. Retrievals and Analysis
In this study, the brightness temperatures were simulated by ARTS model and validated by corrected brightness temperatures of MWHTS with observation error covariance added to matrix R. The atmospheric state vectors of temperature and humidity profiles were retrieved by the combined algorithm with a prior background error covariance matrix B estimated by ANN neural network based on historical datasets in the same domain.
Figure 7 shows the brightness temperatures observed within 20°–40°N latitude and 60°–80°W longitude using the first and tenth channel of MWHTS onboard FY-3C, with starting time of 01:43 on 6 October, 13:34 6 October and 01:24 UTC 7 October 2016.
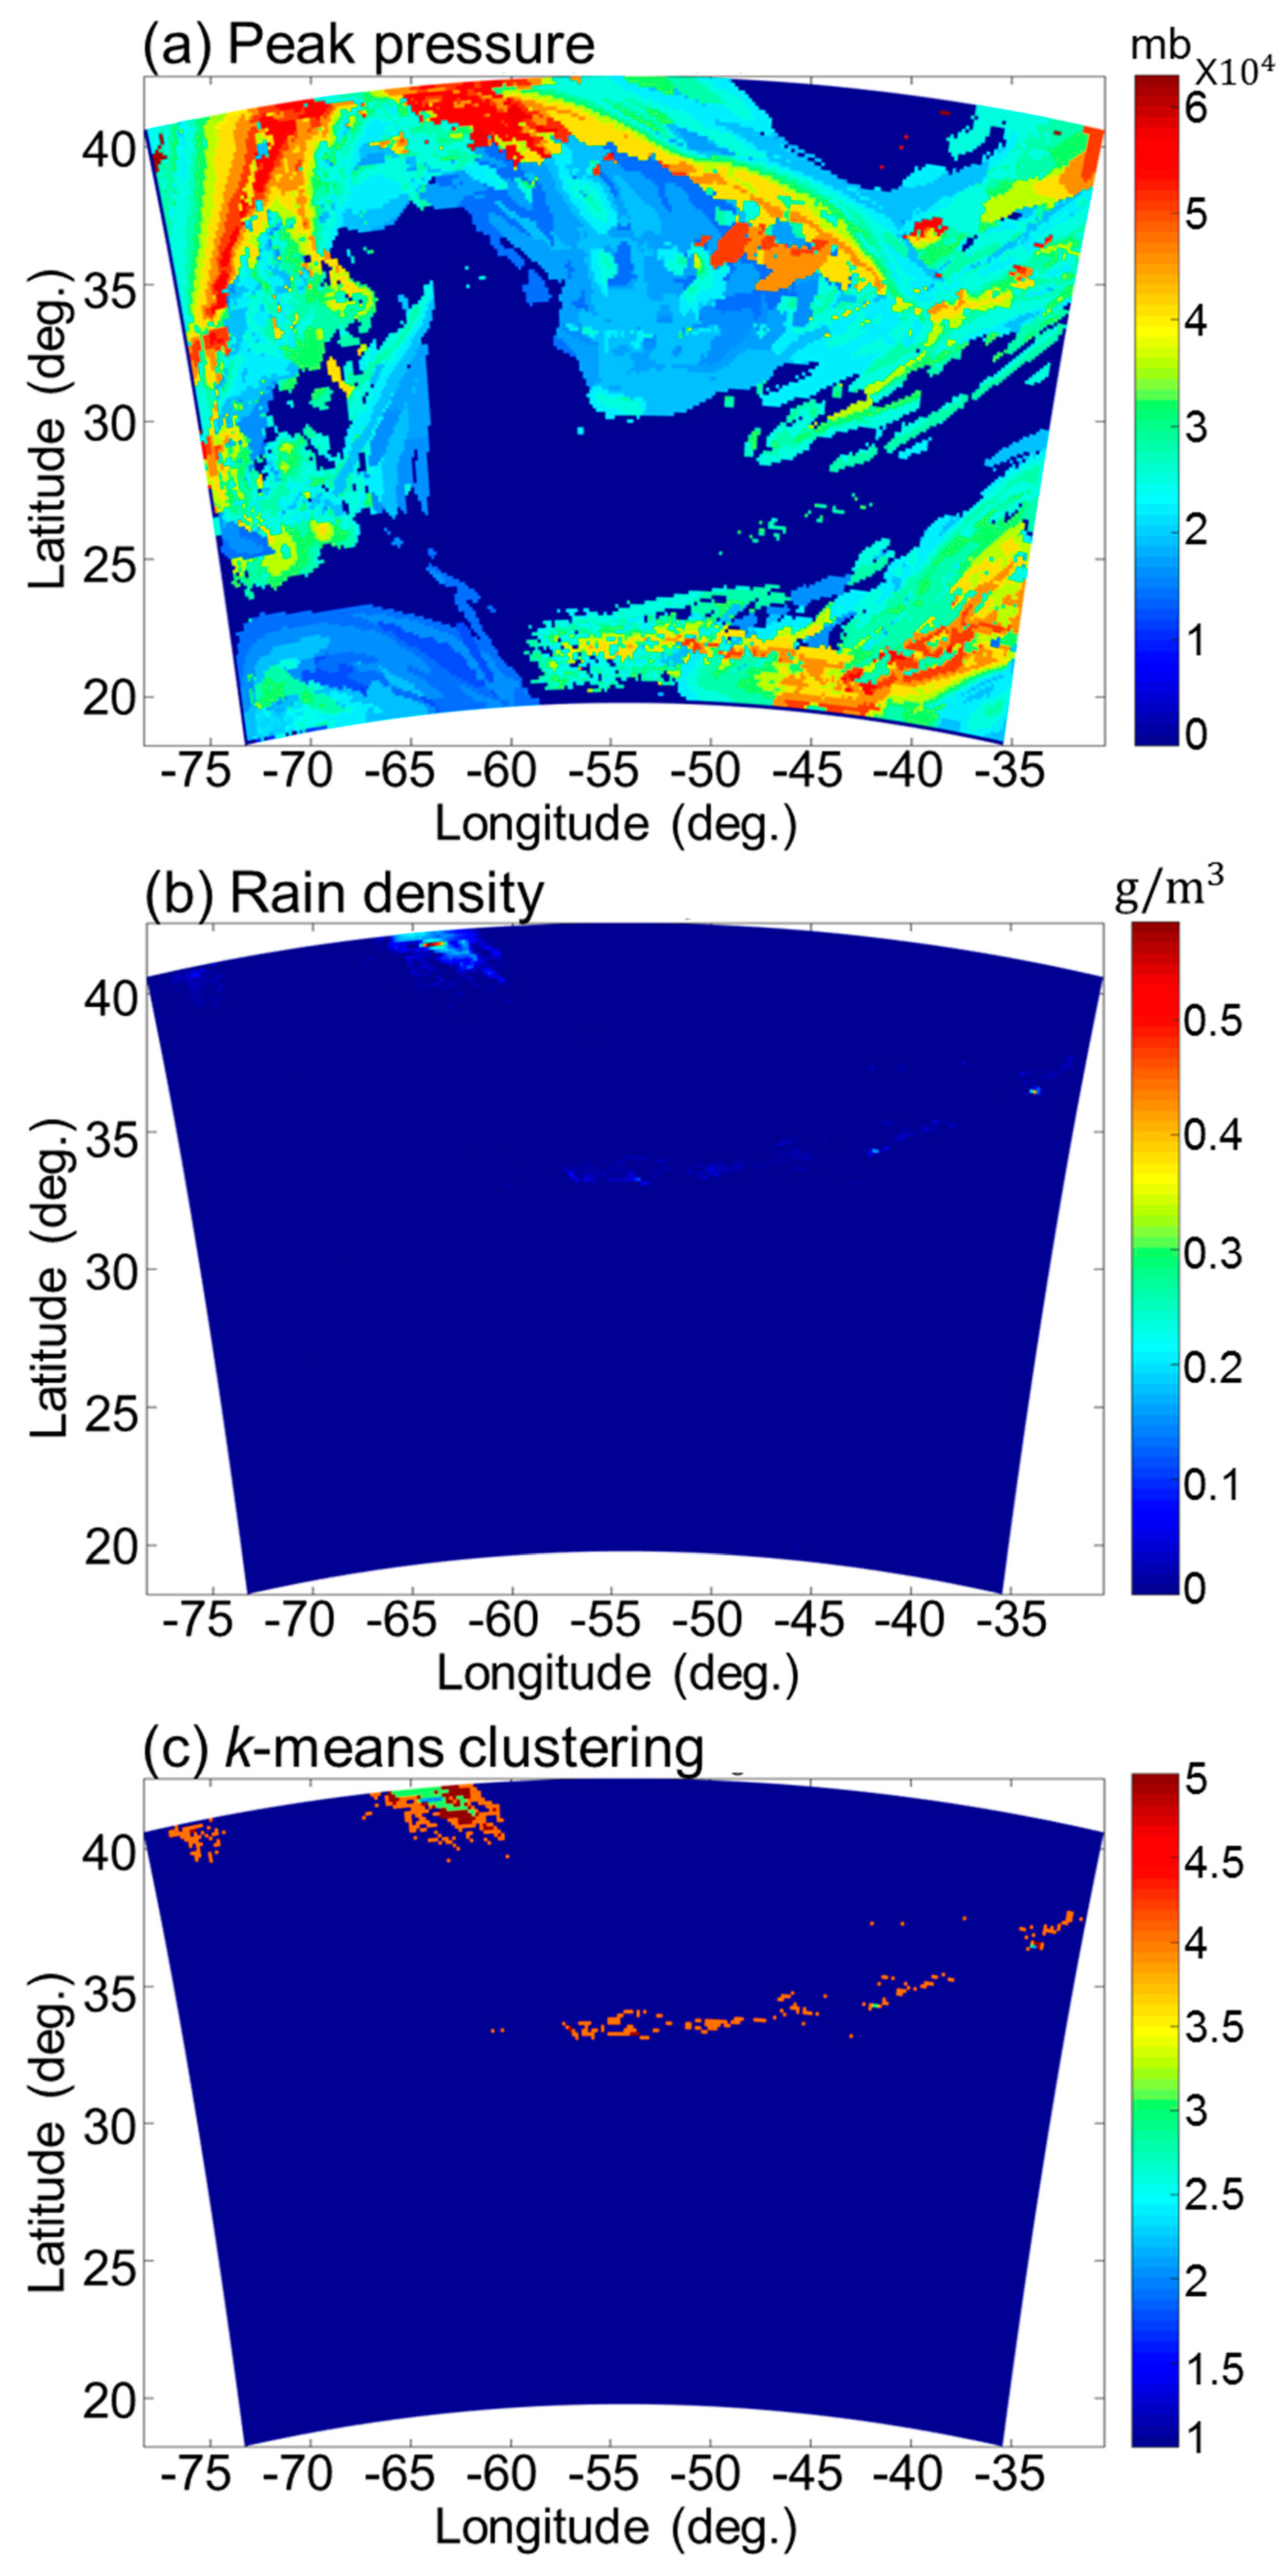
Simulation datasets using ARTS were calculated, as shown in
Figure 8, where the input data included three-dimensional atmospheric hydrometeor variables (e.g., cloud liquid water, cloud ice, graupel, rain, and snow mixing ratios) and thermodynamic state (e.g., temperature and water vapor density) variables at 460 mb from WRF model runs with NCEP FNL data.
Biases were calculated to evaluate the retrieval results and quantify the associated errors with respect to the WRF outputs and NWP model reanalysis, which were assumed to be truths. According to the channel specification of the MWHTS, the temperature and humidity retrievals were for 32 pressure levels from 1000 to 10 hPa, and totally nine sampled levels were chosen, as illustrated in
Figure 9. The corresponding distribution of retrievals errors including root mean square error (RMSE) are shown in
Figure 10.
For calculation of the background error covariance, we used NNs method and validated the retrievals with reanalysis from NWP model. Combining the NNs and the 1D-var retrieval algorithm, the temperature and water vapor density retrieval validation results are shown in
Figure 11.
According to the retrieval results during hurricane Matthew, it is concluded that MWHTS can be used to retrieve temperature and humidity at levels from surface to 100 hPa due to the weighting function distribution of multi-channel observation. This also offers a possibility for improving the retrieval accuracy of temperature and humidity profiles in the atmospheric layers using the MWHTS observations.
The retrieved temperature profiles from the combined algorithm show that the retrieval accuracy of MWHTS at levels from surface to 100 hPa was evenly distributed with a temperature bias less than 0.75 K, which is consistent with the peaks of 118 GHz channels. For the water vapor profile, the accuracy of surface and 750–550 was worse than other levels, and, due to the distribution of water vapor in troposphere, the upper levels had relatively smaller root mean square errors than the lower layers. The comparison study on the retrieved atmospheric temperature and water vapor using satellite observations provided the reference value for assessing the detection ability of 118.75 GHz oxygen line.
5.4. Data Assimilation with Retrievals and Radiance
We also conducted the following experiments: (1) Control trial (CTRL): Basic assimilation trial in which no radiance data from polar-orbiting instruments were assimilated. Assimilated observations were therefore only conventional observations. (2) Radiance trial (DA_MWHTS_118GHz and DA_ MWHTS_118GHz): Same as CTRL but with MWHTS 118 GHz and 183 GHz observations from FY-3C satellite added separately. (3) Retrievals trial (DA_ temperature and humidity profiles): Same as CTRL but with MWHTS retrievals added.
To explore the application of microwave sounding data in numerical prediction of typhoons and improve typhoon forecast, we assimilated data directly for numerical forecasting of the track and intensity for the case study of hurricane Matthew based on the WRF-3DVar system. The forecasted tracks were compared with other satellite observations. Results show that the initial fields of the numerical model were improved much more due to direct assimilation of FY-3C MWHTS observations than the assimilation of conventional observations alone. The model initial fields were more reasonable in reflecting the initial situation of typhoon circulation as well as temperature and humidity conditions, and typhoon central position was also adjusted. Therefore, the FY-3C microwave data could efficiently improve the numerical prediction of typhoons, and radiance assimilation showed more improvement than retrievals. Combining the simulation and observation of satellite-based microwave payloads, the prediction of hurricane path compared with the actual path from real monitoring, and the results are shown in
Figure 12.
6. Conclusions and Future Work
Theoretically, satellite radiance assimilation is superior to the retrieval assimilation because the uncertainties in the radiance observations are much smaller and more justified in direct radiance assimilation than in retrieval assimilation. This study demonstrated that a 118-GHz aircraft or satellite observations could provide useful information on the vertical thermal structure of the atmosphere. In addition, combined with the 183 GHz and window channels, water vapor profiles could be accurately retrieved and used in the data assimilation model, which can validate the positive impacts on forecast of extreme weather such as the hurricanes. This study also provided incremental gains in the analysis and forecast accuracy and brought new capacity to the 118 GHz channel through the deliverable of new cloud ice information in data assimilation model over only assimilating the 183 GHz radiance.
Nevertheless, accurate prediction of hurricane track and intensity change is still a challenging problem. Due to the lack of in situ data for hurricane initialization, initial vortices provided by large-scale analysis from operational centers are often ill-defined, too weak, and sometimes misplaced. The methodology presented in this study is a new attempt to provide more confidence on the satellite-based atmospheric profile applications in hurricane domains. In addition to the atmospheric temperature and humidity profiles, precipitation, as one of the MWHTS L2 products, will also be an available choice to improve the hurricane storm track density. For the study case, using microwave radiance of MWHTS is recommended, which can improve the forecasting track by 50 km combining atmospheric temperature and humidity information.


