1. Introduction
Owing to the characteristics of wide coverage, long duration, remote access, and high data collection volume, earth observation satellites play a key role in urban planning, traffic surveillance, geological exploration, disaster assessment, military reconnaissance, etc. Among these satellites, micro-nano satellites have the specific advantages of small size, low power consumption, short development cycle, suitable for networking and constellation, and low cost to complete many complex space missions. Therefore, micro-nano satellites have become the research hotspot in the fields of scientific research, national defense construction, and commercial application [
1,
2]. Global Maritime Domain Awareness (MDA) [
3] is one of the important applications of micro-nano satellites, and the periodic full coverage data of micro-nano satellites form the data basis for the extraction of target information in a large area. Ships are the main carrier of maritime transport, therefore the accurate position of ship target is of great significance and value for MDA.
The traditional processing flow of ship detection from remote sensing images consists of mission planning, satellite imaging, satellite-earth data transmission, and ground processing. The ground processing scheme has time delay for ground users, and the satellite-earth data transmission system is under tremendous pressure. There are two bottlenecks for the further development of micro-nano satellites, i.e., the hysteresis of satellite-ground mutual communication of massive remote sensing images and the low efficiency of traditional information processing. On-board processing in micro-nano satellites is an effective way to improve the response speed to emergencies and provide immediate products for users.
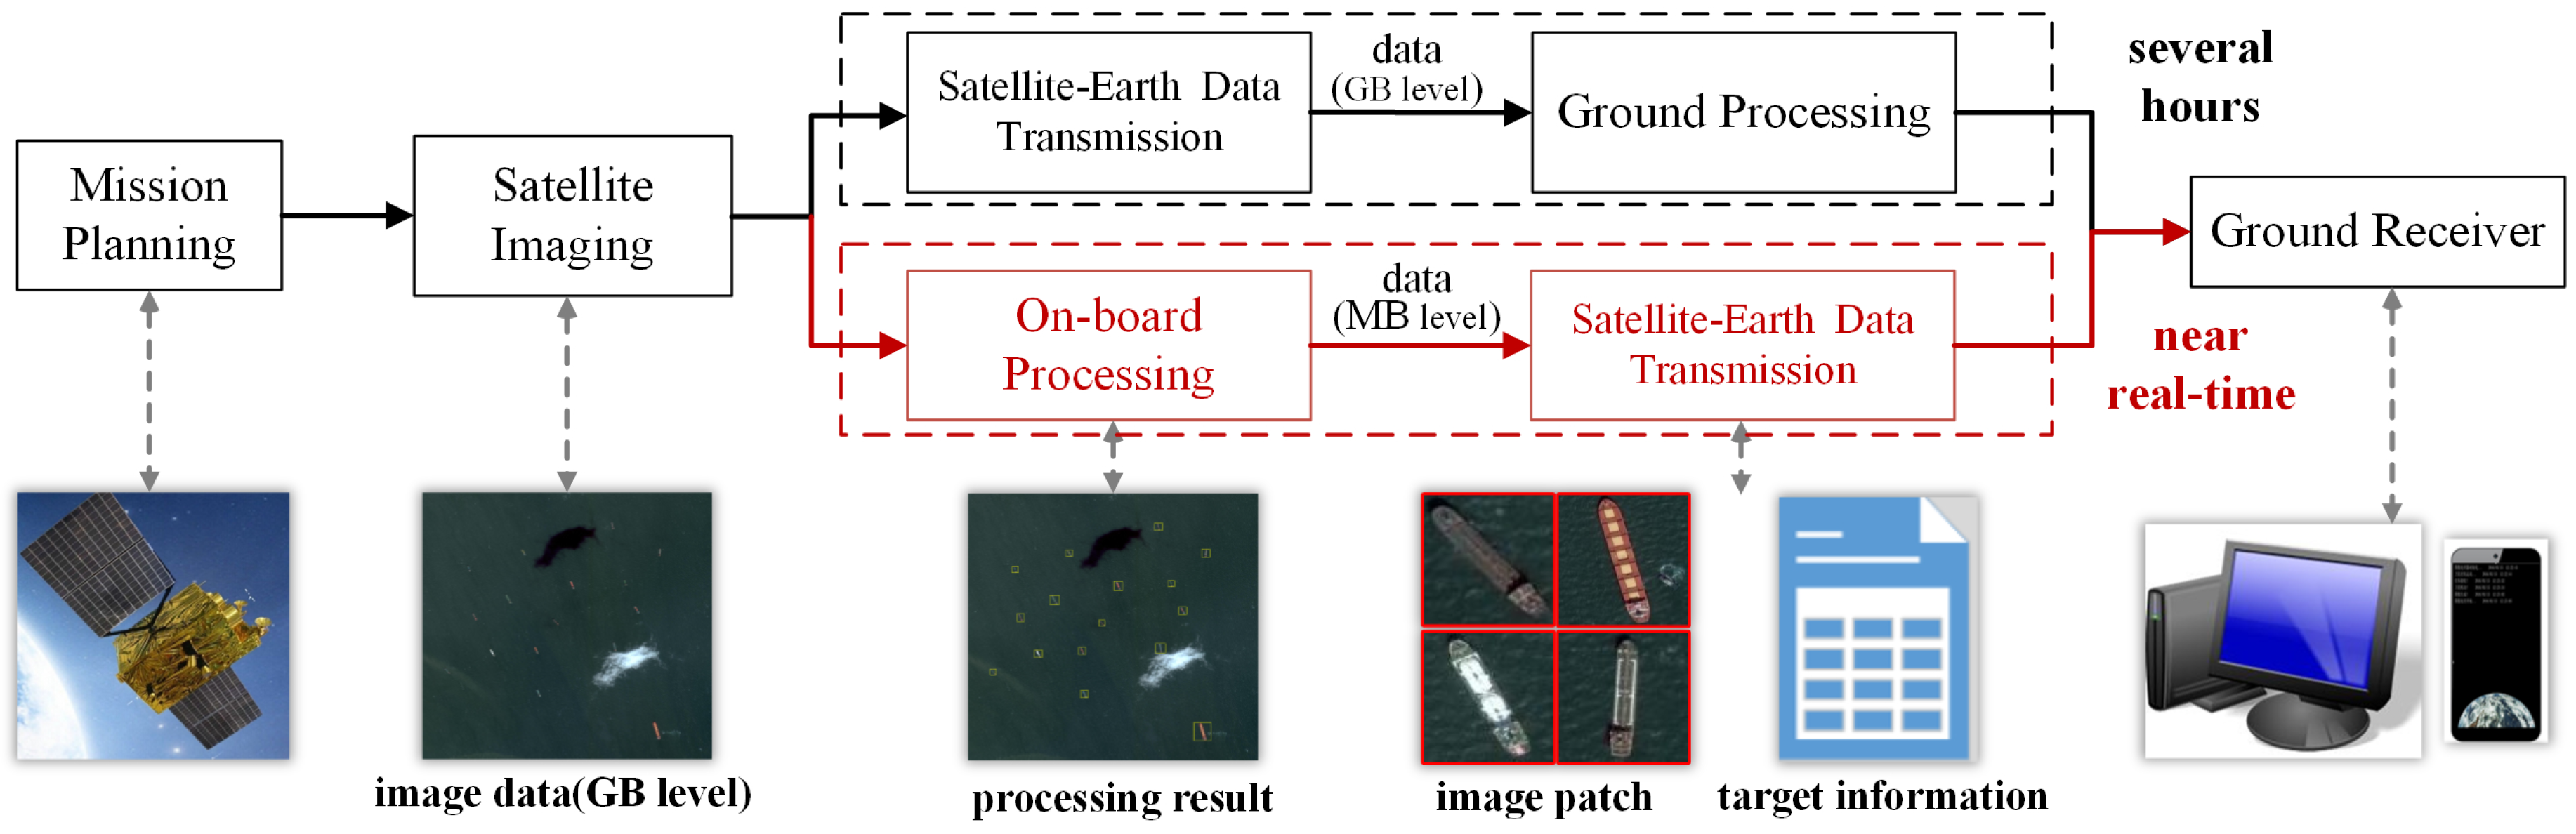
Figure 1 shows the comparison between on-board processing flow and the traditional ground processing flow. On-board image processing analyzes the remote sensing images directly on the satellite, and then only transmits the effective information to the ground receiver immediately. Compared with the traditional ground processing flow of ship detection, the advantages of on-board processing flow of ship detection are as follows: (1) the gigabyte level images are simplified to megabyte level target patches and information by on-board ship detection. It can reduce the compression, transmission and storage pressure for emergencies. (2) It simplifies the process of ground equipment and directly delivers the concerned information to users from the satellite. (3) Users can acquire information in near real-time while traditional processing flow needs several hours or days.
The core of on-board processing is the hardware architecture and the intelligent processing algorithm. Current on-board processing mainly applies the architecture of Field-Programmable Gate Array (FPGA) and Digital Signal Processor (DSP). Such architecture has limited computing capacity and the existing algorithms on the hardware architecture can only complete some simple tasks, such as image compression [
4], ortho-rectification [
5], point matching [
6], and preprocessing [
7]. With perceptually lossless compression methods [
8], the satellites may have the ability to downlink more images to ground. However, the volume of compressed images is still too large for limited downlinking bandwidth even under high compression ratio, especially for urgent tasks and micro-nano platforms. As for the intelligent processing algorithm, there are two main problems for ship detection on micro-nano satellite. One is on how to use the limited computing resources on the satellite to detect ships from massive images. The on-board resources are severely limited (configuration, power consumption, computing capability, etc.) due to the small size and weight of micro-nano satellites. The other one is on how to efficiently detect ship targets in a large area under complex scenes (cloud, fog, wave, island interference, etc.).
With the development of Commercial Off-The-Shelf (COTS) component, it has become an important way to reduce the cost and shorten the development cycle of micro-nano satellites, which has the advantages of low cost, superior performance, high integration and easy availability. For the past few years, cheap, compact, low-power and high processing performance modules are emerged, such as Jetson TX1 and TX2 by NVIDIA Corporation. These modules are very adequate for on-board processing of micro-nano satellites.
In the past decade, some traditional methods have been proposed for ship detection [
9,
10,
11,
12,
13]. Zhu et al. [
9] applied shape and texture features to extract the region of interest, and then a semi-supervised hierarchical classification was adopted to eliminate the false alarms. Shi et al. [
10] used anomaly detector and local shape feature to detect ships in a “coarse-to-fine” manner. Qi et al. [
11] developed an unsupervised ship detection method based on saliency and S-HOG descriptor. Yang et al. [
12] proposed a detection algorithm based on saliency segmentation and the local binary pattern descriptor combined with ship structure. Dong et al. [
13] constructed a hierarchical model based on multi-scale saliency, rotation-invariant feature, and trainable Gaussian support vector machine classifier. Most of these methods are designed on image segmentation and hand-crafted features, which may have poor performance in complex background.
In recent years, deep learning has achieved great success in computer vision [
14,
15,
16,
17]. The development of deep learning technology makes it possible to detect ships with high accuracy and high processing speed. The on-board ship detection algorithm needs to detect as many targets as possible with limited resources and take both the detection accuracy and model size into consideration. However, most of the previous ship detection methods [
18,
19,
20,
21,
22,
23,
24,
25,
26] detected ships on small image patches by high-power Graphic Processing Units (GPUs) on the ground, without considering the computing and storage resources for practical aerospace application.
To solve the problems above, this paper presents an on-board ship detection scheme based on COTS component and deep learning, which can be used to achieve near real-time on-board processing by micro-nano satellite computing platform. In addition, a ground demonstration and verification system is built to verify the feasibility and effectiveness of our scheme. Experimental results show that the proposed scheme has a good application prospect in micro-nano satellites with limited power and computing resources. The main contributions of this paper are three-fold.
We design an on-board ship detection scheme based on deep learning and COTS component. Different from the traditional ground processing flow, our scheme directly distributes the target patches and valuable information to ground users from micro-nano satellites, which can increase the response and processing speed, application ability, and the data utilization rate of micro-nano satellites.
We adopt the strategies of image cropping, square anchor, global average pooling, and BL-NMS to extract the target patches and information from remote sensing images. Compared to the previous ship detection methods, our method can achieve higher detection accuracy with a light weight model size, which meets the requirement of practical aerospace application with limited computational and storage resources.
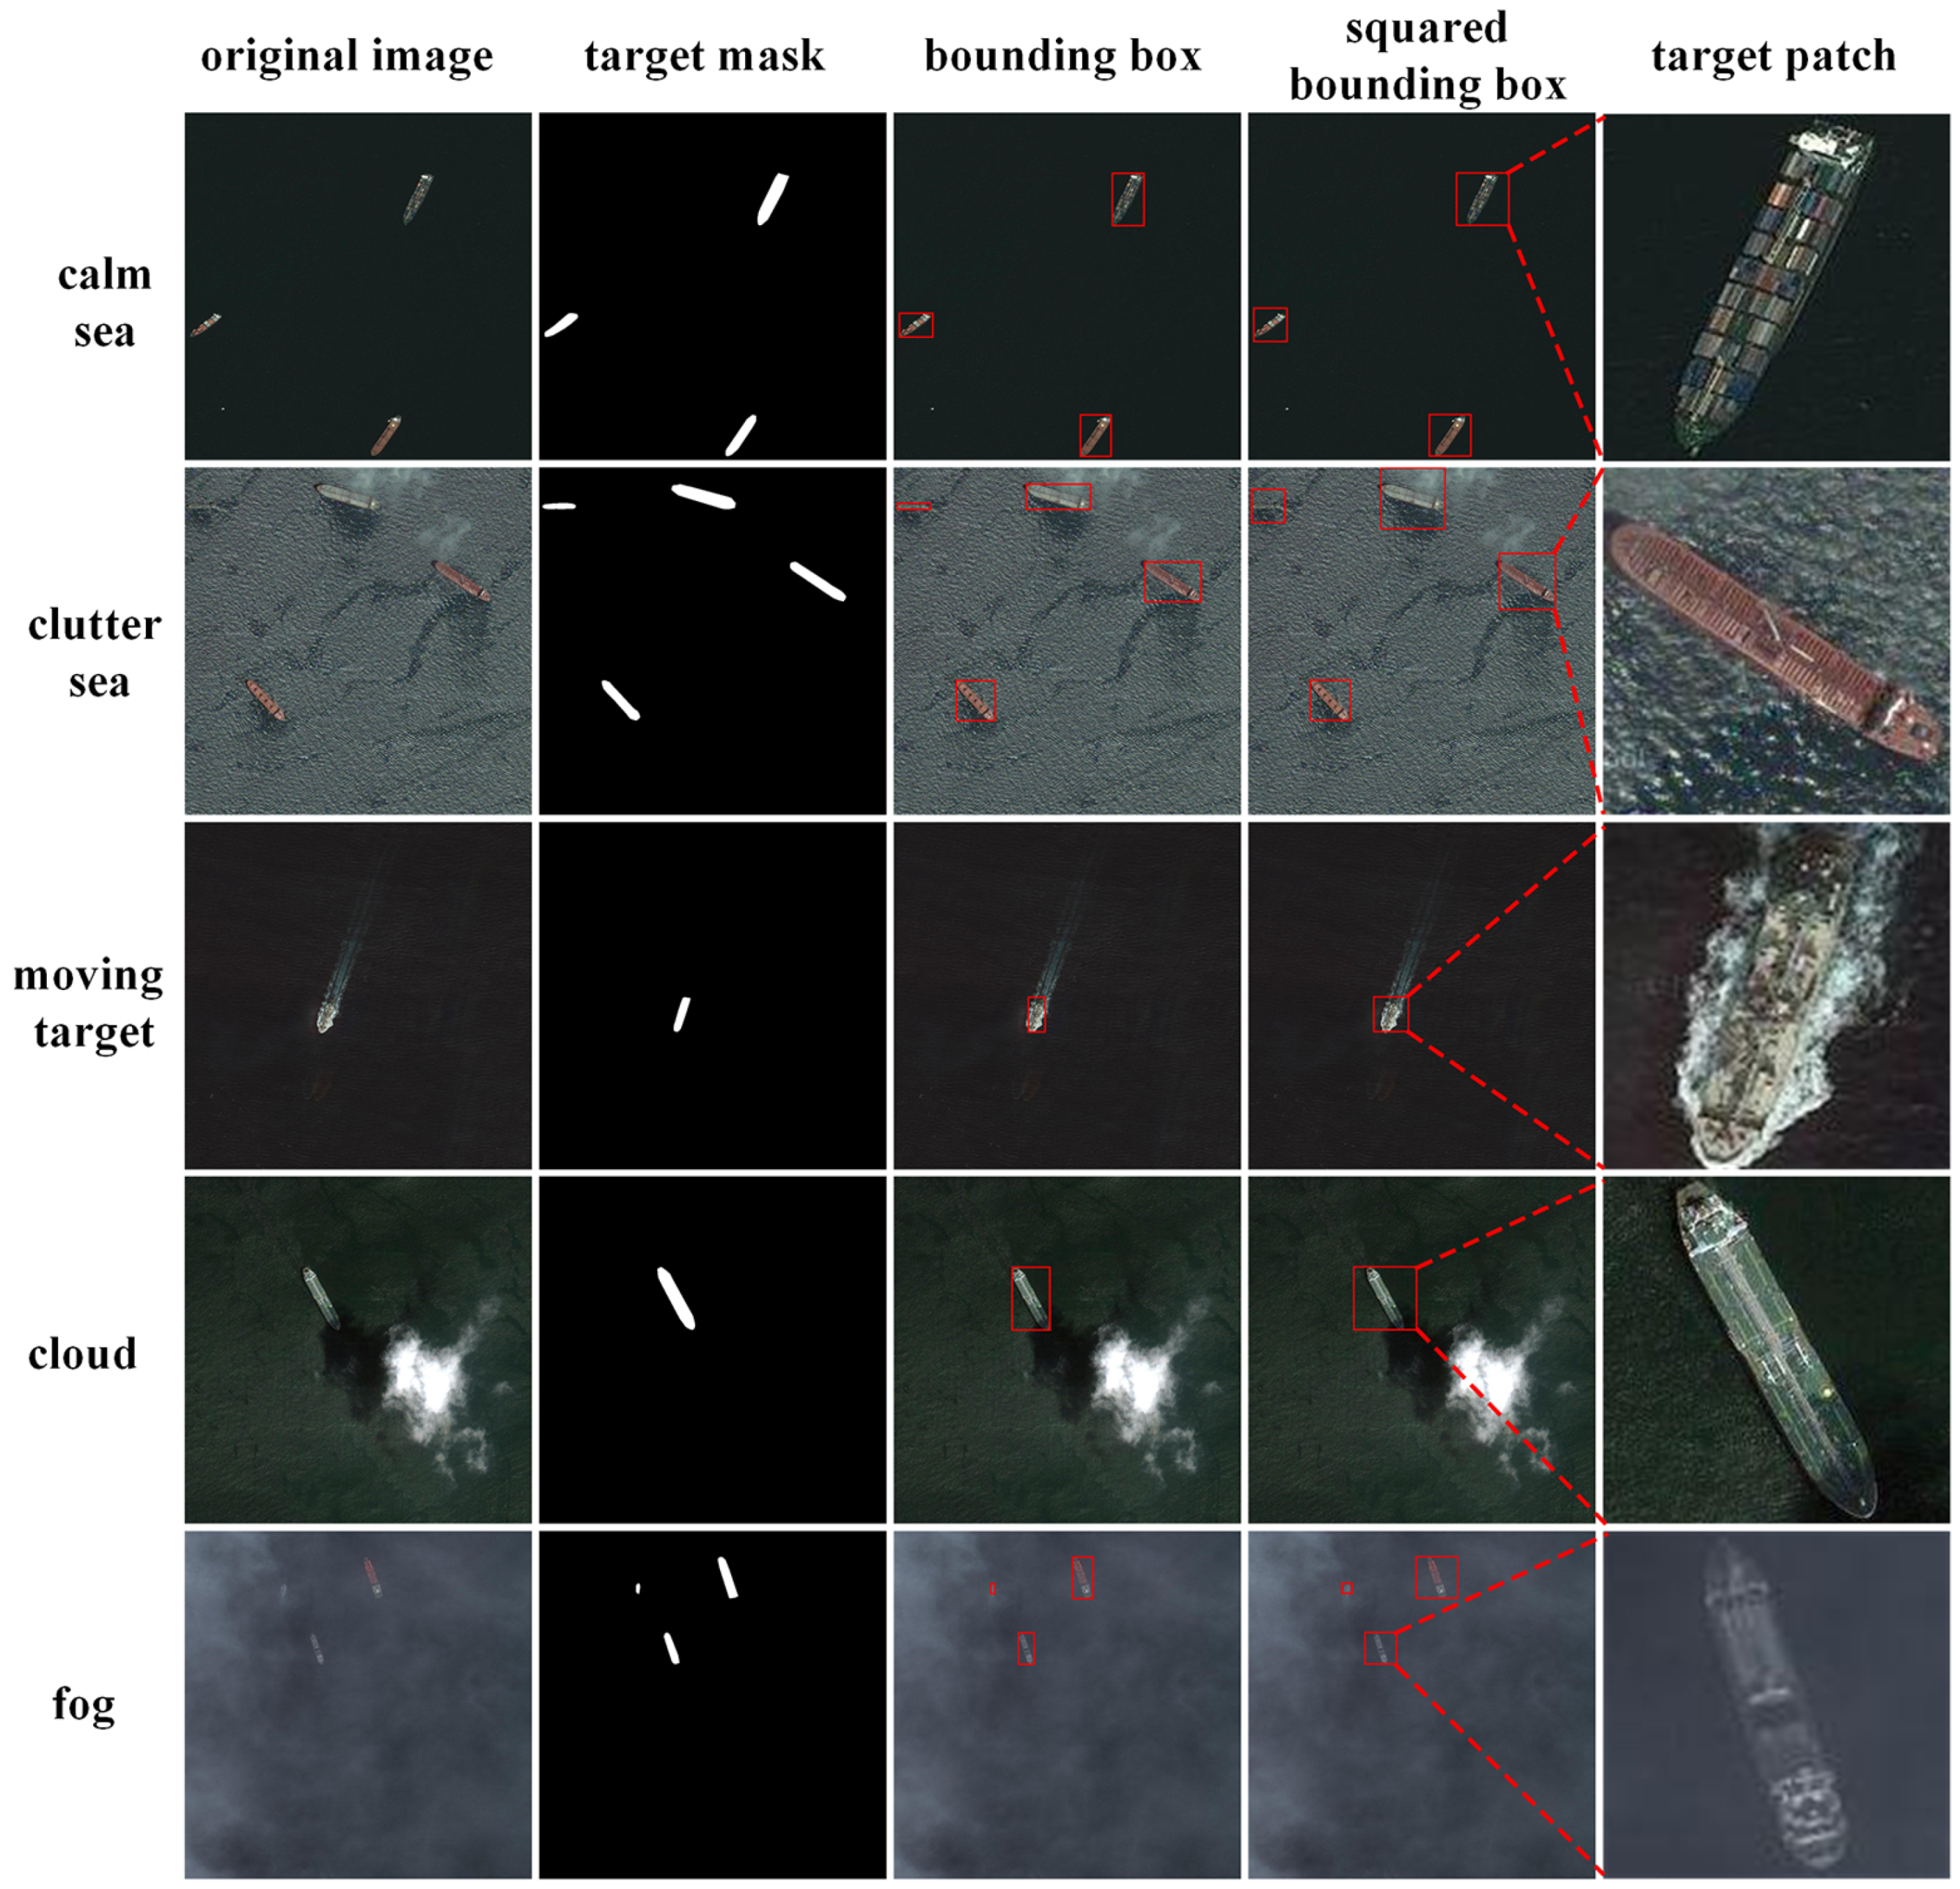
We collect a well-annotated dataset from Google Earth, which includes the binary mask, bounding box, and squared bounding box of each ship. The performance of the proposed scheme tested by a ground demonstration and verification system demonstrates that our scheme has a promising application prospect in on-board intelligence processing.
The rest of this paper is organized as follows.
Section 2 presents the details of our proposed ship detection algorithm.
Section 3 introduces the construction of micro-nano satellite computing platform.
Section 4 introduces the ground demonstration and verification system and experimental results are shown in
Section 5.
Section 6 discusses the practical application. Finally,
Section 6 concludes this paper.
2. On-Board Ship Detection Based on Deep Learning
In the fields of image classification and object detection, the Convolution Neural Network (CNN) has made a great breakthrough in performance and efficiency. AlexNet [
14] won the ImageNet Large Scale Visual Recognition Challenge (ILSVRC) [
27] 2012 by a large margin. After several years of development, the error rate of the winning scheme [
28] in ImageNet classification competition reached 3.57% in 2015, while the error rate of human is 5.1%. In recent years, deep learning technology has been successfully applied in various fields. Girshick et al. first proposed an object detection framework based on Region-based Convolutional Networks (R-CNN) [
29] in 2014, and then researchers proposed a series of object detection algorithms based on deep learning, such as Fast R-CNN [
30], Faster R-CNN [
16], You Only Look Once (YOLO) [
31], Single Shot MultiBox Detector (SSD) [
32], etc. These methods have surpassed the traditional algorithms in various object detection tasks.
Owing to the good performance of deep learning methods in object detection from natural scene images, an increasing number of methods based on deep learning are applied to remote sensing image processing. The deep learning algorithm has achieved good performance in the detection tasks of aircraft [
33], oil tanks [
34] and vehicles [
35] from remote sensing images. Deep learning based ship detection methods have also been proposed [
18,
19,
20,
21,
22,
23,
24,
25,
26]. These methods have achieved outstanding results in performance, but most of them deal with images on the ground without considering the computational and storage resources.
Compared with objects in natural scene image and other targets in remote sensing image, on-board ship detection from remote sensing images has the following difficulties:
Due to the limitation of the Graphic Processing Unit (GPU) memory, the large-scale remote sensing image should be cropped into image patches. For images of different sizes, object detection methods from natural scene image are usually performed by rescaling the long side of input image to a certain length, such as 800 pixels. As the size of remote sensing image ranges from several thousands to tens of thousands of pixels, it is not feasible to use the remote sensing images with high down-sampling rate.
The ship target varies from a few meters to a few hundred meters in length and has different directions. Since the ship target usually has a rigid body with symmetrical strip structure, it has a large aspect ratio.
The ship target has large intraclass variations. Due to different requirements, the structure of ship body is designed into different shapes, which presents great differences in remote sensing images.
The final detection bounding boxes need to be accurately located, and include the complete body of ship for further analysis in ground equipment. If the downlinked target patches miss ships or only include parts of ships, some valuable information will be lost.
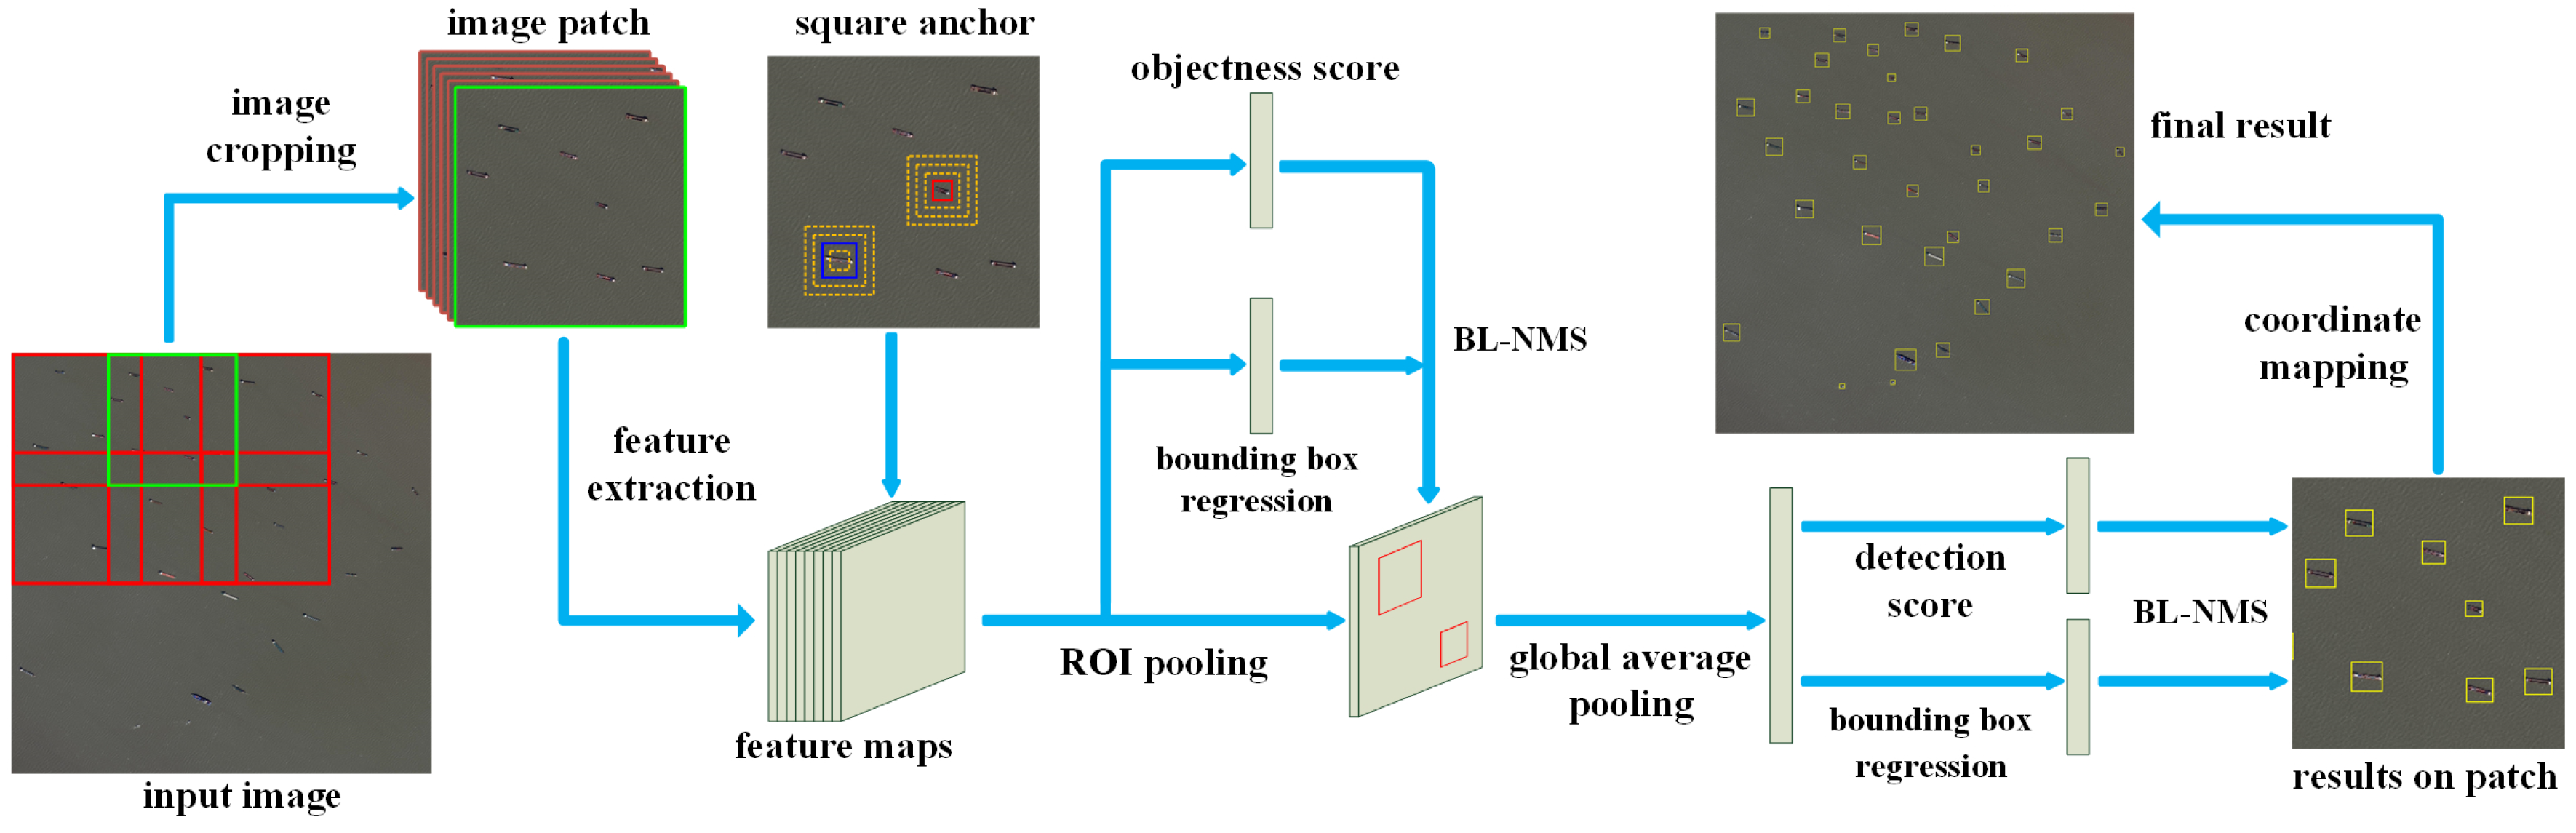
To solve these difficulties, we adopt the strategies shown in
Figure 2. We first crop the large scale remote sensing images into a series of 1024 × 1024 image patches, and then a lightweight model is employed to do feature extraction. The region proposals are generated by the Region Proposal Network (RPN) with square anchors. After Region of Interest (ROI) pooling layer and global average pooling layer, the bounding box regression and score of proposals are processed, followed by Bigger-Left Non-Maximum Suppression (BL-NMS) to remove redundant detection. Finally, the results in image patches are mapped into the input image coordinate to obtain the final result.
This paper focuses on ship detection on sea surface from optical remote sensing image. Compared with traditional synthetic aperture radar (SAR) images, optical images have the advantages of rich details and short revisit period. In addition, since the ships far away from the land has more important value than the inshore ship, our method mainly aims at offshore ships.
2.1. Image Cropping
Due to the large size of remote sensing images and the limitation of computing resources, we divide the large-scale remote sensing images into 1024 × 1024 image patches, which are used as the input images for training and testing. The longest existing ship is the Knock Nevis (458.45 m), which is an ultra large crude carrier from Singapore. In order to prevent the ship target from being cut off at the margin of patches, overlapping sampling is used during image cropping. The overlap step is set to 256 pixels in this paper.
2.2. Feature Extraction
Feature extraction is the basis of object detection and the quality of the features have great influence on follow-up tasks. With the higher performance requirements, the Zeiler and Fergus (ZF) [
36] and the visual geometry group (VGG) [
37] networks used in the original Faster R-CNN cannot meet the demand. Hence more CNN networks with better performance have been proposed in recent years, such as Residual Network (ResNet) [
28], Dense Convolutional Network (DenseNet) [
38], Squeeze-and-Excitation Network (SENet) [
39], etc. Due to the limited on-board computing and storage resources, we adopt ResNet-50 as feature extraction network, which has a good performance and light weight.
2.3. Region Proposal Network with Square Anchor
RPN is used to extract the target proposals, which applies the anchor mechanism to ensure that targets of different positions and orientations can be covered by the proposals. The key parameters in RPN are the size and aspect ratio of anchors according to the training set. The length range of the ship target is very large, so both small anchor and large anchor should be taken into consideration. The length-to-width ratio of a ship target is generally around 3.0 to 7.2. Since ship targets have random orientations, the aspect ratio of bounding box for ship may range from 1:8 to 8:1. However, anchors with multiple aspect ratios will increase the amount of calculation, and some types of anchors with limited positive samples will generate a large number of false alarms. After determining the size and aspect ratio of anchors, there are two principles for choosing positive samples from anchors. (1) The anchor is assigned as a positive sample if its Intersection-over-Union (IoU) overlap with any ground-truth boxes is greater than 0.5, since the correct detection can only be calculated when the IoU overlap of the final detection result and ground-truth boxes is greater than 0.5. Reference [
40] showed that the selection rules of training samples are closely related to the final detection results. (2) The anchor with highest IoU overlap with a ground-truth box is also determined to be a positive sample, in order to ensure that each target is covered by a positive sample at least.
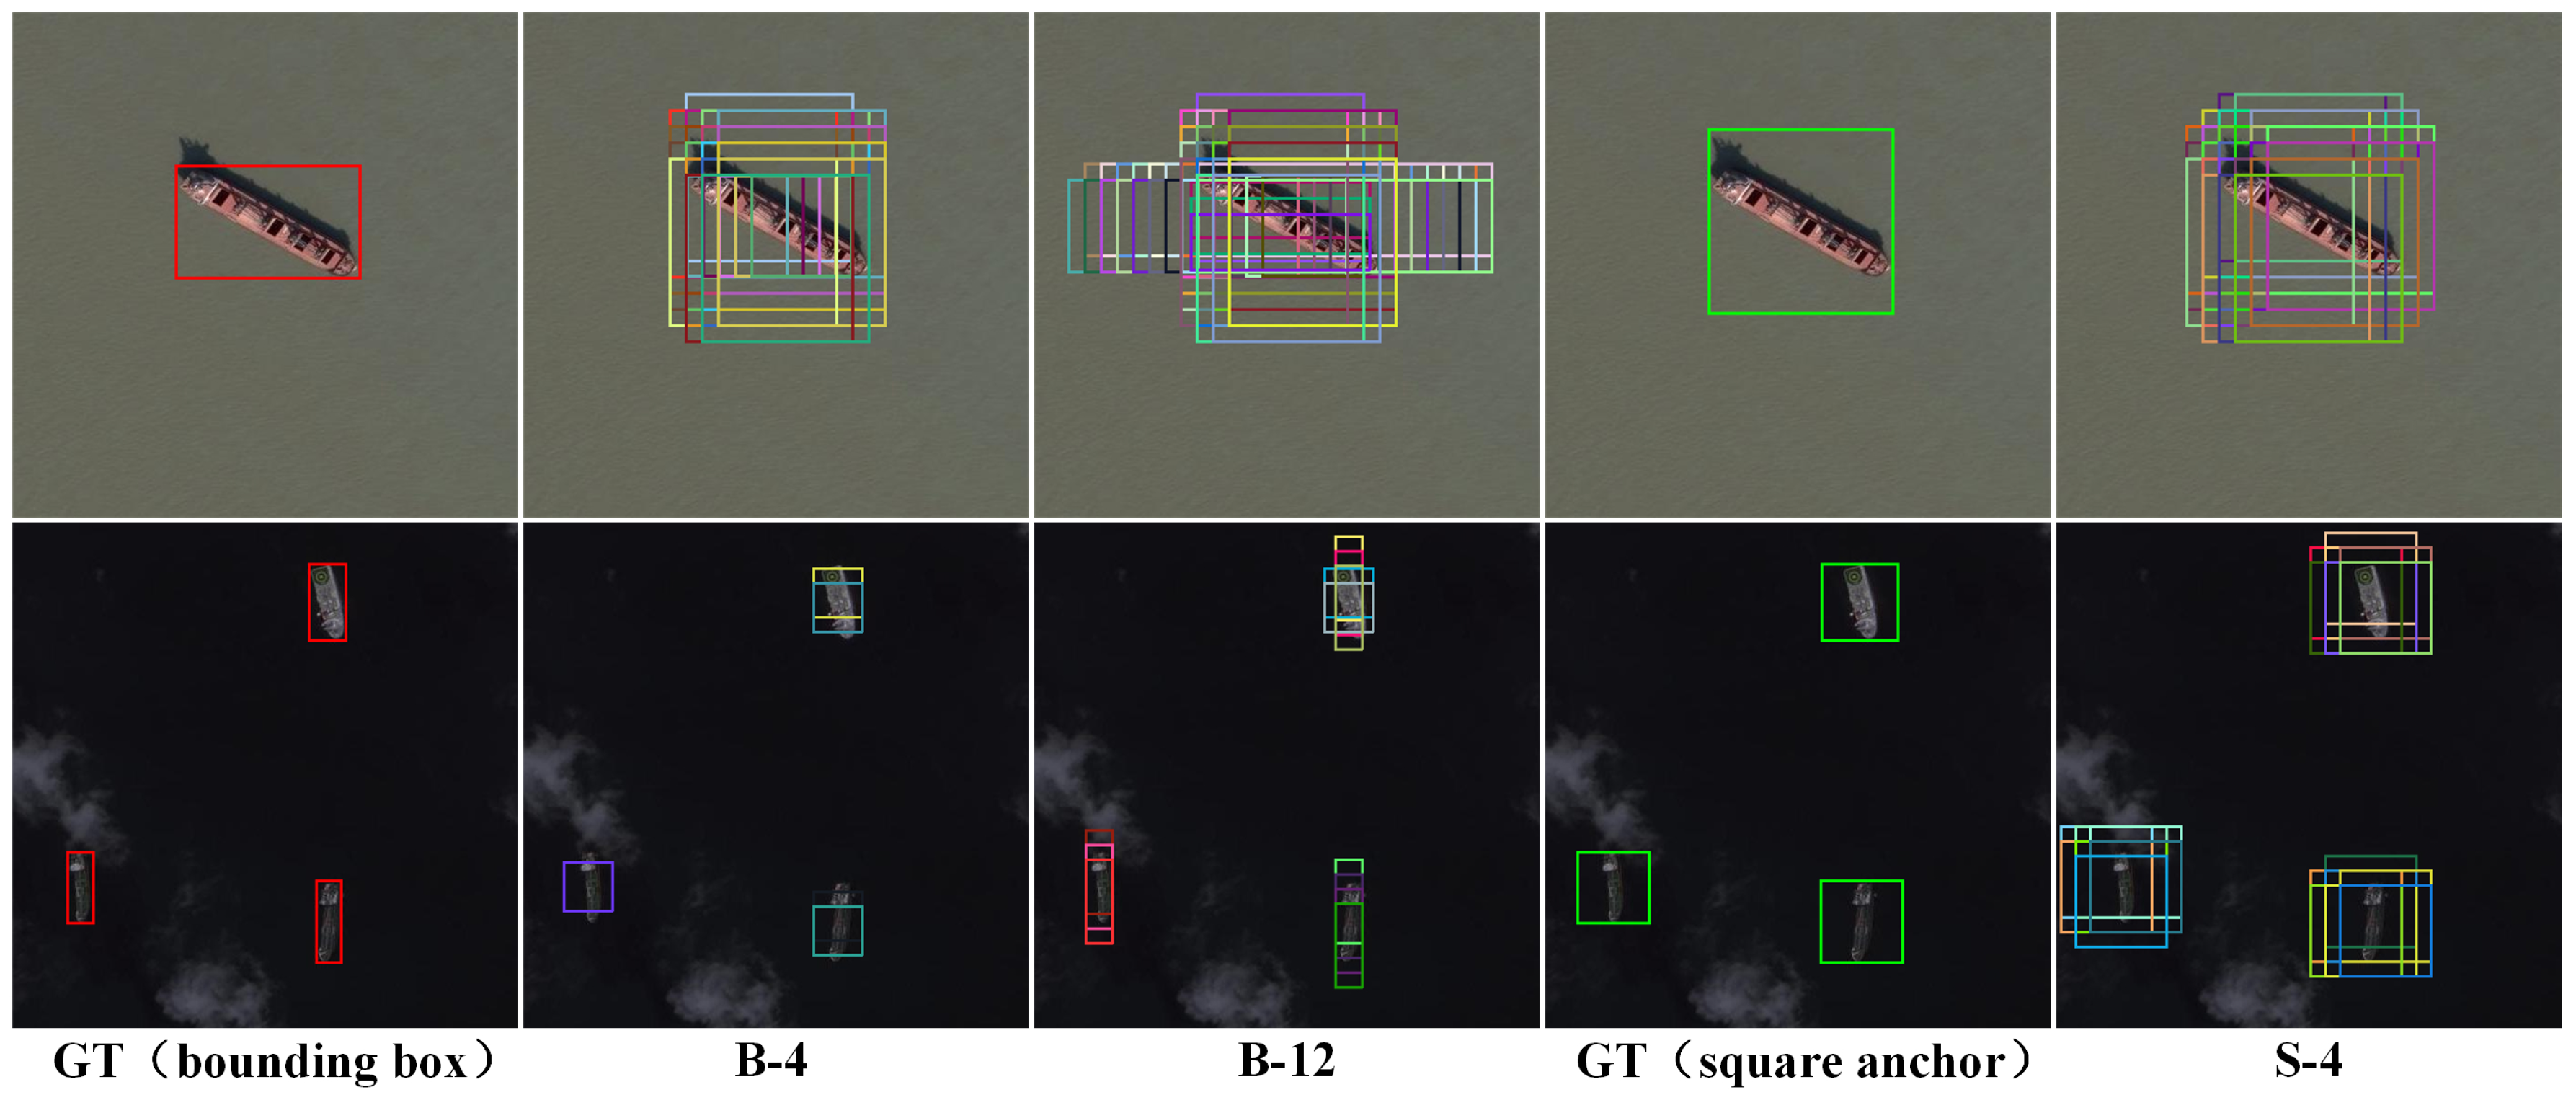
According to these two principles and the characteristics of large aspect ratio and wide size distribution of ship target, we design square anchors.
Figure 3 shows some positive samples of different types of anchors, where B and S represent original anchor and square anchor respectively, followed by the number of anchors. For the ships in training set, we use K-means to select four scales and choose three aspect ratios to adapt the rectangular target at the same time. As shown in
Figure 3, for the target orientation approximately 45
, the square anchors (aspect ratio is 1) have better positive samples. However, for the target orientation 90
(or 0
), B-4 cannot choose appropriate samples, and B-12 can select the positive samples close to the target. Compared with B-4 and B-12, positive samples of good quality can be selected by S-4 under various circumstances, which will provide good support for subsequent networks.
We form a multi-task loss function for training RPN, which is defined as follows
where
i is the index number of anchors,
is the probability that the image patch of the anchor
i is ship target,
is the ground truth label (1 represents that the anchor is positive sample, and 0 means that the anchor is non-ship target),
is the predicted position vector of candidate regions, and
is the ground truth for the position vector of the candidate region. The cross entropy loss function
is adopted to represent the classification loss of candidate regions.
is smooth L1 loss, which is counted for bounding box regression. The balance factors
and
are set as 1 and 10 respectively. In order to normalize each loss,
is the number of candidate regions to be classified, and
equals the number of positive samples selected from anchors.
The regression task of RPN is to regress four offset values,
, from an anchor to the corresponding ground truth. We adopt the parameterization for
t given in Reference [
16], where
t is defined as
where
x,
y,
w, and
h denote the bounding box’s center coordinates, width and height, and
,
, and
are the parameters of the predicted box, anchor, and ground-truth respectively.
2.4. Global Average Pooling
The parameters of Full Connection (FC) layers account for about 80% of the parameters of the whole network, resulting in a large model, which is not suitable for on-board applications. Therefore, the method of GAP [
41] is adopted after the ROI Pooling layer to reduce the parameters of the model. One advantage of global average pooling layer over the fully connected layers is that it is more native to the convolution structure and another advantage is that there is no parameter to optimize in the global average pooling, thus over-fitting is avoided at this layer [
41].
2.5. Bigger-Left Non-Maximum Suppression
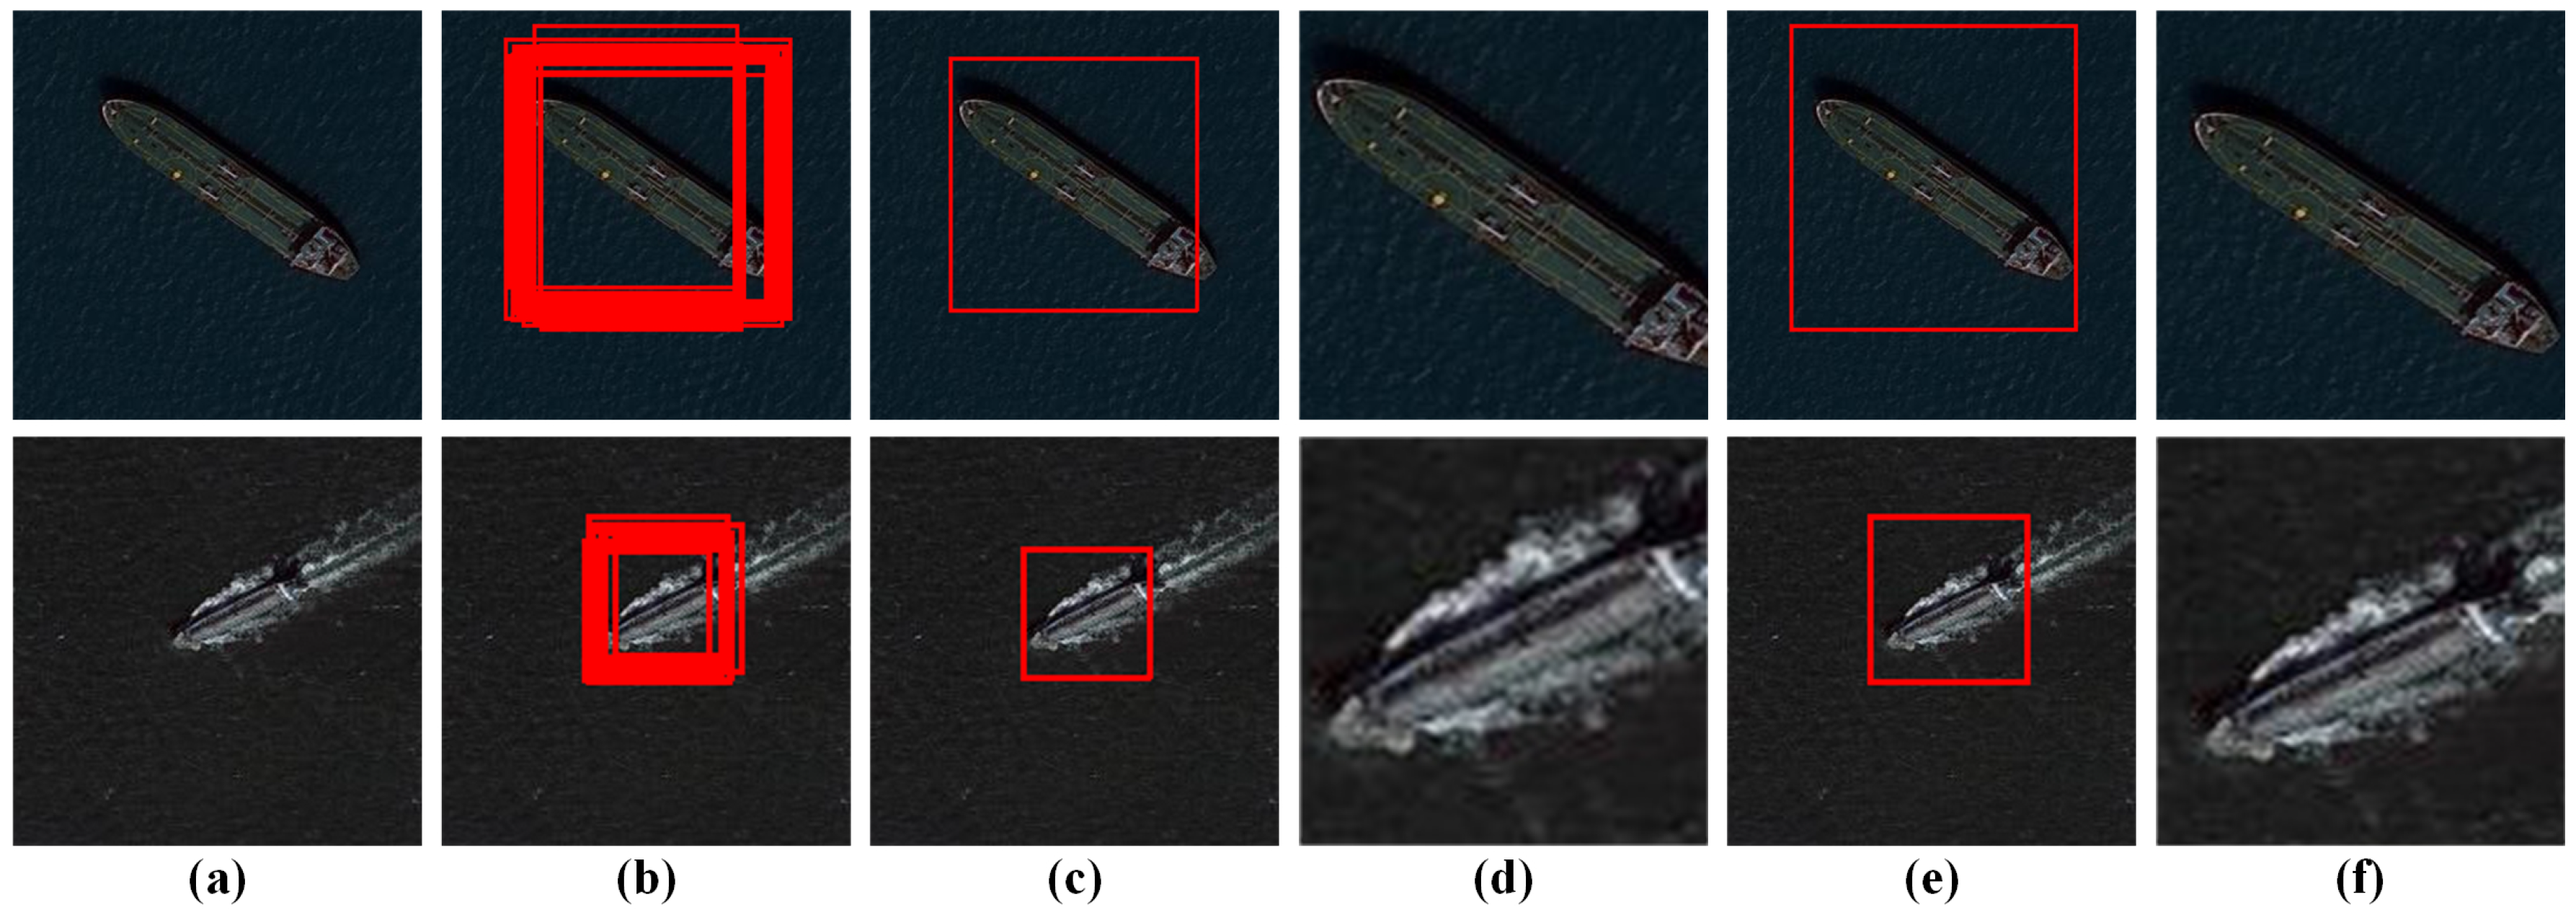
The output of the trained network will produce a large number of overlapping detection boxes, and the traditional algorithms usually adopt the NMS method to remove the redundancy. The NMS method is used to calculate the IoU overlap of two boxes according to the score of the detection boxes one by one. If the IoU overlap is greater than the threshold, the detection box with lower score will be removed. If the IoU overlap is less than the threshold, the two detection boxes will be retained. As shown in
Figure 4, the NMS method can remove a lot of overlapping boxes. If the box with high score cover the ship target incompletely, it will lead to the target patch only contains parts of ships, which influences the further recognition and analysis for ground users.
To reduce incomplete target patches, we use the method of BL-NMS. Algorithm 1 illustrates the process of BL-NMS in detail. Firstly, the traditional NMS method is employed to calculate the IoU overlap of two detection boxes. Then if the IoU overlap is greater than the threshold, the detection box with high score will be updated to a larger detection box that can fully contain the two detection boxes. Finally the detection boxes can contain more target areas to ensure that the target will not be truncated when all detection boxes are refined by BL-NMS.
Figure 4 shows the results of different NMS methods. The target patches by BL-NMS have a better coverage of ships than the target patches by NMS. In this paper, we choose 0.3 as the threshold of BL-NMS.
| Algorithm 1 Bigger-Left Non-Maximum Suppression (BL-NMS) |
Input: B is the list of detection boxes before BL-NMS, and S is the list of detection scores of each boxes.
is the list of detection boxes after BL-NMS, and T is the threshold of BL-NMS.
N is the number of detection boxes.
, , where and denote the positions for top-left and bottom-right points of detection boxes.
- 1:
whiledo - 2:
- 3:
= , = - 4:
- 5:
for in do - 6:
if IoU(, ) ≥ T then - 7:
, - 8:
- 9:
- 10:
end if - 11:
end for - 12:
end while - 13:
return, S
|
3. Construction of Computing Platform in Micro-Nano Satellite
3.1. The Integrated Information Flow of Platform and Payload
Micro-nano satellites refer to small satellites weighing less than 100 kg, such as SkySat, Flock-1 and so on. In 2017, 467 spacecrafts were launched around the world, of which 321 were micro-nano satellites (68.7%). A large amount of data for earth observation can be generated by micro-nano satellites, and these data will be downlinked when the satellites fly over the ground stations, which is not time-sensitive. Besides, the limited bandwidth of satellite-earth data transmission leads to many valuable images not downlinked to ground. This situation significantly limits the application ability of micro-nano satellites.
To alleviate the pressure of data transmission, the remote sensing image can be simplified by some on-board processing on the satellites. The small size of the configuration brings a variety of resource limitations on micro-nano satellites, such as power consumption, energy, computing power and so on. Therefore, it is difficult to achieve advanced tasks. At present, traditional on-board processing tasks are mainly focused on image preprocessing, mass data storage and format conversion, data compression, automatic analysis of original data and target feature extraction, etc. With the improvement of spatial resolution of remote sensing image and the sharp increase of data volume, it not only forms data basis for the higher information processing on the satellite, but also brings challenges to the performance, flexibility, power consumption and other aspects of the on-board processing technology.
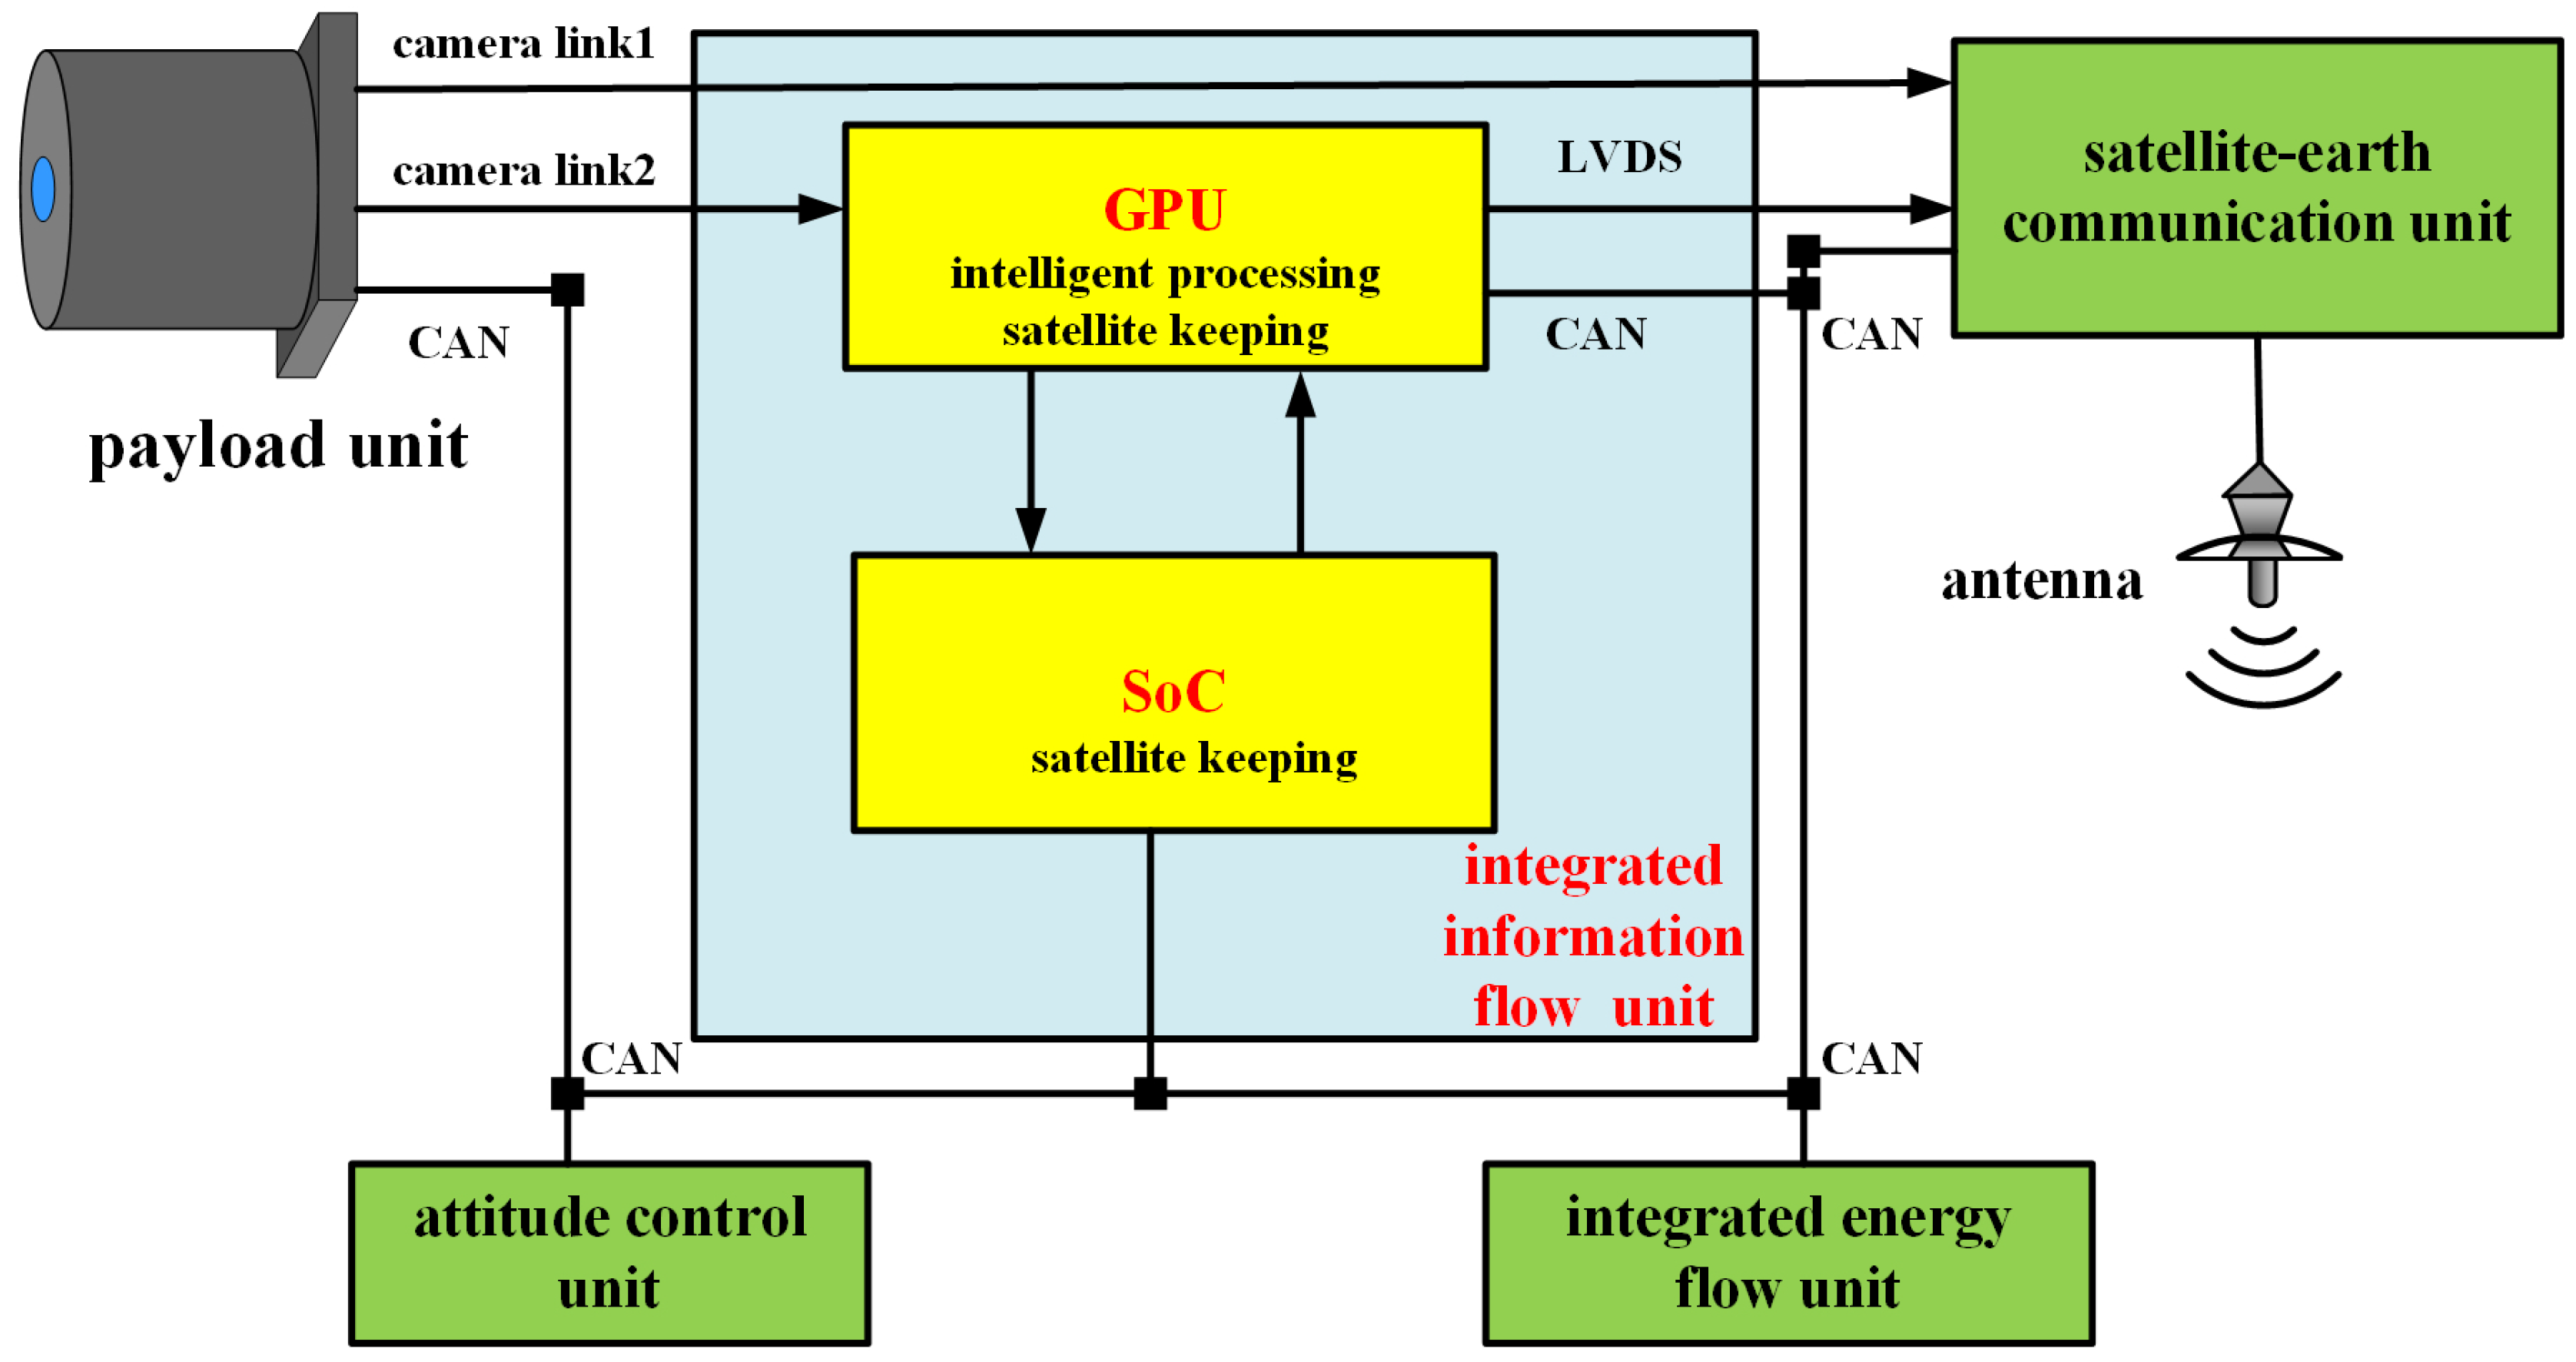
The integrated information flow of platform and payload is an effective method to improve the capacity of imaging and processing for micro-nano satellites. The technology has the advantages of improving the location precision for remote sensing image, reducing satellite quality, and reducing construction cost. We use heterogeneous backup of System on Chip (SoC) and Graphic Processing Unit (GPU) to meet the demand of the integration of information flow. SoC is utilized to achieve satellite platform and payload management and control with high reliability, including remote metering, remote control, attitude and orbit control, time management, payload management, recovery processing, etc. GPU with high-performance data processing capability is applied to do on-orbit real-time remote sensing image processing. Besides, the satellite can use the CPU embedded in the GPU processing module as the backup of SoC, not only ensure that satellite platform safe and reliable, but also meet the requirements of on-board high performance computing.
Figure 5 shows the hardware architecture of the integrated information flow. The information flow is interacted through CAN bus and satellite affairs, measurement, navigation and other functions are controlled through integrated information flow unit. The imaging of remote sensing payload unit is adjusted by integrated energy flow unit and attitude control unit, and then remote sensing images are transmitted to GPU and satellite-ground communication unit through camera link respectively. Target patches and information processed by GPU are transmitted to the satellite-ground communication unit through LVDS and then satellite-ground communication unit transmits these data to the ground receiver by antenna. The micro-nano satellite needs to choose the type of data (images or patches and information) with the limitation of the downlink capability.
3.2. The Commercial GPU in Integrated Information Flow Unit
Compared with traditional large satellites, micro-nano satellites do not need a long lifetime. The disadvantage of a short lifetime can be compensated by networking and constellation. Therefore, the COTS components with the characteristics of low cost, superior performance, high integration and easy access are very suitable for on-board processing in micro-nano satellites.
Embedded component Jetson TX2 by NVIDIA Corporation, which is a development board integrated four cores ARM Cortex-A57 CPU and 256 cores Pasal GPU, can achieve a trillion times floating point number operations per second on the Linux system. Jetson TX2 is technically designed for computer vision, deep learning and other fields with the same size of a credit card. Low cost ($599), low power consumption (less than 7.5 W), small size (50 mm × 87 mm), and light weight (85 g) are all suitable for on-board processing on micro-nano satellites. Jetson TX2 has the software environment for the development tools of deep learning, so the code and model of proposed method can be easily ported into Jetson TX2.
3.3. Intelligent Application
A variety of advanced on-board processing tasks can be realized through the high-performance processing platform, which can simplify massive remote sensing images into valuable information and greatly improve the data utilization rate. We receive near real-time downlinked data from satellite through the data service operation platform and analyze it in some intelligent application (APP). The received data will be graphically displayed by the graphical display module for the convenience of users. Through the monitoring and management software, the ground users can realize the monitoring of the data transmitted from the satellite and the communication supervision of the ground instructions uploaded to the satellite. Besides, the algorithm model and code of the new task can be uploaded to the information flow unit of the satellite through the satellite upload channel, so as to accomplish new applications.
4. The Composition of Ground Demonstration and Verification System
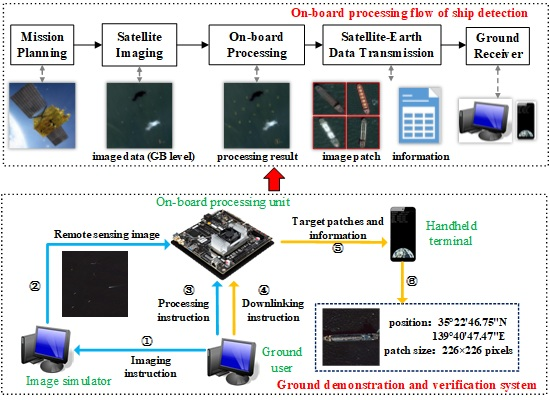
In order to verify the feasibility and effectiveness of the proposed scheme, we set up a ground demonstration and verification system. The operation process is shown in
Figure 6.
The ground users first determine the observation area according to the requirements, and then send an imaging instruction to the image simulator to simulate the function of payload imaging. After the image simulator selects the image of the relevant area, the image is transmitted to the on-board intelligent processing unit. When the imaging is completed, the ground users send a processing instruction to the on-board processing unit. Then, the on-board processing unit uses the proposed method to detect ship target from the image. The target slices and information are extracted from the large-scale image in one minute. After the on-board processing, the ground users send a data transmission instruction to the on-board intelligent processing unit to transmit the target patches and information to the ground handheld terminal. Finally, the users can check the target patches and information through intelligent APP. The following is the introduction of each device.
4.1. Ground User Equipment
According to the requirements of different tasks, the ground user equipment completes the functions of intelligent processing application scene configuration, parameter configuration and instruction control with the remote sensing satellite. The application scene configuration is to select the specific algorithm, and parameter configuration includes satellite data information, the selection of intelligent algorithm model and the data transmission mode. Instruction control includes image simulation, data generation, intelligent processing and product generation instruction.
4.2. Image Simulator
The image simulator is used to simulate payload imaging and its main function is to provide remote sensing images for the entire system. It includes two different methods to generate the required images. One is to directly use the real remote sensing data as input data, and the other one is to combine the task requirements and the image synthesis method in Reference [
42] to generate simulation images for application scenes. The latter method is applied to deal with the unusual scenes and enhance the generalization of the proposed algorithm.
4.3. On-Board Processing Unit
The processing unit on the satellite is the core of the ground demonstration and verification system. This module uses Jetson TX2 combined with deep learning algorithm to simplify a large amount of remote sensing data into the information required by users, which improves the utilization rate of data and reduces the pressure of data transmission. The code and trained model of proposed scheme need to be stored in the intelligent processing unit before the operation of the system. Since the model and code can be updated or replaced in the information flow unit through the upload channel, the whole framework can also be applied to other high-level tasks, such as other target detection, change detection, terrain classification, etc., which can greatly improve the application ability of micro-nano satellites.
4.4. Ground Handheld Terminal
The ground handheld terminal mainly displays the processing results obtained by the on-board processing unit on the satellite. In the form of APP, the target patches and information outputted by the on-board processing unit are displayed on the handheld terminal to verify that the whole system is working properly. By receiving target patches and information, the user can further analyze the target’s attributes and higher-level tasks, such as type classification, size measurement, and analysis of motion state.
6. Discussion
Many experiments in
Section 5 verify the validity of the proposed scheme. We can use the Jetson TX2 as a part of integrated information flow unit in micro-nano satellite and achieve on-board ship detection algorithm through the unit.
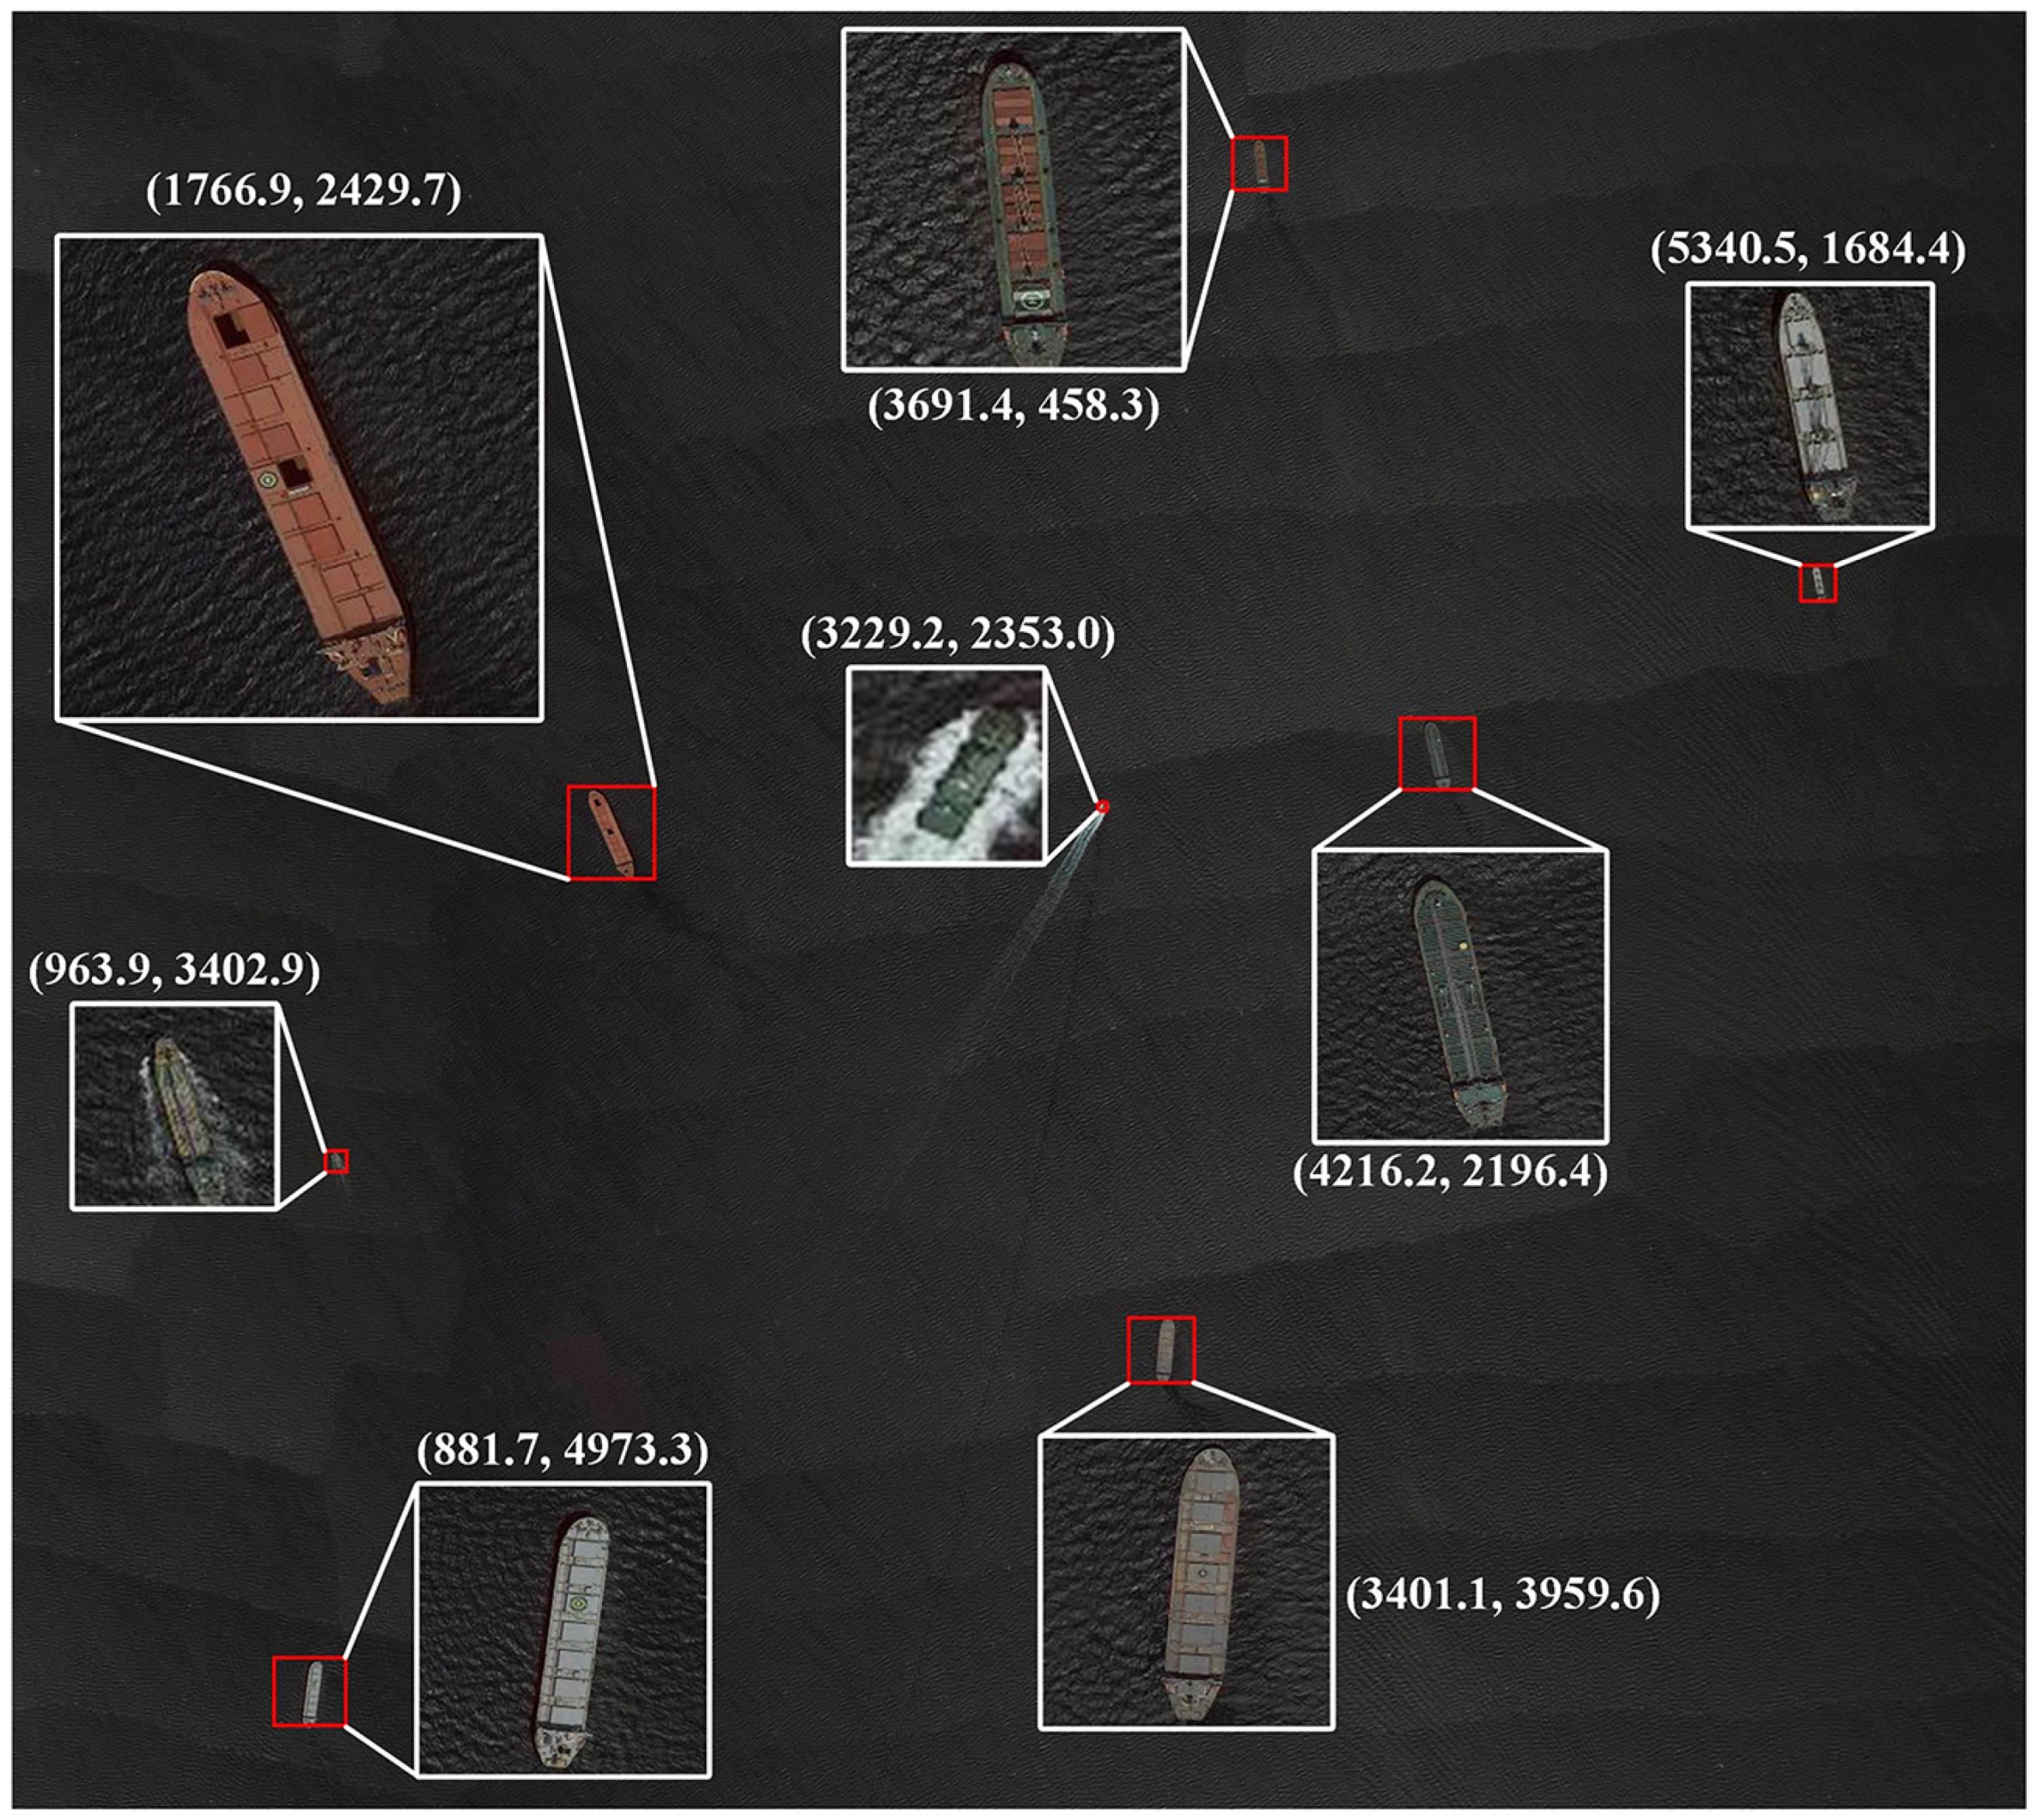
Figure 8 illustrates an example for the result of our scheme. The red boxes are the detection results of our ship detection method and the white boxes are the target patches extracted by our network. The two numbers are the image coordinates of the central point for each ships and they will be converted into geographic coordinates through coordinate conversion. The target patches and geographic coordinates are transmitted to the ground receivers. As shown in
Figure 8, our scheme has good performance both in detection and patch quality and the results verify the effectiveness of strategies in our scheme. The file size of the image is 90.6 MB while the target patches and information are 810 KB in total. The reduction in file size is the biggest advantage of on-board ship detection, which helps to alleviate the pressure of satellite-ground mutual transmission and ground receivers.
For some emergencies, the ground users can control several micro-nano satellites in networking or constellation to obtain the raw remote sensing images over the areas focused on. Then the on-board ship detection algorithm is applied to extract the target patches and information from these raw remote sensing images. Finally, the target patches and information are transmitted to the ground user by relay satellites or other methods in a short time, which can improve the response speed to emergencies. Some perceptually lossless compression methods can be used to achieve image compression for target patches, which can further reduce the file size of target patches. The ground users can make better decisions to deal with emergencies by these valuable data. For other cases, the micro-nano satellites downlink the raw remote sensing images to the ground when the satellites fly over the ground stations. The raw data can be used for other purposes.
To achieve other on-board tasks, the users should store the programs and models in the integrated information flow unit on the ground. During the micro-nano satellites operating in orbit, the programs and models for new tasks can also be updated or uploaded to the satellite through the satellite upload channel. The micro-nano satellites can achieve many on-board intelligent processing tasks by the computing platform proposed in our scheme, which greatly improves the application ability of micro-nano satellites.


