Article

Interoperability of Direction-Finding and Beam-Forming High-Frequency Radar Systems: An Example from the Australian High-Frequency Ocean Radar Network

Ocean Graduate School and the UWA Oceans Institute, The University of Western Australia, 35 Stirling Highway, Crawley, WA 6009, Australia
*
Author to whom correspondence should be addressed.
Remote Sens. 2019, 11(3), 291; https://doi.org/10.3390/rs11030291
Submission received: 31 December 2018 / Revised: 25 January 2019 / Accepted: 28 January 2019 / Published: 1 February 2019
(This article belongs to the Special Issue Ocean Radar)

Abstract

:
Direction-finding SeaSonde (4.463 MHz; 5.2625 MHz) and phased-array WEllen RAdar WERA (9.33 MHz; 13.5 MHz) High-frequency radar (HFR) systems are routinely operated in Australia for scientific research, operational modeling, coastal monitoring, fisheries, and other applications. Coverage of WERA and SeaSonde HFRs in Western Australia overlap. Comparisons with subsurface currents show that both HFR types agree well with current meter records. Correlation (R), root-mean-squares differences (RMSDs), and mean bias (bias) for hourly-averaged radial currents range between R = (−0.03, 0.78), RMSD = (9.2, 30.3) cm/s, and bias = (−5.2, 5.2) cm/s for WERAs; and R = (0.1, 0.76), RMSD = (17.4, 33.6) cm/s, bias = (0.03, 0.36) cm/s for SeaSonde HFRs. Pointing errors (θ) are in the range θ = (1°, 21°) for SeaSonde HFRs, and θ = (3°, 8°) for WERA HFRs. For WERA HFR current components, comparison metrics are RU = (−0.12, 0.86), RMSDU = (12.3, 15.7) cm/s, biasU = (−5.1, −0.5) cm/s; and, RV = (0.61, 0.86), RMSDV = (15.4, 21.1) cm/s, and biasV = (−0.5, 9.6) cm/s for the zonal (u) and the meridional (v) components. Magnitude and phase angle for the vector correlation are ρ = (0.58, 0.86), φ = (−10°, 28°). Good match was found in a direct comparison of SeaSonde and WERA HFR currents in their overlap (ρ = (0.19, 0.59), φ = (−4°, +54°)). Comparison metrics at the mooring slightly decrease when SeaSonde HFR radials are combined with WERA HFR: scalar (vector) correlations for RU, V, (ρ) are in the range RU = (−0.20, 0.83), RV = (0.39, 0.79), ρ = (0.47, 0.72). When directly compared over the same grid, however, vectors from WERA HFR radials and vectors from merged SeaSonde–WERA show RU (RV) exceeding 0.9 (0.7) within the HFR grid. Despite the intrinsic differences between the two types of radars used here, findings show that different HFR genres can be successfully merged, thus increasing current mapping capability of the existing HFR networks, and minimising operational downtime, however at a likely cost of slightly decreased data quality.

1. Introduction

Shore-based high-frequency radar (HFR) systems, operating in the frequency range between 3–30 MHz, are extensively used to remotely sense ocean currents in coastal areas, and for operational purposes [1]. More than 100 HFR systems are presently in operation in the US [2], with increasing numbers of installations in the Asia-Pacific region [3,4] and Europe [5,6]. Extensive analyses have proven the general reliability and limitations of HFR systems, including their ability to record oceanographic features at different spatial and temporal scales, their usefulness for the validation of numerical circulation models, and the potential for search and rescue purposes [7,8,9,10,11,12,13,14,15,16,17]. The commercial direction-finding (SeaSonde) and phased-array (WEllen RAdar, or WERA HFR systems, provided respectively by Codar Ocean Sensors (COS) and Helzel MessTechnik [18,19], are the most commonly deployed systems, although other HFR systems, such as the PISCES developed by Neptune Radar Ltd, or the Least Expensive RAdar (or LERA) HFRs, are also available (e.g., [3,20]).
High-frequency radar systems rely on the Doppler shift of a radio wave signal transmitted to the ocean and backscattered from resonant Bragg-matching ocean waves. SeaSonde systems transmit a frequency-modulated interrupted continuous wave (FMICW) pulse from an omnidirectional vertical antenna and use a compact antenna system (two orthogonal loops and a monopole element) in combination with a direction-finding algorithm to resolve the azimuth of the incoming signal on a polar grid [21]. At frequencies above 13.5 MHz, the transmit and receive elements can be combined in a single element with significant improvement on system compactness. At lower frequencies, separate transmit and receive elements are required, typically spaced one radar wavelength apart.
Phased-array WERA HFR systems transmit a frequency-modulated continuous wave (FMCW) pulse from a phased-array transmitter, usually composed of four vertical elements in a rectangular arrangement. A linear array of up to 16 elements, each typically spaced 0.45 radar wavelengths apart, is used to resolve the bearing of a signal through a beam-forming approach [22]. Decoupling between the transmit and receive array is achieved through physical separation of the two arrays.
Direct comparisons between different types of HFR systems, in general, and between SeaSonde and WERAs in particular, are limited in number and temporal duration, with the majority performed about 20 years ago when the technology was less mature. This was also acknowledged in Reference [23], where an extensive comparison between SeaSonde and WERA HFR deployed in the West Florida shelf was conducted, and a comprehensive review of previous inter-comparisons was also given. For the sake of documentation, a summary of the reviews and the main findings from Reference [23] are presented here. Simultaneous current measurements from SeaSonde and beam-forming ocean surface current radars (OSCRs) were collected in Monterey Bay and compared against two days of acoustic Doppler current profiler (ADCP) observations at a 9-m depth collected in May 1995 [24]. Multifrequency phased-array radars, OSCRs, and SeaSonde HFRs were deployed to measure the Chesapeake Bay outflow plume over a six-week experiment [25]. When compared to near-surface (2-m depth) measurements, multi-frequency phased-array data were found to be accurate within 10 cm/s [26]. A direct comparison of direction-finding and beam-forming accuracy was performed in 1996 between CODAR and WERA HFR along the German coasts [27]. Additional comparisons between CODAR, WERA, and point-wise current meter data were undertaken in the same region in 2000 [28]; root-mean-square difference (RMSD) values ranged between 14–15 and 11–13 cm/s for CODAR and WERA radial velocity components, respectively. Compared to more recent findings, statistics were generally poorer in the earlier studies (see [1,24,25,26,27,28,29]).). Reference [23] for instance reported RMSD in the range 5.1–9.2 and 3.8–6.5 cm/s for hourly-averaged SeaSonde and WERA HFR radial velocities over a three-month period in a low-energy shelf. As suggested in Reference [23], this may be due to a number of factors, such as improved reliability of in situ current meter data, and advancements in the HFR processing algorithms [30,31,32]. Validation with ADCP data and inter-comparisons between SeaSonde and phased-array systems (not commercial WERA systems) have also been performed in other regions (e.g., [33]). The reported RMSD values between HFR and ADCP data were in the range (6.62, 11.3) cm/s for current velocity, and in the range (5.75, 13.7) cm/s for hourly-averaged radial velocity.
In the present work, we use Reference [23] as a starting point and extend the analyses to the combined SeaSonde–WERA HFR data, with the aim of proving the compatibility and interoperability of the two HFR types, for instance in case of downtime of one or more HFR components in an observing network. While merging radials from different frequencies appears to be a common practice (especially for SeaSonde HFR systems; see for instance Reference [29]), to our knowledge this is the first attempt to combine radial data from different HFR types and estimate the accuracy of the resulting vector maps for operational purposes.
The importance of this analysis is straightforward, considering the increasing number of deployments around the globe and the potential to fill in gaps in cases of operational downtime in an observing network without the need to apply gap-filling or optimal-interpolation techniques.
The paper is organized as follows. The Australian HFR network is introduced in Section 2, along with the data analysis approach and a description of the validation metrics. Subsurface current meter data are also introduced in this section. Results are given in Section 3, followed by sections containing a discussion of the main findings and the conclusions.

2. Materials and Methods

The Australian Ocean Radar facility is part of the Integrated Marine Observing System (IMOS), a national collaborative research infrastructure tasked with collection and dissemination of ocean data [34]. The facility, based at the University of Western Australia, manages both direction-finding (SeaSonde) and phased-array (WERA) HFR systems. Long-range (9.335 MHz) WERA and long-range (4.463 MHz) SeaSonde HFR systems, with overlapping coverage, are in operation in the Rottnest (ROT) Shelf and Turquoise (TURQ) Coast (Western Australia, WA; Figure 1).
Separate intermediate range (13.5 MHz) WERA and long-range (5.2675 MHz) SeaSonde HFR stations are located at Coffs Harbor (COF) and Newcastle (NEWC), New South Wales (NSW). Long-range (9.335 MHz) WERA HFR systems are also operational in the South Australian Gulf (SAG) regions. Additional details on operational settings, such as frequency band and bandwidth, accuracy levels, and quality-control (QC) procedures specific to the WERA HFR systems, and main limitations of the Australian HFR systems, including strong interference within the operating frequency bands, are provided in References [34,35].
The primary product of the HFR network is ocean current maps; waves and winds can also be obtained where the phased-arrays systems are installed. Radar data, freely available from the IMOS portal (https://portal.aodn.org.au/), are used for scientific research, operational modeling, coastal monitoring, fisheries, and other applications [36,37,38,39,40,41,42].
The two SeaSonde systems deployed in WA are located at Lancelin (LANC; 31°01.588′S, 115°19.708′E) and Green Head (GHED; 30°04.393′S, 114°58.003′E) (Figure 1). Both stations operate at a central frequency of 4.463 MHz with a 25-kHz bandwidth, 512-point fft, 1-Hz sweep rate, 20-min Doppler spectra averaging with 15 min output rate. At the operating frequency, measurement depth is approximately 2.5 m.
The standard software provided by the manufacturer is used to invert radial maps from the ocean Doppler spectra; hourly radial velocity data within the radar coverage were obtained by averaging around the cardinal hour a sequence of observations collected within an 80 min interval. The final output was produced every 60 min. At least two radial observations were required at each range and bearing in the final radial map.
To avoid mutual interferences between SeaSonde systems, transmitted chirps are synchronized between the two systems. The nominal angular resolution was set to 2°; calibrated antenna patterns were used at both stations, and provided an angular coverage of 180° and approximately 150°, respectively. To avoid interference to primary users, transmit power was limited to 8 W; maximum operational range exceeded 200 km offshore which reduced to 50 km or less with a typical day-to-night variability.
Two WERA systems, located at Guilderton (GUI; 31°20.4960′S, 115°29.3640′E), and Fremantle–Port Beach (FRE; 32°20.0198′S, 115°44.7480′E) constitute the Rottnest Shelf (ROT) deployment in WA (Figure 1). Both sites use a four-element transmitter array, and a receive array of 16 equally-spaced elements. The systems operate at 9.335 MHz with a 33.3 kHz bandwidth, 1024-point fft, and 0.26 s sweep rate, an integration time of 5 min, and collect radial velocity data on a Cartesian grid with 4-km spacing every 10 min in alternate mode. As discussed in Reference [43], the 5-min sampling used here for the phased-array HFR systems was considered equivalent to the 80 min integration for the crossed-loop systems in terms of noise in the receive antennas. At the working frequency, sampling depth was approximately 1.3 m.
Hourly-averaged radial currents were generated from the QC 5 min radial velocity data by averaging at least three valid observations within the hour. For real-time operations, hourly averages were computed at minute 30 (i.e., at 00:30, 01:30, and on). In the following comparisons and merging, however, the averaging was performed consistently with SeaSonde HFR or the mooring data, to minimize temporal offsets between the datasets.
The IMOS–Australian National Mooring Network (ANMN) Facility collects subsurface current data in the Rottnest Shelf region (Figure 1; Table 1). Quality-controlled data are available for download through the data portal [44,45,46,47,48]. A set of compulsory quality-control tests including: impossible date, impossible depth, impossible horizontal and vertical velocities, correlation magnitude, and depth-correction for mooring knock-down, are performed on the time-series of subsurface velocities, along with other optional tests [49]. Instruments deployed at the moorings include Nortek 190 KHz Continental current profilers at the WA Perth Canyon, 200 m (WACA20) mooring, a Teledyne RD Instruments (RDI) Workhorse Sentinel ADCP at the WA Rottnest National Reference Station (NRSROT), a Teledyne RDI Long Ranger ADCP at the WA Two Rocks 490 m (WATR50) mooring, and a Nortek Aquadopp Pro at the WA Two Rocks 103 m mooring (WATR10). Temporal resolution of the mooring records ranges between 10–30 min (Table 1). For consistency with HFR data, hourly-averaged subsurface currents were considered.
The HFR and subsurface current data used in the following analyses span a four-month time period between 01 October 2017 and 31 January 2018. Comparison metrics include correlation coefficient (R), root-mean-square difference (RMSD), vector correlation magnitude and phase [50], as defined through Equations (1)–(5).
R = i = 1 n ( x i x ¯ ) ( y i y ¯ ) ( n 1 ) σ x σ y
r m s d = i = 1 n ( x i y i ) 2 n
σ x = i = 1 n ( x i x ¯ ) 2 n 1
ρ = u r u m + v r v m + i u r v m v r u m u r 2 + v r 2 1 / 2 u m 2 + v m 2 1 / 2
ϑ = tan 1 u r v m v r u m u r u m + v r v m
In Equations (4) and (5), (ur,m, vr,m) stand for the zonal and meridional components of the HFR (mooring) velocity components, respectively, i identifies the imaginary unit, and < > represents the ensemble average operator.
The analysis method described in Reference [9] is used to quantify bearing offsets in the radial currents for both SeaSonde and WERA HFR systems: the components of moored current velocity are first translated into radial current components in the direction of the HFR site, then R and RMSD values are calculated using HFR radial data at fixed range and at all bearings. In the presence of bearing offsets, the angle θ ( m i n ) that maximizes (minimizes) R (RMSD) does not correspond to the angular sector where the mooring is located ( θ m o o r ) . The difference between the two angles is a quantitative measure of the bearing errors.
The HFR current components are derived from radial velocity data on a Cartesian grid following Equations (6)–(8), in which urad1,2> and θ 1 , 2 stand for the radial speed and direction from the two radar stations at each grid point:
f = sin ( θ 1 θ 2 )
u = ( u r a d 1 cos ( θ 2 ) u r a d 2 cos ( θ 1 ) ) / f
v = ( u r a d 2 sin ( θ 1 ) u r a d 1 sin ( θ 2 ) ) / f
Additionally, mean bias between velocity components is calculated as follows:
b i a s = i = 1 n ( x i y i ) n
In the following analyses, vectors are mapped onto the WERA HFR grid and constraints are applied on the intersecting beam geometry in order to reduce errors of geometrical dilution of precision. SeaSonde HFR radials are converted from their polar coordinate systems and mapped on the same Cartesian grid before the radial-to-vector conversion step by averaging radial data within a 1 km distance from each WERA grid point. In order to avoid temporal mismatches between WERA and SeaSonde HFR radials, WERA radial data are averaged consistently with SeaSonde HFR data.
Standard statistical tests are used to derive significance levels for scalar correlation values. Methods described in [51,52,53,54] are used to derive confidence levels on amplitude of the vector correlation from the percentiles of the sample distribution obtained following a bootstrap approach, and assuming variables to be independent and identically distributed (IID) variables. First, the horizontal components of surface and subsurface currents are resampled to produce new current time series. This procedure was repeated 1000 times and amplitudes and phase angles were computed for each resampled pair to generate a distribution of correlation amplitudes. Then, the 95% confidence intervals for vector correlation were obtained from the 2.5% and 97.5% percentiles of the resulting distribution.
Finally, the Welch modified periodogram method [55] was used to extract a smooth estimate of the power density distribution of surface HFR and subsurface currents at selected locations.

3. Results

3.1. Accuracy of WERA and SeaSonde Radial Data

Comparisons between HFR radial and subsurface currents in the direction of the radar are summarized in Table 2 for both WERA and SeaSonde HFR radars. Results shown here refer to the radar grid point closest to the mooring locations. For WERA HFR systems, comparison metrics are in relatively good agreement with previously reported findings in different ocean regions (for instance [1,2]), but poorer compared to a previous validation in the same area for a different time period [34]. This is particularly true for FRE when compared to all the mooring data, with the exception of mooring WATR10. A similar trend is observed for the GUI HFR station, but in this comparison an improvement in comparison metrics can be observed for moorings WACA20 and WATR10 that in Reference [34] had the lowest agreement. One possible explanation for this pattern may be related to a different distribution of the noise level and the corresponding radial signal-to-noise ratio (SNR).
When the error analysis described in Reference [9] was performed, bearing offsets were observed (Table 3) for both beam-forming and direction-finding systems. For FRE radar, bearing offsets ranged between θ = [2°, 9°], and between θ = [0°, 8°] for the GUI station. For a 16-element receive array with 0.45 λHF spacing as the ROT HFR WERA systems, the theoretical bearing resolution (λHF/D, where D is the length of the antenna array and λHF is the wavelength of the transmit signal) was approximately 8.5°. As such, the bearing offsets are within the system’s nominal angular resolution.
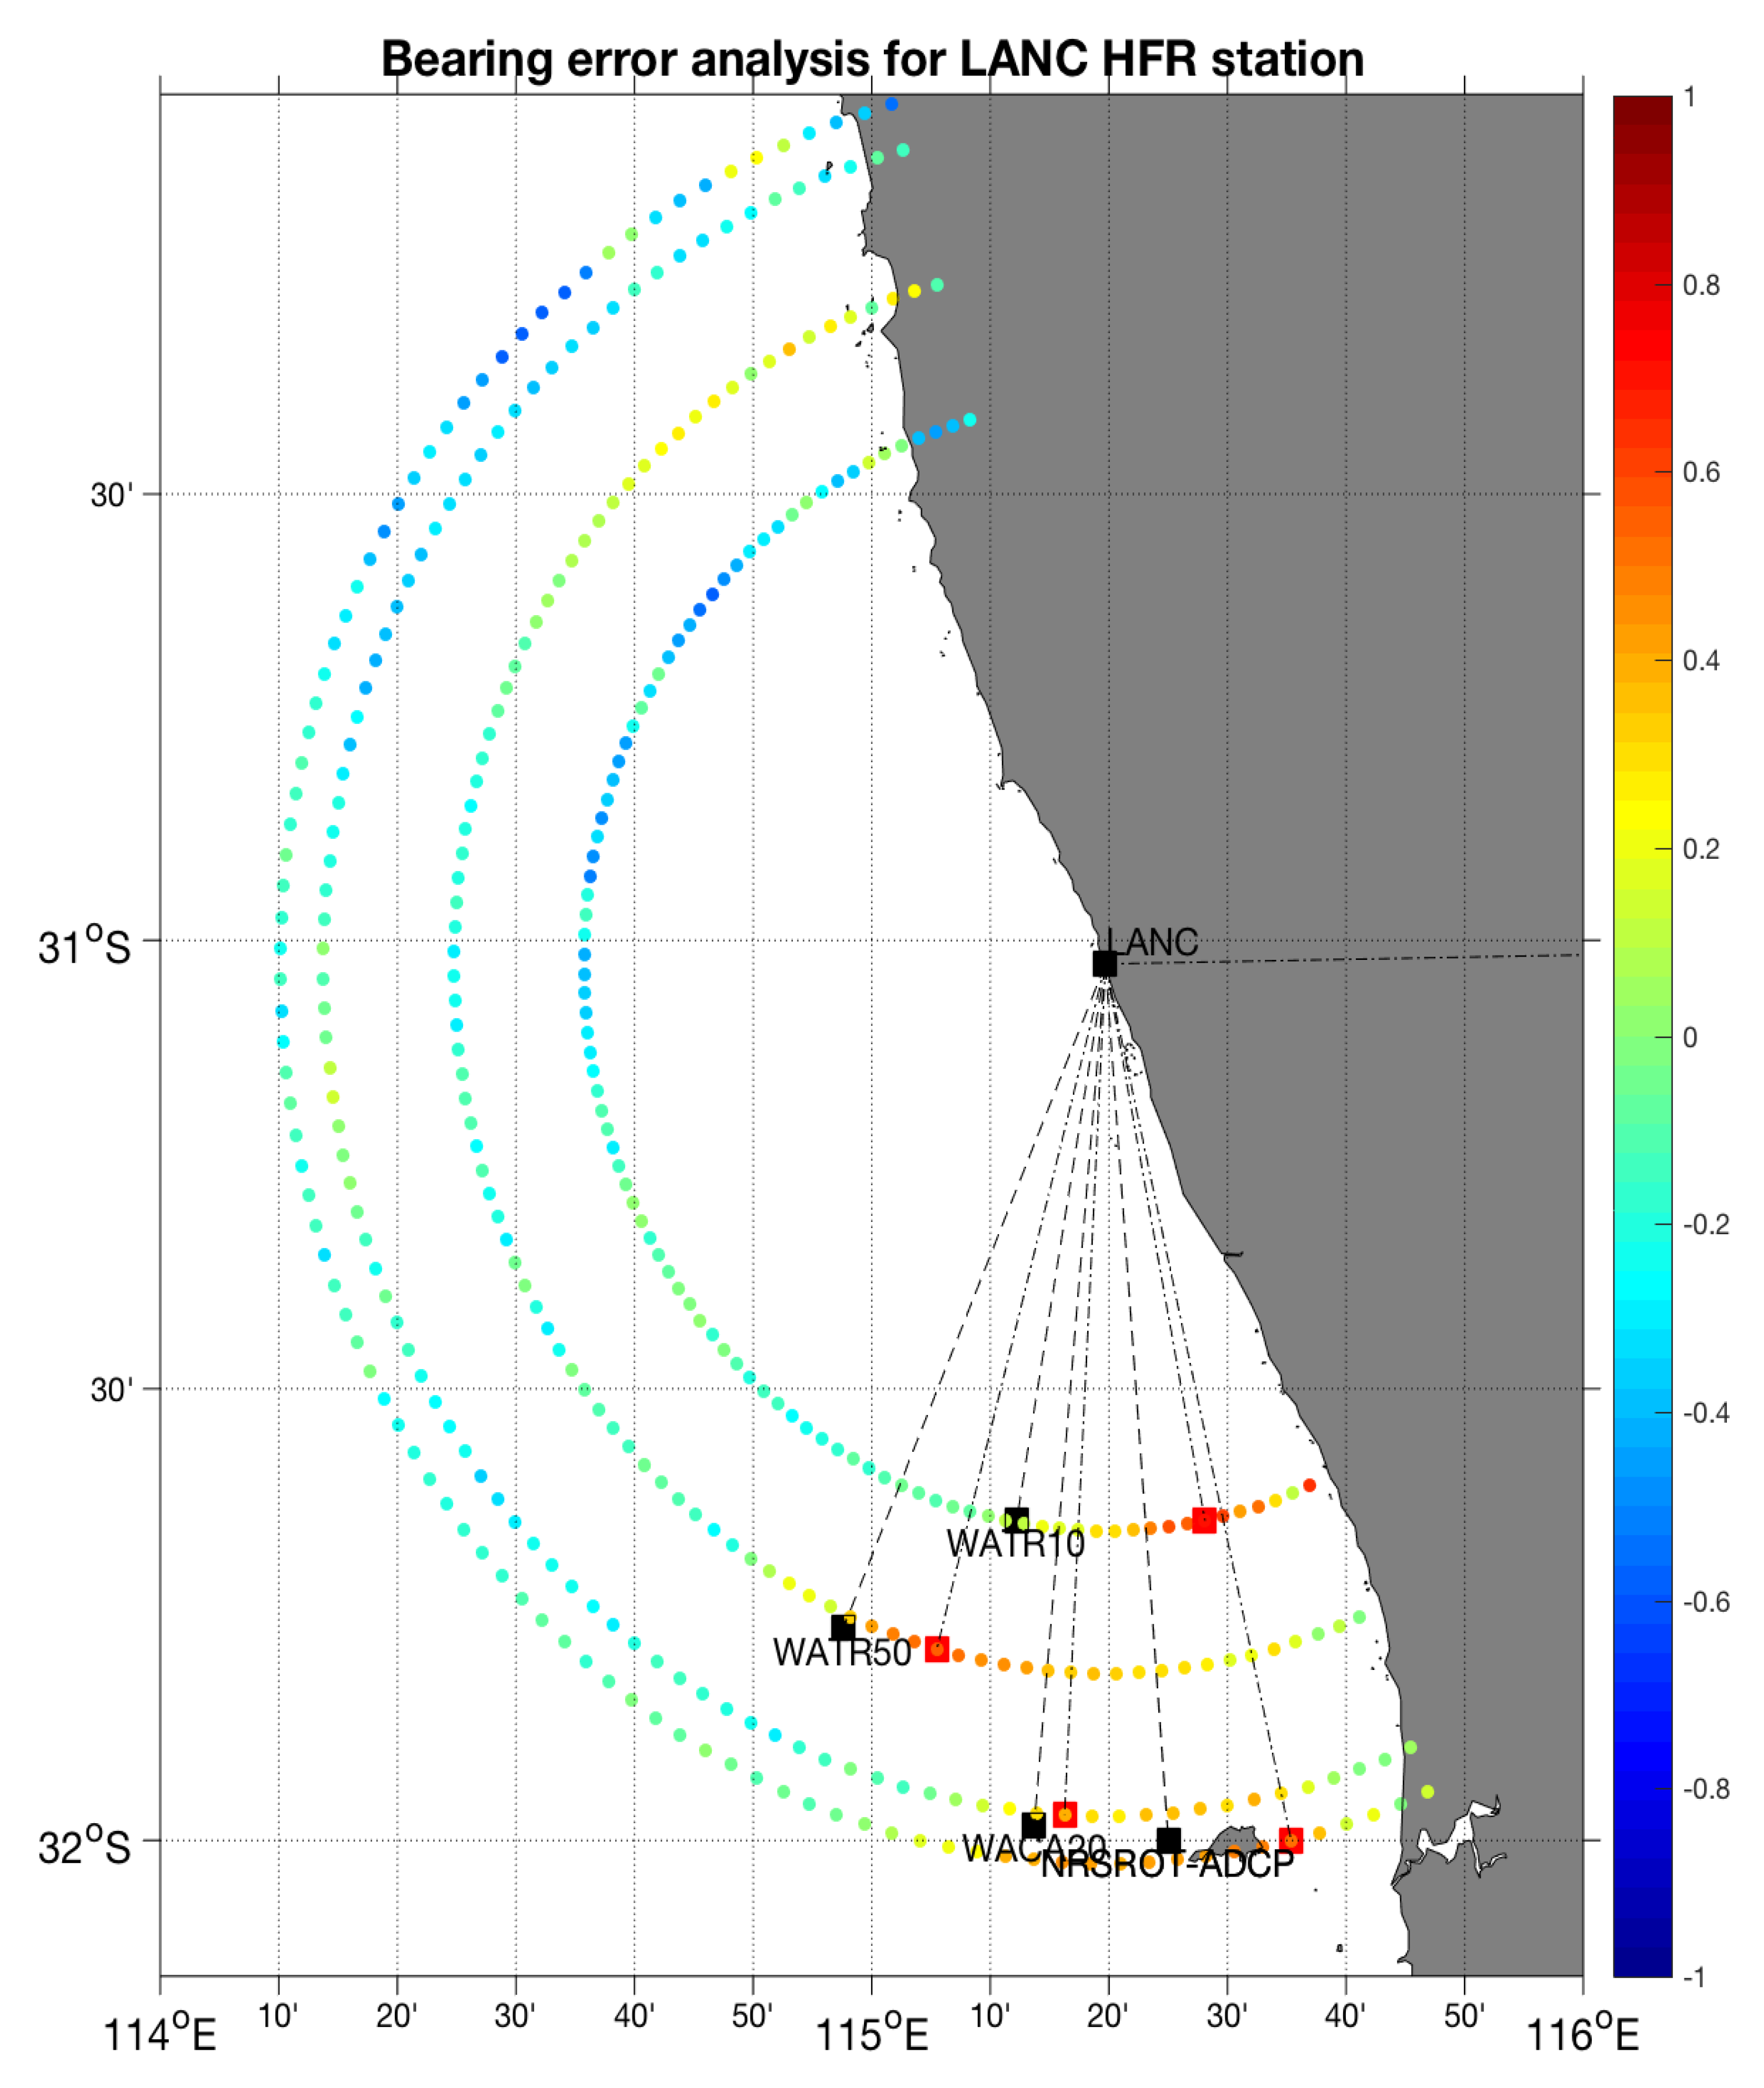
Comparison metrics between SeaSonde HFR radials and subsurface currents were lower than corresponding values for the WERA HFR systems: R was in the range R = (0.1, 0.42) for both GHED and LANC, and RMSD = (26.2, 37.2) cm/s. Bearing errors for SeaSonde were also typically larger than beam-forming systems, in the range θ = (2°, 21°) for LANC (Figure 2) and in the range θ = (8°, 13°) for GHED radar, however, they were consistent with values reported at different installations.
The results of the comparisons for GHED HFR were likely biased due to the significant lower data coverage for this station at the moorings (Table 2 and Table 3), located at the far edges of the range and angular coverages (Figure 1).
The bearing offset reported from the LANC–NRSROT mooring (Figure 2) can originate both from distortions in the antenna beam pattern, and from incorrect settings in the processing software, specifically a missing land mask which is typically used to exclude specific directions or islands. It is worth noting that low correlation values do not necessarily suggest the presence of errors in the data, but may originate instead from the predominant current direction, especially if the low R is associated with low RMSD values as was the case of NRSROT (WACA20) and FRE in Table 2. Also, all correlation values are statistically significant (p-values < 0.001).
Finally, Table 2 and Table 3 show that SeaSonde HFR perform better than WERAs in terms of mean bias, with values in the range (0.03, 0.33) cm/s and (−5.2, +5.2) cm/s, respectively.

3.2. Comparison of WERA and SeaSonde Vector Maps

For both SeaSonde and WERA HFR vector maps, comparison was limited to a marginal sector of the total grid (less than 25 points), located at the boundaries of the geometrically stable areas, and affected by the available data, as well as by the different grid resolution.
The WERA and SeaSonde vector grids have different spatial resolutions; as such, comparison is performed at the coarser grid cell points after remapping current data onto a common grid. A minimum of 50% data availability was required at each point to perform the statistical comparison.
Correlation values for the U (V) velocity components ranged between RU = (–0.02, 0.45), RV = (0.29, 0.73) (p-values < 0.001), while RMSDU, V values ranges between (22,49) cm/s and (19,59) cm/s for the U, V components respectively. Typical values for amplitude and phase angle of the vector correlation are in the range ρ = (0.19, 0.59), and φ = (−4°, 54°).

3.3. Comparison of Merged WERA–SeaSonde Merged Vector Maps

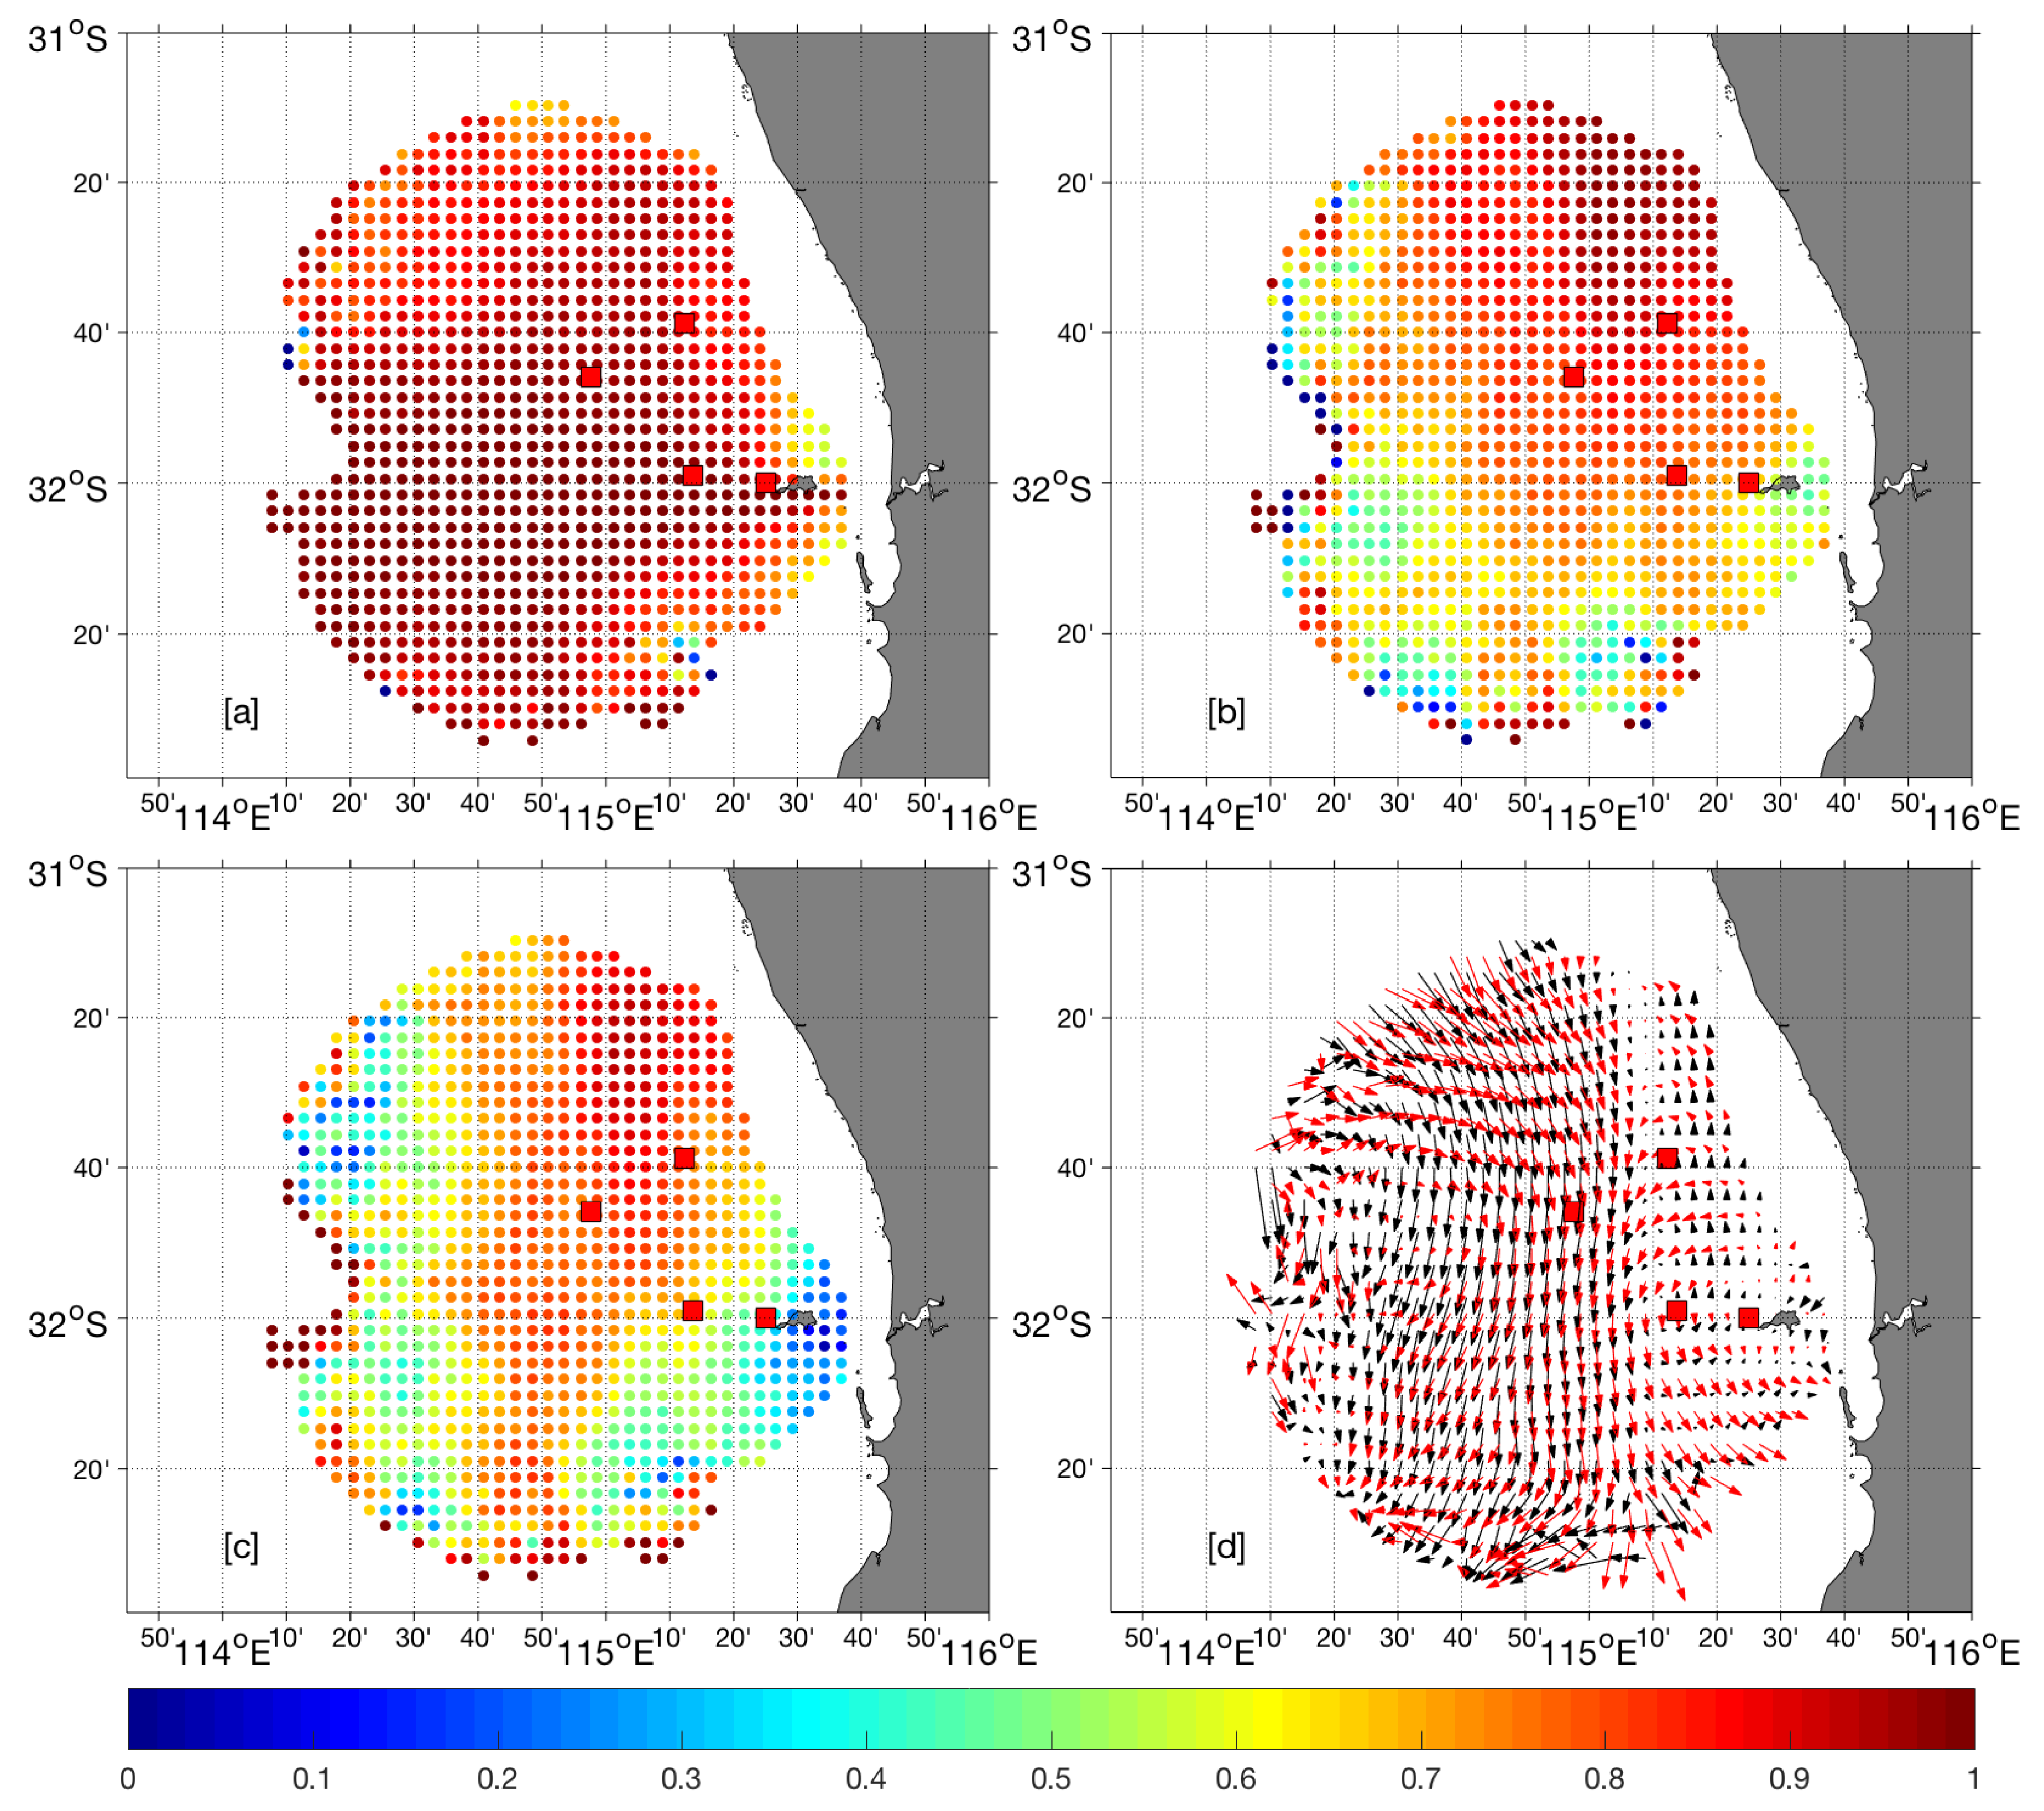
The WA HFR network configuration (Figure 1) presents several possible pairs of WERA–SeaSonde combinations (FRE–LANC; FRE–GHED; GUI–LANC; GUI–GHED) (Figure 3); however, only one of them (FRE–LANC; Figure 3b) provides vector maps over a spatial domain comparable with the FRE–GUI configuration and with enough temporal coverage for reliable statistical analyses, thus offering the possibility of a direct comparison with subsurface currents at the mooring locations. Others provide either more limited spatial coverage and no overlap with the moorings, in spite of the large temporal data availability (GUI–GHED; Figure 3c), or too low data return (FRE–GHED; Figure 3d) at the moorings.
Statistics of the comparison between the FRE–GUI HFR pair and the subsurface currents at the mooring locations are provided in Table 4; for the sake of comparison, results of the cross-validation of unmerged and merged vector data at the same mooring locations are provided in Table 5.
At the mooring locations (Table 4), correlation values for unmerged data range between (–0.12, 0.83) for the U component, lower than corresponding values for V, which is found to range between (0.6, 0.86). Amplitude of the vector correlation generally exceeds 0.58, with the highest value (0.86) for the deep-water mooring (WATR50), which also shows the lowest angular offset (–6°) with HFR currents in spite of the distance from surface. Relatively poor comparison metrics are observed at the NRSROT mooring, and in particular for the U component (RU = (–0.12, 0.31)), the RMSDV and the veering angles, which exceed 20° (absolute values).
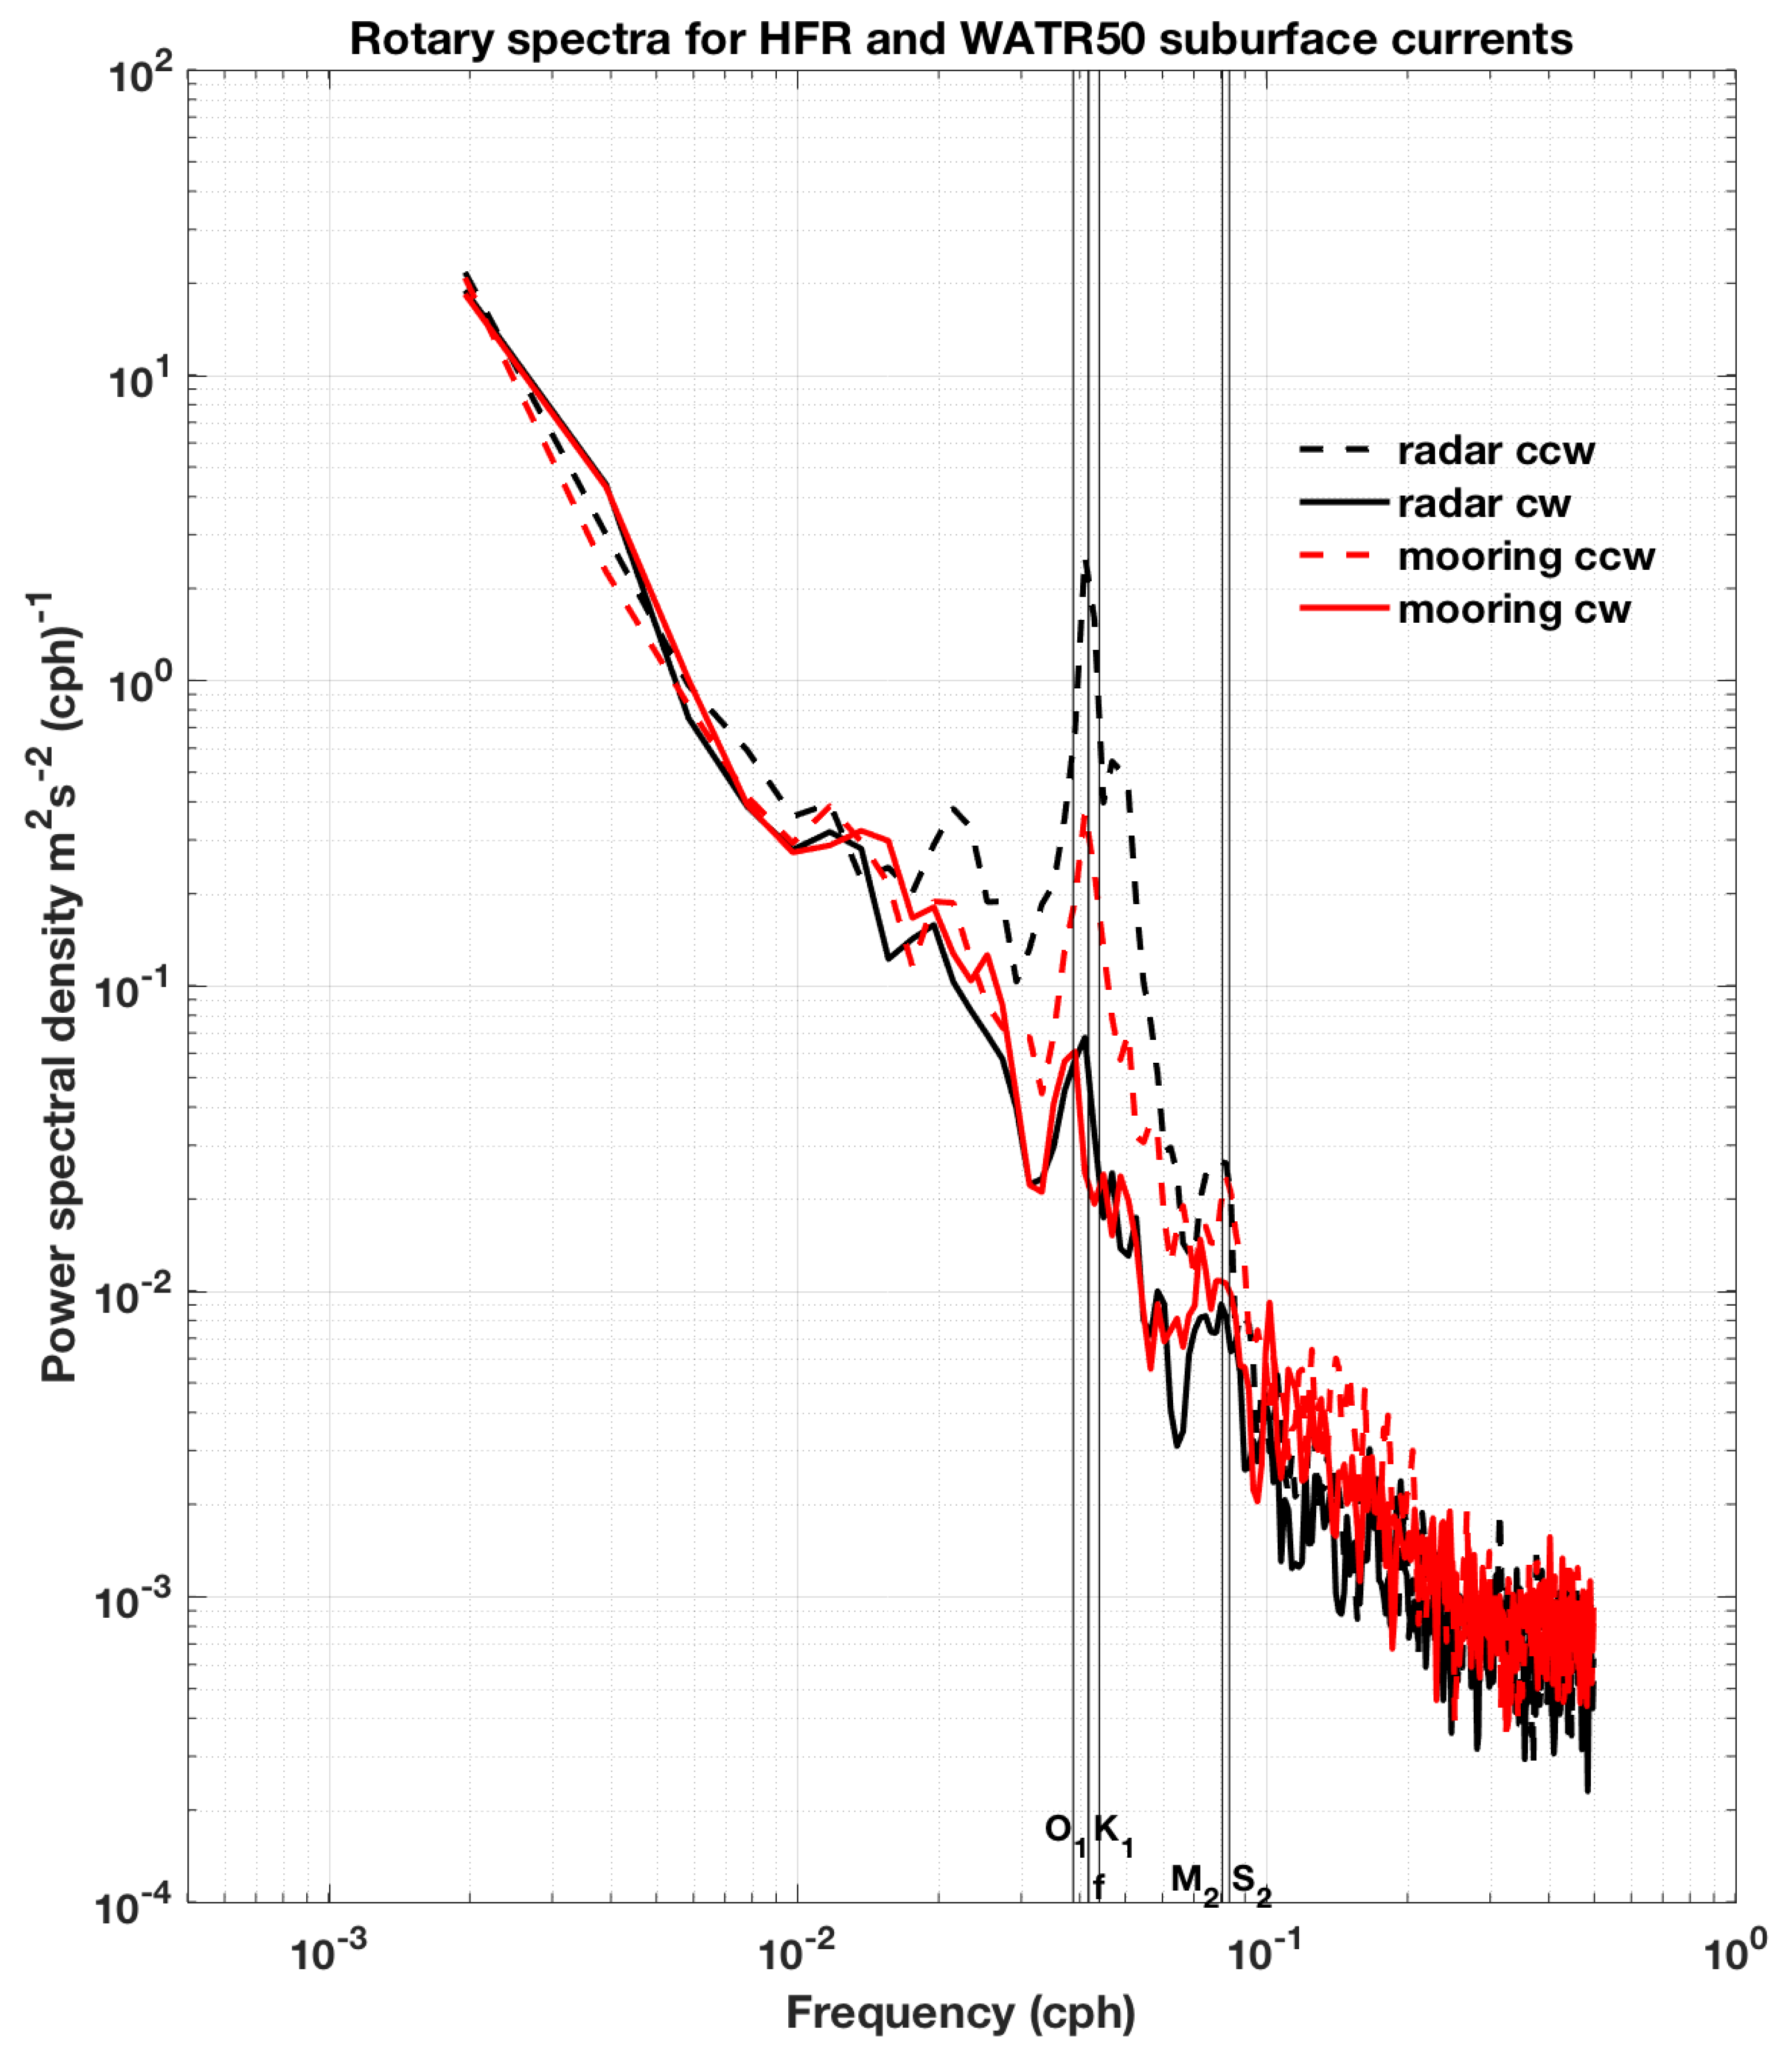
It is interesting that at several deep-water locations (for instance: WATR50; WATR10; WACA20), the cross-validation statistics suggest good matches between time-series at the mooring locations, with ρ in the range (0.65, 0.86), angular offset in the range φ = (–5°, 28°), RMSDU = (13.2, 15.7) cm/s, RMSDV = (15.4, 17.3) cm/s, and low bias values (biasU = (–5.1, –1.9) cm/s; biasV = (6.5, 9.6) cm/s). If a time-lagged cross-correlation is performed between surface HFR currents and subsurface data, results (not shown here) suggest that there is no lag between the currents at the two different depths. A spectral analysis of HFR and subsurface currents for the WATR50 mooring suggests that the majority of the differences are found within the diurnal–inertial frequency bands while the low- and high-frequency bands have comparable energy levels between mooring and HFR currents (Figure 4). Similar differences in this frequency band are commonly observed when HFR and subsurface currents are compared. This feature was also documented by Reference [56], who reported a surface-intensified sea breeze response in their early SeaSonde observations.
Comparison metrics for the merged SeaSonde−WERA and subsurface currents at the mooring locations (Table 6) match the trend reported in Table 4 for the unmerged data, although with lower correlation and higher RMSD values: RU = (−0.2, 0.83), RMSDU = (14.3, 24.2) cm/s, biasU = (−9.5, 1.1); RV = (0.39, 0.79), RMSDV = (19.9, 26.2) cm/s, biasV = (−1.3, 9.6), ρ = (0.47, 0.72), and φ = (3°, 51°).
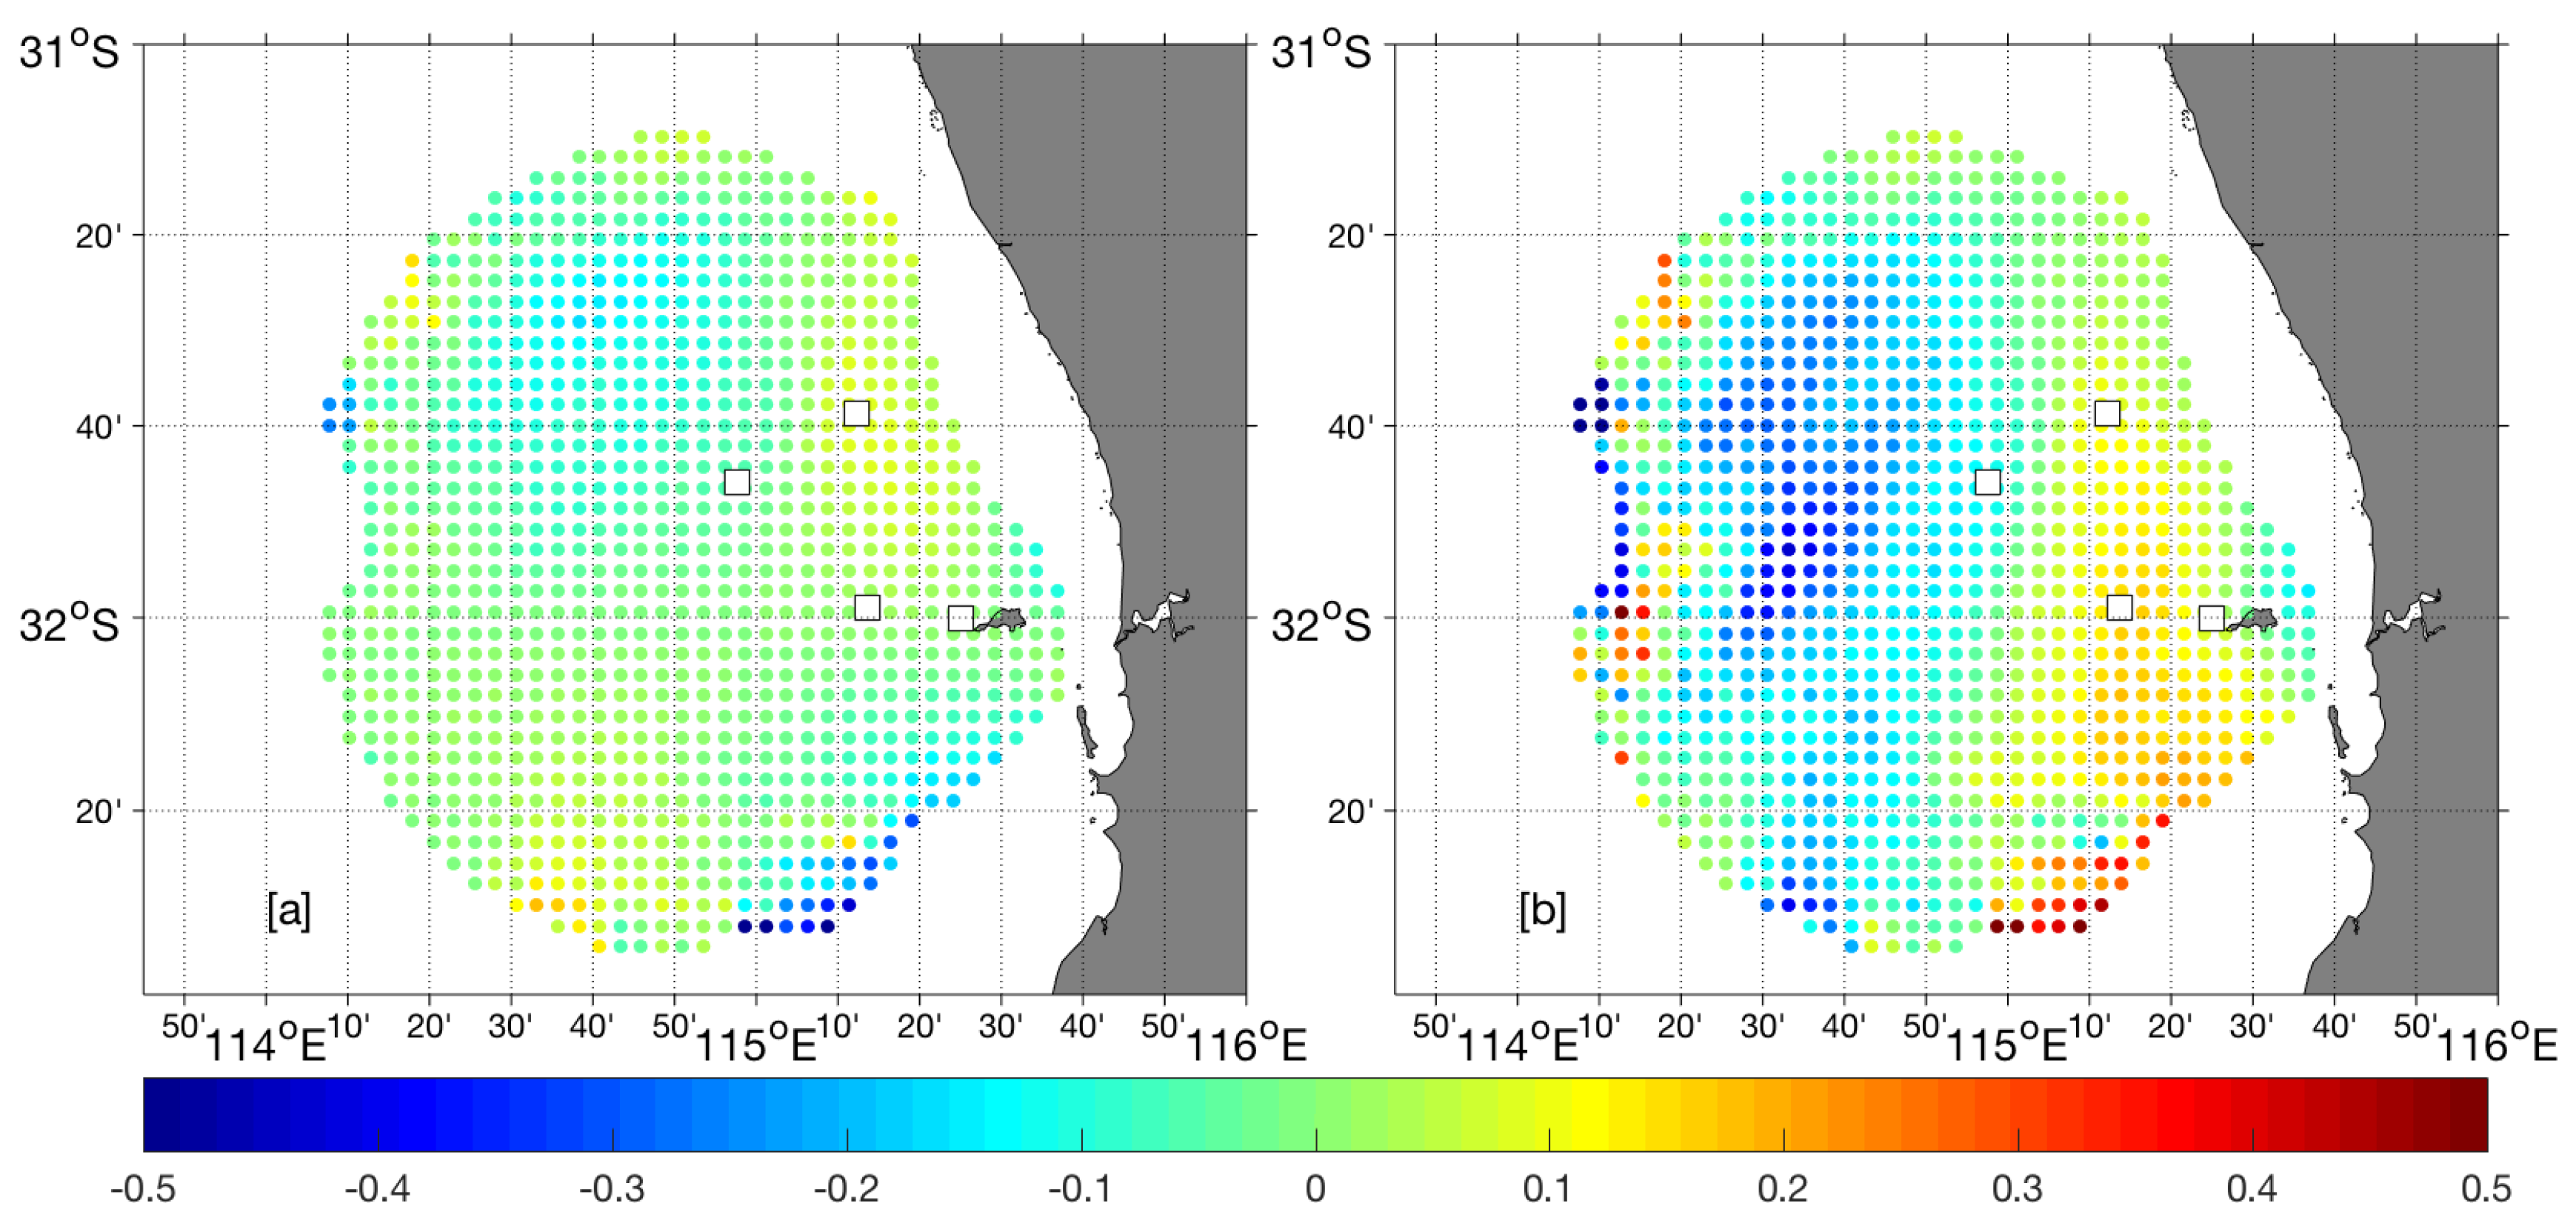
The spatial distributions of RU, RV, and ρ between merged and unmerged data are provided in Figure 5, along with the mean current pattern for the analysis period. RU values typically exceeded 0.95 within the radar footprint (Figure 5a), while RV values also exceeded 0.9 (Figure 5b), suggesting good agreement between datasets. Good agreement was confirmed in the general circulation pattern: the offshore southward current and the weaker northward current mapped by the WERA HFR radar (black arrows), associated, respectively, with the Leeuwin Current (LC) and the Capes Current (CC) [40,42], they are also well reconstructed in the merged WERA–SeaSonde data (red arrows). Typical bias for the zonal component (Figure 6a) was below 0.15 m/s across the radar domain, and increases for the meridional component, particularly in areas of weak currents (Figure 6b). Lower RU, RV, and ρ were typically observed offshore; this poorer agreement was reflected in the anomalous and inconsistent mean current vectors at the outer edges of the domain (Figure 5d), where bias values also become significant.

4. Discussion

Developed initially as a research-based tool, HFR technology has reached a maturity stage such that national and international operational programs and networks make extensive use of HFR capabilities in order to provide reliable sea surface maps over a variety of temporal and spatial scales [1,2,3,4]. Several genres of HFR systems are available [18,22], classified on the basis of the approach used to resolve the direction of the sea echo. Extensive validation exercises have proven the general reliability and provided accuracy estimates of both types of HFR systems over a wide variety of deployments [1]. With the exception of a limited number of test cases or cross-validation exercises [22,23,24,25,26,27,28], limited attempts have been made to compare vectors from different systems in overlapping areas. Even fewer attempts have been made to combine surface radial current data from different systems in their areas of common overlap, and assess the accuracy of the resulting current maps. In this study, we used Reference [23] as a starting point and further explored the possibility of combining radial velocity data from the two major commercial ocean HFR systems (direction finding SeaSonde and beam forming WERA HFR) that are operationally managed along the coast of Western Australia (WA; Figure 1; [34]).
First, we use independent subsurface current data measured at various locations within the HFR footprint to provide estimates of radial data accuracy for each of the two HFR systems. Results show that in general, both HFRs provide reliable and accurate information. Beam-forming WERA HFRs seem to perform slightly better than SeaSonde in terms of correlation, RMSD values, and bearing offsets. Bearing offsets are commonly observed in direction-finding HFR systems [9], and are not necessarily uniform within range from the receive antennas. In the case of the LANC SeaSonde HFR system, offsets can be as high as 30°. Large offsets are also found for GHED SeaSonde HFR systems; however, they should be interpreted in terms of the low percent return rates at the radar far ranges at the mooring locations. If large bearing offsets occur at far ranges from the HFR receiver, they translate into significant spatial offsets with potential to bias the accuracy of the radial maps, thus decreasing the quality of the ocean current maps. Bearing offsets are also present in the WERA HFR systems; however, they are typically lower than SeaSonde and are within the angular accuracy of the beam-forming systems [43]. While antenna pattern distortions for direction-finding HFRs, such as the SeaSonde, manifest themselves in pointing errors, distortions of the antenna pattern leading to significant side lobe weighting in a phased-array system, such as the WERA system, may cause biases in the amplitude estimates of the radial currents.
Effects of the vertical shear associated with different operating frequencies (4.463 MHz and 9.335 MHz for the SeaSonde and WERA HFR systems, respectively) are neglected at this stage, due to the fact that most of the comparisons with subsurface current data are performed well below the surface. For instance, the nominal distance from surface for the first usable current meter bin exceed 50 m in case of the deep-water WATR50 mooring, yet R and RMSD values for both direction finding and beam forming systems are consistent.
Second, we directly compare vector currents from the beam forming (FRE and GUI) HFRs to those derived from pairs of direction finding (LANC and GHED) HFR systems. The overlap area is limited to a small sector of their coverages, and is controlled by the geometry of the intersecting radar-look angles. Comparisons in this common area show a relatively good match despite different grid resolutions and vector mapping methods.
Differences may originate from a number of causes. For WERA HFRs, vectors are derived as described in Equations (6)–(8) using a 1-to-1 matching of radial velocities from the two stations at each grid point. Hourly WERA radial data are averaged from a sequence of 5-min integration samples. SeaSonde vector maps are derived through a similar least-squares fit, which uses radial data within a 10-km distance from each grid point. This second approach biases direction and speed of the resulting current maps, especially at the far edges of the radar grid, both in the case of simplified and more complex current fields [57], and propagates radial velocity errors across adjacent vector grid points.
Other biases may arise from the temporal sampling scheme used in the hourly SeaSonde radial maps; however, this is accounted for properly in the radar configurations. Typically, hourly radial maps are derived collecting several intermediate short-term intermediate products (“short term radials” following the standard operational SeaSonde jargon), that are then “merged” to define a final product through a median filtering method. The WERA radials are, on the other hand, derived by averaging a sequence of radial maps collected every 10 min, and requires at least three valid observations at each grid point. To avoid biases from different merging approaches, the Australian SeaSonde systems use an averaging merging approach consistent with that used for WERA HFR systems.
Third, we compared vector maps from WERA systems with merged SeaSonde–WERA radial data on the same grid. We used Equations (6)–(8) to compute vectors from LANC–FRE HFR systems for a period of 4 months between October 2017 and January 2018. The period was chosen on purpose: due to hardware problems with one of the WERA systems, no real-time (RT) vectors were available over the Rottnest Shelf (Figure 1); and both SeaSonde systems had been recently calibrated and optimized for real-time operations.
To set a confidence limit to WERA vector accuracy, comparisons with subsurface data at the mooring locations were first performed. Then, comparison metrics were derived across the entire radar domain. Comparison metrics for unmerged and merged data against subsurface data were consistent, although merged SeaSonde–WERA had slightly poorer performances.
This may be related to a combination of factors, including the re-mapping of LANC radar radial velocities from a polar coordinate system to a higher resolution Cartesian grid where FRE radials are sampled; or the effects of the vertical shear associated with the different operating frequencies of the two HFR systems. As this was a preliminary test of system interoperability, the latter factor was neglected in first approximation, also due to the lack of high-resolution surface current data in the region from either drifters or glider observations that would provide quantitative estimates of the velocity shear effects. Further investigation is planned to quantify the contribution of similar possible error sources through the deployment of near surface drifters within the radar coverage.
When comparing the time-averaged current pattern, results show good agreement between the two data sets and further support the hypothesis of interoperability of the different HFR systems. There is good agreement between the main offshore meandering structure as well as the current reversal in the coastal shelf area (Figure 5d), that are associated respectively with the Leeuwin Current (LC) and Capes Current (CC) system [40,42].
There are regions where comparison is qualitatively and quantitatively poor, but they are located either at far ranges from LANC HFR, where radial velocity errors are commonly observed due to the poor SNR constraints, or at the edges of the FRE station where side lobes may bias amplitude estimates of the radial currents.

5. Conclusions

Along the coast of Western Australia, the IMOS Ocean Radar Facility operates the two major commercial-type HFR systems, the direction-finding SeaSonde and the beam-forming WERA ocean radars.
In spite of their overlapping radial coverage, they routinely operate separately collecting ocean surface maps representative of the shelf areas of the Turquoise Coast (SeaSonde systems) and the Rottnest Shelf (WERA systems). The relative short distance between individual HFR stations, combined with the extensive availability of subsurface currents from different moorings within the HFR coverage, provide a unique opportunity to determine accuracy levels of radial and current velocities, and investigate the possibility of combining radial velocity data from different platforms.
This latter aspect is of particular interest in light of the fact that it can potentially fill in the gaps in case of downtime of one component of an HFR observing network.
We tested this hypothesis using a four-month data period between October 2017 and January 2018. This time period was chosen on purpose: one of the WERA HFR systems was shut down for a prolonged period of time due to hardware issues, so it was necessary to investigate the interoperability of the two HFR in order to fill the gap (although in delayed mode only).
In spite of the intrinsic differences between the direction-finding SeaSonde HFR systems (polar coordinate grid, 2° nominal angle resolution, 6 km range resolution, measurement depth of 2.7 m, integration time 80 minutes with 1-h output rate, non-uniform bearing errors over the operational range), and the beam-forming WERA (cartesian coordinate system with 4.5 km resolution, effective measurement depth 1.3 m, integration time of 5 minutes with 1-h output rate, low bearing errors), surface vector maps can be derived with reasonable accuracy.
Combining radials from different HFR genres is not commonly performed, however it is shown here that this is possible, thus increasing the spatial and temporal coverage of the HFR observing network, especially for instance in case of prolonged downtime of an HFR component.

Author Contributions

Conceptualization, S.C.; Methodology, S.C.; Software, S.C.; Validation, S.C.; Formal Analysis, S.C.; Resources, S.C.; Data Curation, S.C. and S.d.V.; Writing-Original Draft Preparation, S.C.; Writing-Review & Editing, S.C., S.d.V.; Project Administration, S.C.; Funding Acquisition, S.C.

Funding

This research was funded by Integrated Marine Observing System IMOS–Ocean Radar 2017–2019, grant number 53000300.

Acknowledgments

Data was sourced from the Integrated Marine Observing System (IMOS). IMOS is supported by the Australian Government through the National Collaborative Research Infrastructure Strategy and the Super Science Initiative. Subsurface current data were collected by the IMOS–Australian National Mooring Network (ANMN) Facility. The WERA data used here were collected by the Ocean Radar Facility at the University of Western Australia.

Conflicts of Interest

The authors declare no conflict of interest.

References

  1. Paduan, J.D.; Washburn, L. High-frequency radar observations of ocean surface currents. Annu. Rev. Mar. Sci. 2013, 5, 115–136. [Google Scholar] [CrossRef] [PubMed]
  2. Paduan, J.D.; Kosro, P.M.; Glenn, S.M. A national coastal ocean surface current mapping system for the United States. Mar. Technol. Soc. J. 2004, 38, 102–108. [Google Scholar] [CrossRef]
  3. Fujii, S.; Heron, M.L.; Kim, K.; Lai, J.-W.; Lee, S.-H.; Wu, X.; Wu, X.; Wyatt, L.R.; Yang, W. An overview of developments and applications of oceanographic radar networks in Asia and Oceania countries. Ocean Sci. J. 2013, 48, 69–97. [Google Scholar] [CrossRef]
  4. Wyatt, L.R. High frequency radar applications in coastal monitoring, planning and engineering. Aust. J. Civ. Eng. 2014, 12, 1–15. [Google Scholar] [CrossRef]
  5. Bellomo, L.; Griffa, A.; Cosoli, S.; Falco, P.; Gerin, R.; Iermano, I.; Kalampokis, A.; Kokkini, Z.; Lana, A.; Magaldi, M.G.; et al. Toward an integrated HF radar network in the Mediterranean Sea to improve search and rescue and oil spill response: The TOSCA project experience. J. Oper. Oceanogr. 2015, 8, 1–13. [Google Scholar] [CrossRef]
  6. Rubio, A.; Mader, J.; Corgnati, L.; Mantovani, C.; Griffa, A.; Novellino, A.; Quentin, C.; Wyatt, L.; Schulz-Stellenfleth, J.; Horstmann, J.; et al. HF Radar activity in European coastal seas: Next steps toward a Pan-European HF Radar Network. Front. Mar. Sci. 2017, 4, 8. [Google Scholar] [CrossRef]
  7. Chapman, R.D.; Shay, L.K.; Graber, H.C.; Edson, J.B.; Karachintsev, A.; Trump, C.L.; Ross, D.B. On the accuracy of HF radar surface current measurements: Intercomparisons with ship-based sensors. J. Geophys. Res. Oceans 1997, 102, 18737–18748. [Google Scholar] [CrossRef] [Green Version]
  8. Kohut, J.T.; Glenn, S.M. Improving HF radar surface current measurements with measured antenna beam patterns. J. Atmos. Ocean. Technol. 2003, 20, 1303–1316. [Google Scholar] [CrossRef]
  9. Emery, B.M.; Washburn, L.; Harlan, J.A. Evaluating radial current measurements from CODAR high-frequency radars with moored current meters. J. Atmos. Ocean. Technol. 2004, 21, 1259–1271. [Google Scholar] [CrossRef]
  10. Davies, A.M.; Hall, P.; Howarth, M.J.; Knight, P.J.; Player, R.J. Comparison of observed (HF radar and ADCP measurements) and computed tides in the North channel of the Irish sea. J. Phys. Oceanogr. 2001, 31, 1764–1785. [Google Scholar] [CrossRef]
  11. Erofeeva, S.Y.; Egbert, G.D.; Kosro, P.M. Tidal currents on the central Oregon shelf: Models, data, and assimilation. J. Geophys. Res. Oceans 2003, 108. [Google Scholar] [CrossRef] [Green Version]
  12. Mau, J.-C.; Wang, D.-P.; Ullman, D.S.; Codiga, D.L. Comparison of observed (HF radar, ADCP) and model barotropic tidal currents in the New York Bight and Block Island Sound. Estuar. Coast. Shelf Sci. 2007, 72, 129–137. [Google Scholar] [CrossRef]
  13. Shay, L.K.; Lentz, S.J.; Graber, H.C.; Haus, B.K. Current structure variations detected by high-frequency radar and vector-measuring current meters. J. Atmos. Ocean. Technol. 1998, 15, 237–256. [Google Scholar] [CrossRef]
  14. Rosenfeld, L.; Shulman, I.; Cook, M.; Paduan, J.D.; Shulman, L. Methodology for a regional tidal model evaluation, with application to central California. Deep Sea Res. Part II Top. Stud. Oceanogr. 2009, 56, 199–218. [Google Scholar] [CrossRef]
  15. Bjorkstedt, E.; Roughgarden, J. Larval transport and coastal upwelling: An application of HF radar in ecological research. Oceanography 1997, 10, 64–67. [Google Scholar] [CrossRef]
  16. Graber, H.C.; Limouzy-Paris, C.B. Transport patterns of tropical reef fish larvae by spin-off eddies in the straits of Florida. Oceanography 1997, 10, 68–71. [Google Scholar] [CrossRef]
  17. Cosoli, S.; Ličer, M.; Vodopivec, M.; Malačič, V. Surface circulation in the Gulf of Trieste (northern Adriatic Sea) from radar, model, and ADCP comparisons. J. Geophys. Res. Oceans 2013, 118, 6183–6200. [Google Scholar] [CrossRef] [Green Version]
  18. Barrick, D.; Lipa, B.J.; Crissman, R.D. Mapping surface currents with CODAR. Sea Technol. 1985, 26, 43–48. [Google Scholar]
  19. Gurgel, K.-W.; Essen, H.-H.; Schlick, T. Wellen Radar (WERA): A new ground-wave HF radar for ocean remote sensing. Coast. Eng. 1999, 37, 219–234. [Google Scholar] [CrossRef]
  20. Wyatt, L.R.; Green, J.J.; Middleditch, A.; Moorhead, M.D.; Howarth, J.; Holt, M.; Keogh, S. Operational wave, current, and wind measurements with the Pisces HF Radar. IEEE J. Ocean. Eng. 2006, 31, 819–834. [Google Scholar] [CrossRef]
  21. Schmidt, R.O. Multiple emitter location and signal parameter estimation. IEEE Trans. Antennas Propag. 1986, 34, 276–280. [Google Scholar] [CrossRef]
  22. Helzel, T.; Petersen, L. WERA: Remote ocean sensing for current, wave, and wind direction: Introduction to the principle of operation. In Proceedings of the 2006 IEEE US/EU Baltic International Symposium, Klaipeda, Lithuania, 23–26 May 2006; Available online: http://www.helzel.com/ files/432/upload/Papers/WERA-Basics-Paper-6605.pdf (accessed on 22 October 2018).
  23. Liu, Y.; Weisberg, R.H.; Merz, C. Assessment of Codar SeaSonde HF Radars in mapping surface currents on the West Florida Shelf. J. Atmos. Ocean. Technol. 2014, 31, 1363–1382. [Google Scholar] [CrossRef]
  24. Fernandez, D.M.; Paduan, J.D. Simultaneous CODAR and OSCR measurements of ocean surface currents in Monterey Bay. In Proceedings of the IGARSSʼ96: IEEE 1996 International Geoscience and Remote Sensing Symposium, Lincoln, NE, USA, 31–31 May 1996; Volume 3, pp. 1749–1752. [Google Scholar] [CrossRef]
  25. Teague, C.C.; Fernandez, D.M.; Laws, K.E.; Paduan, J.D.; Vesecky, J.F. Comparison of multifrequency phased-array and direction-finding HF radar systems during COPE-3. In Proceedings of the IGARSS ʼ98: 1998 IEEE International Geoscience and Remote Sensing Symposium, Seattle, WA, USA, 6–10 July 1998; Volume 1, pp. 201–203. [Google Scholar] [CrossRef]
  26. Teague, C.C.; Vesecky, J.F.; Hallock, Z.R. A comparison of multifrequency HF radar and ADCP measurements of near-surface currents during COPE-3. IEEE J. Ocean. Eng. 2001, 26, 399–405. [Google Scholar] [CrossRef]
  27. Gurgel, K.-W.; Antonischki, G.; Schlick, T. A comparison of surface current fields derived by beam forming and direction finding techniques as applied by the HF radar WERA. In Proceedings of the IGARSSʼ97: 1997 International Geoscience and Remote Sensing Symposium, Singapore, 3–8 August 1997; Volume 4, pp. 1805–1807. [Google Scholar] [CrossRef]
  28. Essen, H.-H.; Gurgel, K.-W.; Schlick, T. On the accuracy of current measurements by means of HF radar. IEEE J. Ocean. Eng. 2000, 25, 472–480. [Google Scholar] [CrossRef]
  29. Kim, S.Y.; Terrill, E.; Cornuelle, B.D.; Jones, B.; Washburn, L.; Moline, M.A.; Paduan, J.D.; Garfield, N.; Largier, J.L.; Crawford, G.; et al. Mapping the U.S. West Coast surface circulation: A multiyear analysis of high-frequency radar observations. J. Geophys. Res. 2011, 116, C03011. [Google Scholar] [CrossRef]
  30. Gurgel, K.W.; Barbin, Y.; Schlick, T. Radio frequency interference suppression techniques in FMCW modulated HF radars. In Proceedings of the IEEE/Oceans’07 Europe 2007, Aberdeen, UK, 18–21 June 2007. [Google Scholar]
  31. Gomez, R.; Helzel, T.; Merz, C.R.; Liu, Y.; Weisberg, R.H.; Thomas, N. Improvements in ocean surface radar applications through real-time data quality-control. In Proceedings of the 2015 IEEE/OES Eleventh Current, Waves and Turbulence Measurement (CWTM), St. Petersburg, FL, USA, 2–6 March 2015. [Google Scholar] [CrossRef]
  32. Dzvonkovskaya, A.; Petersen, L.; Helzel, T. HF Ocean Radar with a triangle waveform implementation. In Proceedings of the 19th International Radar Symposium IRS 2018, Bonn, Germany, 20–22 June 2018; ISBN 978-3-7369-9545-1. [Google Scholar]
  33. Yoshikawa, Y.; Masuda, A.; Marubayashi, K.; Ishibashi, M.; Okuno, A. On the accuracy of HF radar measurement in the Tsushima Strait. J. Geophys. Res. 2006, 111, C04009. [Google Scholar] [CrossRef]
  34. Cosoli, S.; Grcic, B.; de Vos, S.; Hetzel, Y. Improving data quality for the Australian high frequency ocean radar network through real-time and delayed-mode quality-control procedures. Remote Sens. 2018, 10, 1476. [Google Scholar] [CrossRef]
  35. Middleditch, A.; Cosoli, S. Operational data management procedures for the Australian Coastal Ocean Radar Network. In Proceedings of the OCEANS 2016 MTS/IEEE, Monterey, CA, USA, 19–23 September 2016. [Google Scholar] [CrossRef]
  36. Archer, M.R.; Keating, S.R.; Roughan, M.; Johns, W.E.; Lumpkin, R.; Beron-Vera, F.; Shay, L.K. The kinematic similarity of two western boundary currents revealed by sustained high-resolution observations. Geophys. Res. Lett. 2018, 45, 6176–6185. [Google Scholar] [CrossRef]
  37. Archer, M.R.; Roughan, M.; Keating, S.; Schaeffer, A. On the Variability of the East Australian Current: Jet Structure, Meandering, and Influence on Shelf Circulation. J. Geophys. Res. Oceans 2017, 122, 8464–8481. [Google Scholar] [CrossRef]
  38. Kerry, C.; Powell, B.; Roughan, M.; Oke, P. Development and evaluation of a high-resolution reanalysis of the East Australian Current region using the Regional Ocean Modelling System (ROMS 3.4) and Incremental Strong-Constraint 4-Dimensional Variational (IS4D-Var) data assimilation. Geosci. Model Dev. 2016, 9, 3779–3801. [Google Scholar] [CrossRef] [Green Version]
  39. Mantovanelli, A.; Keating, S.; Wyatt, L.R.; Roughan, M.; Schaeffer, A. Lagrangian and Eulerian characterization of two counterrotating submesoscale eddies in a western boundary current. J. Geophys. Res. Oceans 2018, 122, 4902–4921. [Google Scholar] [CrossRef]
  40. Mihanovic, H.; Pattiaratchi, C.; Verspecht, F. Diurnal Sea Breezes Force Near-Inertial Waves along Rottnest Continental Shelf, Southwestern Australia. J. Phys. Oceanogr. 2016, 46, 3487–3508. [Google Scholar] [CrossRef]
  41. Schaeffer, A.; Gramoulle, A.; Roughan, M.; Mantovanelli, A. Characterizing frontal eddies along the East Australian Current from HF radar observations. J. Geophys. Res. Oceans 2017, 122, 3964–3980. [Google Scholar] [CrossRef]
  42. Wandres, M.; Wijeratne, E.M.S.; Cosoli, S.; Pattiaratchi, C. The effect of the Leeuwin Current on offshore surface gravity waves in southwestwestern Australia. J. Geophys. Res. Oceans 2017, 122, 9047–9067. [Google Scholar] [CrossRef]
  43. Heron, M.L.; Atwater, D.P. Temporal and spatial resolution of HF ocean radars. Ocean Sci. J. 2013, 48, 99–103. [Google Scholar] [CrossRef]
  44. Integrated Marine Observing System (IMOS). 2018. NRSROT July 2017. Available online: http://data.aodn.org.au/IMOS/ANMN/NRS/NRSROT/Velocity/IMOS_ANMN-NRS_AETVZ_20170724T080000Z_NRSROT-ADCP_FV01_NRSROT-ADCP-1707-Sentinel-or-Monitor-Workhorse-ADCP-44_END-20171123T234000Z_C-20171124T012415Z.nc (accessed on 16 April 2018).
  45. Integrated Marine Observing System (IMOS). 2018. NRSROT November 2017. Available online: http://data.aodn.org.au/IMOS/ANMN/WA/WACA20/Velocity/IMOS_ANMN-WA_AETVZ_20170915T080000Z_WACA20_FV01_WACA20-1709-Continental-194_END-20180301T233000Z_C-20180302T042339Z.nc (accessed on 16 April 2018).
  46. Integrated Marine Observing System (IMOS). 2018. WATR50 March 2017. Available online: http://data.aodn.org.au/IMOS/ANMN/NRS/NRSROT/Velocity/IMOS_ANMN-NRS_AETVZ_20171123T080000Z_NRSROT-ADCP_FV01_NRSROT-ADCP-1711-Sentinel-or-Monitor-Workhorse-ADCP-44_END-20180409T002000Z_C-20180413T052411Z.nc (accessed on 16 April 2018).
  47. Integrated Marine Observing System (IMOS). 2018. WATR10 May 2017. Available online: http://data.aodn.org.au/IMOS/ANMN/WA/WATR50/Velocity/IMOS_ANMN-WA_AETVZ_20170308T000000Z_WATR50_FV01_WATR50-1703-Long-Ranger-Workhorse-ADCP-496_END-20171109T010000Z_C-20171117T055142Z.nc (accessed on 16 April 2018).
  48. Integrated Marine Observing System (IMOS). 2018. WACA20 September 2017. Available online: http://data.aodn.org.au/IMOS/ANMN/WA/WATR10/Velocity/IMOS_ANMN-WA_AETVZ_20170525T080000Z_WATR10_FV01_WATR10-1705-Aquadopp-Profiler-98_END-20171025T233000Z_C-20171129T052225Z.nc (accessed on 16 April 2018).
  49. Morello, E.B.; Galibert, G.; Smith, D.; Ridgwayd, K.R.; Howell, B.; Slawinskie, D.; Timms, G.P.; Evans, K.; Lynch, T.P. Quality Control (QC) procedures for Australia’s National Reference Station’s sensor data—Comparing semi-autonomous systems to an expert oceanographer. Methods Oceanogr. 2014, 9, 17–33. [Google Scholar] [CrossRef]
  50. Kundu, P.K. Ekman veering observed near the ocean bottom. J. Phys. Oceanogr. 1976, 6, 238–242. [Google Scholar] [CrossRef]
  51. Breaker, L.C.; Gemmill, W.H.; Crosby, D.S. The application of a technique for vector correlation to problems in meteorology and oceanography. J. Appl. Meteorol. 1994, 33, 1354–1365. [Google Scholar] [CrossRef]
  52. Efron, B.; Tibshirani, R. Bootstrap methods for standard errors, confidence intervals, and other measures of statistical accuracy. Stat. Sci. 1986, 1, 54–77. [Google Scholar] [CrossRef]
  53. Cosoli, S.; Gacic, M.; Mazzoldi, A. Variability of currents in front of the Venice Lagoon, Northern Adriatic Sea. Ann. Geophys. 2008, 26, 731–746. [Google Scholar] [CrossRef] [Green Version]
  54. Cosoli, S.; Gacic, M.; Mazzoldi, A. Surface current variability and wind influence in the northeastern Adriatic Sea as observed from high-frequency (HF) radar measurements. Cont. Shelf Res. 2012, 33, 1–13. [Google Scholar] [CrossRef]
  55. Welch, P.D. The use of fast-Fourier transform for the estimation of power spectra: A method based on time-averaging over short, modified periodograms. IEEE Trans. Audio Electroacoust. 1967, 15, 70–73. [Google Scholar] [CrossRef]
  56. Paduan, J.D.; Rosenfeld, L.K. Remotely sensed surface currents in Monterey Bay from shore-based HF radar (CODAR). J. Geophys. Res. 1996, 101, 20669–20686. [Google Scholar] [CrossRef]
  57. Cosoli, S.; Bolzon, G. Accuracy of surface current mapping from High-Frequency (HF) ocean radars. Bollettino di Geofisica Teorica ed Applicata 2014, 55. [Google Scholar] [CrossRef]
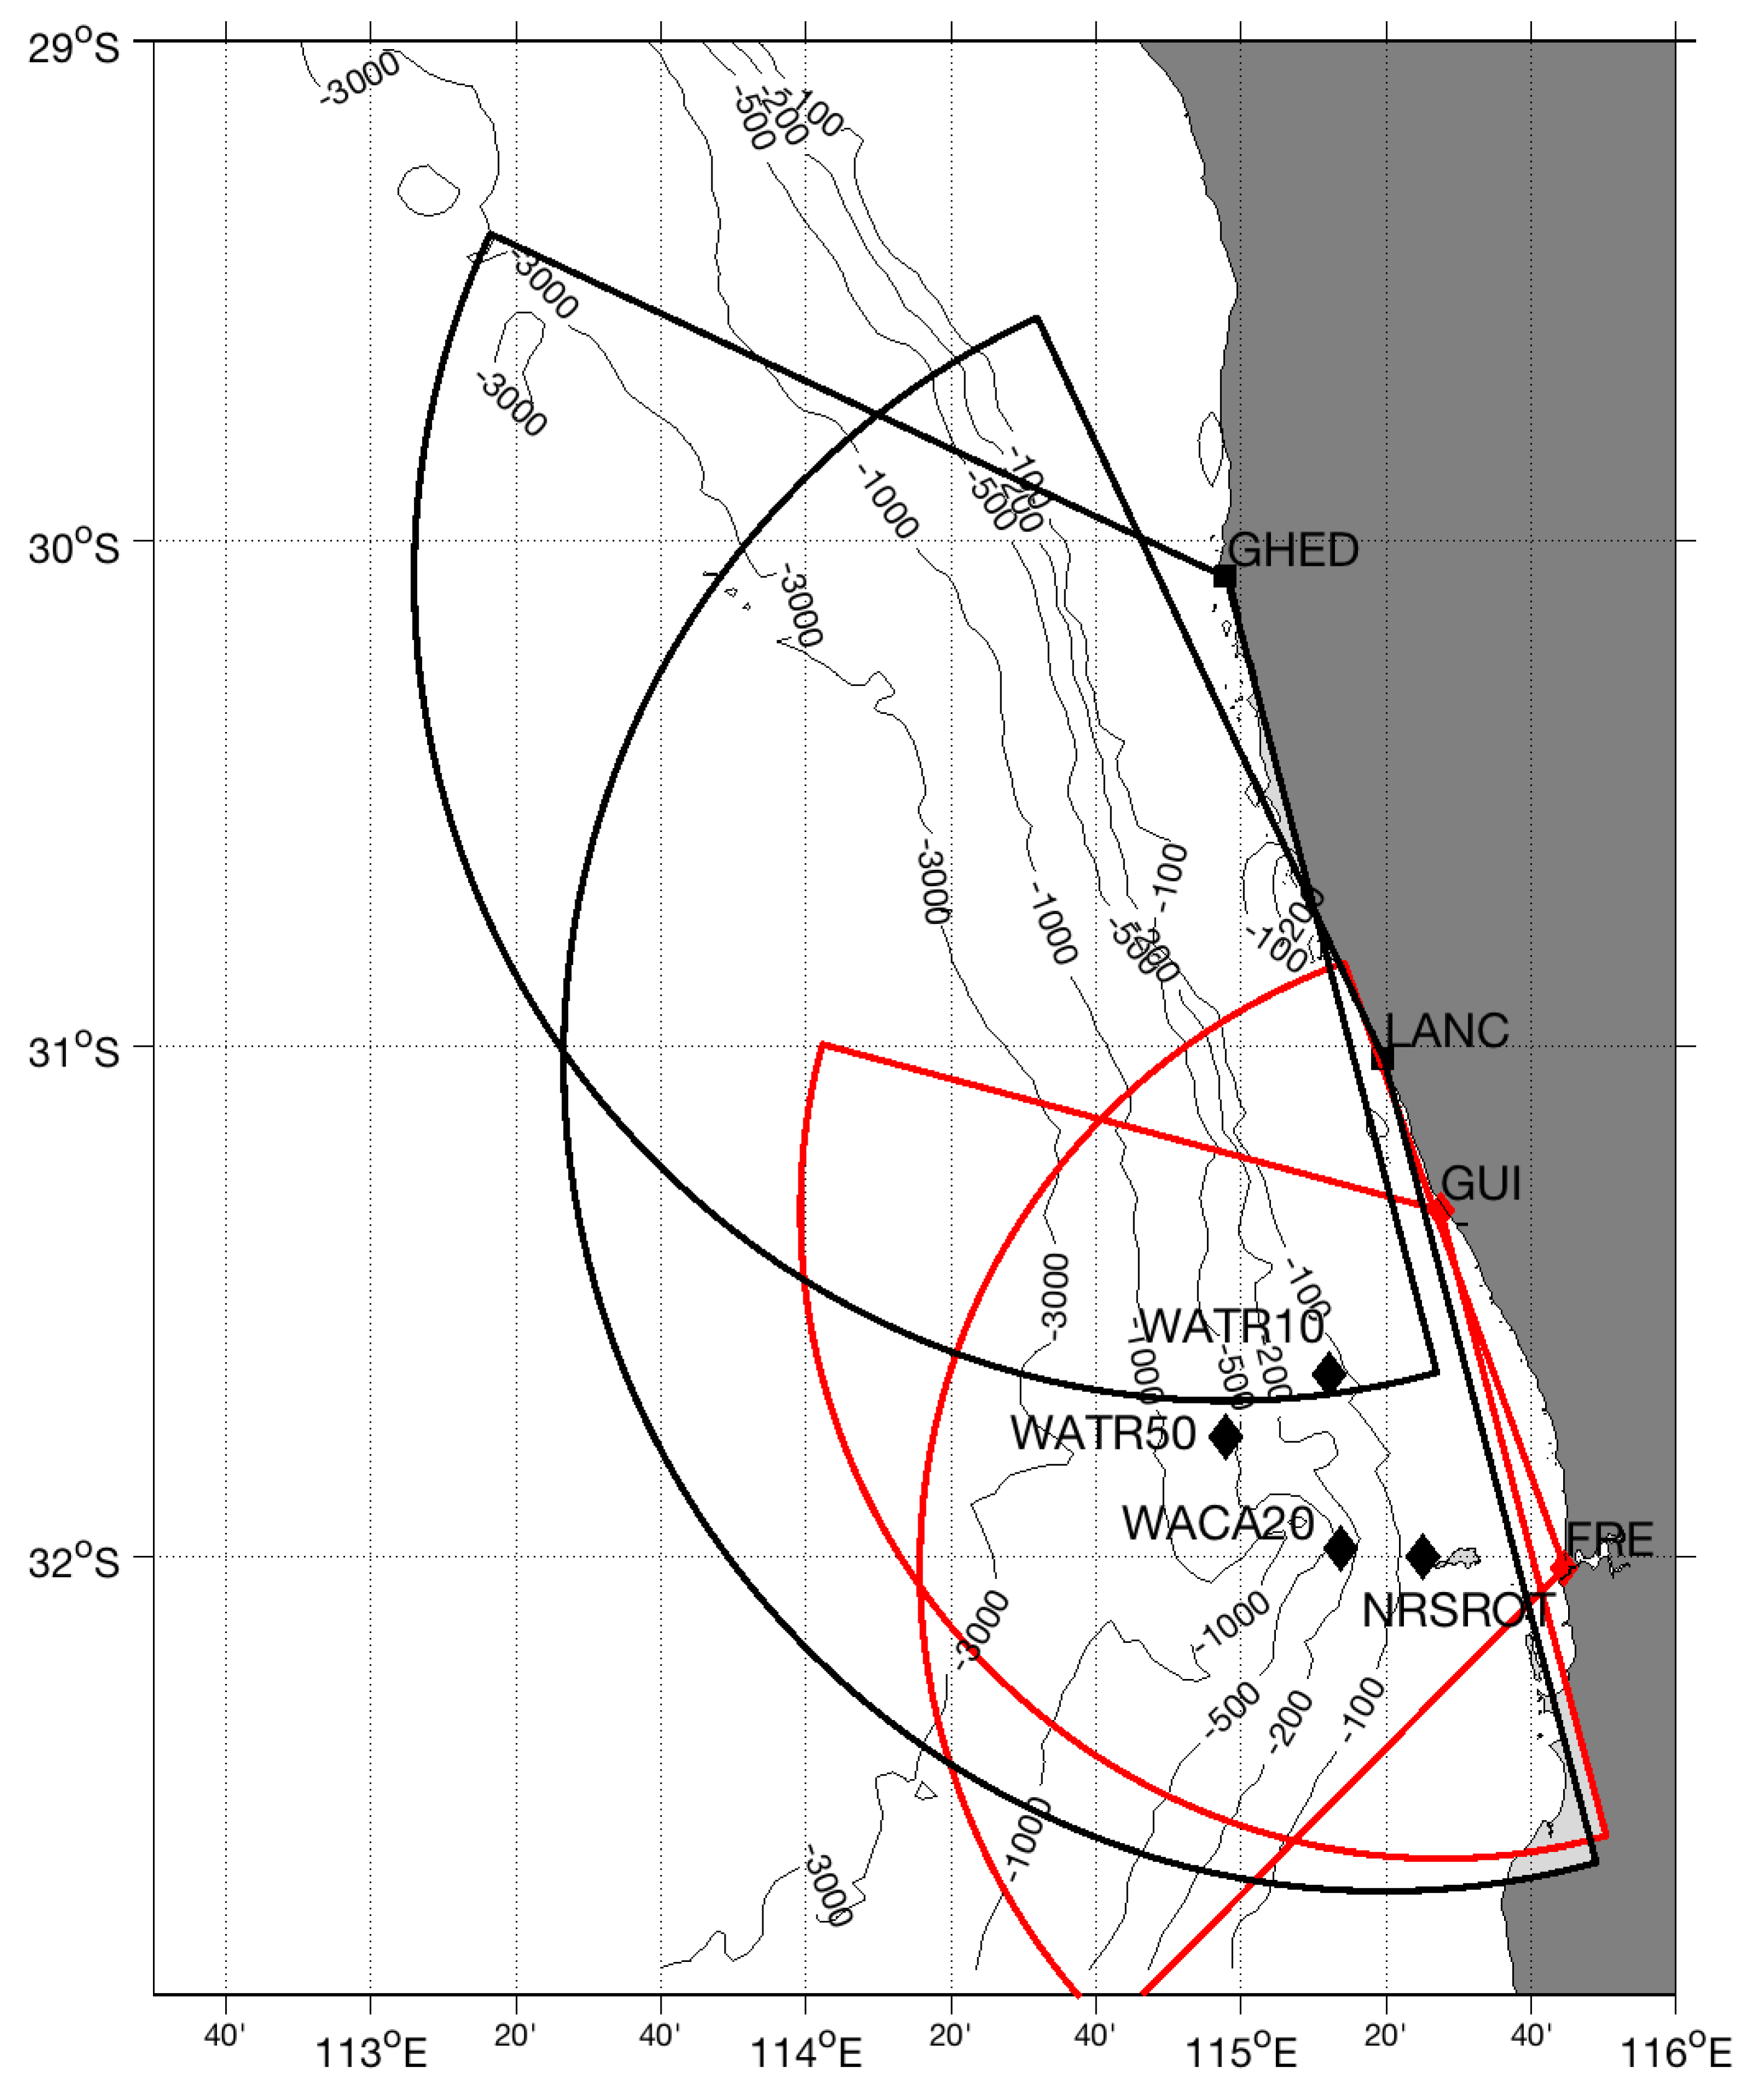
Figure 1. Coverage of the high-frequency radar (HFR) systems deployed along the Western Australia (WA) coast, with the dominant bathymetric features. Red (black) markers are used for the WEllen RAdar WERA (SeaSonde) Fremantle (FRE) and Guilderton (GUI) stations (Green Head (GHED) and Lancelin (LANC)); red (black) areas show the typical coverage of each HFR station. Mooring locations are marked as black diamonds inside the HFR footprints. NRSROT, WATR50, WATR10 and WACA20 stand for Rottnest Reference Station, WA Two Rocks 490 m, WA Two Rocks 103 m, and WA Perth Canyon 200 m moorings, respectively.
Remotesensing 11 00291 g001
Figure 2. Bearing error analysis for LANC HFR SeaSonde site, showing the color-coded magnitude of correlation between HFR radial velocity over bearing and subsurface currents at the mooring locations. Black markers are used for the mooring locations, while red markers identify the locations that maximize the correlation at each specific range.
Remotesensing 11 00291 g002
Figure 3. Data return maps for different HFR network configuration: (a) refers to FRE–GUI stations (default ROT WERA configuration); (b) shows the coverage obtained merging FRE and LANC radial data; (c) same as (b) but for the GUI–LANC pair; and (d) coverage obtained with the FRE–GHED configuration. The colormap documents the percent data availability for the different configurations. Locations of the moorings are marked as red squares. Refer to Figure 1 for the codes of the HFR systems and the moorings.
Remotesensing 11 00291 g003
Figure 4. Rotary spectra for the WATR50 data at the 56 m level and corresponding rotary spectra for HFR surface currents at the radar grid cell closest to the mooring location. Units for frequency and power spectral density are cycles per hour (cph) and (m/s)2/cph, respectively.
Remotesensing 11 00291 g004
Figure 5. Spatial distribution of correlation between WERA and merged SeaSonde–WERA radial current maps, and corresponding time-averaged current patterns: (a) refers to the zonal component; (b) refers to the meridional component; (c) is the amplitude of the vector correlation; and (d) presents the time-averaged current patterns for the WERA (red arrows) and the merged SeaSonde–WERA (black arrows). Vectors are plotted every two grid points and offset by one grid point to improve readability. Locations of the moorings are marked as red squares.
Remotesensing 11 00291 g005
Figure 6. Spatial distribution of the mean bias (m/s) for the two velocity components between WERA and merged SeaSonde–WERA: (a) refers to the zonal component; (b) refers to the meridional component. Locations of the moorings are marked as white squares.
Remotesensing 11 00291 g006
Table 1. Details of the mooring in the Rottnest Shelf region. See Figure 1 for their locations within the HFR coverage area. NRSROT, WATR50, WATR10 and WACA20 stand for Rottnest Reference Station, WA Two Rocks 490 m, WA Two Rocks 103 m, and WA Perth Canyon 200 m moorings, respectively.
Mooring NameInstrument TypeUpwards/Downwards LookingSeafloor Depth (m)Deployment Depth (m)Blanking Distance (m)Bin Resolution (m)Temporal Resolution (min)
NRSROTRDI WorkHorseUpwards47443220
WATR50RDI Long RangerUpwards50049624.51630
WATR10Nortek Aquadopp ProUpwards104983.52.530
WACA20Nortek 190 KHz ContinentalUpwards2001947530
Table 2. Comparison of surface HFR and subsurface radial data for the WERA and SeaSonde HFR stations. Radar look angle in the direction of the mooring (counterclockwise north) is also provided along with percent data available for the comparisons. R is the correlation coefficient between radial velocities as defined in Equation (1). Units for RMSD (bias) are cm/s.
MooringDistance from Surface (m)FRE Radar−look Angle/% DataFRE R (95% CL)/RMSD (bias)GUI Radar−look Angle/% DataGUI R (95% CL)/RMSD (bias)LANC Radar−look Angle/% DataLANC R (95% CL)/RMSD (bias)GHED Radar−look Angle/% DataGHED R (95% CL)/RMSD (bias)
NRSROT1587/960.14 (0.09, 0.18)/10.3 (1.3)175/980.31 (0.26, 0.34)/27.6 (2.9)184/410.42 (0.49)/31.0 (0.04)−/−−/−
NRSROT1587/55−0.03 (−0.11, 0.05)/9.2 (0.5)175/710.18 (0.10, 0.24)/30.3 (−4.6)−/−−/−−/−−/−
WATR505668/950.74 (0.71, 0.75)/19.3 (1.5)133/980.44 (0.40, 0.48)/24.2 (2.7)157/690.33 (0.26, 0.40)/27.5 (−0.11)180/110.39 (0.20, 0.54))/33.6 (0.22)
WATR104340/920.57 (0.53, 0.61)/17.8 (−5.2)141/960.48 (0.43, 0.51)/12.2 (5.2)170/510.1 (−0.01, 0.20)/26.2 (0.03)187/20.38 (−0.24, 0.78)/37.2 (0.2)
WACA203296/920.25 (0.20, 0.29)/14.2 (−3.5)161/990.61 (0.58, 0.63)/20.5 (4.1)175/530.29 (0.21, 0.36)/34.8 (0.09)−/−−/−
Table 3. Same as Table 1 but for the radar angle at which correlation with mooring currents is maximized. Results are displayed for both WERA and SeaSonde HFR stations. Units for RMSD (bias) are cm/s.
MooringDistance from Surface (m)FRE Max Angle/% DataFRE R (95% CL)/RMSD (bias)GUI max Angle/% DataGUI R (95% CL)/RMSD (bias)LANC Max Angle/% DataLANC R (95% CL)/RMSD (bias)GHED Max Angle/% DataGHED R (95% CL)/RMSD (bias)
NRSROT1589/960.14 (0.09, 0.18)/10.3 (1.3)170/980.42 (0.38, 0.45)/25.8 (3.3)193/180.52 (0.40, 0.61)/29.8 (−0.05)195/0.21 (1, 1)/10.9 (0)
NRSROT1544/550.07 (−0.016, 0.15)/ 9.6 (0.2)167/720.31 (0.23, 0.37)/29.6 (−2.8)−/−−/−−/−−/−
WATR505673/950.78 (0.76, 0.79)/ 18.2 (−3.5)130/980.56 (0.53, 0.59)/21.4 (5.9)165/650.53 (0.47, 0.59)/21.4 (−0.07)193/1.80.68 (0.28, 0.87)/41.6 (0.36)
WATR104343/920.58 (0.54, 0.32)/ 20.3 (0.1)145/960.48 (0.43, 0.51)/12.2 (5.2)191/140.72 (0.59, 0.80)/17.5 (−0.06)195/9.50.42 (0.17, 0.61)/26.7 (0.1)
WACA203287/920.31 (0.27, 0.34)/ 14.3 (−2.5)161/990.61 (0.58, 0.63)/20.6 (4.1)177/450.38 (0.31, 0.45)/33.1 (0.07)169/0.2%0.91 (1, 1)/ 19.4 (0.2)
Table 4. Comparison between WERA surface HFR currents and subsurface current data at the mooring locations. Units for RMSD and phase angle are cm/s and degrees, respectively. Positive (negative) values for phase angle indicate that surface HFR currents are rotated counterclockwise (clockwise) from subsurface currents.
MooringDistance from Surface (m)NRU (95% CL)/RMSDU (biasU)RV (95% CL)/RMSDV (biasV)ρ (95% CL)/φ
NRSROT15663−0.12 (−0.19, −0.04)/13.5 (−0.5)0.61 (0.56, 0.65)/20.7 (3.3)0.58 (0.05, 0.64/ −28°
NRSROT152500.31 (0.19, 0.42)/12.3 (−4.9)0.69 (0.62, 0.75)/21.1 (−0.5)0.66 (0.05, 0.70)/−10°
WATR50567610.83 (0.82, 0.86)/13.2 (−2.3)0.86 (0.85, 0.88)/15.4 (6.5)0.86 (0.06, 0.92)/−6°
WATR10434110.34 (0.26,0.43)/15.7 (−1.9)0.70 (0.65, 0.75)/15.9 (8.3)0.65 (0.05, 0.68)/ 28°
WACA203214500.34 (0.29, 0.38)/14.5 (−5.1)0.78 (0.77, 0.81)/17.3 (9.6)0.68 (0.06, 0.73)/−9°
Table 5. Comparison between WERA HFR currents and SeaSonde−WERA HFR currents at the mooring locations. Units for RMSD and phase angle are cm/s and degrees, respectively. Positive (negative) values for phase angle indicate that WERA HFR currents are rotated counterclockwise (clockwise) from SeaSonde−WERA HFR currents.
MooringDistance from Surface (m)NRU (95% CL)/RMSDU (biasU)RV (95% CL)/RMSDV (biasV)ρ (95% CL)/φ
NRSROT154990.89 (0.87 0.90)/3.5 (−0.9)0.40 (0.33, 0.47)/24.1 (−6.4)0.45 (0.05, 0.62)/−5°
NRSROT15− /−− /−− /−
WATR50569880.93 (0.92, 0.94)/9.1 (4.4)0.65 (0.62, 0.65)/23.0 (11.1)0.78 (0.10, 0.82)/ 8°
WATR104310570.81 (0.79, 0.83)/13.9 (−8.3)0.78 (0.76, 0.80)/16.4 (−9.8)0.79 (0.26, 0.89)/22°
WACA20328000.98 (0.98, 0.99)/2.9 (−1.6)0.54 (0.49, 0.59)/29.7 (−16.5)0.63/1.5°
Table 6. Same as Table 3a but refers to the combined SeaSonde−WERA HFR data.
MooringDistance from Surface (m)NRU (95% CL)/RMSDU (biasU)RV (95% CL)/RMSDV (biasV)ρ (95% CL)/φ
NRSROT15732−0.20 (−0.27, −0.13)/14.6 (1.6)0.51 (0.45, 0.56)/26.2 (−1.3)0.47 (0.04, 0.64)/25°
NRSROT15−/−−/−−/−
WATR50566340.83 (0.81, 0.85)/14.3 (1.1) 0.63 (0.58, 0.63)/22.5 (12.8)0.72 (0.15, 0.73)/ 7°
WATR10433680.23 (0.14, 0.33)/24.2 (−9.5)0.39 (0.31, 0.48)/19.9 (−0.4)0.50 (0.07, 0.61)/51°
WACA203214500.34 (0.29, 0.38)/ 14.6 (−5.1)0.79 (0.77, 0.81)/17.3 (9.6) 0.68 (0.06, 0.73)/3°