Article

Detecting and Mapping Slag Heaps at Ancient Copper Production Sites in Oman

1
Department of Science Education, Samtse College of Education, Royal University of Bhutan, Samtse, Samtse Dzonkhag 22001, Bhutan
2
Department of Archaeology, The University of Sydney, Sydney, NSW 2006, Australia
3
Department of Near Eastern Studies, Johns Hopkins University, Baltimore, MD 21218, USA
4
Life Design Lab, Johns Hopkins University, Baltimore, MD 21218, USA
5
Department of Earth and Planetary Sciences, Johns Hopkins University, Baltimore, MD 21218, USA
6
Ministry of Heritage and Culture, Bat 511, Oman
7
School of Civil and Environmental Engineering, The University of New South Wales, UNSW SYDNEY, Kingsford, NSW 2052, Australia
8
Department of Applied Physics and Astronomy, College of Sciences, University of Sharjah, Sharjah 27272, UAE
9
Department of Earth Sciences, College of Science, Sultan Qaboos University, Al-Khod, Muscat 123, Oman
*
Author to whom correspondence should be addressed.
Remote Sens. 2019, 11(24), 3014; https://doi.org/10.3390/rs11243014
Submission received: 8 October 2019 / Revised: 11 December 2019 / Accepted: 11 December 2019 / Published: 14 December 2019
(This article belongs to the Special Issue 2nd Edition Advances in Remote Sensing for Archaeological Heritage)

Abstract

:
This study presents a new approach for detection and mapping of ancient slag heaps using 16-band multispectral satellite imagery. Understanding the distribution of slag (a byproduct of metal production) is of great importance for understanding how metallurgy shaped long-term economic and political change across the ancient Near East. This study presents results of slag mapping in Oman using WorldView-3 (WV3) satellite imagery. A semi-automated target detection routine using a mixed tuned matched filtering (MTMF) algorithm with scene-derived spectral signatures was applied to 16-band WV3 imagery. Associated field mapping at two copper production sites indicates that WorldView-3 satellite data can differentiate slag and background materials with a relatively high (>90%) overall accuracy. Although this method shows promise for future initiatives to discover and map slag deposits, difficulties in dark object spectral differentiation and underestimation of total slag coverage substantially limit its use. Resulting lower estimations of combined user’s (61%) and producer’s (45%) accuracies contextualize these limitations for slag specific classification. Accordingly, we describe potential approaches to address these challenges in future studies. As sites of ancient metallurgy in Oman are often located in areas of modern exploration and mining, detection and mapping of ancient slag heaps via satellite imagery can be helpful for discovery and monitoring of vulnerable cultural heritage sites.

Graphical Abstract

1. Introduction

Researchers previously achieved mixed success using satellite imagery to map archaeological slag. Pryce and Abrams published efforts to extract spectral signatures of ancient copper mining sites in Thailand from ASTER imagery [1]. Band combinations across multispectral wavelengths (VNIR–SWIR) were examined and spectral indices were used in attempts to distinguish unique spectral features indicative of archaeological targets. Pryce and Abrams reported that low spatial resolution, pervasive vegetation cover, and the small size of archaeological sites prevented identification of a spectral signature characteristic of ancient metallurgical material. However, they also suggested that similar investigations in less vegetated contexts might be more successful in identifying distinct spectral signatures for metallurgical production.
Concordantly, Savage et al. [2,3,4,5] used hyperspectral imagery to map archeometallurgical production in the far more arid copper mining district of Wadi Faynan in Jordan. They used a combination of principal components analysis, similarity matrices, and spectral mixture analysis with NASA’s EO-1 Hyperion imagery. Savage et al. observed that slag mounds exhibited different spectral profiles corresponding to different parent end-member spectra. The project also used the imagery to identify spectrally similar groundcover as candidate areas for future field investigation. Despite these promising results, the authors reported that limitations of Hyperion imagery, including low spatial resolution, a weak signal-to-noise ratio, and limited coverage in the Short-Wave Infrared (SWIR) wavelengths, hindered detection, and mapping of slag heaps.
To overcome previously documented obstacles, we investigated high spatial resolution WorldView-3 (WV3) imagery for detecting and mapping archaeological slag heaps. WV3 measures visible near infrared (VNIR) and shortwave infrared (SWIR) in a combined total of 16 available spectral bands [6]. With the ability to collect imagery off nadir, the spatial resolution of WV3 ranges from 1.24 to 1.38 m at 20° off nadir in VNIR bands and 3.7 m to 4.10 m at 20° off nadir in SWIR bands. SWIR data is resampled to 7.5 m for public distribution, however higher resolution SWIR has more recently become available. While lower in overall spectral resolution than EO-1 Hyperion, WV3’s key spectral band placement and much higher spatial resolution appears particularly well suited to address the limitations of previous remote sensing efforts to map archaeological slag. Accordingly, we hypothesized that employing scene-based target detection routines with WV3 would be helpful for detecting and mapping slag in the arid environments of Oman.

2. Materials and Methods
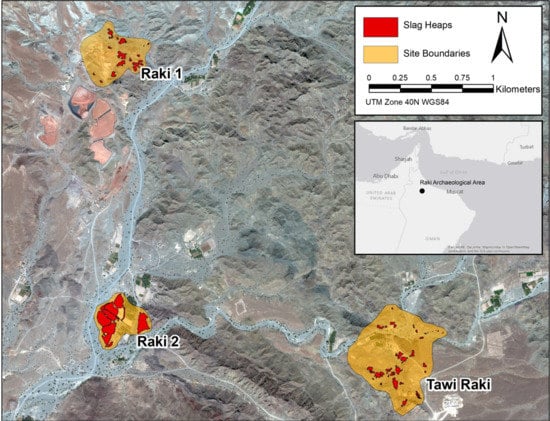
2.1. Study Area

Wadi Raki is a drainage in Al-Dhahirah Governorate of Oman near the modern town of Yanqul (Figure 1). Situated along the western side of the Al-Hajar Mountains, Wadi Raki originates in rugged terrain and runs southwest across a broad gravel plain before entering Yanqul. Early surveys of Wadi Raki in the late 1970s [7,8] followed by archaeological excavations in 1995 and 1996 identified extensive evidence of early Iron Age (ca. 1200–800 BCE) and early Islamic copper production (ca. CE 700–950) [9] (pp. 142–144) [10] (pp. 108–115). Copper production sites within the Wadi Raki drainage are distributed in three large clusters of ancient activity referred to as Raki 1, Raki 2, and Tawi Raki (Figure 1). These initial archaeological investigations provide an estimated total of nearly 200,000 tons of slag [11] (pp. 116–117), making Wadi Raki one of the largest primary metal production sites in Southeast Arabia.
The location of metal production in the Raki area is closely related to the region’s complex geologic history and the associated availability of copper. During the Late Cretaceous (ca. 95 Ma) an ophiolitic package of local geology formed through a sequence of fast oceanic spreading and supra-subduction zone volcanism within the Tethys Ocean, an ancient seaway that separated elements of Laurasia and Gondwana following the breakup of Pangea [12,13,14,15]. Geochronological, petrological, and structural evidence point towards this volcanism and creation of oceanic crust occurring within a geologically short period of a few million years or less [12,13,14,15,16].
In the middle–upper Cretaceous, tectonic cycling brought about the closure of the Tethys. Instead of being subducted beneath the continental margin, as is typical for oceanic lithosphere, a package of this relatively young and hot oceanic lithosphere was thrust up and onto the stable Arabian Craton in a process known as obduction [17]. The oceanic rocks that form this obducted package are collectively known as the Semail Ophiolite Complex (SOC). The SOC has been described as one of the best exposed and most complete ophiolitic assemblages in the world [13,14,15,17].
The geology at the Raki archaeological sites represents the uppermost levels of this SOC sequence (Figure 2). Volcanic rocks range in composition from primarily basalt to basaltic andesite, and formed in direct contact or in close proximity to sea water near the paleo-ocean floor [14,18,19]; observable structures within this volcanic sequence, including pillowed surfaces and brecciated flows, are demonstrative of this formation environment [20,21]. Throughout the SOC, upper volcanic rocks have been classified into three to five separate units representing different stages of volcanic eruption across oceanic spreading center and supra-subduction zone environments [13,18,22]. Importantly, these submarine volcanic environments present conditions favorable for hydrothermal alteration and local emplacement of base metals. The renowned copper resources of Oman are a product of this hydrothermal overprinting process [17,23].
Within the volcanostratigraphic sequence of the SOC, at least 150 individual Volcanogenic Massive Sulfide (VMS) deposits have been identified [24]. A typical iron-rich cap (gossan) represents the oxidized upper portion of the copper-rich sulfide orebody below, making VMS deposits often distinctly visible on the landscape surface. Gossans are usually the first indicators for an underlying copper deposit and such manifestations were particularly important for resource exploration in ancient mining communities that lacked modern exploration techniques. VMS have served as the primary sources for copper in Oman, and have been exploited in both historic as well as modern times [17]. At least three VMS bodies are present at the Raki area: one at Raki 1, one at Tawi Raki, and one located approximately 4 km to the west near the town of Sayeh. The deposits at Raki 1 and Tawi Raki share evidence of extraction and exploration during both ancient and modern times.

2.2. Archaeological Context

Archaeological research in Southeast Arabia demonstrates a long history of copper production [25,26], with the earliest evidence for production dating to the late 4th millennium BCE [27]. Archeometallurgical surveys focused on the distribution of copper ore sources and copper production in Southeast Arabia, and Oman in particular, first began in the 1970s [28,29,30]. Beginning in 1977 and over the course of four field seasons, the Deutsches Bergbau Museum conducted an extensive program of surveys, excavations and laboratory analyses that outlined the development of metallurgy in the region [11,31,32,33,34,35,36], provided empirical evidence for long-distance trade of copper from ancient Oman to Mesopotamia and beyond [37], and began to identify the social, economic, and environmental implications of ancient copper production [38]. In conjunction with geological surveys in the region, this work identified over 50 major copper deposits and more than 100 minor deposits, which often displayed accumulations of early Islamic production, occasionally Iron Age and less frequently Bronze Age production [39] (p. 270).
Some of the earliest descriptions of the Wadi Raki copper source and associated archaeological sites, in particular slag heaps, come from the USGS 1973–1974 mineral deposit survey in northern Oman [40] and by Centre National de la Recherche Scientifique (CNRS) archaeologists [7]. Focused surveys and excavations in Wadi Raki led by Gerd Weisgerber in 1995–1996 demonstrated that there were three large clusters of slag heaps with evidence for both Early Iron Age and Early Islamic exploitation [9,10]. This work focused efforts on Raki 2, where an Early Iron Age settlement is associated with slag heaps with depths of 5–6 m. Five radiocarbon ages date the occupation to ca. 1200–800 cal. BCE. Evidence from their excavations demonstrated that copper production intensified in scale at the beginning of the Iron Age in Oman, leaving a significant impact on the surrounding landscape.
Less is known about the two other concentrations of slag heaps, Raki 1 and Tawi Raki, however recent investigations by our team confirm the predominance of early Islamic exploitation (ca. CE 700–950). The distribution of slag at these sites is markedly different from Raki 2 (See Figure 1). Raki 1 and Tawi Raki are larger in scale with well-delineated boundaries of slag heaps associated with separated roasting and smelting furnaces. These sites are also located in direct association with the gossan cap of the underlaying copper sulfide body (see Figure 2) and exhibit less evidence of settlement activity. Separated by a period of ca. 1900 years, the early Islamic period of exploitation marks another dramatic increase in copper production, a pattern which is replicated at major copper sources across Oman [38,41].
Encroachment of modern development poses substantial risk to the archaeological sites of the Raki area. Modern mining operations as well as residential occupations and small-scale agriculture are in close proximity to slag heaps at Raki 1, Raki 2, and Tawi Raki. Furthermore, bulldozing of slag heaps to clear ground for geologic coring has been observed, and appears to be ongoing, in a number of areas. Any alteration to the structure and distribution of these slag features can seriously impact the preservation of their archaeological record. As such, culture heritage managers are in need of reliable and accurate depictions of these archaeological landscapes. In order to best document the current distribution of slag at these sites, our team employed a combined remote sensing and field survey approach.

2.3. Methodology

Archaeological field surveys of the Wadi Raki area were completed by the Archaeological Water Histories of Oman (ArWHO) Project during in January 2019. While the distribution of archaeological slag heaps at the site at Raki 2 were relatively well defined, the areas of Raki 1 and Tawi Raki were less understood. We employed a combined approach of field survey aided by concurrent remote sensing to locate and document the presence of slag heaps in these less understood areas. Prior to field mapping, satellite imagery was used to help identify key target areas around each archaeological site. Detection results were loaded onto an iPad and taken into the field to help guide and plan survey efforts. Field survey (as described in Section 2.3.3) guided by the remotely sensed detection products confirmed and mapped slag heaps that were detected within the imagery and also documented other slag features that were not detected via remote sensing. Over the course of the field survey, we developed a characterization protocol for the slag features observed on the ground based on their spatial extent, homogeneity, and relative density of slag cover. To analyze our detection products, a final accuracy assessment was completed with reference to the characterized field derived GNSS data for observed slag heap coverage. The following sections detail this process.

2.3.1. Imagery and Data Processing

Worldview-3 standard 2A imagery of the ArWHO Al-Dhahirah study area was obtained free-of-charge from the DigitalGlobe Foundation. This included three swaths of imagery, including SWIR bands, covering approximately 3925 km2. The imagery was collected on 17 October, 2017 with a mean off nadir view angle of 21°.
Worldview-3 imagery was processed and analyzed using Environment for Visualizing Images (ENVI) v5.3 software. Steps requiring spectral layer stacking were executed using Earth Resources Data Analysis System (ERDAS) Imagine v2018 software, which was selected for operability and performance.
Multispectral tiles and the corresponding SWIR swath were processed separately, and then stacked and mosaiced to create a full coverage raster for the study area. Conversion from delivered Digital Number (DN) values to at sensor radiance was completed using the ENVI radiance conversion tool and radiometric scaling factors stored within the imagery metadata. The ENVI Fast Line-of-sight Atmospheric Analysis of Hypercubes (FLAASH) atmospheric correction package was used to compensate for atmospheric inference [42]. Though atmospheric correction is not specifically required for the scene-based target detection routine used in this study (see Section 2.3.2), we chose to include this standard correction process in order to improve future replicability of the methods with the potential to expand target detection across multiple scenes (likely gathered at different temporal intervals). FLAASH uses the MODTRAN4 radiation based transfer code to model atmospheric and aerosol interference [43]. The atmospheric model for FLAASH was set as tropical for these scenes and a rural aerosol modal was selected to most accurately characterize the image acquisition conditions. FLAASH corrected multispectral tiles were then stacked with the corrected and corresponding SWIR bands, resulting in a datacube of 16 bands resampled to delivered VNIR band spatial resolution. Imagery around each archaeological site was then spatially subset to an approximately 1 km2 bounding box to limit the detection area and speed processing time.

2.3.2. Slag Detection

Minimum Noise Fraction Transformation was applied to the data to whiten noise and the full 16 band stack was transformed into MNF space [44]. Spectral signatures were derived from image Regions of interest (ROIs) placed locally within well understood slag heap pixels at the site of Raki 2. These pixels were selected due to extensive prior field work, well known and characterized slag heap locations, and a general understanding of the slag heap local character. The average target spectra of slag derived from these ROIs can be seen in Figure 3.
A target detection routine was executed using a Mixed Tuned Match Filtering (MTMF) algorithm following the processing steps of the Spectral Hourglass Workflow within ENVI v5.3. The MTMF approach allows for the combination of both partial unmixing and subpixel abundance estimation [45]. We chose to investigate this approach due to its unique combination of “products that cannot be simultaneously achieved using standard mixture modeling or spectral angle mapping algorithms” [45], and its given success as a target detection approach in both geological contexts [46,47,48] and WV3 applications [49].
Matched filtering is described as a partial unmixing routine that calculates an estimated value of target abundance for each pixel [45,50]. The technique identifies pixels within a scene that display the strongest spectral similarity to the target spectrum. With the input data projected into MNF space, this process also works to suppress the general background spectra of the scene. The MTMF algorithm therefore offered an approach for detection of spectrally similar slag pixels without requiring knowledge or discrimination of all endmembers in the image scene. As the number of spectral end members was likely small in comparison to WV3’s 16 bands, this partial unmixing approach could help in discriminating slag from other dark targets. Additionally, matched filtering results offer an approximation of material abundance within individual pixels. While not substantially investigated in this paper, opportunities for sub-pixel abundance analysis could prove useful for future slag mapping efforts. Finally, the mixture tuning phase of the algorithm provides the additional benefits for identifying and rejecting false positives. As we anticipated false positive detection of similar dark materials to be a likely issue, the MTMF approach appeared better suited for our task than other traditional target detection models.
Excellent descriptions of the MTMF approach are offered by Goodarzi Mehr et al. 2013 [48] and Mund et al. 2007 [45] citing the work of Boardman 1993 [51]. An abbreviated description and relevant equations are presented for this paper. To complete this routine, the matched filter vector (MFV) is first calculated via the following equation [48,51]:
MFV = (CMNF−1 × tsMNF)/(tsMNFT × CMNF−1 × tsMNF)
where CMNF−1 is the diagonal inverse of the MNF covariance matrix; tsMNF is the target spectrum converted to MNF space (in this case slag signatures derived from the ROI at Raki 2). Once calculated, the MNF data is projected onto the MFV, and the matched filter values are calculated as follows [48,51]:
MFI = MFV × DMNF
where MFI is the resulting matched filter image and DMNF is the MNF data set.
As the matched filtering (MF) process is known to be limited in its ability to differentiate false positive results [46], the mixture tuned (MT) variable can help to exclude erroneously detected pixels. The mixture tuned approach calculates an infeasibility score for each pixel spectrum by measuring the Euclidean distance of the pixel from the identified target mean spectrum based on the concept of mixing feasibility [45,48]. Once complete, the MF and MT scores can be considered concurrently to enhance the evaluation and screening of false positive detections [50]. Presented as noise sigma units, the MT score is calculated via the following equation [48,51]:
MTi = (Σ (((DMNFi − dmi)/MTevali)2))1/2
where MTi is the mixture-tuned value for pixel i; DMNFi is the MNF spectrum for the pixel i; dmi is the appropriate mean value for pixel i; and MTevali is the interpolated vector of eigenvalues for pixel i.
The output of the mixed tuned match filtering (MTMF) detection creates a composite image with a matched filter (MF) score and infeasibility score for each pixel. The MF score indicates an estimated relative degree of matching between the pixel values and the endmember spectrum, while the infeasibility results indicate the relative feasibility of the MF score. ENVI allows the selection of pixels that have high MF scores and low infeasibilities via an interactive 2D scatter plot. Threshold variables inferred as positive detection were set at pixels that attained an MF score greater than 0.6 and an infeasibility score less than 4. These threshold levels were identified by distinguishing spatially coherent pixel clusters of target detection results overlain on true color imagery. While the 2D visualizer selection method can be somewhat subjective, the identified threshold scores resulted in a highly selective MTMF feasibility ratio [50] (MF score/infeasibility score) of 0.15.
While the MT process helped to reduce false positive detections, visual interpretation of these detection results still displayed some obvious false positive outputs. These were recognized as single or small clusters of spatially segregated pixels occurring in locations such as steep slopes and variable elevations that were unlikely to contain slag deposits (based on known field characteristics). As the initial objective for remote sensing was to identify large and spatially consistent slag features, we sought to implement an additional process to address these isolated false positive detections. To clean MTMF results and remove these remaining false positive errors, a final filtering process was completed.
Raw MTMF detections were filtered through a two phase processes to produce final slag heap detection polygons using ENVI sieve and clump functions (Figure 4). MTMF rasters were converted to classification datasets in ENVI 5.3 and run through the classification wizard. First, a sieve function using blob grouping was performed with a default pixel criterion of 3 to remove speckling noise resulting from isolated pixels within the detection product. Next, a clump function with a default dilate kernel and erode kernel criterion of 9 was used to remove small regions of false positive detection, and clump together remaining pixel clusters. Final shapefile polygons were created from the filtered MTMF data and exported in ArcMap. These final shapefiles polygons were georeferenced (slight corrections of ~5 m) in ArcGIS Desktop 10.5.1 to compensate for geographic deviation inherent within the commercially delivered WV3 product.
Both the raw detection products and final detected shapefile boundaries were used to aid in field mapping of the slag deposits. Through field evaluation, it was noted that some small pixel clusters within the raw detection rasters that were removed during the filtering process correctly identified areas of diffuse slag scatters. Critical review of these raw detection products allowed us to infer whether some isolated pixels were likely false positive detections (e.g., in close proximity to observable shadows) or where these pixels might in fact be correctly depicting slag cover. Consideration of these filtered pixel clusters helped to direct field mapping on numerous occasions, and without their use it is likely that some small slag scatters would have been missed by field survey. Differentiation between slag heaps and slag scatters is further addressed in the following section.

2.3.3. Field Survey

Field mapping was accomplished using Global Navigation Satellite System (GNSS) equipment supplied by the Johns Hopkins University, Spatial Observation Laboratory for Archaeological Research (SOLAR). We mapped slag heaps using a Trimble GeoXH 6000 GPS receiver (running TerraSync version 5.86 Centimeter Edition software) connected to a backpack mounted Trimble Zephyr antenna. This rover data was then differentially corrected (post-processed) using records from a Trimble R10 receiver running as a base station immediately adjacent to field survey locations.
Given the rugged nature of the terrain and the time-consuming nature of mapping slag over large areas, we planned and guided our field survey using the satellite imagery detection products described above. We would often begin field survey at the most accessible point of these sites and then survey outwards in a loose transect pattern. While completing these loose transects, we would either attempt to follow cardinal direction (either N–S or E–W) or, when the local topography was prohibitory, we would follow the natural systems of topography and drainages.
Target detection products were loaded onto an iPad tablet running GIS Pro software carried during field survey. Consistently throughout these surveys, our team would reference the target detection products, noting which slag heaps we had surveyed and where other heaps might likely be present. In this manner, we were able to validate slag heaps that were detected via the remotely sensed imagery and also identify and document slag features that were not detected. Concurrently with the mapping survey, our team also collected comprehensive elevation data using continuously recording GNSS with the intention of producing a DEM to be used in future analysis. Collection of this elevation data was accomplished following a stricter systematic spatial approach. This included tighter transects spanning approximately 5 m meters walked across the entirety of the site and specific revisits to slag coverage areas that were additionally mapped following a descending spiral pattern. Collection of elevation in this manner ensured that all areas of the site had significant visual coverage. These two survey methods, guided by the remote sensing products, allowed us to have high confidence for the accurate survey of slag features at Raki 1 and Tawi Raki.
We mapped archaeological features following protocols determined by characteristics of the site locations. Both polygon and point data were collected to document a wide range of features including slag heaps and scatters, furnace and roaster installations, lithic scatters, settlement architecture, and tombs. When zones of slag cover were surveyed, we attempted to map discrete boundaries based on the presence/absence of slag, though often these judgements were based on gradational boundaries. Through the course of the survey, an emergent understanding of slag distribution led to a classification of slag collections under the following criteria: (a) slag heaps—extensive, contiguous, voluminous, and multidimensional large piles (≥100 m2) of slag with intermixed metallurgical ceramic (i.e., furnace lining) fragments and (b) slag scatters—surficial covers of slag that were substantially smaller than slag heaps in both area and volume (Figure 5). In some instances (particularly at the site of Tawi Raki) slag features demonstrated evidence of disturbance by fluvial events. All slag distributions were mapped within their currently found positioning so as to best document the present extent of the archaeological material.
Slag detection results were evaluated and ground-truthed via field reconnaissance and GNSS mapping. In some select cases, reference to the detection products led to the discovery of slag that may have been overlooked via traditional survey methods. Referencing these detections substantially expanded the area under survey consideration, and often directed survey efforts to slag heaps and scatters beyond previously interpreted site boundaries.
Generalized site boundaries were drawn for Raki 1 and Tawi Raki following the completion of survey once all known and discovered slag features were mapped. These boundaries were discerned from a conservative qualitative approach in order to best capture the nature of the site distribution and inform future efforts of cultural heritage conservation. In general, the site boundaries were drawn with a roughly 10 to 20 m buffer from the furthest mapped archaeological features. These boundaries attempted to take into account the assumed historical distribution of any material [7,10,40] and modern disturbance of those original distributions (i.e., large open caste copper mine at the site of Raki 1).

2.3.4. Classification Accuracy

Appropriately describing the measured accuracy for these remote sensing products is a challenging task due the reality of our evolving survey methods and emergent understanding of the archaeological environment. While the initial goal of this remote sensing initiative was to detect slag features at the archaeological sites, our field survey revealed that slag features can be classified in two main depositional states: heaps and scatters. During survey, it became apparent that the target detection results most often identified the relatively homogenous slag heaps (our intended target) but did not usually identify ephemeral slag scatters. Due to this complexity, we opted to measure accuracy of these detection results against the mapped large slag heaps and omitted slag scatters from our accuracy classification.
Accuracy of assessment results was calculated using both presence/absence and site-specific methods. Slag heap polygons derived from field survey of both Raki 1 and Tawi Raki were used as the ground truthed reference data of the accuracy assessment. The assessment was limited to the survey defined site boundaries, and detection results were clipped accordingly prior to assessment. Presence-absence accuracy is reported as percent of GNSS mapped slag heaps that contain detected pixels. This accuracy is reported for both the raw and filtered detection results. Site-specific accuracy was assessed using a confusion matrix. 1000 random points were generated within the site area boundaries and assessed to compare slag presence/absence in WV3 detection vs. GNSS field mapping layers. Overall accuracy, kappa coefficients, errors of omission and commission, and user and producer accuracies are reported for each detection. Final calculations of combined user and producer accuracy for both detection areas are also reported to offer a comprehensive description of remote sensing accuracy and provide context for potential future applications of this method.

3. Results

Target detection at the sites of Raki 1 and Tawi Raki demonstrates that WV3 imagery can be successfully used to map archaeological slag heaps. Overall detection accuracy of 93% (Raki 1) and 97% (Tawi Raki) describes the classifications as being accurate classifications of slag heaps and the surrounding background land cover within these archaeological areas. A combined user accuracy for slag classification of 61% indicates that these detections could be used to discover previously undocumented slag heaps. However, a combined producer accuracy for slag classification of 45% demonstrates that these detection products substantially underestimate total slag surface coverage.
These detection products were of great value during the field survey campaign where satellite derived results helped direct and improve ground-based GNSS mapping efforts. High overall reported accuracies for the remote sensing detection (>90%) demonstrates that this methodology can be successfully employed to differentiate archeometallurgical sites from their background landscape in arid environments. However, additional steps to improve user and producer accuracies are recommended before applying this method to discover previously undocumented slag heaps in heaps in new areas (see Discussion).

3.1. Slag Detection at Raki 1

The target detection results at Raki 1 demonstrate good visual correspondence and spatial consistency with the field surveyed slag boundaries (Figure 6). A total of 19 slag heaps were mapped via survey methods, with seven heaps measuring above 500 m2. WV3 detection produced substantial detection polygons for each of these seven large slag heaps, and had smaller polygons in all but four of the smaller slag heaps. Two of these smaller slag heaps contained single detected pixels in the raw results, however these were removed in the filtering process. Detection results of the major slag heaps often produced more conservative distribution boundaries than those mapped via survey methods. Errors of commission, or false positive detections, further skew boundaries of detected slag. Despite differences between the classifications, the WV3 detection offers a visual aid that gives a useful representative picture of the major slag heap distribution at the site of Raki 1.
Presence-absence and site-specific accuracy results for the differentiation of slag heaps and background landscape are presented in Table 1. Filtered WV3 results have pixels present in 79% of the GNSS surveyed slag heaps, however this accuracy is increased to 89% within the raw unfiltered detection. Random point classification reports and overall accuracy of 93% for the detection with a Kappa coefficient of 0.46. While the detection results for slag have a relatively low score for producer’s accuracy (44%), a user’s accuracy of 59% indicates that these results can be valuable reference for field identification. A user’s accuracy rating of 95% and producer’s accuracy of 97% indicates that the detection routine is very well suited at distinguishing background surfaces signatures from slag signatures, and this high percentage is undoubtedly contributing to overall accuracy.
Beyond reported accuracy, these detection results proved to be a valuable asset to aid in the field mapping and survey of Raki 1. WV3 generated slag boundaries were a useful spatial dataset to check the extent and distribution of slag heaps during and after sessions of documenting archaeological material boundaries with on-the-ground GNSS mapping.
In some instances, detection results helped to identify slag heaps that most likely would have been overlooked by traditional field survey. For example, slag heap 981-030, located in the central area of Raki 1, was initially not recorded via survey due to its proximity to modern mining operations. However, when detected pixels were observed within this overlooked area, subsequent survey efforts were planned. Ground-truthing of these detected pixels revealed a previously unmapped slag heap that was significantly disturbed by bulldozing. Correctly identified slag presence within the raw detection and final filtered results thus proved instructive for field survey. The combined products of both raw and filtered detection results therefore were highly useful tools in the slag mapping workflow.

3.2. Slag Detection at Tawi Raki

Target detection results at Tawi Raki demonstrate a very well matched and spatially consistent agreement with the surveyed slag boundaries (Figure 7). Survey efforts mapped a total of 20 slag heaps present at this site, with ten heaps measuring above 500 m2. WV3 detection produced substantial detection polygons for each of these ten large slag heaps, and had smaller polygons in all but five of the smaller slag heaps. One of these smaller slag heaps had two detected pixels present in the unfiltered results, yet these were removed during the filtering process. Additionally, these results at Tawi Raki are consistent with the results at Raki 1 in producing slag heap boundaries that are more conservative in total extent than those mapped via survey methods. Importantly though, these target detection results show a distribution of slag heaps in alignment with what was observed on the ground via survey.
The target detection technique correctly mapped slag rich areas found towards the southern portion of the site, notably in close proximity to a highly weathered gossan and VMS deposit (likely the primary source of ancient ore extraction). The northern portion of the site is characterized by sporadic and diffuse slag scatters, often interrupted and eroded by a large E-W wadi drainage. While the raw target detection results did correctly identify some of these areas, only small polygons were produced within these zones following the filter routine. These detections proved valuable for mapping of the northern area, however due to the diffuse nature of these slag scatters they were not included in the overall accuracy assessment.
Presence-absence and site-specific accuracy results describing differentiation of slag heaps from the background landscape are presented in Table 2. Filtered WV3 results have pixels present in 75% percent of the GNSS surveyed major slag heaps, however this percentage increases to 80% in the raw unfiltered detection results. Random point site-specific accuracy assessment shows an overall accuracy of 97% with a Kappa coefficient of 0.56. The detection results for slag have both an increased score for producer’s accuracy (51%) and user’s accuracy (65%) as compared with Raki 1. These improved results could be attributed to a variety of factors, but likely are influenced by a larger detection area with less overall slag coverage that is characterized by a higher degree of massive homogeneous slag heaps. A user’s and producer’s accuracy of 98% and 99% respectively indicate that the detection routine is again very well suited at distinguishing background surfaces signatures from slag signatures, and this high percentage is undoubtedly contributing to the overall accuracy.
Slag detection results at Tawi Raki again proved to be a valuable asset to aid in the field mapping and survey. Instances of slag verification in WV3 helped to identify the large homogenous slag heaps within the southern portion of the archaeological site. In particular, detected slag heaps along the wadi edges in both the western and eastern portions of the site aided in the mapping and distribution of these targets. Furthermore, two discrete polygons of detected pixels in the northern portion of the site along the banks of the dominant east-west wadi system prompted field survey efforts into regions that likely would not have seen as much attention via traditional field survey. While not included in the overall accuracy assessment due to their diffuse nature, pixels classified as slag within this region led field investigation efforts to a host of spatially dispersed and wadi eroded slag scatters that significantly extended the boundary of the site beyond what was previously understood [7]. In the case of Tawi Raki, both the accurate mapping of the large contiguous slag heaps as well as the limited detection of the spatially diffuse slag scatters enabled a richer and more successful field survey campaign.

4. Discussion

Results demonstrate that WV3 satellite detection can be used to aid in the mapping of slag heaps in arid environments. While limitations currently exist in this routine due to false positive detection and differences in boundary delineation, these remote sensing efforts provided both visual aids and ground cover estimates that proved useful for slag heap documentation. The WorldView-3 data and the MTMF algorithm significantly enhanced traditional field survey. Target detection results provided both a general check on major slag heap distribution while also leading to the documentation of smaller slag features that might have been otherwise overlooked.
From an archaeological survey perspective, the primary usefulness of these detection products resided in their visual depiction of previously unmapped material culture. These detection results identified a collection of large, spatially discrete areas of slag cover at both sites of interest. This visual depiction was immensely valuable in the planning and execution of archaeological survey in a previously unrecorded context. Furthermore, referencing these detection products occasionally identified areas of slag that would have been otherwise overlooked visually, either in direct field observation or within true color imagery interpretation. These products, therefore, played a critical role with aiding and assisting field survey.
Accuracy assessment is useful to contextualize the practical success of this method for the identification and detection of slag. However, the accuracy reporting methods of this study must be critically scrutinized in order to understand their relevance as metrics. While the overall detection accuracies are reported as high (>90%), these measurements are reflecting a large portion of the random accuracy measurement points that are correctly classified background pixels. Though correctly removing background pixels from survey consideration is a valuable contribution, the reported high accuracy of this metric alone does not fully describe this method’s accuracy in relation to the positively detecting slag.
Consideration of the combined user and producer accuracies offers an important clarification of this method’s ability to detect and map slag heaps. A combined user’s accuracy of 61% indicates that this method was moderately successful at detecting areas that our field survey also mapped as slag. This moderate user’s accuracy suggests that if this remote sensing method was applied to a novel context with limited information about slag cover, the target detection products could offer substantial aid in a survey based archaeological documentation. However, a combined producer’s accuracy of 46% indicates that this method underestimates the total coverage of slag heaps that were measured via survey. As described in the Results sections, target detection efforts often produced slag heap polygons with significantly smaller boundaries than as mapped via field survey. Therefore, due to this persistent coverage underestimation, the method (as it stands) should not be considered a precise delineation of slag heap boundaries.
Both detection methodology and survey methodology could explain some variation in the low reported producer’s accuracy. Within the detection process, the clumping phase of the filtering routine used to remove areas of false positive detections also resulted in the smoothing of the boundaries for the larger spatially coherent detection clusters. This process often resulted in final detected slag heap polygons that were reduced in size from the initial raw detections. While benefiting from the removal of extra false positive detection, this filtering also reduced the reported accuracy of the detection product.
During field survey, GNSS mapping of these slag heaps was conducted using a conservative approach that attempted to capture an accurate a boundary for slag heaps in order to inform future conservation efforts. As a result, field mapping of the boundaries was completed by mapping the observed distribution of slag when walking around these features. However, the boundaries of slag heaps were often observed as gradational rather than discrete contacts. While discretion was used during field survey to measure these features as accurately as possible, variation due to human judgment is unavoidable in GNSS mapping. Furthermore, while the survey boundaries were mapped and corrected to centimeter accuracy, the WV3 product is limited by its 1.2 m spatial resolution and imperfect georeferencing (see Section 2.3.3). As a result, discrepancies between WV3 detected pixels and mapped slag heap distributions are to a certain extent unavoidable.
Observed limitations in detection accuracy pose significant challenges for future applications of this method in unexplored areas. While this remote sensing approach greatly enhanced survey at previously known sites, observed limitations may prove challenging if this method were applied to new contexts. Furthermore, limited reported accuracy for slag detection demonstrates that while this method can generally detect slag heaps it is less capable of accurately mapping their entirety and precise boundaries of slag cover. As it stands (like many remote sensing approaches), these methodologies cannot currently act as a replacement for the high accuracy of field survey mapping, but rather act as a supplement to it. However, future incorporation of additional steps to address these limitations could improve accuracy. Finding methods to address these issues would be a foremost objective when expanding this method to new contexts.
Errors arising in detection efforts are likely due to limitations of target spectral differentiation. This issue partially stems from variable slag heap characteristics which were noticed and described in the field (see Figure 4). The MTMF algorithm appears to be particularly successful at detecting large homogenous slag heaps, such as the case at Tawi Raki. In contrast, our results demonstrate less success in detecting diffuse and surficial slag scatters that were observed at both sites.
Figure 8 displays a visual comparison of averaged spectral signatures between example slag features with these different characteristics. All slag spectra, regardless of feature designation, display relatively similar characteristics across measured portions of the spectrum. Additionally, all slag spectra are relatively dark (on average <20% reflectance) in comparison with other landcover in the WV3. However, variation in specific wavelengths regions could help to describe their spectral separability.
While the signatures display a similar pattern in the visible portion of the spectrum, differences are present within VNIR and SWIR wavelengths. Between 1000 and 1200 nm, slag scatters exhibit a rise in apparent reflectance and slag heaps display a drop in apparent reflectance. Furthermore, slag scatters display a sharper peak at 1730 nm (corresponding to WV3 Band 12). Finally, and perhaps most importantly both the slag detection ROI and the slag heap spectra share an absorption feature centered at 2260 nm (WV3 Band 15). This absorption appears to be absent or minimally present in the slag scatter profile. While the slag scatter signature appears to more closely resemble the training signature in apparent brightness, the MTMF function performed better when evaluating areas of dense slag heaps. Slag feature homogeneity and relative pixel purity might help to explain this difference in performance.
Slag heaps are a homogenous coverage of dark material, and thus represent a spectrally pure endmember. Slag scatters, on the other hand, are low density surficial groupings of slag. Due to their lower slag density, the underlying sediment surface is often visible in between slag cover when viewed from above. Therefore, pixels covering these scatters likely represent a complex mixture of archeometallurgical material and underlying substrate. This hypothesis is further supported when the MTMF results are considered.
As described, matched filter values provide an estimate of subpixel abundance for a target material [45]. Therefore, mean MF scores sampled over an ROI can give an approximation for fractional coverage of the intended target. In this example, the ROI used to generate the Figure 8 slag heap spectrum has a mean MF score of 0.75, whereas the ROI used to generate the slag scatter spectrum has a mean MF score of 0.26. These scores indicate that slag scatter pixels have substantially less fractional coverage of the measured target. Within the detection routine for this study, the training signature used for MTMF detection was selected from spectrally pure slag heaps. Therefore, the MTMF algorithm applied to the WV3 data appears to be correctly classifying slag features based upon their predominant target coverage. Defining a separate training signature for slag scatters could likely improve detection and differentiation of these characteristic slag features.
Future refinements of this slag detection methodology will need to consider a classification schema to differentiate a diverse range of slag ground cover. Running the MTMF target detection routine with a defined slag scatter signature might lead to better identification of the noted gradational slag heap boundaries. Additionally, a more detailed spectral characterization of slag heaps and slag scatters could be achieved via in situ field measurements using a handheld spectrometer. Compiling field derived measurements into a spectral library could also be useful for future detection efforts, and our team plans to investigate this course of action further. Beyond distinctions between of slag heaps and slag scatters, however, detection of false positive targets proved to be the main limitation in this study.
False positive detections primarily involve dark surfaces incorrectly classified as slag heaps. At Raki 1, false positive detections are present within both the raw and filtered WV3 results, and contribute to the reduced producer accuracy for slag heap detection. These errors of commission occur in two main circumstances: shadowed north facing slopes, and dark bedrock terrace ground cover. False positive detection attributed to shadowed northerly aspects can be observed in the southern portion of the detection area (see Figure 5), where high, freestanding ridges of mapped pillow basalt flows cast shadows due to their illumination angle. Dark surface false positive detection occurred in northern portions of the detection area. Here, satellite derived slag boundaries are reported to extend beyond the in-field mapped boundaries. In field inspection of the area surrounding these slag heaps yielded observations that the underlying bedrock is significantly darker in color (potential due to compositional variation or weathered character).
At Tawi Raki, similar patterns in false positive detection can also be observed (see Figure 6). The two primary cases of commission again occur in areas dominated by shadows and dark ground cover. North facing slope shadows were detected in both the southern and northern portions of the site along high standing pillow basalt ridges. In some instances, even illuminated portions of this pillow basalt bedrock were also incorrectly identified as slag. Towards the southern portion of the site (beyond the ridgeline shadows), a substantial amount of dark ground cover was also falsely detected. Field inspection of this area revealed the dark ground cover to be outcrops of black-gray, thinly bedded chert. These outcrops were strikingly similar to slag heaps in both visible color and spatial extent, and could easily be mistaken for slag heaps even when observed at a distance in the field. Visual similarity between this bedrock lithology and slag likely influenced its false positive detection, and reflectance properties of this material must be scrutinized for future improvements to detection. A final class of false positives appeared to cluster around modern domestic development in the central portion of the site boundary. These areas are relatively small in comparison to the correctly mapped large slag heaps, and again appear to be associated either with dark ground cover (bedrock surface) or shadows (from structures and agricultural date palms) within the domestic complex. Notably, an area in the northwestern portion of the site, located within a mapped sheeted dyke bedrock unit, was also falsely detected. These pixels (located on a well illuminated southwesterly aspect) were correctly removed during the intervening filtering process, and likely eliminated due to their spatially diffuse distribution.
Many false positive detections could be explained through consideration of spectra that appear dark in the WV3 scene. Figure 9 displays a collection of scene-derived spectra from falsely identified dark surfaces. It should be noted all of these dark targets produce signatures that share common shape, slope, and brightness with scene derived slag signatures. Generally, each of these targets have signatures with low measured reflectance across the spectrum and are remarkably flat in shape. Each signature shares a notable, though subtle, absorption feature around 900 nm (WV3 Band Near-IR1). This feature could be an indication of iron present within each of the targets [52], which would be in agreement with the dominant mafic characterization of the local geology [20]. Yet aside from this absorption, the spectra are relatively featureless. Importantly, all of these measurements are substantially darker than the typical spectral signatures of the variable background materials. The overall dark and flat character of these signatures (along with slag) likely enables these targets to be readily separable from the majority of the brighter landscape.
Discriminating slag heaps from naturally occurring dark surface remains the primary shortcoming of our current methodology. Similarities between the spectra are not ultimately surprising, as the slag found at Raki is a direct byproduct of copper production using local ore. In the future, we plan to detect slag over larger unexplored areas and these efforts will benefit from more effective means of addressing false positive detection due to dark areas and shadows. Following our mapping of the Raki area, we conducted a brief opportunistic investigation in mountainous terrain north of archaeological sites. Visual inspection of WV3 data revealed a large and spatially homogenous area characterized by dark material on a low-lying wadi terrace approximately 2 km north of the Raki sites. Visual evidence of bulldozer activity could be seen within the imagery, and this area appeared to share many similarities to the slag heaps observed in the imagery of Raki. Hypothesizing this area could be another location of ancient copper production, slag detection routines were opportunistically completed over a clipped area. Detection results appeared to be promising with spatially contiguous polygons of this unknown dark surface detected. However, upon ground truthing, the area proved to be a modern quarry involving extraction of a particularly dark lithology. This false positive conflation of dark bedrock with the slag target signature illustrates the challenges involved in differentiating slag. Resolution or mitigation of this conflation will be important to implementation of slag detection across wider areas.
Conflation errors arising from similarity among dark surfaces is a well-documented concern in remote sensing. Accordingly, multiple approaches have been proposed to compensate for these limitations in spectral differentiation. On the topic of shadows, topographic modeling routines have demonstrated considerable success in the identification of shadowed regions in rugged terrain. These cast shadow delineation algorithms can use the known angle of incident radiation at image acquisition with a digital elevation model (DEM) to delineate shaded areas within a given scene [53,54]. Although DEM accuracy, image georeferencing, and orthorectification are known complications of this methodology [53], shadowed areas, informed by DEM analysis, can be masked or removed prior to, or following, detection. Our future refinement of the WV3 slag detection will likely incorporate this approach. Additionally, as some false positive detections at Tawi Raki were associated with vegetation shadows along the drainage corridors, masking out these suspect areas prior to detection could improve detection accuracy. A calculated normalized difference vegetation index (NDVI) image could be used to identify and subsequently remove these vegetated areas before spectral analysis.
Discrimination of slag features from adequately illuminated dark colored lithologies will likely prove a more difficult challenge. However, careful scrutiny of variations in target spectra may hold the key to dark surface differentiation. Similar challenges in discriminating dark surfaces has been encountered in urban remote sensing applications, where dark colored roofing materials of different compositions often exhibit similar spectral qualities [55]. Typical approaches to this problem include comparing values such as mean or standard deviation across the broad spectral shapes, as opposed to unique narrow absorption features, in order to differentiate dark targets. Similar steps could be added to the slag detection routine used in this study. Differences in broad spectral shape might have led to better discrimination and filtering of the sheeted dyke complex (Figure 9d) spectra as opposed to other common false positive identifications. Exploring similar values across the spectra of the other dark surfaces of chert (Figure 9b) and pillow basalt (Figure 9c) might yield spectral information that could be used for dark surface differentiation.
Furthermore, other detection algorithms may have better success at differentiating these dark materials. The Spectral Angle Mapper (SAM) algorithm could be one promising method for future detection. This technique determines the spectral similarity between an identified target spectrum and image pixel by projecting both spectra into n-dimensional space where n is equal to the number of bands within the image and then calculating the deviation in angle between the target and pixel spectra [56]. As this method is relatively insensitive to illumination and albedo, it relies primarily on similarity in spectral profile shape [57,58]. SAM, therefore, might perform better comparing and discriminating between these dark targets. However, a strict SAM approach would lack the mixture tune feasibility calculations and subpixel abundance estimations that are inherent within the MTMF operation. Exploring and evaluating the performance of other target detection approaches is therefore recommended for future study.
Taking into account the described method limitations and possible approaches to address these challenges, we propose that the following workflow could be invoked if this method were to be applied in a new context: (1) if the local geologic context is unknown, use WV3 to identify the presence VMS deposits (potentially via principle components analysis (PCA) or the Crosta technique [59]), (2) identify appropriate target spectral signatures for both slag heaps and slag scatters (either from field derived spectra, previous spectral libraries, or new scene-derived spectra), (3) apply masks for topography-based shadow removal and NDVI-based vegetation removal, (4) run slag detection methods with specific attention to dark object delineation, and (5) validate via field survey to confirm and map slag coverage.
Despite the described limitations, the overall reported accuracy demonstrates that our detection routine holds considerable promise as a tool for archaeological research and heritage management. The ability to describe an archaeological landscape via the differentiation of archeometallurgical material and surrounding background cover can provide a valuable perspective when documenting these important sites of cultural heritage. Reported lower estimated user’s and producer’s accuracies, however, demonstrate that these target detection products are limited in their ability to precisely delineate all features. Modern mining operations in areas with archaeological remnants of past extraction demonstrate how rare and valuable copper resources were in the past and are in the present. Although ancient copper production involved small-scale, near-surface mining, modern practices involve deeper and more spatially extensive exploitation of VMS structures. As a result, modern mining operations tend to damage and sometimes destroy archaeological sites.
Threats to archaeological sites are currently ongoing in the Raki archaeological area. Modern mining operations as well as residential occupations and small-scale agriculture are in close proximity to slag heaps at Raki 1, Raki 2, and Tawi Raki. Bulldozing of slag heaps to clear ground for geologic coring has been observed, and appears to be ongoing, in a number of areas. Any alterations to the distribution of slag heaps destroys ancient landscapes that are of important worldwide cultural heritage value. Structural modifications to slag heaps severely impair opportunities of volumetric analysis and efforts to quantify the total amounts of raw material present. The threat of disturbance to these archeometallurgical sites, therefore, is an immediate and pressing matter for cultural heritage management in Oman.
As such, documenting any alteration to slag heaps is of great concern for their management. Remote sensing could offer a promising tool to aid in this documentation. This target detection method could aid managers through informing field survey efforts and potentially even documenting areas that are less accessible. Furthermore, if target detection could be conducted on repeat imagery, automated change detection processes comparing two slag detection rasters might prove a valuable approach to document any spatial change within these features. While the observed limitations in total coverage estimates and boundary delineation must be addressed, such products and processes could be of great benefit for monitoring and management of these important ancient archeometallurgical landscapes.

5. Conclusions

Our research shows that 16-band WorldView-3 satellite imagery can be used with MTMF algorithm procedures to detect and map slag heaps generated by ancient copper production. Detection results show relatively high (>90%) overall accuracy which helps to describe the archaeological mining landscape. These detection products proved valuable assets that helped in the planning and execution of field survey, and often led to improvements over traditional methods. However, it is noted that lower estimations of both user’s (61%) and producer’s (45%) accuracies demonstrate this method’s limitation in accurately describing precise slag cover and distributions. These methods are useful for monitoring ancient metallurgical sites threatened by modern disturbance and hold considerable potential for detecting slag over larger areas to discover new archaeological sites.

Author Contributions

Conceptualization, A.J.S., J.W.L., M.J.H., and I.A.D.; methodology, A.J.S.; software, A.J.S.; validation, A.J.S., J.W.L., P.E.P., S.N., D.R.V., S.A.-J., B.H., F.W., D.M., B.P.; formal analysis, A.J.S.; investigation, A.J.S., J.W.L., M.J.H., P.E.P., B.H., D.M., and B.P.; resources, J.W.L. and M.J.H.; data curation, J.W.L. and M.J.H.; writing–original draft preparation, A.J.S.; writing–review and editing, A.J.S., J.W.L., and M.J.H.; visualization, A.J.S., J.W.L., M.J.H., and P.E.P.; supervision, J.W.L. and M.J.H.; project administration, J.W.L. and M.J.H.; funding acquisition, J.W.L. and M.J.H.

Funding

This research was funded by grants from National Aeronautics and Space Administration (ROSES) Research Opportunities in Space and Earth Sciences (#NNX13AO48G), Australian Research Council Discovery Early Career Award DE180101288, and Johns Hopkins University Catalyst and Space@Hopkins grants.

Acknowledgments

The DigitalGlobe Foundation; Sultan Al-Bakri and Khamis Al-Asmi, Ministry of Heritage and Culture, Sultanate of Oman, T. Kalaycı, CNR-ISPC. The authors are grateful to L. Weeks, K. Franke, and P. Yule for important discussions on the peculiarities of metal production in southeast Arabia and the archaeology of Wadi Raki.

Conflicts of Interest

The authors declare no conflict of interest. The funders had no role in the design of the study; in the collection, analyses, or interpretation of data; in the writing of the manuscript, or in the decision to publish the results.

References

  1. Pryce, T.O.; Abrams, M.J. Direct detection of Southeast Asian smelting sites by ASTER remote sensing imagery: Technical issues and future perspectives. J. Archaeol. Sci. 2010, 37, 3091–3098. [Google Scholar] [CrossRef]
  2. Savage, S.H.; Levy, T.E.; Jones, I.W. Prospects and problems in the use of hyperspectral imagery for archaeological remote sensing: A case study from the Faynan copper mining district, Jordan. J. Archaeol. Sci. 2012, 39, 407–420. [Google Scholar] [CrossRef]
  3. Savage, S.H.; Levy, T.E.; Jones, I.W. Archaeological remote sensing in Jordan’s Faynan copper mining district with hyperspectral imagery. In Mapping Archaeological Landscapes from Space; Harrower, M.J., Comer, D.C., Eds.; Springer: New York, NY, USA, 2013; pp. 97–110. [Google Scholar]
  4. Dumitru, I.A.; Harrower, M.J. Mapping Ancient Production and Trade of copper from Oman and Obsidian from Ethiopia. In The Read Sea and the Persian Gulf from Late Prehistory to Early Modernity; Manzo, A., Zazzaro, C., DeFalco, D.J., Eds.; Brill: Leiden, The Netherlands, 2018; pp. 74–94. [Google Scholar]
  5. Dumitru, I.A.; Harrower, M.J. From Rural Collectibles to Global Commodities: Copper from Oman and Obsidian from Ethiopia. In Globalization in Prehistory: Contact, Exchange, and the “People Without History”; Boivin, N., Frachetti, M., Eds.; Cambridge University Press: Cambridge, UK, 2018; pp. 232–262. [Google Scholar]
  6. Digital Globe Inc. WorldView-3 Data Sheet. Available online: https://dgv4-cms-production.s3.amazonaws.com/uploads/document/file/128/DG2017_WorldView-3_DS.pdf (accessed on 10 September 2019).
  7. Berthoud, T.; Besenval, R.; Cleuziou, S.; Drin, N. Les anciennes mines de cuivre du sultanat d’Oman. In Rech. Copp. Sur Programme; Pierre and Marie Curie University: Paris, France, 1978; Volume 442. [Google Scholar]
  8. Weisgerber, G. Evidence of Ancient Mining Sites in Oman: A Preliminary Report. J. Oman Stud. 1978, 4, 15–28. [Google Scholar]
  9. Yule, P.; Weisgerber, G. Die 14. Deutsche Archäologische Oman-Expedition 1995. Mitt. Dtsch. Oreint-Ges. 1996, 128, 135–155. [Google Scholar]
  10. Weisgerber, G.; Yule, P. Preliminary Report of the 1996 Season of Excavation in the Sultanate of Oman. In Studies in the Archaeology of the Sultanate of Oman; Yule, P., Ed.; Verlag Marie Leidorf: Rahden, Germany, 1999; pp. 97–117. [Google Scholar]
  11. Hauptmann, A. 5000 Jahre Kupfer in Oman. Bd. 1: Die Entwicklung der Kupfermetallurgie vom 3. Jahrtausend bis zum Neuzeit; Deutsche Bergbau-Museum: Bochum, Germany, 1985. [Google Scholar]
  12. Dilek, Y.; Furnes, H. Structure and geochemistry of Tethyan ophiolites and their petrogenesis in subduction rollback systems. Lithos 2009, 113, 1–20. [Google Scholar] [CrossRef]
  13. Hacker, B.R.; Mosenfelder, J.L.; Gnos, E. Rapid emplacement of the Oman ophiolite: Thermal and geochronologic constraints. Tectonics 1996, 15, 1230–1247. [Google Scholar] [CrossRef] [Green Version]
  14. Searle, M.; Cox, J. Tectonic setting, origin, and obduction of the Oman ophiolite. Geol. Soc. Am. Bull. 1999, 111, 104–122. [Google Scholar] [CrossRef]
  15. Rioux, M.; Bowring, S.; Kelemen, P.; Gordon, S.; Miller, R.; Dudás, F. Tectonic development of the Samail ophiolite: High-precision U-Pb zircon geochronology and Sm-Nd isotopic constraints on crustal growth and emplacement: Tectonic History of the Samail Ophiolite. J. Geophys. Res. Solid Earth 2013, 118, 2085–2101. [Google Scholar] [CrossRef] [Green Version]
  16. Nicolas, A.; Boudier, F.; Ildefonse, B. Evidence from the Oman ophiolite for active mantle upwelling beneath a fast-spreading ridge. Nature 1994, 370, 51–53. [Google Scholar] [CrossRef]
  17. Lippard, S.J.; Shelton, A.W.; Gass, I.G. The Ophiolite of Northern Oman; Geological Society Memoir; Geological Society: London, UK, 1986. [Google Scholar]
  18. Gilgen, S.A.; Diamond, L.W.; Mercolli, I.; Al-Tobi, K.; Maidment, D.W.; Close, R.; Al-Towaya, A. Volcanostratigraphic Controls on the Occurrence of Massive Sulfide Deposits in the Semail Ophiolite, Oman. Econ. Geol. 2014, 109, 1585–1610. [Google Scholar] [CrossRef]
  19. Gilgen, S.A.; Diamond, L.W.; Mercolli, I. Sub-seafloor epidosite alteration: Timing, depth and stratigraphic distribution in the Semail ophiolite, Oman. Lithos 2016, 260, 191–210. [Google Scholar] [CrossRef] [Green Version]
  20. Bechennec, E.; Roger, J.; Le Metour, J.; Wyns, R.; Cheyrel, S. Geological Map of Ibri: Sheet NF 40–02; Ministry of Petroleum and Minerals: Muscat, Oman, 1992.
  21. Villey, M.; Bechennec, E.; Beurrier, M.; Le Metour, J.; Rabu, D. Geological Map of Yanqul, sheet NF 40-2C; Ministry of Petroleum and Minerals: Muscat, Oman, 1986.
  22. Alabaster, T.; Pearce, J.A.; Malpas, J. The volcanic stratigraphy and petrogenesis of the Oman ophiolite complex. Contrib. Mineral. Petrol. 1982, 81, 168–183. [Google Scholar] [CrossRef]
  23. Robertson, A.H.F.; Searle, M.P.; Ries, A.C. (Eds.) The Geology and Tectonics of the Oman Region; Geological Society: London, UK, 1990; Volume 49. [Google Scholar]
  24. Partington, G. Developing Models using GIS to Assess Geological and Economic Risk: An Example from Mineral Exploration in Oman for VMS Copper Gold Mineralisation. In Proceedings of the Tenth Biennial SGA Meeting, Smart Science for Exploration and Mining, Townsville, Australia, 17–20 August 2009; Society for Geology Applied to Mineral Deposits: Townsville, Australia, 2009; pp. 836–838. [Google Scholar]
  25. Giardino, C. Magan—The Land of Copper: Prehistoric Metallurgy of Oman; Ministry of Heritage and Culture: Muscat, Oman, 2017.
  26. Weeks, L. Early Metallurgy of the Persian Gulf; Brill: Lieden, The Netherlands, 2003. [Google Scholar]
  27. Schmidt, C.; Döpper, S. The Hafit Period at Al-Khashbah, Sultanate of Oman: Results of Four Years of Excavations and Material Studies. Proc. Semin. Arab. Stud. 2019, 29, 265–274. [Google Scholar]
  28. Goetller, G.W.; Firth, N.; Huston, C.C. A Preliminary Discussion of Ancient Mining in the Sultanate of Oman. J. Oman Stud. 1976, 2, 43–56. [Google Scholar]
  29. Hasting, A.; Humphries, J.H.; Meadow, R.H. Oman in the third millennium BCE. J. Oman Stud. 1975, 1, 9–56. [Google Scholar]
  30. Tosi, M. Notes on the distribution and exploitation of natural resources in ancient Oman. J. Oman Stud. 1975, 1, 187–206. [Google Scholar]
  31. Hauptmann, A.; Weisgerber, G.; Bachmann, H.G. The Beginning of the Use of Metals and Alloys; Maddin, R., Ed.; MIT Press: Cambridge, MA, USA, 1988. [Google Scholar]
  32. Prange, M.K. 5000 Jahre Kupfer im Oman: Bd. II Vergleichende Untersuchungen zur Charakterisierung des omanischen Kupfers mittels chemischer und isotopoischer Analysenmethoden; Deutsche Bergbau-Museum: Bochum, Germany, 2001. [Google Scholar]
  33. Weisgerber, G. Beobachten zum alten Kupfergebau in Sultanat Oman. Anschnitt 1977, 29, 189–211. [Google Scholar]
  34. Weisgerber, G. und Kupfer in Oman. Anschnitt 1980, 32, 62–110. [Google Scholar]
  35. Weisgerber, G. Archäologische und archäometallurgische Untersuchungen in Oman. Allg. Vgl. Archäol. 1980, 2, 67–90. [Google Scholar]
  36. Weisgerber, G. Mehr als Kupfer in Oman. Der Anschnitt. Anschnitt 1981, 33, 174–263. [Google Scholar]
  37. Begemann, F.; Hauptmann, A.; Schmitt-Strecker, S.; Weisgerber, G. Lead Isotope and Chemical Signature of Copper from Oman and Its Occurence in Mesopotamia and Sites on the Arabian Coast. Arab. Archaeol. Epigr. 2010, 21, 135–169. [Google Scholar] [CrossRef]
  38. Weisgerber, G. Patterns of Early Islamic Metallurgy in Oman. Proc. Semin. Arab. Stud. 1980, 10, 115–129. [Google Scholar]
  39. Weisgerber, G. Copper Production during the Third Millennium B.C. in Oman and the Question of Makkan. J. Oman Stud. 1983, 6, 269–276. [Google Scholar]
  40. Coleman, R.G.; Edgar, H.B. Mineral deposits and Geology of Northern Oman as of 1974; United States Geologic Survey: Reston, VA, USA, 1981.
  41. Weisgerber, G. Archaeological Evidence of Copper Exploitation at ‘Arja. J. Oman Stud. 1987, 9, 145–172. [Google Scholar]
  42. Harris Geospatial Solutions Inc. ENVI v 5.3 Fast Line-of-Sight Atmospheric Analysis of Hypercubes; Harris Geospatial Solutions Inc.: Broomfield, CO, USA, 2015. [Google Scholar]
  43. Adler-Golden, S.M.; Matthew, M.W.; Bernstein, L.S.; Levine, R.Y.; Berk, A.; Richtsmeier, S.C.; Acharya, P.K.; Anderson, G.P.; Felde, J.W.; Gardner, J.A.; et al. Atmospheric Correction for Shortwave Spectral Imagery Based on MODTRAN4. In Proceedings of SPIE Imaging Spectrometry V; SPIE: Denver, CO, USA, 1999; Volume 3753, pp. 61–69. [Google Scholar]
  44. Green, A.A.; Berman, M.; Switzer, P.; Craig, M.D. A transformation for ordering multispectral data in terms of image quality with implications for noise removal. IEEE Trans. Geosci. Remote Sens. 1988, 26, 65–74. [Google Scholar] [CrossRef] [Green Version]
  45. Mundt, J.T.; Street, N.G.; Streutker, D.R.; Glenn, N.F. Partial unmixing of hyperspectral imagery: Theory and methods. In Proceedings of the American Society of Photogrammetry and Remote Sensing; ASPRS: Tampa, FL, USA, 2007; Volume 2007. [Google Scholar]
  46. Boardman, J.W. Leveraging the high dimensionality of AVIRIS data for improved sub-pixel target unmixing and rejection of false positives: Mixture tuned matched filtering. In Summaries of the Seventh JPL Airborne Geoscience Workshop; NASA Jet Propulsion Laboratory: Pasadena, CA, USA, 1998; Volume 97, pp. 55–56. [Google Scholar]
  47. Kruse, F.A.; Boardman, J.W.; Hunnington, J.F. Comparison of airborne hyperspectral data and EO-1 Hyperion for mineral mapping. IEEE Trans. Geosci. Remote Sens. 2003, 41, 1388–1400. [Google Scholar] [CrossRef] [Green Version]
  48. Goodarzi Mehr, S.; Ahadnejad, V.; Abbaspour, R.A.; Hamzeh, M. Using the mixture-tuned matched filtering method for lithological mapping with Landsat TM5 images. Int. J. Remote Sens. 2013, 34, 8803–8816. [Google Scholar] [CrossRef]
  49. Kruse, F.A.; Baugh, W.M.; Perry, S.L. Validation of DigitalGlobe WorldView-3 Earth imaging satellite shortwave infrared bands for mineral mapping. J. Appl. Remote Sens. 2015, 9, 096044. [Google Scholar] [CrossRef]
  50. Boardman, J.W.; Kruse, F.A. Analysis of Imaging Spectrometer Data Using N-Dimensional Geometry and a Mixture-Tuned Matched Filtering Approach. IEEE Trans. Geosci. Remote Sens. 2011, 49, 4138–4152. [Google Scholar] [CrossRef] [Green Version]
  51. Boardman, J.W. Automated Spectral Unmixing of AVIRIS Data Using Convex Geometry Concepts. In Proceedings of the Summaries of the Fourth JPL Airborne Geoscience Workshop, Pasadena, CA, USA, 25–29 October 1993; NASA Jet Propulsion Laboratory: Pasadena, CA, USA, 1993; Volume 1, pp. 11–14. [Google Scholar]
  52. Clark, R.N. Spectroscopy of Rocks and Minerals, and Principles of Spectroscopy. In Manual of Remote Sensing; John Wiley & Sons: New York, NY, USA, 1999; Volume 3, pp. 3–58. [Google Scholar]
  53. Giles, P. Remote Sensing and Cast Shadows in Mountainous Terrain. Photogramm. Eng. Remote Sens. 2001, 67, 833–839. [Google Scholar]
  54. Shahtahmassebi, A.; Yang, N.; Wang, K.; Moore, N.; Shen, Z. Review of shadow detection and de-shadowing methods in remote sensing. Chin. Geogr. Sci. 2013, 23, 403–420. [Google Scholar] [CrossRef] [Green Version]
  55. Heiden, U.; Segl, K.; Roessner, S.; Kaufmann, H. Determination and Verification of Robust Spectral Features for an Automated Classification of Sealed Urban Surfaces. In Proceedings of the 4th EARSeL Workshop on Imaging Spectroscopy. New quality in environmental studies, EARSel and Warsaw University, Warsaw, PL, USA, 27–29 April 2005. [Google Scholar]
  56. Kruse, F.A.; Lefkoff, A.B.; Boardman, J.W.; Heidebrecht, K.B.; Shapiro, A.T.; Barloon, P.F.; Goetz, A.F.H. The spectral image processing system (SIPS)—Interactive visualization and analysis of imaging spectrometer data. Remote Sens. Environ. 1993, 44, 145–163. [Google Scholar] [CrossRef]
  57. Clark, R.N.; Swayze, G.; Heidebrecht, K.B.; Goetz, A.F.H.; Green, R.O. Comparison of Methods for Calibrating AVIRIS Data to Ground Reflectance; Jet Propulsion Laboratory: Pasadena, CA, USA, 1993; pp. 35–36. [Google Scholar]
  58. Yuhas, R.H.; Goetz, A.F.H.; Boardman, J.W. Discrimination among semi-arid landscape endmembers using the spectral angle mapper (SAM) algorithm. In Proceedings of the Summaries of the Third Annual JPL Airborne Geoscience Workshop, Jet Propulsion Laboratory, Pasadena, CA, USA, 1–5 June 1992; Volume 1. [Google Scholar]
  59. Ranjbar, H.; Honarmand, M.; Moezifar, Z. Application of the Crosta technique for porphyry copper alteration mapping, using ETM+ data in the southern part of the Iranian volcanic sedimentary belt. J. Asian Earth Sci. 2004, 24, 237–243. [Google Scholar] [CrossRef]
Figure 1. The location of the Raki Archaeological Area within the Al-Hajar mountain range of southeast Arabia. WorldView-3 imagery courtesy of the DigitalGlobe Foundation.
Remotesensing 11 03014 g001
Figure 2. The three primary sites of Raki 1, Raki 2, and Tawi Raki that compose the greater Raki Archaeological area overlain on geologic units digitized from Villey et al. [21]. WorldView-3 imagery courtesy of the DigitalGlobe Foundation.
Remotesensing 11 03014 g002
Figure 3. The spectral information used in target detection was derived from the well-known site of Raki 2: (a) locations of the regions of interest (ROIs) plotted on well-defined slag heaps; (b) average spectral signatures of ROIs (black) with plotted standard deviation (green dash). WorldView-3 imagery courtesy of the DigitalGlobe Foundation.
Remotesensing 11 03014 g003
Figure 4. Filtering steps for the mixed tuned match filtering (MTMF) detection results: (a) output of the MTMF detection with noted matched filtering (MF) and infeasibility score threshold; and (b) final output slag detection polygons after the smoothing and aggregation. WorldView-3 imagery courtesy of the DigitalGlobe Foundation.
Remotesensing 11 03014 g004
Figure 5. Examples of archaeological slag preserved at the Raki Area: (a) tap and furnace slag fragments from the sites of Raki 1 and Tawi Raki; (b) slag heaps (outlined in yellow, note people for scale); and (c) slag scatters. All features can be dated to the early Islamic (c.a. CE 635 – 1055)) period.
Remotesensing 11 03014 g005
Figure 6. Slag Detection results from the Raki 1 site (a) filtered WV3 MTMF detection results; (b) boundaries of the field surveyed major slag heaps of Raki 1; (c) pre-filtered WV3 detection. WorldView-3 imagery courtesy of the DigitalGlobe Foundation.
Remotesensing 11 03014 g006
Figure 7. Slag Detection results from the Tawi Raki site (a) filtered WV3 MTMF detection results; (b) boundaries of the field surveyed major slag heaps at Tawi Raki; (c) pre-filtered WV3 detection. WorldView-3 imagery courtesy of the DigitalGlobe Foundation.
Remotesensing 11 03014 g007
Figure 8. Spectral characteristics of homogenous slag heaps (red) and heterogeneous surficial slag scatters (blue). Mean slag detection ROI derived from the site of Raki 1 (black line) was used for MTMF detection. Symbols indicate WV3 bands. Spectra offset for clarity.
Remotesensing 11 03014 g008
Figure 9. The spectral information of false positive targets including: (a) shadow; (b) chert; (c) pillow basalt; and (d) sheeted dyke complex. All spectra compared against slag signature derived from Raki 1 ROI and used within the MTMF detection.
Remotesensing 11 03014 g009
Table 1. Accuracy assessment for Raki 1 classification: (a) presence/absence accuracy statistics; and (b) confusion matrix and supporting statistics comparing WV3 MTMF slag detection results to field survey data for Raki 1. Overall site-specific accuracy 93% and Kappa = 0.46.
Presence/Absence Accuracy (a)
Filtered Detection Results79%Unfiltered Detection Results84%
Site Specific Accuracy (b)
Field Reference Data
SlagBackground
WV3 Detection ResultsSlag3726
Background47890
Class NameCommission (%)Omission (%)User’s AccuracyProducer’s Accuracy
Slag41%56%59%44%
Background5%3%95%97%
Table 2. Accuracy assessment for Tawi Raki classification: (a) presence/absence accuracy statistics; and (b) confusion matrix and supporting statistics comparing WV3 MTMF slag detection results to field survey data for Tawi Raki. Overall site-specific accuracy 97% and Kappa = 0.56.
Presence/Absence Accuracy (a)
Filtered Detection Results75%Unfiltered Detection Results80%
Site Specific Accuracy (b)
Field Reference Data
SlagBackground
WV3 Detection ResultsSlag179
Background16958
Class NameCommission (%)Omission (%)User’s AccuracyProducer’s Accuracy
Slag35%49%65%51%
Background2%1%98%99%

