Article

Deriving Particulate Organic Carbon in Coastal Waters from Remote Sensing: Inter-Comparison Exercise and Development of a Maximum Band-Ratio Approach

by
Trung Kien Tran
1,2,3,4,
Lucile Duforêt-Gaurier
1,2,3,
Vincent Vantrepotte
1,2,3,4,
Daniel Schaffer Ferreira Jorge
1,2,3,
Xavier Mériaux
1,2,3,
Arnaud Cauvin
1,2,3,
Odile Fanton d’Andon
5 and
Hubert Loisel
1,2,3,4,*
1
Univ. Littoral Côte d’Opale, UMR 8187, F 62930 Wimereux, France
2
CNRS, UMR 8187, F 62930 Wimereux, France
3
Univ. Lille, UMR 8187, LOG, Laboratoire d’Océanologie et de Géosciences, F 62930 Wimereux, France
4
LOTUS, University of Science and Technology of Hanoi, 18 Hoang Quoc Viet, Cau Giay, Hanoi 10000, Vietnam
5
ACRI-ST, 260 Route du Pin Montard, 06904 Sophia-Antipolis, France
*
Author to whom correspondence should be addressed.
Remote Sens. 2019, 11(23), 2849; https://doi.org/10.3390/rs11232849
Submission received: 2 October 2019 / Revised: 23 November 2019 / Accepted: 26 November 2019 / Published: 30 November 2019

Abstract

:
Recently, different algorithms have been developed to assess near-surface particulate organic matter (POC) concentration over coastal waters. In this study, we gathered an extensive in situ dataset representing various contrasted bio-optical coastal environments at low, medium, and high latitudes, with various bulk particulate matter chemical compositions (mineral-dominated, 50% of the data set, mixed, 40%, or organic-dominated, 10%). The dataset includes 606 coincident measurements of POC concentration and remote-sensing reflectance, Rrs, with POC concentrations covering three orders of magnitude. Twelve existing algorithms have then been tested on this data set, and a new one was proposed. The results show that the performance of historical algorithms depends on the type of water, with an overall low performance observed for mineral-dominated waters. Furthermore, none of the tested algorithms provided satisfactory results over the whole POC range. A novel approach was thus developed based on a maximum band ratio of Rrs (red/blue, red/yellow or red/green ratio). Based on the standard statistical metric for the evaluation of inverse models, the new algorithm presents the best performance. The root-mean square deviation for log-transformed data (RMSDlog) is 0.25. The mean absolute percentage difference (MAPD) is 37.48%. The mean bias (MB) and median ratio (MR) values are 0.54 μg L−1 and 1.02, respectively. This algorithm replicates quite well the distribution of in situ data. The new algorithm was also tested on a matchup dataset gathering 154 coincident MERIS (MEdium Resolution Imaging Spectrometer) Rrs and in situ POC concentration sampled along the French coast. The matchup analysis showed that the performance of the new algorithm is satisfactory (RMSDlog = 0.24, MAPD = 34.16%, MR = 0.92). A regional illustration of the model performance for the Louisiana continental shelf shows that monthly mean POC concentrations derived from MERIS with the new algorithm are consistent with those derived from the 2016 algorithm of Le et al. which was specifically developed for this region.

Graphical Abstract

1. Introduction

Carbon is unevenly distributed in the biosphere among three major reservoirs: atmospheric, oceanic, and terrestrial (on land in vegetation, soils and freshwaters). Knowledge of the carbon exchanges between the different reservoirs is a key issue for better understanding the carbon cycle in the biosphere [1,2]. Although coastal waters represent only 7% of the oceanic surface area, this domain is of a particular interest, being an active exchange zone between the terrestrial and oceanic reservoirs. A significant amount of terrestrial carbon is transported from soils to river headstreams. A fraction of this carbon returns to the atmosphere via degassing occurring in inland waters, a fraction is stored in freshwater organic sediments, and the remaining amount is delivered by estuaries to the coastal waters as dissolved inorganic carbon (DIC), dissolved organic carbon (DOC) and particulate organic (POC) and inorganic (PIC) carbon [3,4,5]. Besides this pool of terrestrial carbon origin, marine coastal ecosystems are also productive areas where dissolved and particulate organic carbon may be locally produced and degraded due to complex biogeochemical and physical processes. For a better understanding of the role of coastal waters in the carbon cycle, the spatiotemporal evolution of the different carbon compartment (POC, DOC, PIC, DIC) and their respective standing stocks, must be evaluated and analyzed [6].
POC is one of the main pools of ocean organic carbon, which is composed of living material (heterotrophic bacteria, phytoplankton, zooplankton) and detritus (i.e., non-living cells). Despite its relatively small stock in open ocean waters, its high turnover rate makes POC a central component of the oceanic carbon cycle. Knowledge of the POC concentration distribution and dynamics is indeed a key parameter to study the biological export of carbon from the surface to the deep ocean but also the transfer of carbon throughout the marine food web. Indeed, being the first level of the trophic chain, the production of organic matter (and organic carbon) by phytoplankton supports higher trophic levels and marine diversity. Thus, the amount of POC is an indicator of productivity in the euphotic zone, and can also be used as an indicator of pollution events in coastal areas impacted by human activities.
Over the past few years, many bio-optical algorithms have been developed to derive the POC concentration at both the surface [7,8,9,10,11,12,13,14] and within the euphotic [15] or mixed oceanic layers [12,16] from ocean-color radiometry (OCR). These algorithms were developed for open waters and rely on the fact that the variability of the inherent optical properties is driven by phytoplankton and its associated material (heterotrophic bacteria, detritus, colored dissolved organic matter (CDOM)). The performance of different available POC algorithms for oceanic waters has recently been evaluated [17] showing that empirical approaches based on band ratios [11] and semi-analytical approaches based on the back scattering coefficient (bbp) and chlorophyll-a concentration (Chla) [8] performed the best. While the application of these algorithms to OCR observations allowed the pool of POC over the open ocean to be estimated (about 0.4 and 1.2 Pg. C in the first attenuation and euphotic layers, respectively), [15], such information is still not available for global coastal waters, which are more complex bio-optical environments [18]. To overcome this limitation on our understanding of the POC dynamics, some purely empirical approaches were recently developed from in situ measurements performed in offshore and coastal waters [19,20,21,22] or exclusively from measurements collected in coastal waters (mainly in river-dominated systems) [23] to estimate the surface POC concentration from OCR. However, these algorithms were almost all developed from limited datasets gathered in specific regions. This dictates that the results and performance of these approaches at a global scale may be strongly conditioned by the representativeness of the dataset used for their development. In other words, these algorithms may be not suitable to catch the large POC variability encountered in optically contrasted coastal areas.
This study emerged in this context and aimed at improving the retrieval of POC concentration for global scale applications in coastal waters (i.e., over large POC concentration range). For this purpose, a large number of in situ measurements performed at low, medium, and high latitudes were first gathered to constitute an extended dataset attesting to the high diversity of physical and biological coastal environments. Different existing algorithms built on different approaches and assumptions were tested over this in situ dataset. A new empirical algorithm involving a maximum band ratio was then developed. Finally, the new approach was applied to a dataset of the medium resolution imaging spectrometer (MERIS) and a coastal region was selected, where the spatial changes of POC concentrations were discussed.

2. Data and Methods

2.1. In Situ Data

The in-situ dataset includes the concentration of biogeochemical parameters (POC, Chla, and suspended particulate matter, SPM) and remote sensing reflectance spectra Rrs(λ) where λ is the wavelength. Measurements were collected by different contributors and instruments undoubtedly introducing uncertainties, which are not necessarily well characterized (Table 1). The field measurement protocols and data processing are described in detail in related papers listed in Table 1. Measurements were sampled between 1997 and 2015 in various coastal regions (Figure 1): European coastal waters [24,25,26,27,28,29], French Guiana [30], Eastern Viet Nam Sea [31,32], coastal waters of South East Pacific [33] and North Canada [34]. The particulate organic carbon is here considered as particulate carbon from organic origin retained by a Whatman GF/F filter according to the JGOFS (Joint Global Ocean Flux Study) protocol [5]. The POC is then composed of particles with a diameter between 0.4 and 200 μm, with pre-filtration usually performed.
The highest POC values are observed in French Guiana 5744 μg L−1 and Mekong River 4623 μg L−1. The lowest POC concentrations (< 100 μg L−1) are associated with the Chilean upwelling system sampled during the Biosope campaign [35]. The Chilean upwelling system was identified as coastal waters on criteria based on bathymetry (4000 m), distance to the coast (200 km), and Chla concentration (> 0.8 μg L−1) [32]. Biosope upwelling data were included in our dataset in order to consider the transition zone between coastal and open waters.
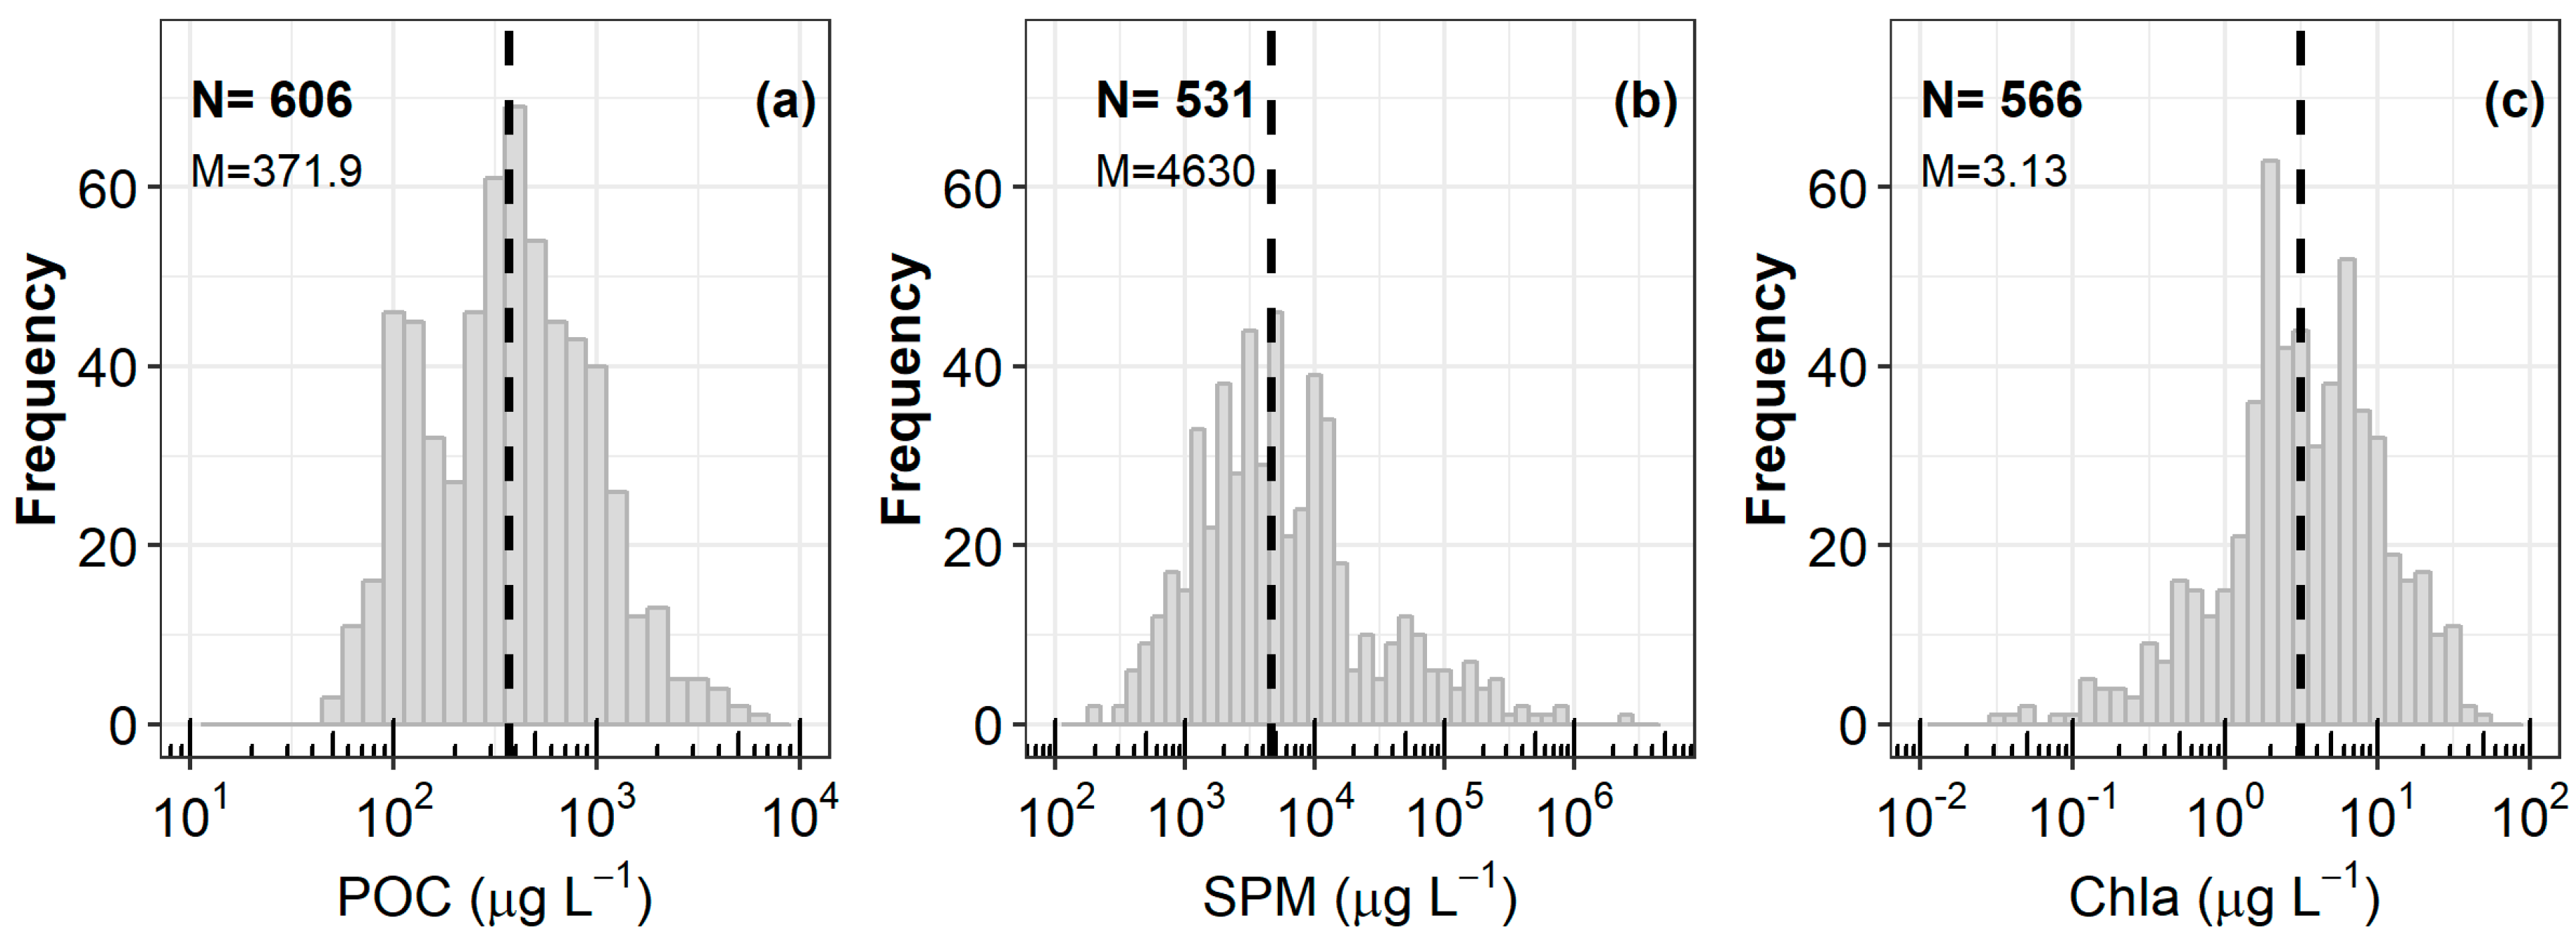
Among the Rrs(λ) spectra considered, about 69% were obtained from hyperspectral measurements performed from 310 to 950 nm with a 3 nm spectral resolution, while the remaining 31% were obtained from multispectral measurements at the standard spectral bands of ocean color sensors. Hyperspectral data were interpolated to obtain Rrs(λ) at every nanometer, to be able to test the different published algorithms considering their specific input spectral bands. Quality controls were applied on Rrs(λ) spectra based on criteria developed in [36] (unusual spectral shape, negative values in the near-infrared, strong deviation in the Rrs vs. SPM relationship in the red). The whole dataset (named DSW) consists of 606 measurements of POC concentrations (NPOC) associated with hyperspectral (73%) and multispectral (27%) Rrs(λ) spectra. Note that, for some of the 606 POC measurements, coincident Chla and SPM concentrations are missing so NPOC > NChla > NSPM. The POC, Chla, and SPM concentrations vary from 45.37 to 5744 μg L−1, 0.034 to 48.66 μg L−1, and 207.4 to 2626 x 103 μg L−1, respectively (Table 1 and Figure 2).
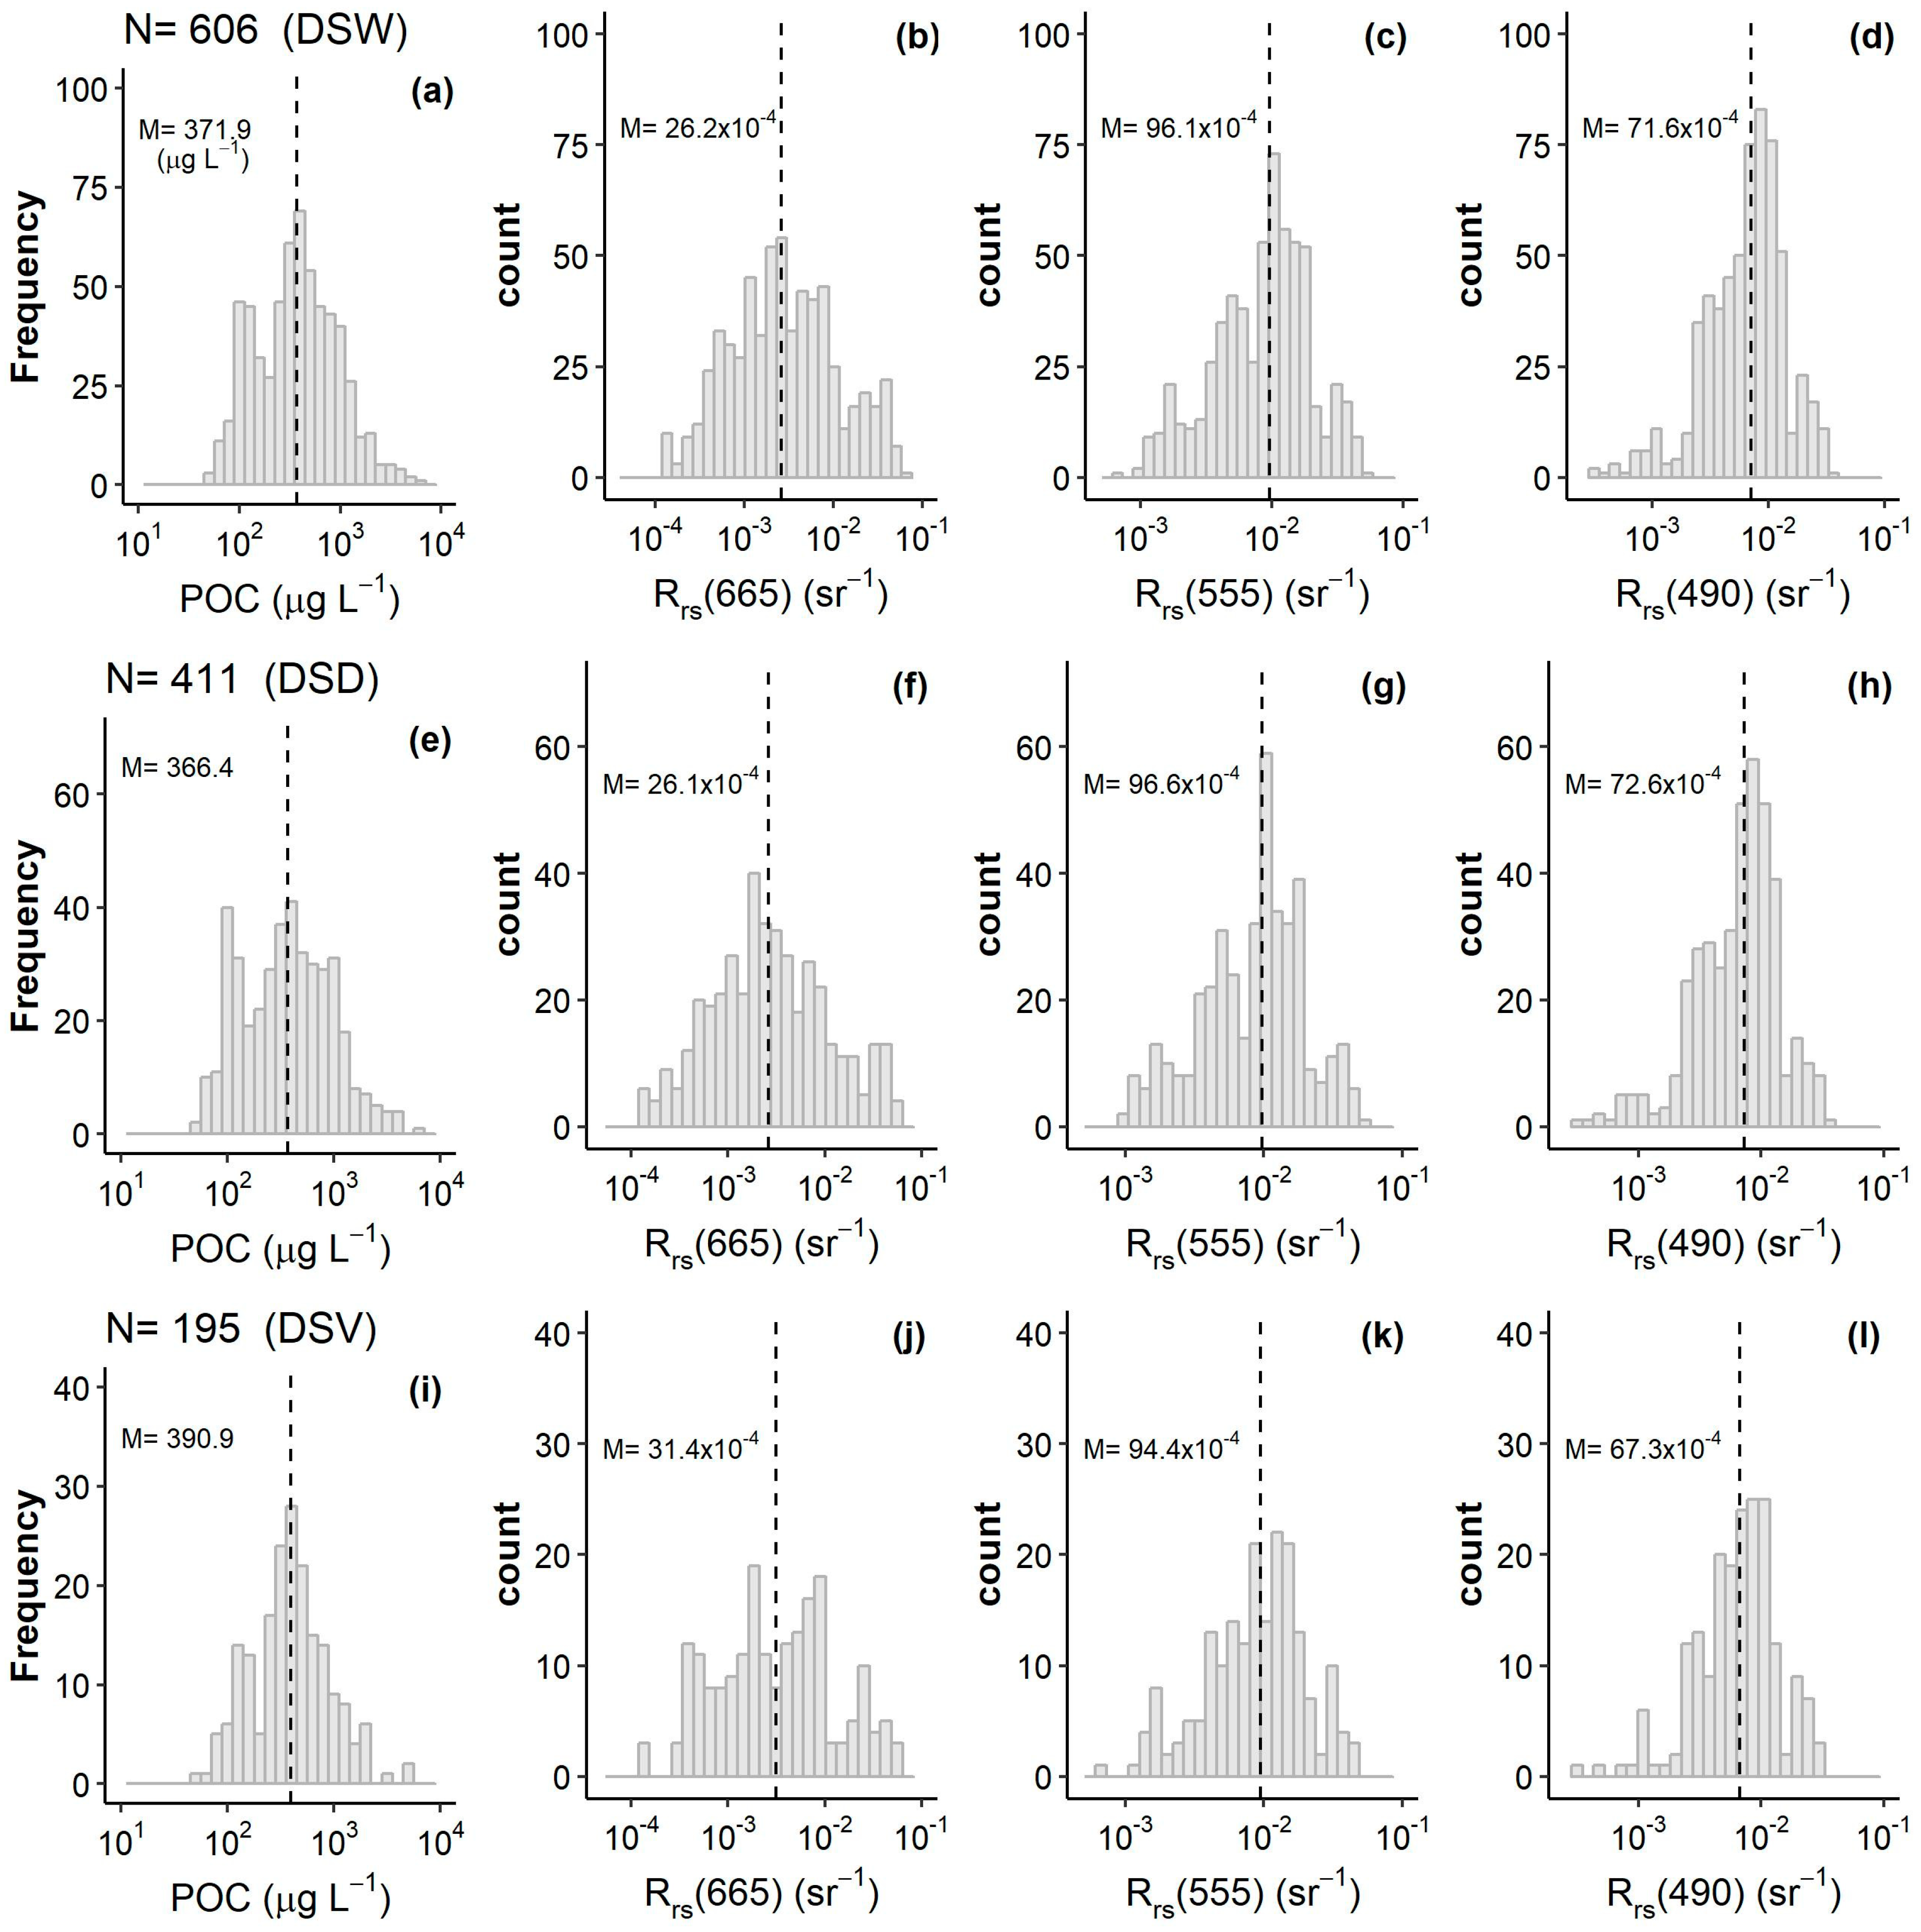
The large ranges of POC, SPM, and Chla concentrations attest to the high diversity of physical and biological coastal environments (river plumes, phytoplankton blooms, and areas affected by bottom sediment re-suspension, land-ocean exchange, and upwelling) sampled at low (tropical), medium, and high latitudes (Arctic). Because POC represents a significant fraction of the particulate organic matter, the POC to SPM ratio (POC/SPM) can be used as a rough proxy of the relative contribution of organic particles to the total suspended particulate matter [11,37,38,39]. Woźniak et al. 2010 [39] identified three types of waters according to the POC/SPM level. Waters are considered as mineral-dominated if POC/SPM < 0.06, organic-dominated if POC/SPM > 0.25, and mixed if 0.06 ≤ POC/SPM ≤ 0.25. According to these criteria, which may not be adapted for all water types while giving a rough approximation of the nature of the particulate assemblage, about 50% of the measurements of our dataset were sampled within mineral-dominated waters, 10% within organic-dominated waters, and 40% within mixed waters (Figure 3a). The whole dataset (DSW, NPOC = N = 606) was randomly split (Monte Carlo method) into a development dataset (DSD) and a validation dataset (DSV), which represent 67.8% (N = 411) and 32.2% (N = 195) of DSW, respectively. The ranges of Rrs (490), Rrs (555), and Rrs (665) and proportion of mineral-dominated, organic-dominated, and mixed waters are quite similar for DSW, DSD, and DSV (Figure 3). DSD and DSV cover about three orders of magnitude in terms of POC concentration (Figure 4) being representative of the large natural variability of coastal environments.

2.2. Satellite-In Situ Matchup Data Base

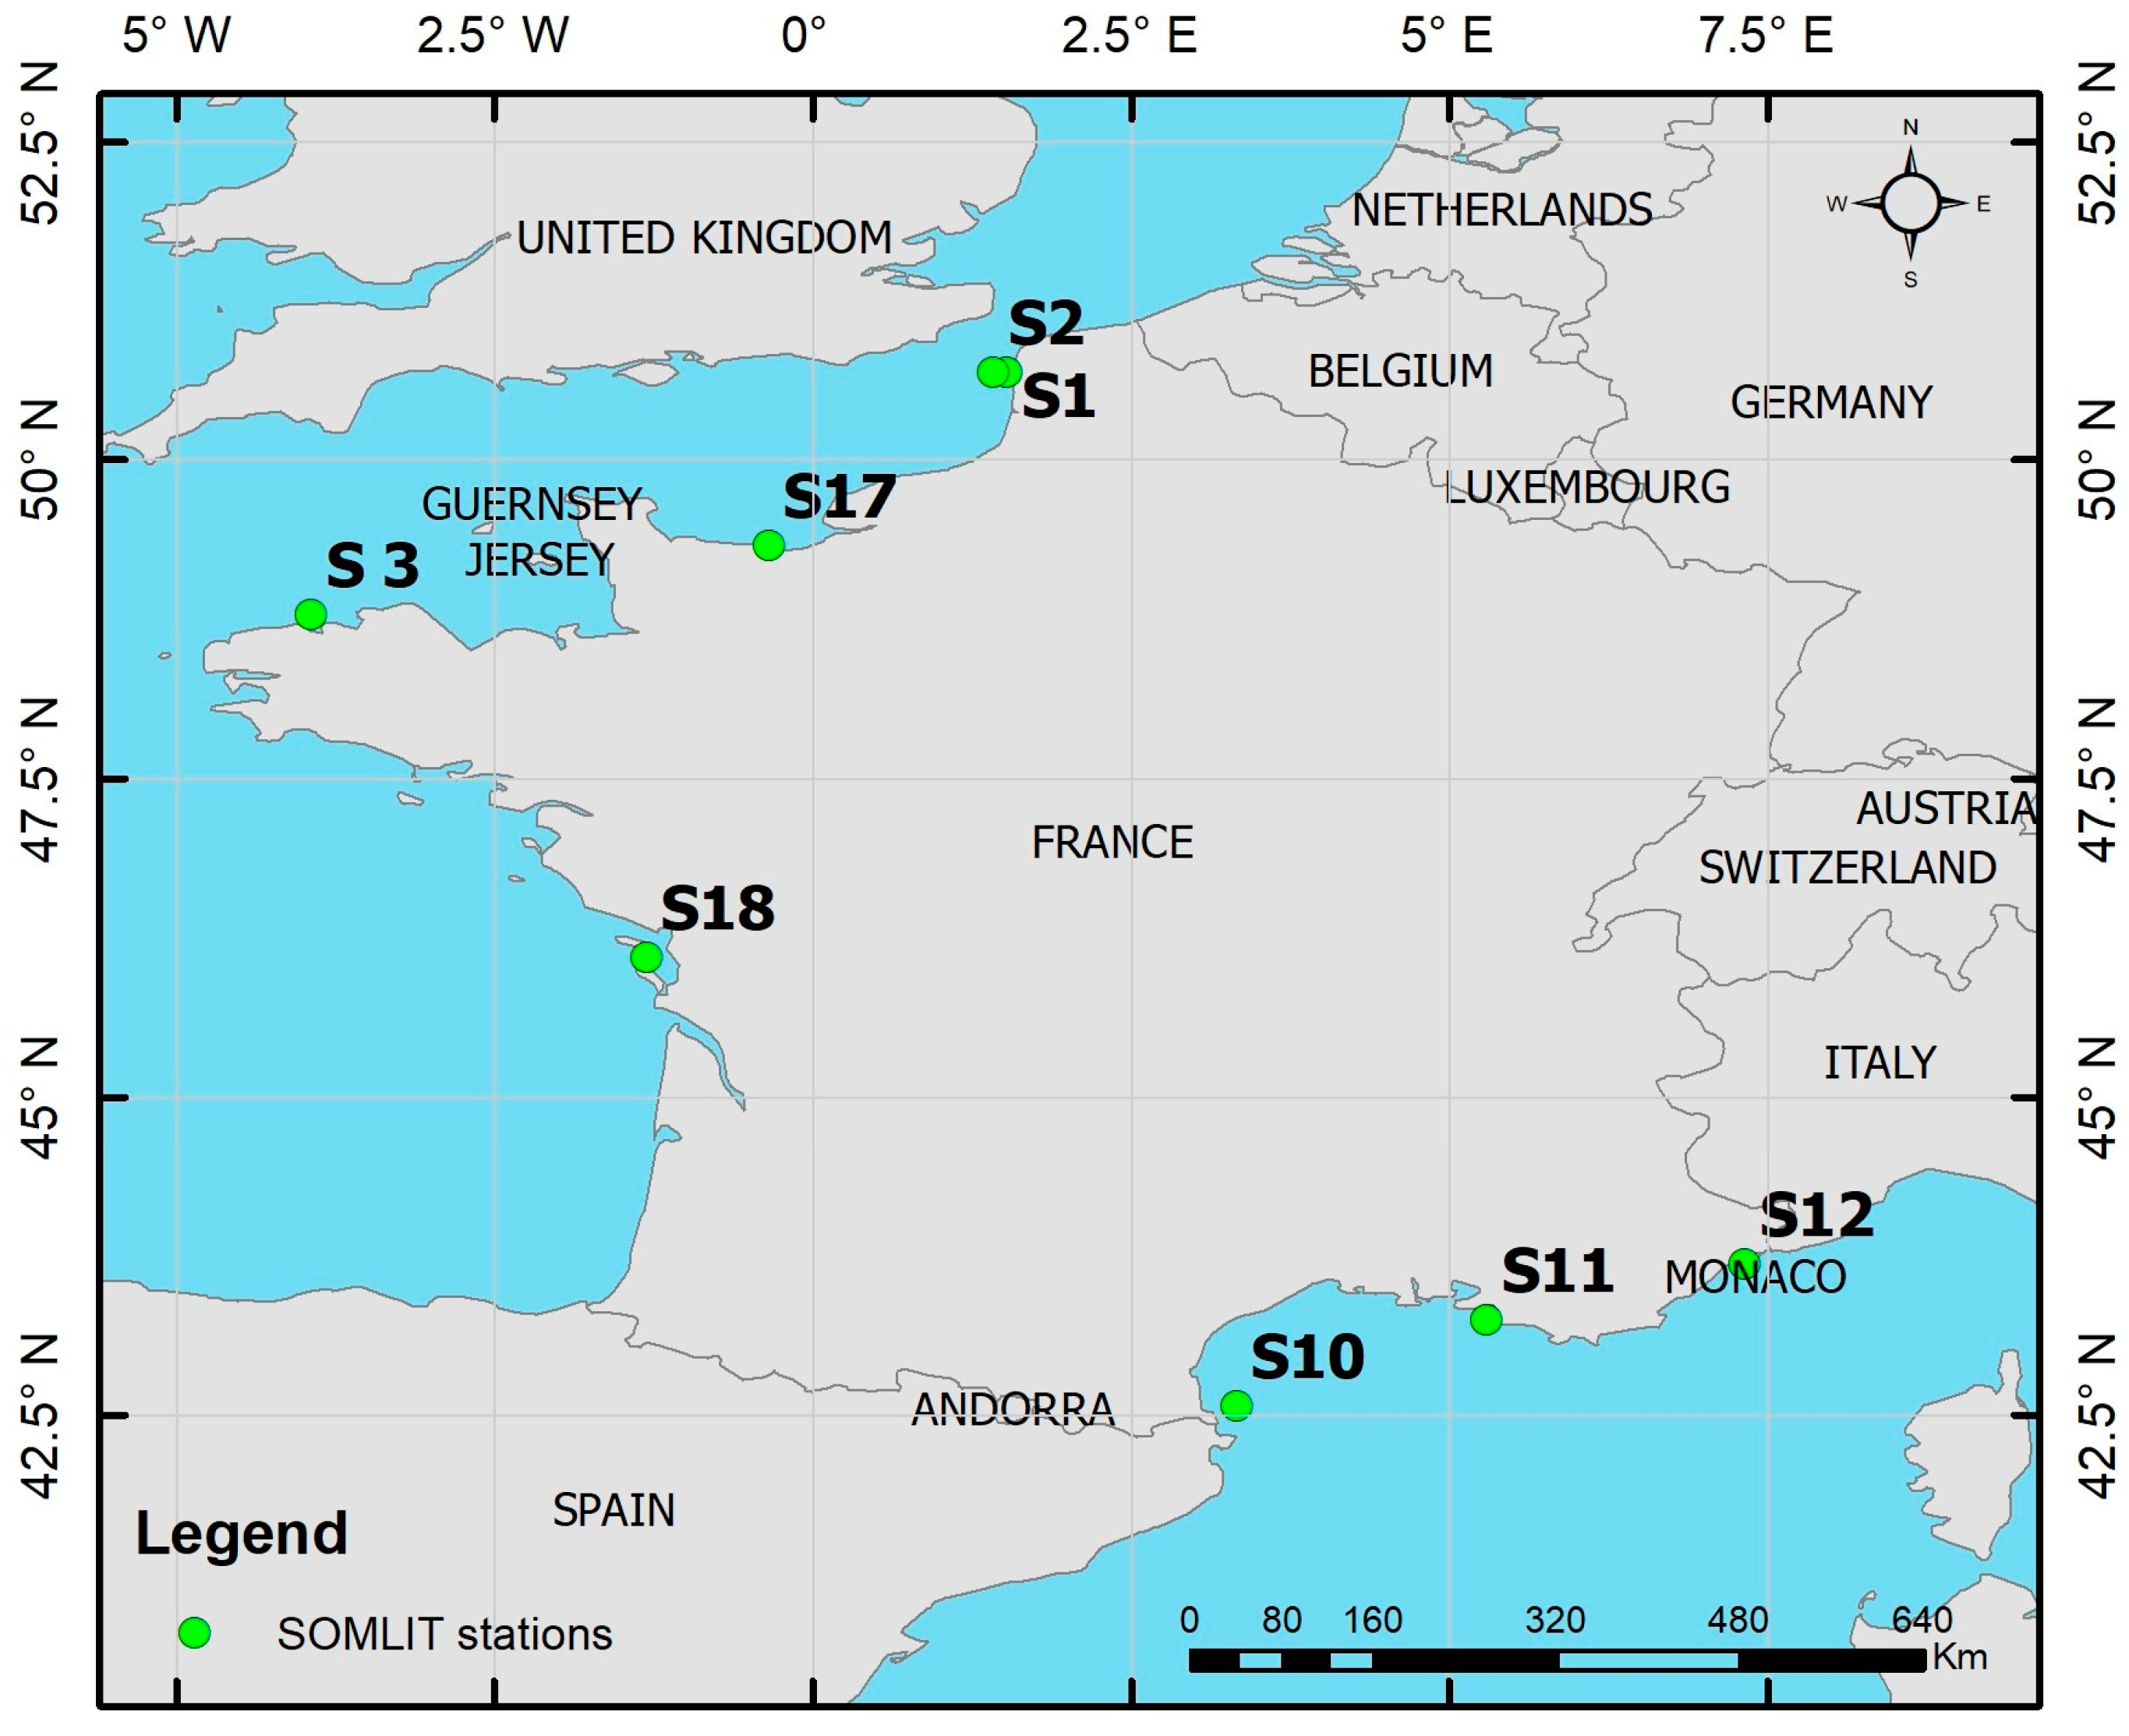
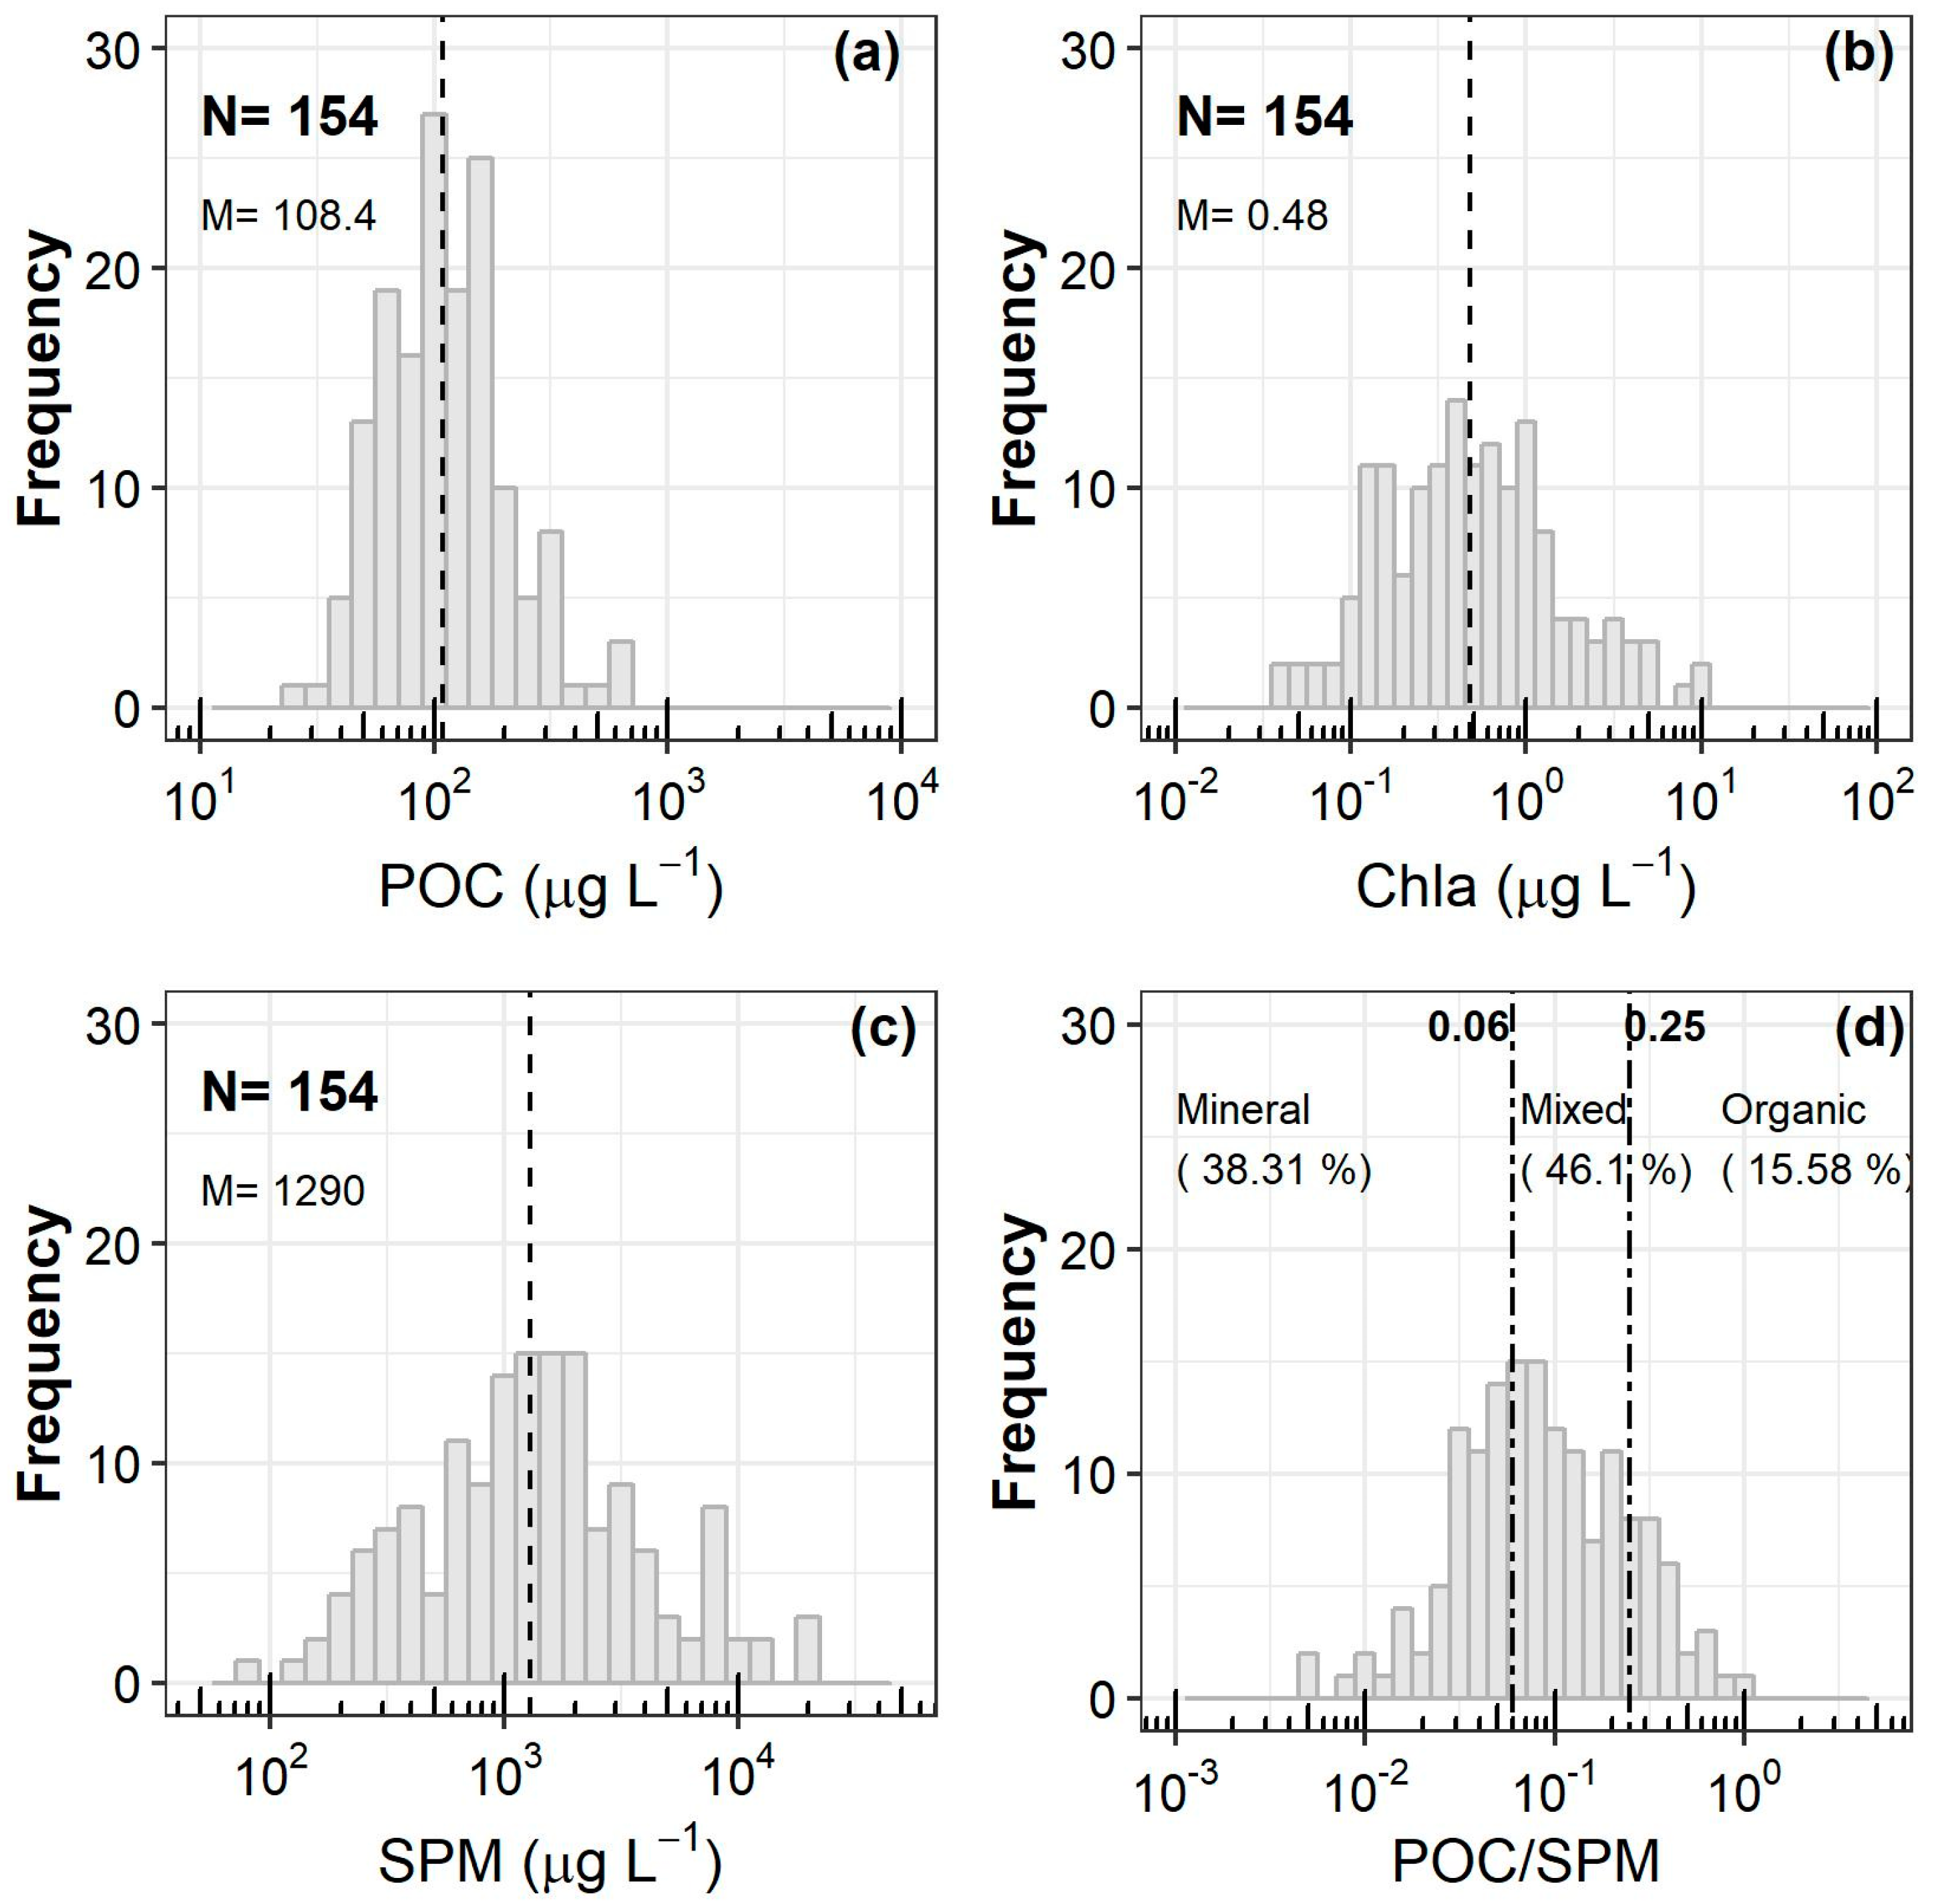
The matchup dataset is composed by in situ measurements of POC collected in the frame of the French Coastal Monitoring Network (SOMLIT, Service d’Observation en Milieu LITtoral, http://somlit.epoc.u-bordeaux1.fr/fr/) nearly simultaneously with the overpass of the MERIS onboard the European Space Agency (ESA)’s Envisat platform. The SOMLIT network gathers several coastal stations along the French coastline (Eastern English Channel, Atlantic Ocean, and Mediterranean Sea) sampled bi-monthly since 1995 (Figure 5). MERIS level 1 data were processed using the polymer atmospheric correction algorithm [41], which was adapted for coastal waters in the frame of the GlobCoast project funded by the French Research National Agency [42]. From daily MERIS images, a total of 336 in situ data points were extracted during the satellite lifetime (2002–2012). The criteria considered for the matchup selection were: (1) selection of a 3 × 3 pixel window centered on matchup location, (2) a time difference between in situ measurements and satellite overpass lower than 3 h (a time window of one hour also was tested with no significant differences in the results), (3) spatial homogeneity in the satellite pixels (coefficient of variation of Rrs(λ), ratio of the standard deviation to the mean computed over the pixel window, lower than 30%), and (4) number of valid pixels per pixel window greater than 6. After the application of all these criteria, the final matchup dataset is then composed of 154 matched points (Table 2). For the matchup dataset, POC concentrations are between 26.58 and 658.2 μg L−1, Chla ranges from 0.04 to 10.04 μg L−1, and SPM from 80 to 20,270 μg L−1, respectively (Figure 6). According to the value of the in situ POC/SPM ratio, 38.31%, 15.58%, and 46.1% of matchups concern mineral-dominated, organic-dominated, and mixed waters, respectively.

2.3. Candidate Algorithms

Many bio-optical algorithms have been developed to derive the near-surface concentration of POC from satellite measurements [7,8,9,10,11,12,13,14] and an inter-comparison exercise was recently performed to test their respective performances [17]. These algorithms were developed for open ocean waters and rely on the dominance of phytoplankton biomass in the total POC concentration. More recently, some purely empirical approaches were developed from in situ measurements performed in offshore and coastal waters [19,20,21,22] or exclusively from measurements collected in coastal waters (mainly in river-dominated systems) [23]. These algorithms are all empirical because the use of a semi-analytical algorithm to estimate POC requires a perfect knowledge of the spectral specific POC-IOPs properties, which are not available as yet.
These latter coastal and offshore-coastal algorithms, which were almost all developed for specific regions (Table 3), were all considered for the inter-comparison exercise. In addition, we selected Stramski et al., (2008) algorithm that was implemented by the NASA Ocean Biology Processing Group to derive POC from MODIS at global scale. Because this algorithm is dedicated to open waters, the discussion on its performance is limited to organic-dominated waters. The selected models are representative of the different approaches found in the literature: purely empirical approaches using Rrs(λ) [23], Rrs band ratios [11,19,20,21], or color index [22] as input parameters.

2.3.1. Band Ratio-based Algorithms

S08—Stramski et al., 2008 [11] developed an empirical algorithm based on Rrs(λ) ratios at two different wavelengths to derive POC concentration in open ocean waters. This algorithm was developed from in situ data (N = 53) collected within oligotrophic and upwelling waters of the eastern South Pacific Ocean (10 ≤ POC ≤ 270 μg L−1) during the Biosope campaign. This algorithm is based on an empirical power-law between near-surface POC and blue-to-green ratio of Rrs(λ). Stramski et al. (2008) showed that the following two algorithms have the best performance for their dataset:
POC = 203.2 [ R rs ( 443 ) R rs ( 555 ) ] 555 ) 0
POC = 308.3 [ R rs ( 490 ) R rs ( 555 ) ] 555 ) 0
These two algorithms will be named S08-1 (Equation (1)) and S08-2 (Equation (2)) in the following.
W16—Woźniak et al. 2016 [21] proposed an empirical algorithm built from 73 in situ measurements collected during four field campaigns during spring and late summer within the open waters of the Southern Baltic and coastal regions of the Gulf of Gdańsk. POC measurements cover a wide range from 145 to 2370 μg L−1. The authors tested correlations of POC concentrations with reflectance ratios at various spectral bands leading to the selection of the Rrs(555)/Rrs(589) ratio:
POC = 0.814 × [ R rs ( 555 ) R rs ( 589 ) ] 589 )
A good performance was also obtained with the Rrs(490)/Rrs(625) ratio, which has benefits to consider the input Rrs close to bands potentially available from satellite observations:
POC = 0.774 [ R rs ( 490 ) R rs ( 625 ) ] 625 )
Equations (3) and (4) will be further named W16-1 and W16-2, respectively. Note that the 589 nm spectral band is absent in all ocean color sensors, while the 625 nm band is only available for MERIS and OLCI (Ocean and Land Colour Instrument).
Hu16—Hu et al., 2016 [20] developed a regional algorithm using coastal and offshore data (N = 120) collected in the South China Sea mainly during the summer. The POC values range between 25.3 and 687.5 mg m−3. Their algorithm is quite similar to the 2008 algorithm from Stramski et al. as it is based on a blue-to-green reflectance ratio. The authors examined the following band ratios:
POC = 262.1730 [ R rs ( 443 ) R rs ( 555 ) ] 555 ) 6
POC = 285.0929 [ R rs ( 490 ) R rs ( 555 ) ] 555 ) 85
POC = 243.8148 [ R rs ( 510 ) R rs ( 555 ) ] 555 ) 43
They showed that the algorithm described by Equation (5) provides the best performance. The Equations (5)–(7) will be further named Hu16-1, Hu16-2, and Hu16-3, respectively.
Liu15—Liu et al., 2015 [19] developed an algorithm for estimating surface POC concentration in the highly turbid waters of the Pearl River estuary in China. Their algorithm is based on band ratios of the equivalent reflectance computed for MODIS/AQUA (Moderate Resolution Imaging Spectro-radiometer) spectral bands (412, 443, 488, 531, 551, 667, 678 and 748 nm). The equivalent reflectance is defined by Equation (8):
r equi ( ) = λ min λ max f ( λ ) r ( λ ) L ( λ ) d λ / λ min λ max f ( λ ) L ( λ ) d λ
where requi(λ) is the equivalent reflectance for a band with a central wavelength λ, f(λ) is the spectral response function, available from the Ocean Color website (http://oceancolor.gsfc.nasa.gov/), r(λ) is the in situ remote-sensing reflectance, L(λ) is the solar irradiance at mean Earth-Sun distance, λmin is equal to 350 nm, and λmax is 800 nm. The authors selected an approach based on two different band ratios, and used an optimization approach to determine the best band combination:
POC = b 0 + b 1 r equi ( λ 1 ) r equi ( λ 2 ) + b 2 r equi ( λ 3 ) r equi ( λ 4 )
After testing all possible band combinations, the algorithm achieved the best fit with λ1 = 678 nm, λ2 = 488 nm, λ3 = 748 nm, and λ4 = 412 nm. The regression coefficients are b0 = 0.0078, b1 = 1.3973, and b2 = −1.2397. Equation (9) is named Liu15. It was shown that the Rrs(λ) values at the central bands are very similar to the equivalent reflectance values calculated using the band spectral response at all visible bands of the different OCR [36]. For this reason, the central remote-sensing reflectance at 678, 488, 748, and 412 nm are used instead of the equivalent reflectance in this inter-comparison exercise.
It is worth noticing that the two-step algorithm developed by Woźniak et al. in 2016 [21], based on the particulate absorption (ap) coefficient at 570 and 675 and the concentration of SPM, was not tested because of the complexity in retrieving ap in the green and in the red from OCR [43].

2.3.2. Absolute Rrs-based Algorithms

Le16- Using a dataset of in situ POC concentrations matched with satellite Rrs(λ), Le et al., 2016 [23] developed multiple regression algorithms for two river-dominated estuaries in the northern Gulf of Mexico (the Louisiana Continental Shelf and Mobile Bay). The multiple linear regression models which showed the lowest prediction error between log(POC) (log-transformed base 10) and Rrs(λ) are given in Equation (10) (named Le16-1) and in Equation (11) (L16-2). L16-1 and L16-2 were developed using MODIS and SeaWiFS (Sea Viewing Wide Field of View Sensor) spectral bands, respectively.
log(POC)= −126.22 × Rrs(488) − 120.74 × Rrs(531) + 245.42 × Rrs(547) − 493.54 × Rrs(667) + 489.3 × Rrs(678) − 0.59
log(POC) = −115.69 × Rrs(490) − 53.64 × Rrs(510) + 172.13 × Rrs(555) − 40.06 × Rrs(670) − 0.54

2.3.3. Color Index Algorithm

Le18—In 2018, Le et al., [22] formulated two algorithms using in situ POC data from the SeaWiFS Bio-optical Archive and Storage System (SeaBASS) of NASA (https://seabass.gsfc.nasa.gov) and satellite Rrs(λ) data obtained from matchups. This approach uses three spectral bands centered at 490 nm, 550 nm, and 670 nm to determine a color index (CIPOC, Equation (12)), from which the POC concentration is estimated (Equations (13) and (14)). This approach is named Le18-1.
CIPOC = Rrs(555) − (Rrs(490) + (555 − 490)/(670 − 490) × (Rrs(670) − Rrs(490)))
CIPOC ≤ −0.0005: log(POC) = 185.72 × CIPOC + 1.97
CIPOC ≥ −0.0005: log(POC) = 485.19 × CIPOC + 2.1
Le et al. formulated another algorithm based on the blue-to-green ratio (Equations (15) and (16)). The color index (Equation (12)) is used to pick up a suitable relationship. Indeed, the authors indicated that Equation (15) used when the CIPOC is less than –0.0005 is more suitable for open waters, whereas Equation (16) used when CIPOC is greater than –0.0005 is suitable for coastal waters, respectively.
CIPOC ≤ −0.0005: log(POC) = −0.66 × log[Rrs(443)/Rrs(555)] + 2.06
CIPOC ≥ −0.0005: log(POC) = −1.38 × log[Rrs(443)/Rrs(555)] + 2.31

2.4. Statistical Indicators Used for Model Development and Validation

To assess the performance of the 12 selected algorithms, we use the graphical comparison of model predictions and observations as well as quantitative statistical metrics of differences between the corresponding predictions of model and observations. These indicators include the root mean square deviation for log-transformed data (RMSDlog) (Equation (17)), the root mean square Deviation for un-transformed data (RMSD) (Equation (18)), and the median absolute percent difference (MAPD) (Equation (19)):
RMSD log = ( i = 1 N ( log ( POC i mod ) odD ( POC i obs ) ) 2 / N ) 1 2
RMSD = ( i = 1 N ( POC i mod POC i obs ) 2 / N ) 1 2
MAPD = median [ | POC i mod POC i obs POC i obs | ] × 100
where POCiobs and POCimod are the in situ and model—derived POC concentration. The mean bias (MB) (Equation (20)) and the median ratio (MR) (Equation (21)) are also calculated:
MB = 1 N i = 1 N ( POC i mod POC i obs )
MR = median ( POC i mod POC i obs ) .
The statistical indicators obtained for the 12 algorithms are normalized to be compared graphically. For that purpose, the normalized statistical indicators for each algorithm are defined as follows:
MAPD norma ( j ) = MAPD ( j ) maximum ( MAPD ( j ) ,   j = 1 , k )
RMSD log norma ( j ) = RMSD log ( j ) maximum ( RMSD log ( j ) ,   j = 1 , k )
MB norma ( j ) = | MB ( j ) | maximum ( | MB ( j ) | ,   j = 1 , k )
MR norma ( j ) = | MR ( j ) R | maximum ( | MR ( j ) R | ,   j = 1 , k )
where j identifies the algorithm (j =”S08-1”,”S08-2”, “W16-1”, “W16-2”, “Hu16-1”, “Hu16-2”, “Hu16-3”, “Liu-15”, “Le16-1”, Le16-2”, “Le18-1”, “Le18-2”) and k is the number of tested algorithms.
Radar charts are also used to compare the performance of the algorithms. A radar chart is a graphical method displaying multi parameters in the form of a two-dimensional chart. The radar plots in used in the present study give an overview of the statistical indicators by displaying the normalized MAPD, RMSDlog, MB and MR (Equations (22)–(25)). For the development of the new model, we also use a half-matrix representation of the determination coefficient (R2) calculated between POC and Rrs(λi)/Rrs(λj) as it does not matter which Rrs(λ) is taken as a numerator or denominator.

3. Results and Discussion

3.1. Development of a New Algorithm for POC

As explained in Section 2.3.1, empirical algorithms based on band ratios at two different wavelengths were first developed for open waters. More recently, they were adjusted to coastal waters but from limited in situ datasets in terms of the number of samples or geographical distribution (Table 3). The objective of this section is to define a band ratio algorithm for coastal waters using the large DSD dataset. The use of band ratios allows the influence of potential errors due to atmospheric correction being minimized [21].
The performance of different color ratios is tested considering only the hyperspectral Rrs(λ) measurements in DSD (N=298, representing 72.5% of DSD). For each spectrum, Rrs(λ) in the visible part (400–700 nm) is measured at 300 different wavelengths (Rrsi)). Mathematically, the different Rrs(λ) ratios, defined as Rrsi)/Rrsj) where ij, correspond to k-combinations (Rrsi), Rrsj)) of the set composed of DSD hyperspectral Rrs(λ). The number of k-combinations is equal to 44,850. It corresponds to the binomial coefficient calculated using the factorials according to:
( n k ) = n ! k ! ( n k ) !
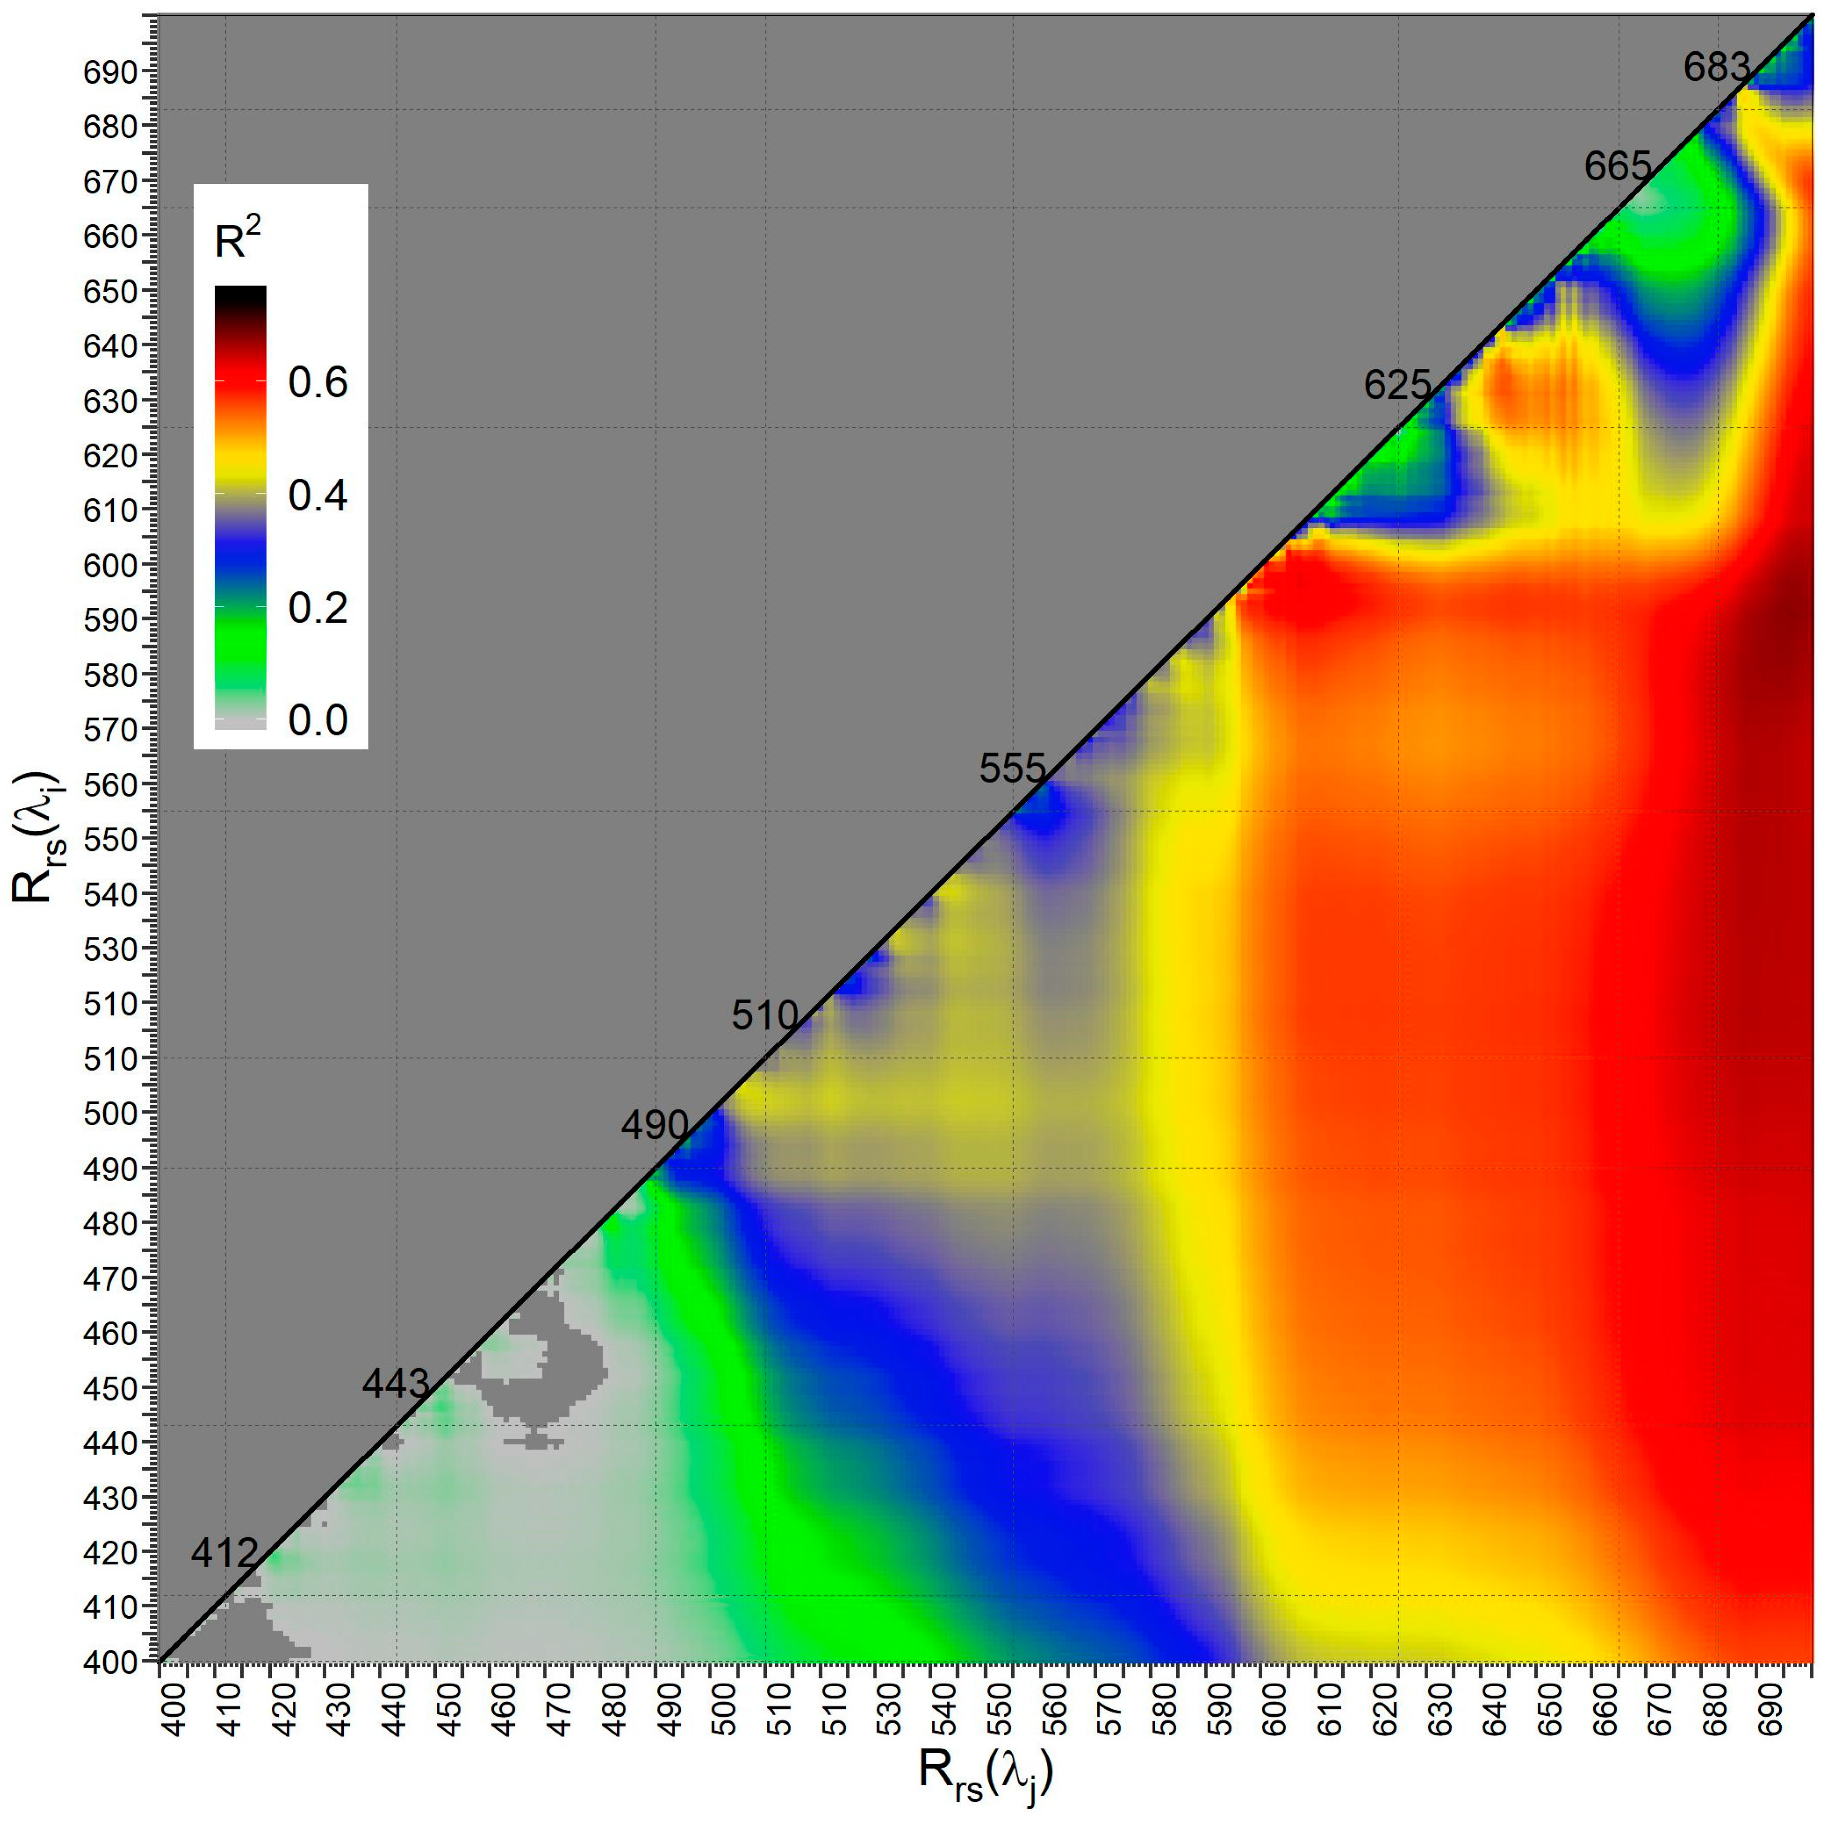
where k = 2 and n = 300. So, 44,850 linear type II regressions were computed between POC and the different Rrsi)/Rrsj) ratios. Both POC concentration and Rrsi)/Rrsj) were log-transformed to base 10. Figure 7 summarizes through a half matrix representation the value of the coefficient of determination (R2) for the 44,850 regressions. The highest R2 values (about 0.68) are obtained for band ratios Rrsi)/Rrsj) with λi ranging from 675 to 695 nm and λj ranging from 490 and 590 nm. It corresponds to red-to-blue, red-to-green, or red-to-yellow ratios. However, as the spectral region around 680 nm corresponds to the maximum of chlorophyll fluorescence [44,45], the Rrs(λ) signal may be contaminated by light emission, which may bias the POC retrieval. Figure 7 shows that Rrs(λ) between 660–670 nm and Rrs(λ) between 490–560 are “statistically promising” spectral band combinations. The advantage is that many ocean color sensors have bands in the corresponding spectral region. These results are in agreement with those of Woźniak et al. in 2016, who obtained good performance for a blue-to-red ratio (Rrs(490)/Rrs(625) (Equation (4)). As MERIS data will be used in the matchup exercise, a focus is performed on bands for that sensor, selecting the following red-to-green and red-to-blue band ratios: Rrs(665)/Rrs(555), Rrs(665)/Rrs(510), Rrs(665)/Rrs(490) (Table 4 and Figure 8). Note that these bands are also available on OLCI, SeaWiFS, and VIIRS (Visible Infrared Imaging Radiometer Suite).
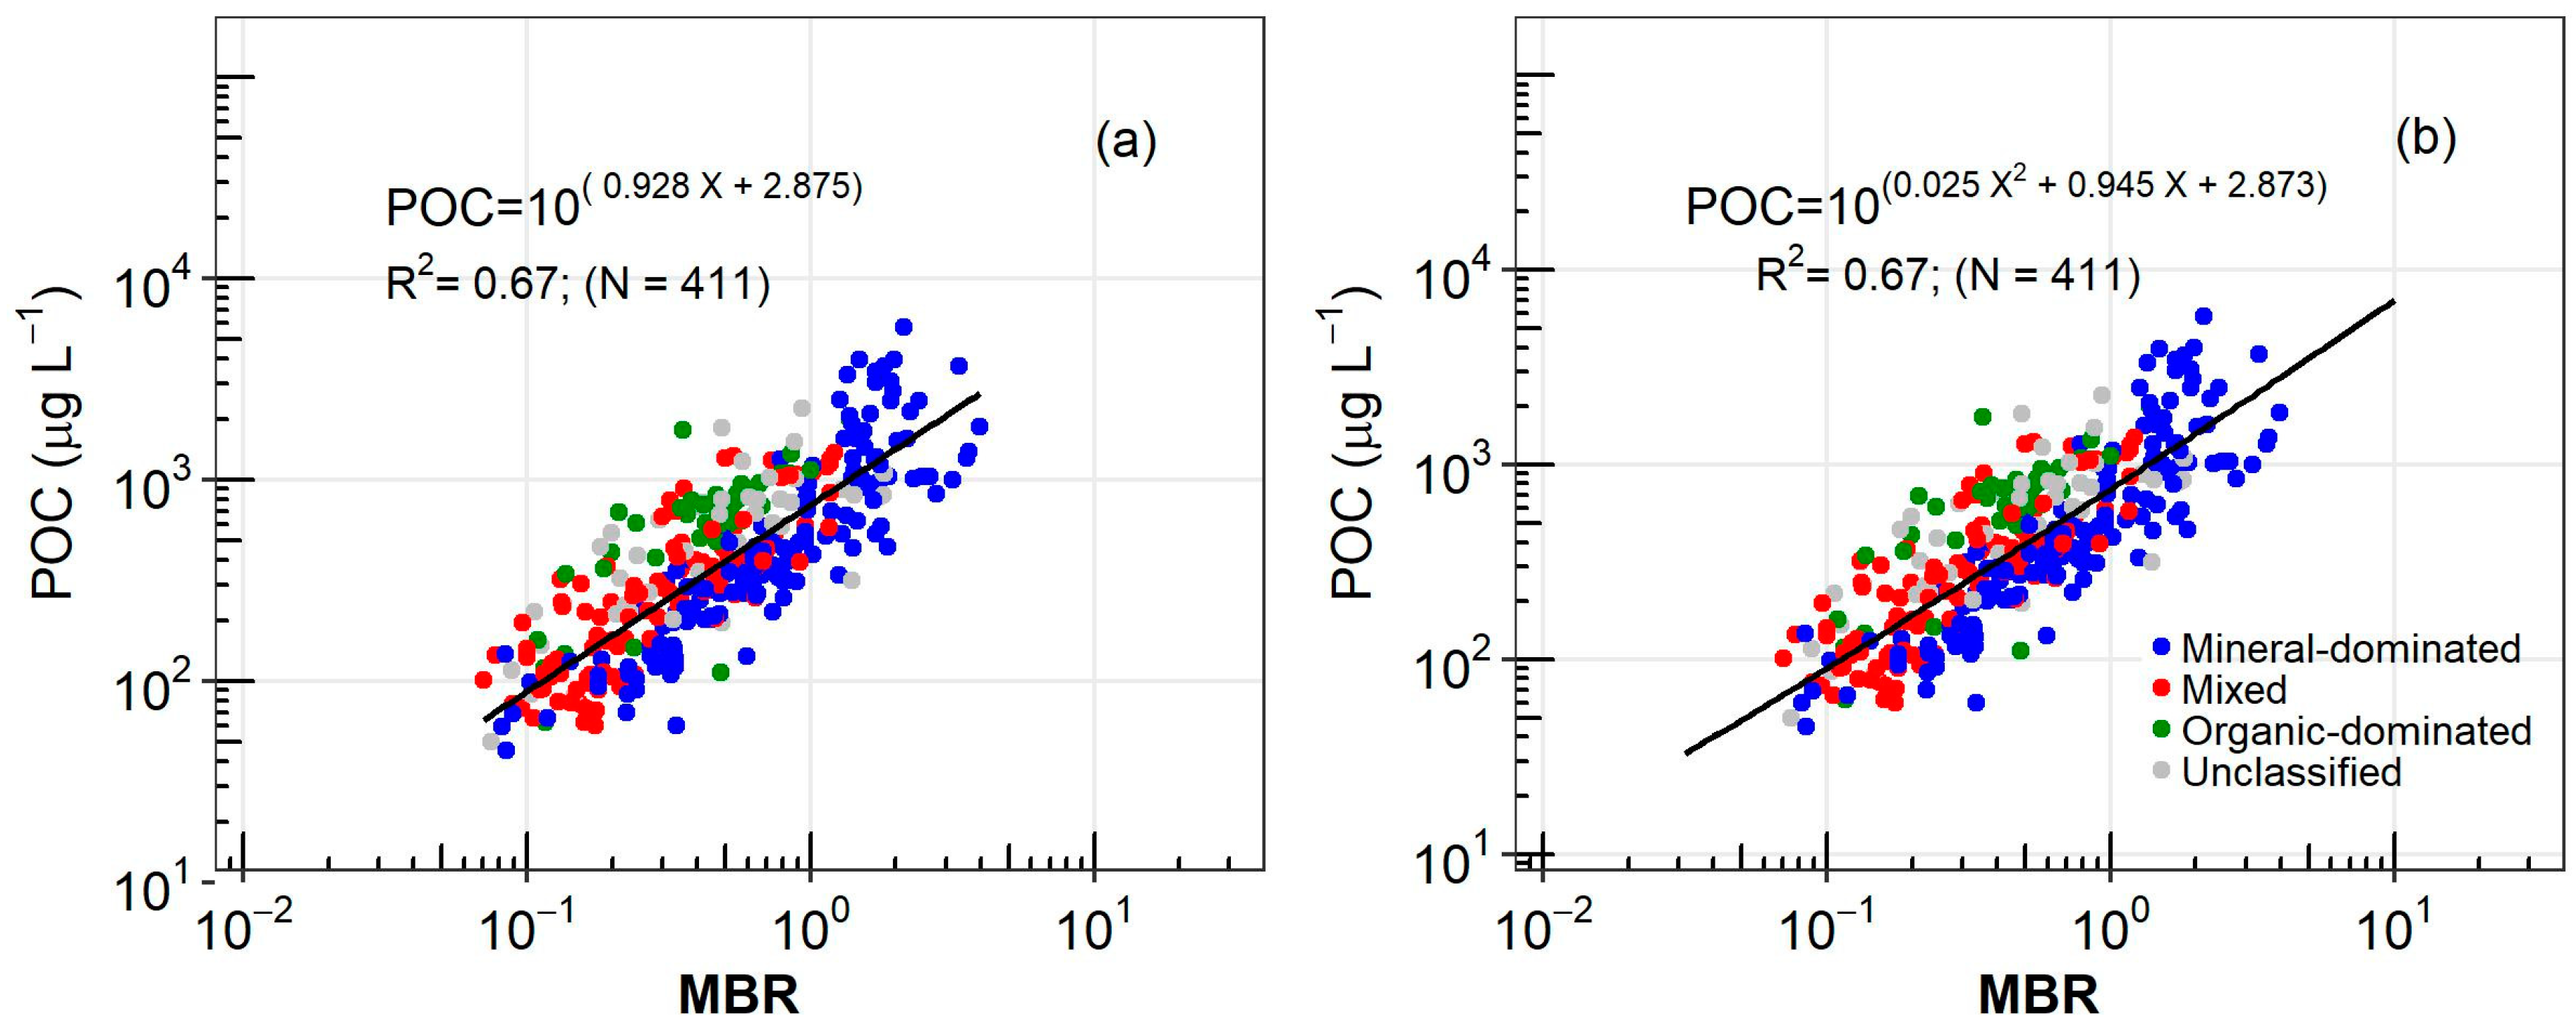
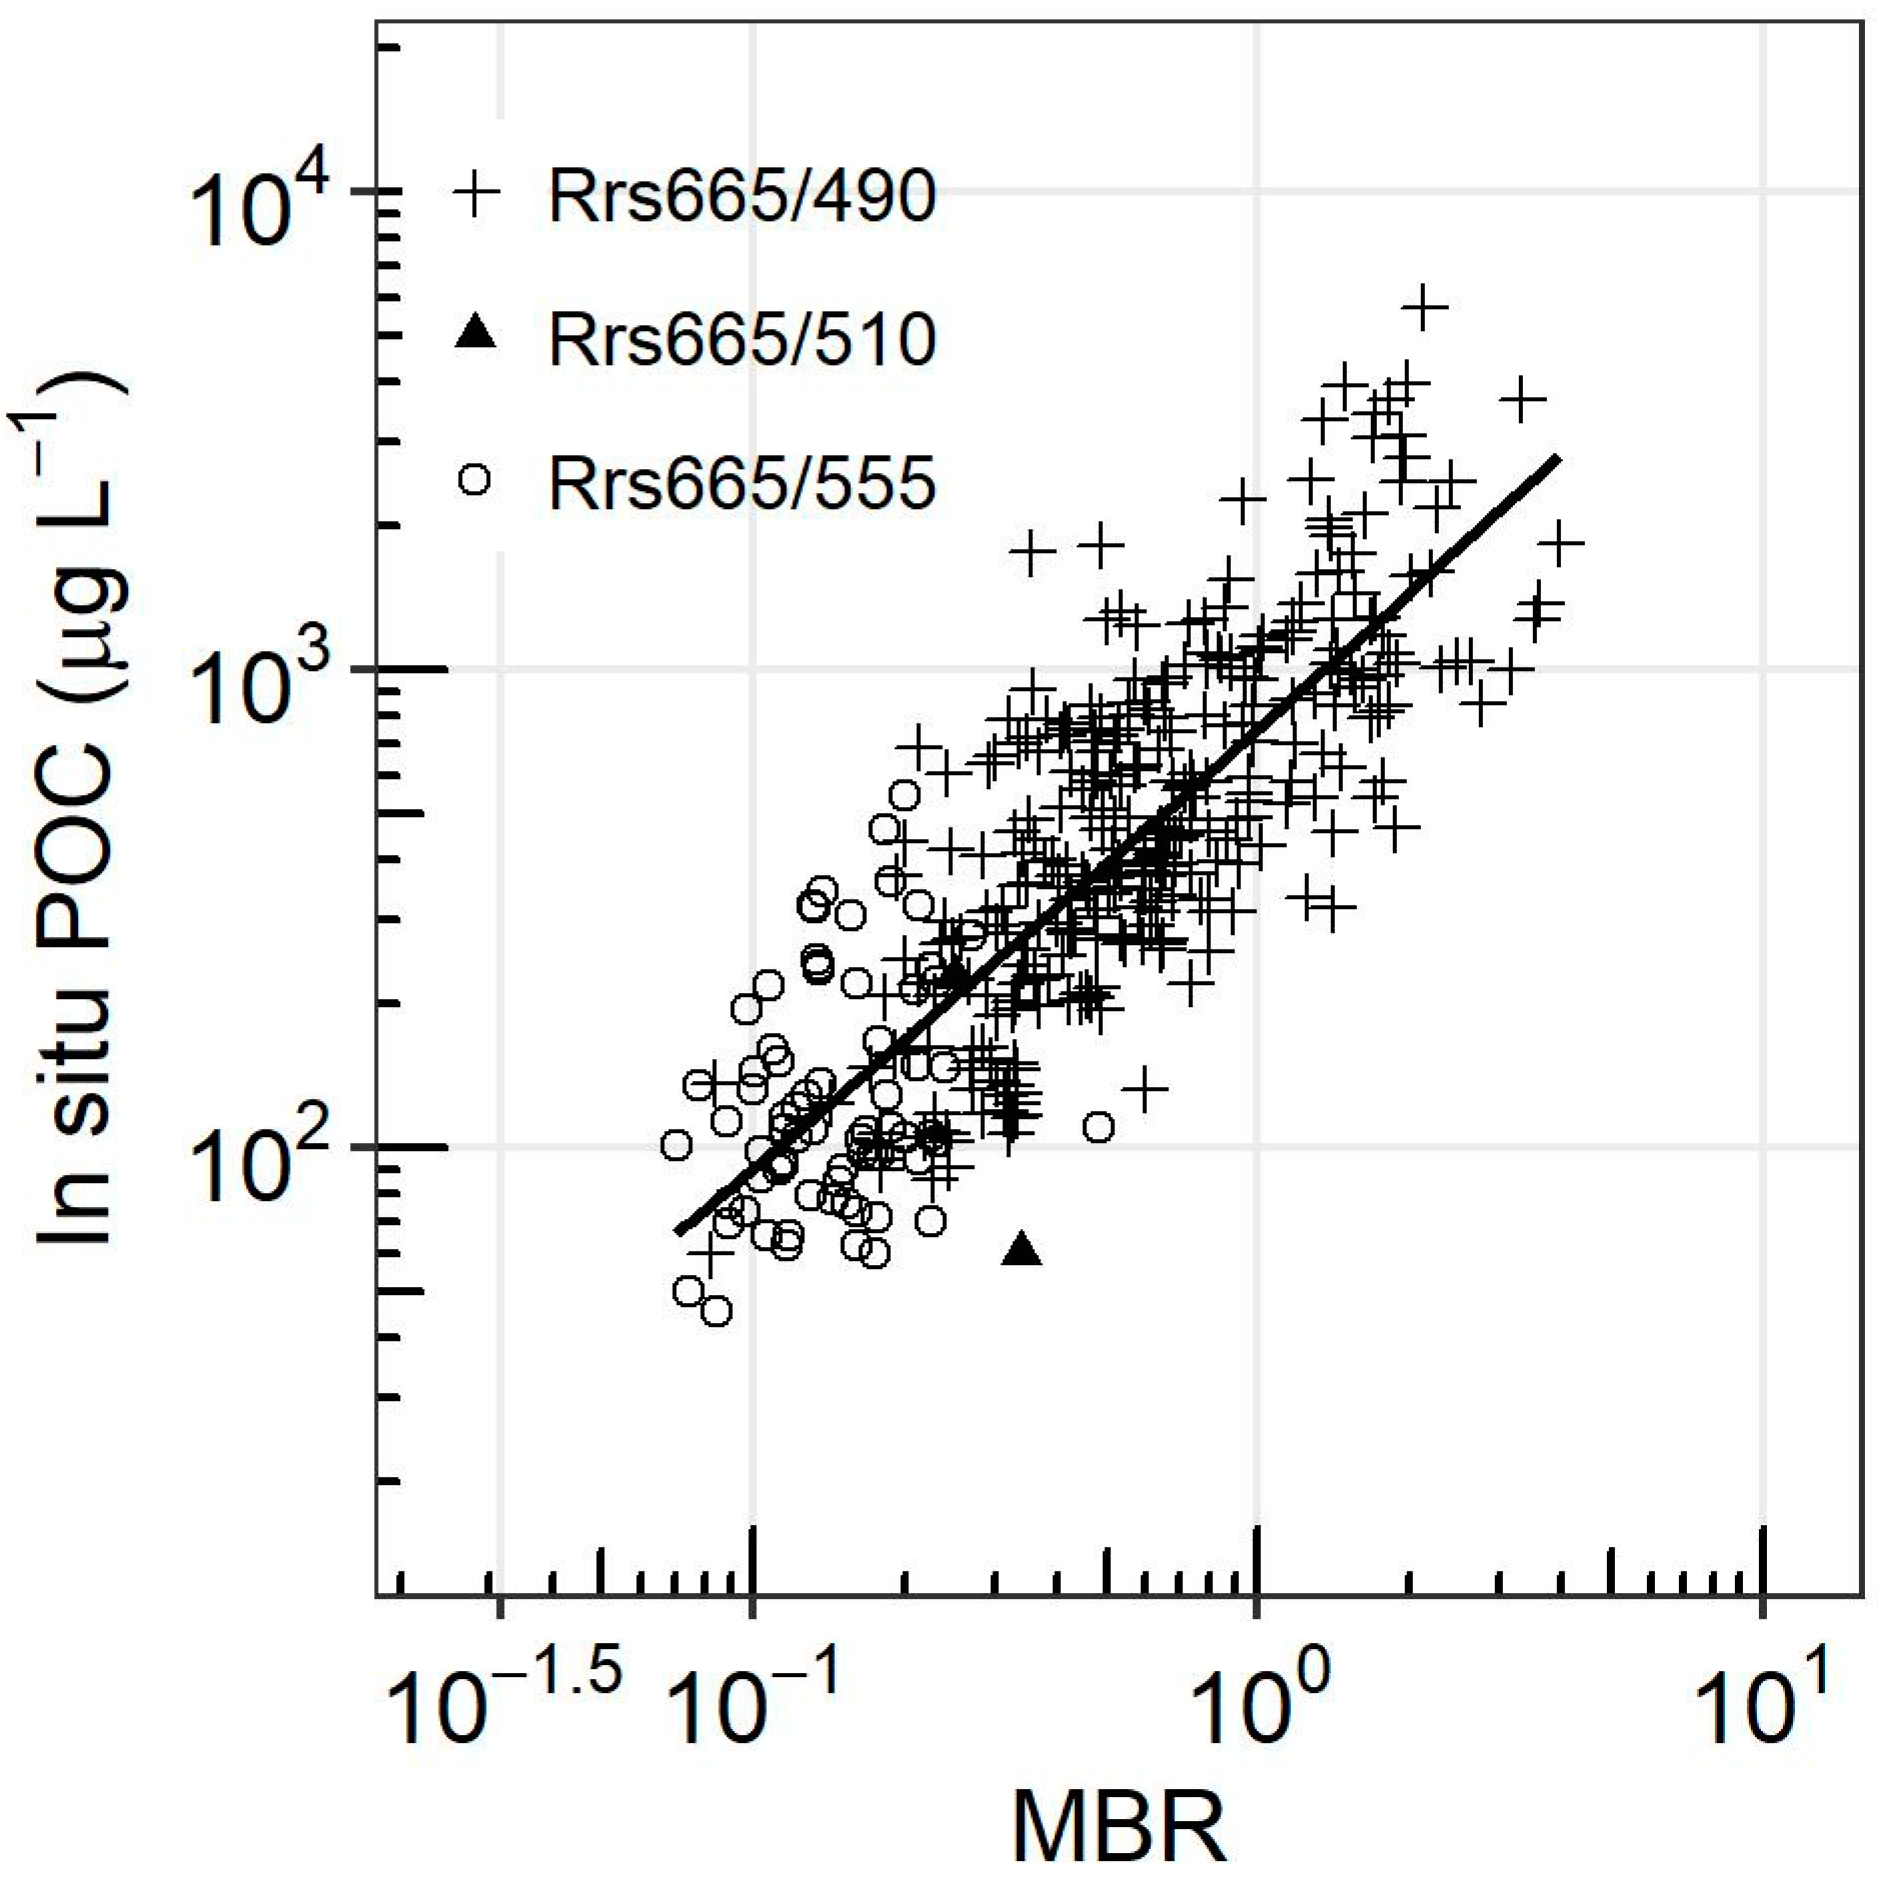
Because of the slightly different statistics (in terms of R2 and RMSD) observed between POC and the different latter band ratios (see Table 4), a linear (and polynomial) type II regression (log-transformed data) based on the maximum band ratio (MBR) are also examined (Figure 9). Considering both statistical and graphical criteria, the linear type II regression based on MBR presents rather better performance with linear type II regression based on a single band ratio. The coefficient of determination is a bit higher (R2 = 0.67 instead of R2 between 0.59 and 0.66) and the RMSDlog is a bit lower (RMSDlog = 0.242 instead of RMSDlog between 0.246 and 0.267) (Table 4). As already discussed by [46] for Chla estimates from OC4 algorithm, the MBR allows to switch from a given band ratio to another, thereby avoiding, in some cases, a low and potentially noisy band ratio. Thus, in the context of satellite applications, it is expected that using MBR instead of a single band ratio allow maximization of the model precision over the entire range of POC. Among the three band ratios, Rrs(665)/Rrs(490) and Rrs(665)/Rrs(555) are maximal for POC above 500 μg L−1 and POC below 500 μg L−1, respectively (Figure 10). The latter pattern can be explained by the fact that, over their broad range of variability, SPM and POC tend, at first order, to co-vary in coastal waters (R2 = 0.63 on DSW). For instance, high SPM values increase Rrs in the red, while associated high POC values will increase absorption in the blue-green part of the spectrum, hence decreasing Rrs(490). Although the Rrs(665)/Rrs(510) ratio is maximum for only 4 data points over the present dataset, this ratio is more frequently selected as the MBR over the MERIS coastal archive (not shown here). As observed for OC4 [46,47], there is an overlap, over the POC range, in the bands selected for the MBR definition, so there is a smooth transition for MBR around 0.2, which corresponds to POC concentrations between 100 and 500 μg L−1 (Figure 10). Second and third order polynomial regressions, which theoretically allow for a better account of specific spectral features, were also tested. Statistical results obtained for the second-order polynomial are similar to those obtained for the type II linear regression (Figure 9, Table 4) while those for the third polynomial regression do not show any improvements (not shown). Therefore, only the linear (Equation (27)) and second-order polynomial (Equations (28)–(29)) fits based on the maximum band ratio, named CPOC-1st and CPOC-2nd (Coastal POC), will be evaluated in the following section.
POC = 10 0.928 X + 2.875
POC = 10 0.025 X 2 + 0.945 X + 2.873
with
X = l o g 10 [ maximum ( R rs ( 665 ) R rs ( 490 ) , R rs ( 665 ) R rs ( 510 ) , R rs ( 665 ) R rs ( 555 ) ) ]

3.2. Inter-comparison Exercise of Existing Algorithms

The inter-comparison exercise is carried out on DSV (N = 195). Because some algorithms (W16, Le16 and Liu15) require Rrs(λ) at wavelengths available from hyperspectral measurements only, multi-spectral measurements of DSV cannot be used for their evaluation. The W16-1, W16-2, Le16-2, and Liu15 algorithms are therefore tested using 150, 146, and 144 data points, respectively. The number of used hyperspectral data changes based on the availability of the bands required by each algorithm. DSV was however not restricted to hyperspectral data to allow a wide representativeness of this validation dataset in terms of geographical distribution as well as biogeochemical and optical variability. The inter-comparison exercise is realized in two steps. First, the performance of the algorithms was assessed using hyperspectral and multispectral data (when possible) to cover a wide range of variability. Second, the inter-comparison exercise was performed on a consistent number of hyperspectral data (N = 144) to observe if the number of data impacts the ranking of the algorithms’ performance.
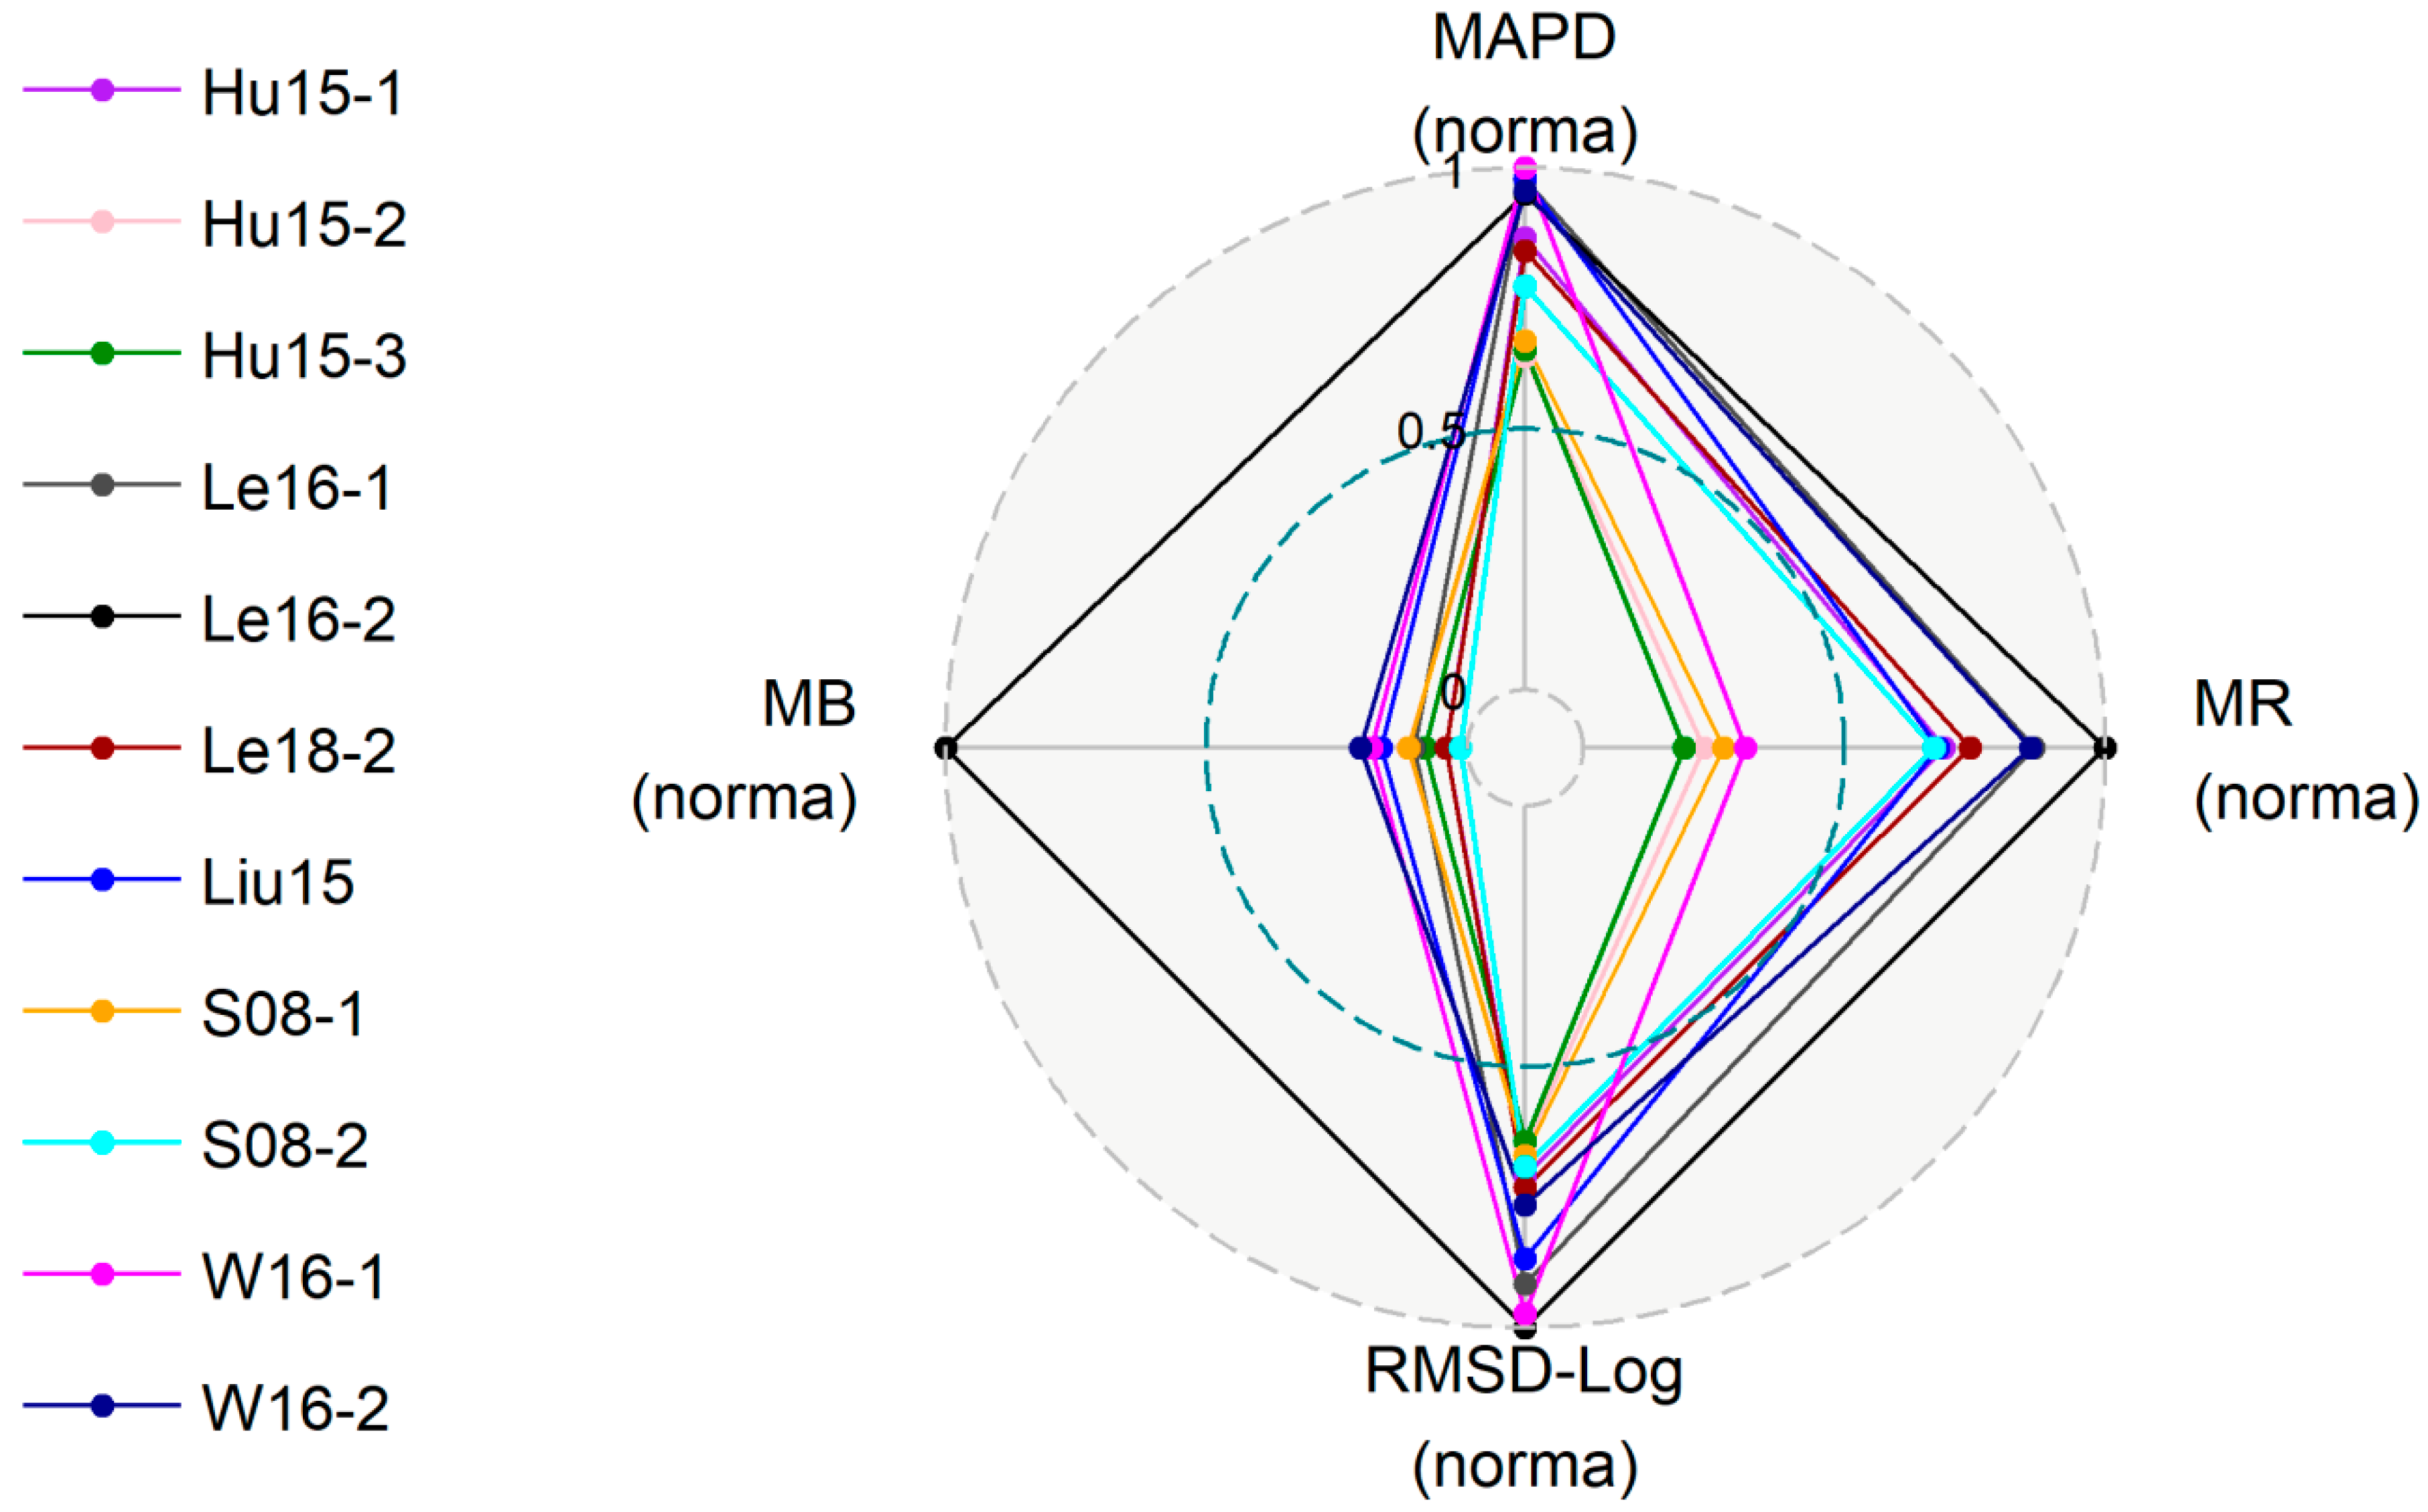
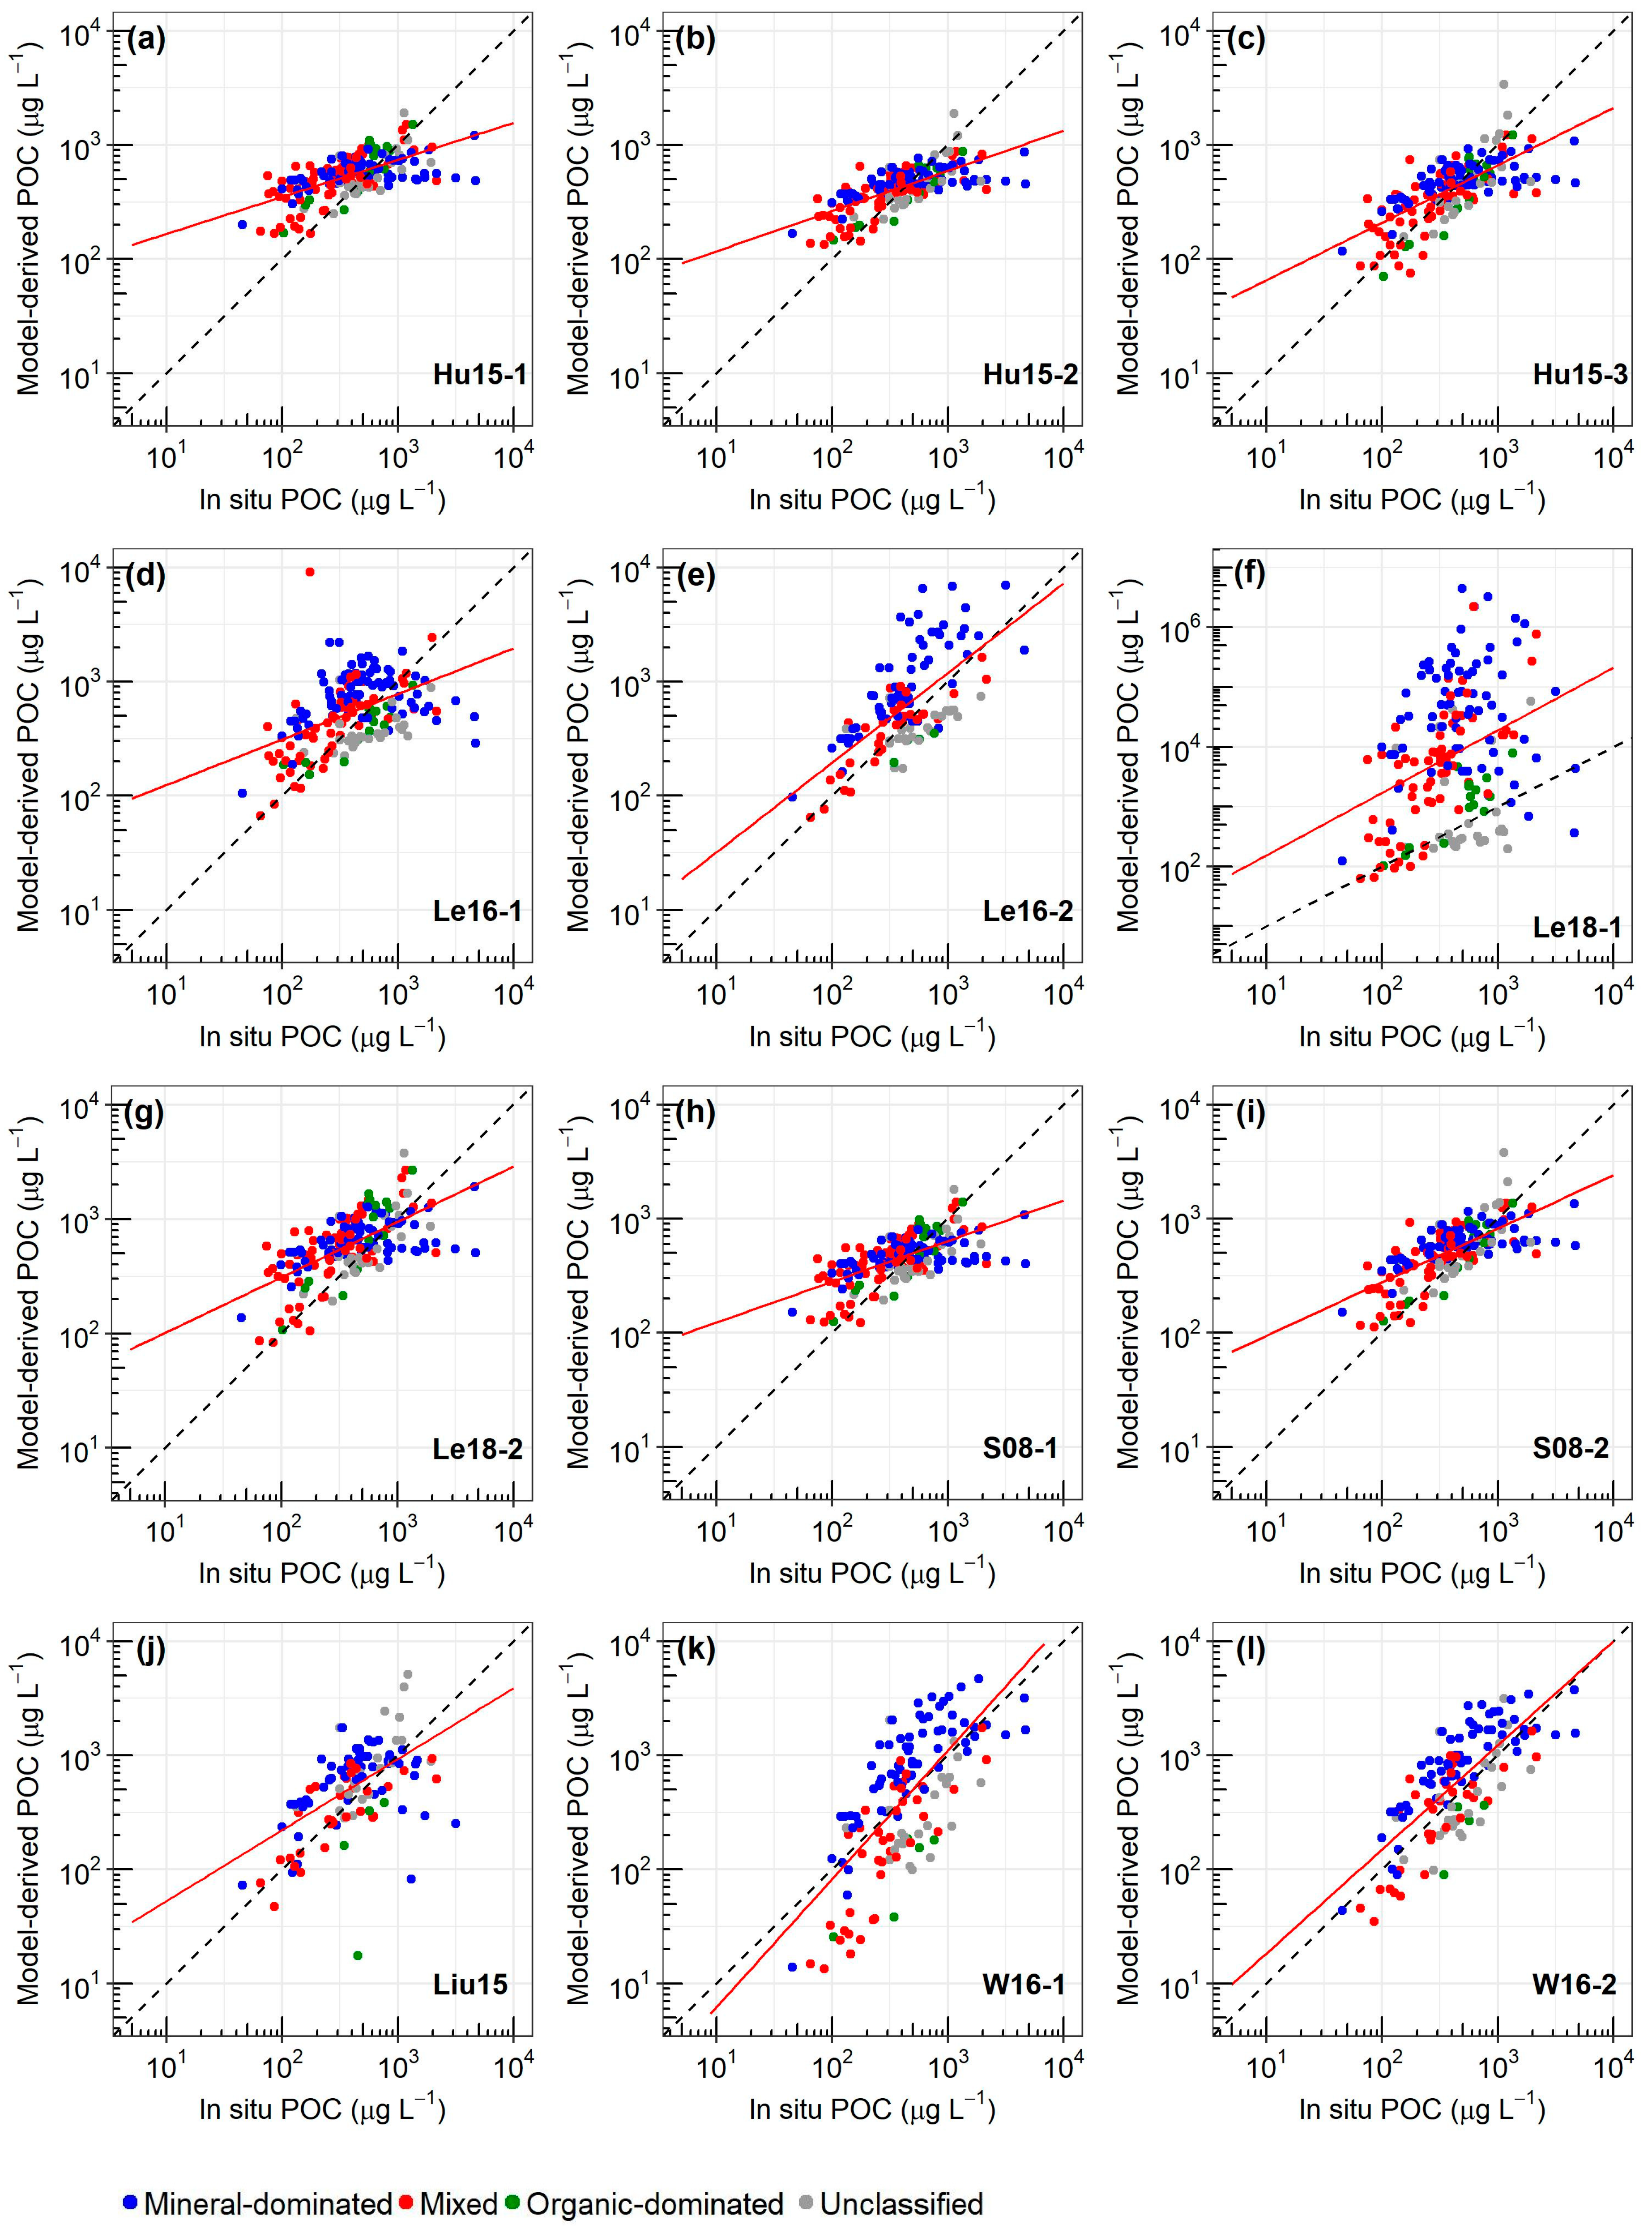
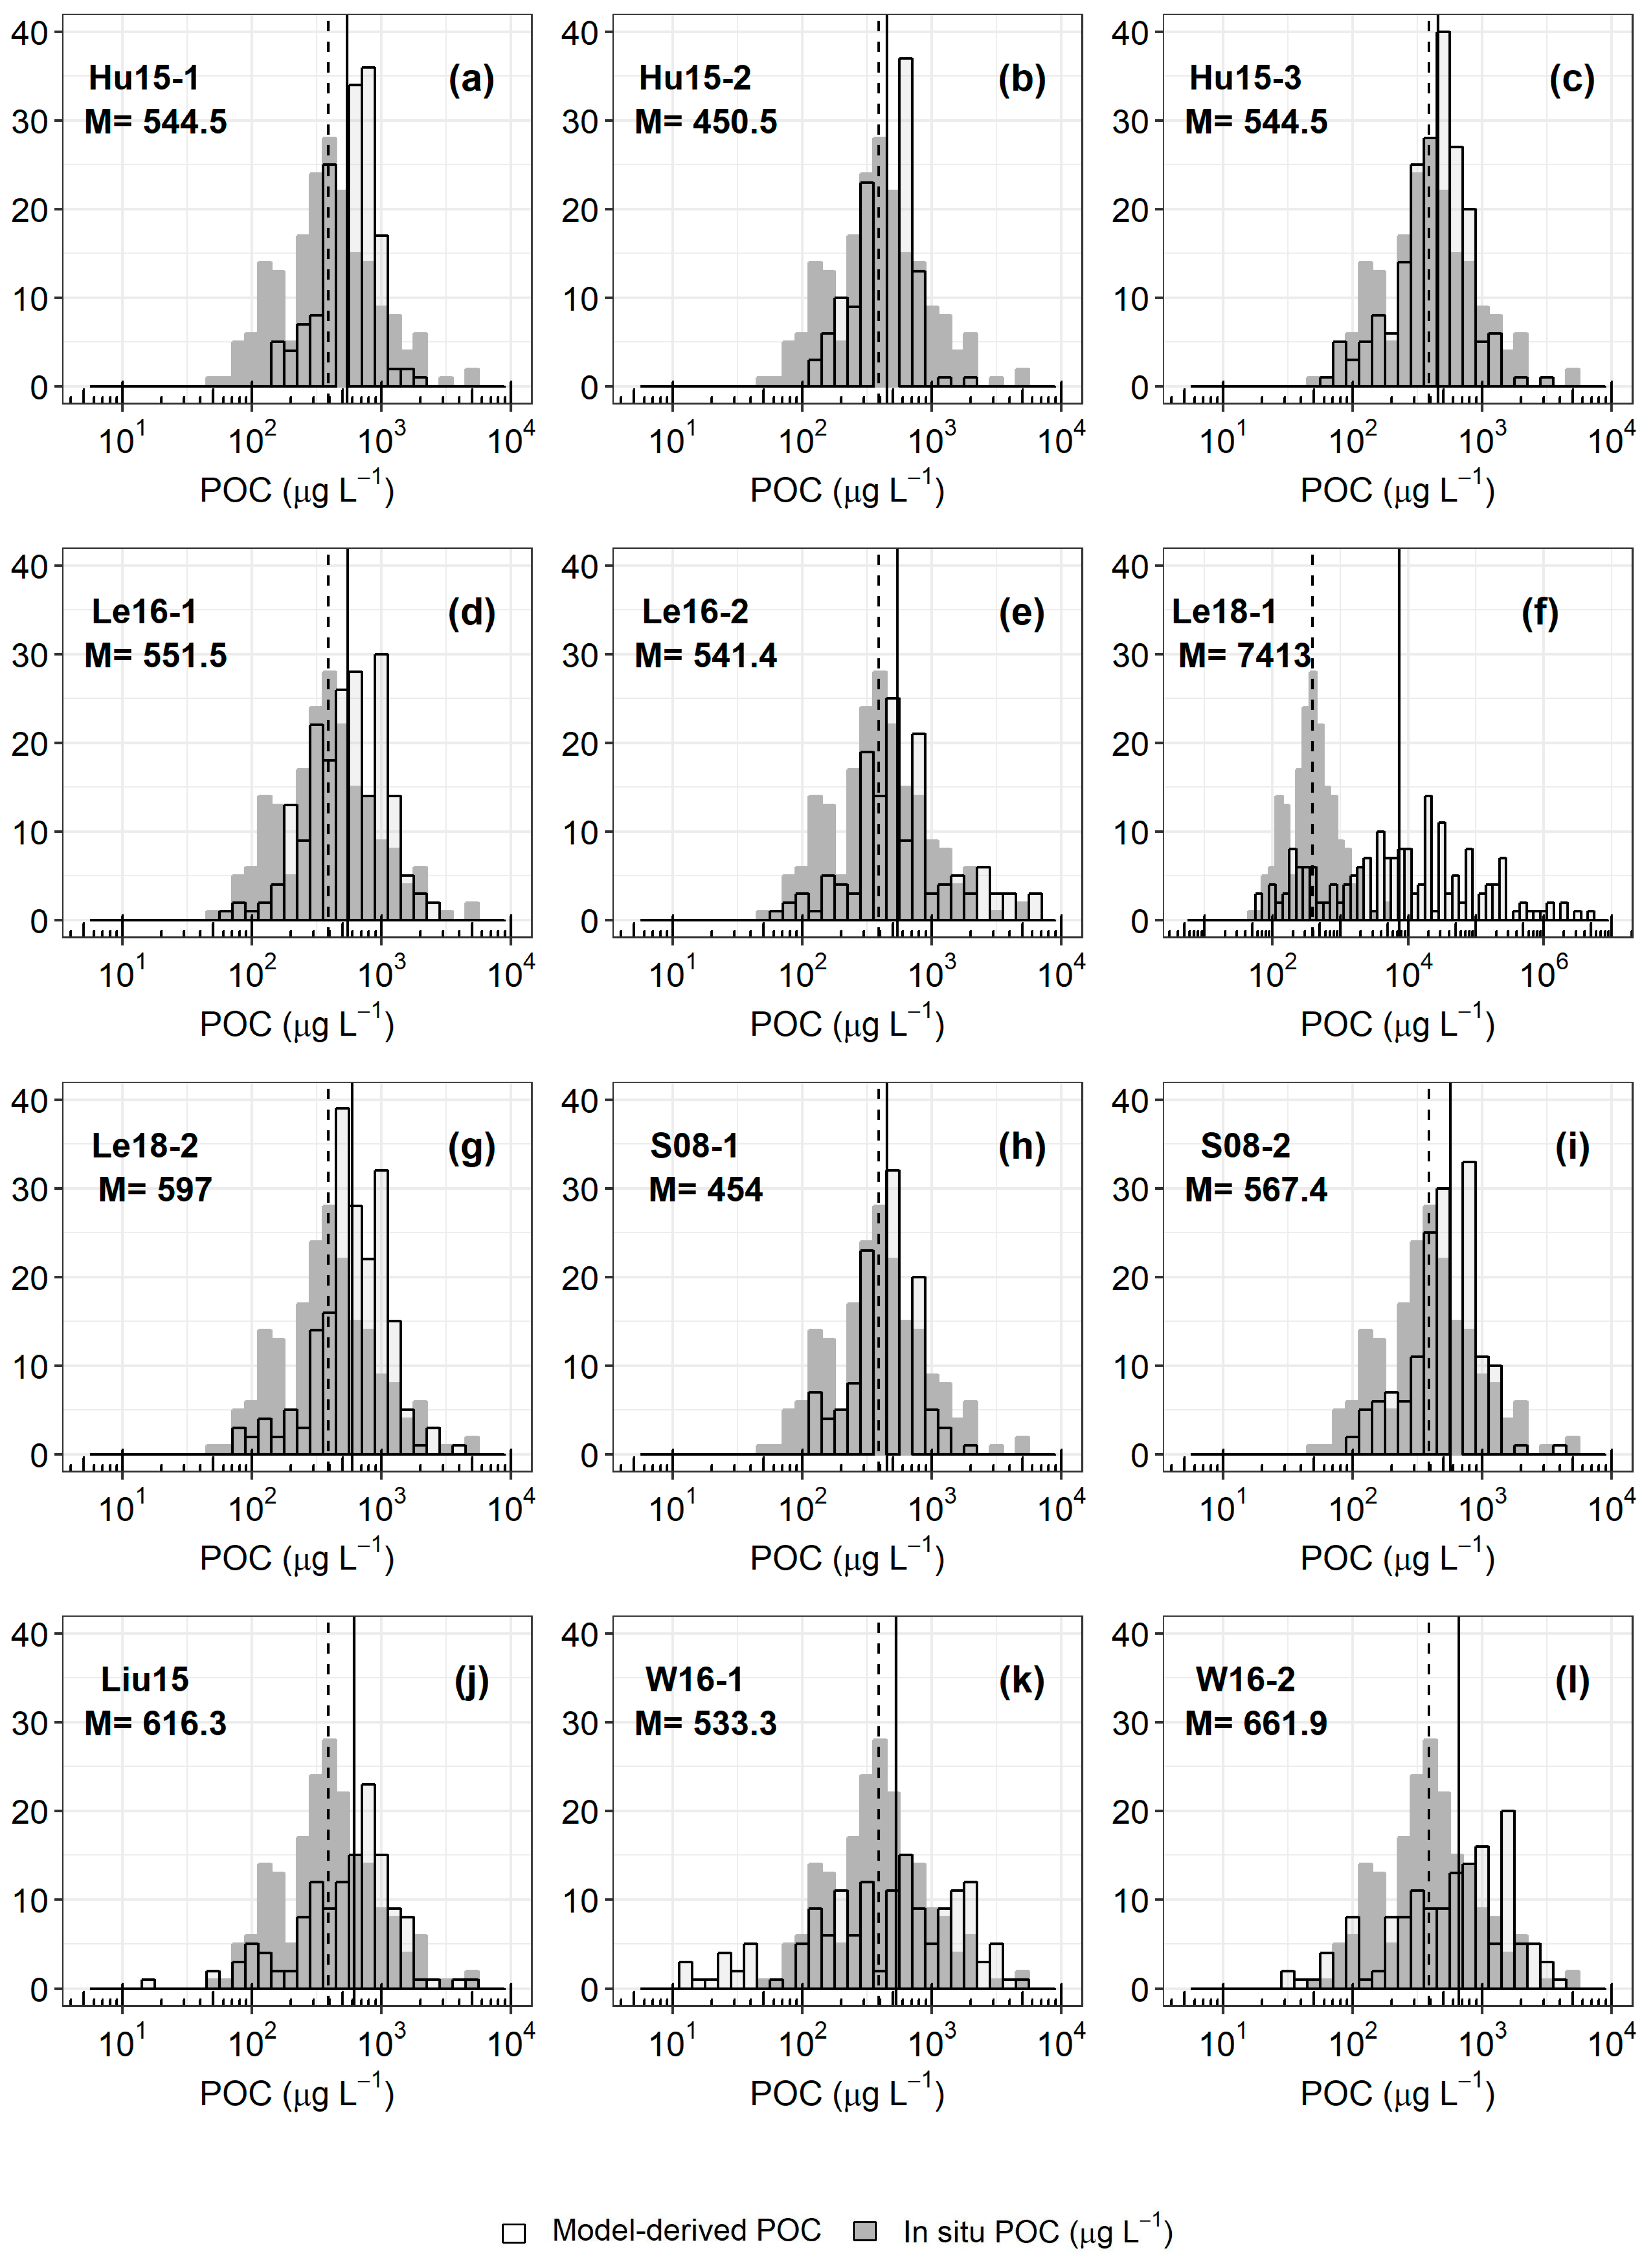
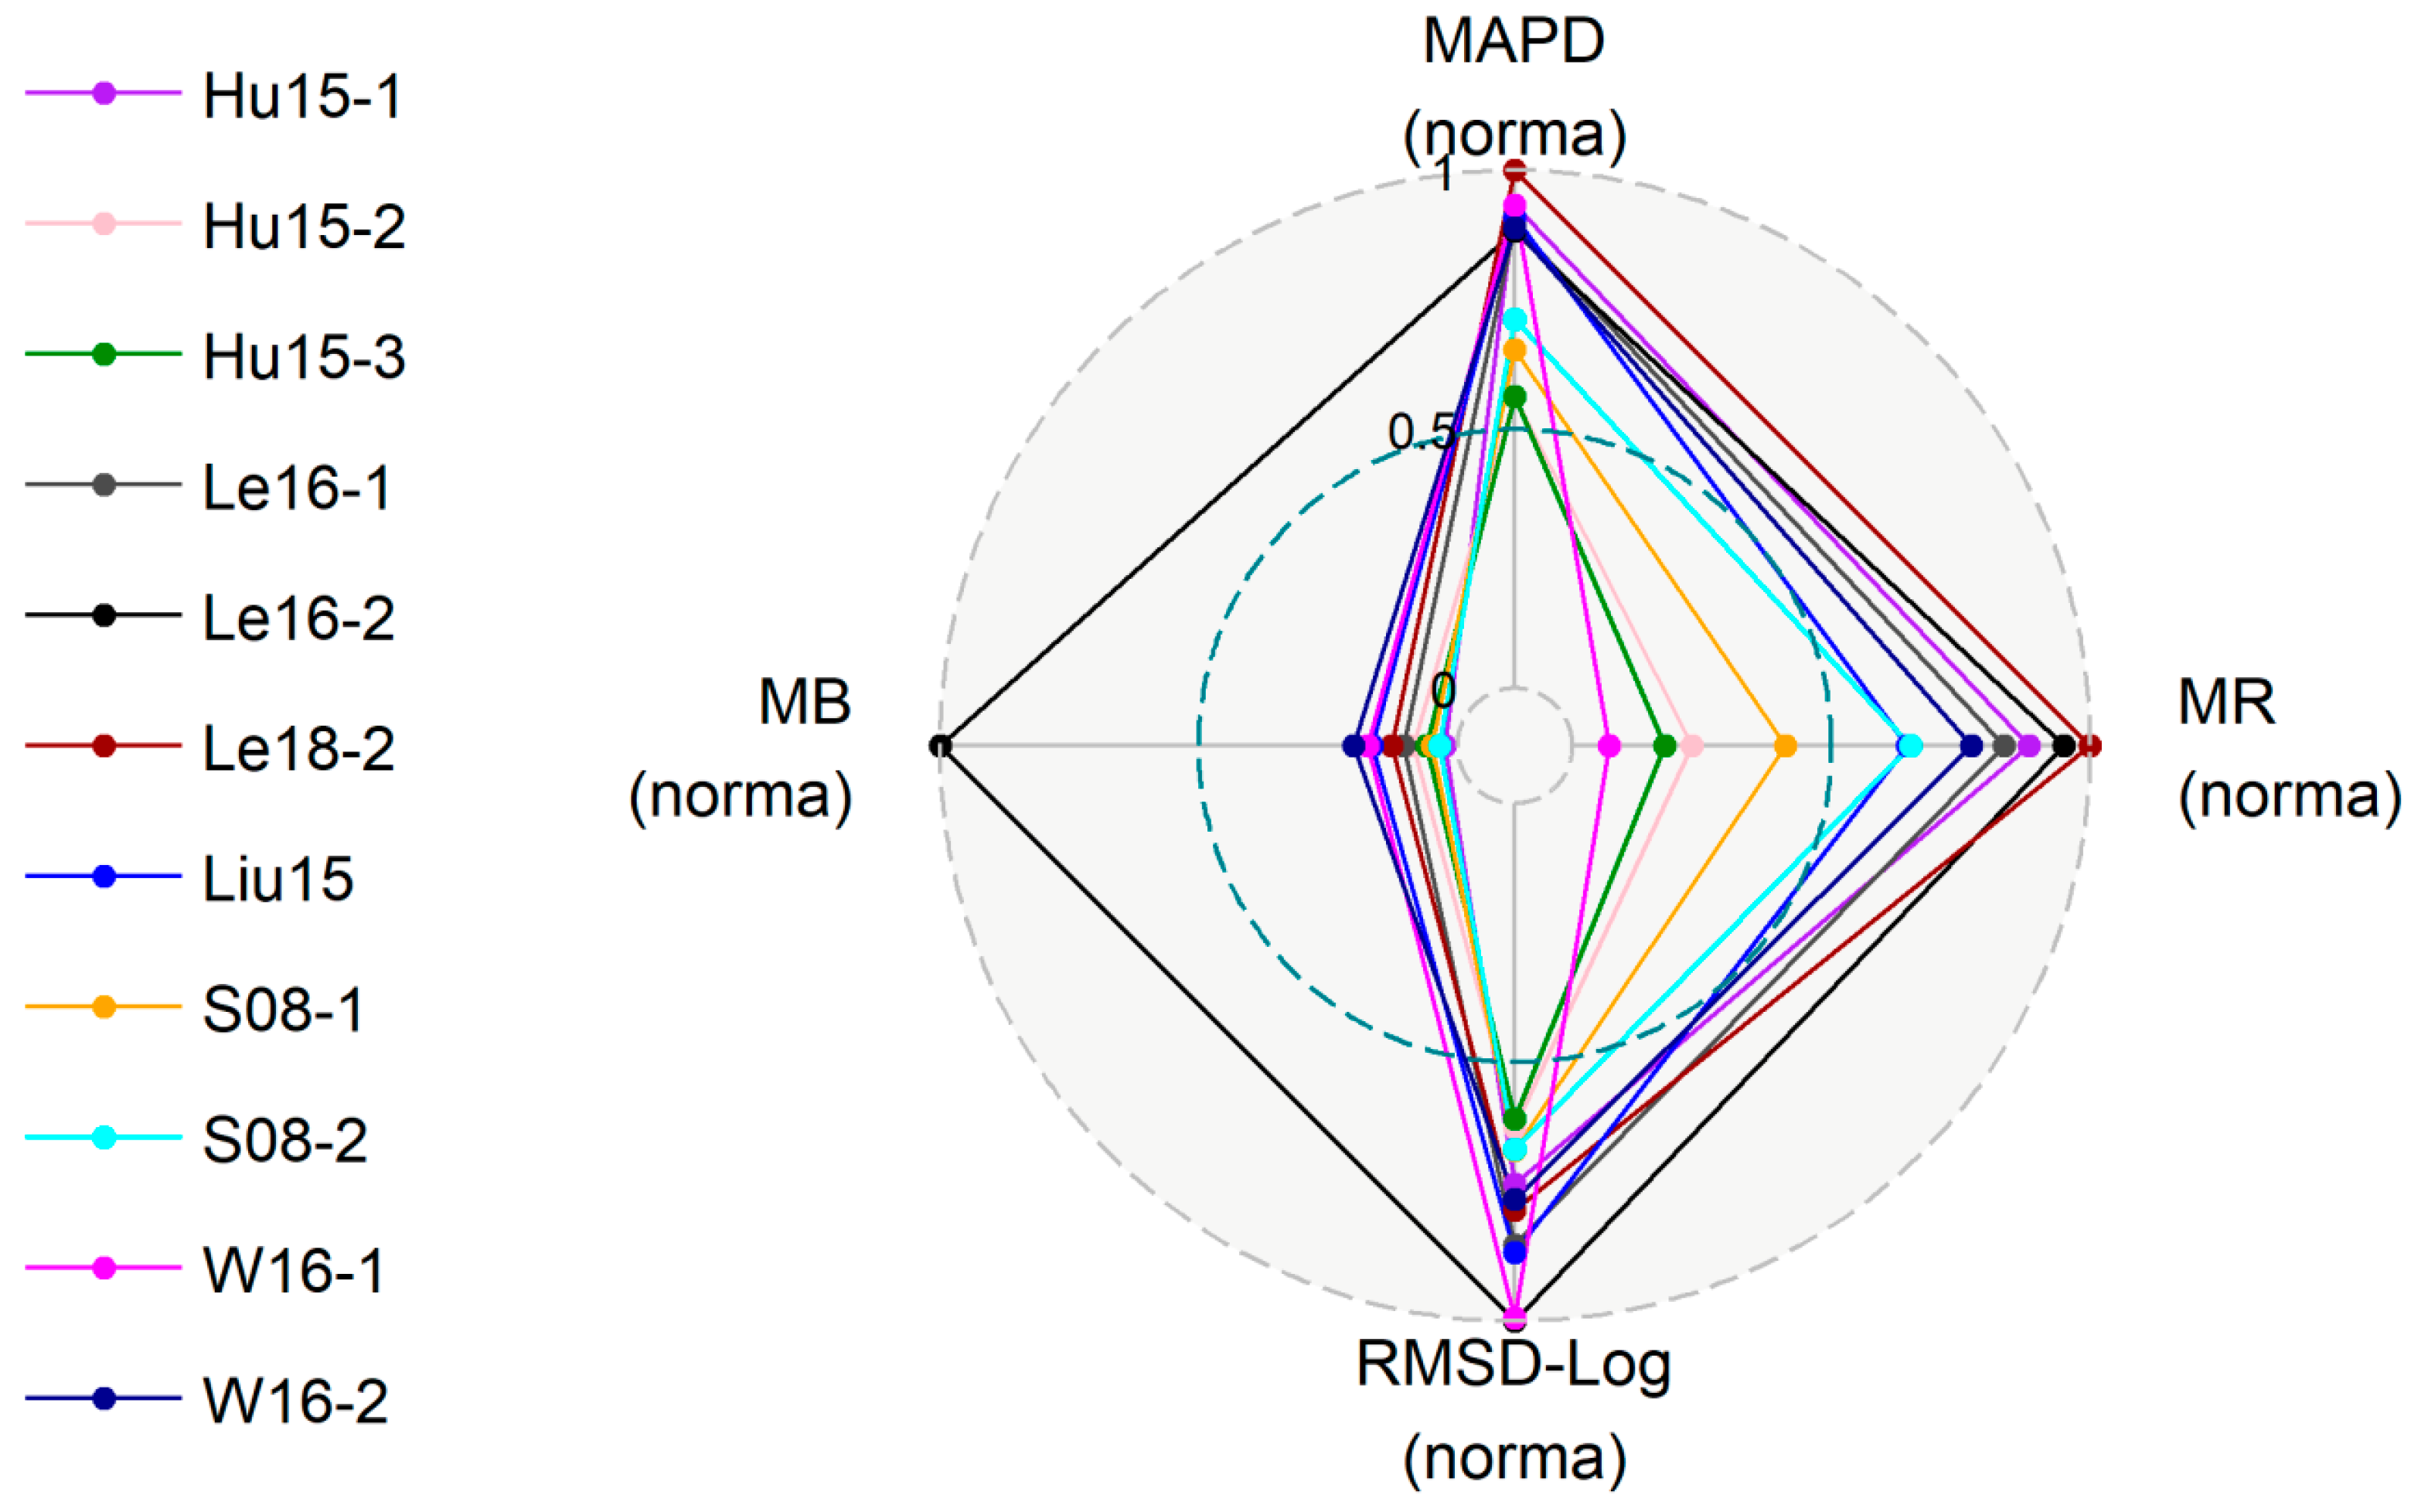
Figure 11 shows POC concentration derived from the different algorithms described in Section 2.3 and Table 3 against in situ POC measurements. Figure 12 compares the histograms of the frequency distribution of in situ and model-derived POC concentrations. Relevant statistical metrics are summarized in Table 5. The Le18-1 algorithm presents the highest MAPD, MB, RMSDlog and MR values, and a much wider POC distribution compared to the in-situ ones (Figure 11f and Figure 12f). For the organic-dominated waters, Le18-1 performs quite well as data points (green dots) are distributed along the 1:1 line. However, for mixed or organic-dominated waters, the variability in POC concentration is not reproduced and modeled POC values can be 100 times higher than in situ ones. In view of these results, this algorithm was excluded from further steps of the inter-comparison exercise. The statistical metrics (Table 5) provide a range of values among the 11 remaining algorithms for which the MAPD values vary between 38.83% and 64.40%, RMSDlog between 0.27 and 0.44, MR between 1.04 and 1.59, and MB between −104.78 and 1237 μg L−1. Note that the Liu15 algorithm generates 10 negative POC values, which were not considered within the log-scale statistics may be leading to an artificial increase in the algorithm performance. The radar plot in Figure 13 gives an overview of the statistical indicators by displaying the normalized MAPD, RMSDlog, MB and MR (Equations (20–23)). The best performance, related to the smallest area in the normalized radar diagram (Figure 13), is obtained for the Hu15-3 algorithm. The Hu15-3 presents the smallest MAPD (38.87%), the smallest RMSDlog (0.27), and an MR close to one (1.11) (Table 5). The Hu15-3 algorithm provides relatively good performance for organic-dominated (green dots close to the 1:1 line in Figure 11c). Data points sampled in mixed waters are scattered but follow the 1:1 line. However, for mineral-dominated waters, the Hu15-3 algorithm tends to underestimate high concentrations (POC > 1000 μg L−1) (Figure 11c and 12c) and overestimates POC concentrations lower than 1000 μg L−1 (blue dots in Figure 11c). This results in the the regression slope between in situ and derived POC being lower than 1 (= 0.5). Similar observations can be made for the Hu15-2 and Hu15-1 algorithms.
The S08-1 and S08-2 algorithms provide accurate estimates at low concentrations for organic-dominated and mixed waters (around 100–200 μg L−1), as it was developed mainly from data collected in open ocean waters. The performances of these algorithms are degraded at high concentrations, and for mineral dominated waters (blue dots in Figure 11h,i). Two Biosope data points in DSV were used previously by Stramski et al. (2008) to establish the S08-1 and S08-2 relationships and may artificially increase the performance of the S08-1 and S08-2. The performances of the S08 algorithms however do not change when removing these Biosope data points. The performance of the L18-2 algorithm is quite similar to the performance of the S08-1, 2 (Figure 11g, Table 5 and Table A1). This was expected as Le18-2, S08-1 and S08-2 are based on a blue-to-green ratio.
Woźniak’s algorithm W16-1 presents the best linear fit with a slope of 1.1. Both W16-1 and W16-2 algorithms overestimate POC concentration in mineral-dominated waters and underestimate POC concentration in organic-dominated and mixed waters (Figure 11k,l). For the W16-2 algorithm, data are less scattered and more accurate estimates of POC are achieved, especially for POC concentrations around 100 mg m−3. This results in MAPD and RMSDlog being 61.32% and 0.337 for W16-2, respectively, against 64.08% and 0.427 for W16-1. The histograms in Figure 12k,l show that the shape of the frequency distribution of POC estimates and in situ data differ. The peak of frequency between 200 and 500 μg L−1 observed for the in-situ data is absent for modeled data.
Concerning the Liu15 algorithm, despite the fact that this algorithm was developed for highly turbid waters, it does not provide better POC retrievals over the mineral-dominated water dataset (Figure 11j and Table 5).
The second step of the inter-comparison exercise, performed on the same number of hyperspectral data (N = 144), does not change the respective statistical results for the different algorithms, and Hu15-3 remains the best algorithm (Appendix A).

3.3. Performance of the New Algorithms

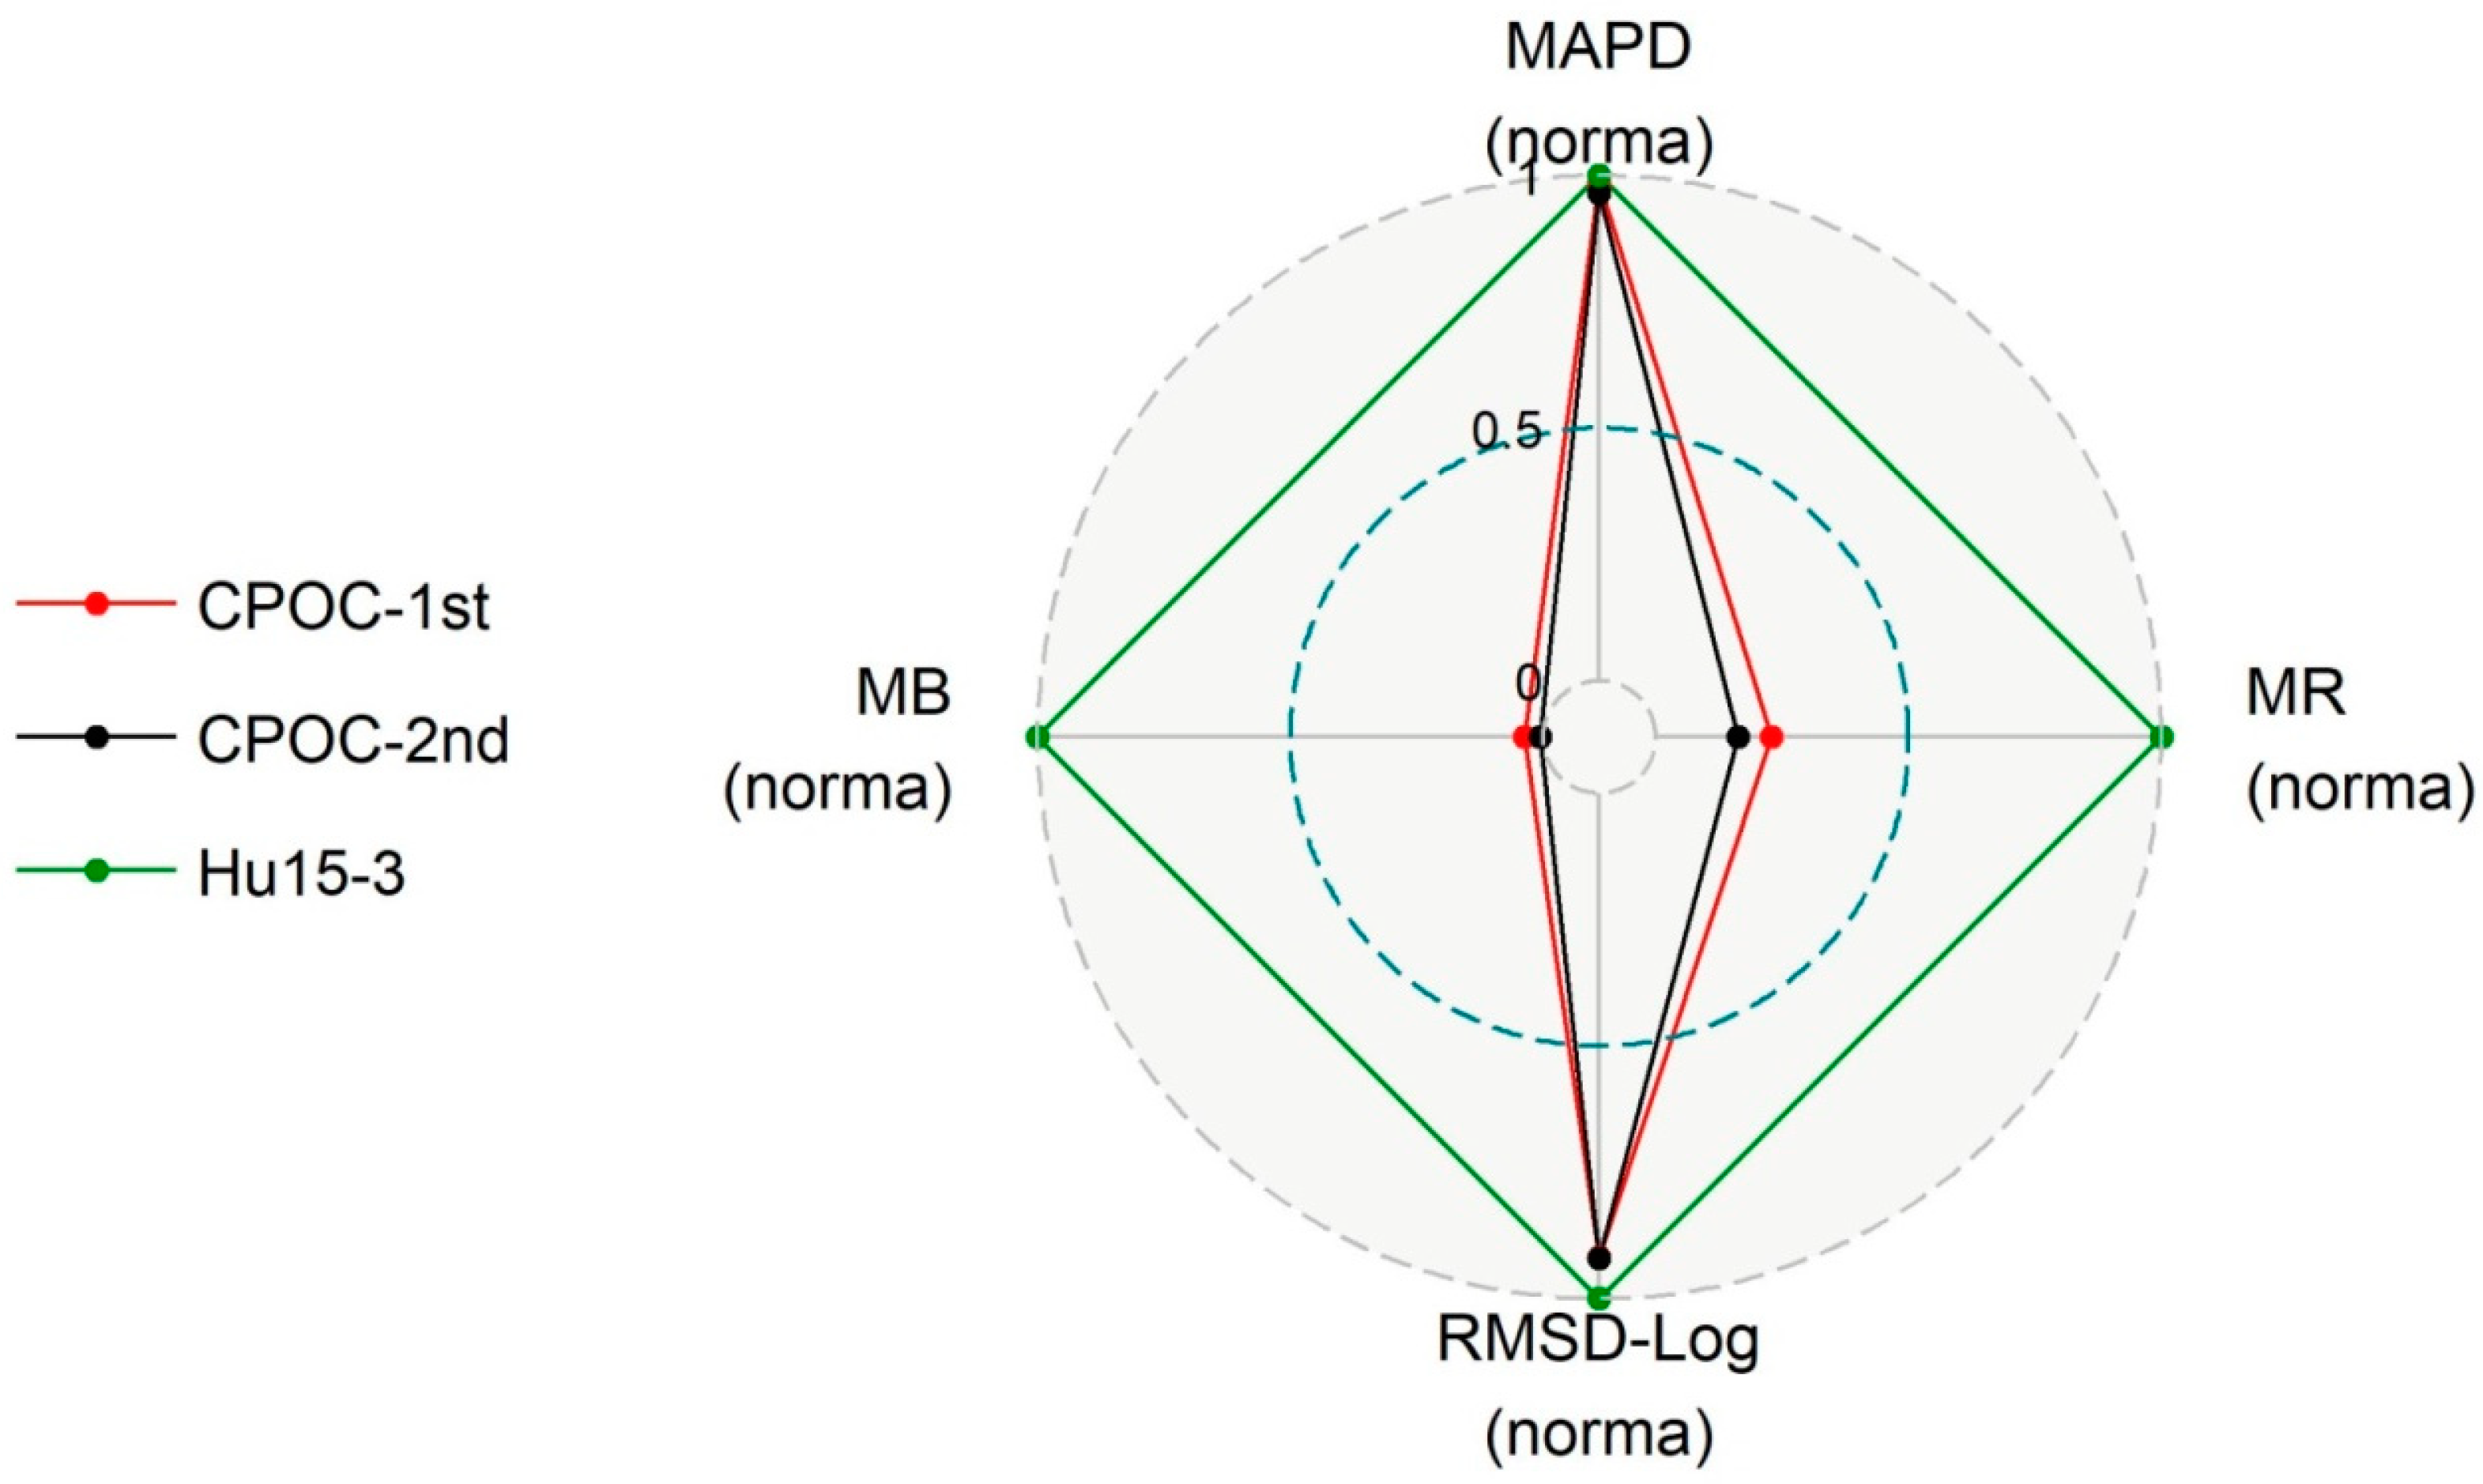
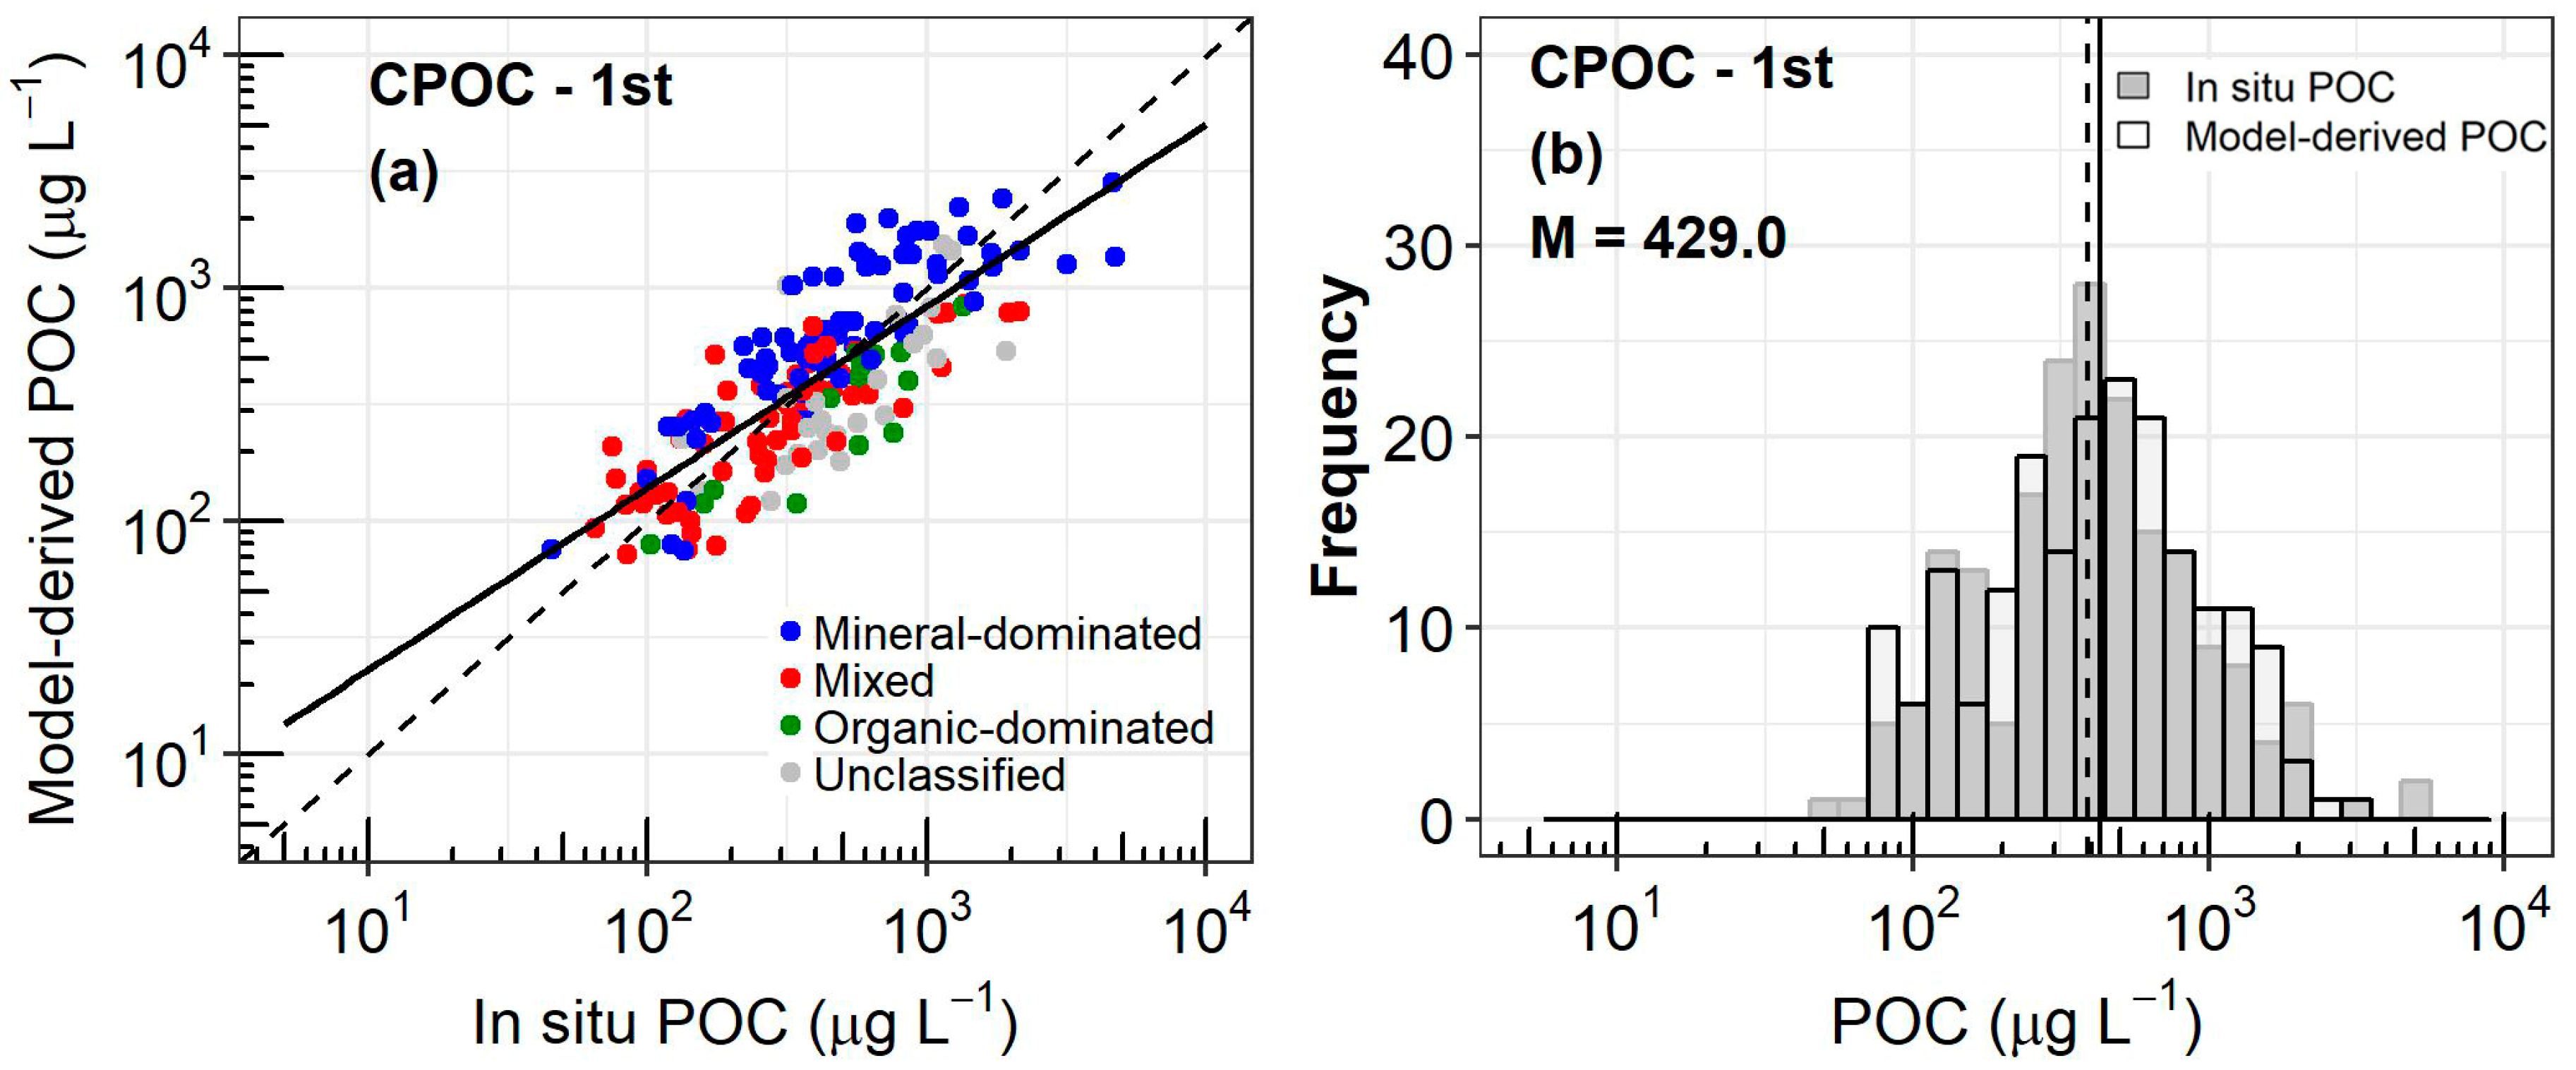
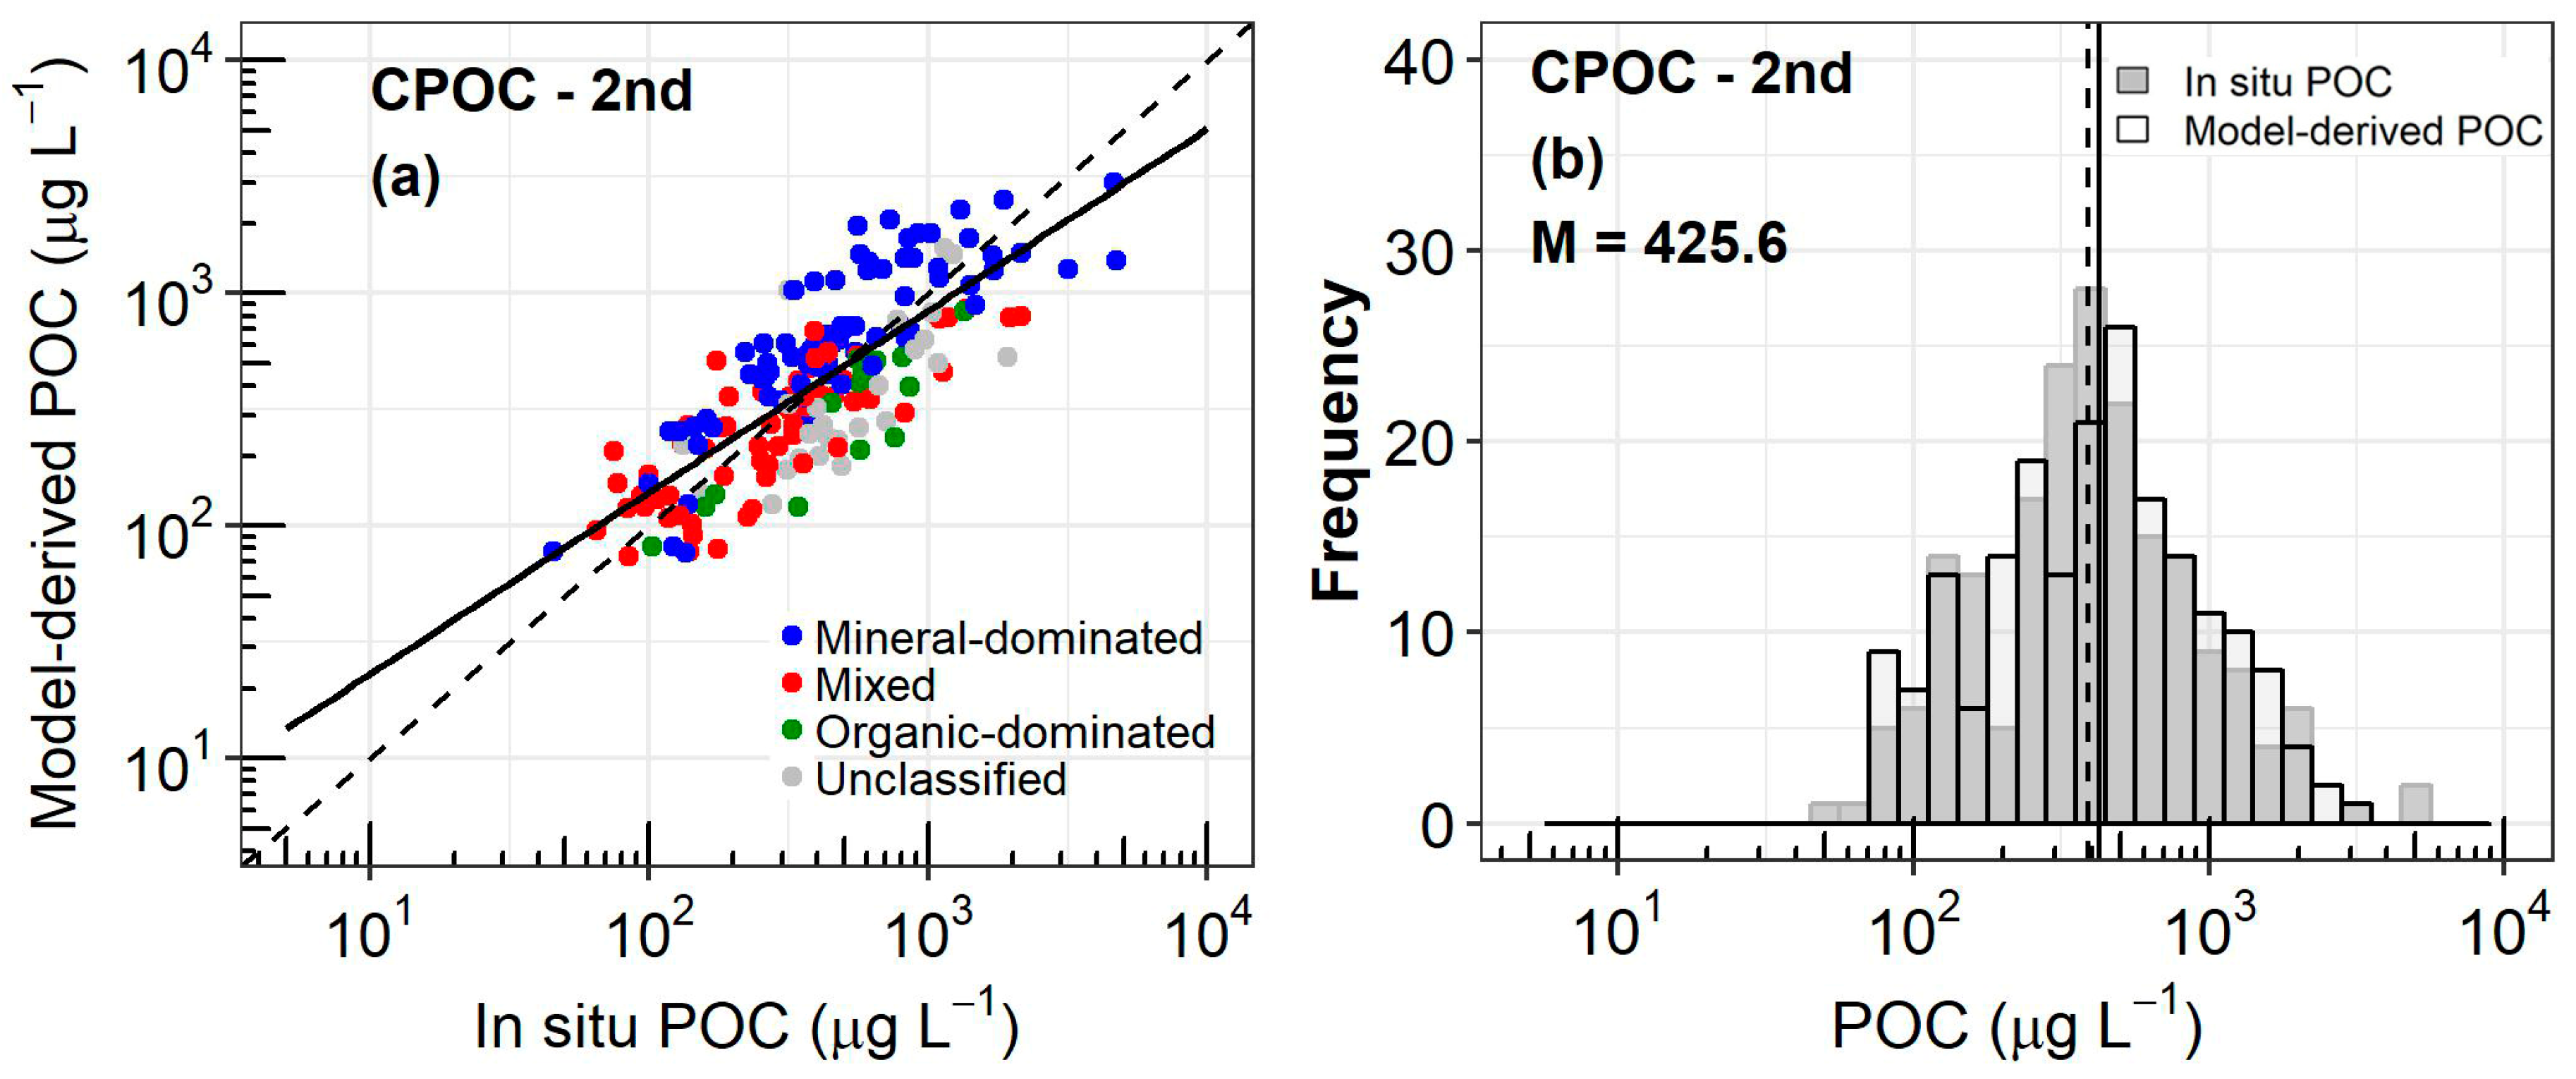
The radar plot in Figure 14 and Table 5 illustrate that the CPOC-1st and CPOC-2nd algorithms improve the overall performance as compared to Hu15-3 algorithm. The second-order polynomial relationship shows the best performance with a smaller MAPD and smaller MB than the Type II linear regression. The MAPD is 37.48%, the RMSDlog is 0.25, MB is = 0.54, MR is equal to 1.02, and the regression slope is around 0.78. Most of the POC values in waters identified as mineral-dominated are overestimated, whereas the POC values in organic-dominated waters are underestimated (Figure 15). We tried to develop a specific second-order polynomial regression according to the type of waters to adjust the POC concentration from Equation (28) according to the POC/SPM ratio with SPM concentration from Han et al., 2016. Results are not shown as it does not improve the accuracy of the estimates. As no specific regional pattern has been noticed on the validation results (not shown), the performance of the algorithm is more related to the chemical nature of the bulk suspended particulate matter, as opposed to any regional aspects. The shape of the POC distribution of model-derived and in situ data are quite similar (Figure 15b and Figure 16b). Nevertheless, the maximum of occurrence is slightly shifted towards higher POC values. This results in the median calculated for modeled data being a bit higher (425 μg L−1 instead of 391 μg L−1), whereas the mean values are equal (=569 μg L−1).
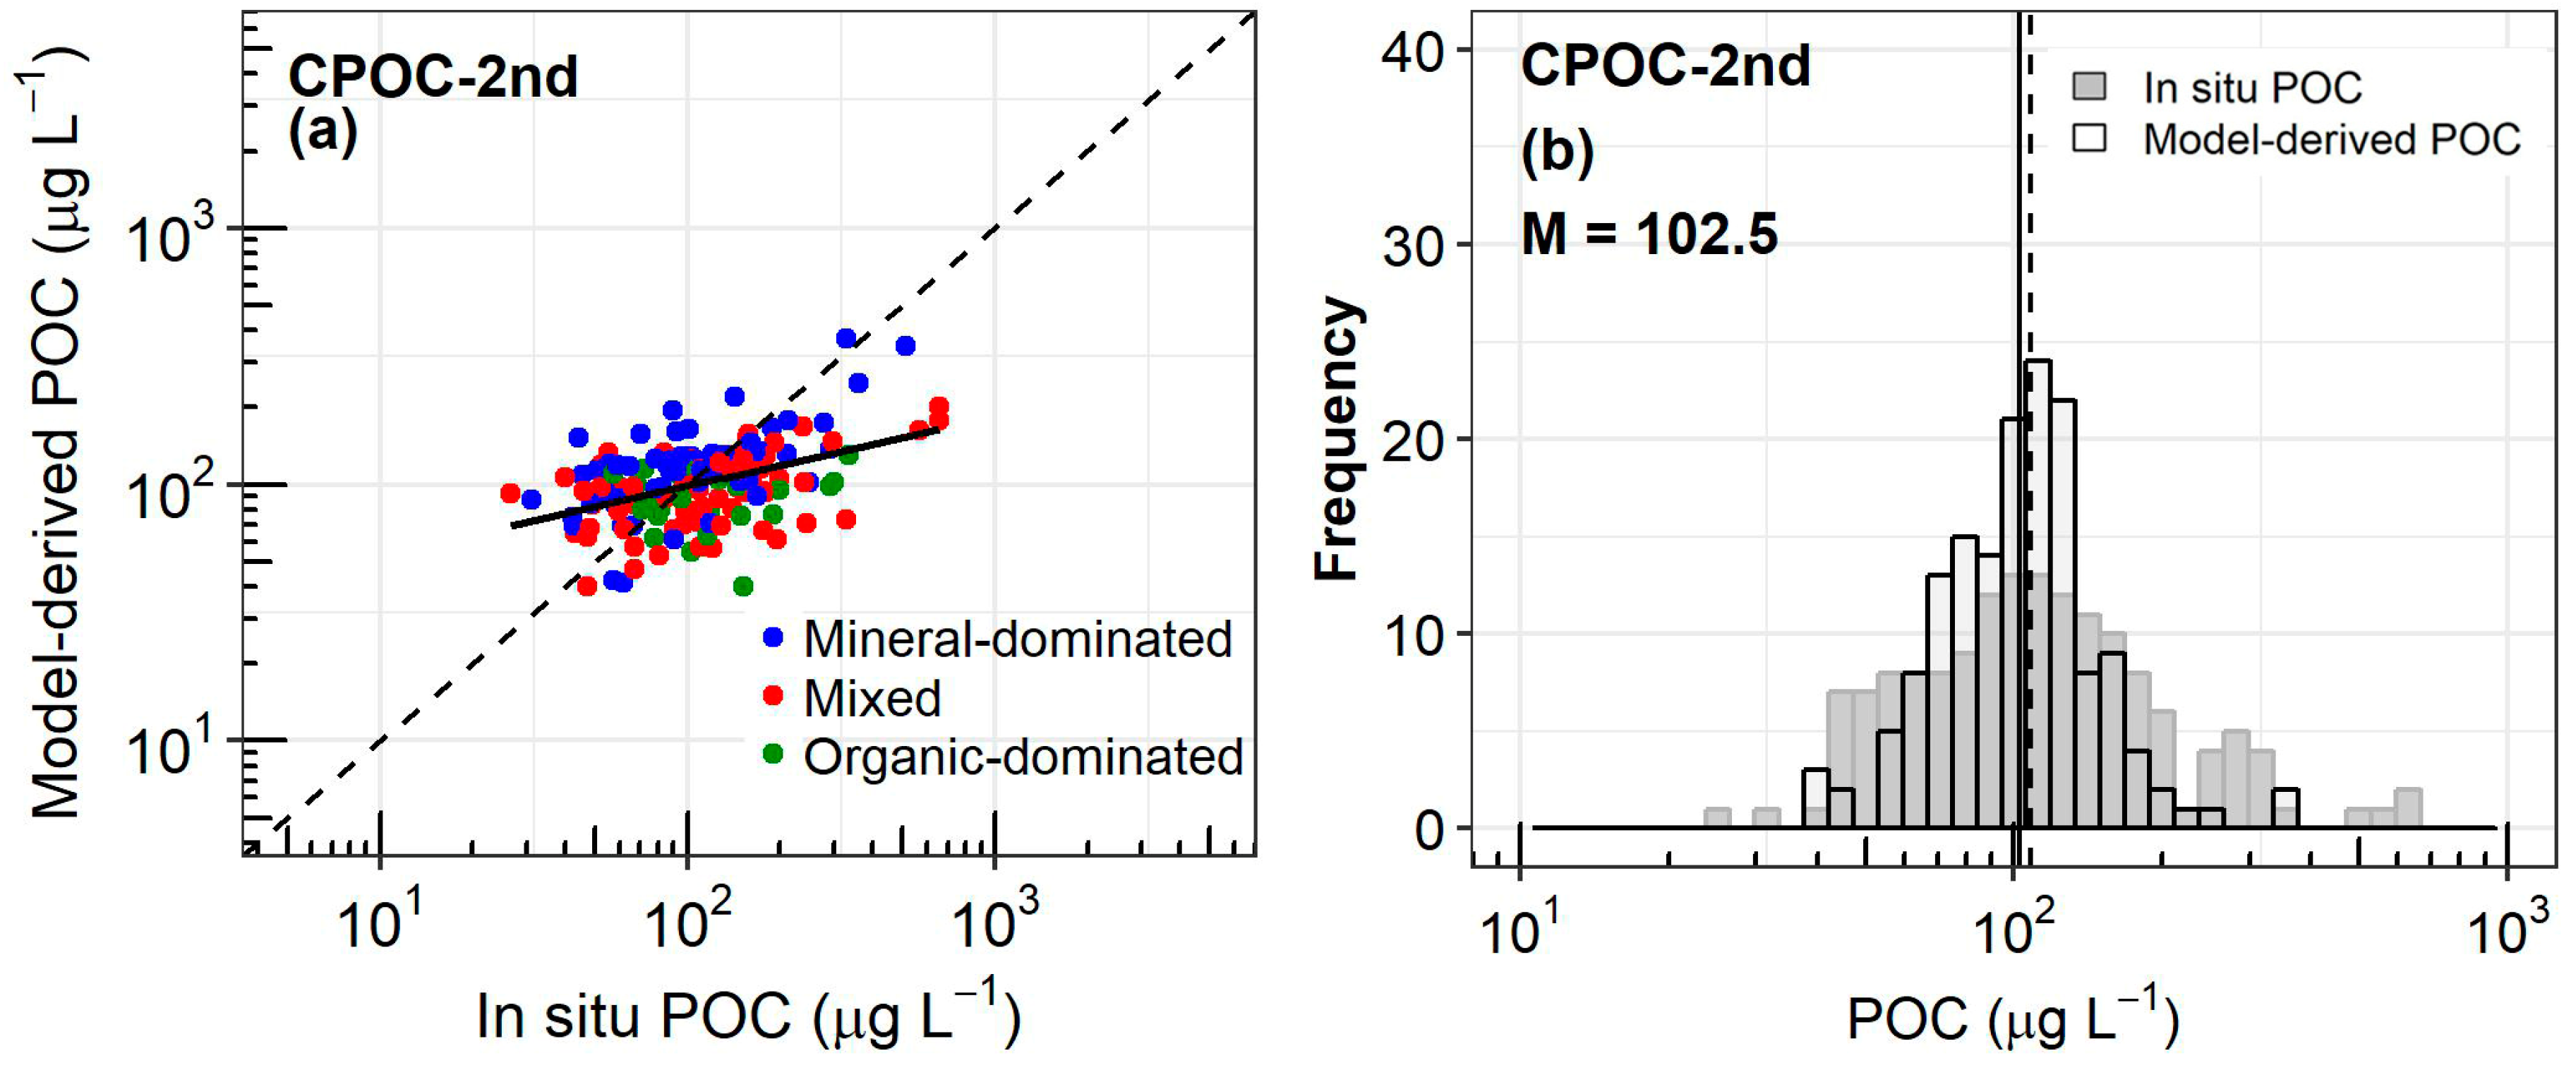
The matchup analysis was conducted by applying CPOC-2nd on the satellite Rrs(λ) measurements gathered in the match-up dataset described in Section 2.2. The matchup analysis shows that the CPOC-2nd algorithm, developed only on Rrs(λ) and POC in situ data, is able to estimate satisfactorily the surface POC concentration from satellite observation over coastal waters. The histograms (Figure 17) show a good agreement between the in situ and estimated maximum values (around 100 μg L−1), as well as between the in situ and estimated median values (102.5 and 108.4 μg L−1), respectively. The MAPD, RMSDlog, MR, and MB values are 34.16%, 0.24, 0.92, and −25.93 μg L−1, respectively [43,48]. Note that overestimations and underestimations of POC values are only observed for two of the eight sampling stations (Banyuls-sur-Mer and Marseille). These differences can be due to uncertainties on in situ POC measurements as well as satellite remote-sensing reflectance (partly due to atmospheric corrections uncertainties). Concerning this latter aspect, we verified the retrieval accuracy of Rrs based on an extensive matchup exercise of 760 coincident data points collected from the AERONET-OC sites (Ocean Color component of the Aerosol Robotic Network). A bias of 3.4 × 10⁻³, 1.5 × 10⁻³, −1.9 × 10⁻⁴ between in situ AERONET and MERIS Rrs(λ) at 490, 555 and 665 has been observed, respectively. Taking into account these bias values for the MERIS Rrs(λ) values over the SOMLIT matchup dataset, we showed that this correction only slightly modifies the POC estimates. Inaccuracies can also be explained by the fact that the range of POC concentration used in this matchup exercise is lower than the range of POC concentration of DSD. For instance, the median POC value for the SOMLIT in situ dataset is 108.4 μg L−1, while it reaches 366.4 for DSD. The fact that the statistical values are better for the match-up data set than for DSV may be partly explained by the fact that the SOMLIT POC data set used for the match-up exercise gathers less mineral dominated waters (38 %) for which a slight over-estimation by CPOC-2nd has been observed, against 50% for DSV.

3.4. Satellite POC Estimates for Coastal Regions

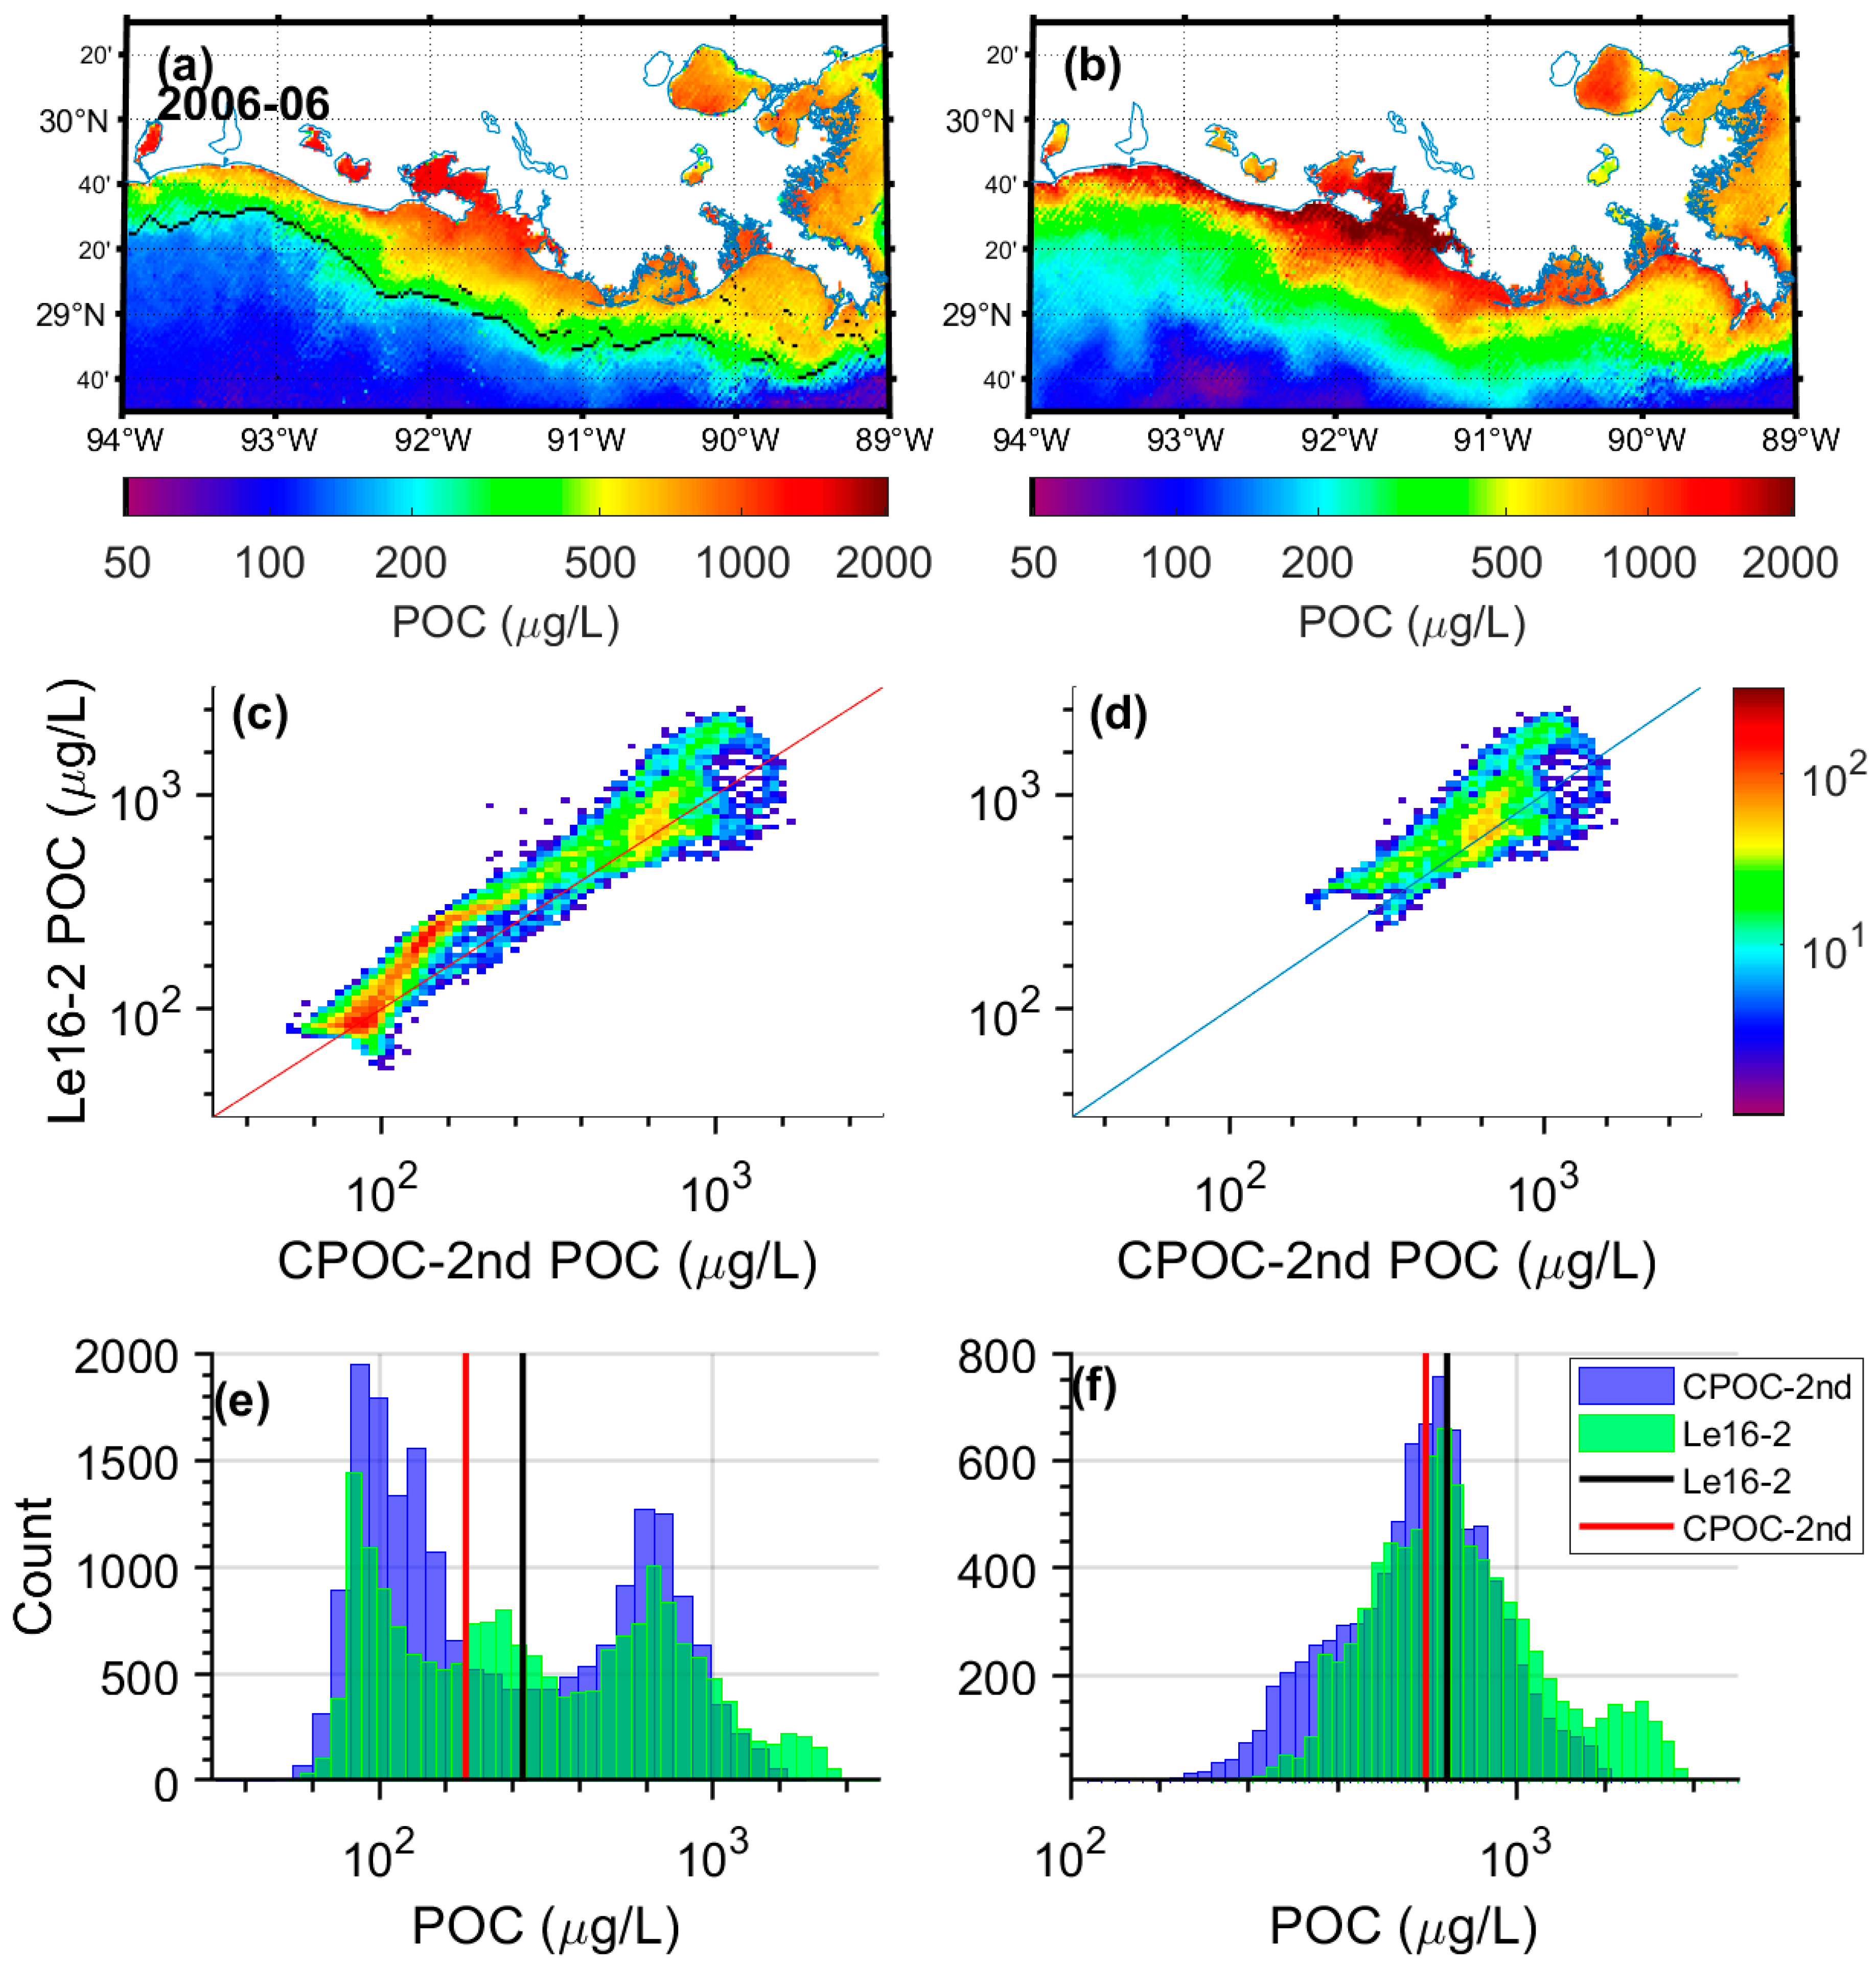
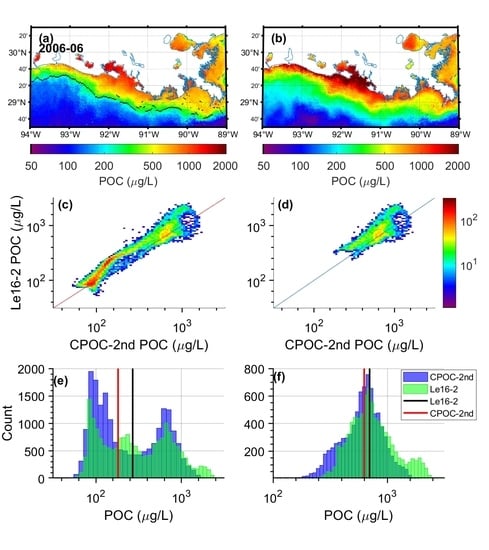
The present algorithm (CPOC-2nd) is applied to MERIS data over the Louisiana Continental Shelf, where the 2016 algorithm of Le et al. has been specifically developed. The MERIS monthly mean POC concentrations (June 2006) are displayed in Figure 18. The POC estimates were derived using the CPOC-2nd algorithm (Figure 18a) and the Le16-2 algorithm (Equation (11)), which is suitable for MERIS data (Figure 18b). The spatial patterns of the POC concentration derived using the CPOC-2nd mimics the spatial distribution observed using the Le16 algorithm. Figure 18a,b shows a strong gradient from the inner to outer shelves, which was observed by Le et al. from in situ measurements. A slight overestimation of POC by CPOC-2nd compared to Le16-2 is observed when all pixels are taken into account (Figure 18c). However, by restricting only the comparison to coastal pixels (as defined by Rrs(665) > 0.0012 [49]) for which the CPOC-2nd has been developed, an excellent agreement between the two POC products is observed (Figure 18d–f). The two histograms are more similar than previously, and the medians are closer: 700.25 μg L−1 for Le16-2 and 627.50 μg L−1 for CPOC-2nd estimates. This pattern shows that part of the discrepancies between the Le16-2 and CPOC-2nd are related to open water situations for which the CPOC-2nd and Le16-2 are not suitable.

4. Concluding Remarks

A variety of POC inversion algorithms based on different approaches were evaluated from an extensive dataset composed of coincident measurements of POC and Rrs(λ), which were sampled in highly contrasting bio-optical coastal environments. While these existing algorithms perform relatively well over POC ranges for which they were developed, they present some lack of accuracy over a broad range of POC concentrations. With the objective of improving POC estimates at the global scale for coastal waters, a new empirical relationship was proposed based on a second-order polynomial regression using the maximum band ratio. The new algorithm (CPOC) shows relevant capacity to estimate POC concentrations on the in-situ validation dataset (MAPD = 37.48%, RMSDlog = 0.25, MB = 0.54 μg L−1, and MR = 1.02). Robust results were found when the algorithm was tested on the matchup dataset as illustrated by the consistency in the median values computed for the modeled POC (102.5 μg L−1) and the in situ POC datasets (108.4 μg L−1). While the use of a spectral band ratio to retrieve POC reduces the impact of atmospheric corrections, the latter continues to have an impact as the accuracy of Rrs retrieval is spectrally dependent [50]. The new algorithm was applied to MERIS data in the Louisiana Continental Shelf in June 2006. The observed spatial and temporal (not shown) patterns were in good agreement with the patterns observed by Le et al. who developed an algorithm specifically for this region in 2006. The algorithm developed in this study performs consistently across the three types of water (mineral-dominated, mixed, and organic-dominated). However, the POC concentration in mineral-dominated waters tends to be overestimated, whereas POC concentration in organic-dominated waters tends to be underestimated. Second-order polynomial regressions specific to the type of waters to adjust the POC concentration according to the POC/SPM ratio were evaluated, but such formulations did not improve the estimates. From these results, several key points of development are highlighted as necessary to the development of greater knowledge pertaining to the composition of the particulate pool.
The use of POC/SPM ratio as a proxy for particulate composition according to the criteria of [39] should be re-examined. The criteria established by [39] to define the type of waters were fixed regarding the spectral shape of the absorption coefficient and the particle size distribution (PSD). This exercise was based on measurements sampled from optically contrasted conditions but in a restricted area (Imperial Beach, San Diego, Tijuana River watershed). It will be interesting to re-examine these criteria on a larger number of observations performed in different coastal regions to ensure their possible generalization at a global scale. However, in many cases, PSD is not available from the optical measurements and measurements of the particulate absorption spectra using benchtop spectrophotometers are not systematically performed. In this framework, the ratio of the particulate backscattering to scattering coefficient (bbp/bp), measured by commercial optical backscattering sensors, such as WetLabs Eco-VSF and ECO-BB, could be a valuable parameter. Indeed, previous studies [37,51,52] have shown that bbp/bp could be an indicator of the amount of organic material relative to mineral particles. It would be interesting to re-conduct these studies on coincident POC, Rrs(λ), SPM, and bbp/bp in situ measurements to define some criteria at the global scale and to better characterize which kind of particles dominate in a defined water mass.

Author Contributions

T.K.T. analyzed the in situ data, test historical algorithms, developed the final algorithms, and wrote the original version of the manuscript. L.D.-G. and H.L. as the major funders proposed the idea of the work gave permission to data in LOG, were deeply involved in the algorithm development, and manuscript organization and co-writing. V.V. gave valuable suggestions and comments and revised the manuscript. X.M., A.C. conducted field missions, processed field bio-geophysical data and were in charge of LOG database management. D.S.F.J. supported the development of the Matlab processed image, gave suggestions and comments. O.F.A. gave valuable suggestions and comments.

Funding

PhD scholarship fellowship was funded by the Université du Littoral Côte d’Opale and Région Hauts-de-France. This work was supported by Centre National d’Etudes Spatiales in the frame of the COYOTE project (CNES/ TOSCA program).

Acknowledgments

The authors would like to thank the Université du Littoral-Côte d’Opale and the Hauts-de-France region for the PhD scholarship fellowship. This study was realized with the support from the French Space Agency (CNES) through the COYOTE project (CNES/TOSCA program). MERIS data were processed in the framework of the GlobCoast project funded by the French Agence Nationale de la Recherche (ANR 2011 BS56018 01). Some of the in situ measurements used in this study were collected from different cruises performed in Vietnam coastal waters, French Guyana, and Eastern English Channel through various projects funded by CNES. The authors are grateful to all the people that contributed to data provided by the Service d’Observation en Milieu Littoral (SOMLIT), INSU-CNRS. We thank also our many colleagues, who participated in the collection of various datasets cited in this study. We thank the PIs of the AERONET sites for their continuous efforts in providing high quality measurements. The authors are grateful to David Dessailly for the help with matchup processing and satellite images.

Conflicts of Interest

The authors declare no conflict of interest about the work presented here.

Appendix A

Table A1. Statistics obtained on the 144 hyperspectral data of DSV with hyperspectral Rrs only. Multispectral data coming from CASES [36], Biosope [37] and Coastlooc [26,27] were removed.
AlgorithmsNMAPDMBRMSDlogRMSDMRR2SlopeInterceptNegative Value
Hu15-114455.44−50.550.31651.01.410.370.281.980
Hu15-214441.01−142.60.29666.91.140.410.311.820
Hu15-314441.77−101.30.28677.61.110.410.441.480
Le16-114462.68126.80.410841.510.140.331.870
Le16-214460.8912370.4447151.590.420.90.460
Le18-114428181,801,7761.8715,865,15329.190.030.682.260
Le18-214453.8950.530.32674.91.440.370.431.630
Liu1513462.71202.80.38749.41.40.280.621.110
CPOC-2nd14444.6222.600.27561.71.180.550.770.640
S08-114442.82−139.50.3665.51.160.370.311.830
S08-214449.5917.340.3675.41.40.410.421.640
W16-114464.08228.80.43859.71.180.451.06−0.150
W16-214461.32252.40.34719.91.510.530.90.390
Figure A1. Comparison of the statistical performance of the eleven algorithms. The algorithms were tested using hyperspectral data only. The number of data (N = 144) is the same for the 11 algorithms (Table 5).
Remotesensing 11 02849 g0a1

References

  1. Ward, N.D.; Bianchi, T.S.; Medeiros, P.M.; Seidel, M.; Richey, J.E.; Keil, R.G.; Sawakuchi, H.O. Where carbon goes when water flows: Carbon cycling across the aquatic continuum. Front. Mar. Sci. 2017, 4. [Google Scholar] [CrossRef]
  2. Keller, D.P.; Lenton, A.; Littleton, E.W.; Oschlies, A.; Scott, V.; Vaughan, N.E. The effects of carbon dioxide removal on the carbon cycle. Curr. Clim. Chang. Rep. 2018, 4, 250–265. [Google Scholar] [CrossRef] [PubMed]
  3. Cole, J.J.; Prairie, Y.T.; Caraco, N.F.; McDowell, W.H.; Tranvik, L.J.; Striegl, R.G.; Duarte, C.M.; Kortelainen, P.; Downing, J.A.; Middelburg, J.J.; et al. Plumbing the global carbon cycle: Integrating inland waters into the terrestrial carbon budget. Ecosystems 2007, 10, 172–185. [Google Scholar] [CrossRef]
  4. Tranvik, L.J.; Downing, J.A.; Cotner, J.B.; Loiselle, S.A.; Striegl, R.G.; Ballatore, T.J.; Dillon, P.; Finlay, K.; Fortino, K.; Knoll, L.B.; et al. Lakes and reservoirs as regulators of carbon cycling and climate. Limnol. Oceanogr. 2009, 54, 2298–2314. [Google Scholar] [CrossRef]
  5. Raymond, P.A.; Hartmann, J.; Lauerwald, R.; Sobek, S.; McDonald, C.; Hoover, M.; Butman, D.; Striegl, R.; Mayorga, E.; Humborg, C.; et al. Global carbon dioxide emissions from inland waters. Nature 2013, 503, 355–359. [Google Scholar] [CrossRef]
  6. Bauer, J.E.; Cai, W.J.; Raymond, P.A.; Bianchi, T.S.; Hopkinson, C.S.; Regnier, P.A. The changing carbon cycle of the coastal ocean. Nature 2013, 504, 61–70. [Google Scholar] [CrossRef]
  7. Stramski, D.; Reynolds, R.A.; Kahru, M.; Mitchell, B.G. Estimation of particulate organic carbon in the ocean from satellite remote sensing. Science 1999, 285, 239–242. [Google Scholar] [CrossRef]
  8. Loisel, H.; Nicolas, J.-M.; Deschamps, P.-Y.; Frouin, R. Seasonal and inter-annual variability of particulate organic matter in the global ocean. Geophys. Res. Lett. 2002, 29, 49:1–49:4. [Google Scholar] [CrossRef]
  9. Mishonov, A.V.; Gardner, W.D.; Jo Richardson, M. Remote sensing and surface POC concentration in the south atlantic. Deep Sea Res. Part II Top. Stud. Oceanogr. 2003, 50, 2997–3015. [Google Scholar] [CrossRef]
  10. Gardner, W.D.; Mishonov, A.V.; Richardson, M.J. Global poc concentrations from in-situ and satellite data. Deep Sea Res. Part II Top. Stud. Oceanogr. 2006, 53, 718–740. [Google Scholar] [CrossRef]
  11. Stramski, D.; Reynolds, R.A.; Babin, M.; Kaczmarek, S.; Lewis, M.R.; Rottgers, R.; Sciandra, A.; Stramska, M.; Twardowski, M.S.; Franz, B.A.; et al. Relationships between the surface concentration of particulate organic carbon and optical properties in the eastern south pacific and eastern atlantic oceans. Biogeosciences 2008, 5, 171–201. [Google Scholar] [CrossRef]
  12. Stramska, M. Particulate organic carbon in the global ocean derived from seawifs ocean color. Deep Sea Res. Part I Oceanogr. Res. Pap. 2009, 56, 1459–1470. [Google Scholar] [CrossRef]
  13. Pabi, S.; Arrigo, K.R. Satellite estimation of marine particulate organic carbon in waters dominated by different phytoplankton taxa. J. Geophys. Res. 2006, 111. [Google Scholar] [CrossRef]
  14. Son, Y.B.; Gardner, W.D.; Mishonov, A.V.; Richardson, M.J. Multispectral remote-sensing algorithms for particulate organic carbon (poc): The gulf of mexico. Remote Sens. Environ. 2009, 113, 50–61. [Google Scholar] [CrossRef]
  15. Duforêt-Gaurier, L.; Loisel, H.; Dessailly, D.; Nordkvist, K.; Alvain, S. Estimates of particulate organic carbon over the euphotic depth from in situ measurements. Application to satellite data over the global ocean. Deep Sea Res. Part I Oceanogr. Res. Pap. 2010, 57, 351–367. [Google Scholar] [CrossRef]
  16. Świrgoń, M.; Stramska, M. Comparison of in situ and satellite ocean color determinations of particulate organic carbon concentration in the global ocean. Oceanologia 2015, 57, 25–31. [Google Scholar] [CrossRef]
  17. Evers-King, H.; Martinez-Vicente, V.; Brewin, R.J.W.; Dall’Olmo, G.; Hickman, A.E.; Jackson, T.; Kostadinov, T.S.; Krasemann, H.; Loisel, H.; Röttgers, R.; et al. Validation and intercomparison of ocean color algorithms for estimating particulate organic carbon in the oceans. Front. Mar. Sci. 2017, 4. [Google Scholar] [CrossRef]
  18. Loisel, H.; Vantrepotte, V.; Jamet, C.; Ngoc Dat, D. Challenges and New Advances in Ocean Color Remote Sensing of Coastal Waters; INTECH: London, UK, 2013. [Google Scholar]
  19. Liu, D.; Pan, D.; Bai, Y.; He, X.; Wang, D.; Wei, J.-A.; Zhang, L. Remote sensing observation of particulate organic carbon in the pearl river estuary. Remote Sens. 2015, 7, 8683–8704. [Google Scholar] [CrossRef]
  20. Hu, S.B.; Cao, W.X.; Wang, G.F.; Xu, Z.T.; Lin, J.F.; Zhao, W.J.; Yang, Y.Z.; Zhou, W.; Sun, Z.H.; Yao, L.J. Comparison of meris, modis, seawifs-derived particulate organic carbon, andin situmeasurements in the south china sea. Int. J. Remote Sens. 2016, 37, 1585–1600. [Google Scholar] [CrossRef]
  21. Woźniak, S.B.; Darecki, M.; Zabłocka, M.; Burska, D.; Dera, J. New simple statistical formulas for estimating surface concentrations of suspended particulate matter (spm) and particulate organic carbon (poc) from remote-sensing reflectance in the southern baltic sea. Oceanologia 2016, 58, 161–175. [Google Scholar] [CrossRef]
  22. Le, C.; Zhou, X.; Hu, C.; Lee, Z.; Li, L.; Stramski, D. A color-index-based empirical algorithm for determining particulate organic carbon concentration in the ocean from satellite observations. J. Geophys. Res. Ocean. 2018, 123, 7407–7419. [Google Scholar] [CrossRef]
  23. Le, C.; Lehrter, J.C.; Hu, C.; MacIntyre, H.; Beck, M.W. Satellite observation of particulate organic carbon dynamics on the louisiana continental shelf. J. Geophys. Res. Ocean. 2016, 122, 555–569. [Google Scholar] [CrossRef] [PubMed]
  24. Babin, M.; Morel, A.; Fournier-Sicre, V.; Fell, F.; Stramski, D. Light scattering properties of marine particles in coastal and open ocean waters as related to the particle mass concentration. Limnol. Oceanogr. 2003, 48, 843–859. [Google Scholar] [CrossRef]
  25. Babin, M.; Stramski, D.; Ferrari, G.M.; Claustre, H.; Bricaud, A.; Obolensky, G.; Hoepffner, N. Variations in the light absorption coefficients of phytoplankton, nonalgal particles, and dissolved organic matter in coastal waters around europe. J. Geophys. Res. 2003, 108. [Google Scholar] [CrossRef]
  26. Lubac, B.; Loisel, H.; Guiselin, N.; Astoreca, R.; Felipe Artigas, L.; Mériaux, X. Hyperspectral and multispectral ocean color inversions to detectphaeocystis globosablooms in coastal waters. J. Geophys. Res. 2008, 113. [Google Scholar] [CrossRef]
  27. Lubac, B.; Loisel, H. Variability and classification of remote sensing reflectance spectra in the eastern english channel and southern north sea. Remote Sens. Environ. 2007, 110, 45–58. [Google Scholar] [CrossRef]
  28. Novoa, S.; Doxaran, D.; Ody, A.; Vanhellemont, Q.; Lafon, V.; Lubac, B.; Gernez, P. Atmospheric corrections and multi-conditional algorithm for multi-sensor remote sensing of suspended particulate matter in low-to-high turbidity levels coastal waters. Remote Sens. 2017, 9, 61. [Google Scholar] [CrossRef]
  29. Neukermans, G.; Loisel, H.; Me’riaux, X.; Astoreca, R.; McKee, D. In situ variability of mass-specific beam attenuation and backscattering of marine particles with respect to particle size, density, and composition. Limnol. Oceanogr. 2012, 57, 124–144. [Google Scholar] [CrossRef]
  30. Vantrepotte, V.; Danhiez, F.P.; Loisel, H.; Ouillon, S.; Meriaux, X.; Cauvin, A.; Dessailly, D. Cdom-doc relationship in contrasted coastal waters: Implication for doc retrieval from ocean color remote sensing observation. Opt. Express 2015, 23, 33–54. [Google Scholar] [CrossRef]
  31. Loisel, H.; Mangin, A.; Vantrepotte, V.; Dessailly, D.; Dinh, D.N.; Garnesson, P.; Ouillon, S.; Lefebvre, J.-P.; Mériaux, X.; Phan, T.M. Variability of suspended particulate matter concentration in coastal waters under the mekong’s influence from ocean color (meris) remote sensing over the last decade. Remote Sens. Environ. 2014, 150, 218–230. [Google Scholar] [CrossRef]
  32. Loisel, H.; Vantrepotte, V.; Ouillon, S.; Ngoc, D.D.; Herrmann, M.; Tran, V.; Mériaux, X.; Dessailly, D.; Jamet, C.; Duhaut, T.; et al. Assessment and analysis of the chlorophyll- a concentration variability over the vietnamese coastal waters from the meris ocean color sensor (2002–2012). Remote Sens. Environ. 2017, 190, 217–232. [Google Scholar] [CrossRef]
  33. Claustre, H.; Sciandra, A.; Vaulot, D. Introduction to the special section bio-optical and biogeochemical conditions in the south east pacific in late 2004: The biosope program. Biogeosciences 2008, 5, 679–691. [Google Scholar] [CrossRef] [Green Version]
  34. Bélanger, S.; Babin, M.; Larouche, P. An empirical ocean color algorithm for estimating the contribution of chromophoric dissolved organic matter to total light absorption in optically complex waters. J. Geophys. Res. 2008, 113. [Google Scholar] [CrossRef] [Green Version]
  35. Leblanc, K.; Cornet, V.; Rimmelin-Maury, P.; Grosso, O.; Hélias-Nunige, S.; Brunet, C.; Claustre, H.; Ras, J.; Leblond, N.; Quéguiner, B. Silicon cycle in the tropical south pacific: Contribution to the global si cycle and evidence for an active pico-sized siliceous plankton. Biogeosciences 2018, 15, 5595–5620. [Google Scholar] [CrossRef] [Green Version]
  36. Han, B.; Loisel, H.; Vantrepotte, V.; Mériaux, X.; Bryère, P.; Ouillon, S.; Dessailly, D.; Xing, Q.; Zhu, J. Development of a semi-analytical algorithm for the retrieval of suspended particulate matter from remote sensing over clear to very turbid waters. Remote Sens. 2016, 8, 211. [Google Scholar] [CrossRef] [Green Version]
  37. Loisel, H.; Meriaux, X.; Berthon, J.-F.o.; Poteau, A. Investigation of the optical backscattering to scattering ratio of marine particles in relation to their biogeochemical composition in the eastern english channel and southern north sea. Limnol. Oceanogr. 2007, 52, 739–752. [Google Scholar] [CrossRef]
  38. Stavn, R.H.; Richter, S.J. Biogeo-optics: Particle optical properties and the partitioning of the spectral scattering coefficient of ocean waters. Appl. Opt. 2008, 47, 2660–2679. [Google Scholar] [CrossRef] [Green Version]
  39. Woźniak, S.B.; Stramski, D.; Stramska, M.; Reynolds, R.A.; Wright, V.M.; Miksic, E.Y.; Cichocka, M.; Cieplak, A.M. Optical variability of seawater in relation to particle concentration, composition, and size distribution in the nearshore marine environment at imperial beach, california. J. Geophys. Res. 2010, 115. [Google Scholar] [CrossRef] [Green Version]
  40. Vantrepotte, V.; Loisel, H.; Dessailly, D.; Mériaux, X. Optical classification of contrasted coastal waters. Remote Sens. Environ. 2012, 123, 306–323. [Google Scholar] [CrossRef]
  41. Steinmetz, F.; Deschamps, P.-Y.; Ramon, D. Atmospheric correction in presence of sun glint: Application to meris. Opt. Express 2011, 19, 9783–9800. [Google Scholar] [CrossRef]
  42. Vincent, V.; David, D.; François, S.; Didier, R.; Bing, H.; Xavier, M.; Sylvain, O.; Arand, C.; Cedric, J. Suspended particulate matter variability of the global coastal waters over the MERIS time period. In Proceedings of the Ocean Optics XXIII, Victoria, BC, Canada, 23–28 October 2016. [Google Scholar]
  43. Loisel, H.; Stramski, D.; Dessailly, D.; Jamet, C.; Li, L.; Reynolds, R.A. An inverse model for estimating the optical absorption and backscattering coefficients of seawater from remote-sensing reflectance over a broad range of oceanic and coastal marine environments. J. Geophys. Res. Ocean. 2018, 123, 2141–2171. [Google Scholar] [CrossRef]
  44. Gower, J.F.R.; Doerffer, R.; Borstad, G.A. Interpretation of the 685nm peak in water-leaving radiance spectra in terms of fluorescence, absorption and scattering, and its observation by meris. Int. J. Remote Sens. 2010, 20, 1771–1786. [Google Scholar] [CrossRef]
  45. Xing, X.-G.; Zhao, D.-Z.; Liu, Y.-G.; Yang, J.-H.; Xiu, P.; Wang, L. An overview of remote sensing of chlorophyll fluorescence. Ocean Sci. J. 2007, 42, 49–59. [Google Scholar] [CrossRef] [Green Version]
  46. O’Reilly, J.E.; Maritorena, S.; Mitchell, B.G.; Siegel, D.A.; Carder, K.L.; Garver, S.A.; Kahru, M.; McClain, C. Ocean color chlorophyll algorithms for seawifs. J. Geophys. Res. Ocean. 1998, 103, 24937–24953. [Google Scholar] [CrossRef] [Green Version]
  47. O’Reilly, J.E.; Maritorena, S.e.; O’Brien, M.C.; Siegel, D.A.; Toole, D.; Menzies, D.; Smith, R.C. Seawifs Postlaunch Calibration and Validation Analyses, part 3. NASA Tech. Memo 2000, 206892, 3–8. [Google Scholar]
  48. Seegers, B.N.; Stumpf, R.P.; Schaeffer, B.A.; Loftin, K.A.; Werdell, P.J. Performance metrics for the assessment of satellite data products: An ocean color case study. Opt. Express 2018, 26, 7404–7422. [Google Scholar] [CrossRef] [Green Version]
  49. Robinson, W.; Franz, B.; Patt, F.; Bailey, S.; Werdell, J. Masks and flags updates. NASA Tech. Memo.-Seawifs Postlaunch Tech. Rep. Ser. 2003, 22, 34–40. [Google Scholar]
  50. Jamet, C.; Loisel, H.; Kuchinke, C.P.; Ruddick, K.; Zibordi, G.; Feng, H. Comparison of three seawifs atmospheric correction algorithms for turbid waters using aeronet-oc measurements. Remote Sens. Environ. 2011, 115, 1955–1965. [Google Scholar] [CrossRef]
  51. Twardowski, M.S.; Boss, E.; Macdonald, J.B.; Pegau, W.S.; Barnard, A.H.; Zaneveld, J.R.V. A model for estimating bulk refractive index from the optical backscattering ratio and the implications for understanding particle composition in case i and case ii waters. J. Geophys. Res. Ocean. 2001, 106, 14129–14142. [Google Scholar] [CrossRef] [Green Version]
  52. Duforêt-Gaurier, L.; Dessailly, D.; Moutier, W.; Loisel, H. Assessing the impact of a two-layered spherical geometry of phytoplankton cells on the bulk backscattering ratio of marine particulate matter. Appl. Sci. 2018, 8, 2689. [Google Scholar] [CrossRef] [Green Version]
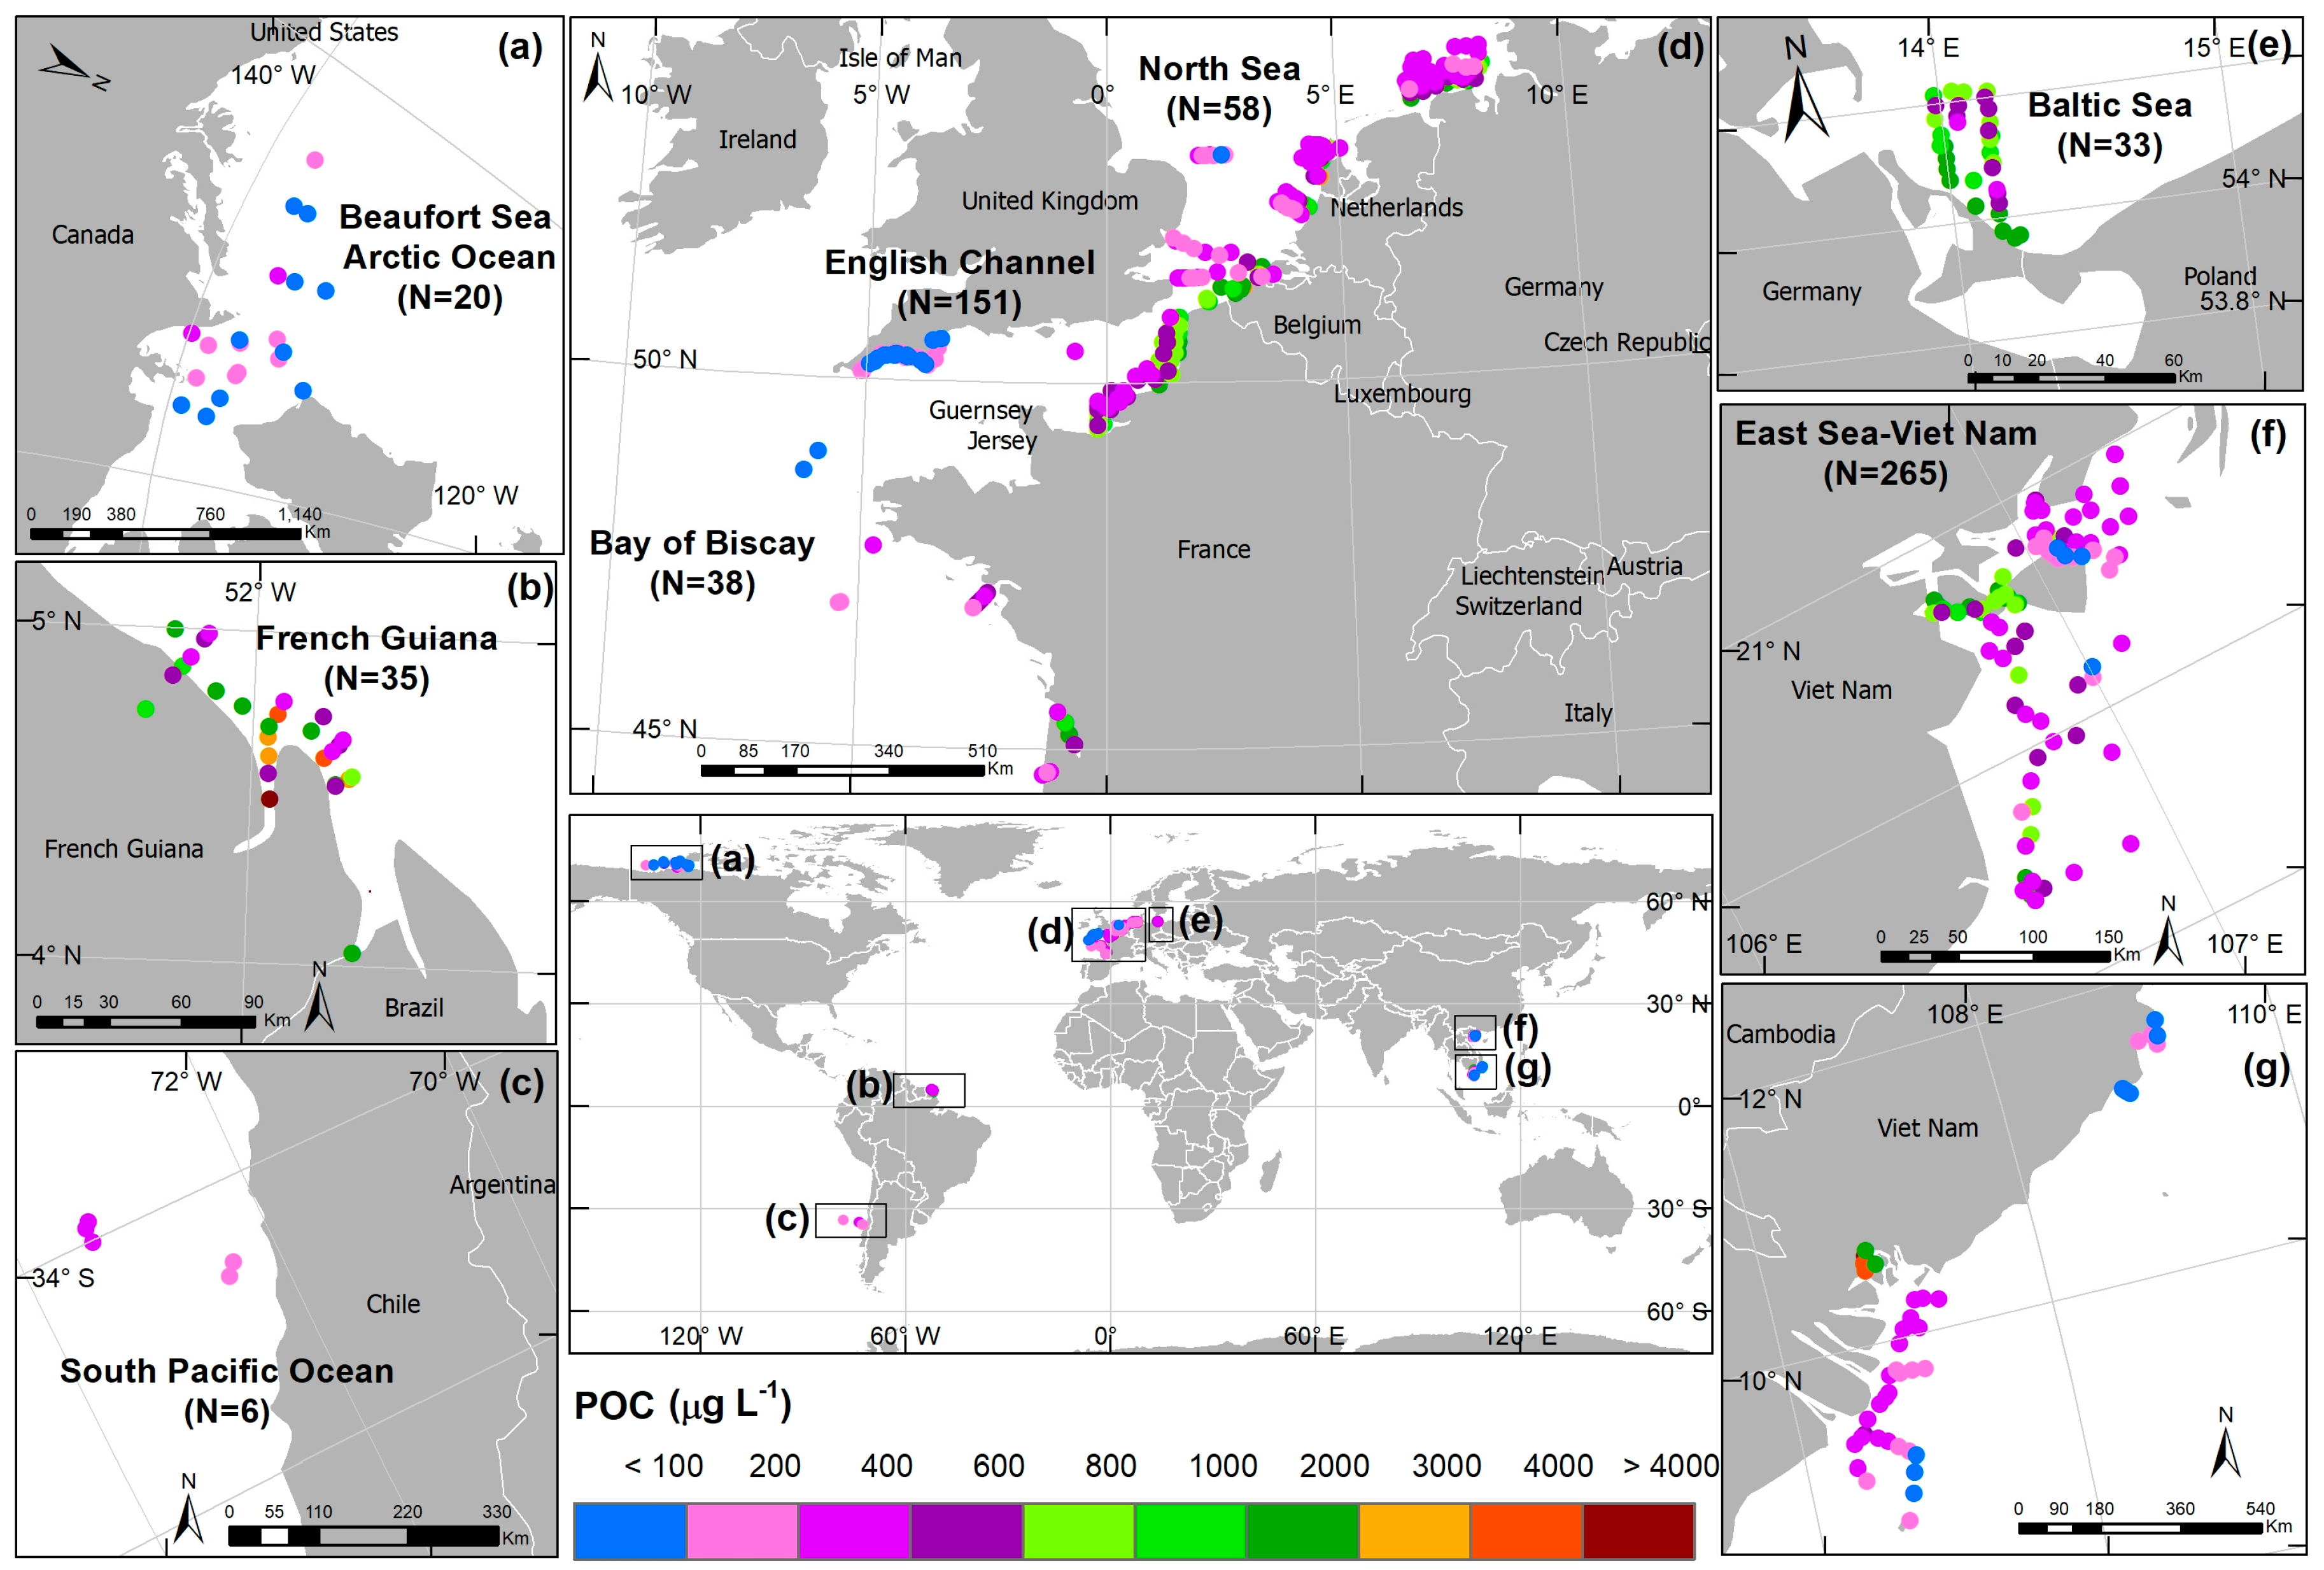
Figure 1. Geographical distribution of the 606 in situ coincident measurements of POC and Rrs listed in Table 1; In situ data were collected (a) in the Beaufort Sea—Arctic ocean, (b) in the coastal water of French Guiana, (c) in the South East Pacific ocean, (d) in European coastal waters: the North Sea, the English Channel and Bay of Biscay, (e) in the Baltic Sea and, (f,g) the Eastern Viet Nam Sea. The color scale corresponds to surface POC concentrations (in μg L−1).
Remotesensing 11 02849 g001
Figure 2. Frequency distribution of (a) POC, (b) SPM, and (c) Chla concentration. Dashed lines stand for the median values (M) of each parameter.
Remotesensing 11 02849 g002
Figure 3. Frequency distribution of the POC to SPM ratio for (a) DSW, (b) DSD, and (c) DSV. Dot-dashed lines represent the values, which delimit the POC/SPM ranges for the mineral-dominated, mixed, and organic-dominated waters according to [39]. The percentages between brackets indicate the percentage of in situ data for each type of water.
Remotesensing 11 02849 g003
Figure 4. POC and Rrs values at 665, 555 and, 490 nm for the whole (ad), development (eh), and validation dataset (il) named DSW, DSD and DSV, respectively. Dashed lines display the median values, M.
Remotesensing 11 02849 g004
Figure 5. Map of SOMLIT stations location around France, presented for divers’ type of waters in coastal area.
Remotesensing 11 02849 g005
Figure 6. Frequency distribution of the biogeochemical measurements for the matchup dataset (DSM). (a) POC, (b) Chla, (c) SPM concentration (μg L−1), and (d) POC/SPM. The dashed lines in (a), (b), and (c) display the median values (M). The dot-dashed lines in (d) delimit the POC/SPM range for the mineral-dominated, mixed and organic-dominated waters according to [39].
Remotesensing 11 02849 g006
Figure 7. Coefficient of determination (R2) for linear type II regression (in log space) between POC and band ratio defined as Rrsi)/Rrsj). The dashed lines represent the central wavelength of MERIS spectral bands (units, nm).
Remotesensing 11 02849 g007
Figure 8. The relationship between POC and the different band ratios developed from the DSD dataset (N = 411): (a) Rrs(665)/Rrs(555), (b) Rrs(665)/Rrs(510), and (c) Rrs(665)/Rrs(490). Green, red and blue dots correspond to organic-dominated, mixed, and mineral-dominated waters; gray dots indicate the in-situ data points without information of SPM that cannot be classified according to POC/SPM ratio. The black line stands for the linear type II regression to log-transformed data. The letter “X” represents the band ratio.
Remotesensing 11 02849 g008
Figure 9. Relationships (in log-transformed) between POC and the maximum band ratio (MBR) developed from the DSD dataset (N = 411). Green, red and blue dots correspond to organic-dominated, mixed and mineral-dominated waters; gray dots indicate the in-situ data points without information of SPM that cannot be classified according to POC/SPM ratio. The black line stands for (a) linear type II regression (b) second-order polynomial regression to log-transformed data. The letter “X” represents the MBR.
Remotesensing 11 02849 g009
Figure 10. Relationships (log-transformed) between POC and the maximum band ratio (MBR) developed from the DSD dataset (N = 411). Symbols indicate which ratio is maximal for each data point. For open circles, it is Rrs(665)/Rrs(555), which is maximum, whereas for crosses and filled triangles, it is Rrs(665)/Rrs(490) and Rrs(665)/Rrs(510), respectively.
Remotesensing 11 02849 g010
Figure 11. Comparison of in situ and model-derived POC for the selected algorithms (log-transformed data). Each subplot was made using a different algorithm to retrieve POC: (a) Hu15-1; (b) Hu15-2; (c) Hu15-3; (d) Le16-1; (e) Le16-2; (f) Le18-1; (g) Le18-2; (h) S08-1; (i) S08-2; (j) Liu15; (k) W16-1; (l) W16-2. Green, red, and blue dots correspond to organic-dominated, mixed, and mineral-dominated waters, respectively. Gray dots indicate the in situ data points without information of SPM that cannot be classified according to the POC/SPM ratio. The black dashed line is the 1:1 line, and the solid red line is the type II linear regression.
Remotesensing 11 02849 g011
Figure 12. Frequency distribution of in situ (grey) and model-derived (white) POC. Each subplot was made using a different algorithm to retrieve POC: (a) Hu15-1; (b) Hu15-2; (c) Hu15-3; (d) Le16-1; (e) Le16-2; (f) Le18-1; (g) Le18-2; (h) S08-1; (i) S08-2; (j) Liu15; (k) W16-1; (l) W16-2. The dashed lines represent the median of in situ POC measurements for DSV (=391 μg L−1), and the solid line the median values of POC estimates. The median values of POC estimates (M) are indicated in each panel.
Remotesensing 11 02849 g012
Figure 13. Comparison of the statistical performance of the eleven algorithms. The algorithms were tested using hyperspectral and multispectral data. The number of data changes according the considered algorithm (Table 5).
Remotesensing 11 02849 g013
Figure 14. Statistical performance of the new developed algorithms named CPOC (Coastal POC) as compared to the Hu15-3 algorithm. The normalized MAPD, MR, MB, and RMSDlog were calculated on DSV. The black line and red line present statistics obtained with the CPOC-1st and CPOC-2nd algorithm, respectively.
Remotesensing 11 02849 g014
Figure 15. (a) Comparison of in situ and model-derived POC for the CPOC-1st algorithm. The dashed line is the 1:1 line, and the solid line is the type II linear regression. Green, red and blue dots correspond to organic-dominated, mixed and mineral-dominated waters; gray dots indicate the in-situ data points without information of SPM that cannot be classified according to the POC/SPM ratio. (b) The frequency distribution of in situ (grey) and POC measurements derived from the CPOC-1st algorithm (black contour). The dashed lines represent the median of in situ POC measurement of DSV (=391 μg L−1), and the solid line the median value of model-derived POC value of DSV.
Remotesensing 11 02849 g015
Figure 16. (a) Comparison of in situ and model-derived POC for the CPOC-2nd algorithm. The dashed line is the 1:1 line, and the solid line is the type II linear regression. Green, red and blue dots correspond to organic-dominated, mixed and mineral-dominated waters; gray dots indicate the in-situ data points without information of SPM that cannot be classified according to the POC/SPM ratio. (b) The frequency distribution of in situ (grey) and POC measurements derived from the CPOC-2nd algorithm (black contour). The dashed lines represent the median of in situ POC measurement of DSV (=391 μg L−1), and the solid line the median value of model-derived POC value of DSV.
Remotesensing 11 02849 g016
Figure 17. (a) Comparison of in situ and model-derived POC concentrations using the matchup dataset. The dashed line displays the 1:1 line and the solid one the linear type II regression. Green, red and blue dots correspond to organic-dominated, mixed and mineral-dominated waters, respectively. (b) Frequency distribution of in situ (grey) and POC measurements derived from the CPOC-2nd algorithm (black contour). The dashed lines represent the median of in situ POC measurement (=108.4 μg L−1), and the solid line the median value of model-derived POC value.
Remotesensing 11 02849 g017
Figure 18. Near-surface POC concentration model-derived from MERIS, Louisiana Continental Shelf, June 2006 (a) using CPOC-2nd (b) Le16-2 algorithms. The black line in the upper left panel delimits pixels, close to the coast, with Rrs(665) > 0.0012 [49] and offshore pixels with Rrs(665) < 0.0012 (c,d). Density plots of POC as derived with the CPOC-2nd and Le16-2 algorithms for (c) all the pixels of the scene (d) only for pixels with Rrs(665) > 0.0012. Distribution of POC estimates with CPOC-2nd and Le16-2 algorithm for (e) all pixels of the scene (f) only for pixels with Rrs(665) > 0.0012. The black and red lines represent the median of POC estimates using the Le16-2 and CPOC-2nd algorithms, respectively.
Remotesensing 11 02849 g018
Table 1. Information on the in-situ data used in this study: number of data (N), minimum (Min), maximum (Max), mean, and standard deviation (StdDev) values of POC concentrations (μg L−1). M and H stand for multispectral and hyperspectral data, respectively.
RegionYearNPOCNRrsMinMaxMeanStdDevReferenceMultispectral (M) or Hyperspectral Data (H)
Baltic Sea19983333330.01990823.3339.7[24,25]M
Bay of Biscay-France20123838157.0393012251056[28]H
Beaufort Sea Arctic Ocean2004202049.80319.7120.864.15[34]M
East Sea-Viet Nam20101414188.01248485.1365.6[31,32]H
201112512568.901203283.7200.4H
20133737221.01858649.5248.1H
2014727265.414623588.3816.9H
2015171745.37144.599.9836.92H
English Channel1997474760.00221.0119.441.53[24,25]M
20048484214.72262754.0388.2[26,27]H
20102020110.22159331.6276.9[29]H
French Guiana20123535216.0574414061309[30,40]H
North Sea19985858190.02470505.8390.5[24,25]M
South Pacific Ocean200466112.9277.8192.662.79[33]M
Overall 60660645.375744575.6662.5
Table 2. In situ data from the French SOMLIT network (DSM dataset) sampled simultaneously with MERIS overpass.
StationLocationDistance to Coastline (km)Number of In Situ POC Data Number of Matchups
S 01Wimereux, North of France
(Channel Sea)
1.6306
S 02Wimereux, North of France
(Channel Sea)
8.15611
S 03Roscoff, Brittany
(Channel Sea)
3.54230
S 10Banyuls-sur-Mer
(Mediterranean Sea)
0.89278
S 11Marseille
(Mediterranean Sea)
4.8–6.46928
S 12Villefranche-sur-Mer, French Riviera,
(Mediterranean Sea)
0.544
S 17Luc-sur-Mer, Normandy,
(Channel Sea)
0.1751
S 18La Rochelle, Bay of Biscay
(Atlantic Ocean)
8.04621
Total 336154
Table 3. Candidate algorithms used for the inter-comparison exercise. The four last columns provide relevant information on the algorithms: inputs of algorithm, region where the data were collected, the range of POC, and number of data used for the development of the algorithm.
AuthorsAbbreviationInputsRegionPOC Range
(μg L−1)
N
Band ratio-based algorithms
Stramski et al. 2008S08-1S08-2Rrs(443)/Rrs(555)
Rrs(490)/Rrs(555)
Eastern South Pacific10–27053
Woźniak et al. 2016W16-1
W16-2
Rrs(555)/Rrs(589),
Rrs (490)/Rrs(625)
Baltic Sea
Gulf of Gdańsk (Poland)
145–237073
Hu et al. 2015Hu15-1
Hu15-2
Hu15-3
Rrs(443)/Rrs(555)
Rrs(490)/Rrs(555)
Rrs(510)/Rrs(555)
China Sea17.59–687.5120
Liu et al. 2015Liu15Rrs(678)/Rrs(488)
& Rrs(748)/Rrs(412)
Pearl River Estuary, (China)113–1402103
Rrs based algorithm
Le et al. 2016Le16-1
Le16-2
Rrs(488), Rrs(532), Rrs(547), Rrs (667), Rrs(678)
Rrs(490), Rrs(510), Rrs(550), Rrs (670)
Louisiana & Mobile Bay (Gulf of Mexico)11.5–230230
Color index algorithm
Le et al. 2018Le18-1
Le18-2
Rrs(490) & Rrs(555) & Rrs(665),
Rrs(443)/Rrs(555)
Global ocean *52.6–375.2297
*The algorithm was developed from satellite Rrs and coincident in situ POC measurements through a matchup exercise.
Table 4. Statistical results for POC algorithms. The formulations are power function, POC = 10 a 1 X + a 0 or second-order polynomial POC = 10 a 2 X 2 +   a 1 X   +   a 0 (log is for decimal logarithm).
XFunctional Formaoa1a2R2RMSDlog
log(Rrs(665)/Rrs(555))Power3.0971.122 0.590.267
log(Rrs(665)/Rrs(510))Power2.9260.906 0.650.249
log(Rrs(665)/Rrs(490))Power2.8610.833 0.660.246
log(MRB)Power2.8750.928 0.670.242
log(MRB)Second-order polynomial2.8730.9450.0250.670.242
Table 5. Statistics obtained on DSV for the tested algorithms. The best results for each statistic are shown in bold.
AlgorithmsNMAPDMBRMSDlogRMSDMRR2SlopeInterceptNegative Value
CPOC-1st19538.37−2.770.25488.021.030.600.780.580
CPOC-2nd19537.480.540.25489.881.020.600.780.580
Hu15-119564.4029.450.32581.371.550.390.321.90
Hu15-219538.83−104.80.28582.11.140.480.351.720
Hu15-319538.87−74.530.27589.81.110.470.51.310
Le16-119561.75127.50.38943.31.520.220.41.70
Le16-214460.8912370.4447151.590.420.90.460
Le18-119517811,340,7601.7613,608,58418.810.080.941.480
Le18-219568.94157.70.35651.51.630.390.481.520
Liu1513462.71202.80.38749.41.40.280.621.110
S08-119545.09−60.530.3584.01.260.390.361.730
S08-219549.1944.140.29590.41.410.480.471.510
W16-115064.29214.90.44842.51.040.481.13−0.330
W16-214661.32247.50.34715.11.480.530.910.350
S08-1*19345.46−61.030.30587.01.260.380.351.750
S08-2 *19349.1944.470.30593.51.410.480.461.520
* Removed Biosope data.