1. Introduction
With the development of space science and technology, Earth observation systems have been established gradually [
1,
2]. Various Earth observation platforms, including air-borne and space-borne platforms, have played important roles in many fields and are organized as systems to provide numerous datasets of our living planet. In recent years, the Moon, as the only natural satellite of the Earth, has gained great interest as a potential Earth observation platform [
3,
4,
5,
6].
The first Moon-based sensor can be dated back to 1972, when Apollo 16 sent men to the Moon for the fifth time [
7]. A far-ultraviolet camera was operated on the lunar surface, and imagery of the terrestrial atmosphere and the geocorona was obtained [
8]. Forty-one-years later, in 2013, an extreme ultraviolet camera (EUVC) onboard the Chang’E-3 (CE-3) lander observed the Earth’s plasmasphere from the lunar surface [
9]. In recent years, many countries and organizations have initiated programs to set up a base on the Moon, which includes establishing an Earth observation platform [
10]. Some pioneer research has been carried out to investigate the Moon-based Earth observations, including scientific goals [
3,
11], observation geometry analysis [
12,
13,
14,
15], and Moon-based synthetic aperture radar (SAR) parameters [
4,
5,
16]. According to their research conclusion, a Moon-based Earth observation platform is characterized by longevity, integrity, stability, and uniqueness. Equipping sensors on the lunar surface can be used to monitor the Earth-space environment, the dynamics of solid Earth, the Earth’s radiation budget at the top of atmosphere, and other issues of large-scale phenomena of the Earth. Further, a Moon-based Earth observation platform could be complementary to the existing Earth observation systems.
For the Moon to serve as an Earth observation platform, it is essential to evaluate its observation geometry. Compared to traditional Earth observation platforms, equipping sensors on the lunar surface has some special characteristics in observation geometry. First, since the distance between the Earth and the Moon is very large, a sensor installed on the lunar surface could observe nearly half of the Earth, which could extend the existing Earth observations to longer time scales and larger space scales [
12]. Additionally, it is possible to realize integrative measurements for the Earth [
11]. Second, combining the orbit of the Moon and the seasonal change in relative Earth orientation, a Moon-based platform can realize simultaneous and integral observation of the high latitudes, which will help carry out the contrastive study of the polar regions [
17]. Third, due to the vast places of the lunar surface, different kinds of sensors can be installed. They can work together and acquire data from the Earth’s surface to the plasmasphere simultaneously. Many scholars have conducted research on the observation geometry. He et al. [
18] simulated the Moon-based extreme ultraviolet images and demonstrated that equipping sensors on the regions where they can observe the Earth is beneficial for acquiring high quality images. Ren et al. [
12] proposed simulation technologies of Moon-based Earth observations and evaluated the line-of-sight condition to the Earth. In addition to the consideration of the line-of-sight condition to the Earth, Ye et al. [
13] studied the pointing error of a Moon-based sensor and noted that the mid–high latitude regions on the lunar surface are suitable places to equip Earth observation sensors. Guo et al. [
14] analyzed the errors of the exterior orientation elements of Moon-based sensors. They also suggested that equipping sensors on the mid–high latitude region helps to reduce the pointing error.
As an Earth observation platform, the requirements of acquiring high-quality data need to be considered. Solar invasion for a sensor refers to the sunlight hitting the lens of the sensor directly, which may damage the sensor, reduce the quality of the measurements, and ultimately affect the accuracy of the data [
19,
20,
21]. When observing the Earth from the lunar surface, the effect of solar invasion also exists. As shown in
Figure 1, the Sun moves into the FOV of the sensor. At that moment, the Sun moves to the other side of the Earth and the lens of the sensor will be directly exposed to the Sun.
From the experiences of space-borne platforms, the effects of the solar invasion depend on the geometric relationships between the Sun, the Earth, and the platforms. The solar invasion does not seem to be an issue in the Sun-synchronous orbit because the satellites will pass over the Earth’s surface at the same local mean solar time [
22]. It is an orbit that always maintains the same relationship with the Sun. Another common one is the geostationary orbit. Since the geostationary orbit is a circular orbit above the Earth’s Equator and follows the direction of the Earth’s rotation, the solar invasion will occur near midnight at local time daily, which might lead to the damage of the sensors. A method to solve this problem is to avoid the solar invasion by adjusting the satellite attitude [
19]. When observing the Earth from a Moon-based platform, since the relative position of the Sun, the Earth, and the Moon is unfixed, the sensor’s line-of-sight vector would be close to the Sun direction at some time. Such a complex geometrical relationship will no doubt complicate the evaluation of the solar invasion effects.
The aim of this paper is to analyze the solar invasion effects at different positions on the lunar surface so as to give support to the site selection for a Moon-based platform. We make three contributions in this paper. The first contribution is to make a geometrical description of solar invasion for a Moon-based sensor. By analyzing the geometrical relationship, the degree of solar invasion is found to be relative to the angle between the Sun and line-of-sight vector direction, as well as the position the sensor is equipped on. Second, according to the geometric analysis, the method to calculate the solar invasion duration and radiation is proposed. Different from Burinskaya et al. [
23] and Song et al. [
24], who calculated the solar radiation on the lunar surface, the theoretical expression of solar invasion radiation considers the radiation at the entrance pupil of a sensor. The third is to evaluate the effects of the solar invasion duration and radiation for a sensor on the near-side of the Moon. Since the effect of the variation of the orbit of the Moon on the solar invasion radiation is different, to evaluate the differences at different positions on the lunar surface, the mean value and standard deviation need to be calculated. The standard deviation could be combined with the mean value to measure the variation amplitude of the solar invasion radiation.
The remainder of this paper is arranged as follows.
Section 2 first introduces the theoretical geometric model for Moon-based Earth observations. Based on the geometric model, two typical observational cycles are demonstrated. A geometric description of solar invasion is introduced in
Section 3, and the angle between the Sun direction and line-of-sight vector are found to be an important factor in determining the effects of solar invasion on a sensor. Then, the calculation methods of solar invasion duration and radiation are established. In
Section 4, the results of the simulations conducted are presented to illustrate the effects of solar invasion on the near-side of the Moon from the perspective of duration and radiation. Finally, some discussion about the site selection issue of Moon-based Earth observation sensors is provided in
Section 5.
2. Theoretical Geometric Model
The analysis of solar invasion effects on sensors at a Moon-based platform requires a theoretical model of the Moon-based Earth observation geometry. The theoretical geometric model presented in this paper is based on the model published by Ye et al. [
13] and and Guo et al. [
14]. In this section, the theoretical geometric model of a Moon-based platform is introduced briefly. The core of this model is the process to transform the Moon-based platform, the Sun, and the Earth into the same coordinate system. All of them should be transformed through a series of complex coordinate systems.
Figure 2 summarizes the general procedures of the coordinate system transformations. Since the Moon is simplified as a sphere with a radius 1738 km, the position can be expressed as latitude, longitude, and altitude in the selenographic coordinate system. Additionally, the coordinates of a Moon-based platform can be transformed to a Cartesian coordinate system, i.e., Moon-centered Moon-fixed coordinate system (MCMF). For the description of the Moon-based platform’s orientation, the Euler angles of the lunar libration are used to transform the MCMF to the Selenocentric Celestial Reference System (SCRS). According to the lunar positions derived from the planetary ephemeris, the position of the Moon is defined in the Geocentric Celestial Reference System (GCRS), which shares the same orientation with SCRS. Thus, in the inertial reference system, the transformation between the SCRS and GCRS can be treated as the translation of the barycenter between the Moon and the Earth. Similarly, the coordinates of the Sun can be transformed to GCRS by translating its barycenter to the Earth. For the transformation of the point on Earth, the position of the point on Earth, defined in the International Terrestrial Reference System (ITRS), needs to transform to GCRS and two sets of transformation models can be used to transform it from ITRS to GCRS, i.e., the classical model and non-rotating origin model [
25].
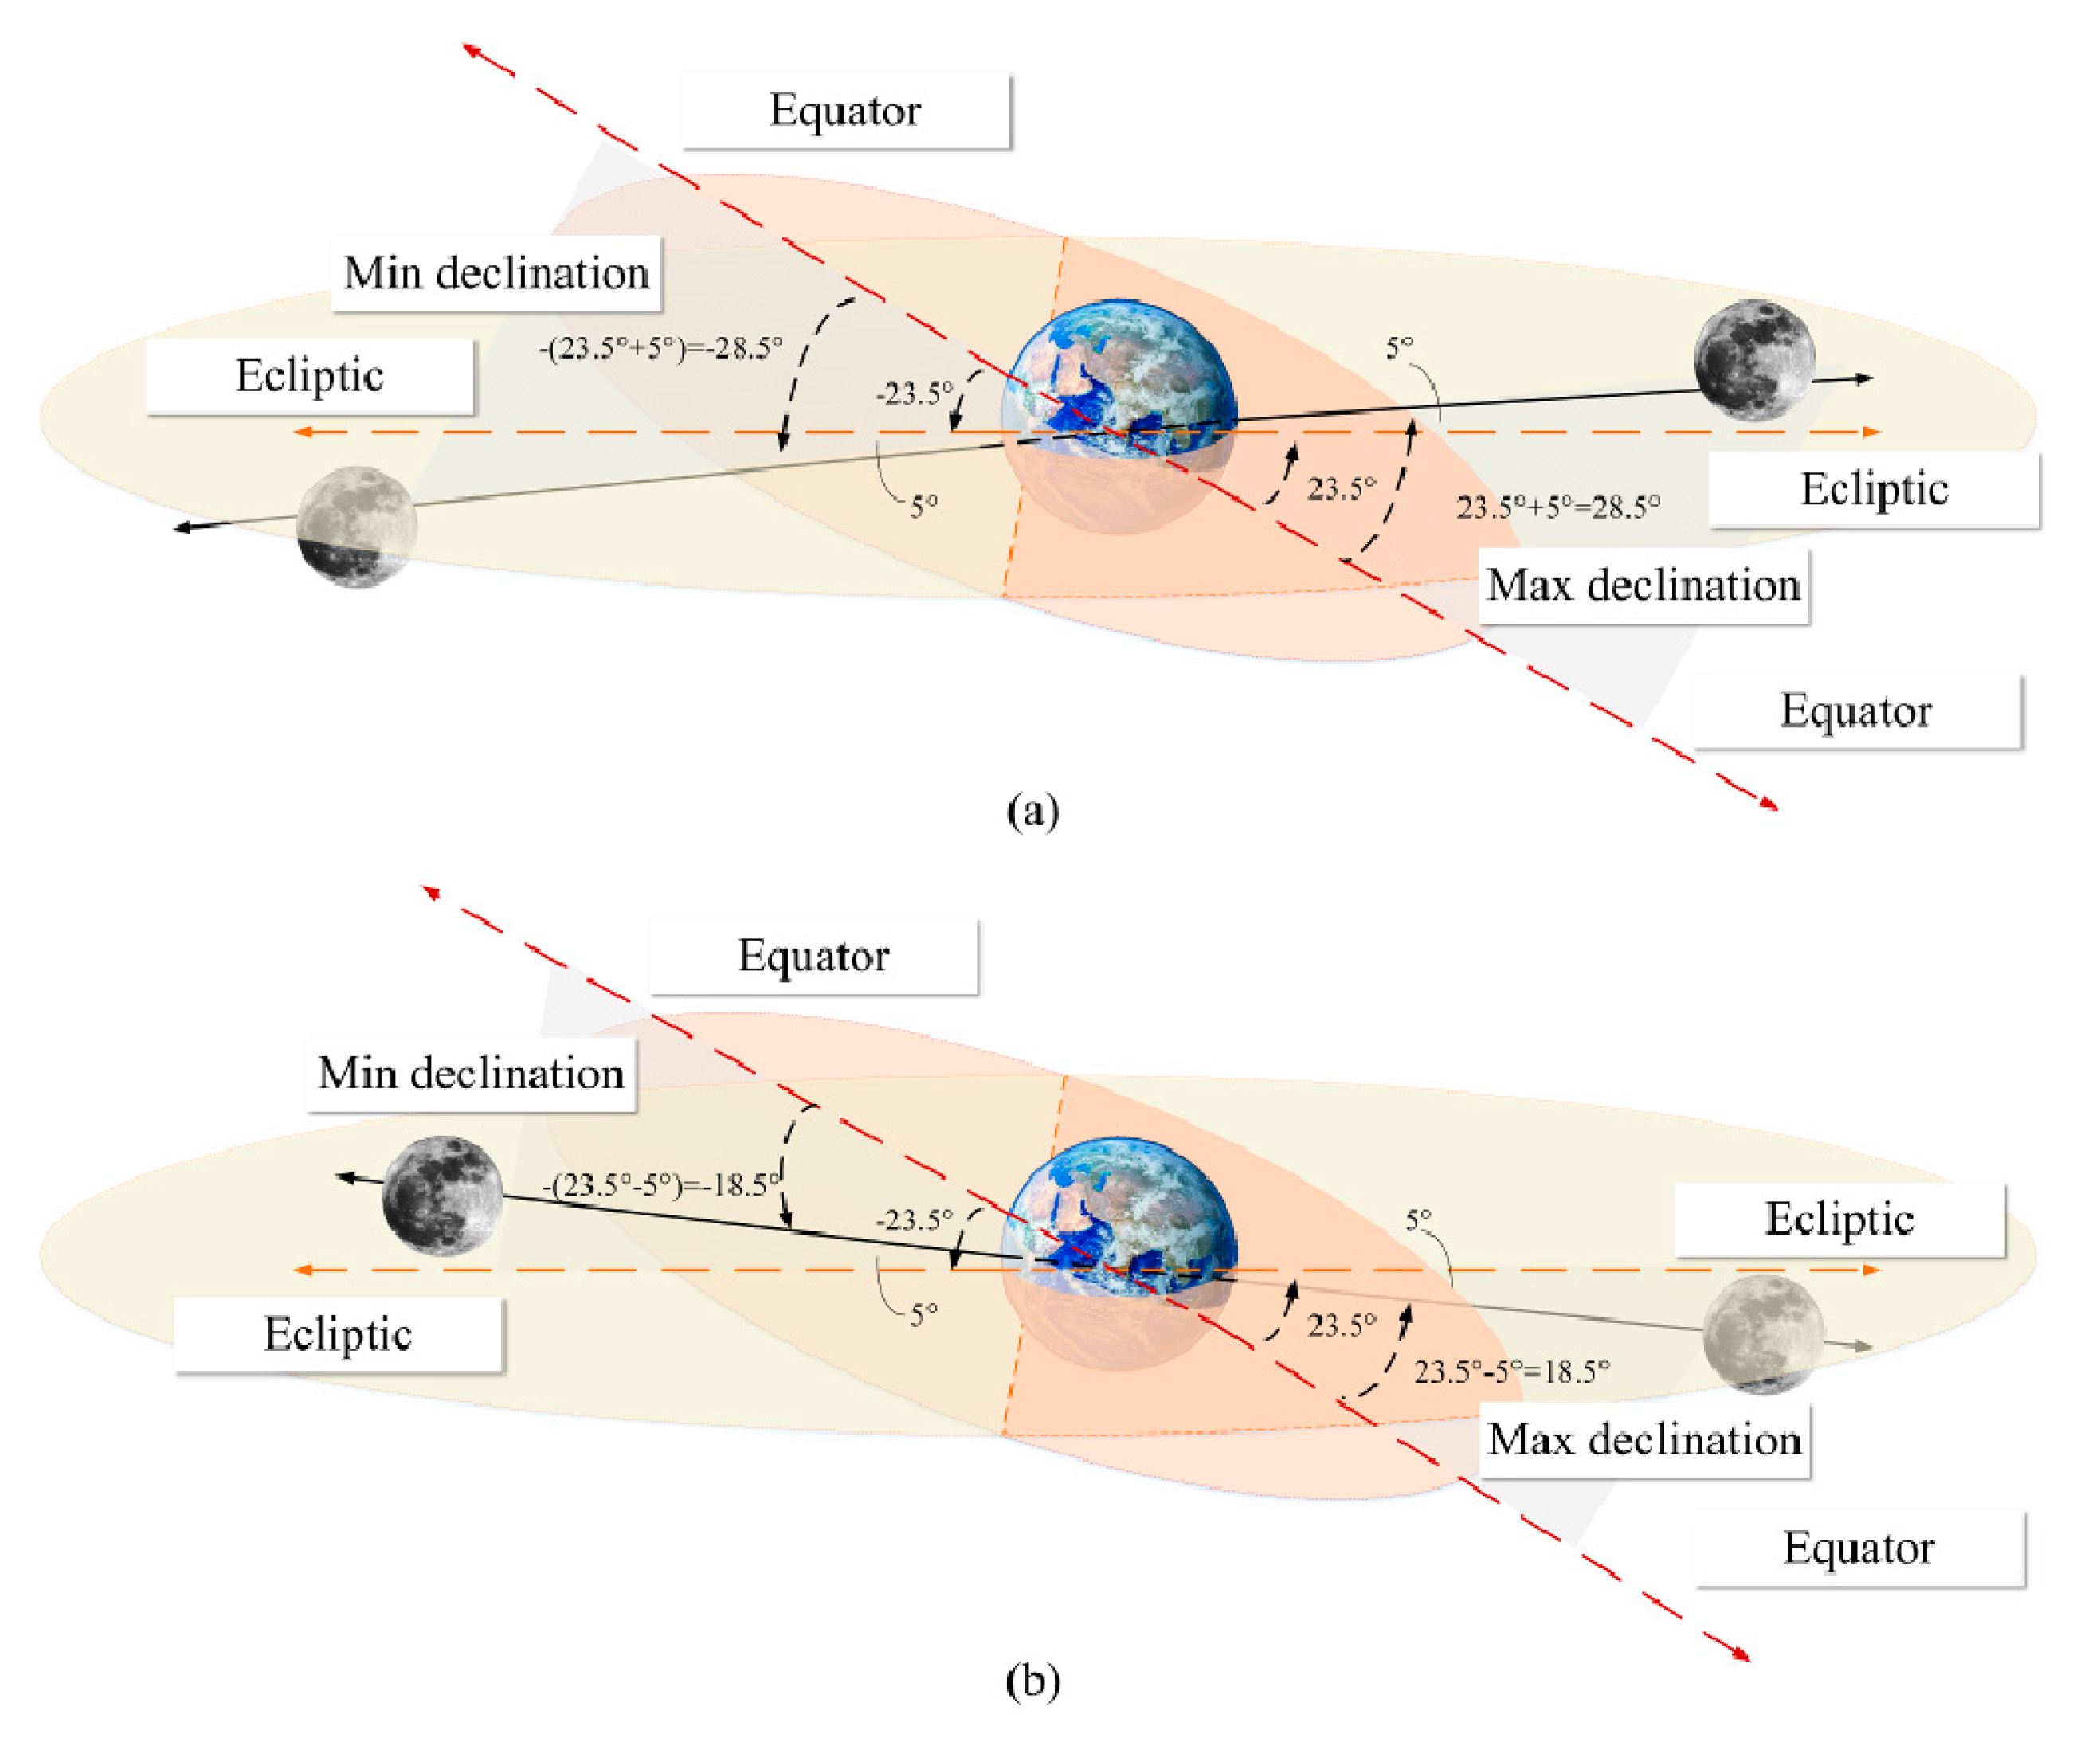
According to the theoretical geometric model, two fundamental observation periods of Moon-based Earth observation can be found. One is a 29.5-day cycle called the orbital period. As the Moon rotates around the Earth, its declination also changes, completing a cycle once every 29.5 days. Another is an 18.6-year cycle, which is much longer than the orbital period. The extreme values of one orbital period vary about 5° with respect to the ecliptic plane, and the obliquity of the ecliptic is about 23.5°. The value of the orbit of the Moon to ecliptic gradually changes over an 18.6-year cycle due to the precession of the lunar inclination, alternately adding to or subtracting from the obliquity of the ecliptic. Therefore, there are two extreme cases, including the adding case (shown in
Figure 3a) and subtracting case (shown in
Figure 3b). In the adding case, the Moon will change its declination during the variation about −28.5° to +28.5°, for a total range of 57°. Then, 9.3-years later, during the subtracting case, the Moon will change its declination from −18.5° to +18.5°, which totals 37° in range. In this paper, we mainly analyzed the effects of the solar invasion duration based on these two fundamental observation periods.
3. Solar Invasion of a Moon-based Sensor
The objective of this paper was to investigate the effects of solar invasion, and to analyze it in terms of both duration and radiation. The geometric description of solar invasion was first introduced. The Boolean matrix method was then used to calculate the duration when the Sun entered the FOV. Finally, the method of solar invasion radiation at the pupil entrance of a sensor was constructed.
3.1. Geometric Description of Solar Invasion
The impact of solar invasion on a sensor essentially reflects the geometric relationship between the line-of-sight vector and the Sun direction vector. In this section, we parameterized the line-of-sight vector and the Sun direction vector, and then obtained the angle between these two vectors. The smaller the angle is, the longer the solar invasion duration on a sensor will be.
According to the theoretical geometric model in
Section 2, we need to transform the coordinates of the Moon-based platform, the Sun, and the Earth into the same coordinate system.
Figure 4 illustrates the solar invasion geometry. Different positions on the lunar surface will have different line-of-sight vectors [
13,
26]. This fact dictates that the position of the Moon-based sensor cannot be simplified as at the barycenter of the Moon. Thus, the line-of-sight vector should be from the position on the lunar surface to the Earth.
To clearly demonstrate the calculation process of the line-of-sight vector and the Sun direction vector, it is necessary to introduce three related transformation matrixes.
Constant matrix [
C]: The location of a Moon-based sensor on the lunar surface are given by coordinates expressed in the MCMF, where the
X-axis points to the mean Earth direction and the
Z-axis points to the mean rotation axis direction. However, the data derived from planetary ephemeris is defined in another coordinate system, and the Principle Axis coordinate system (PA), and the PA and MCMF rotation axes do not coincide. Thus, the differences of these two coordinate systems can be described by applying the constant matrix. Coordinates in the MCMF are converted to PA by:
where C1, C2, and C3 are three different constants. It is worth noticing that different versions of the development ephemeris have different values [
27,
28].
Lunar libration matrix [
L]: The lunar libration matrix describes the lunar orientation parameterized by three Euler angles,
ϕm,
θm, and
ψm. These three parameters can be obtained from planetary ephemeris. The lunar libration matrix from PA to SCRS can be expressed as [
29]:
Translation matrix [
T]: Translation matrix was used to transform the coordinates of a Moon-based sensor from SCRS to GCRS. The parameters
xm,
ym, and
zm are the coordinates of the barycenter of the Moon in the GCRS, which can be derived from planetary ephemeris. Thus, the translation matrix can be written as:
As shown in
Figure 4, the coordinates of the Moon-based sensor can be related to its selenographic coordinates
φm and
λm. Therefore, its position vector
p(
xp,
yp,
zp) in the GCRS are given by
where the subscript p refers to the point.
Rm represents the radius of the Moon.
As far as the line-of-sight vector is concerned, we assume that the line-of-sight vector (
v) always points to the Earth barycenter.
v is then given by:
where (
xe,
ye, and
ze) are the coordinates of the Earth barycenter in the GCRS.
Since the distance between the Sun and the Moon is too large, the Sun is treated as a disk and the received sunlight of a Moon-based sensor can be assumed to be parallel light.
Letting O
s (
xs,
ys, and
zs) represent the direction of the Sun in the GCRS, the vector
s can be written as:
It is worth noting that the barycenter of the Sun (O
s) can also be derived from planetary ephemeris. Therefore, the angle
θ can be given by:
3.2. Solar Invasion Duration Calculation
Solar invasion duration means the duration when the Sun enters the sensor’s FOV. We use the Boolean matrix method to calculate the solar invasion duration at a certain time period. Previous studies evaluating the solar invasion duration of Geostationary Earth Orbit (GEO) platforms mainly first calculated the Earth shadow region and then judged whether the satellite was within that region (e.g., Ye et al. [
30]). The GEO’s orbit is a circle in the GCRS and the solar invasion usually occured at midnight, where the duration is relatively regular. The calculation of solar invasion duration will be more difficult in a Moon-based platform. Previous work has used the Boolean matrix method to calculate the observation duration of a Moon-based platform [
15]. They formed a ‘0–1′ matrix to describe the visibility of Earth during the time period. Each element in the matrix indicates the visibility of Earth at that moment. If the Earth target was visible, the element was marked ‘1′, otherwise the element was marked ‘0′.
Figure 5 shows the scheme, which is divided into two phases. The proposed processing phases are designed to calculate the Boolean matrix of solar invasion duration. Through processing the Boolean matrix, some important statistics, such as the distribution and the length of the solar invasion duration, can be achieved.
In the preprocessing phase, the time period and step size need to be set. In this study, the step size was set to 1 min to reflect the solar invasion duration variation, while at the same time considering the computational burden. After setting the time period and step size, the planetary ephemeris was used to acquire the position and orientation of the Moon. The conventional coordinate system transformations were applied to unify the positions of the Moon-based platform, the Earth, and the Sun.
The next phase of the scheme mainly presented the generation of the Boolean matrix. As the established geometric relationship does not incorporate the sight condition, i.e., the Earth is not visible all the time when equipping sensors at the limb of the lunar disk, it was necessary to consider the visibility of the Earth for a Moon-based platform first. Then, the angle θ between the line-of-sight vector and Sun direction vector could be acquired. If the parameter θ was larger than the field of view, the Sun would not appear in the observational scope and the sensor would not be affected by direct sunlight. The elements in the Boolean matrix represents whether the Sun direction was in the field of view of the sensor. If the parameter θ was less than half of the FOV, the element was marked ‘1′, otherwise the ‘0′ value was assigned. Thus far, the solar invasion determination process at a certain time was finished. In this phase, the process was repeated until all the calculations were finished.
Following all the calculations for the time period, the Boolean matrix was generated. As the elements were calculated at a fixed step size during the time period, the element numbers of the Boolean matrix recorded the time information. The start and finish time of each duration were indicated by the start and finish element numbers and the total observation time was the product of the sum of the Boolean matrix and the step size.
3.3. Solar Invasion Radiation Calculation
The solar invasion radiation refers to the solar radiation at the entrance pupil of a sensor. For a sensor on the lunar surface, in essence, the magnitude of the solar invasion radiation was the component of the solar radiation on the lunar surface along the sensor’s line-of-sight direction. Thus, the calculation of the solar invasion radiation was dealt with in two steps. The first was to calculate the solar radiation on the lunar surface. After that, the component along the line-of-sight direction could be achieved.
On the basis of the energy conservation principle and ignoring the attenuation of the energy emitted from the Sun in the interplanetary space, the radiation emitted from the Sun needed to remain the same at the lunar surface. Thus,
where
F denotes the solar emittance,
Rs the radius of the Sun,
E the total solar energy reaching to the Moon-based platform, and
R0 the instantaneous distance between the Sun and the Moon-based platform.
The solar constant was defined as the solar energy across a unit area on the top of the atmosphere of the Earth, which was normal to the solar beam at the mean distance between the Sun and the Earth. The solar constant
S0 can be written as
where
R denotes the mean distance between the Sun and the Earth.
The total solar radiation on the lunar surface can be obtained by modifying the distance in the case of the solar constant. We had
where
S0 denotes the solar constant. Since the solar constant is a quantity denoting the amount of total solar energy reaching the top of the atmosphere of the Earth,
R/R0 is essentially the ratio of the between the distance from the Sun to the Earth and to the Moon-based platform.
The effective solar radiation is defined as the actual radiation received by the position on the lunar surface at a given time. It depends primarily on the local solar zenith angle and on the variable distance of the position on the lunar surface to the Sun. Hence, the effective solar radiation at a specific position on the lunar surface can be written as:
where
i denotes the solar zenith angle at the specific position on the lunar surface when the instantaneous total solar radiation is
E.
The solar invasion radiation of a Moon-based sensor can be calculated by resolving the effective solar radiation into the component along the line-of-sight direction of the sensor. We obtained
where
is denotes the sensor’s elevation angle.
5. Discussion
In this study, the solar invasion effects on a Moon-based sensor are analyzed systematically. The geometric description of solar invasion was established based on the theoretical geometric model of the Moon-based Earth observations. From the geometric analysis, we found that the angle between the Sun and the Earth direction was an important factor. If this angle was too small, the Sun would probably enter the field of view, and the solar invasion radiation would reach a maximum. According to this parameter, the solar invasion duration when the Sun enters the FOV and the solar invasion radiation at the entrance pupil of the sensor were calculated. Since a Moon-based sensor can be equipped on the whole near-side of the Moon, and the changes of the orbit of the Moon are complicated, it is necessary to evaluate the solar invasion effects for a sensor on the different positions of the near-side of the Moon. In other words, by comparing the solar invasion effects at different positions on the near-side of the Moon, a suitable place to equip an Earth observation sensor can be suggested to avoid the solar invasion effects as much as possible.
In establishing a lunar base, site selection is an extraordinarily significant issue, especially for Earth observations. They need a good line-of-sight condition to the Earth, high-precision pointing control, and low stray light. In the mission of Apollo 16, a far-ultraviolet camera was installed on the Descartes Highlands, located in the low latitude region of the Moon [
8]. In the mission of CE-3, an extreme ultraviolet camera (EUVC) was installed on the Northwest of Mare Imbrium [
9], and many scholars have investigated the landing area [
31]. However, the main reason to land on these two sites is to deepen the understanding of the local region, rather than the requirements of Earth observations. Therefore, this site selection strategy is not suitable for Earth observation sensors.
According to the analysis of the line-of-sight condition to the Earth and pointing accuracy, the site selection issue of a Moon-based sensor have been discussed in References [
13,
14,
26]. However, the site selection issue, considering the stray light of the sensor, was not mentioned. The stray light of the Moon-based sensor was mainly caused by solar invasion and background contamination in the FOV. In this paper, we mainly investigated how to select a suitable region to equip an Earth observation sensor in view of reducing the effects of solar invasion. We first investigated the solar invasion duration and its distribution at the near-side of the Moon. The solar invasion duration depended on the FOV of the sensor. Within the permanently Earth-observing region, the solar invasion duration for a sensor did not change appreciably, regardless of the sensor’s position and FOV (
Figure 9). However, when considering the solar invasion radiation, the differences among different positions on the permanently Earth-observing region were revealed. The solar invasion radiation of a sensor mainly depended on the angle between the Sun direction and the line-of-sight vector. Due to the geometric relationship between the Sun and the Moon, the solar radiation in the mid–high latitude region would be lower than that in the low latitude region, leading to differences in the solar invasion radiation (
Figure 11 and
Figure 12). Since the variation of lunar inclination to the ecliptic plane induces the relevant changes of solar invasion radiation (
Figure 3), solar invasion radiation at a certain position is not consistent. To evaluate these variations more scientifically and rationally, two metrics, including the mean and the standard deviation, are proposed to measure the mean value and amplitude of solar invasion radiation variation (
Figure 13). As shown in
Figure 13, compared to the low latitude region, equipping a sensor at the mid–high latitude region would not only have a lower solar invasion radiation, but also have a relatively stable variation. Our study suggests that equipping sensors on the mid–high latitude of the permanently Earth-observing region will lessen the effects of the solar invasion on a sensor.
6. Conclusions
The effect of solar invasion on an Earth observation sensor on the near-side of the Moon has been investigated. Through parameterization of the Moon-based Earth observation geometry, considering the coordinate transformations of the Earth, the Sun, and the Moon-based sensor, the solar invasion duration of the Sun entering the FOV and solar invasion radiation at the entrance pupil of the sensor was calculated.
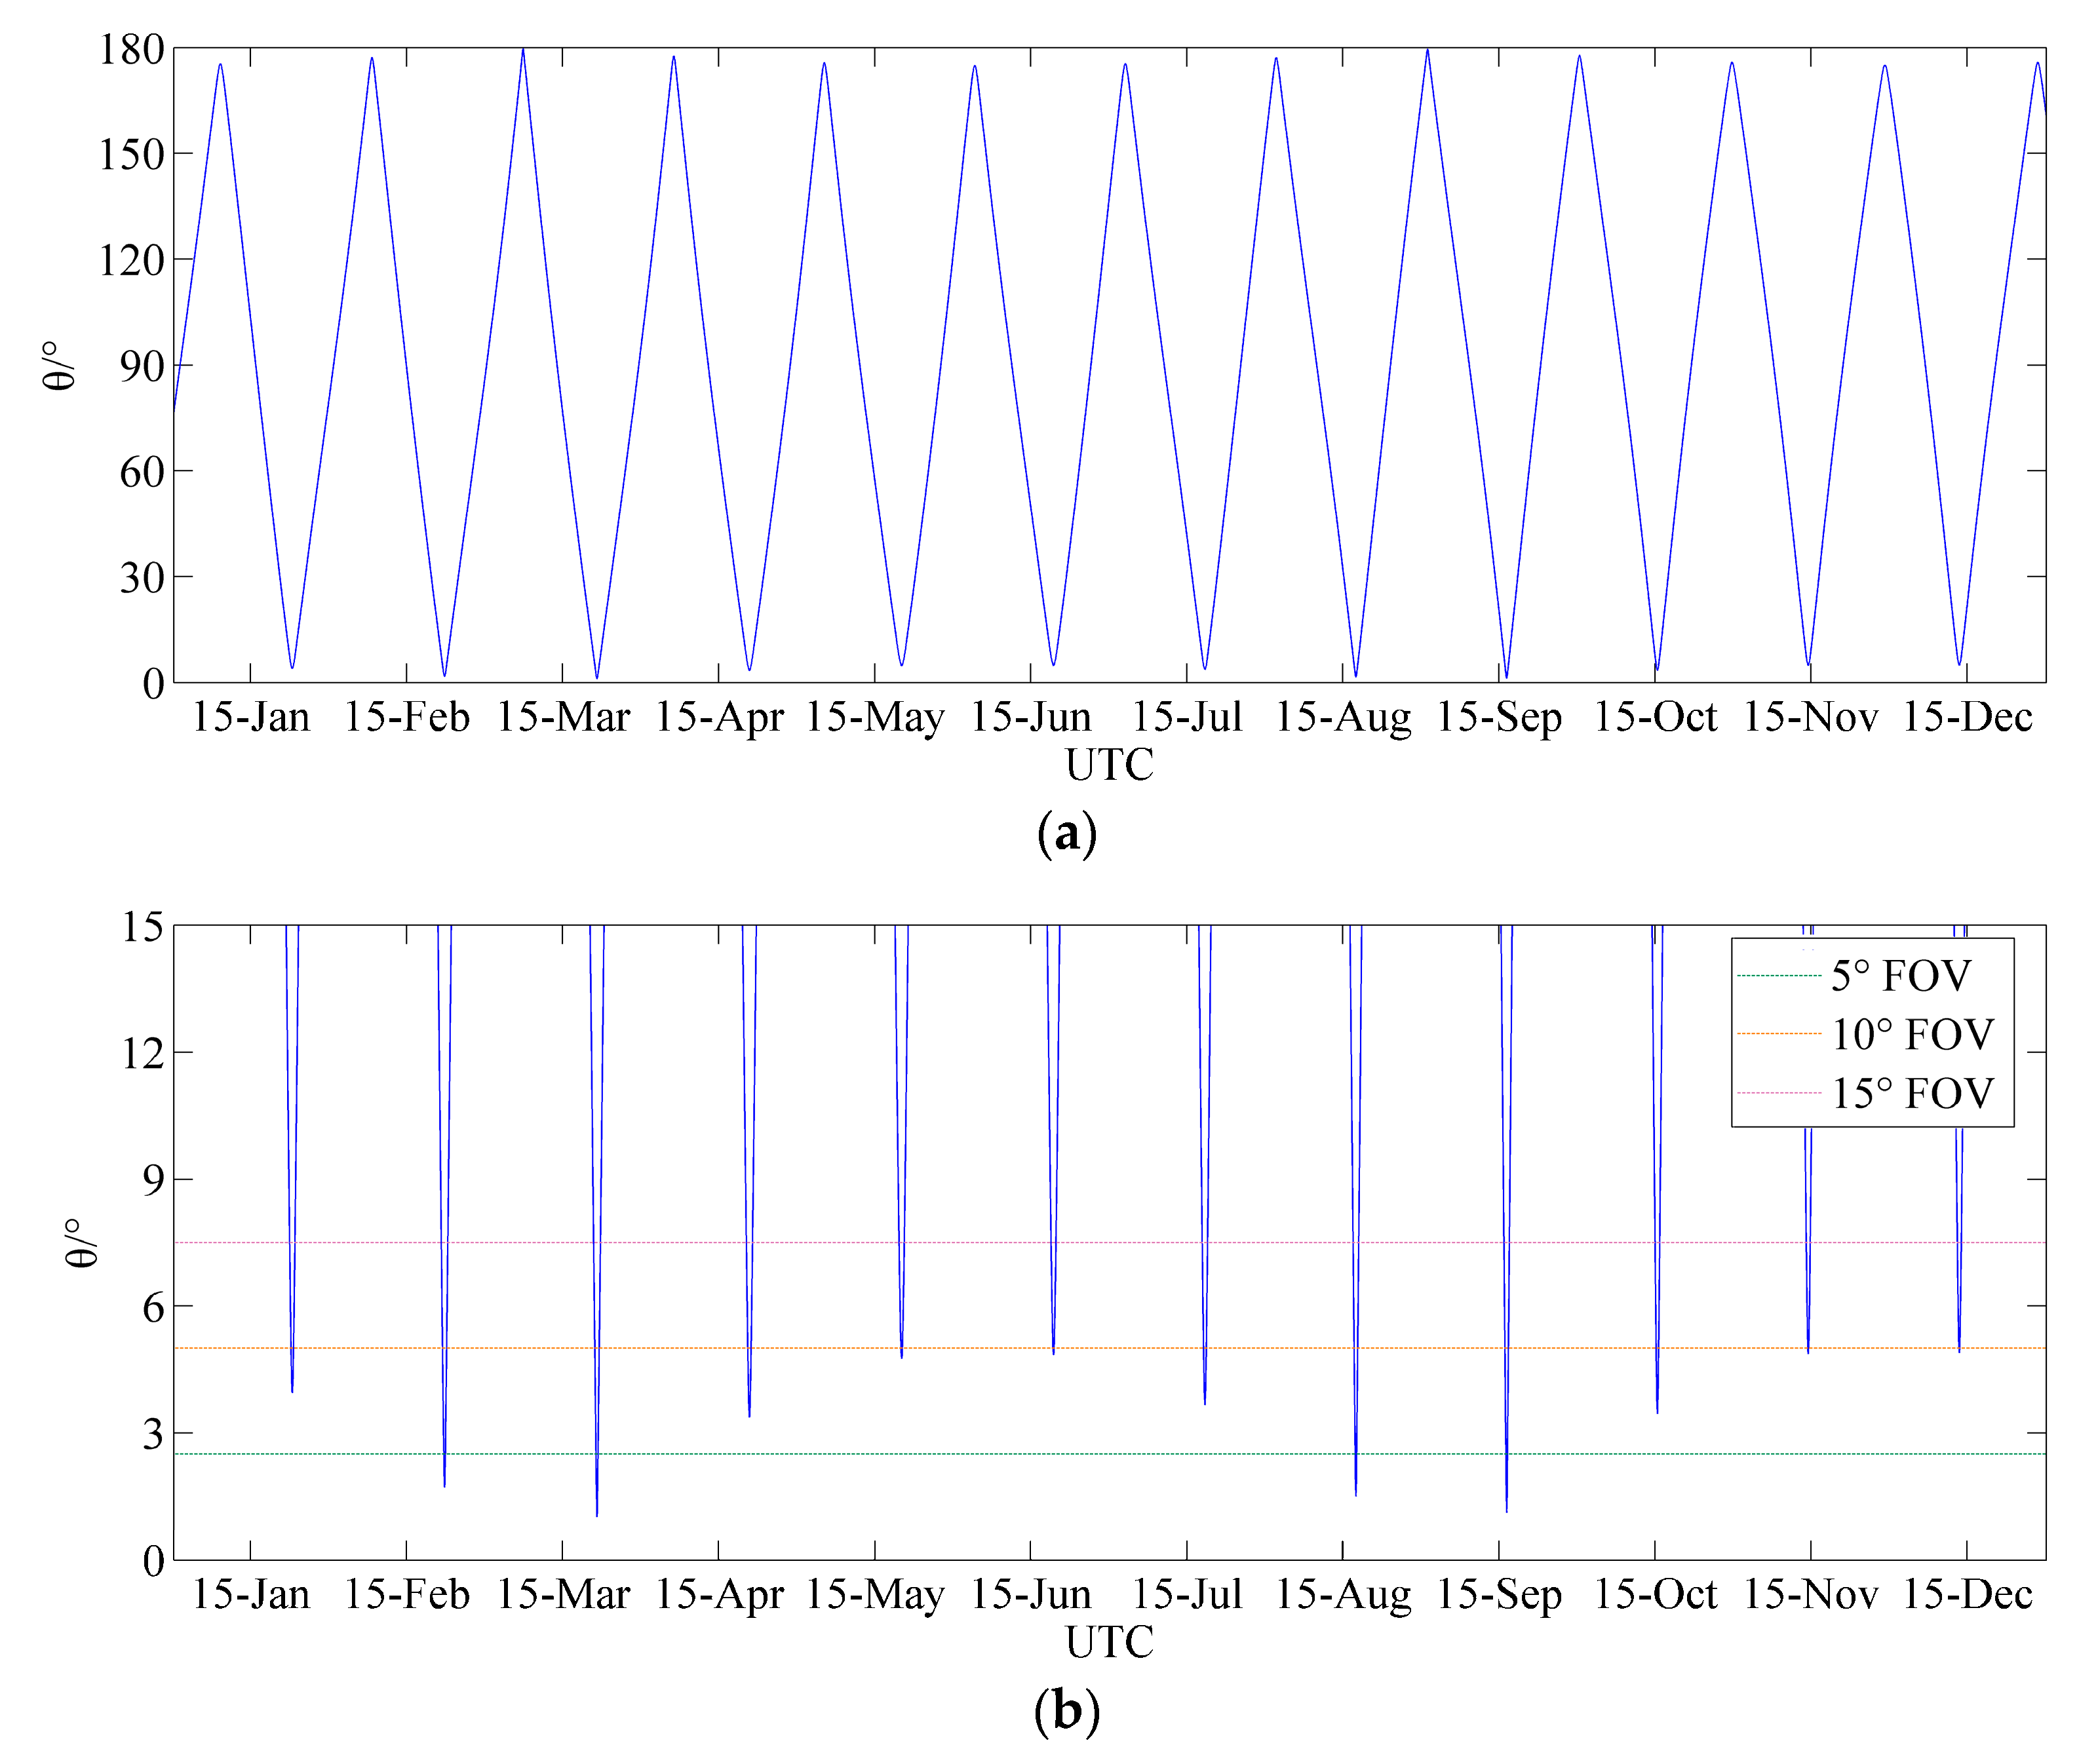
It was found that the angle between the Sun direction and the line-of-sight vector was a dominant factor in determining whether the Sun was in the FOV of the sensor. The variation of this angle showed a 29.5-day cycle and the major reason to affect the solar invasion duration was the FOV of the sensor. When the FOV was larger than 10°, the Sun enters the FOV every orbital period. Further, the solar invasion duration was almost the same when equipping sensors on the permanently Earth-observation region (i.e., 81°S–81°N, 80°W–80°E, as described in the selenographic coordinate system). As for solar invasion radiation, the results showed that both the mean and the standard deviation of the solar invasion radiation variation at the entrance pupil of the sensor was lower at the mid–high latitude regions.
In conclusion, as a consequence of the solar invasion effect analysis, we suggest that the mid–high latitude regions within the permanently Earth-observing region are suitable for equipping Earth observation sensors.


