Article

Aircraft Target Classification for Conventional Narrow-Band Radar with Multi-Wave Gates Sparse Echo Data

Air Force Early Warning Academy, Wuhan 430019, China
*
Author to whom correspondence should be addressed.
Remote Sens. 2019, 11(22), 2700; https://doi.org/10.3390/rs11222700
Submission received: 27 September 2019 / Revised: 12 November 2019 / Accepted: 15 November 2019 / Published: 18 November 2019
(This article belongs to the Special Issue Radar and Sonar Imaging and Processing)

Abstract

:
For a conventional narrow-band radar system, the detectable information of the target is limited, and it is difficult for the radar to accurately identify the target type. In particular, the classification probability will further decrease when part of the echo data is missed. By extracting the target features in time and frequency domains from multi-wave gates sparse echo data, this paper presents a classification algorithm in conventional narrow-band radar to identify three different types of aircraft target, i.e., helicopter, propeller and jet. Firstly, the classical sparse reconstruction algorithm is utilized to reconstruct the target frequency spectrum with single-wave gate sparse echo data. Then, the micro-Doppler effect caused by rotating parts of different targets is analyzed, and the micro-Doppler based features, such as amplitude deviation coefficient, time domain waveform entropy and frequency domain waveform entropy, are extracted from reconstructed echo data to identify targets. Thirdly, the target features extracted from multi-wave gates reconstructed echo data are weighted and fused to improve the accuracy of classification. Finally, the fused feature vectors are fed into a support vector machine (SVM) model for classification. By contrast with the conventional algorithm of aircraft target classification, the proposed algorithm can effectively process sparse echo data and achieve higher classification probability via weighted features fusion of multi-wave gates echo data. The experiments on synthetic data are carried out to validate the effectiveness of the proposed algorithm.

Graphical Abstract

1. Introduction

Aircraft target classification is always a difficult problem for traditional narrow-band radar. Even for the three distinct targets, i.e., helicopter, propeller and jet aircraft, the recognition rate of traditional narrow-band radar is not high in practical applications. The main reasons for target recognition probability deteriorating in traditional narrow-band radar include the following three points: (1) it is limited of range resolution due to the narrow bandwidth of radar transmitting signal; (2) a traditional mechanical scanning radar has a short dwell time, which results in limited azimuth resolution; (3) special circumstances such as data missing increase the difficulty of target classification.
In order to overcome the aforementioned problems, many classification methods have been proposed to improve the aircraft recognition rate. An intuitive idea is to increase the signal bandwidth of the radar system. It is well known that the enlargement of signal bandwidth can improve the range resolution of radar, so wide-band radar can provide more information for target classification. The existing methods of aircraft classification in wide-band radar can be generally divided into three types: (1) methods based on image processing [1,2,3,4,5]. In Reference [6], the extracted image, instead of radar data, was fed into a three-layered feed forward artificial neural network for aircraft classification; (2) methods based on high-resolution range profile (HRRP) [7,8,9,10,11]. Liu et al. [12] proposed a multi-scale target classification method based on the scale-space theory through extracting features from HRRP; and (3) methods based on inverse synthetic aperture radar (ISAR) [13,14,15,16,17]. A shape extraction based aircraft target classification method using ISAR images is proposed in [18]. Although image processing, HRRP- and ISAR-based aircraft classification have achieved good simulation results in wide-band radar, the radar system is more complex and the detectable range is shorter than that in narrow-band radar. Therefore, it is still of great significance to study aircraft classification based on narrow-band radar.
In recent years, many micro-Doppler parameter estimation methods [19,20,21] were designed to tackle the aircraft target classification problem in narrow-band radar. Two techniques of cubic polynomial fitting and three-point models are developed to estimate the micro-Doppler parameters from a fraction of the period in real-world scenarios [22]. In Reference [23] the minimal mean-square error (MMSE)-based method was proposed for estimating the micro-Doppler parameter from a fraction of the period data. Li et al. [24] proposed the parametric sparse representation and pruned orthogonal matching pursuit to the micro-Doppler parameter estimation for target classification and recognition. There are also many methods used in micro-Doppler parameter estimation for aircraft classification, such as time-frequency transform [25,26], continuous wavelet transform [27], Hough transform [25] and so on. However, these methods have the same common problem of inaccurate parameter estimation while the micro-Doppler signal is weak and only single-wave gate echo data is utilized in the aforementioned methods. Moreover, with echo data missing in narrow-band radar, Wang et al. [28] proposed a complex Gaussian model [29] based and factor analysis model [30]-based signal reconstruction methods. On the basis of the complex Gaussian model, the method of directly reconstructing the time-frequency spectrum of the original is proposed in Reference [31]. Although these methods mentioned above can effectively reconstruct the echo signals of aircraft, they have not studied the problem of classification with missing samples.
In addition, for the limited information of narrow-band radar, deep learning and machine learning [32] based methods have also been introduced to aircraft target classification in recent years. One of the most frequently used methods is the convolutional neural network (CNN) [33,34]. A novel landmark and CNN based aircraft recognition method was proposed [35], in which it alleviates the work of human annotation and can be used for any type of aircraft not contained in the training data set without retraining, thus it is highly accurate and efficient. Zuo et al. [36] proposed a deep convolutional neural network (DCNN) [37,38] based aircraft type recognition framework. Additionally, conditional generative adversarial networks [39], a self-organizing neural network [40] and deep belief net [41] have been used in aircraft targets classification. The networks used in the aforementioned methods, as an intelligent technology developed recently, have achieved good performance on aircraft targets classification, but they should be trained with large-scale datasets, which is quite time-consuming to acquire and mark with label, and difficult to practice in radar equipment. Also there is still a certain gap in the actual application of equipment.
In this paper, an aircraft target classification method is proposed for conventional narrow-band radar with multi-wave gates sparse echo data. By contrast with the previous work where there are only extract features from single wave gate echo for aircraft classification [10], the proposed method in this paper uses multiple wave gates echo data for weight feature fusion, and combines sparse theory to improve the probability of target classification in the case of missing data. Firstly, smoothed l 0 norm (SL0) [42] and orthogonal matching pursuit (OMP) [43,44] algorithms are used to reconstruct the sparse echo data in order to solve the low classification probability. Then we analyse the echo data with three kinds of aircraft targets in time domain and frequency domain. According to the difference of micro-Doppler effects [45] of rotating parts due to the difference in structure and rotating speed, features of the amplitude deviation coefficient, time domain waveform entropy and frequency domain waveform entropy are extracted to classify targets. Finally, features extracted from multi-wave gates sparse echo data are weighted and fused to train and test the support vector machine (SVM) [46,47,48] model for classification. Experimental results show that the proposed algorithm can improve the classification probability, and four wave gates echo data in weighted features fusion used to extract features is the optimal wave gate number for target classification.
The rest of this paper is organized as follows. The echo model and reconstruction algorithms are reviewed in Section 2. The proposed algorithm based on multi-wave gates sparse echo data is summarized in Section 3. Section 4 verifies the effectiveness of the proposed algorithm by simulated experiments. Conclusions are presented in Section 5.

2. Reconstruction Algorithm of Sparse Echo Data
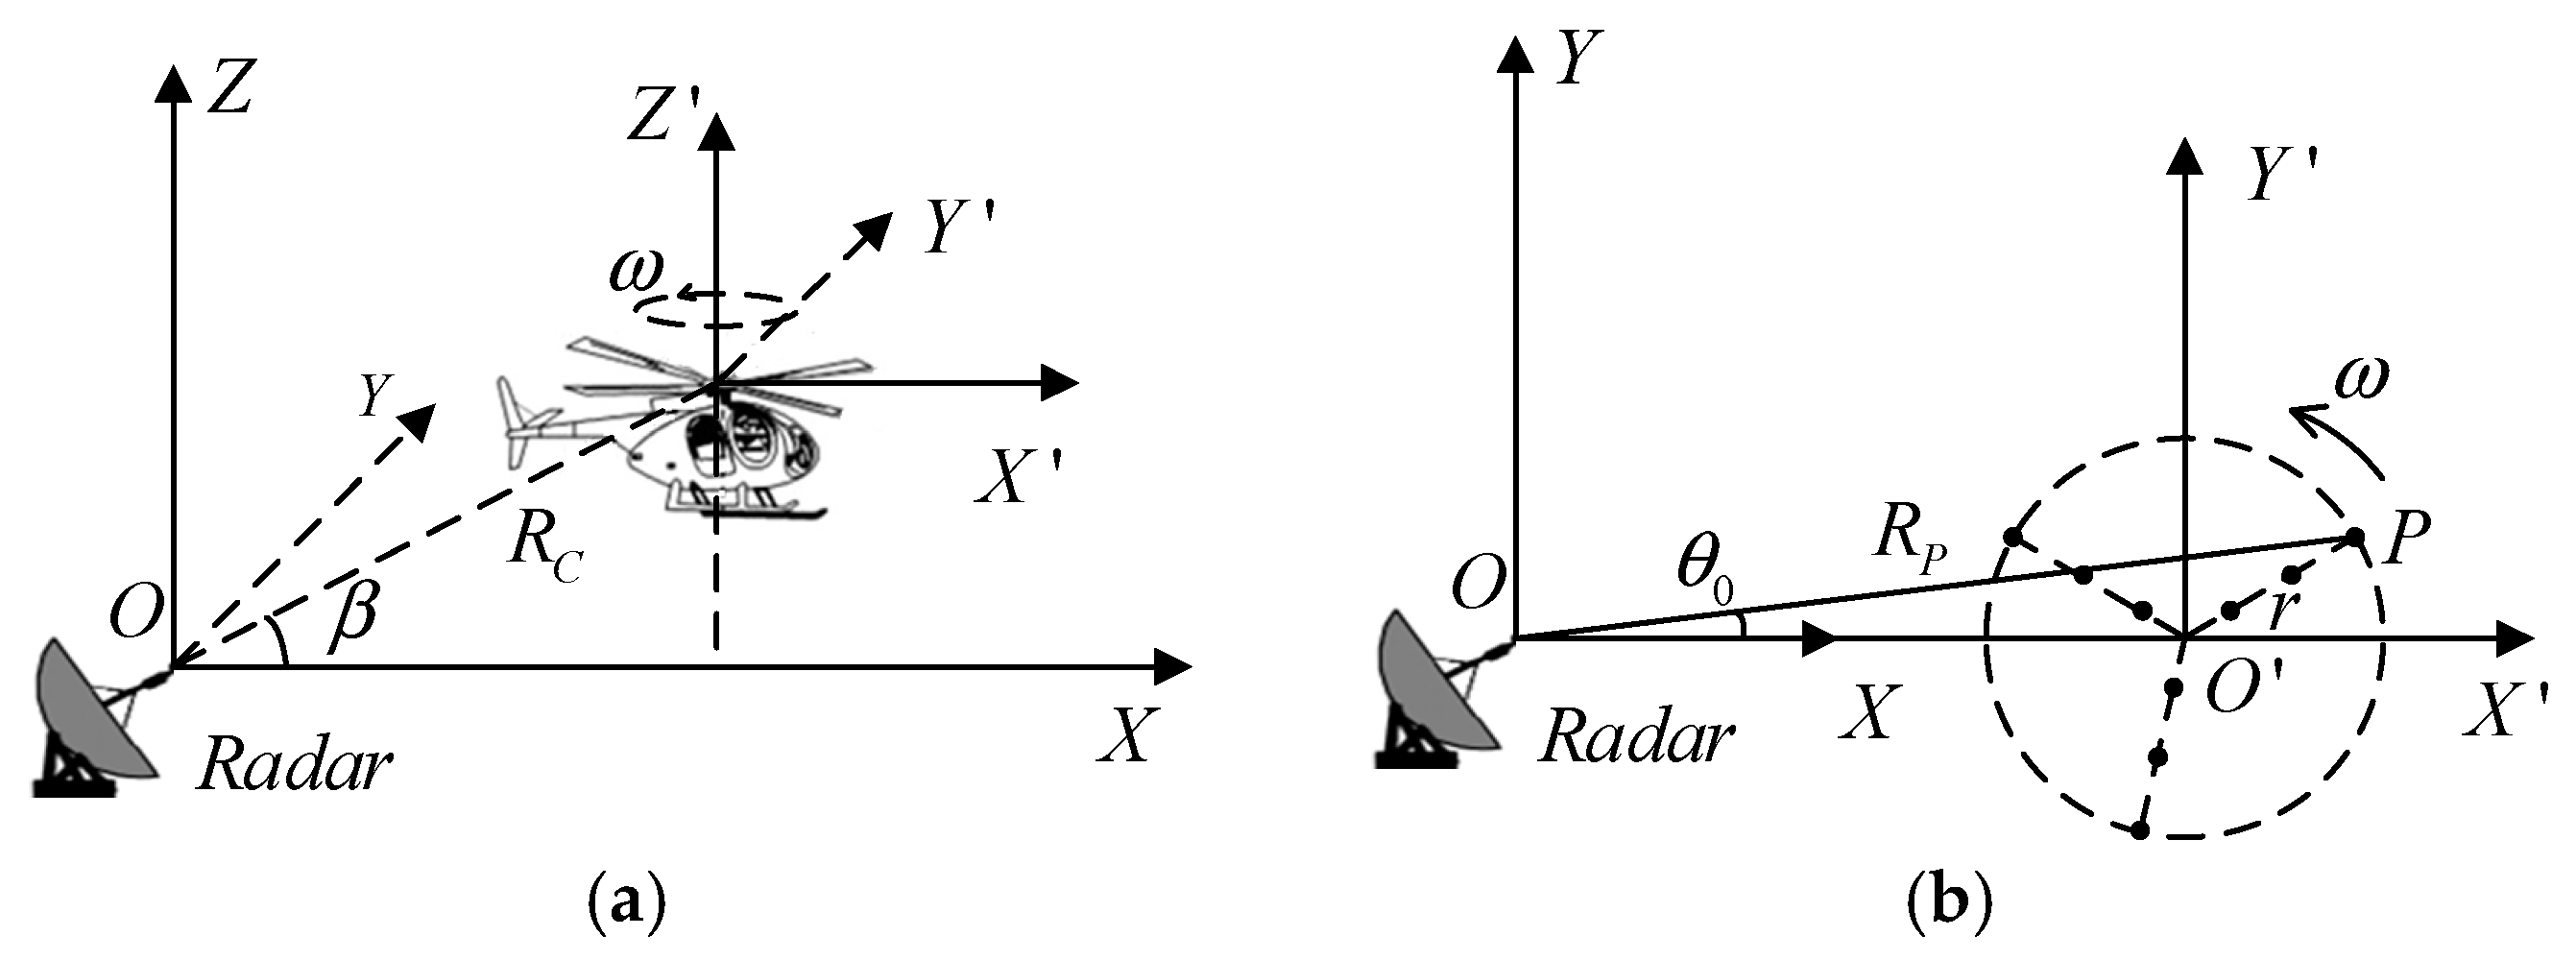
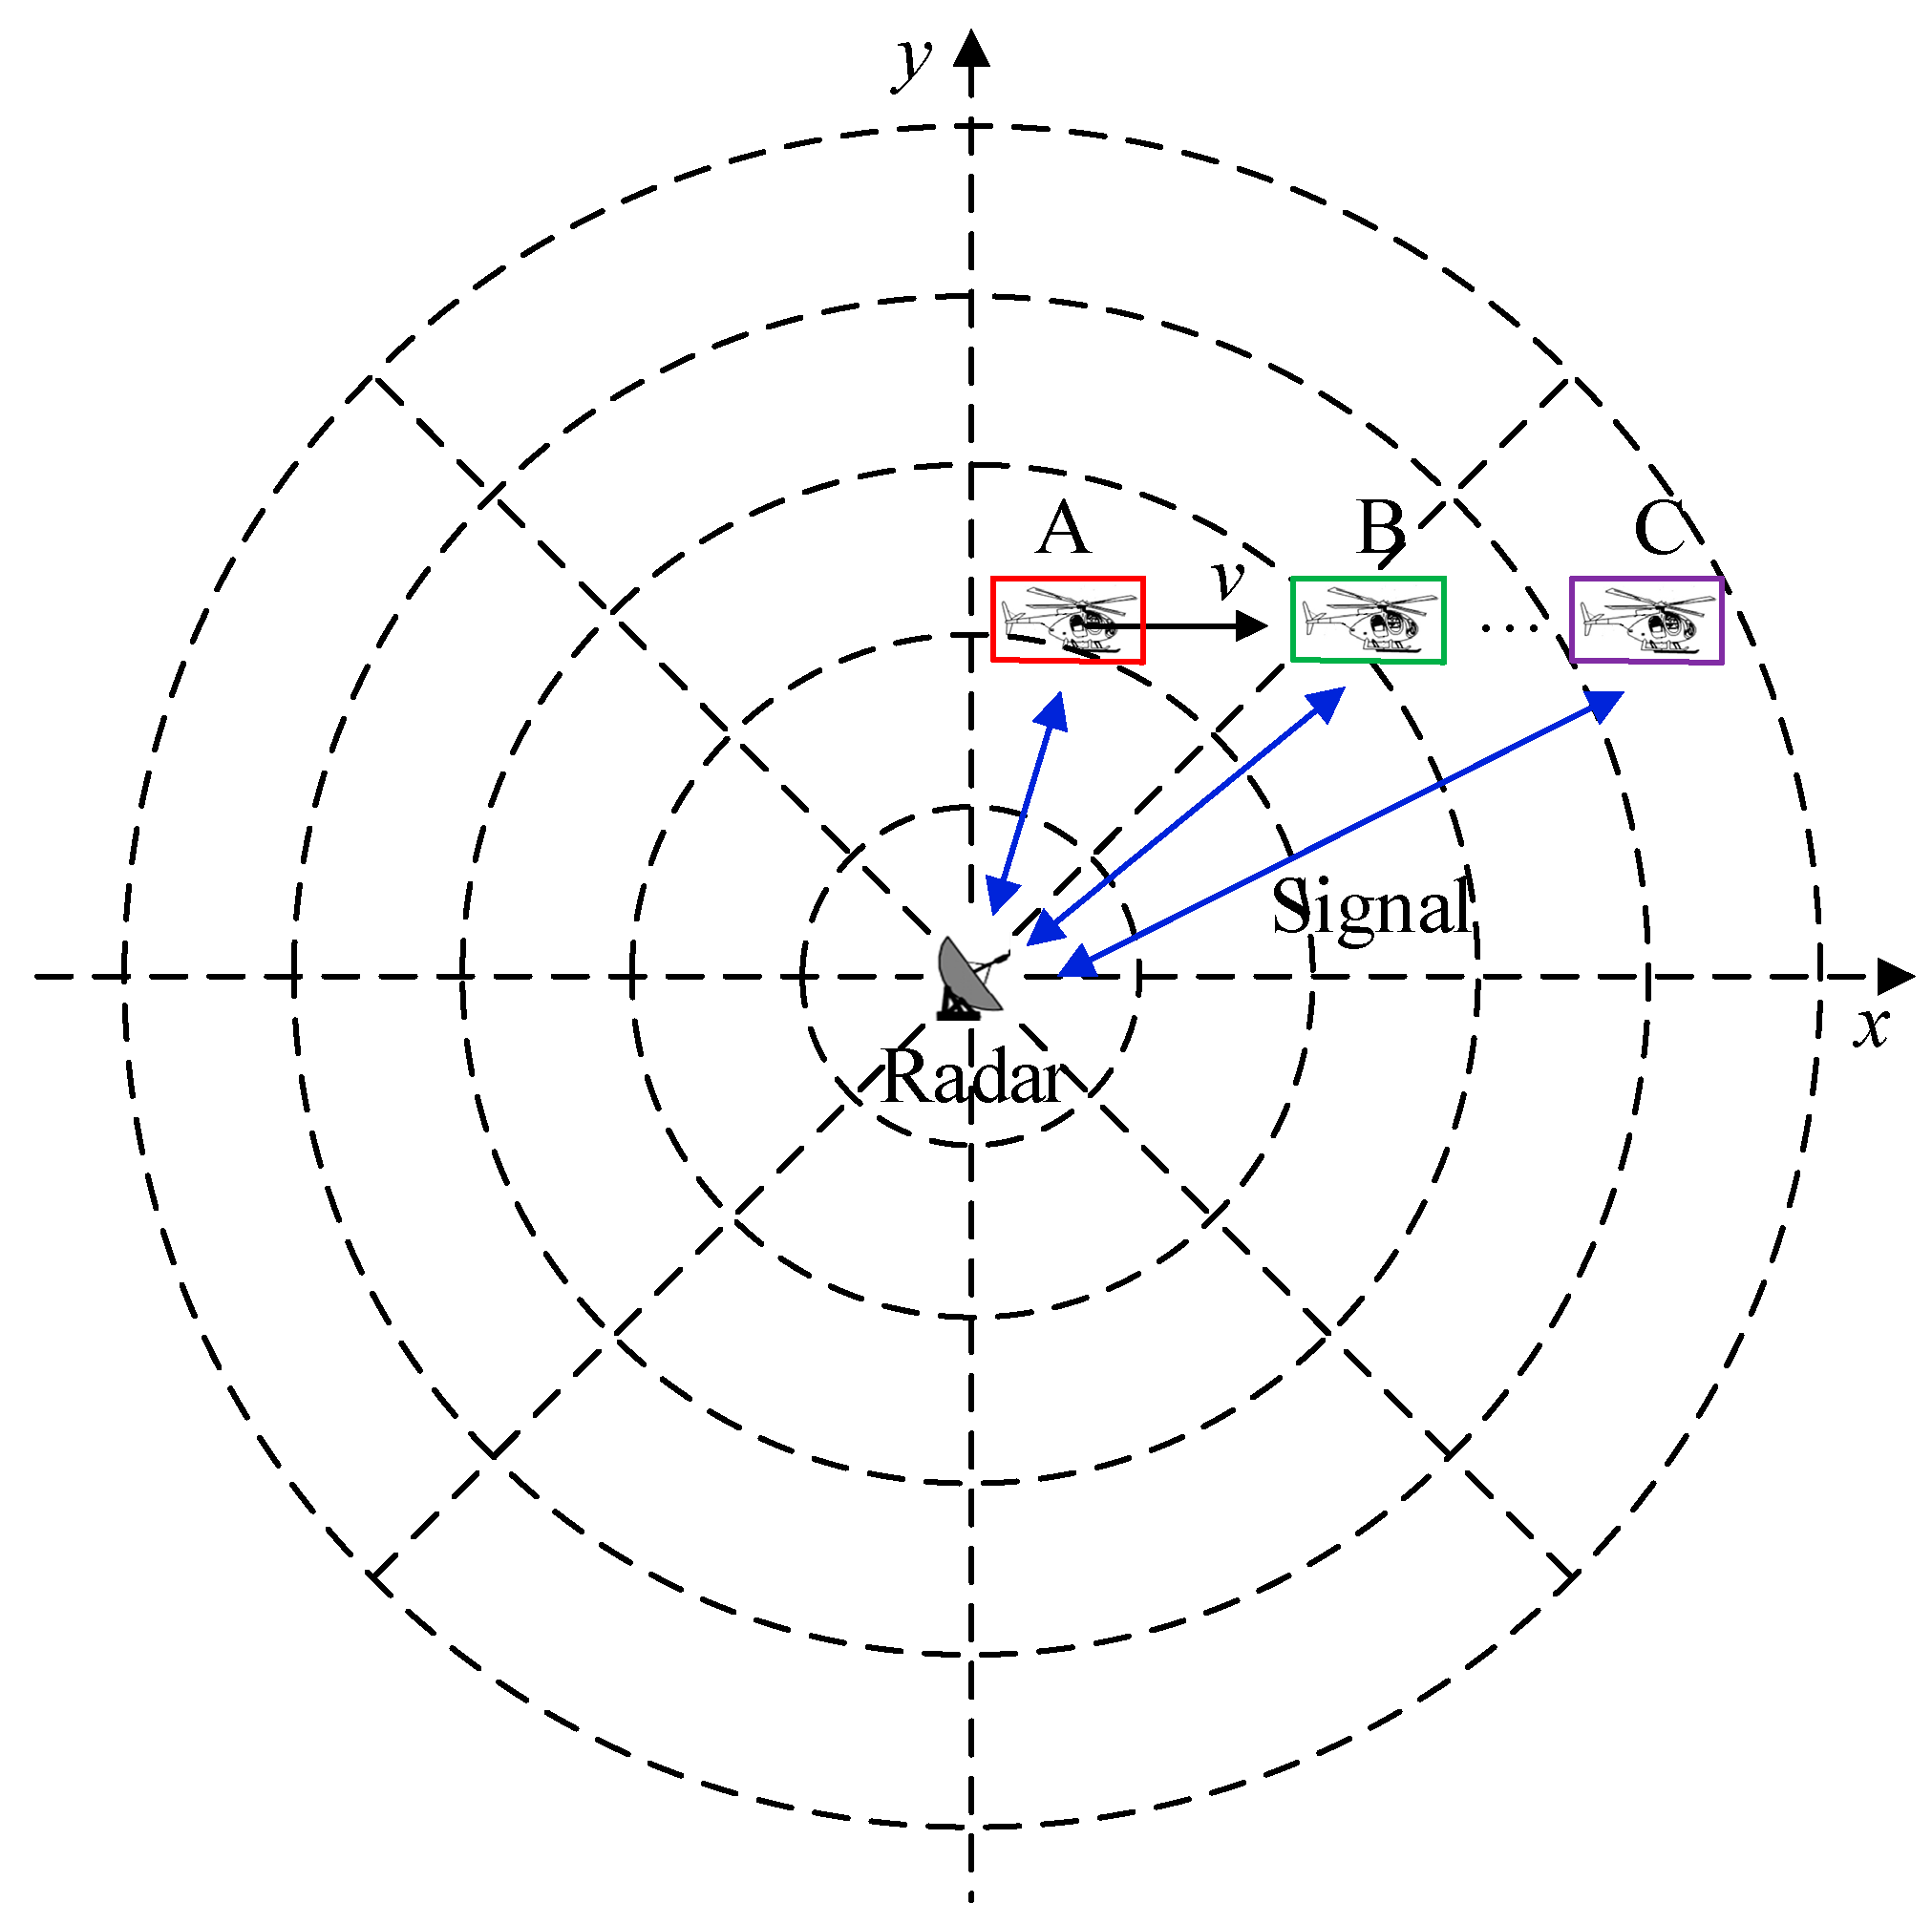
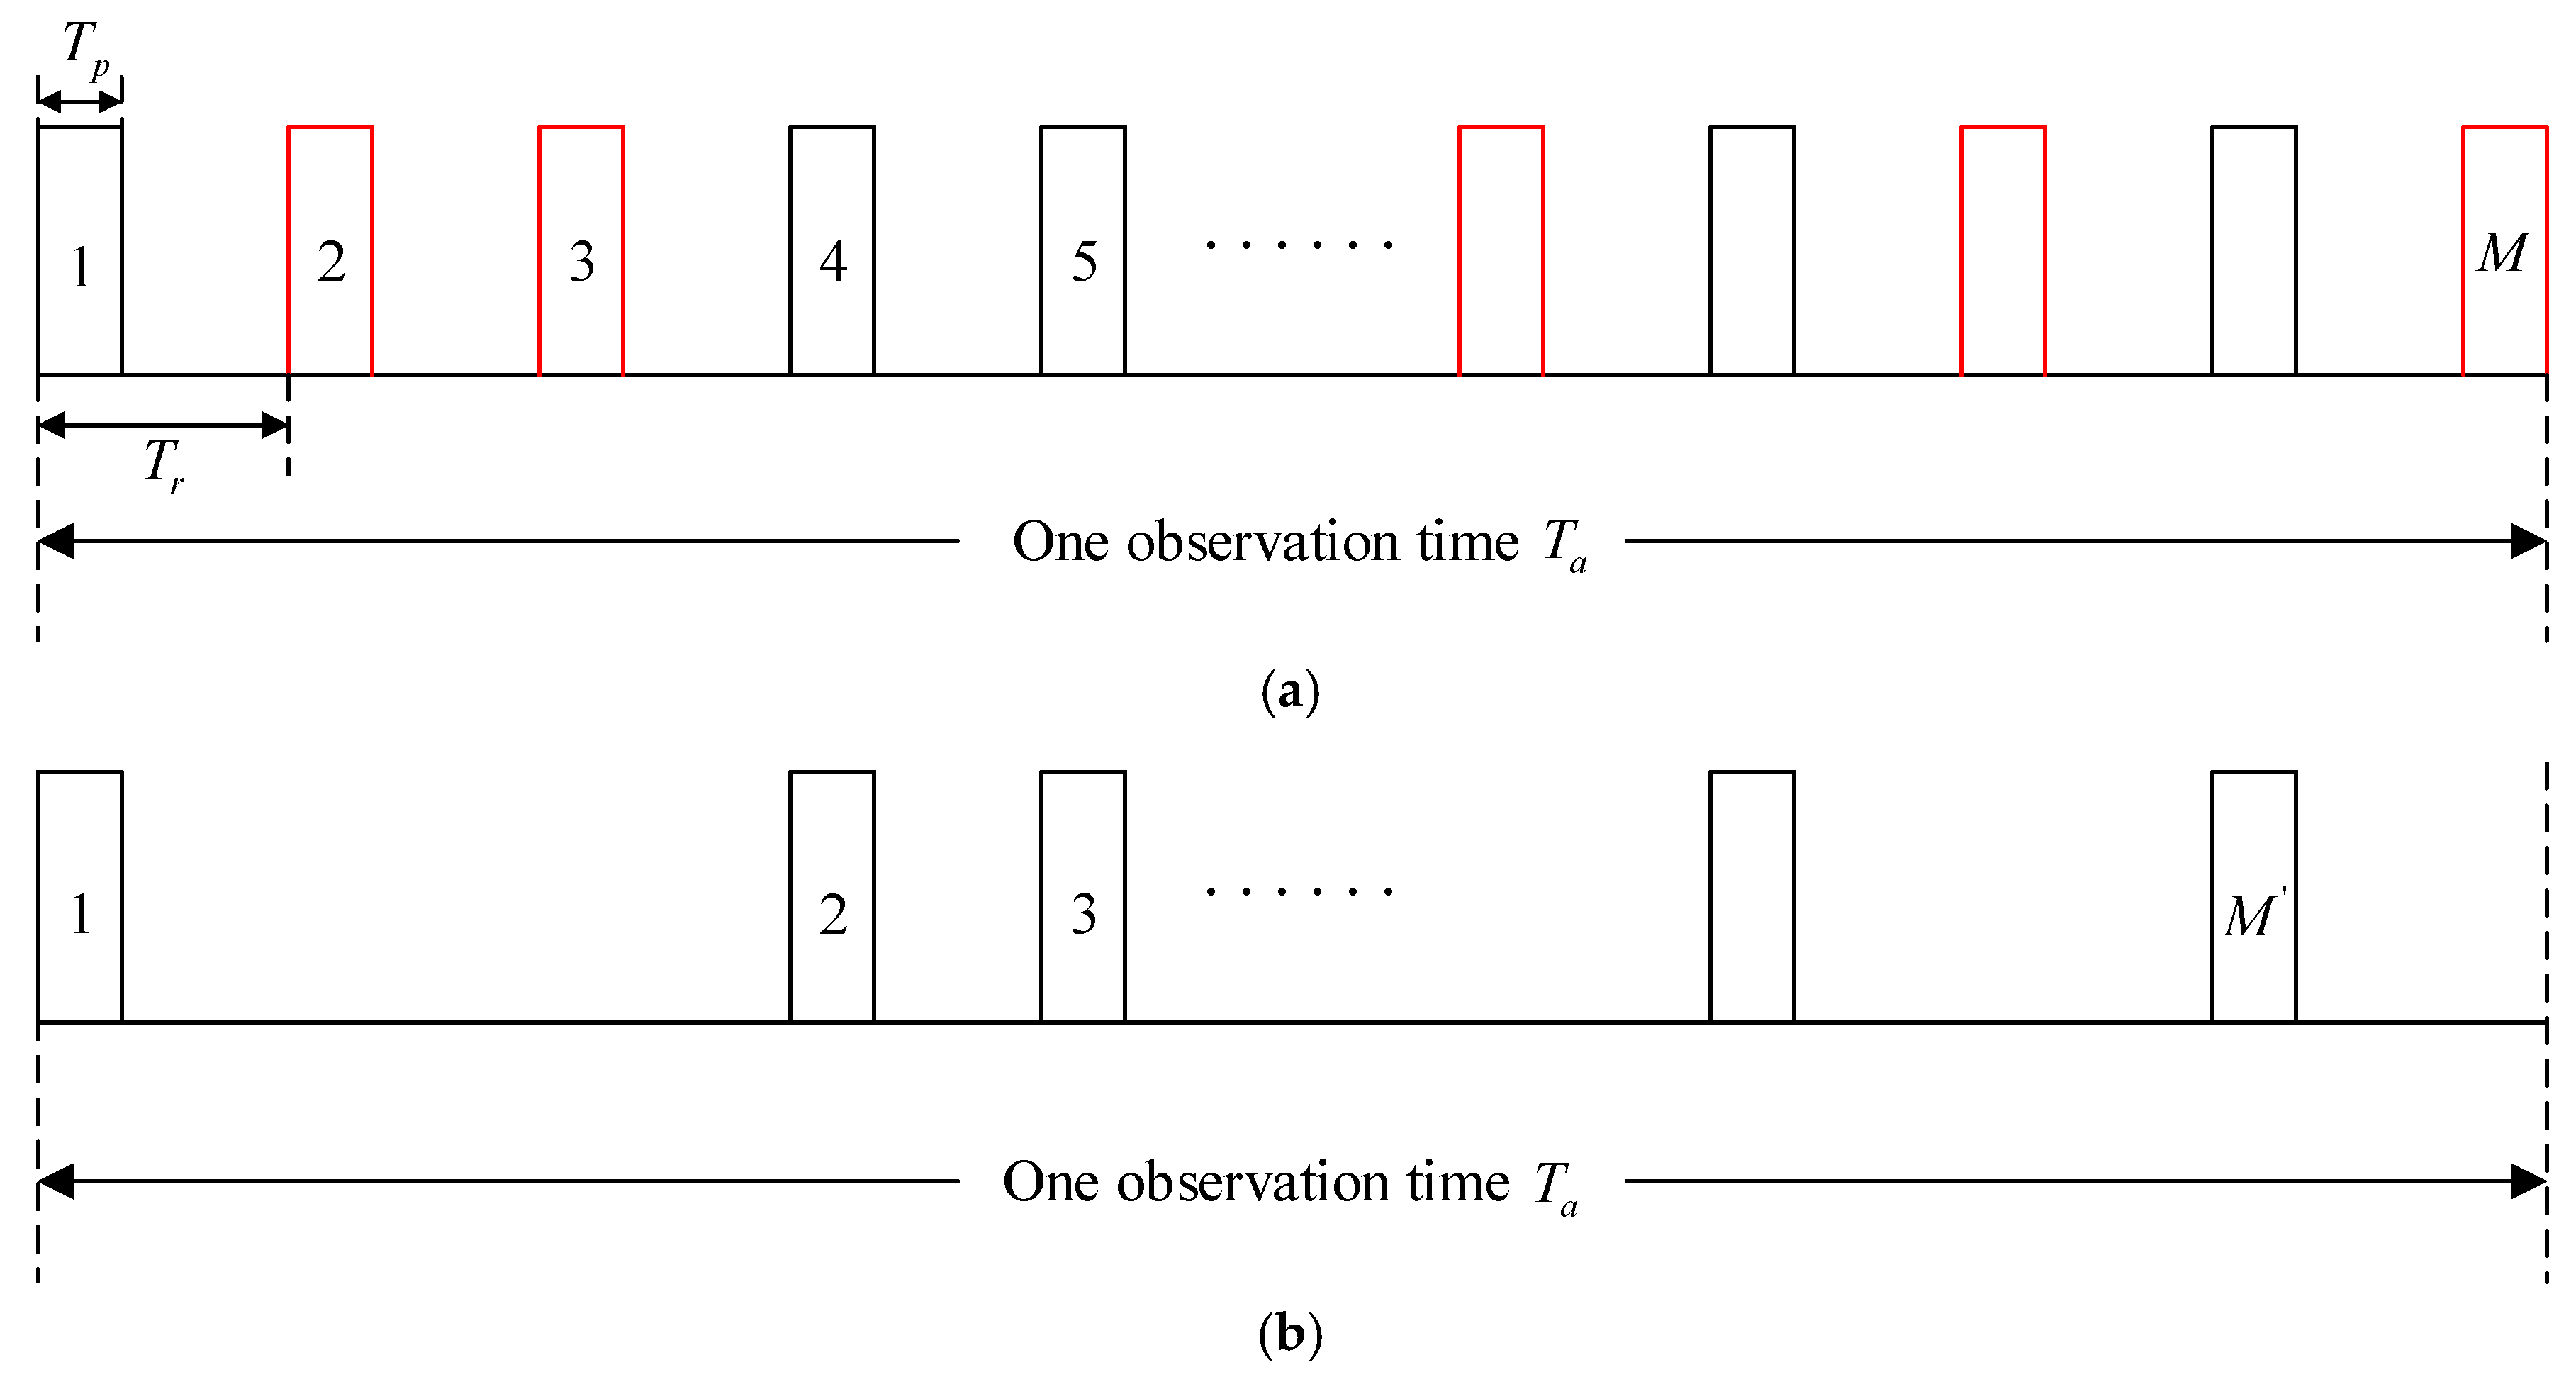
2.1. Echo Model

In narrow-band radar, the signal wavelength is much smaller than the target size, and the received signal by radar is composed of echoes reflected by multiple scattering points. For targets with rotors, such as a helicopter, propeller aircraft and jet aircraft, the echo can reflect not only the translation of scattering points of the fuselage, but also the fretting characteristics of the scattering points of the rotor blades.
Take a helicopter as an example; the special geometry between radar and a helicopter is shown in Figure 1a, in which the distance between the radar and rotor target center is denoted as R C , and the angle of pitch is denoted as β . Considering a 2-D slant-range plane, the simplified geometry is shown in Figure 1b. A radar coordinate system X O Y and target coordinate system X O Y are set up, in which the rotor center is denoted as O . The rotation radius of scattering point P on the rotor blade is assumed to be r —i.e., the distance from P to O is r —and the distance from P to the radar is denoted as R P . The scattering point P rotates around the target coordinate system center O with an angular velocity ω , and the rotation angle at the initial time is denoted as θ 0 . Assume that the radial velocity of the helicopter’s translational motion is v .
In the case of the far field, the instantaneous distance between the scattering point P and the radar can be written as:
R P ( t m ) R C + v t m + r cos ( ω t m + θ 0 ) ,
where t m = m T r is the slow time, m is the m-th echo pulse, and T r is the pulse repetition period.
In this paper, we take the linear frequency modulation (LFM) as the transmitted signal, which can be expressed as:
s t ( t ^ , t m ) = rect ( t ^ / T p ) exp ( j 2 π ( f c t + μ t ^ 2 / 2 ) ) ,
where r e c t ( ) is the rectangular window, t ^ is the fast time, T p is the pulse width, f c is the signal carrier frequency, μ is the chirp rate, t is the total time, and t = t ^ + t m . There are two different time variables t ^ and t in the transmitted signal described in Formula (2), the reason is that the signal carrier frequency f c exists on the whole pulse transmission time axis, while the chirp rate μ is used to adjust the change of Doppler frequency within a pulse. The echo signal of scattering point P can be expressed as:
s r ( t ^ , t m ) = σ rect ( t m / T a ) rect ( ( t ^ 2 R P ( t m ) / c ) / T p ) exp ( j 2 π ( f c ( t 2 R P ( t m ) / c ) + μ ( t ^ 2 R P ( t m ) / c ) 2 / 2 ) ) ,
where σ is the scattering coefficient of the scattering point P , T a is the observation time, and c is the speed of light. The target echo signal after pulse compression can be expressed as:
s P ( t ^ , t m ) = σ T p sin c [ B ( t ^ 2 R P ( t m ) / c ) ] rect ( t m / T a ) exp ( j 4 π R C / λ ) exp ( j 4 π ( v t m + r cos ( ω t m + θ 0 ) ) / λ ) + w ( t ^ , t m )
where B is the signal bandwidth, λ is the wavelength, and w ( t ^ , t m ) denotes the Gaussian white noise signal. By taking the derivative of the phase, the micro-Doppler frequency can be obtained as:
f d P = 1 2 π d ϕ d t m = 1 2 π d [ 4 π ( v t m + r cos ( ω t m + θ 0 ) ) / λ ] d t m = 2 ( v ω r sin ( ω t m + θ 0 ) ) / λ ,
It can be seen from the above formula that the Doppler frequency of the scattering point echo on the target rotor blade is related not only to the radial velocity v of the scattering point echo on the target rotor blade is related not only to the radial velocity of the translational motion, but also to the angular velocity ω of the rotating component and the blade length r . Because the rotational motion of scattering points on the fuselage is negligible, it is equivalent to only translational motion. Therefore, the instantaneous distance between scattering point F on fuselage and the radar can be written as:
R F ( t m ) R C + v t m ,
The echo signal of scattering point F on fuselage after pulse compression can be expressed as:
s F ( t ^ , t m ) = σ T F sin c [ B ( t ^ 2 R F ( t m ) / c ) ] rect ( t m / T a ) exp ( j 4 π R C / λ ) exp ( j 4 π v t m / λ ) + w ( t ^ , t m ) ,
Compared with the echo of blade scatterer in Formula (4), the fuselage echo lacks only the fretting term. In addition, the Doppler frequency of echo is only related to translational radial velocity, that is f d F = 2 v / λ .
The frequency domain echo of helicopter, propeller aircraft and jet aircraft are simulated as shown in Figure 2. The simulation parameters of radar and transmitting signal are set as follows, the pulse repetition frequency F r is 5000 Hz, the pulse-repetition period T r is 0.2 ms , the pulse width T p is 50 μ s , the signal carrier frequency f c of LFM signal is 1 GHz, the signal bandwidth B is 2 MHz, and the observation time T a is 0.05 s. The parameters of three types of aircraft targets are shown in Table 1.
The rotation plane of the helicopter main rotor is parallel to the ground, so the micro-Doppler effect produced can be observed easily by conventional ground radar. It can be seen from Figure 2a that in addition to the fuselage echo, there are strong echo components caused by micro-Doppler motion of rotor blades in the frequency domain echo of the helicopter, and the micro-Doppler spectrum width of the helicopter is higher than that of the propeller in Figure 2b, which is due to the fact that the length of the helicopter rotating parts is significantly longer than that of propeller. In addition, because the rotating plane of the propeller’s engine blade is perpendicular to the flight direction of the aircraft, the blade is easily obscured by the fuselage, and its micro-Doppler effect is relatively weak. Because of the small size of jet engine blades and the particularity of its position, the micro-Doppler effect caused by blade rotation can hardly be observed by ground radar. It can be seen from Figure 2c that the echo of the jet aircraft only contains the fuselage component, but not the micro-Doppler component caused by blade rotation.

2.2. Reconstruction Algorithm

The multi-wave gates echo data can be obtained from the echo reflected by the transmitted signal after encountering the target during each resolution of the radar antenna in the continuous observation of the aircraft target by the radar. The definition of multi-wave gates echo data is shown in Figure 3.
As we can see from Figure 3, it is a radar display that denotes the position relationship between the radar and the aircraft target from the perspective of top view. Let us assume that the aircraft target flies in a positive direction along the x-axis with a velocity of v , and the blue two-way arrow line in the Figure is the signal transmission route. In the rotation of radar antenna, when the aircraft target is seen for the first time, the aircraft target is located at position A , when the antenna comes to the aircraft target after a rotation cycle, the aircraft target is located at position B , the next position is C , and so on. While the radar irradiates the aircraft target, it will receive the echo data in the area, marked by red, green and purple square boxes in this Figure, where the aircraft target is located, and we count it as a wave gate echo. After multiple irradiations, we can obtain multi-wave gates echo data.
It is difficult for conventional narrow-band radar to obtain continuous observation of the same target for a long time, and it may lead to the loss of target echo pulse in one observation time which can be called sparse echo data. The description of complete and sparse echo data are shown in Figure 4.
As we can see from Figure 4a, there are M received echo pulses in one observation time which are called the single-wave gate echo data, among which the pulses marked in red randomly indicate the echo data that may be lost when the radar receives the echo. From Figure 4b, it can be seen that the number of pulses of sparse echo data is less than that of complete echo data in one observation time, we can also say that less echo information is available in sparse echo data, which is not conductive to aircraft target classification. Therefore, it is feasible and necessary to reconstruct sparse echo data by appropriate sparse signal recovery methods.
Since the emergence and development of compressed sensing (CS) [49,50] technology, sparse signal recovery algorithms have mainly been divided into greedy algorithms, non-convex function minimization algorithms, and Bayesian algorithms. The most typical and widely used greedy algorithm is orthogonal matching pursuit (OMP), which finds the best matching dictionary unit by solving the maximum inner product of the residual and the dictionary matrix, then obtains the approximate value of the sparse vector by using the least square method, and finally obtains the reconstruction signal by alternately updating the support set and solving the sparse vector. The smoothed l 0 norm (SL0) algorithm is one of the most famous non-convex function minimization algorithms, which transforms the l 0 norm minimization problem into an optimization problem by introducing a smooth Gaussian function to approach the l 0 norm. The reason for doing this is that we can avoid the non-deterministic polynomial (NP) time hard problem caused by the direct solution of l 0 norm minimization. Therefore, we use the SL0 and OMP algorithms to reconstruct the sparse echo signal, respectively in this paper.
Assuming that the number of pulses of sparse echo data is M , and the typical model of CS can be expressed as:
Y = Φ X ,
where Y is an M × 1 measurement vector. Actually, Y is the superposition of sparse echo data of scattering point and fuselage, which can be expressed as:
Y = s P ( t m ) + s F ( t m ) m = 1 , 2 , , M ,
Φ is an M × N dictionary matrix, and X is an N × 1 sparse vector to be determined. According to CS theory, the sparse solution X can be obtained by:
X ^ = arg min X X 0 s . t . Y Φ X 2 2 ε ,
where 0 and 2 donate L 0 and L 2 norms respectively, ε is the error threshold in the sparse recovery processing. The solution for (10) can be obtained by the SL0 and OMP algorithms through iteration. The main steps of the two algorithms are summarized in Table 2 and Table 3.
SL0 and OMP algorithms are used to reconstruct the sparse frequency domain echoes of three types of aircraft targets. In order to simulate the sparse echo data in real radar equipment, we randomly cut half of the pulses in the complete echo data as sparse echo data in this paper, that is the pulse number of sparse echo data equals M = M / 2 . The reconstructed results of SL0 and OMP algorithms are shown in Figure 5 and Figure 6, respectively, where the dictionary matrix is the Fourier transform matrix because the time domain echoes are reconstructed to obtain the frequency domain echoes in this paper and the error threshold is set as ε 0 = 0.05 Y 2 2 , that is the iteration process is stopped when the residual energy is equal to or smaller than 5% of the received signal energy. Comparing the complete frequency domain echoes in Figure 2, we can see that SL0 and OMP algorithms can realize the reconstruction of sparse echo data. Compared with the reconstructed results of SL0 and OMP algorithms in Figure 5 and Figure 6, it can be seen that the reconstructed result of SL0 algorithm is better than the OMP algorithm in the similarity to the complete frequency domain echo of Figure 2. The echo data reconstructed by these two algorithms are used to extract features, and the simulation experiment of classification probability will be given in Section 4.

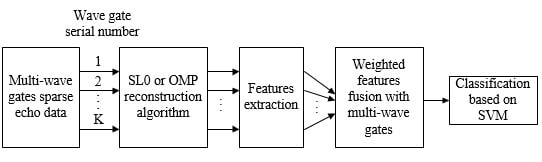
3. Classification Algorithm Based on the Weighted Features Fusion of Multi-Wave Gates

By analyzing the characteristics of the helicopter, propeller aircraft and jet aircraft in time and frequency domains, we can classify three kinds of aircraft targets through the micro-Doppler effect caused by rotating parts due to the difference in structure and rotating speed.

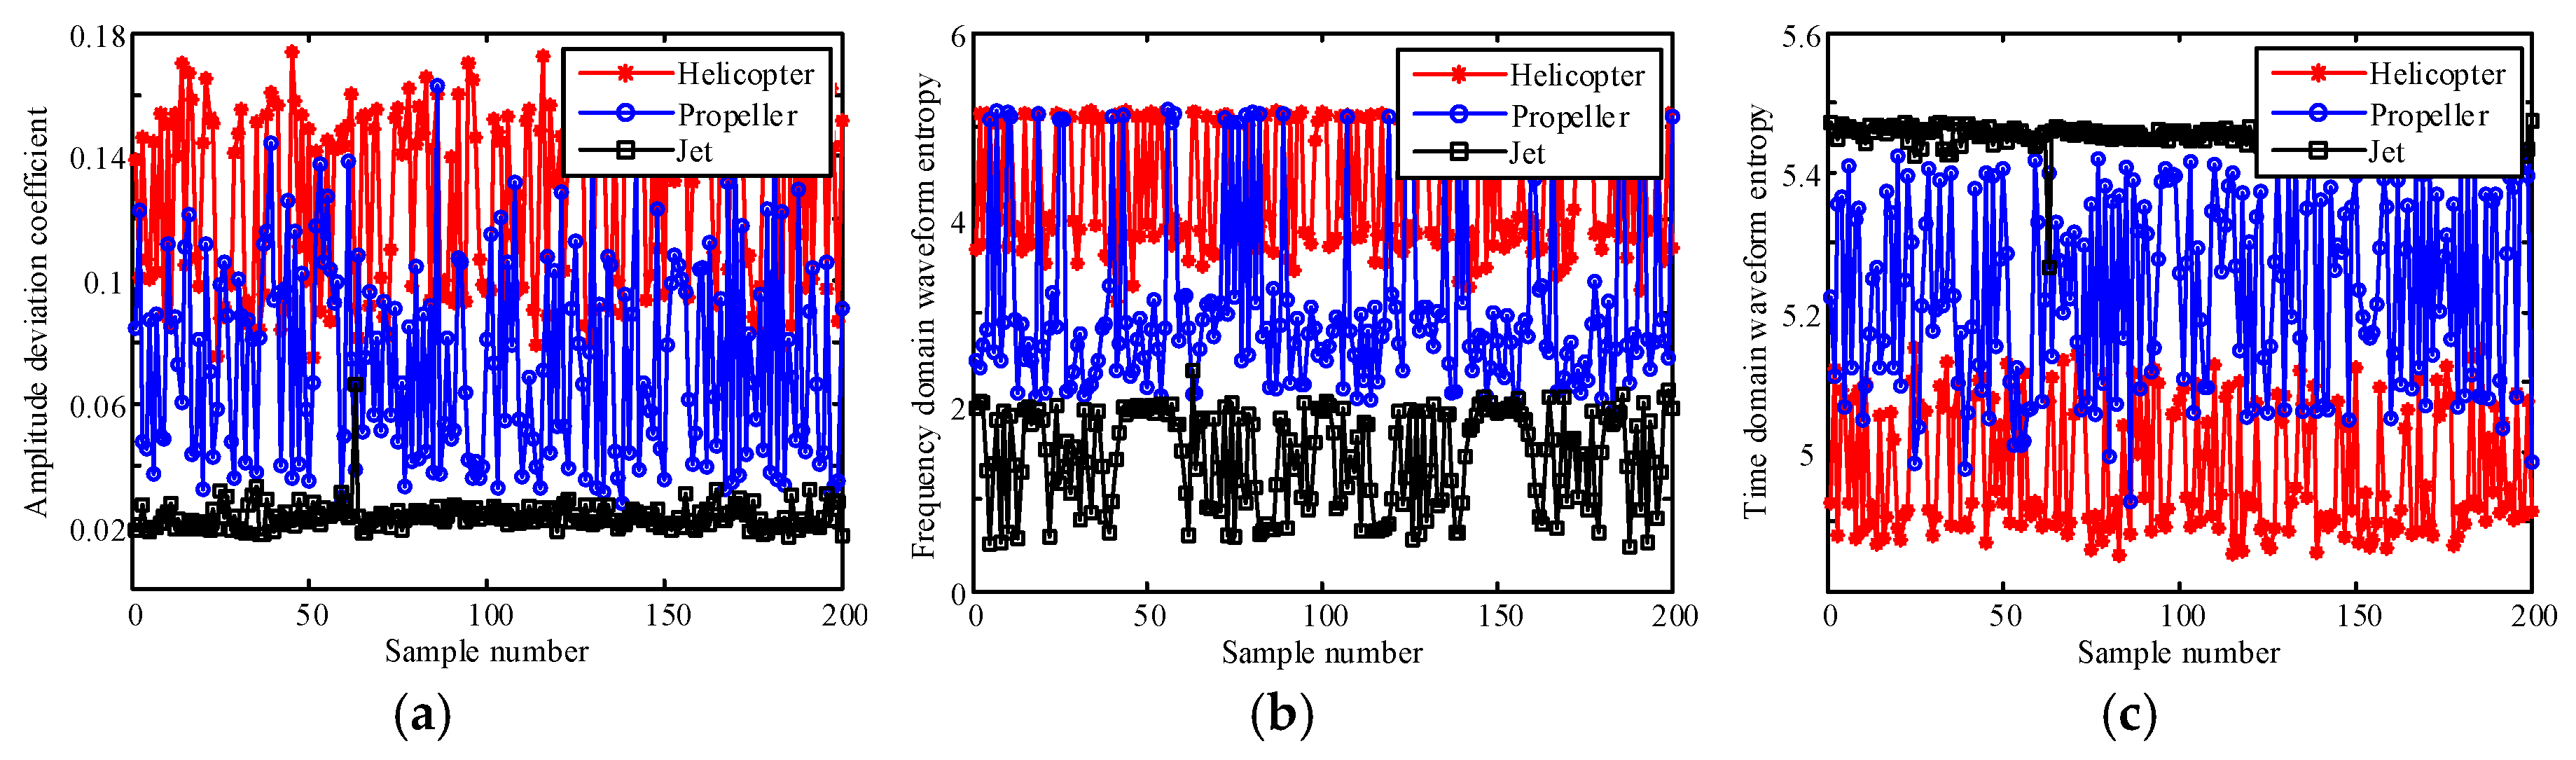
3.1. Features Extraction

According to the difference of echoes in time domain and frequency domain, this paper classifies three types of aircraft targets by extracting amplitude deviation coefficient, time domain waveform entropy and frequency domain waveform entropy. Three feature extraction methods are described as follows:
1. Amplitude deviation coefficient
The amplitude deviation coefficient g y of the discrete echo signal Y = { y i } , i = 1 , 2 , , M reflects the proportional relationship between the rotating parts of an airplane target and its fuselage, which can be defined as:
g y = σ y / Y ¯ ,
where gy denotes the amplitude deviation coefficient, σ y = i = 1 M ( y i Y ¯ ) 2 / ( M 1 ) is the variance of echo amplitude, Y ¯ = i = 1 M y i / M is the mean of echo amplitude, M is the length of the echo signal.
Generally speaking, the higher the complexity of the target structure, such as the helicopter and propeller aircraft, the larger the proportion of the micro-Doppler modulation component of the rotating parts to the radar echo, the greater the overall fluctuation of the echo amplitude and the larger the amplitude deviation coefficient of the echo.
2. Waveform entropy
Waveform entropy is usually used to describe the waveform characteristics of radar echo signals. From the analysis of Section 2, it can be seen that there are differences in the blade’s number, length and rotating speed of the rotating parts in helicopter, propeller aircraft and jet aircraft, so the micro-Doppler effect of the rotating parts is different in the echo waveform. Therefore, we can distinguish the difference of waveform between different targets by extracting waveform entropy in time domain and frequency domain.
Time domain waveform entropy E t and frequency domain waveform entropy E f of echo signal are defined as follows:
E t = i = 1 M p i log 10 ( p i ) ,
E f = i = 1 M q i log 10 ( q i )
where p i = y i / j = 1 M y j and q i = f i / j = 1 M f j are normalized signals in time domain and frequency domain respectively, F = { f i } , i = 1 , 2 , M is the result of fast Fourier transform (FFT) of echo signal Y .
In this paper, three kinds of aircraft target echo models are established, and the time domain and frequency domain echoes of targets are simulated according to the parameters of the rotor in Table 1. Then, the amplitude deviation coefficient, time domain waveform entropy and frequency domain waveform entropy are extracted. We simulate 200 sparse echo signal samples of three types of aircraft targets respectively from different radar perspectives where one sparse echo signal sample corresponds to one observation angle which denotes the relationship between the aircraft target’s flying direction and the radar’s line of sight, and it changes uniformly from 0 ° to 360 ° at an interval of 1.8 ° . Therefore, the angle varies from different samples, and the dataset includes 600 samples in all. The results of features extracted from 600 sparse echo signal samples are shown in Figure 7, where the signal to noise ratio (SNR) of target echo before pulse compression is −13dB, which is defined as SNR = Y 2 2 / ( M σ 2 ) , where σ 2 is the variance of noise.
As can be seen from the above figure, in the case of SNR it is −13 dB, because of the difference among the rotating parts of three types of aircraft targets, the amplitude deviation coefficient, time-domain waveform entropy and frequency-domain waveform entropy are different among targets. Taking the amplitude deviation coefficient as an example, it can be seen from Figure 7a that the amplitude deviation coefficients extracted from the echoes of three kinds of targets have cross-values, which will inevitably lead to erroneous judgment in the process of target classification and reduce the classification probability. The reason may be the low SNR or the change of the angle of view between the aircraft and the radar, which results in small fluctuation of the extracted features. However, we can also see from the graph that the mean values of each feature differ greatly among the three kinds of aircraft targets and are more stable than those extracted from each sparse echo signal sample. Therefore, we need to adopt appropriate methods to make the features extracted from each sparse echo signal sample close to the mean value, so as to eliminate the impact of the target echo fluctuation model and improve the classification probability of the aircraft targets.

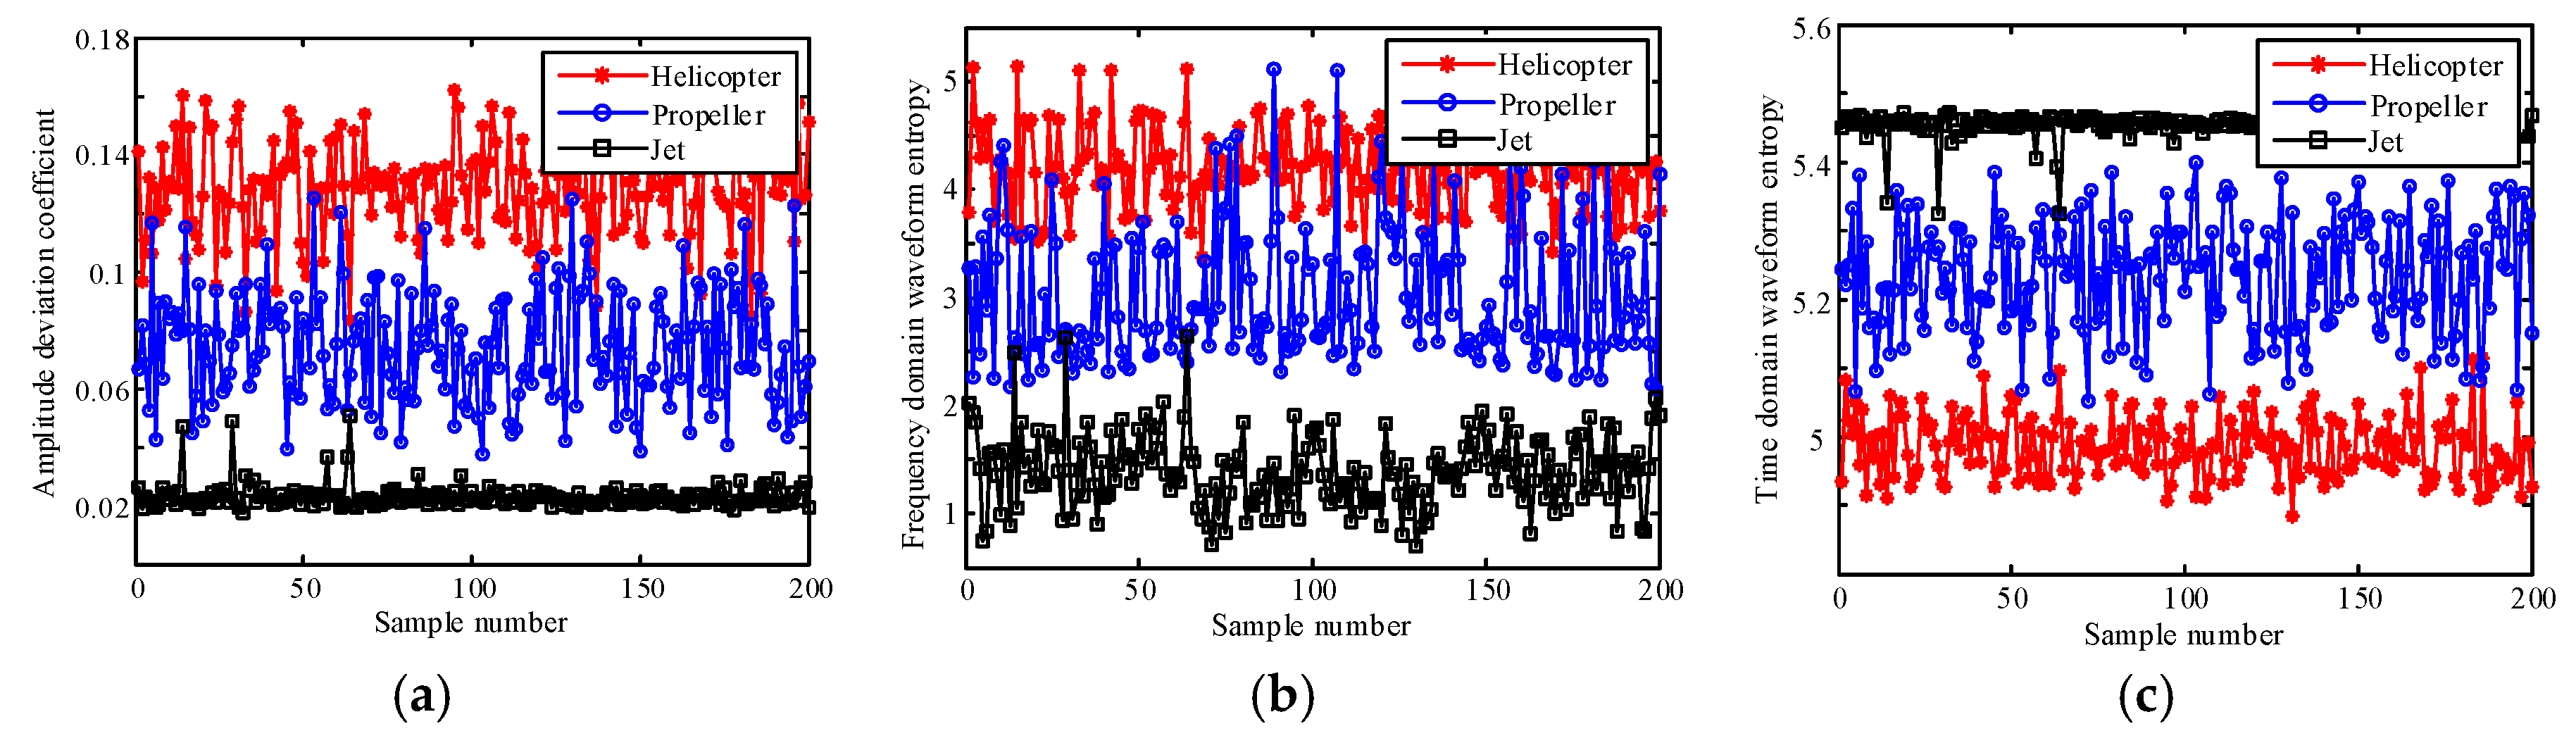
3.2. Weighted Features Fusion

On the basis of the above simulation analysis, we propose a target classification algorithm based on the weighted features fusion of multi-wave gates sparse echo data. This algorithm uses multi-wave gates echo data to extract features, which are fused by weighting to improve the correct classification probability. The fused features can be expressed as:
F ˜ = i = 1 K α i F i ,
where F ˜ is the fused feature, F i is the feature extracted from the echo data of the i-th wave gate, K is the number of gates for feature fusion, α i is the weight of the i-th wave gate feature.
In this paper, we consider that the features extracted from different gates have the same contribution to aircraft target type classification. Therefore, we adopt the same weighting value for feature fusion, that is to say, the weights α i = 1 / K . In Section 3.1, we simulate 200 single-wave sparse echo signal samples of one aircraft target where one sparse signal sample corresponds to one radar observation angle. While in the simulation experiment of weighted features fusion, we collect four-wave gates sparse echo data at each radar observation angle which is set the same as that in Section 3.1 during the observation of the aircraft target. That is to say, in each observation angle, we reconstruct four-wave gates sparse echo signal samples, then extract the features from each reconstructed sample and fuse them as a fusion feature. Therefore, each type of feature consists of 200 fusion features for each aircraft target. Figure 8 shows the result of the fusion features extracted and fused from four wave gates echo data. Compared with Figure 7, the cross-value of extracted features between different targets is significantly reduced under the same SNR, we can also say that the fused features are more clustered near the mean of all samples.
We know that variance is a measure of the degree of dispersion of a set of data. In this paper, we calculate the variance of the fused features extracted from four wave gates sparse echo data with SNR is −13 dB, which is shown in Table 4. For comparison, we also compute the variance of the features that are not fused. We can see from Table 4 that the variance of the fused features is less than that of the features without fusion, no matter which kind of feature. In other words, fusion of extracted features is more conducive to distinguishing the three types of aircraft targets mentioned in this paper.

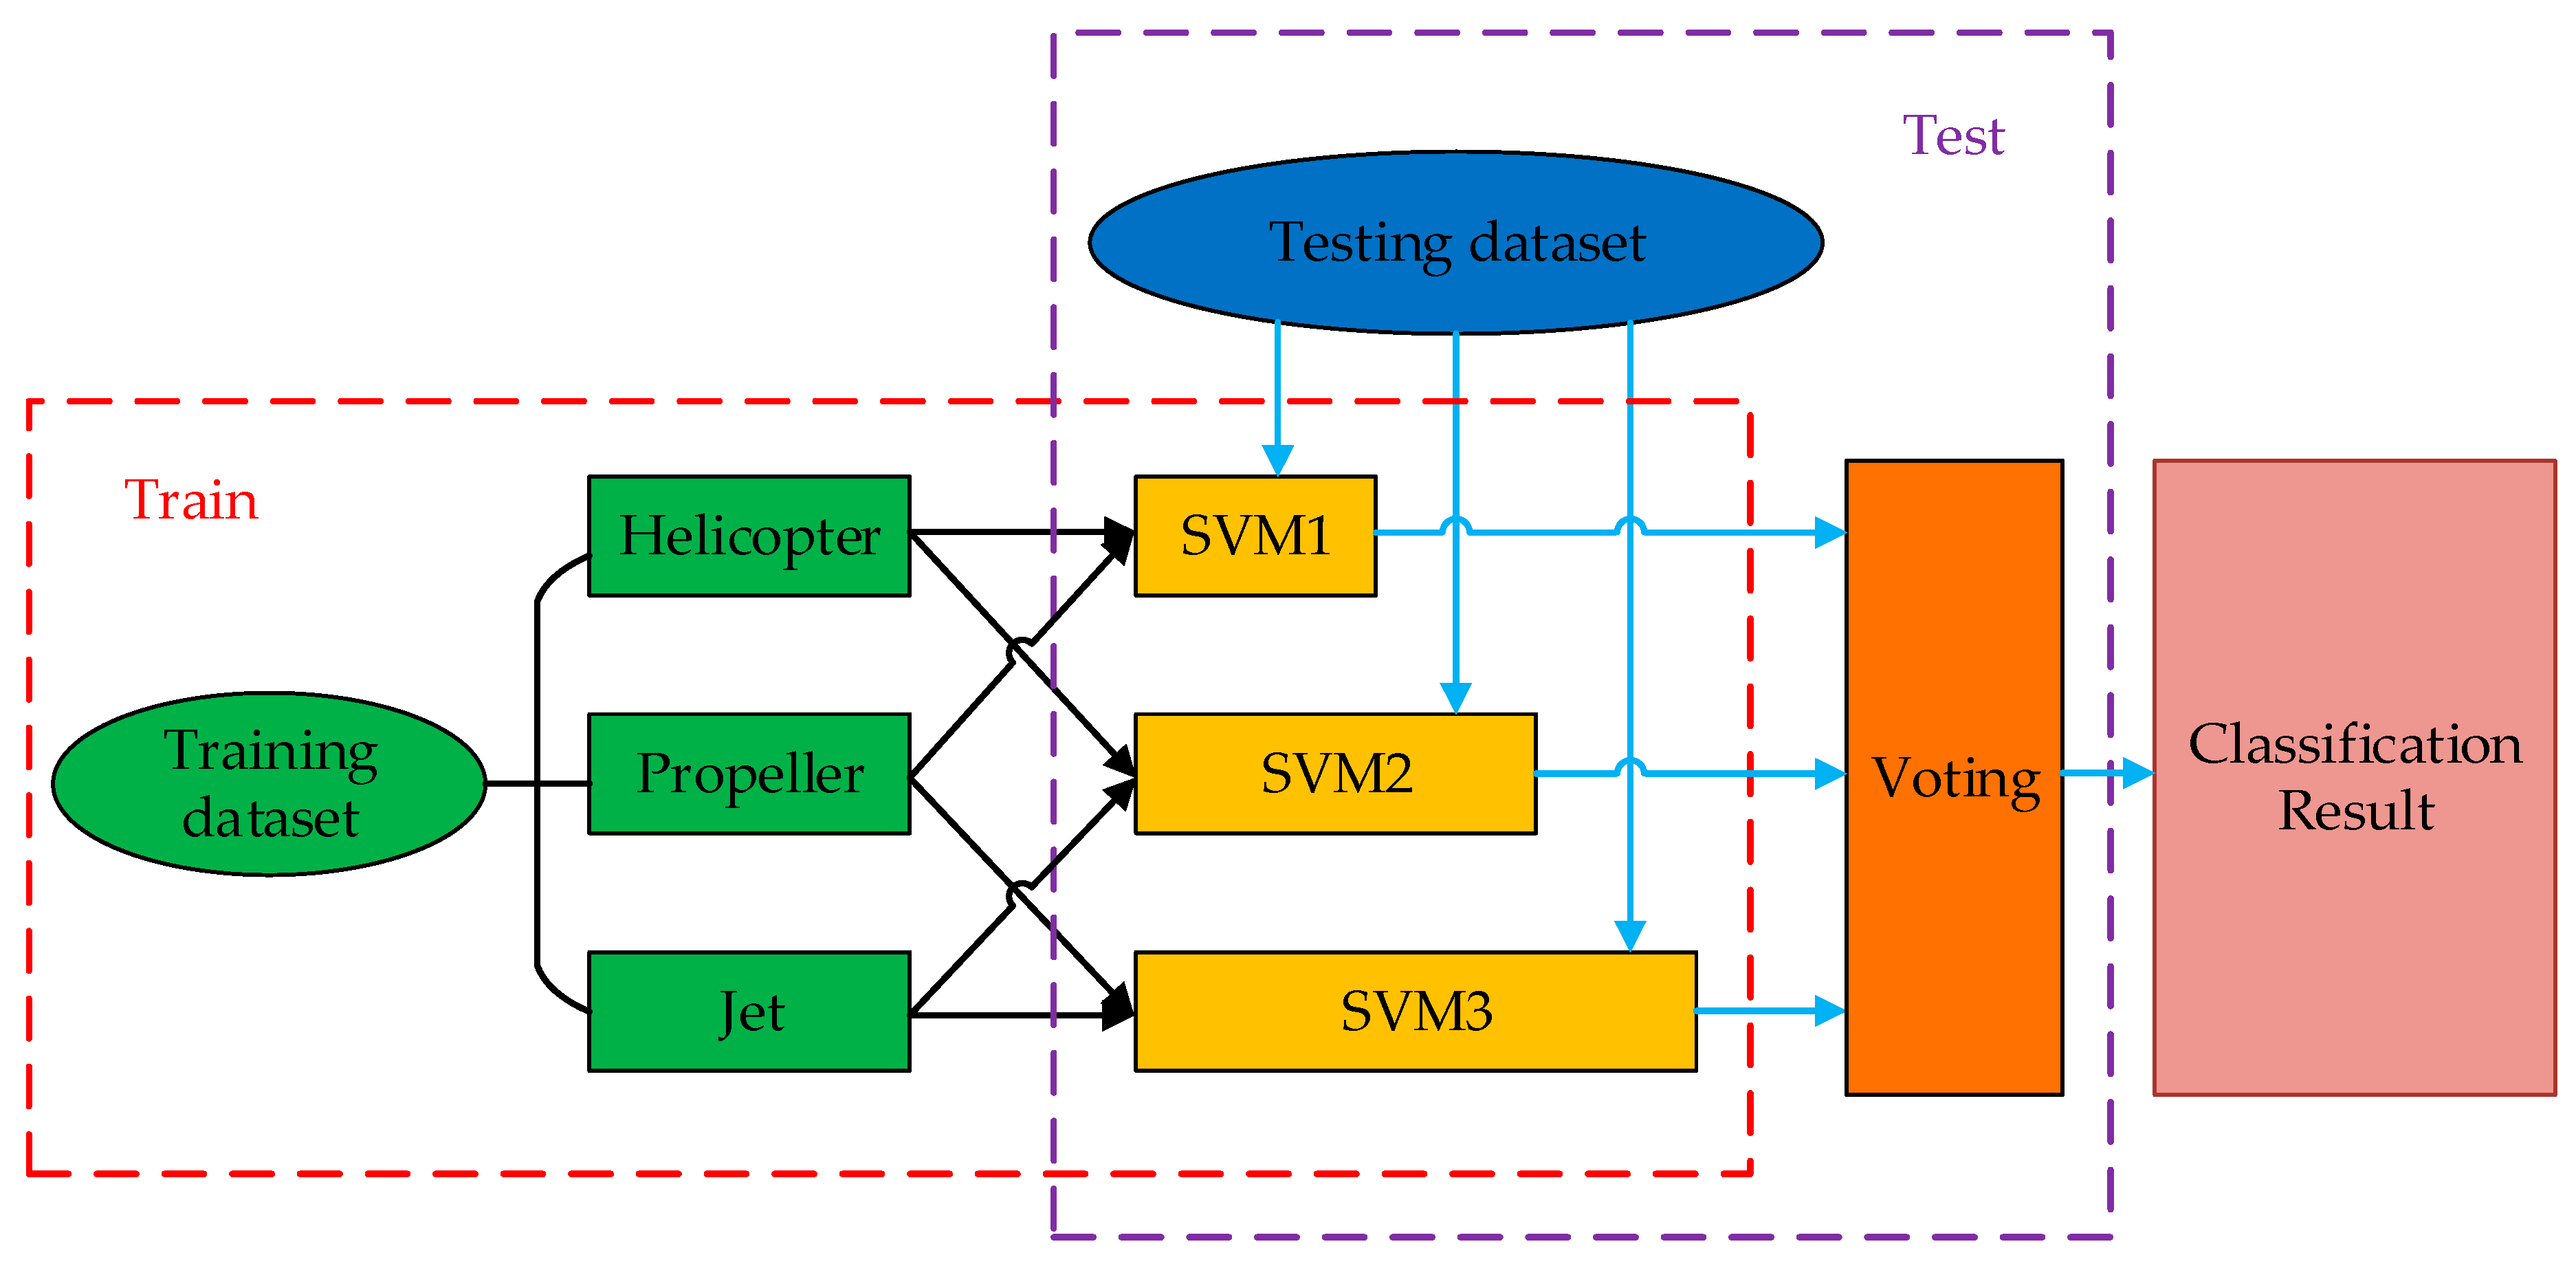
3.3. Classification Algorithm

In this paper, support vector machine (SVM) method is used to classify the extracted fusion features of three types of aircraft targets. SVM was first proposed by Vapink for the classification of two types of liner separable data [51]. By finding the optimal hyperplane which makes the boundary distance between the two classes the maximum, the sample data was divided into two types. Later, it was extended to linear separable data. To solve the problem of three types of aircraft targets classification in this paper, we use the one-vs-one method to construct an SVM classifier between any two types, and construct three classifiers in total, and then obtain the final classification result by voting scheme. Three types of aircraft targets classification method based on SVM that we adopted in this paper are shown in Figure 9.
In Figure 9, the flow of red dotted box marked is the training process, in which the training dataset labeled in advance are divided into three parts belonging to different aircraft targets, and the two parts of them are combined to train three SVM models, respectively. The flow of purple dotted box marked is the testing process, in which the testing dataset which are completely different from the training dataset are sent to three trained SVM models, and then vote on the results of the SVM model to get the final classification results.
To sum up, with the sparse echo data, the classification algorithm of aircraft targets based on the weighted features fusion of multiple wave gates is summarized in Figure 10. In the proposed algorithm, the multi-wave gates sparse echo data are obtained as described in Figure 3: K is the number of wave gates in weighted feature fusion, and the SL0 and OMP methods are used to reconstruct sparse echoes and by which three types of features are extracted: amplitude deviation coefficient, time domain waveform entropy and frequency domain waveform entropy. In addition, in order to improve the classification probability of three types of aircraft targets, a classification algorithm based on the weighted features fusion of multiple wave gates is proposed. Finally, the fused features are used to classify three aircraft targets by three class support vector machine model.

4. Experimental Results

4.1. Dataset Details

In experiments, the parameters of radar, transmitting signal and aircraft targets are the same as those in Section 2.1. In this paper, several groups of comparative experiments are constructed where the noise is all considered for classification probability. In the classification experiment of complete echo data, we simulate 200 single-wave gate complete echo signal samples for each aircraft target as the dataset where one complete signal sample corresponds to one radar observation angle. While the sparse echo data of multi-wave gates continuously are simulated in one angle in the classification experiment of sparse echo data, in other words, the dataset contains 200 multi-wave gates sparse echo signal samples for each aircraft target. What we want to emphasize is that the testing dataset are completely different from the training dataset with different aircraft target distance and view angle, and the aircraft target correct classification probability can be obtained by comparing the classification result of the SVM model with the real label of the aircraft target, which is equal to the number of correctly classified samples divided by the total number of samples.

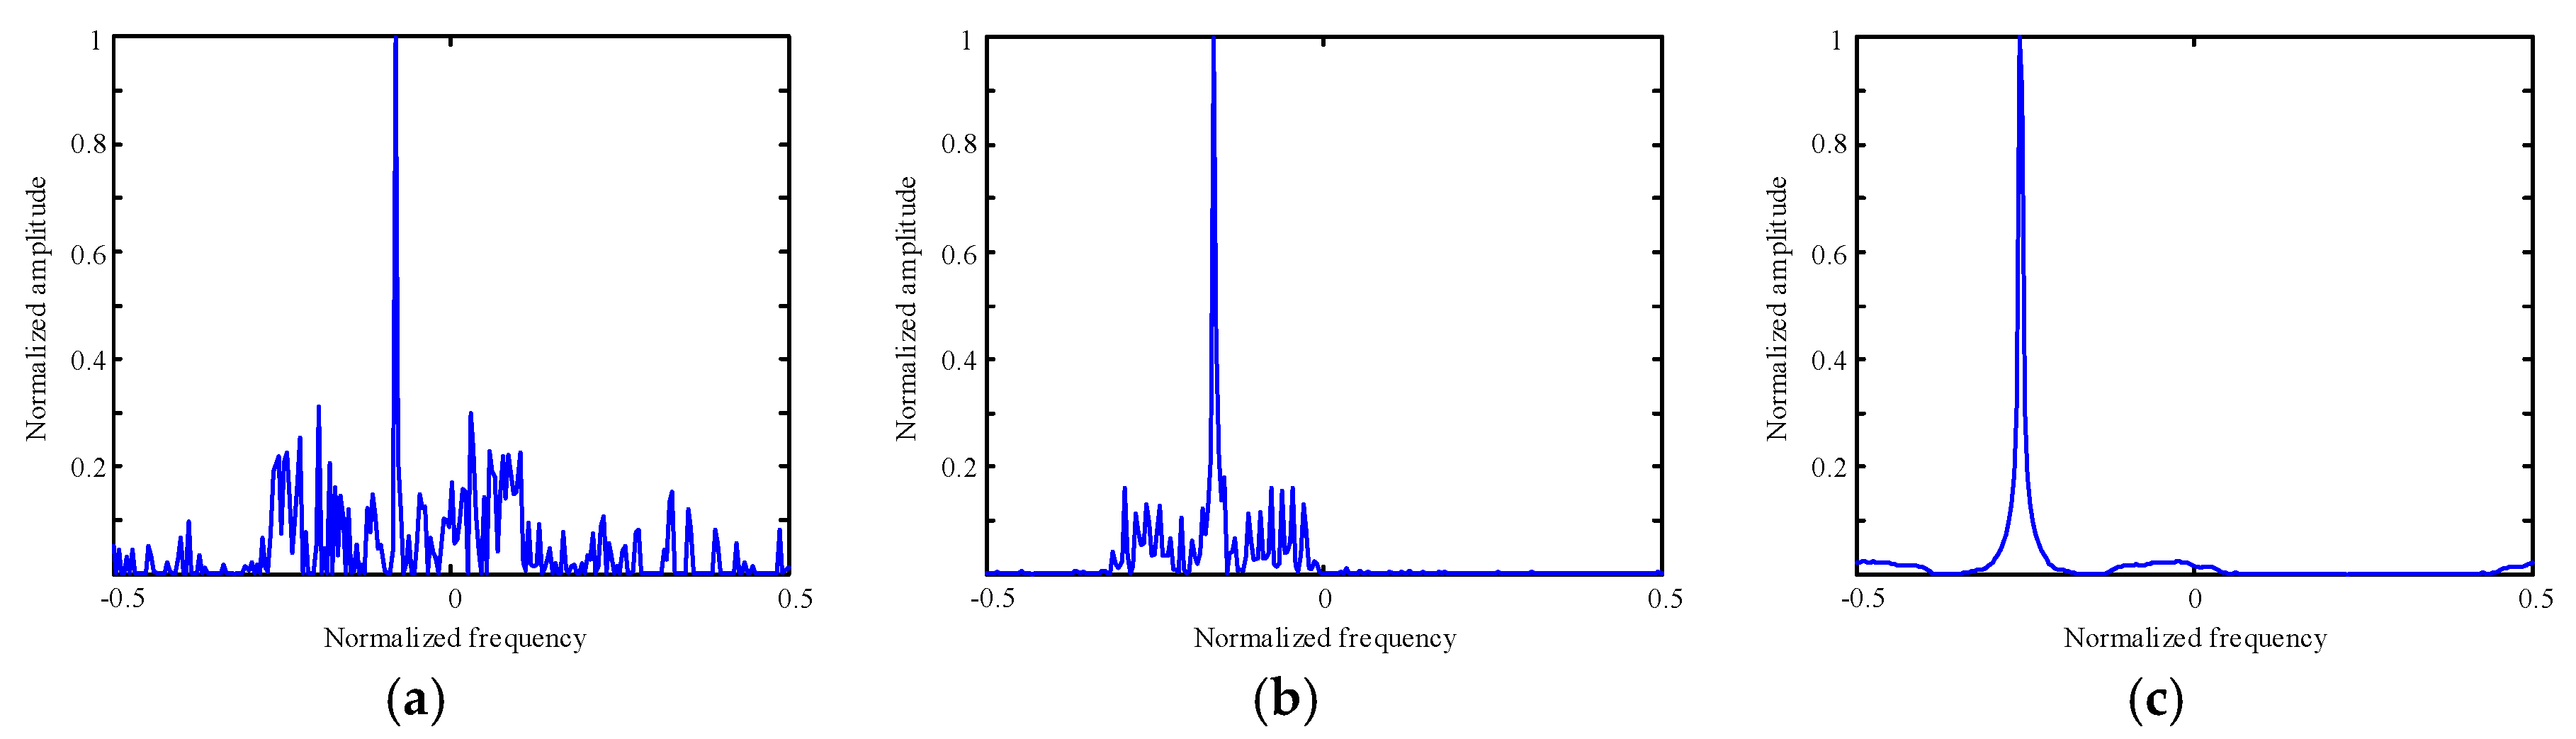
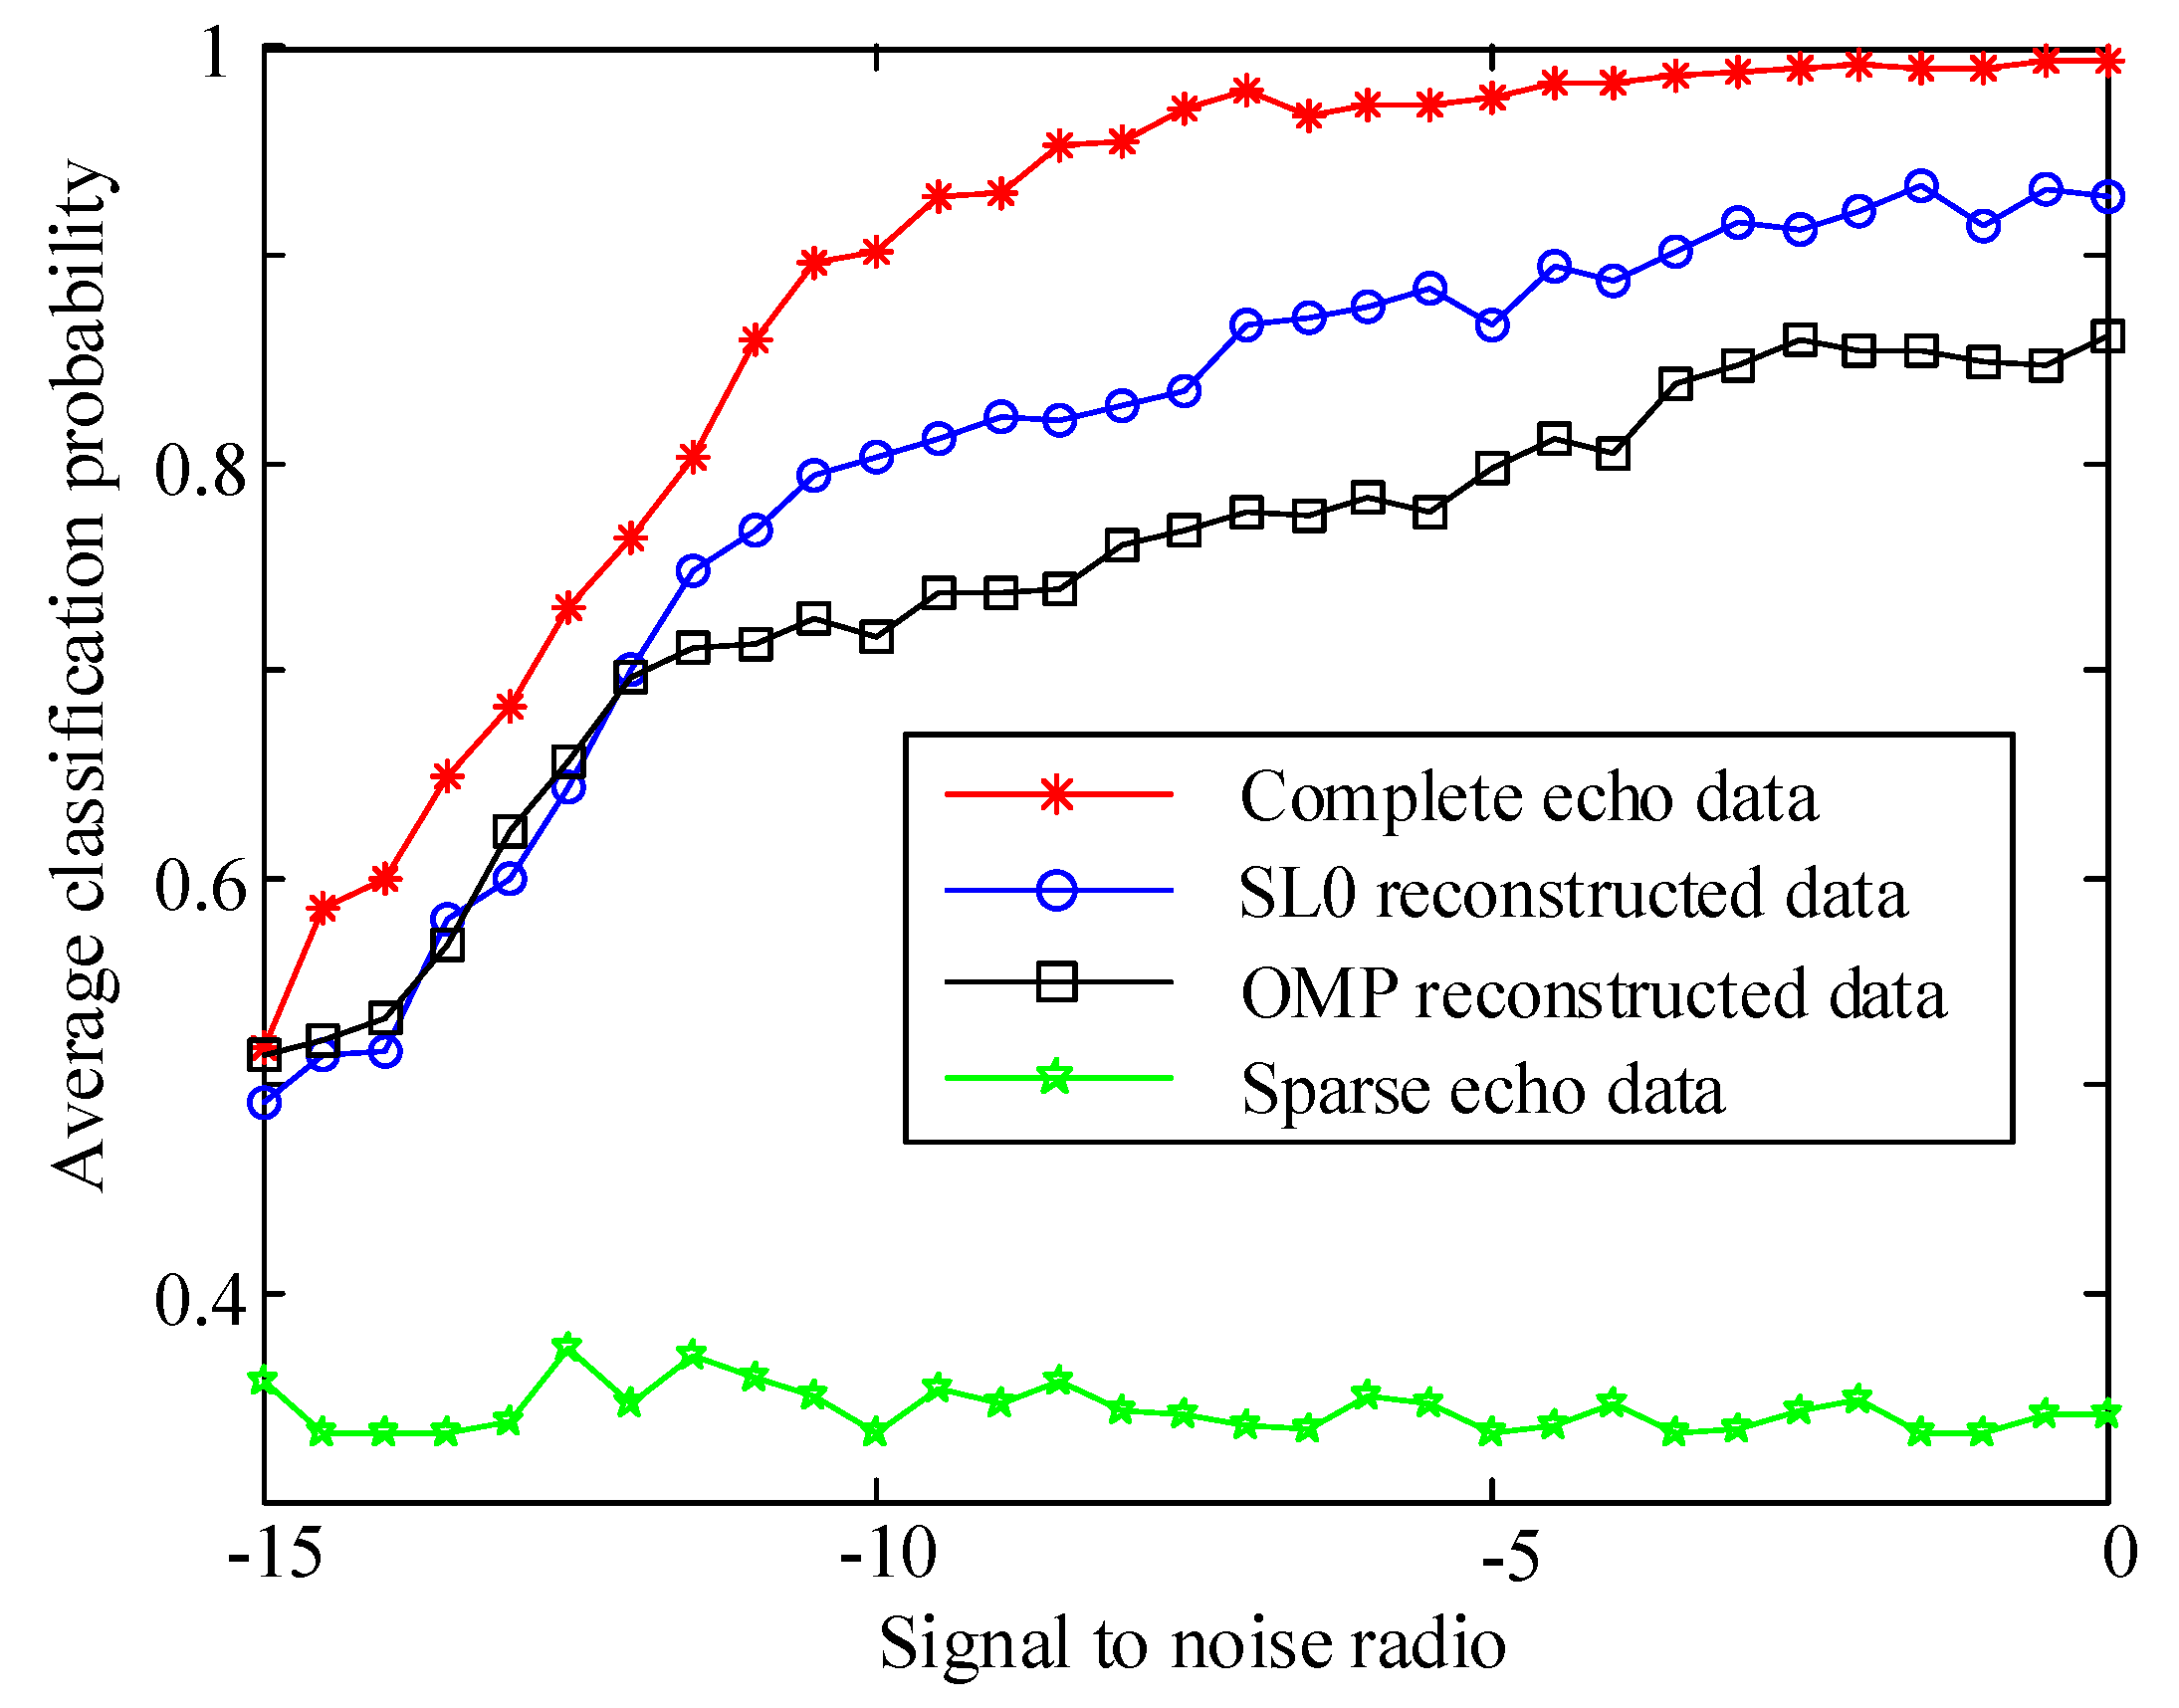
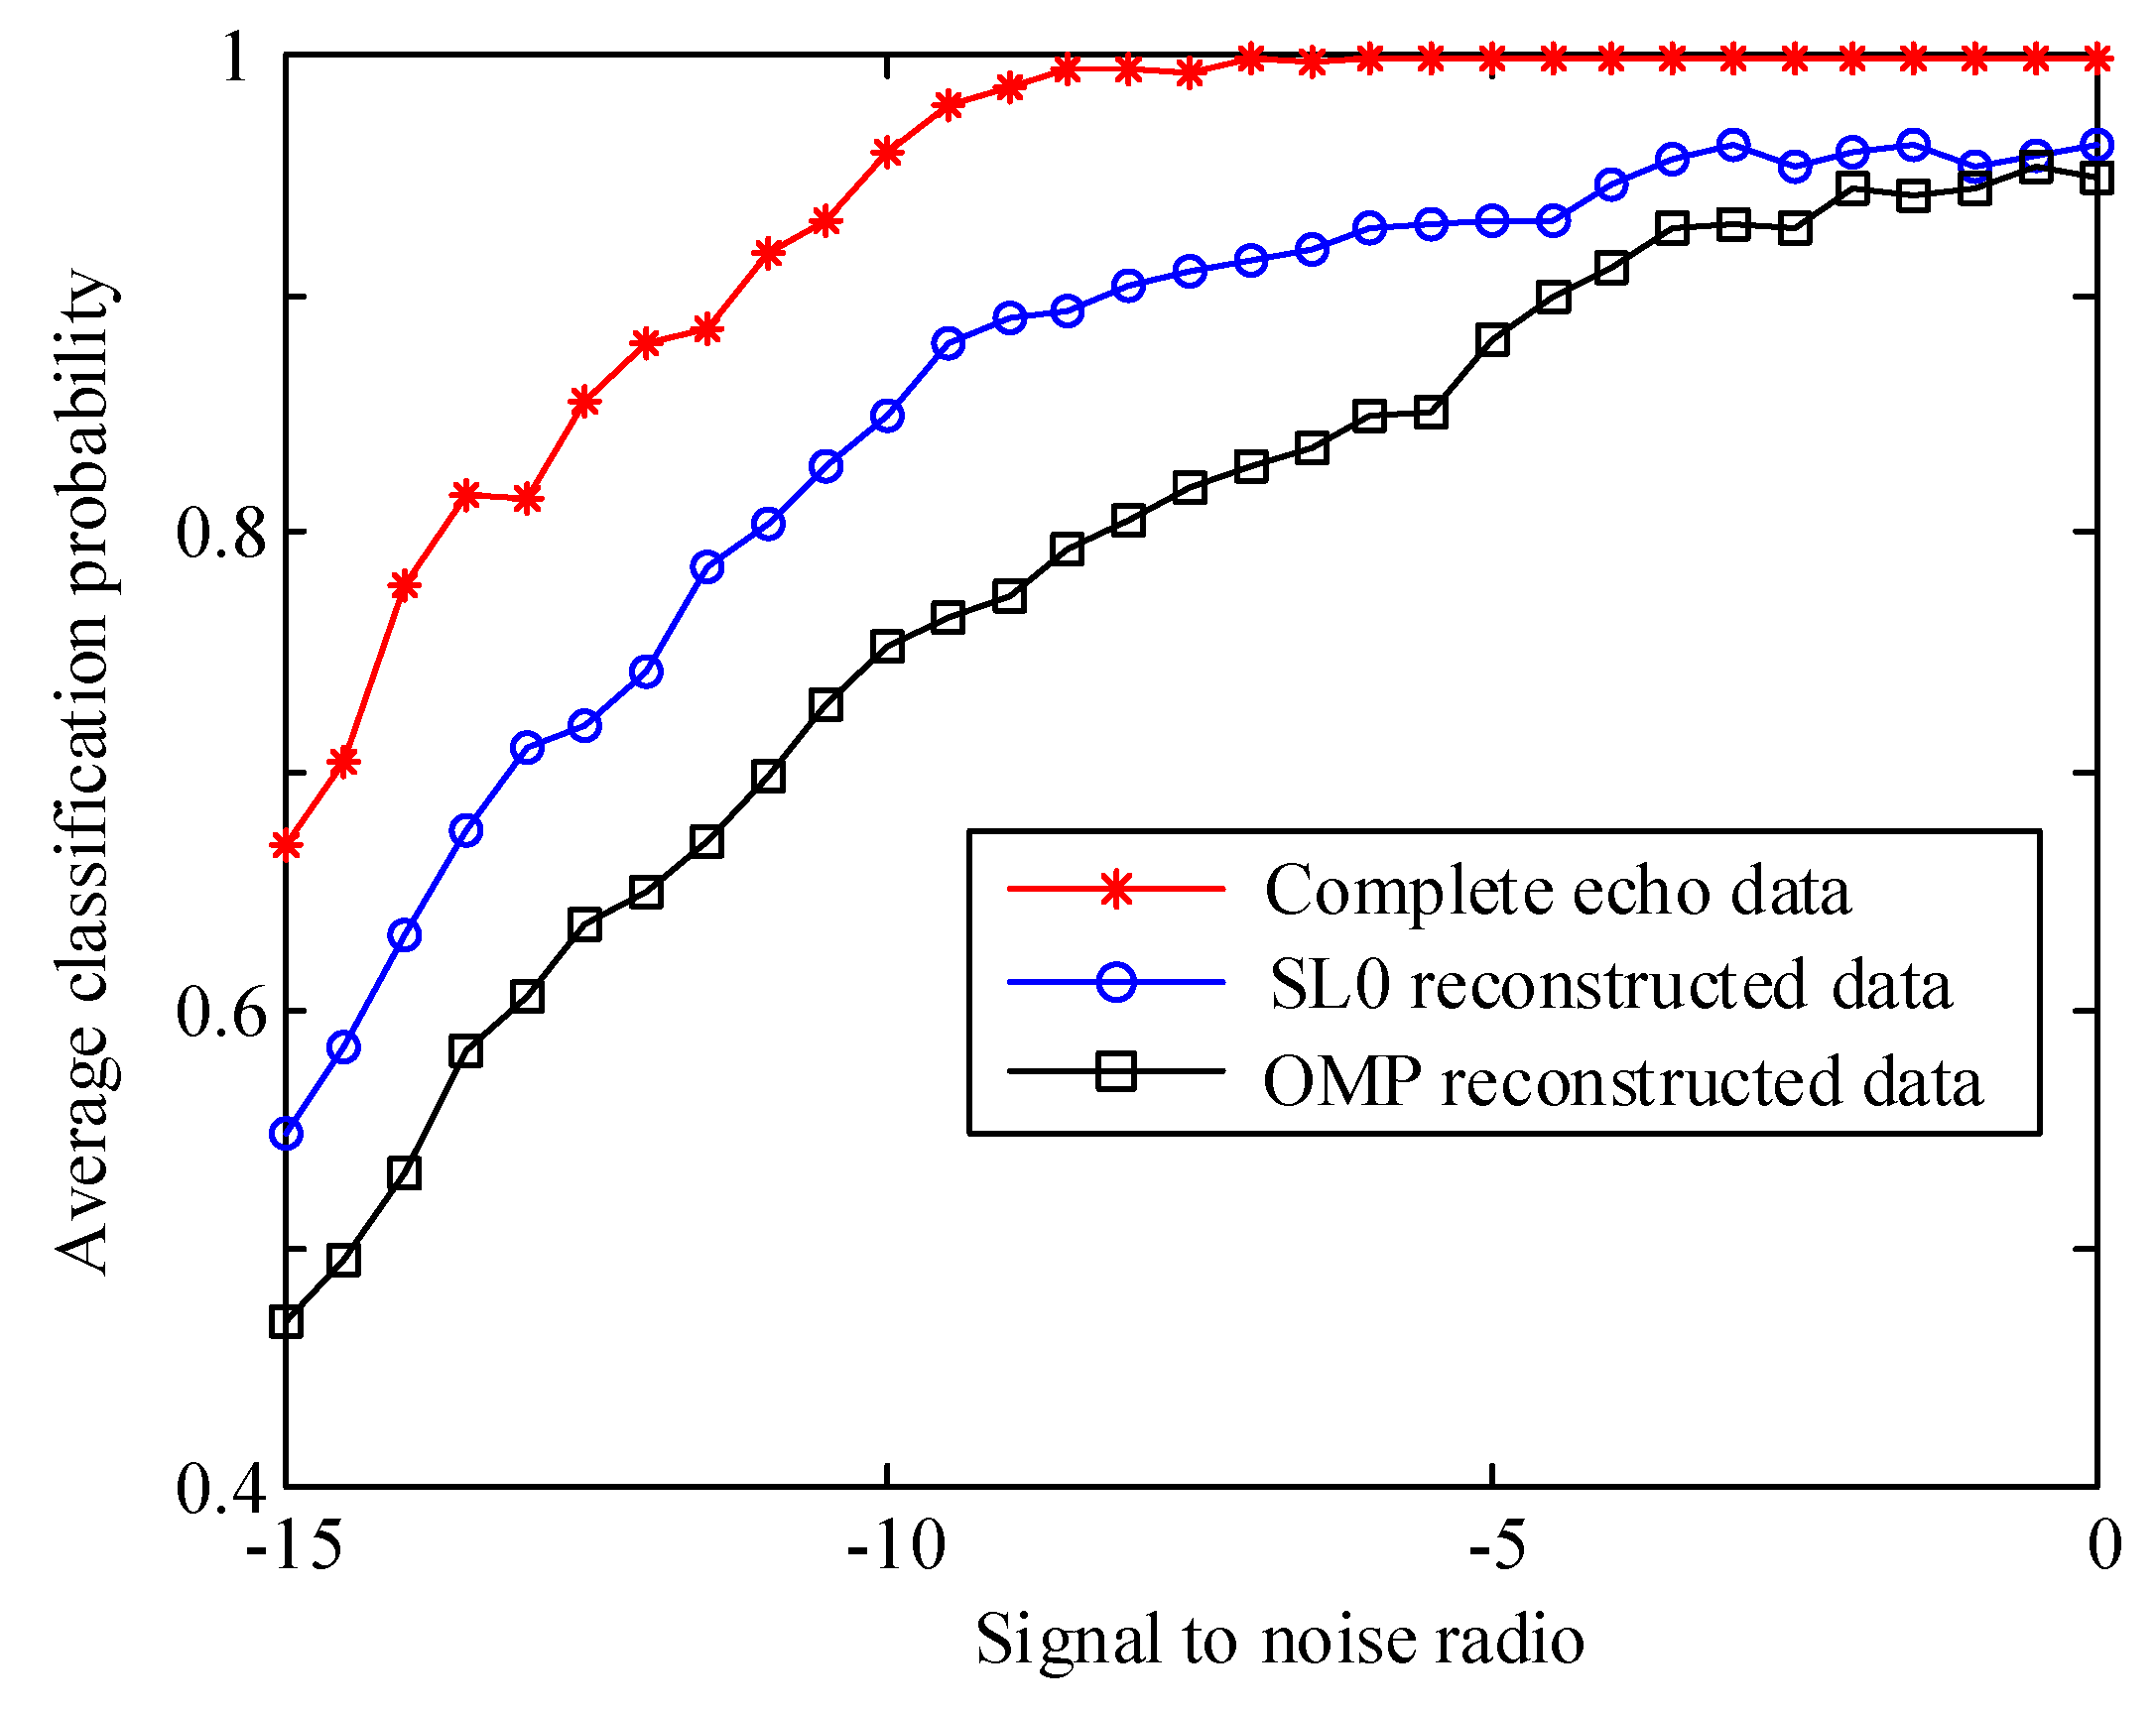
4.2. Validity Experiment of Reconstruction Algorithm

With the aim of verifying the validity of SL0 and OMP reconstruction algorithm for the classification of aircraft targets, we conduct an experiment. In this experiment, in order to better simulate the actual work of radar target classification and recognition, the training dataset of 600 single-wave gate complete echo data samples are extracted features which are used to train the SVM model. Several comparative testing experiments are conducted with different testing dataset, two of which take the reconstructed echo data obtained by SL0 and OMP algorithms as the testing dataset, and the results are shown as the blue curve and the black curve, respectively, in Figure 11. As a comparison, we take another complete echo data samples as the testing dataset, and the result of average classification probability is shown as the red curve. In addition, we take the sparse echo data samples as the testing dataset to verify that the sparse echo data worsen aircraft targets classification due to the loss of several echo information elements.
From Figure 11, we can see that the classification probability of sparse echo data is the lowest, which distributes around 33%, and does not vary with the change of SNR. This shows that the sparse echo data loses the components reflecting the micro-Doppler effect of the rotating parts. We can also say that the helicopter, propeller aircraft and jet aircraft cannot be distinguished correctly by extracting the three kinds of features through the sparse echo data. The correct classification probability of the complete echo data is the highest, and with the increase of SNR, the correct classification probability increases gradually and stabilizes at 99.33%. Although the correct classification probability of reconstructed echo data obtained by the SL0 and OMP algorithms is lower than that of complete echo data, it is obviously higher than that of sparse echo data, which verifies the validity of the two kinds of reconstruction algorithms for reconstructing echo data. When the SNR is lower than −12 dB, the classification probability of the reconstructed echo data between the two algorithms is similar. When SNR is higher than −12 dB, the classification effect of the SL0 reconstruction algorithm is better than that of OMP reconstruction algorithm, which is consistent with the reconstructed results of frequency domain echoes of two kinds of algorithms in Section 2.2.

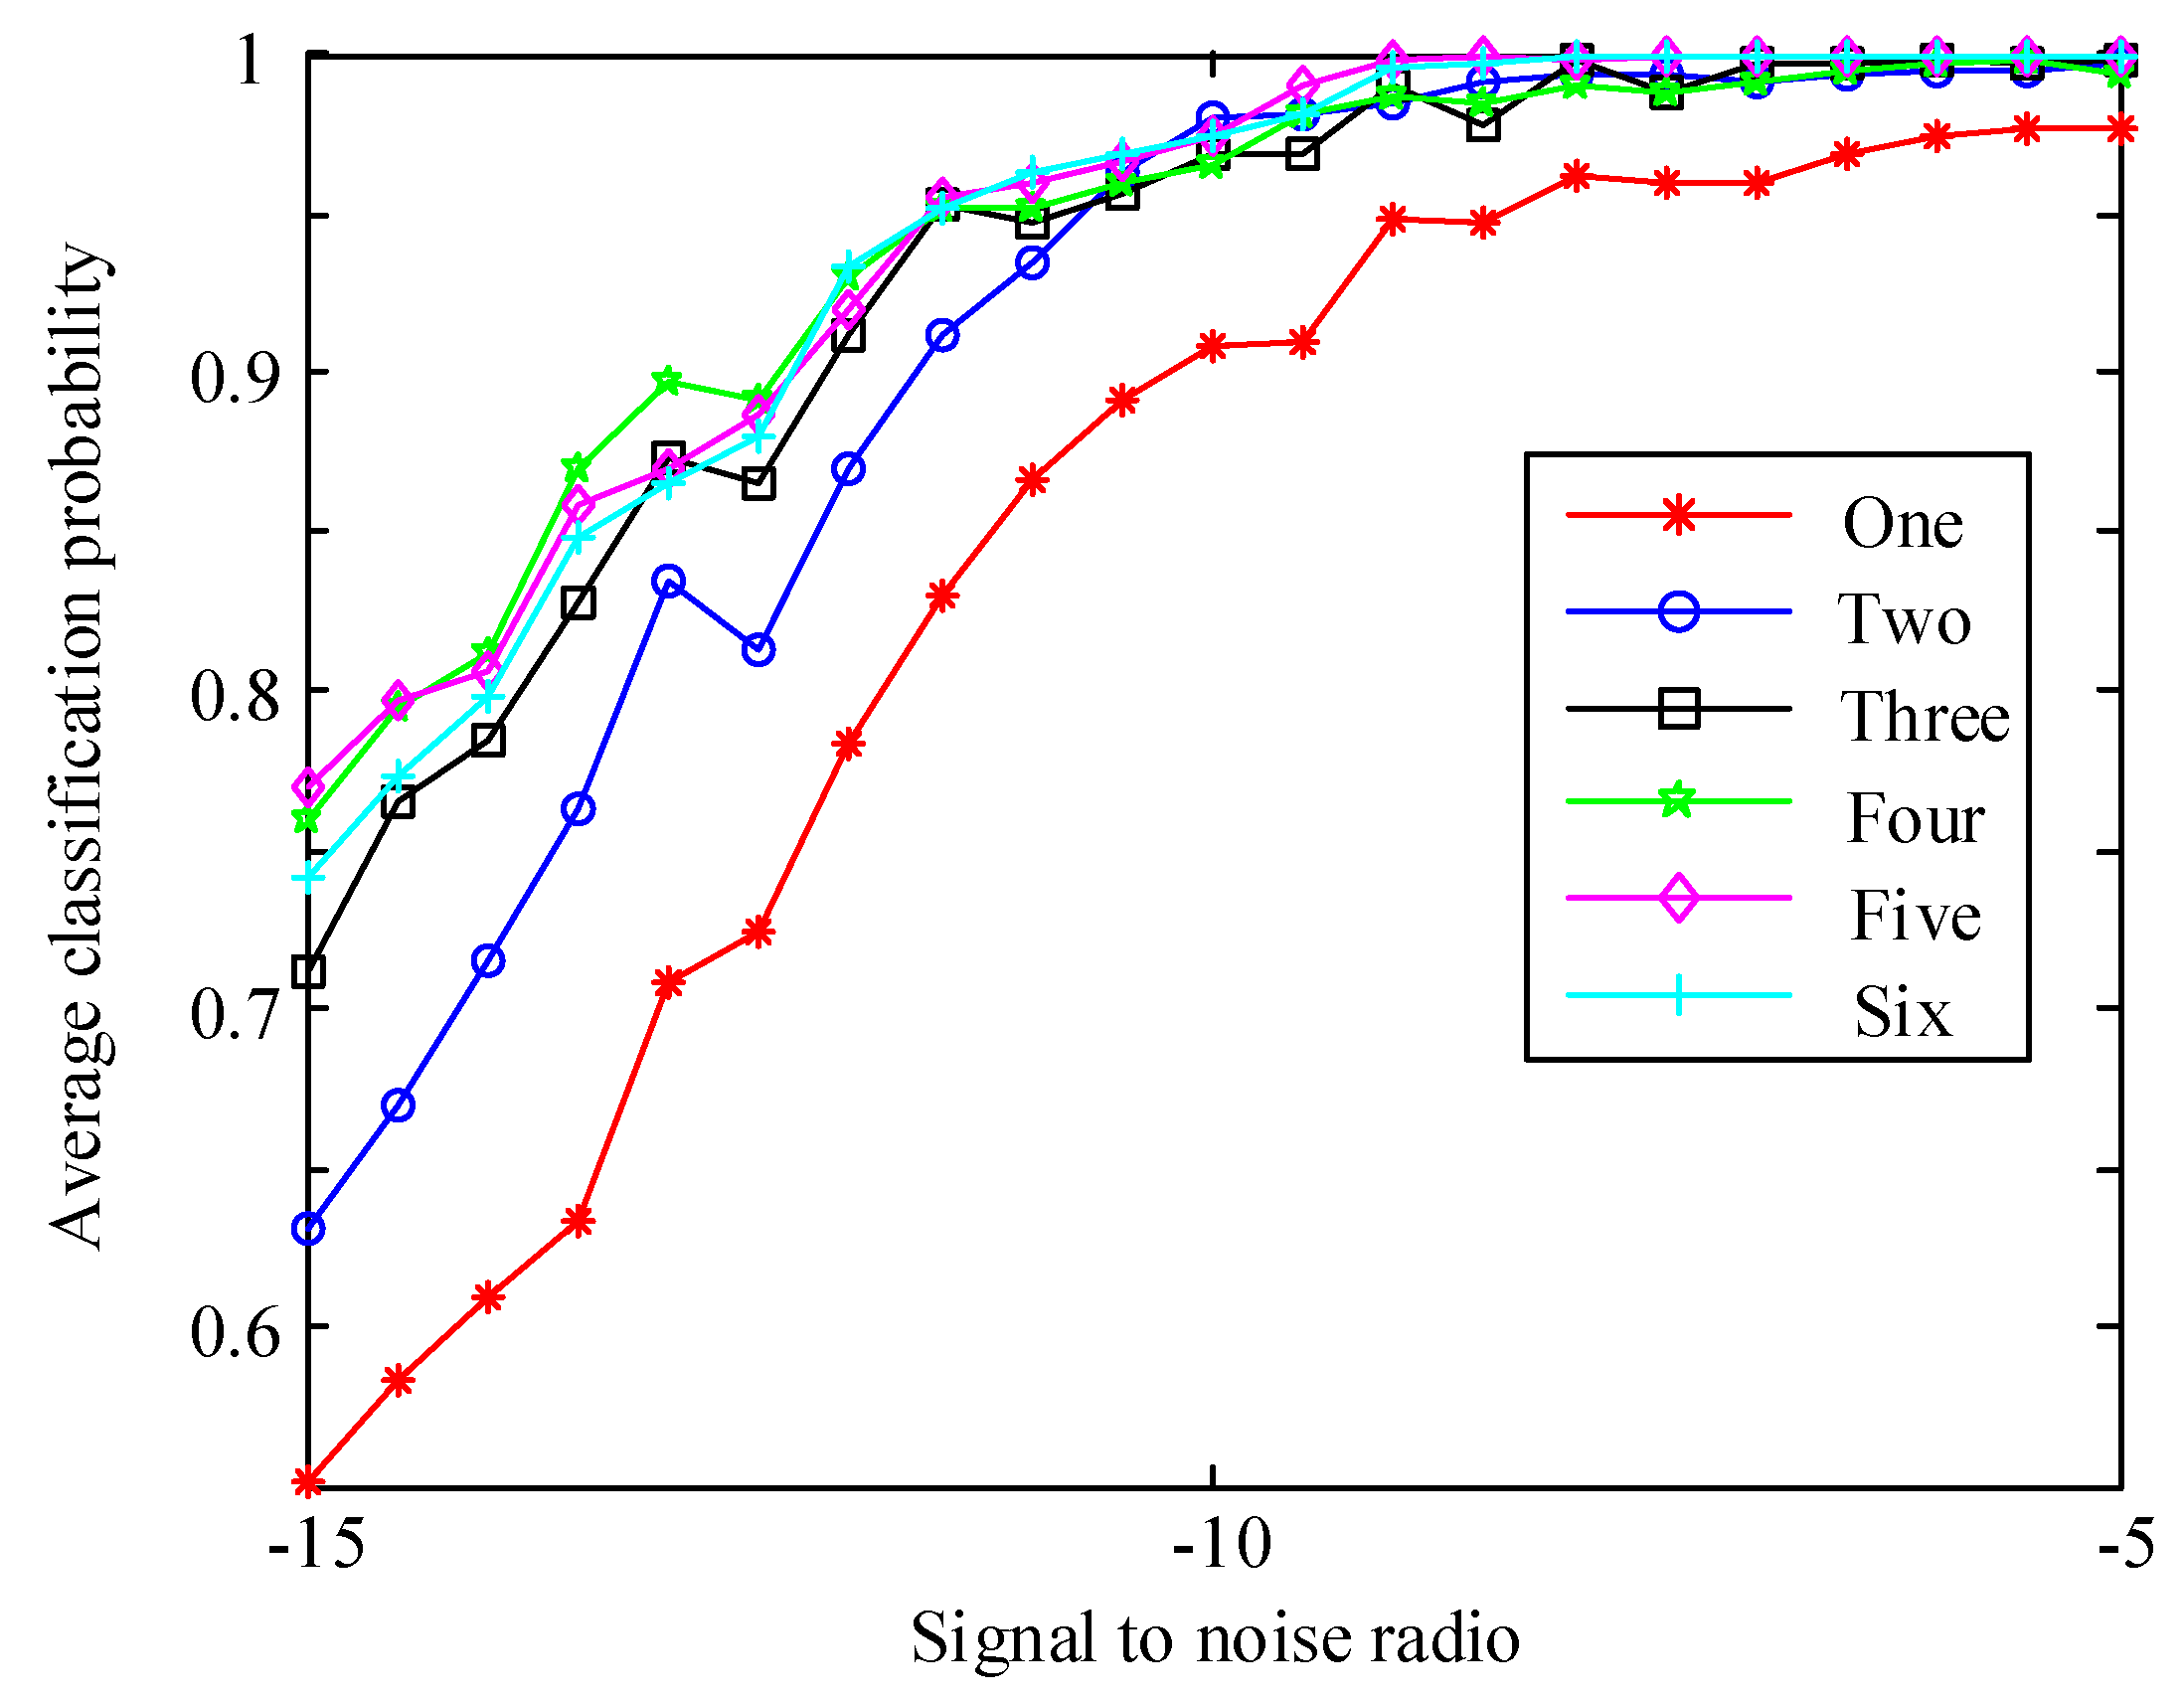
4.3. Selection of Wave Gate Number in Weighted Features Fusion

Although SL0 and OMP reconstruction algorithms can accurately reconstruct the sparse echo data, the correct classification probability of the extracted features still lags behind that of the complete echo data. However, as we analyzed in Section 3.2, after using the weighted features fusion method for the features extracted from the multi-wave gates reconstructed echo data, the fused features are more clustered near the mean of all samples. Therefore, a classification algorithm based on the weighted features fusion of multi-wave gates reconstructed echo data is proposed in this paper in order to improve the classification probability. In this experiment, we compare the influence of the wave gate number on the probability of target classification in order to get the best wave gate number in weighted features fusion. The training and testing dataset of features are all extracted from the reconstructed multi-wave gates echo data. The experimental results are shown in Figure 12.
We can summarize from the above figure that the classification probability among the wave gate number from one to six in weighted features fusion increases with the raise of SNR. When only one wave gate reconstructed echo datum is used to extract features which is selected for classification, the probability is lower than that of multi-wave gates. When the SNR is low, the probability of choosing two fused wave gates features to classify aircraft targets is lower than that of choosing three to six wave gates fused features, but with increasing of the SNR, the probability of choosing two fused wave gates features is similar to that of using more. The experimental results also show that the classification probability curves of choosing three to six wave gates for weighted features fusion has the same change rule and is similar with each other under the same SNR. On the one hand, the experimental result shows that the classification effect of using multi-wave gates reconstructed echo data to classify three types of aircraft targets is better than that of using only one gate reconstructed echo datum. On the other hand, by fusing the features extracted from multi-wave gates reconstructed echo data, the fused features can be close to the mean value, and the number of cross-values of features extracted from different aircraft targets is reduced. However, if too many wave gates in weighted features fusion are selected, during this period, there are some differences between the extracted features due to the change of the aircraft’s motion direction and flight attitude, and the probability of target classification does not increase with the increase of the number of wave gates. In summary, when the wave gate number in weighted features fusion is four, the classification probability of aircraft targets is the best.

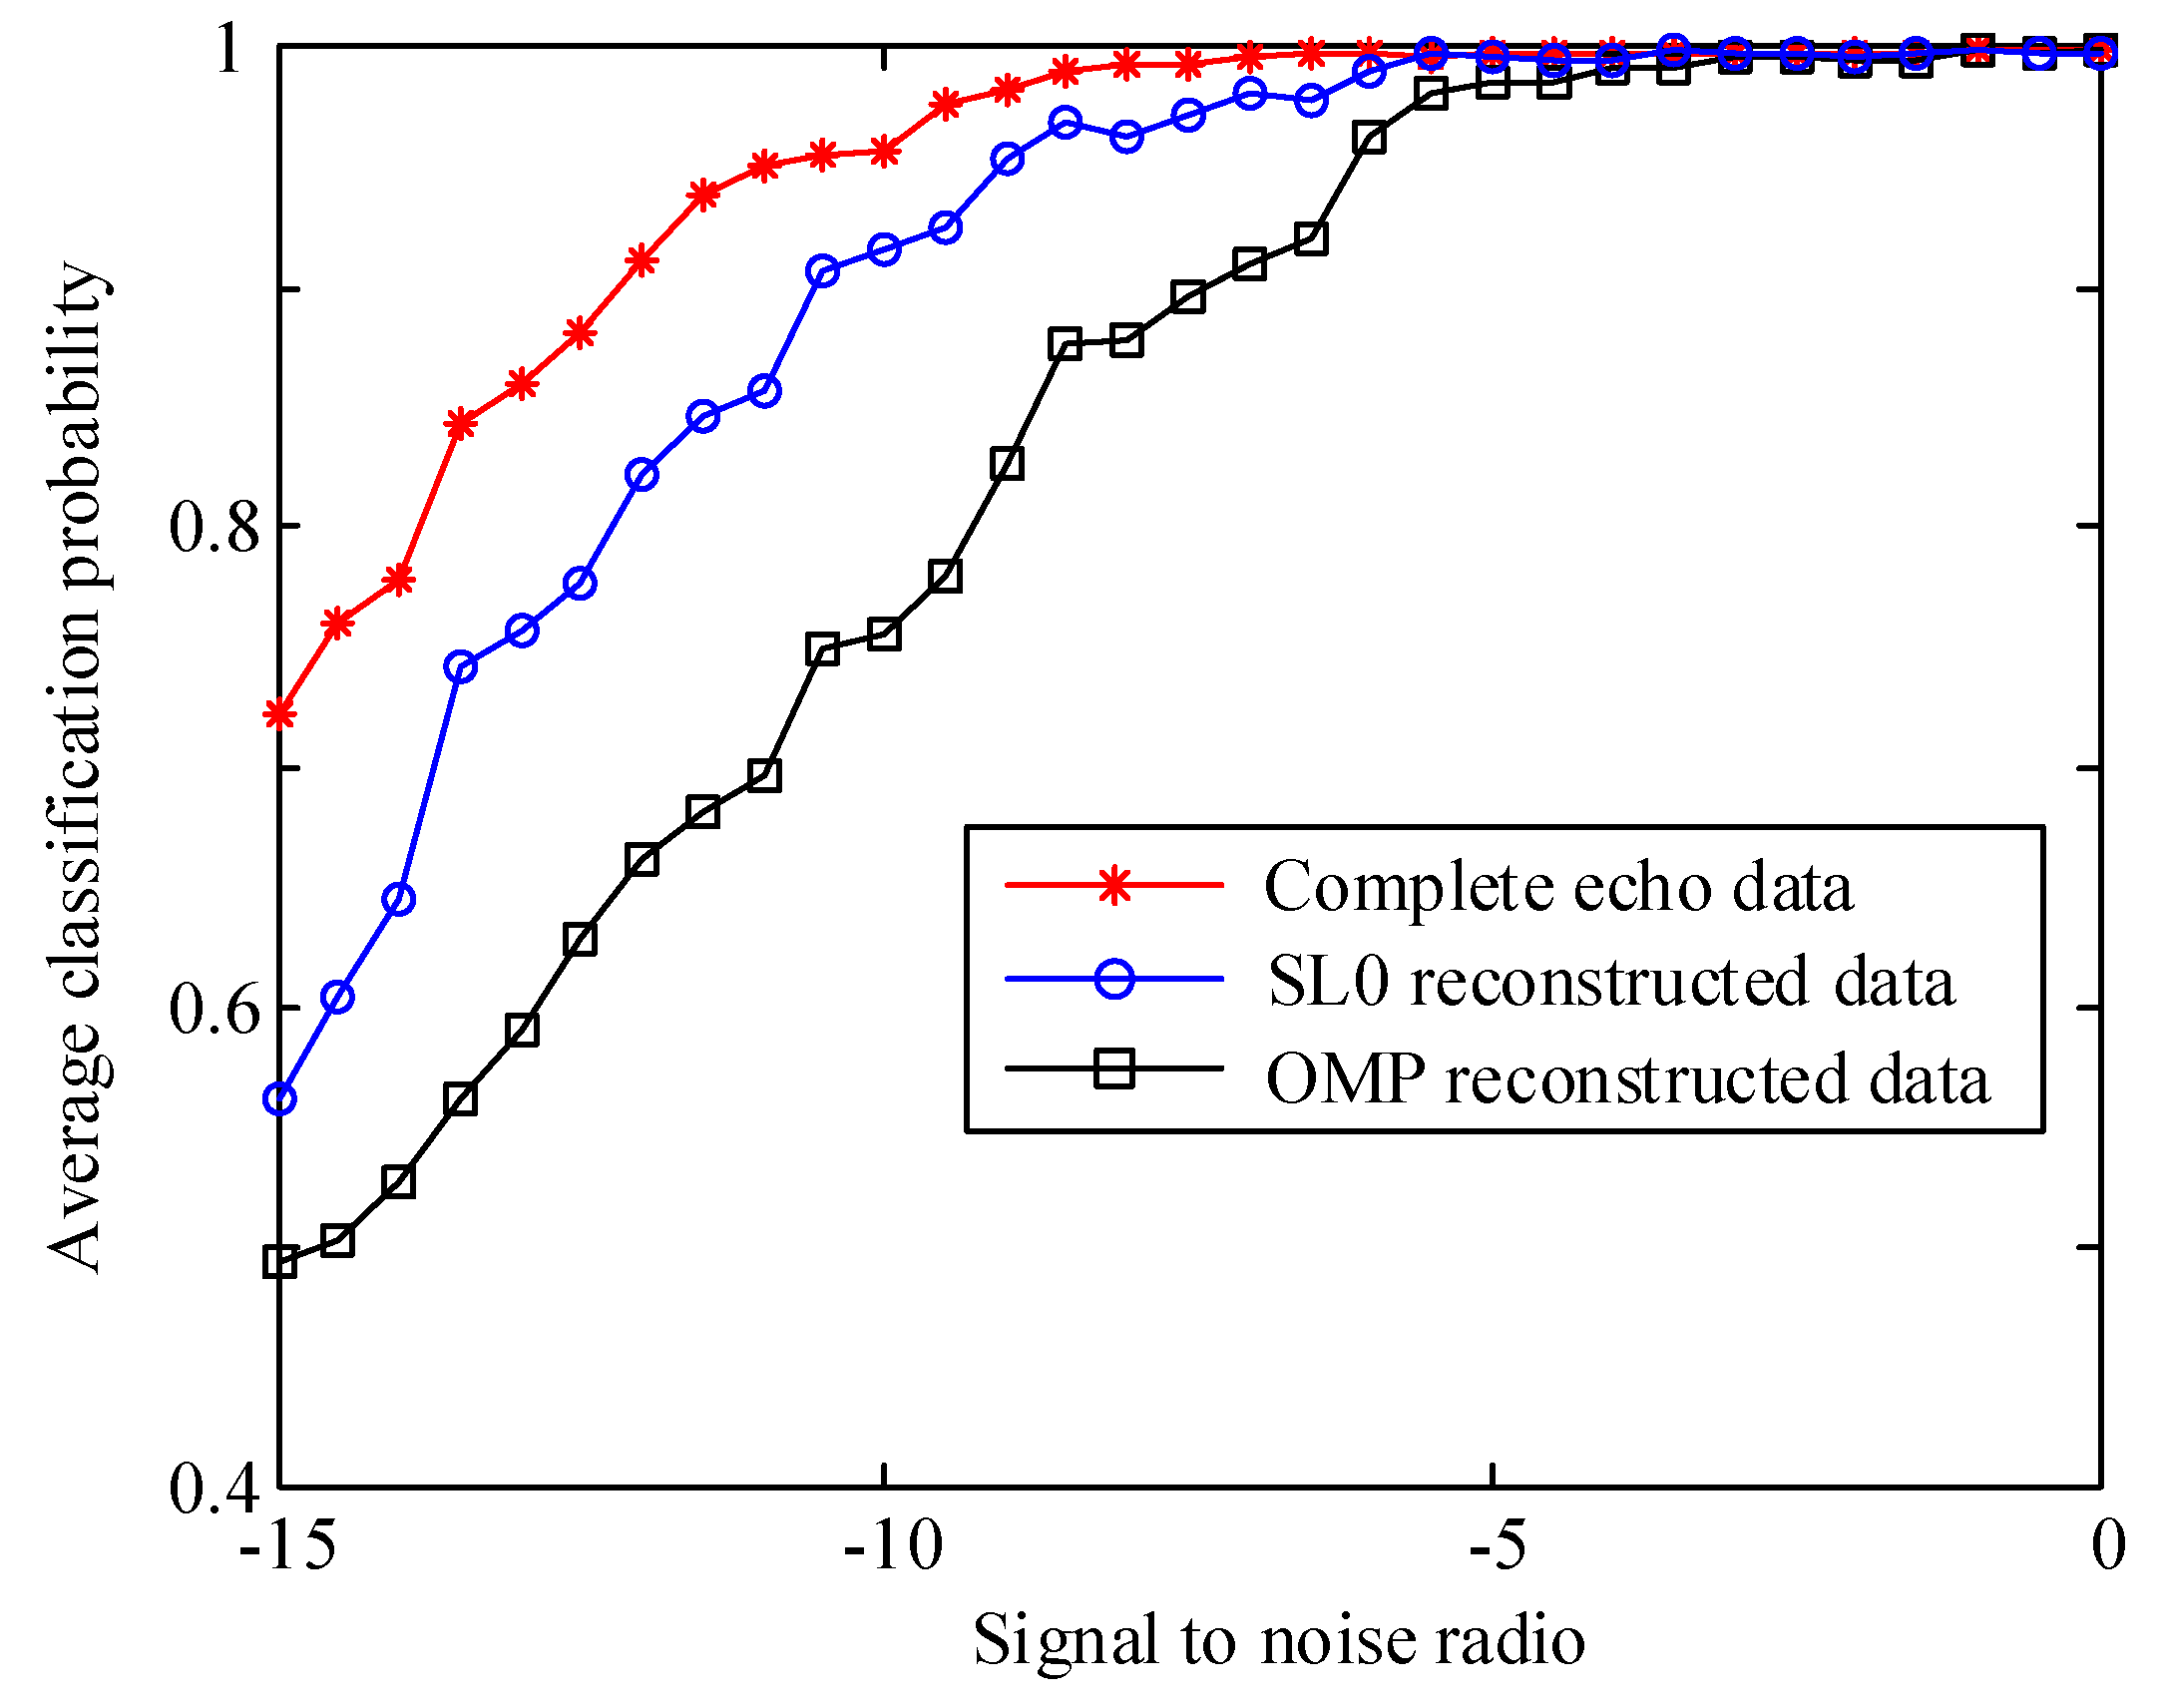
4.4. Classification Experiment Based on Weighted Features Fusion with Four Wave Gates Sparse Echo Data

In this section, based on the target classification algorithm of multi-wave gates in weighted features fusion proposed in this paper, we conduct two comparative simulation experiments. One is that we train the SVM model with the dataset composed of single wave gate complete echo data, classify aircraft targets with the dataset consisting of four wave gates complete echo data and the dataset consisting of four wave gates reconstructed echo data respectively. The simulation results are shown in Figure 13. Another comparative simulation experiment is that we train the SVM model with the dataset composed of four wave gates complete echo data, while the testing datasets consist of four wave gates complete echo data and of four wave gates reconstructed echo data, respectively. The experimental results are shown in Figure 14.
Compared with the experimental result of single wave gate echo data as the testing dataset in Figure 11, we can conclude from the results of four wave gates echo data that the best way to classify targets, as testing dataset in Figure 13 that the classification probability of the complete echo data is obviously improved. The classification probability of features extracted from reconstructed echo data by SL0 and OMP algorithms after weighted features fusion is also higher than that of features without weighted features fusion. Therefore, we come to the conclusion that the echo data of multi-wave gates to classify the aircraft targets can improve the correct classification probability.
Comparing the experimental results in Figure 13 and Figure 14, the classification probability of using four wave gates complete echo data for both training and testing is better than that of the single wave gate complete echo data for training and four wave gates complete echo data for testing, and the reason for this is that the SVM model can learn more target echo information by using four wave gates echo data. Moreover, the classification probability of the two kinds of reconstruction algorithms can reach 99.83% in Figure 14, which verifies the validity of both kinds of reconstruction algorithm and the effectiveness of the classification algorithm based on weighted features fusion of multi-wave gates reconstructed echo data. Therefore, it can be summed up that in the process of radar classification of three types of aircraft target, we can use four wave gates echo data as far as possible in weighted features fusion for training the SVM model, in which the parameters of the SVM model trained in this way are optimal. Also the classification probability of the target is highest when testing with four wave gates echo data.

5. Conclusions

In this paper, an aircraft target classification algorithm is proposed based on weighted features fusion of multi-wave gates sparse echo data. Not only are the SL0 and OMP algorithms utilized to reconstruct the sparse echo data to solve the problem of low classification probability in this case, but also the amplitude deviation coefficient, time domain waveform entropy and frequency domain waveform entropy are extracted to classify aircraft targets according to the analysis of the micro-Doppler effect of echo data. The proposed algorithm works on the multi-wave gates echo data in weighted features fusion, rather than single wave gate echo data, which is helpful for reducing the number of cross-value features of different targets. Experimental results show that the proposed algorithm can improve the classification probability of reconstructed echo data obtained by the SL0 and OMP methods, and four wave gates echo data in weighted features fusion used to extract and fuse features and to both train and test the SVM model is the optimal wave gate number for target classification.
Although our method is effective in aircraft target-type classification, it can still be improved further. In the future, we not only study the aircraft target classification algorithm within unmanned aerial vehicle (UAV) types, but also verify the effectiveness of the algorithm in the actual radar equipment by conducting an experiment with measured data.

Author Contributions

Writing—original draft preparation, W.W.; methodology, Z.T. and Y.C.; writing—review and editing, W.W. and Y.C.; data curation, Y.Z. and Y.S.

Funding

This work was supported in part by the National Natural Science Foundation of China under Grant 61901514, and in part by Young Talent Program of Air Force Early Warning Academy under Grant TJRC425311G11.

Acknowledgments

The authors would like to thanks to the editor and anonymous reviewers for processing our manuscript.

Conflicts of Interest

The authors declare no conflict of interest.

References

  1. Pan, X.R.; Yang, F.; Gao, L.R.; Chen, Z.C.; Zhang, B.; Fan, H.R.; Ren, J.C. Building extraction from high-resolution aerial imagery using a generative adversarial network with spatial and channel attention mechanisms. Remote Sens. 2019, 11, 917. [Google Scholar] [CrossRef]
  2. Deledalle, C.A.; Denis, L.; Poggi, G.; Tupin, F.; Verdoliva, L. Exploiting patch similarity for SAR image processing: The nonlocal paradigm. IEEE Signal Process. Mag. 2014, 31, 69–78. [Google Scholar] [CrossRef]
  3. Zhao, C.H.; Wang, Y.; Masahide, K. An optimized method for image classification based on bag of words model. J. Electron. Inf. Technol. 2013, 34, 2064–2070. [Google Scholar] [CrossRef]
  4. Wang, Y.P.; Hu, Y.H.; Lei, W.H. Aircraft target classification method based on texture feature of laser echo time-frequency image. Acta Optica Sin. 2017, 37, 1128004. [Google Scholar] [CrossRef]
  5. Fu, K.; Dai, W.; Zhang, Y.; Wang, Z.R.; Yan, M.L.; Sun, X. Multiple class activation mapping for aircraft recognition in remote sensing images. Remote Sens. 2019, 11, 544. [Google Scholar] [CrossRef]
  6. Karacor, A.G.; Torun, E.; Abay, R. Aircraft classification using image processing and artificial neural networks. Int. J. Patt. Recogn. Artif. Intell. 2011, 25, 1321–1335. [Google Scholar] [CrossRef]
  7. Hwang, J.; Lin, K.; Chiu, Y. Automatic target recognition based on high-resolution range profiles with unknown circular range shift. In Proceedings of the IEEE International Symposium on Signal Processing & Informational Technology, Bilbao, Spain, 18–20 December 2017. [Google Scholar]
  8. Jiang, Y.; Li, Y.; Cai, J.J.; Wang, Y.H.; Xu, J. Robust automatic target recognition via HRRP sequence based on scatter matching. Sensors 2018, 18, 593. [Google Scholar] [CrossRef] [PubMed]
  9. Zhao, F.X.; Liu, Y.X.; Huo, K.; Zhang, S.H.; Zhang, Z.S. Radar HRRP target recognition based on stacked autoencoder and extreme learning machine. Sensors 2018, 18, 173. [Google Scholar] [CrossRef]
  10. Suresh, P.; Thayaparan, T.; Obulesu, T. Extracting micro-Doppler radar signatures from signatures from rotating targets using Fourier-Bessel transform and time-frequency analysis. IEEE Trans. Geosci. Remote Sens. 2014, 52, 3204–3210. [Google Scholar] [CrossRef]
  11. Smith, G.E.; Mobasseri, B.G. Robust through-the-wall radar image classification using a target-model alignment procedure. IEEE Trans. Image Process. 2012, 21, 754–767. [Google Scholar] [CrossRef]
  12. Liu, J.; Fang, N.; Wang, B.F.; Xie, Y.J. Scale-space theory-based multi-scale features for aircraft classification using HRRP. Electron. Lett. 2016, 52, 475–477. [Google Scholar] [CrossRef]
  13. Tang, N.; Gao, X.Z.; Li, X. Target classification of ISAR images based on feature space optimization of local non-negative matrix factorization. IET Signal Process. 2012, 6, 494–502. [Google Scholar] [CrossRef]
  14. Lopez-Rodriguez, P.; Fernandez-Recio, R.; Bravo, I.; Gardel, A.; Lazaro, J.L.; Rufo, E. Computational burden resulting from image recognition of high resolution radar sensors. Sensors 2013, 13, 5381–5402. [Google Scholar] [CrossRef]
  15. Wang, Y.; Zhu, P.K. Novel and comprehensive approach for the feature extraction and recognition method based on ISAR images of ship target. J. Harbin Inst. Technol. 2017, 5, 12–19. [Google Scholar]
  16. Karine, A.; Toumi, A.; Khenchaf, A.; EI Hassouni, M. Radar target recognition using salient keypoint descriptors and multitask sparse representation. Remote Sens. 2018, 10, 843. [Google Scholar] [CrossRef]
  17. Wang, F.; Sheng, W.X.; Ma, X.F.; Wang, H. ISAR image recognition with fusion of Gabor magnitude and phase feature. J. Electron. Inf. Technol. 2013, 35, 1813–1818. [Google Scholar] [CrossRef]
  18. Saidi, M.N.; Daoudi, K.; Khenchaf, A.; Hoeltzener, B.; Aboutajdine, D. Automatic target recognition of aircraft models based on ISAR images. In Proceedings of the Geoscience & Remote Sensing Symposium IEEE, Honolulu, HI, USA, 25–30 July 2010. [Google Scholar]
  19. Biondi, F.; Addabbo, P.; Orlando, D.; Clemente, C. Micro-motion estimation of maritime targets using pixel tracking in Cosmo-Skymed Synthetic Aperture Radar data-An operative assessment. Remote Sens. 2019, 11, 1637. [Google Scholar] [CrossRef]
  20. Ji, J.Z.; Jiang, J.X.; Al-Armaghany, A.; Shu, C.Y.; Huang, P.L. Nutation and geometrical parameters estimation of cone-shaped target based on micro-Doppler effect. Optik Int. J. Light Electron Opt. 2017, 150, 1–10. [Google Scholar] [CrossRef]
  21. Abdullah, R.S.A.R.; Alnaeb, A.; Salah, A.A.; Rashid, N.E.A.; Sali, A.; Pasya, I. Micro-Doppler estimation and analysis of slow moving objects in forward scattering radar system. Remote Sens. 2017, 9, 699. [Google Scholar] [CrossRef]
  22. Thayaparan, T.; Stanković, L.J.; Daković, M.; Popović, V. Micro-Doppler parameter estimation from a fraction of the period. IET Signal Process. 2010, 4, 201–212. [Google Scholar] [CrossRef]
  23. Zuo, L.; Li, M.; Zhang, X.W. Micro-Doppler parameter estimation from a fraction of the period data with the MMSE criterion. J. Xidian Univ. 2013, 40, 123–129. [Google Scholar]
  24. Li, G.; Varshney, P.K. Micro-Doppler parameter estimation via parametric sparse representation and pruned orthogonal matching pursuit. IEEE J. Sel. Top. Appl. Earth Observ. Remote Sens. 2014, 7, 4937–4948. [Google Scholar] [CrossRef]
  25. Liu, Y.X.; Li, X.; Zhuang, Z.W. Estimation of micro-motion parameters based on micro-Doppler. IET Signal Process. 2010, 4, 213–217. [Google Scholar] [CrossRef]
  26. Song, C.; Wu, Y.R.; Zhou, L.J.; Li, R.M.; Yang, J.F.; Liang, W.; Ding, C.B. A multicomponent micro-Doppler signal decomposition and parameter estimation method for target recognition. Sci. China Inf. Sci. 2019, 62, 029304. [Google Scholar] [CrossRef]
  27. Mujica, F.A.; Leduc, J.P.; Murenzi, R.; Smith, M.J.T. A new motion parameter estimation algorithm based on the continuous wavelet transform. IEEE Trans. Image Process. 2000, 9, 873–888. [Google Scholar] [CrossRef]
  28. Wang, B.S.; Du, L.; He, H.; Liu, H.W. Reconstruction method for narrow-band radar returns with missing samples based on complex Gaussian model. J. Electron. Inf. Technol. 2015, 37, 1065–1070. [Google Scholar]
  29. Yang, J.B.; Liao, X.J.; Yuan, X.; Llull, P.; Brady, D.J.; Sapiro, G.; Carin, L. Compressive sensing by learning a Gaussian mixture model from measurements. IEEE Trans. Image Process. 2015, 24, 106–119. [Google Scholar] [CrossRef]
  30. Xue, H.; Zhang, S.J.; Su, Y.K.; Wu, Z.Z. Capital cost optimization for prefabrication: A factor analysis evaluation model. Sustainability 2018, 10, 159. [Google Scholar] [CrossRef]
  31. Shi, H.R. Research on Feature Extraction of Micro Motion Target and Reconstruction of Incomplete Signal. Master’ Thesis, XiDian University, Xi’an, China, May 2017. [Google Scholar]
  32. Pedregosa, F.; Varoquaux, G.; Gramfort, A.; Michel, V.; Thirion, B.; Grisel, O.; Blondel, M.; Prettenhofer, P.; Weiss, R.; Dubourg, V.; et al. Scikit-learn: Machine learning in python. J. Mach. Learn. Res. 2011, 12, 2825–2830. [Google Scholar]
  33. Li, Y.; Fu, K.; Sun, H.; Sun, X.W. An aircraft detection framework based on reinforcement learning and convolutional neural networks in remote sensing images. Remote Sens. 2018, 10, 243. [Google Scholar] [CrossRef]
  34. Rikhtegar, A.; Pooyan, M.; Manzuri-Shalmani, M.T. Ga-optimized structure of CNN for face recognition applications. IET Comput. Vis. 2016, 10. [Google Scholar] [CrossRef]
  35. Zhao, A.; Fu, K.; Wang, S.Y.; Zuo, J.W. Aircraft recognition based on landmark detection in remote sensing images. IEEE Geosci. Remote Sens. Lett. 2017, 14, 1413–1417. [Google Scholar] [CrossRef]
  36. Zuo, J.W.; Xu, G.L.; Fu, K.; Sun, X.W. Aircraft type recognition based on segmentation with deep convolutional neural networks. IEEE Geosci. Remote Sens. Lett. 2018, 15, 282–286. [Google Scholar] [CrossRef]
  37. Krizhevsky, A.; Sutskever, I.; Hinton, G. ImageNet classification with deep convolutional neural networks. In Proceedings of the 26th Annual Conference on Neural Information Processing Systems, Lake Tahoe, NV, USA, 3–6 December 2012. [Google Scholar]
  38. Simonyan, K.; Zisserman, A. Very deep convolutional networks for large-scale image recognition. arXiv 2014, arXiv:1409.1556. [Google Scholar]
  39. Zhang, Y.H.; Sun, H.; Zuo, J.W.; Wang, H.Q.; Xu, G.L.; Sun, X. Aircraft type recognition in remote sensing images based on feature learning with conditional generative adversarial networks. Remote Sens. 2018, 10, 1123. [Google Scholar] [CrossRef]
  40. Wang, D.; He, X.; Yu, H. A method of aircraft image target recognition based on modified PCA features and SVM. In Proceedings of the 9th International Conference on Electronic Measurement & Instruments, Beijing, China, 16–19 August 2009. [Google Scholar]
  41. Diao, W.; Sun, X.; Dou, F.; Yan, M.; Wang, H.; Fu, K. Object recognition in remote sensing images using sparse deep belief networks. Remote Sens. Lett. 2015, 6, 745–754. [Google Scholar] [CrossRef]
  42. Donoho, D.L. Compressed sensing. IEEE Trans. Inf. Theory 2006, 52, 1289–1306. [Google Scholar] [CrossRef]
  43. Tropp, J.A.; Gilbert, A.C. Signal recovery from random measurements via orthogonal matching pursuit. IEEE Trans. Inf. Theory 2007, 53, 4655–4666. [Google Scholar] [CrossRef] [Green Version]
  44. Li, S.D.; Pei, W.J.; Yang, J.; Hu, G.Q. OMP reconstruction algorithm via Bayesian model and its application. Syst. Eng. Electron. 2015, 37, 246–251. [Google Scholar]
  45. Li, M.; Wu, J.J.; Zuo, L.; Song, W.J.; Liu, H.M. Aircraft target classification and recognition algorithm based on measured data. J. Electron. Inf. Technol. 2018, 40, 2606–2612. [Google Scholar]
  46. Mario, G.; Thorsten, R.; Christoph, E.; Thomas, U. Remote sensing based binary classification of maize. Dealing with residual autocorrelation in sparse sample situations. Remote Sens. 2019, 11, 2172. [Google Scholar]
  47. Man, Q.X.; Dong, P.L. Extraction of urban objects in cloud shadows on the basis of fusion of airborne LiDAR and hyperspectral data. Remote Sens. 2019, 11, 713. [Google Scholar] [CrossRef] [Green Version]
  48. Gapper, J.J.; EI-Askary, H.; Linstead, E.; Piechota, T. Coral Reef change Detection in Remote Pacific islands using support vector machine classifiers. Remote Sens. 2019, 11, 1525. [Google Scholar] [CrossRef] [Green Version]
  49. Kutyniok, G. Compressed Sensing: Theory and Applications; Cambridge University Press,: Cambridge, UK, 2012; pp. 1–20. [Google Scholar]
  50. Rauhut, H.; Schnass, K.; Vandergheynst, P. Compressed sensing and redundant dictionaries. IEEE Trans. Inf. Theory 2008, 54, 2210–2219. [Google Scholar] [CrossRef] [Green Version]
  51. Vapnik, V.N. Statistical Learning Theory; Wiley: New York, NY, USA, 1998. [Google Scholar]
Figure 1. Geometry between radar and rotor target: (a) space geometry; (b) 2-D plane geometry.
Remotesensing 11 02700 g001
Figure 2. Target frequency domain echo: (a) helicopter; (b) propeller; (c) jet.
Remotesensing 11 02700 g002
Figure 3. The definition of multi-wave gates echo data.
Remotesensing 11 02700 g003
Figure 4. Description of complete and sparse echo data: (a) complete echo data; (b) sparse echo data.
Remotesensing 11 02700 g004
Figure 5. Reconstructed frequency domain echoes of SL0 algorithm: (a) Helicopter; (b) Propeller; (c) Jet.
Remotesensing 11 02700 g005
Figure 6. Reconstructed frequency domain echoes of OMP algorithm: (a) helicopter; (b) propeller; (c) jet.
Remotesensing 11 02700 g006
Figure 7. Results of extracted features: (a) amplitude deviation coefficient; (b) frequency domain waveform entropy; (c) time domain waveform entropy.
Remotesensing 11 02700 g007
Figure 8. Result of fusing the features extracted from four wave gates echo data: (a) amplitude deviation coefficient; (b) frequency domain waveform entropy; (c) time domain waveform entropy.
Remotesensing 11 02700 g008
Figure 9. Three-class support vector machine (SVM) model.
Remotesensing 11 02700 g009
Figure 10. Flowchart of the proposed classification algorithm.
Remotesensing 11 02700 g010
Figure 11. Contrast experiment of reconstruction algorithm.
Remotesensing 11 02700 g011
Figure 12. Selection experiment of wave gate number.
Remotesensing 11 02700 g012
Figure 13. Classification results of single wave gate echo data for training and four wave gates echo data for testing.
Remotesensing 11 02700 g013
Figure 14. Classification results using four wave gates echo data for both training and testing.
Remotesensing 11 02700 g014
Table 1. Three kinds of aircraft targets simulation parameters.
Target TypeRotor Length
(m)
Blade NumberRotation Velocity
(rad/s)
Translational Velocity (km/h)
Helicopter8420250
Propeller24130500
Jet127380800
Table 2. Main steps of orthogonal matching pursuit (OMP) reconstruction algorithm.
Input: estimated signal Y M , dictionary matrix Φ M × N , error threshold ε 0 .
Initialization: let the iterative counter k = 1 , residual matrix γ 0 = Y , the index set Λ 0 = .
Iteration: at the k -th iteration
(1) Update the index set Λ k = Λ k 1 λ k , where λ k = arg max i = 1 , 2 , , N | γ k 1 , φ i | , φ i is the i-th column of Φ .
(2) Update the support set Φ Λ k = [ Φ Λ k 1 , φ λ k ] , and calculate the signal X ^ k = arg max Y Φ Λ k X k 2 = ( Φ Λ k H Φ Λ k ) 1 Φ Λ k H Y .
(3) Update the residual matrix γ k = Y Φ Λ k X ^ k .
(4) Increment k , and return to Step (1) until the stopping criterion γ k 2 ε 0 is met. The selection of the error threshold ε 0 is related to the precision requirement.
Output: Reconstructed signal X ^ = X ^ k .
Table 3. Main steps of smoothed l0 norm (SL0) reconstruction algorithm.
Input: estimated signal Y M , dictionary matrix Φ M × N , the search step length α .
Initialization: Choose an appropriate standard deviation parameter decrement sequence [ σ 1 , σ 2 , , σ I ] , the outer loop number is I , the inner loop number is J . The initial solution is the minimum L2 norm of Y = Φ X , that is X 0 = ( Φ H Φ ) 1 Φ H Y .
Iteration:
(1) The i -th outer iteration, i = 1 , 2 , , I , at this time σ = σ i , X = X i 1 .
(2) The j -th inner iteration, j = 1 , 2 , , J
 1. Update the signal with X = X + α d , where d = [ x 1 exp ( x 1 2 / 2 σ 2 ) , , x n exp ( x n 2 / 2 σ 2 ) ] .
 2. Project X onto the feasible domain, that is X X Φ H ( Φ Φ H ) 1 ( Φ X Y ) .
(3) Update the reconstructed signal X ^ i = X .
Output: Reconstructed signal X ^ = X ^ I .
Table 4. Comparison of variance of extracted features whether to fuse or not.
Target TypeAmplitude Deviation Coefficient ( × 10 4 ) Frequency Domain Waveform EntropyTime Domain Waveform Entropy ( × 10 3 )
No FusionFusionNo FusionFusionNo FusionFusion
Helicopter8.602.190.450.138.501.60
Propeller11.002.700.980.3118.604.80
Jet0.210.140.270.090.310.27

