Article

Robot-Assisted Floor Surface Profiling Using Low-Cost Sensors

1
Department of Mechanical and Electrical Engineering, SF&AT, Massey University, Auckland 0632, New Zealand
2
Massey Agritech Partnership Research Centre, SF&AT, Massey University, Palmerston North 4442, New Zealand
*
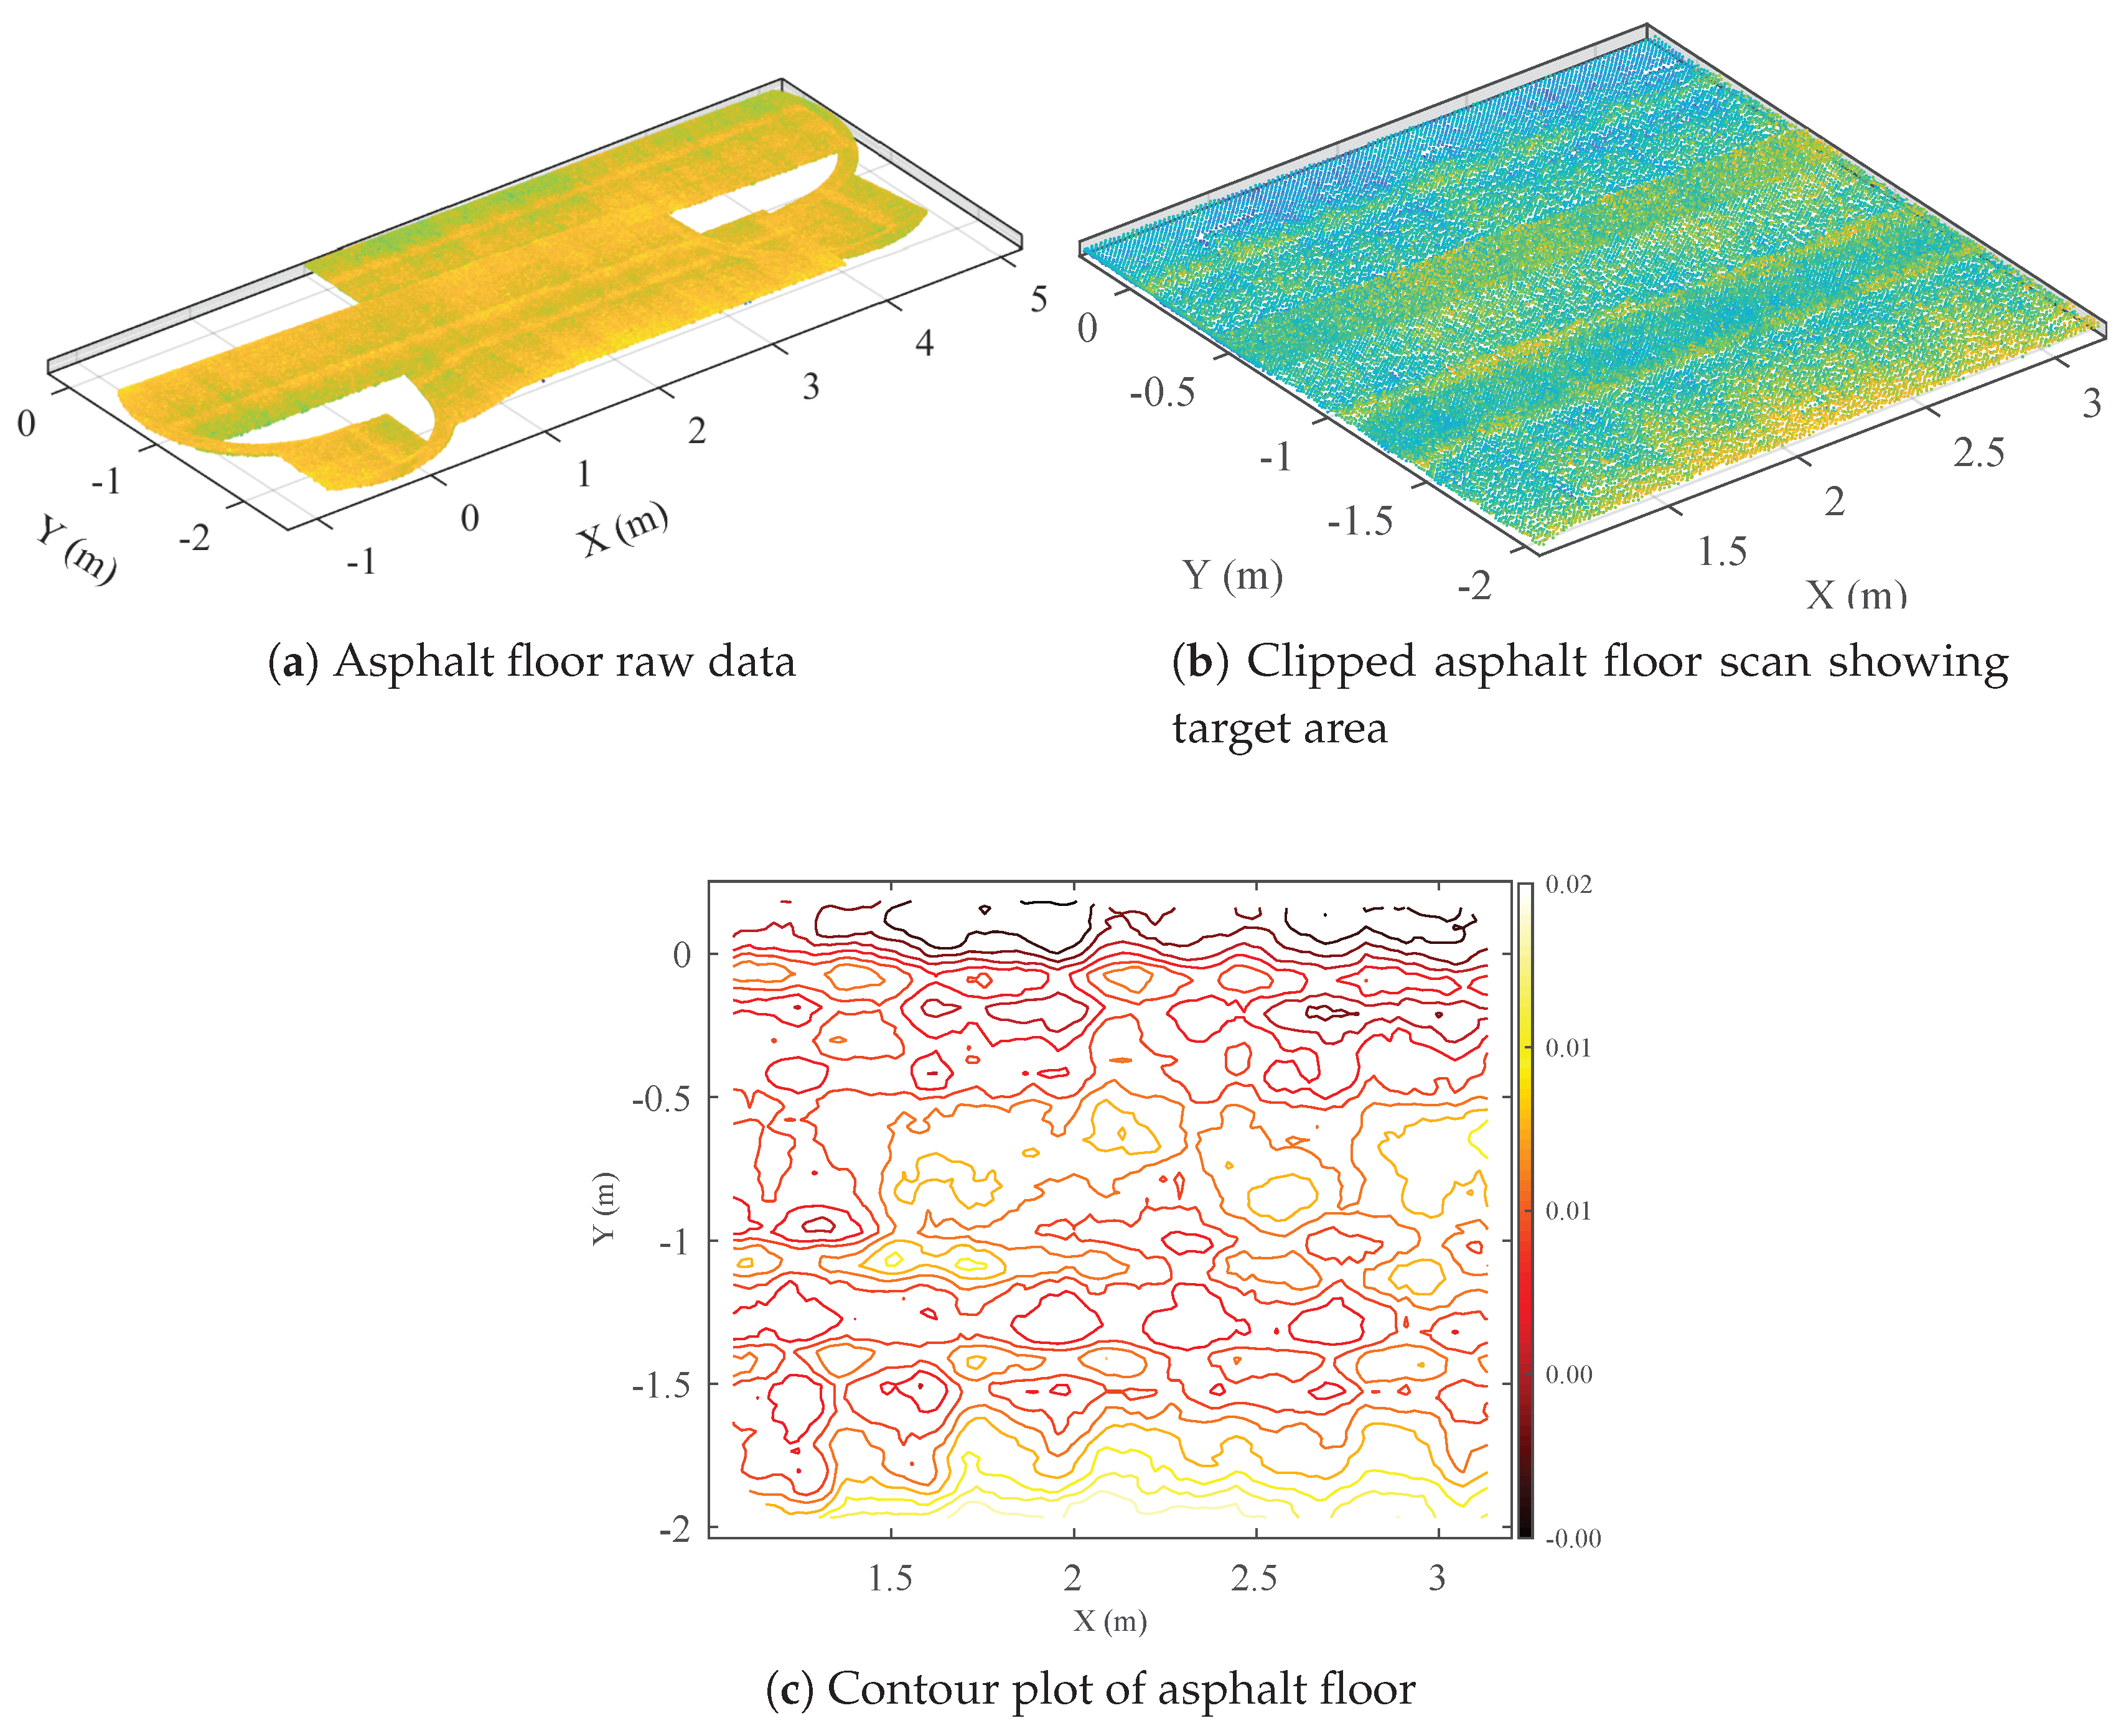
Author to whom correspondence should be addressed.
Remote Sens. 2019, 11(22), 2626; https://doi.org/10.3390/rs11222626
Submission received: 9 October 2019 / Revised: 6 November 2019 / Accepted: 7 November 2019 / Published: 10 November 2019

Abstract

:
Low cost and accurate 3D surface profiling can help in numerous industry applications including inspection tasks, cleaning, minimizing bumps in navigation of non-uniform terrain, aid navigation, and road/pavement condition analysis. However, most of the available systems are costly or inaccessible for widespread use. This research presents investigation into the capability of cheap and accessible sensors to capture the floor surface profile information. A differential drive robotic platform has been developed to perform testing and conduct the research. 2D localization methods are extrapolated into 3D for the floor capturing process. Two different types of sensors, a 2D laser scanner and an RGB-D camera, are used for comparison of the floor profile capture ability. The robotic system is able to successfully capture the floor surface profile of a number of different type floors such as carpet, asphalt, and a coated floor. A key finding is that the surface itself is a significant factor on the measured profile, i.e., dirt or other materials can cause false height measurements. Overall, the methodology has proved a successful real time solution for creating a point cloud of the floor surface.

1. Introduction

For a number of industry applications, a low cost yet accurate 3D surface profiling system is required [1]. A 3D map can easily be achieved through the use of a 3D Terrestrial Laser Scanner (TLS) [2,3,4], however, these can be costly, and therefore may not be practical for some applications. In addition, these applications can often require large areas to be scanned and processed. This makes using technology such as interferometry or lab based stylus systems not as practical despite the incredible accuracy and resolution available. Effectively mapping a terrain, in particular, a floor for use as prior knowledge is not widespread. Prior knowledge of a floor can help in navigation and decision making in numerous applications. These include; inspection tasks, cleaning, minimizing bumps in navigation of non-uniform terrain, aid navigation, and road/pavement condition analysis [5,6]. Mapping the floor, or surface profile mapping, has been achieved through similar means of creating a 2D or 3D map. Optical Interferometry can provide high accuracy and high resolution surface profiles. However, the process is often susceptible to errors due to vibration, temperature, or air flow, and this often rules it out for a number of applications, such as larger floor areas. Gao et al. [7] investigated two methods to minimize the errors due to vibration when using interferometry as a method to map the surface of a shop floor. 3D Terrestrial Laser Scanners have been able to provide high density point cloud surfaces, such as pavement and asphalt, that can then be processed into useful information [2,3,4]. These scanners are typically used as stationary measurement machines, however, Chow et al. [8] investigated fusing an inertial Measurement Unit (IMU) with an RGB-D Camera for assisting localization of a Stop and Go scanning solution. The Stop and Go style of mapping can cause increased scanning time, and combined with an expensive 3D Terrestrial Laser Scanner, is not practical for some applications. Moving an accurate yet cheaper 2D or ‘small measurement area’ sensor over the target floor can be a feasible method of reducing both time and cost, and has potential for low cost automation. Mobile Laser Scanning and Mapping systems have been of research interest since the early 1990s [9] and can provide an autonomous and cheaper alternative to 3D mapping solutions. Zlot et al. [10] investigated the use of replacing the expensive 3D laser scanners with a series of 2D laser scanners mounted on a vehicle for mapping a mining tunnel. Three 2D laser scanners were used, one mounted on a rotating platform performing 3D SLAM, and the other two mounted vertically covering almost 360 degrees. The results were promising, showing the combination of SLAM and surface mapping to create accurate 3D models. Banica et al. [11] used two sets of laser based imaging systems spatially correlated through the use of proximity sensors, odometry, and geolocation. Wen et al. [12] investigated using a single 2D laser scanner to provide localization, whilst a RGB-D Sensor provided a 3D map of the environment. A common challenge for mobile mapping systems, where Global Navigation Satellite information is not possible or reliable, is localization, and accurately matching a measurement to a global frame. Wen et al. overcame this using their fused 2D LIDAR and RGB-D Sensor using loop closure detection by particle weight as well as pose graph optimization by minimizing nonlinear error functions, helping to minimize global inconsistencies. This paper describes the development of a robotic research platform for testing the floor surface scanning and modeling capability. The research platform is designed to be easily portable and enabling fast development of control, as well as efficient testing of systems such as floor scanning. The development of the platform is discussed in terms of the mechanical, electrical, and software systems used. The algorithm for capturing the floor profile and for planning the coverage path is discussed. Initial tests of the floor surface capture system provide insight into further development and challenges. A number of the challenges are addressed and the methodology for testing as well as improving the system is analyzed. Further improvements to the robotic platform after initial testing are discussed as well as the methodology used to capture and measure the floor surface profile.

2. Robotic Platform Development

The floor surface capture system aims to utilize low-cost and accessible sensors. This can be achieved through using one sensor to localize the robot and a second sensor to capture floor surface data. The sensor can be moved through the environment and the resulting captured data stitched into a 3D profile. In order to move a sensor through the environment to capture the required data, a moving platform is required. This platform must be relatively robust, and capable of providing an adequate support for the sensors to be mounted on it. Continuous scanning of an environment also requires accurate localization of the robot. The robotic platform must therefore be capable of localizing whilst capturing the floor surface profile data. A 3D surface profile of the floor must provide enough accurate information for further application-specific analysis (such as flatness) to be performed. The measurement process should also be easy to set up, autonomous, and be performed relatively quickly. This was achieved through the use of a mobile robotic platform running Robot Operating System (ROS). A 2D laser scanner was used to create a series of scan lines of the surface as the robot moved. Each scan measured the distance to the floor along the scan. The scan lines were stitched together using the robot’s position and orientation in space, creating a series of points that formed a 3D surface of the floor. Analysis of the accuracy of the resulting 3D point cloud can help identify key application considerations and develop a low-cost surface profile mobile mapping system.

2.1. System Requirements

The research platform is designed to be easily portable and enable fast development of control, as well as efficient testing of systems such as floor scanning.

2.2. Mechanical System

The robotic platform (Figure 1) is a differential drive robot with two drive motors at the rear. The front of the platform is supported by a castor wheel. The robot has two levels: one providing a base for a horizontal laser scanner for SLAM, and the other holding components for control and communication and providing a mount for a second sensor to scan the floor. An adjustable sensor mount was developed to provide the means for measuring a floor profile at various angles and with different sensors. The mount was designed to be relatively universal and sufficiently strong to hold a variety of floor scanners in position as the robot moves around the room. The mount was designed to hold components weighing at least 6 kg and could easily be adjusted 180-degrees in pitch and then locked in place. It was made out of 3 mm steel bent into shape. Figure 1 inset shows the adjustable mount with an Intel RealSense RGB-D camera on the underside and an IMU on the top. The camera is mounted on a second adjustable frame that can be manually tuned to ensure that the camera is level. The motors are mounted directly into the supports of the frame using 4x M5 bolts. This mounting is sufficient for the test platform, but it may need to be strengthened for the final robot due to additional loading from the weight of the extra components.

2.3. Electrical System

The electrical system consists of power distribution and communication connections. A power distribution board was designed to provide power to each component, protected by fuses and controlled through relays. The main power demands are 24 V, 12 V, and 5 V. The 24 V system is limited to a maximum of 50 A from the battery and is protected by fuses. Each 12 and 5 V component has a fuse to restrict current, ranging from 0.5 A fuses to 5 A fuses. Additional ports were supplied for future expansion. A schematic of the power distribution board was designed using Circuit Studio. The board takes in 24 V and provides 12 V via a 24 V to 12 V converter. The 12 V is then converted to 5 V to power a microcontroller board (Arduino Uno) for relay control. There are 6 relays on the distribution board, 4 × 24 V and 2 × 12 V, which can be turned on and off from the Arduino. Each output port is protected by a fuse to help keep components safe. For a commercialized product, more-reliable control would be desirable; this could be achieved by a dedicated USB-controlled relay board or a PLC relay board. This component can easily be swapped out to achieve the required functionality at a later time.

2.4. Software System

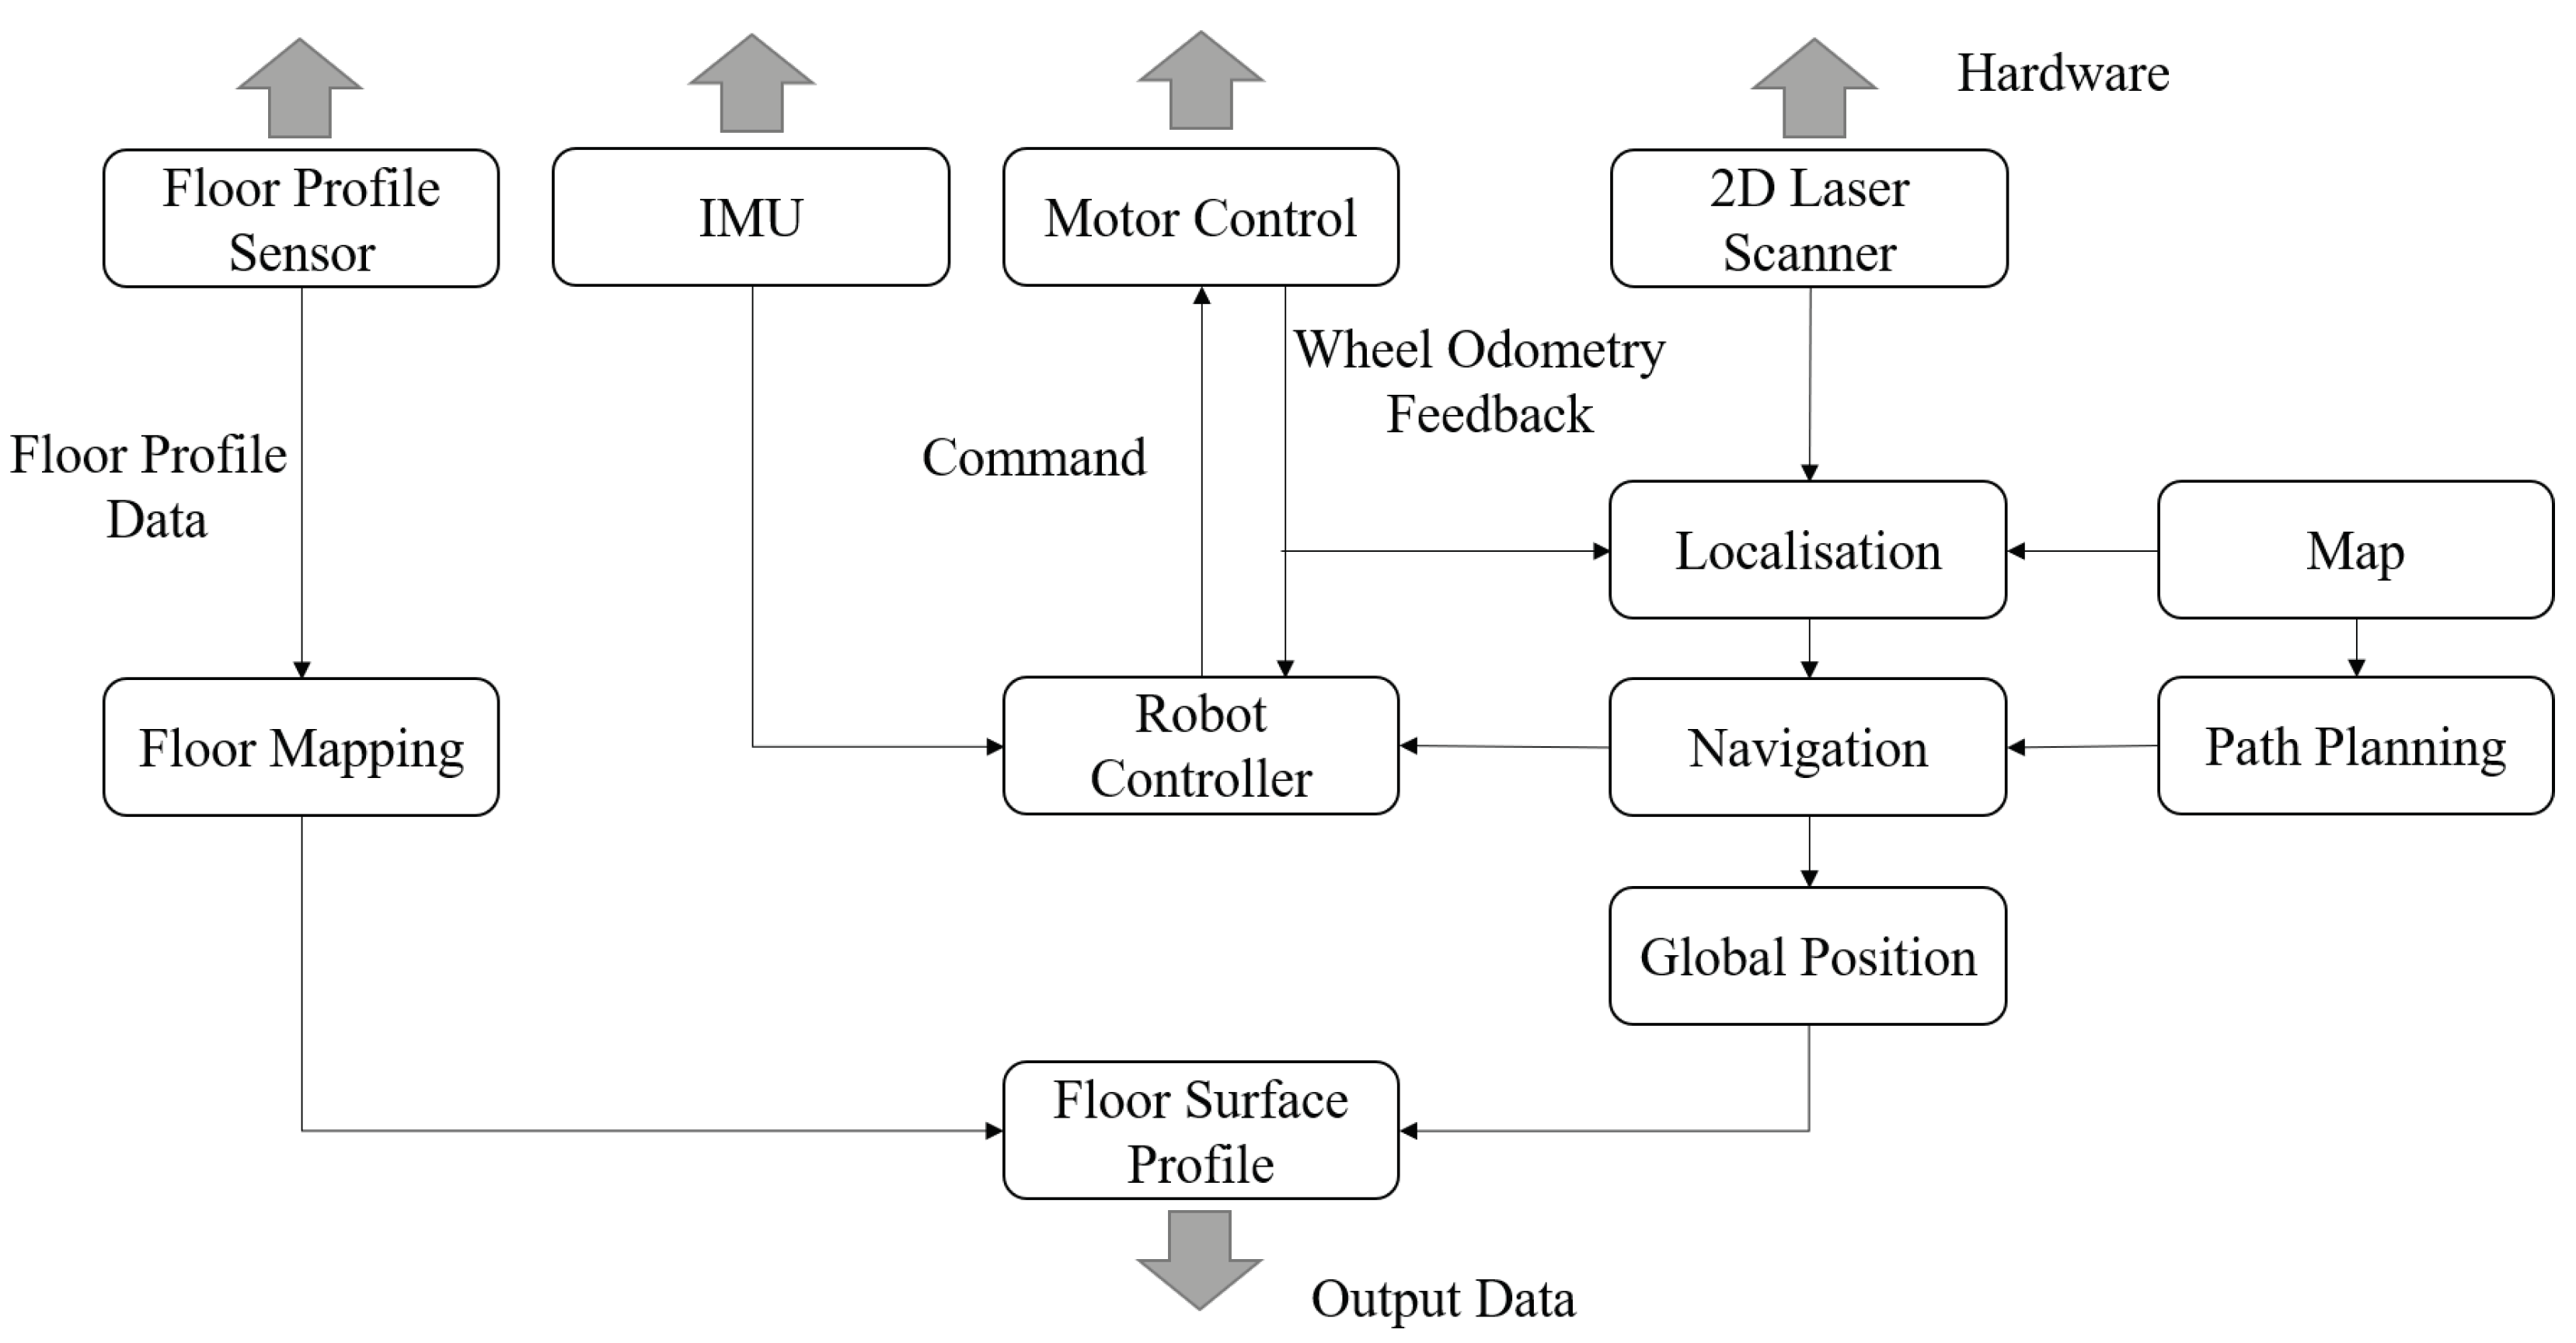
The robot uses the Robotic Operating System (ROS) framework for internal communication and control [13]. ROS is an open-source system that allows for the creation of many nodes that can communicate efficiently through the use of topics and services. The ROS system begins with a core, which provides the base communication framework. Nodes can be added to the system, which can communicate through the roscore using topics and services. Any node can publish or subscribe to any topic or service, providing a highly modular system. Due to the open-source nature of ROS, a community has provided a number of existing solutions to common problems, such as Adaptive Monte Carlo Localization (AMCL), Gmapping, and SLAM. This results in an efficient and proven framework. ROS was selected as the software framework because of its open-source nature, the modularity provided by nodes, and the ability to accelerate development using existing solutions. The ROS system for the research platform requires a number of components; the general architecture is shown in Figure 2.

2.5. Floor Profile Creation

A ROS package was developed to capture laser scans of a floor profile and assemble these into a point cloud that could then be analysed and used as prior knowledge. First, the raw laser scan data is filtered so that only the floor in front of the robot, spanning a 60-degree angle, is captured (Figure 1a). These laser scans are transformed through the robot relative to the robot’s base_link in the global space. As the robot moves through the environment, the base_link transform moves through the global coordinate system. This in turn moves the location of the laser scan and thus the laser scan data. Each laser scan provides a line scan of the floor profile at a point in the 3D global coordinate system. Assembling many of these single scan lines together therefore forms a series of lines and thus a surface of the floor profile. The assembled scans are captured by the laser_assembler package. A keyboard-controlled node calls the laser_assembler services to start and stop collecting data. Once the laser_assembler service is called to stop assembling, a point cloud of the assembled scans is published to the assembled_floor_scan topic. This topic can then be saved to a .pcd file for analysis. This is performed in real-time; however, the point cloud can only be viewed and analyzed once the full scan process has been completed. Alternative profile creation algorithms will be required for different scanning methods, such as RGB-D; and this will be discussed in Section 6.5.

3. Localization and Floor Scanning Sensor Selection

3.1. Localization Sensor

A sensor must be used to help aid localization to overcome the inherent accumulation of errors from wheel odometry. A number of different sensor technologies can be used, each offering different advantages and disadvantages. A selection of these technologies has been described in the literature review. Due to its affordability yet relatively good accuracy, range and resolution, a SICK LMS291 was selected for localization of the robot. This scanner provides a 2D laser scan of the environment, and can produce 50 mm accuracy up to 80 m or 35 mm accuracy up to 8 m [14]. The laser scanner can easily be integrated into the ROS framework with an existing ROS package. The sensor data can be used by Gmapping [15,16] to create a 2D map of the environment or by AMCL [17] to localize the robot in an already created map. AMCL uses a probabilistic approach to match the laser scans to likely positions in the map.

3.2. Floor Scanning Sensor

A sensor is required to capture the floor surface profile information. A number of technologies can be used for this task. Selected technologies are summarised in Table 1. A 2D laser scanner was selected for initial floor scanning, this is once again due to both accessibility and affordability. While 3D laser scanners have been used to perform accurate sensing of an environment, including the floor, they are very expensive and thus make them not feasible for some applications. The 2D laser scanner used for initial testing was a SICK LMS291 laser scanner, which is relatively cheap at around US$6000. The SICK LMS291 has an aperture range of 180-degrees, with an angular resolution of 0.25-degrees. At a range of up to 80 m the accuracy is ±50 mm, reducing to ±35 mm at a range of up to 8 m [14]. Additionally, a Hokuyo URG 2D laser scanner was used for further testing, due to its short-range design. The Hokuyo laser scanner has a detectable range of 20 mm to 5600 mm, with a field of view of 240-degrees at a resoltuion of 0.36-degrees [18]. However, despite having been designed for short-range use, the accuracy of this laser scanner is only ±30 mm. The cost of the Hokuyo laser scanner is around US$1080, substantially less than the other sensors. An RGB-D camera was selected as a secondary sensor for testing and comparison. The RGB-D camera used was a D435 Intel RealSense camera, which uses active IR stereo to produce a depth image alongside the RGB data from a 2 MP camera. [19]. Optical Interferometry can also provide detailed scans of a surface; however, often have long scan times or requires a textured surface for good performance. For example, a multi-laser-based scanner, the NextEngine 360 [20], performs very well with masonry. However, the sensor can take up to 2 min to perform a scan, rendering it unsuitable for this application. This sensor provides incredible accuracy, with up to ±100 microns for a macro model and up to ±300 micron for models with a wider field of view.

4. Initial Testing

The platform’s ability to capture a floor surface profile was initially tested using two 2D laser scanners. One laser scanner (mounted vertically) was used to capture the floor profile, while the other laser scanner (mounted horizontally) was used to localise the robot within the environment. The initial testing methodology and results were presented in [21].

4.1. Experiment Methodology

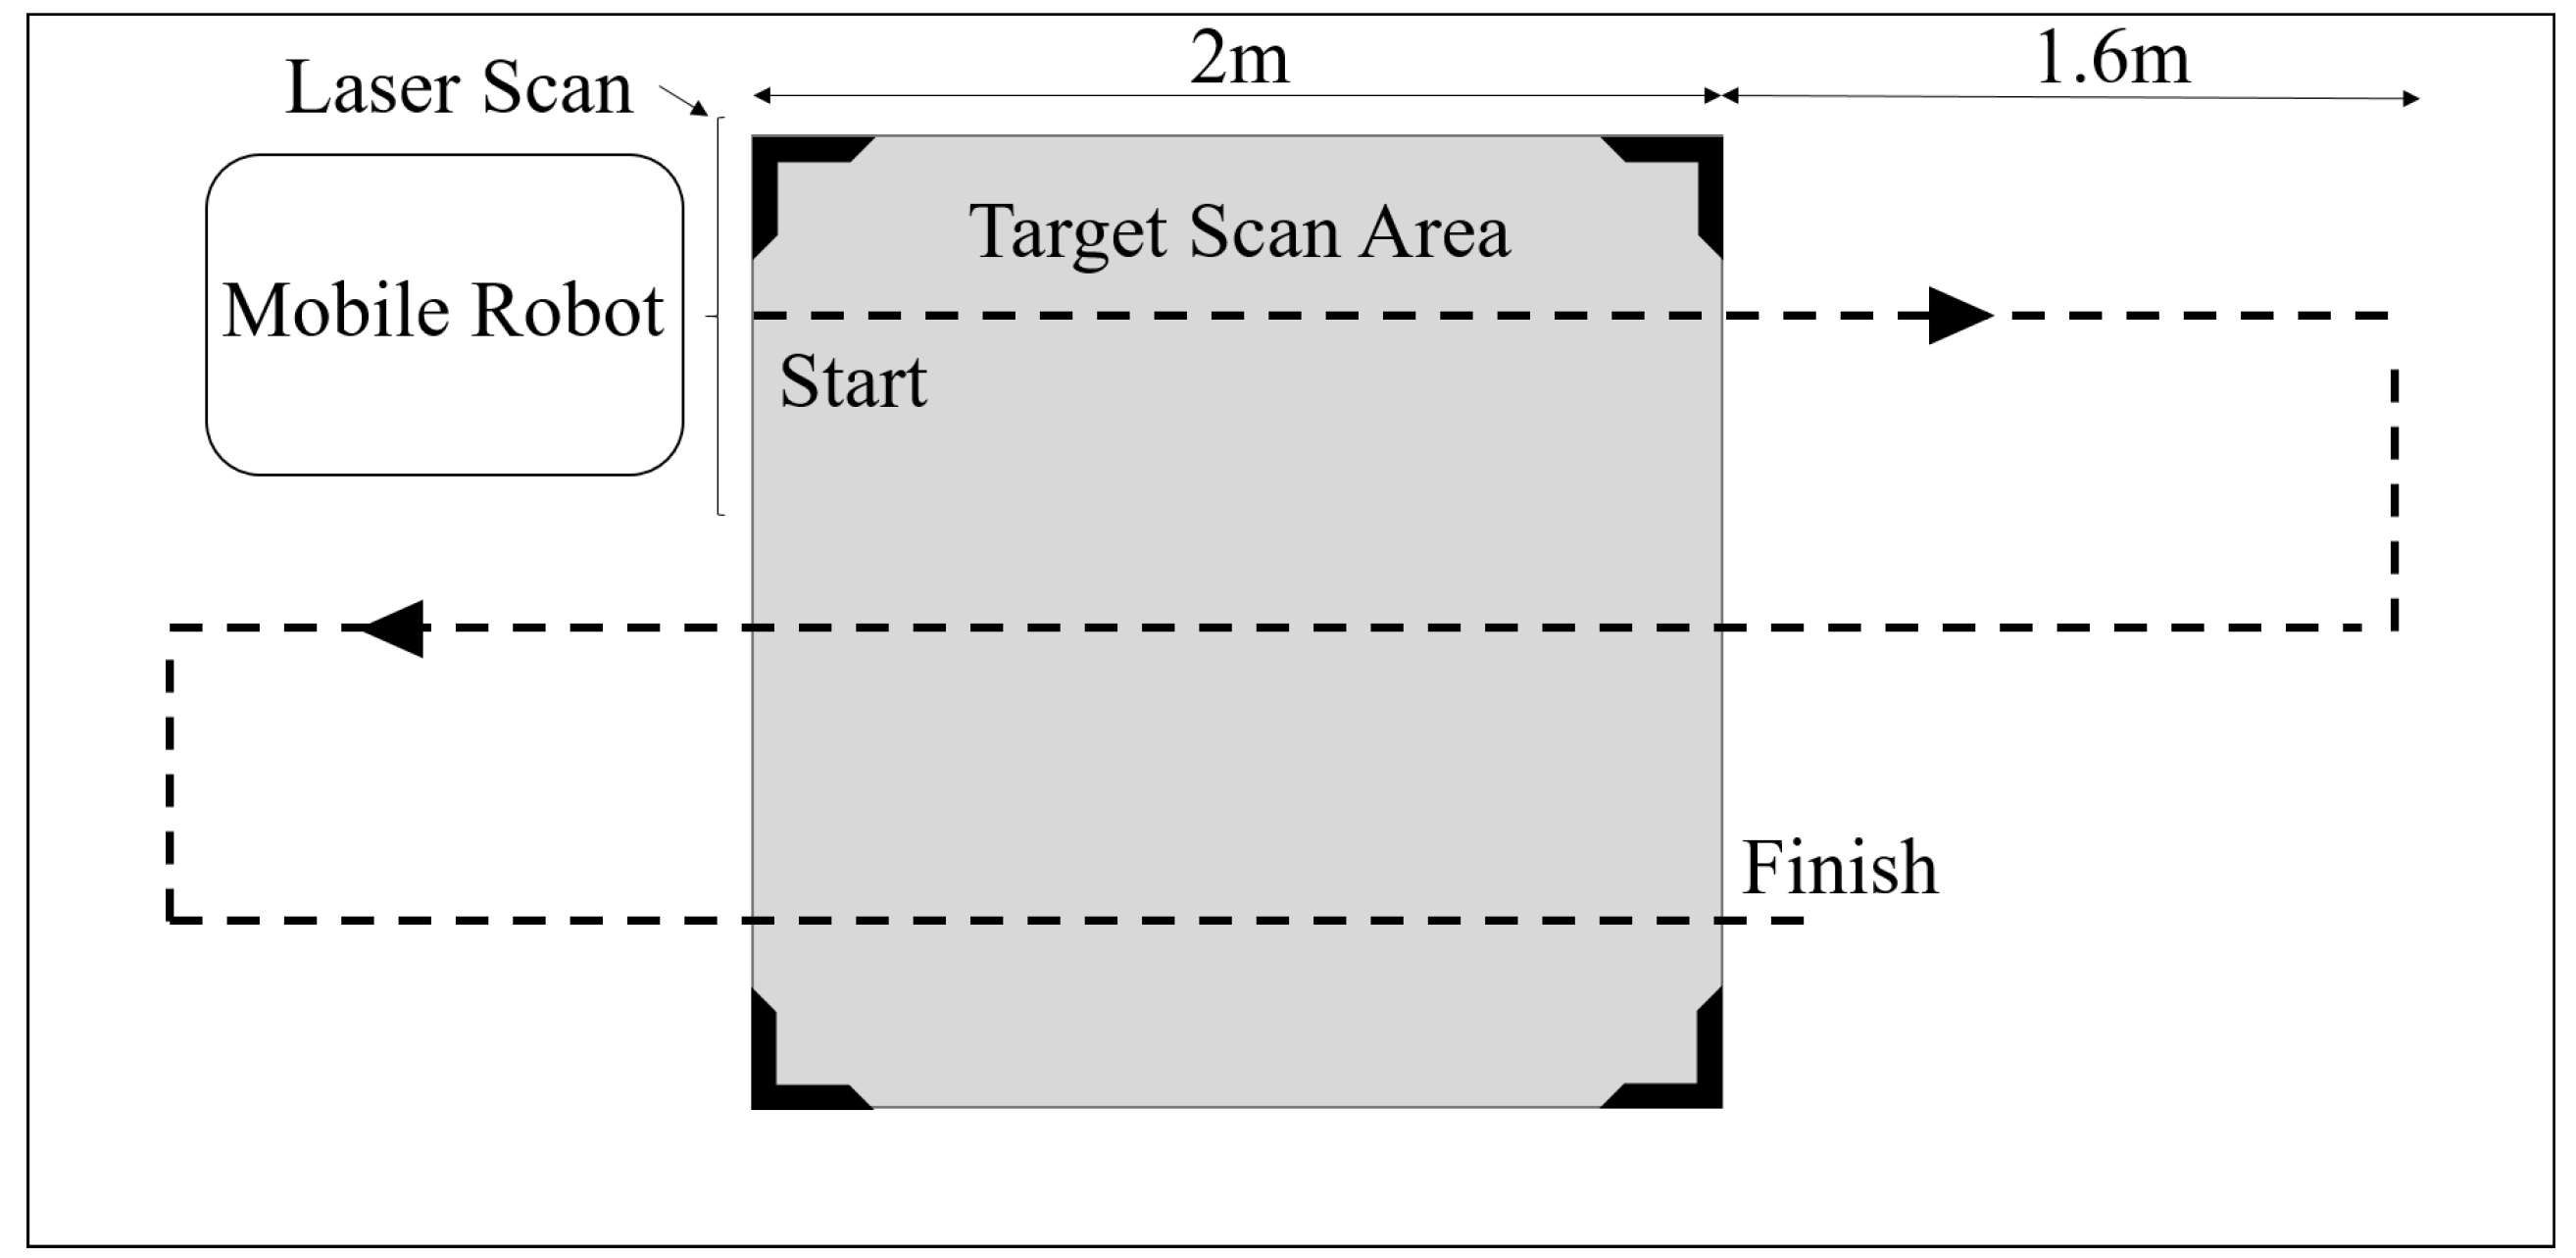
The scanning experiments were set in an area of 2 × 2 m 2 marked out with black electrical tape (Figure 3a–c). This tape has low reflectivity and high absorbency, resulting in a poor laser scan measurement that helps to identify the boundaries of the scanned area in the final assembled point cloud. The robot was positioned outside the lower left-hand corner of the square and then followed a coverage path (Figure 4). This path provided sufficient space for the robot to perform a turn and record scans of the surface. The robot moved at a relatively slow velocity of 0.1 ms 1 . At the beginning of each test, all laser scans were recorded in a ROS bag file for later analysis if required, and the real-time laser scan to point cloud conversion begun. This point cloud creation process involved capturing every laser scan and associated transform and placing them in a 3D coordinate system. The assembly of laser scans was then converted to a single point cloud of the floor, which was then saved as a .pcd file for analysis. In each test it took around six minutes to complete the coverage path. The robotic platform was used to map three different surfaces: carpet flooring (Figure 3a), outdoor asphalt pavement (Figure 3b), and a coated asphalt floor (workshop floor) (Figure 3c). These surfaces were chosen to provide a representative sample of various types of indoor flooring. The test surfaces were expected to give insight into how well the laser scanning could identify areas of interest for the different surfaces. Each surface was mapped three times and cross-analyzed to determine accuracy. A contour plot from the resulting point cloud was created and used to identify high and low areas of the floor.

4.2. Measurement Methods

The captured point cloud of each floor surface was saved as a .pcd file. MATLAB was used for processing, which involved clipping the scanned area to the target size of 2 m × 2 m. The ‘black tape’ outliers were removed by applying a threshold to the point cloud data set, and a Gaussian 5 × 5 filter was then applied to the data to smooth the resulting surface and reduce noise. The point cloud was then presented as a contour plot, indicating high and low areas throughout the 2 m × 2 m area. The surfaces were inspected by touch and visually for any deviations in flatness at key areas. These areas were noted and compared to the resulting point cloud and contour plot.

4.3. Initial Floor Capture Results

The mobile robot system was able to successfully locate itself and use this information to create a surface profile of each floor. The odometry information provided sufficient pose and orientation estimation to capture the general surface profile of each floor. Odometry errors were observed consistently in all tests. Additionally, systematic errors from the laser scanner were observed in all tests, illustrated by a continuous low measurement near the center of the scan.

4.3.1. Carpeted Floor

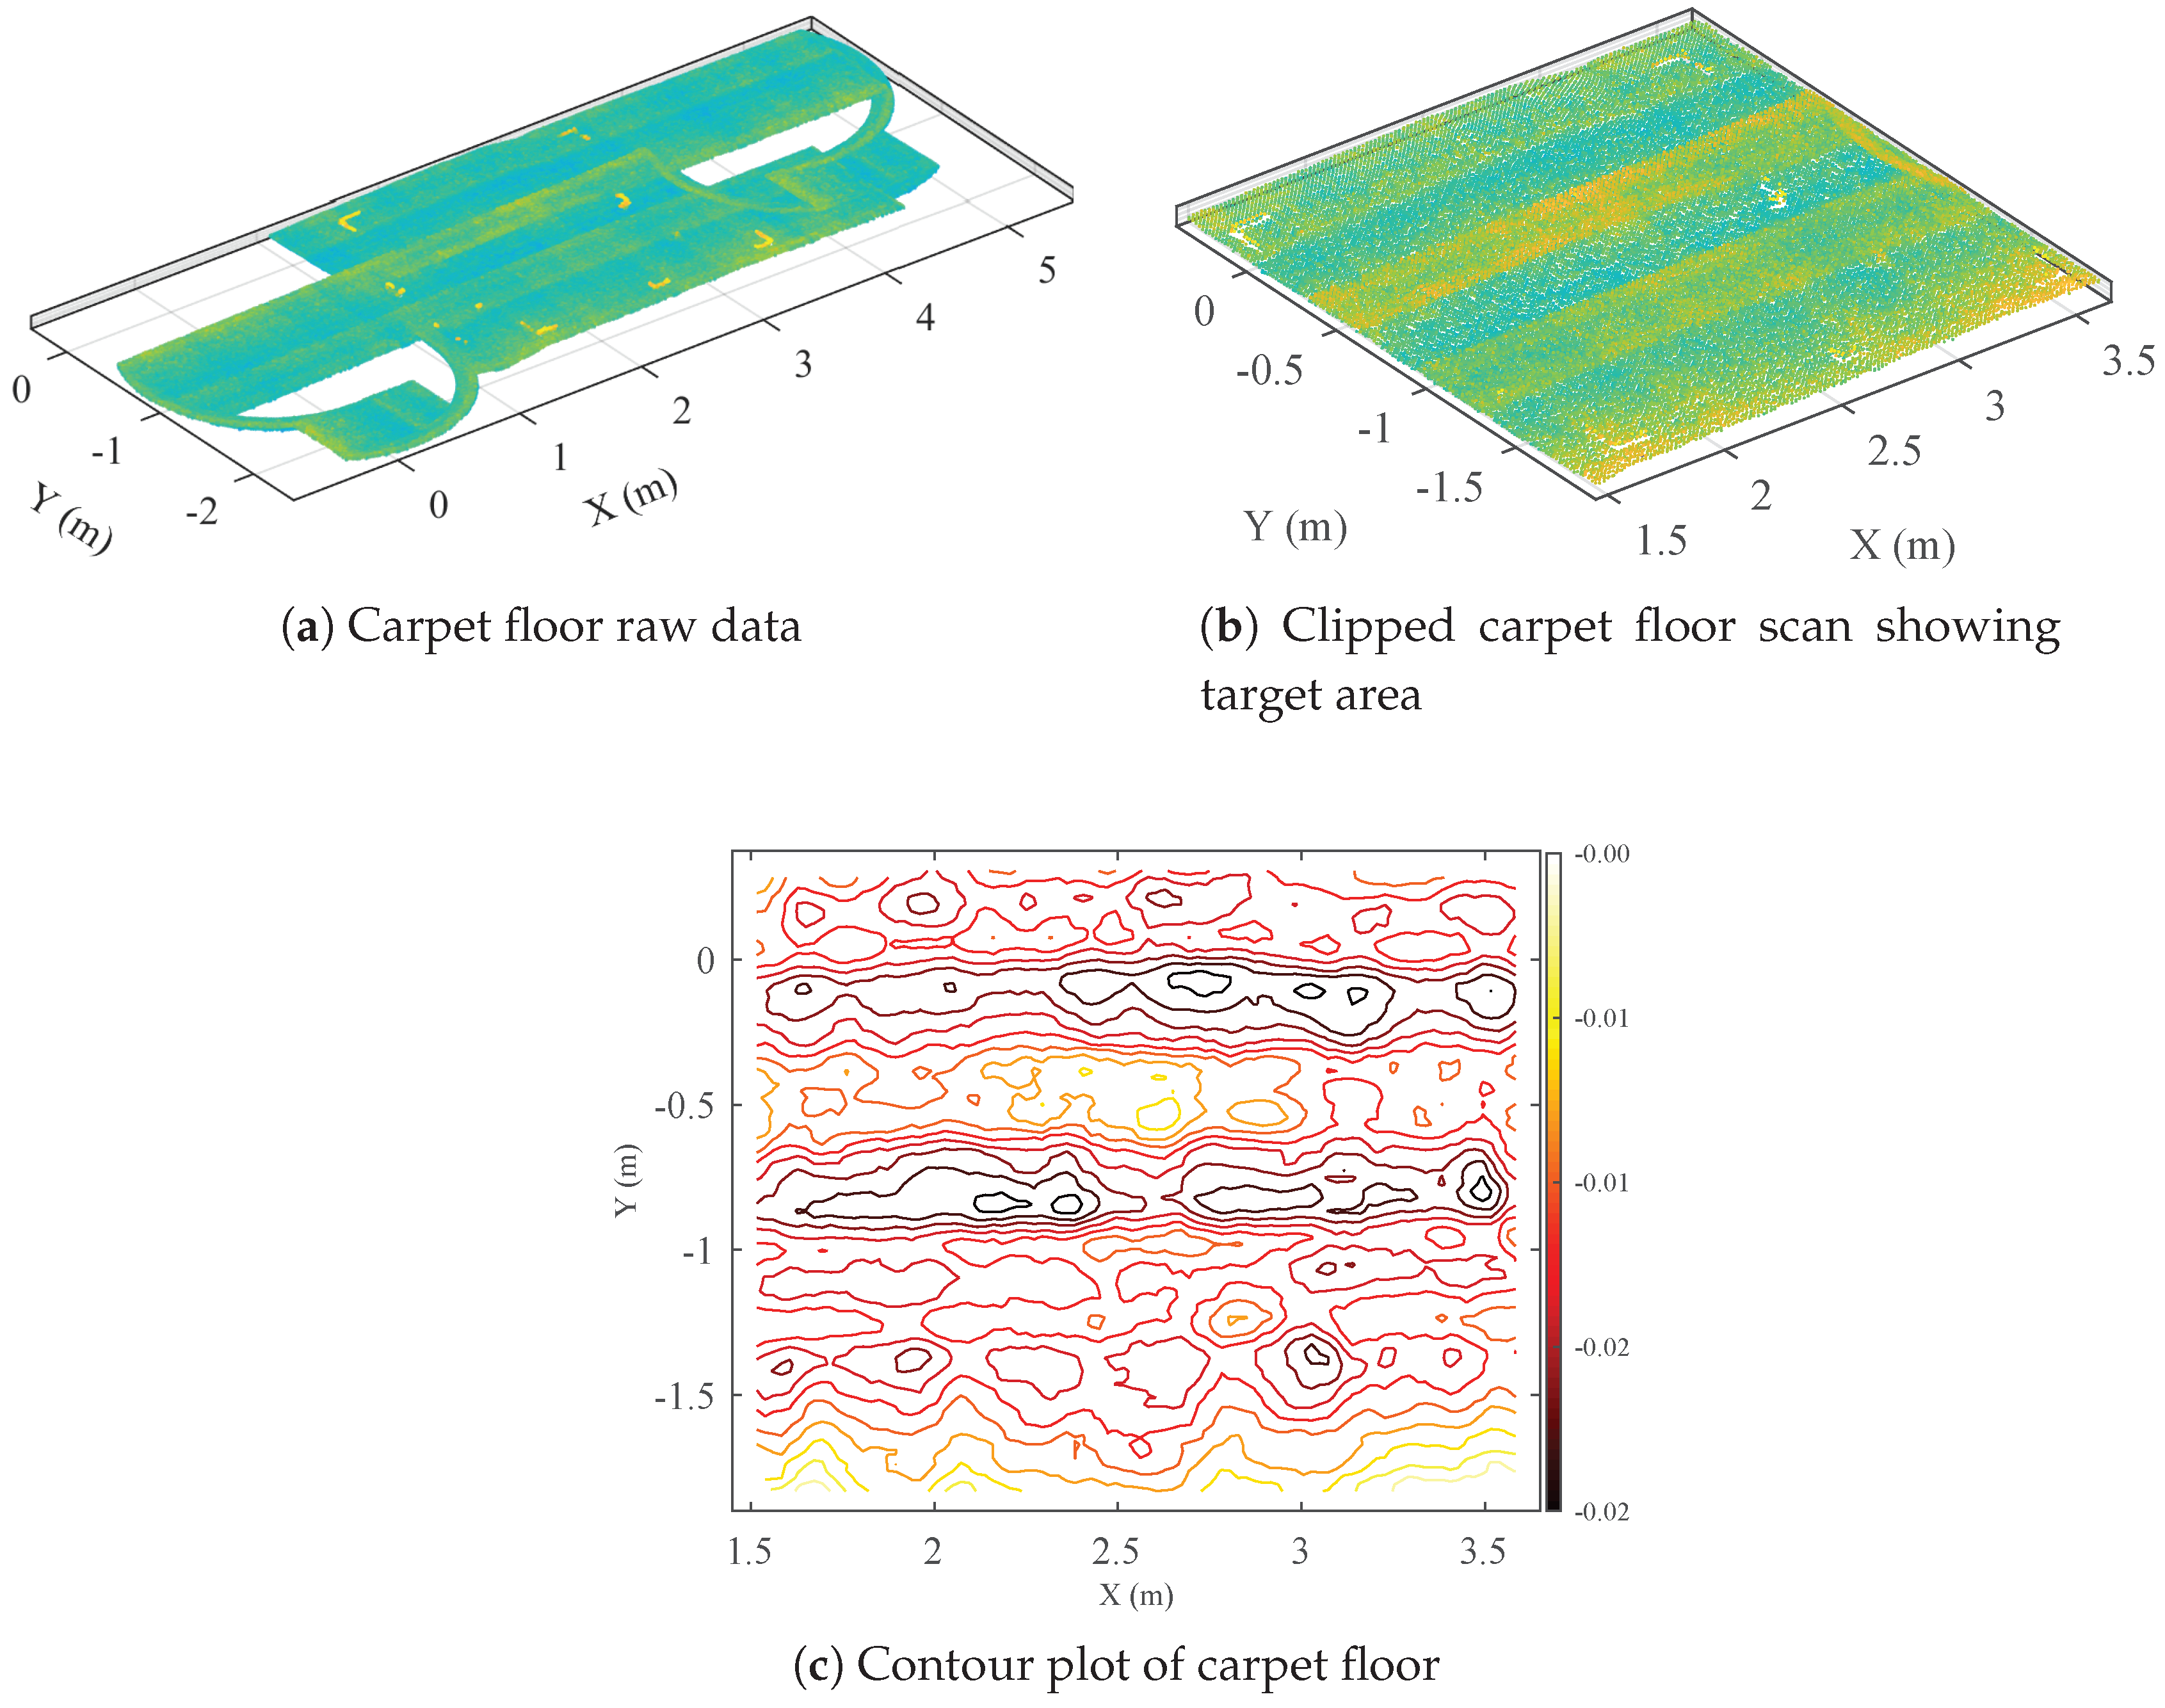
The carpeted floor was successfully mapped (Figure 5) despite being anticipated to be a difficult surface for consistent performance due to the fiber orientations of the carpet. The laser scan provided a reasonably thick surface measurement of 0.1 m. The carpet was difficult to inspect visually and appeared to be relatively flat. The contour plot (Figure 5c) shows a relatively flat area (with the systematic center scan error) and a slight high area towards the bottom of the target area.

4.3.2. Workshop Floor

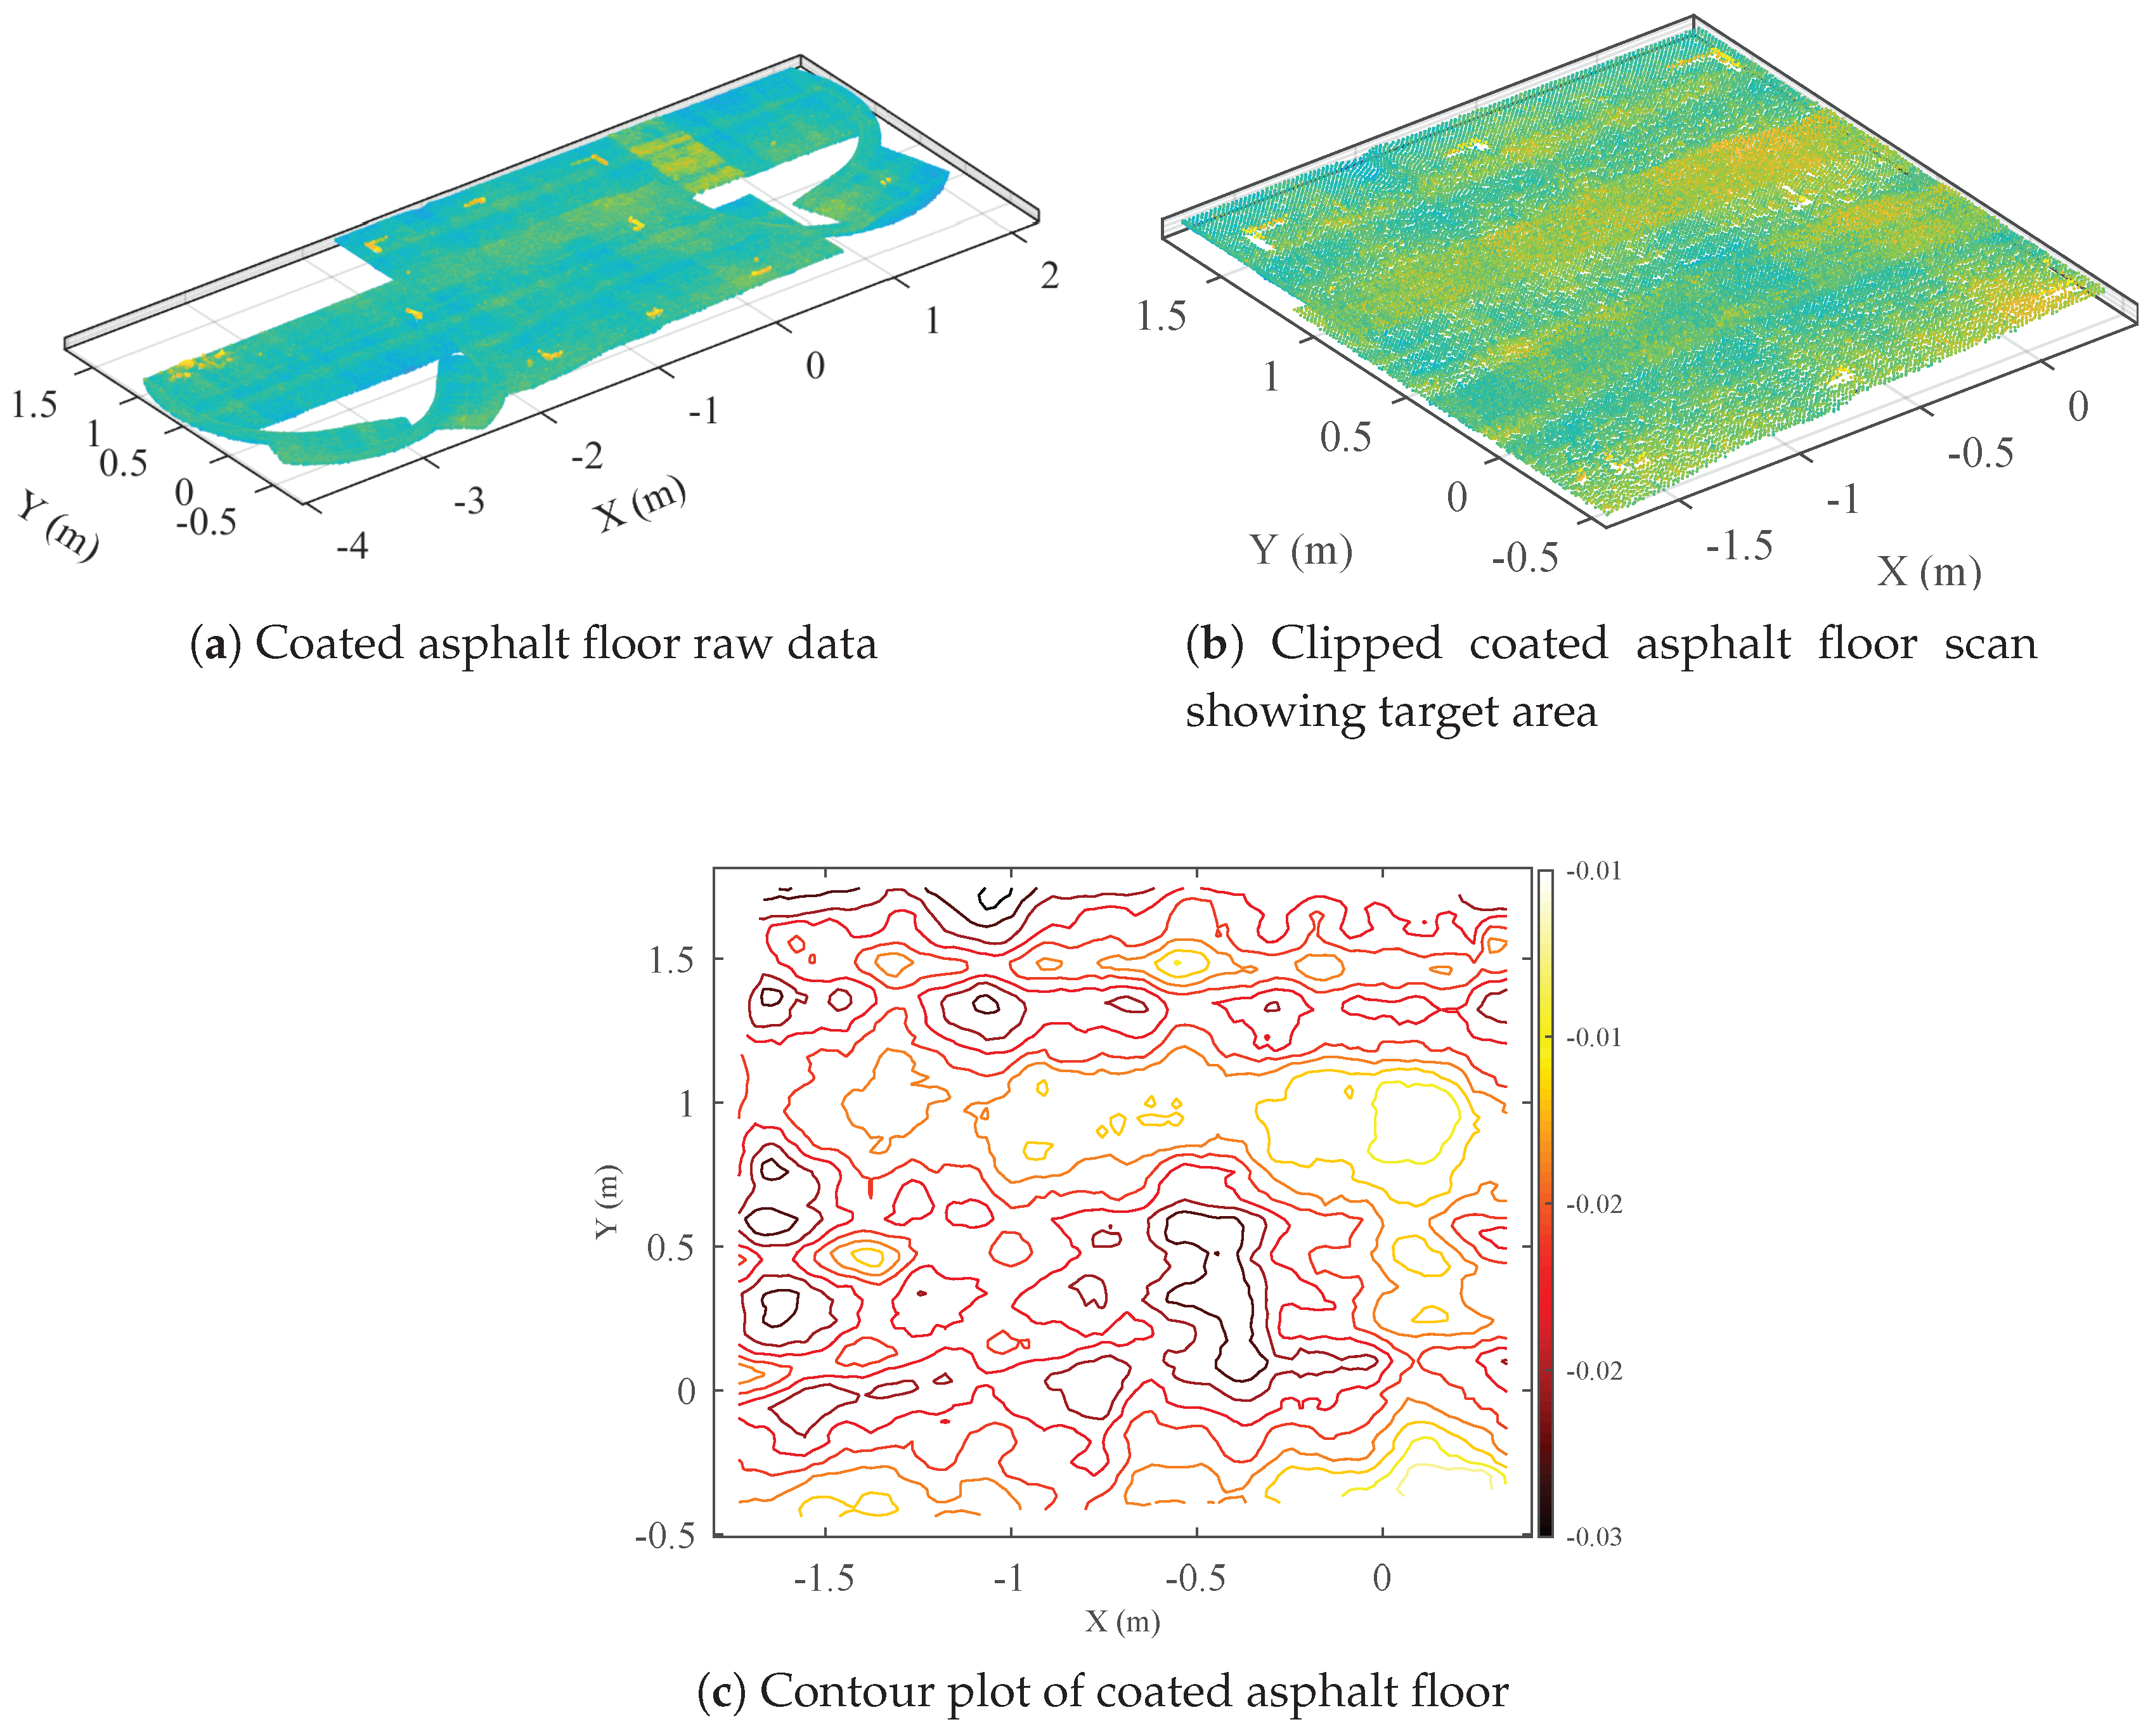
The workshop floor is an example of an indoor surface covered with dust, cracks and pits. This type of surface could be hard to map; however, from the results (Figure 6) it is clear that the scanning system could successfully create a consistent point cloud of the coated asphalt (workshop) floor. Despite the consistent low center measurement due to a systematic error, a high area was identified by the surface scanning system at the middle right of the target area (Figure 6c). This area was confirmed by visual inspection as a large step change in the floor. There are two-coin sized dents (30 mm diameter) in the floor of the workshop that the mapping system was unable to detect. However, the system did detect a general slope along the y axis.

4.3.3. Asphalt

Asphalt is another example of a difficult surface to map, as the colour and texture may vary due to weathering and wear and tear. This surface was also successfully mapped (Figure 7), demonstrating the strength of the developed system. Even though the entire surface was on a gradual slope, and no IMU data was available, the surface profile suggested a high point to the right and a low point to the left of the start position. A ridge in the surface was detected similarly to the coated asphalt floor, but upon inspection this high region was due to a rougher area of asphalt. The contour plot (Figure 7c) illustrates the general slope of the surface, with some deviations of the slope due to surface roughness and the systematic errors.

5. Initial Challenges

Although initial testing did prove to be successful, there are a number of improvements that can be made and challenges that can be overcome. The initial development and testing identified challenges that include: localization, sensor accuracy, and 2D limitations. These challenges are discussed in the following sections.

5.1. Localization

A particular challenge for the robot platform was accurate localization. Based on research conducted by Thrun et al. [17], the robot can use the horizontal laser scan for localization through the Adaptive Monte Carlo Localization (AMCL) ROS node. This node provides a laser scan matching and probabilistic approach for localizing the robot from the 2D laser scans. The probability of the robot position in a number of locations is calculated from the combined laser scan matching and wheel odometry information. The position with the highest probability is updated as the robot’s current position in the map. This method works well, although due to odometry errors and drift, the robot will jump to the calculated ‘correct’ position every time the AMCL node updates. These jumps are small and manageable in some applications, but for this particular application they are not desirable as this will result in a shift in the floor profile. The transformed laser scans will have gaps when the position jump occurs, and this could result in inaccurate floor profile estimation. This challenge can be overcome through a couple of different techniques. First, the jumping action can be minimized by calibrating the odometry to minimize errors and therefore minimize the possible jump in position. In practice this can be difficult due to a number of hard-to-control dynamic factors that can contribute to odometry errors, such as uneven floor, varying tyre pressure over time, axle alignment, wheel point of contact, and tyre slip. However, a similar process to that of Borenstein et al. [22] can be used to estimate the correct wheel radius and wheel separation parameters for odometry tuning. In addition, this can help identify any alignment issues with the robot that can then be allowed for through the wheel odometry calculation. An alternative solution for overcoming the jumping is to gather the transforms as the robot moves, and once AMCL updates the robot’s position, realign the previous positions to fit the known positions of the robot. This could be computationally expensive but could provide a consistent method of scanning the floor.

5.2. 2D Limitations

The ROS system utilized is largely built around the assumption of a flat 2D surface; in particular, the robot is set up to have the base_link attached to the 2D planar floor, and the laser scanners can only capture data in 2D. However, the surface the robot moves along is 3D, and involves 6 dimensions of robot pose and orientation (x, y, z, roll, pitch, yaw). This means that these 2D assumptions can result in inaccurate readings of the floor profile. As seen from the results, the system is able to identify high and low areas of a floor however, the heights and depths of these high and low areas cannot be accurately quantified. This needs to be overcome for accurate analysis of floor profiles. A number of 3D solutions to this problem exist, but these are often computationally expensive. In contrast, a computationally inexpensive solution similar to that implemented by Wen et al. [12] could be utilized. In this approach, a 2D sensor provides the location of the robot in the 2D plane, and this location is then extended into 3D using additional sensors such as an IMU.

6. Further Development

A number of improvements were identified from the initial floor mapping process and experiment results. The following system and process changes aim to achieve these improvements.

6.1. Sensor Accuracy

The laser scanner suffered from systematic sensor errors which could be attributed to its longer-range design. Therefore, a Hokuyo short-range sensor and an RGB-D camera will be tested with an aim to overcome some of these accuracy and systematic error challenges. Comparison experiments are to be performed using these additional sensors. The short-range laser scanner requires correction to convert the raw laser scan data from polar coordinates to Cartesian coordinates. The system methodology will have to be adjusted for the larger field of view of the RGB-D camera and will need to accommodate a sensor calibration step.

6.2. Map Creation

Other software approaches for 3D mapping are to be trialled, in particular Google Cartographer 3D and 3D Octomapping. These approaches could help to create accurate point clouds from sensor information that can then be manipulated and applied to terrain navigation applications. This will be particularly important for managing the large point clouds created by the RGB-D RealSense camera, as the raw point cloud data will quickly become inefficient to manage.

6.3. 2D to 3D Extrapolation

The current implementation utilizes 2D approaches for capturing a 3D floor profile. Whilst the methodology gives insight into the general flow of the floor, it lacks the accuracy to be useful in application. This accuracy can be improved by extending the 2D approaches into an adapted 3D system. AMCL localization can provide accurate positioning through the use of a 2D laser scanner in a 2D plane, however, this localization does not consider changes in z height and the orientation of the robot in terms of roll and pitch. These additional considerations are necessary for accurate mapping of the 3D environment. Such mapping has typically been achieved through the use of expensive 3D sensors such as 3D laser scanners, but this is not feasible for this application. In addition, an IMU is often utilized to provide 6 DOF information on robot pose and orientation [8,10,23]. The target application surface can be considered as a relatively flat floor with simple-shaped obstacles (flat walls), and so the use of a 2D laser scanner for information on x and y position is a relatively cheap and effective solution. It is therefore proposed that the current 2D system be extended into 3D. This will be implemented by utilizing an IMU for inertial information, AMCL for x and y position information, and estimated changes in z based on filtered IMU data and odometry information (Equation (1), below). A node was created to fuse IMU and odometry information into an updated odometry frame. This was published as the Odom to base_link transform, which was then used by AMCL for localization. AMCL does not take the z, roll, or pitch components of the frames into consideration, and can therefore successfully update the x, y, and yaw position and orientation information, whilst the roll, pitch, and global z height can be adjusted. This introduces modularity and can provide the ability to create other methods for calculating the z and 6 DOF information, such as visual odometry and point cloud registration.
δ p o s = ( x i x i 1 ) 2 + ( y i y i 1 ) 2 r = ( x 0 ) 2 + ( z 0 ) 2 Δ z = tan ( p i t c h ) δ p o s z = r cos ( p i t c h + π / 2 + θ 0 ) + Δ z x = r sin ( p i t c h + π / 2 + θ 0 )
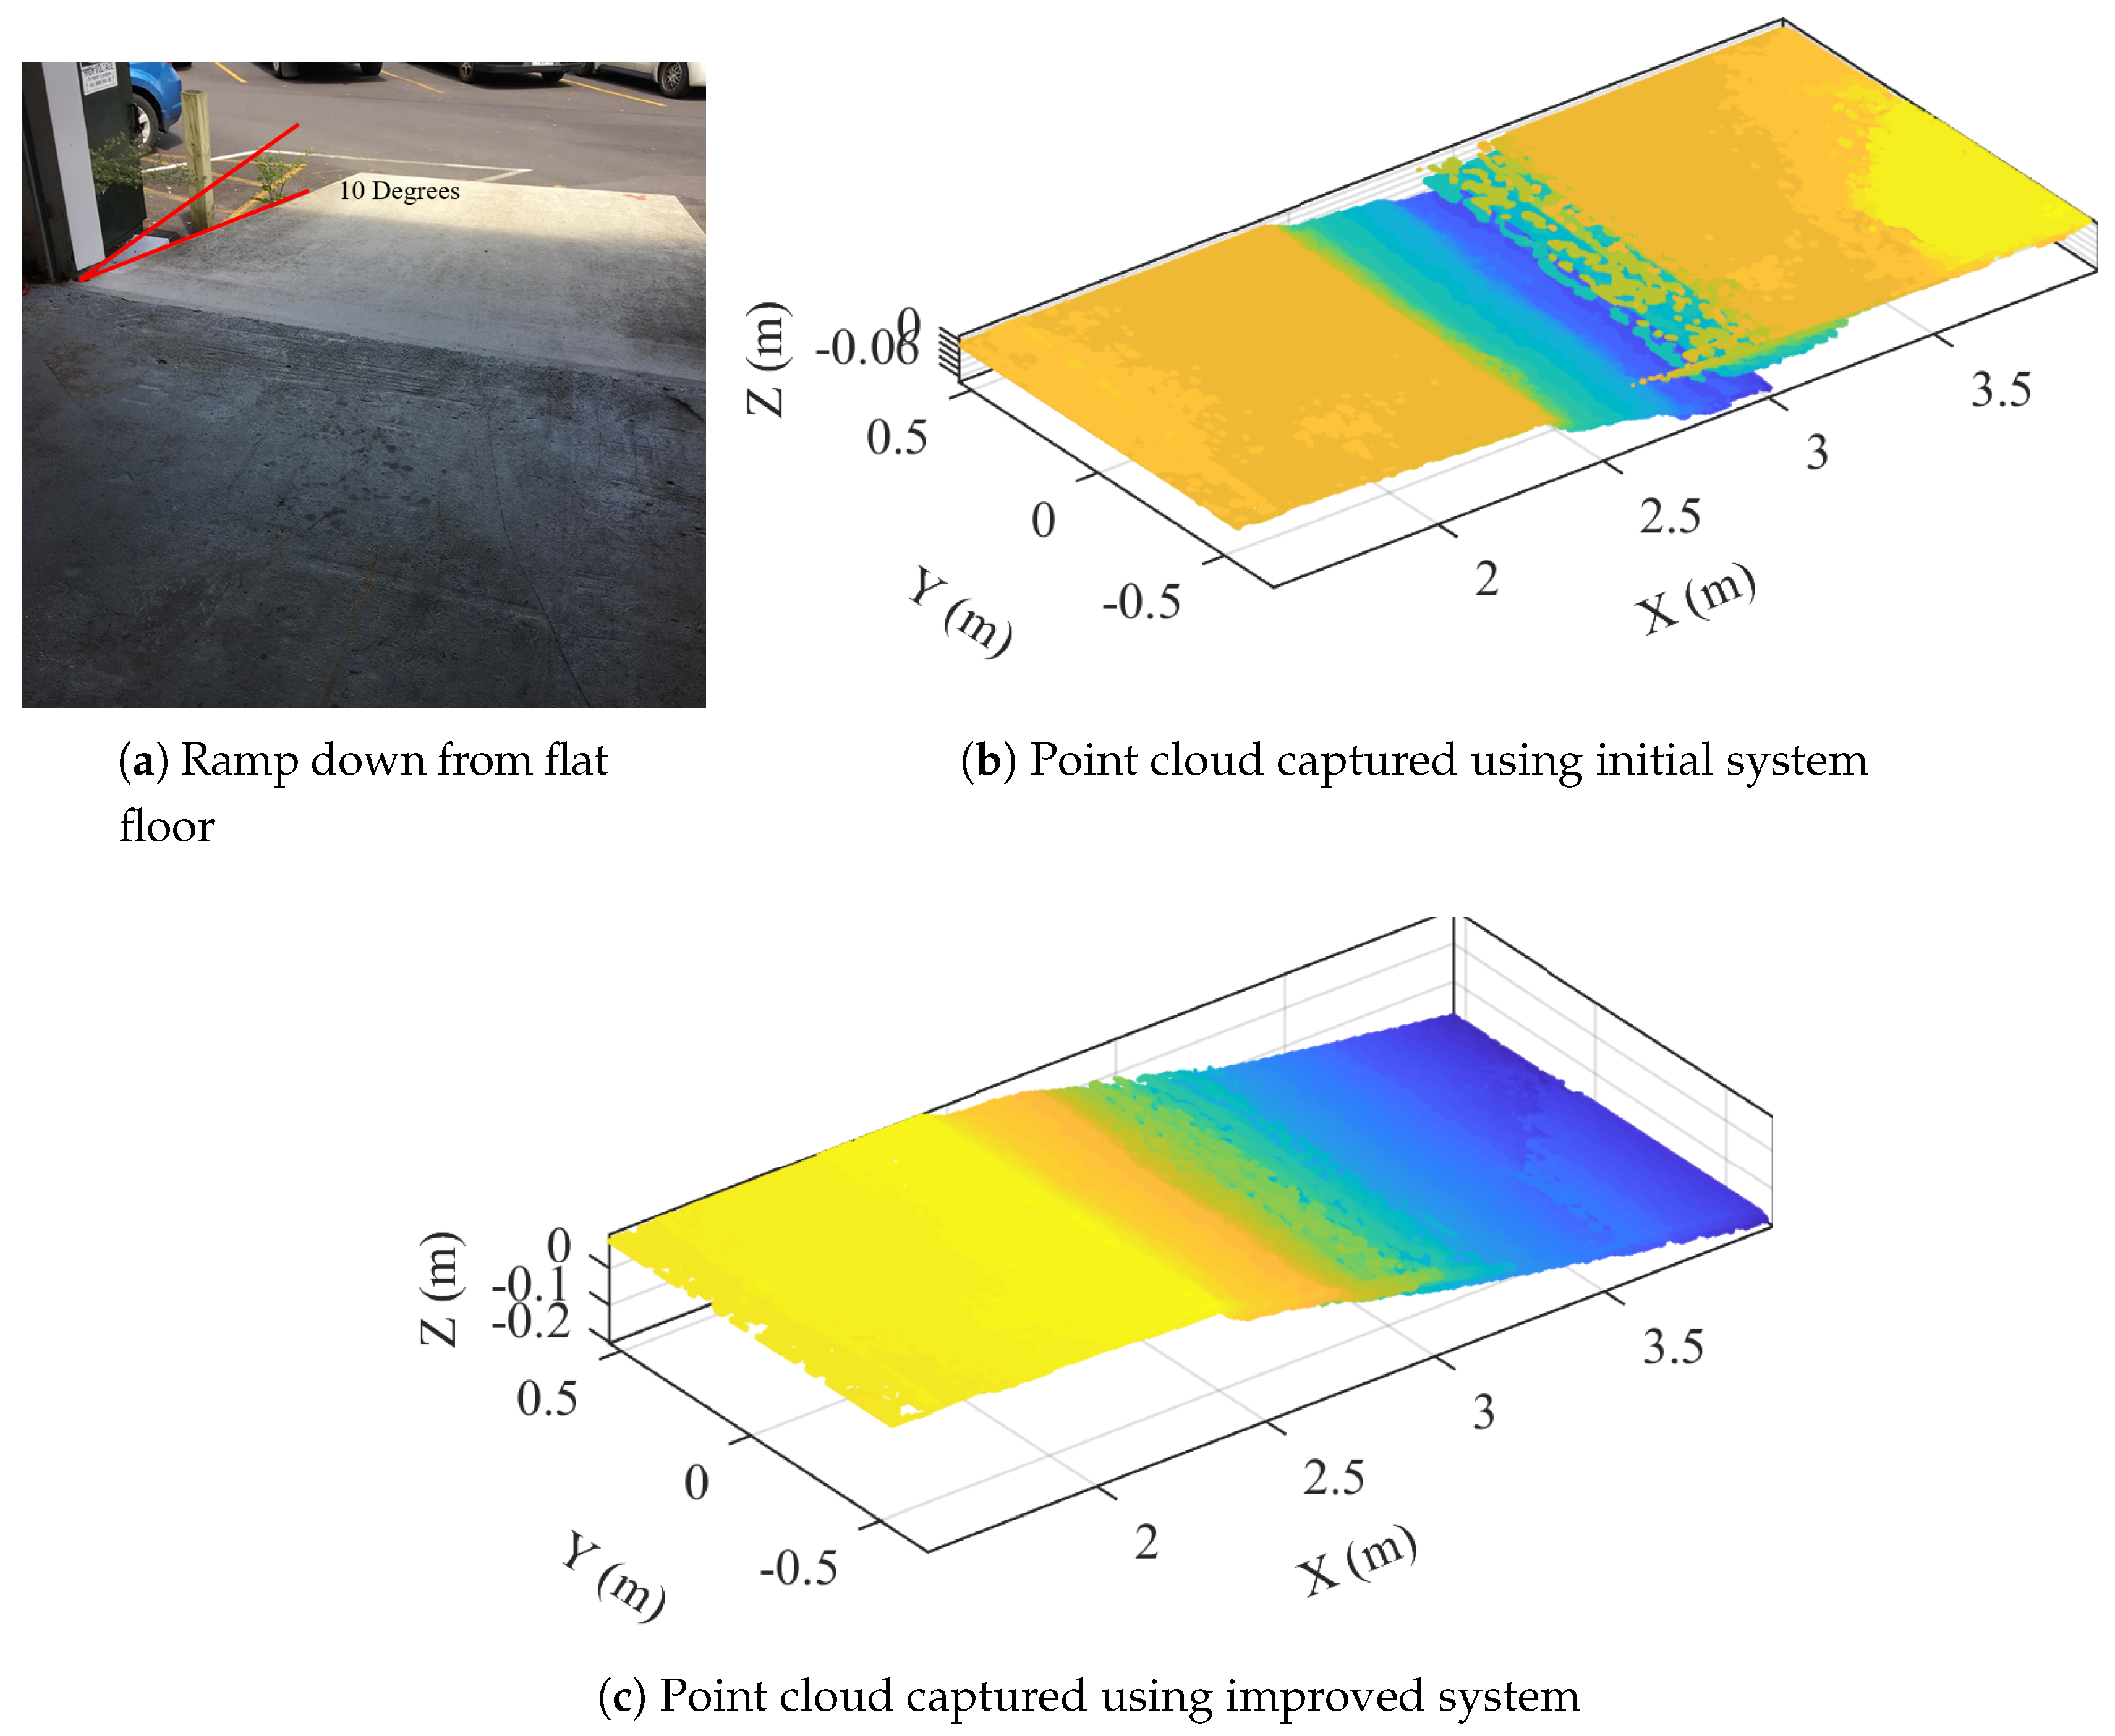
An extreme situation was tested to verify this approach, involving capture of the floor profile of a slope in the form of a 10-degree ramp down from a relatively flat floor (Figure 8a). Limitations of the previous system resulted in the floor profile being incorrectly captured, particularly due to the measurement performed being the distance from the sensor to the floor. As seen in Figure 9, when the robot is on a constant slope the measured distance to the ground is the same as when measuring on a flat floor. This, combined with 2D localization assumptions and no consideration of changes in global z height, results in the system incorrectly capturing a flat floor. To overcome this, the pitch of the robot and the global z height must be considered. To capture the floor, the robot drove forwards at a speed of 0.1 ms 1 and recorded the resulting point cloud information. The captured point cloud using the improved capture system is shown in Figure 8c; for comparison, Figure 8b shows the point cloud captured with no z compensation or consideration of slope. There is significant improvement in the floor capture capability, with the slope of the ramp continuing to be captured even when the robot is fully on the ramp. This suggests that the z height compensation helps to extrapolate the 2D system into a full 3D capture.

6.4. RealSense Camera Testing

The Intel RealSense D435 camera is an RGB-D camera and thus provides both a colour image and a depth image of the environment. This information can be used to create a 3D map/model, which can be used to extract surface floor profile information. The camera can be used in two ways: it can be mounted to view the environment from a horizontal position and the floor profile can be extracted through processing, or it can be mounted to view only the ground, potentially increasing accuracy and reducing occlusion errors. Occlusion errors are common when objects are hidden due to the angle of the sensor scan line. The beam sent out by a sensor cannot bend around a corner, so the view is limited to the unobstructed line of sight. In addition, RGB-D cameras can be sensitive to lighting and so must be calibrated.

6.5. Floor Profile Creation with RGB-D Camera

The floor profile creation program used for the laser scanner cannot be applied to the RGB-D camera information due to the different methods of storing information. The RGB-D camera provides a point cloud of the depth cloud captured. The point cloud resolution is 640 × 480 points and therefore contains 307,200 points. Thus, to store every point and assemble them correctly requires expensive computation and is inefficient. Further, the camera provides a new point cloud approximately every 0.1 s, resulting in around 3,000,000 points per second to process. A common solution to this problem is to use the Octomap Octotree point cloud storage system [24]. In this system, raw point cloud data are down-sampled into 3D voxel grids that are then stored in a tree structure, providing an efficient method for accessing and processing the information. The Octomap attempts to match the new point cloud to previous scans based on the 3D voxel grid. This creates a 3D map stored in an efficient graph-based tree called an Octotree. This has been used by other researchers to create full 3D maps [24,25], but in this application will be used to produce only a 3D profile of the floor surface. Due to computational limitations, the real-time processing of the point cloud stream into an Octomap is restricted to voxel grid sizes of around 8 mm. This eliminates some information about the floor profile, which needs to be considered for real-time applications. For testing, the point cloud data is recorded into a bag file and can be processed at a later time. The processing of the recorded point cloud data results in less computational limitations and the resulting achievable voxel grid size can be as small as 2 mm; Octomap point clouds based on this voxel grid size were used during testing. The raw point cloud bag file from a 6 min test can be as large as 30–40 GB; for comparison, a saved point cloud from an Octomap with a 2 mm voxel grid size is only 20–30 MB, highlighting the substantial reduction in the amount of data to process.

7. Improved Experiment Methodology

The experiment methodology for the test comparing the RGB-D camera and the Hokuyo short-range laser scanner is similar to that of the initial tests, described in Section 4. In addition to the process outlined in Section 4, a calibration step was included prior to testing to improve floor sensor accuracy and to calibrate the odometry scalar variables. Black tape was used to outline the 2 m × 2 m target area due to its different level of reflection giving rise to laser scanner measurements that successfully highlight the edges of the zone. Although the tape does not show up well on the RGB-D point cloud, the two point clouds and target areas can be accurately compared due to localization in the global coordinate system.

7.1. Sensor Calibration

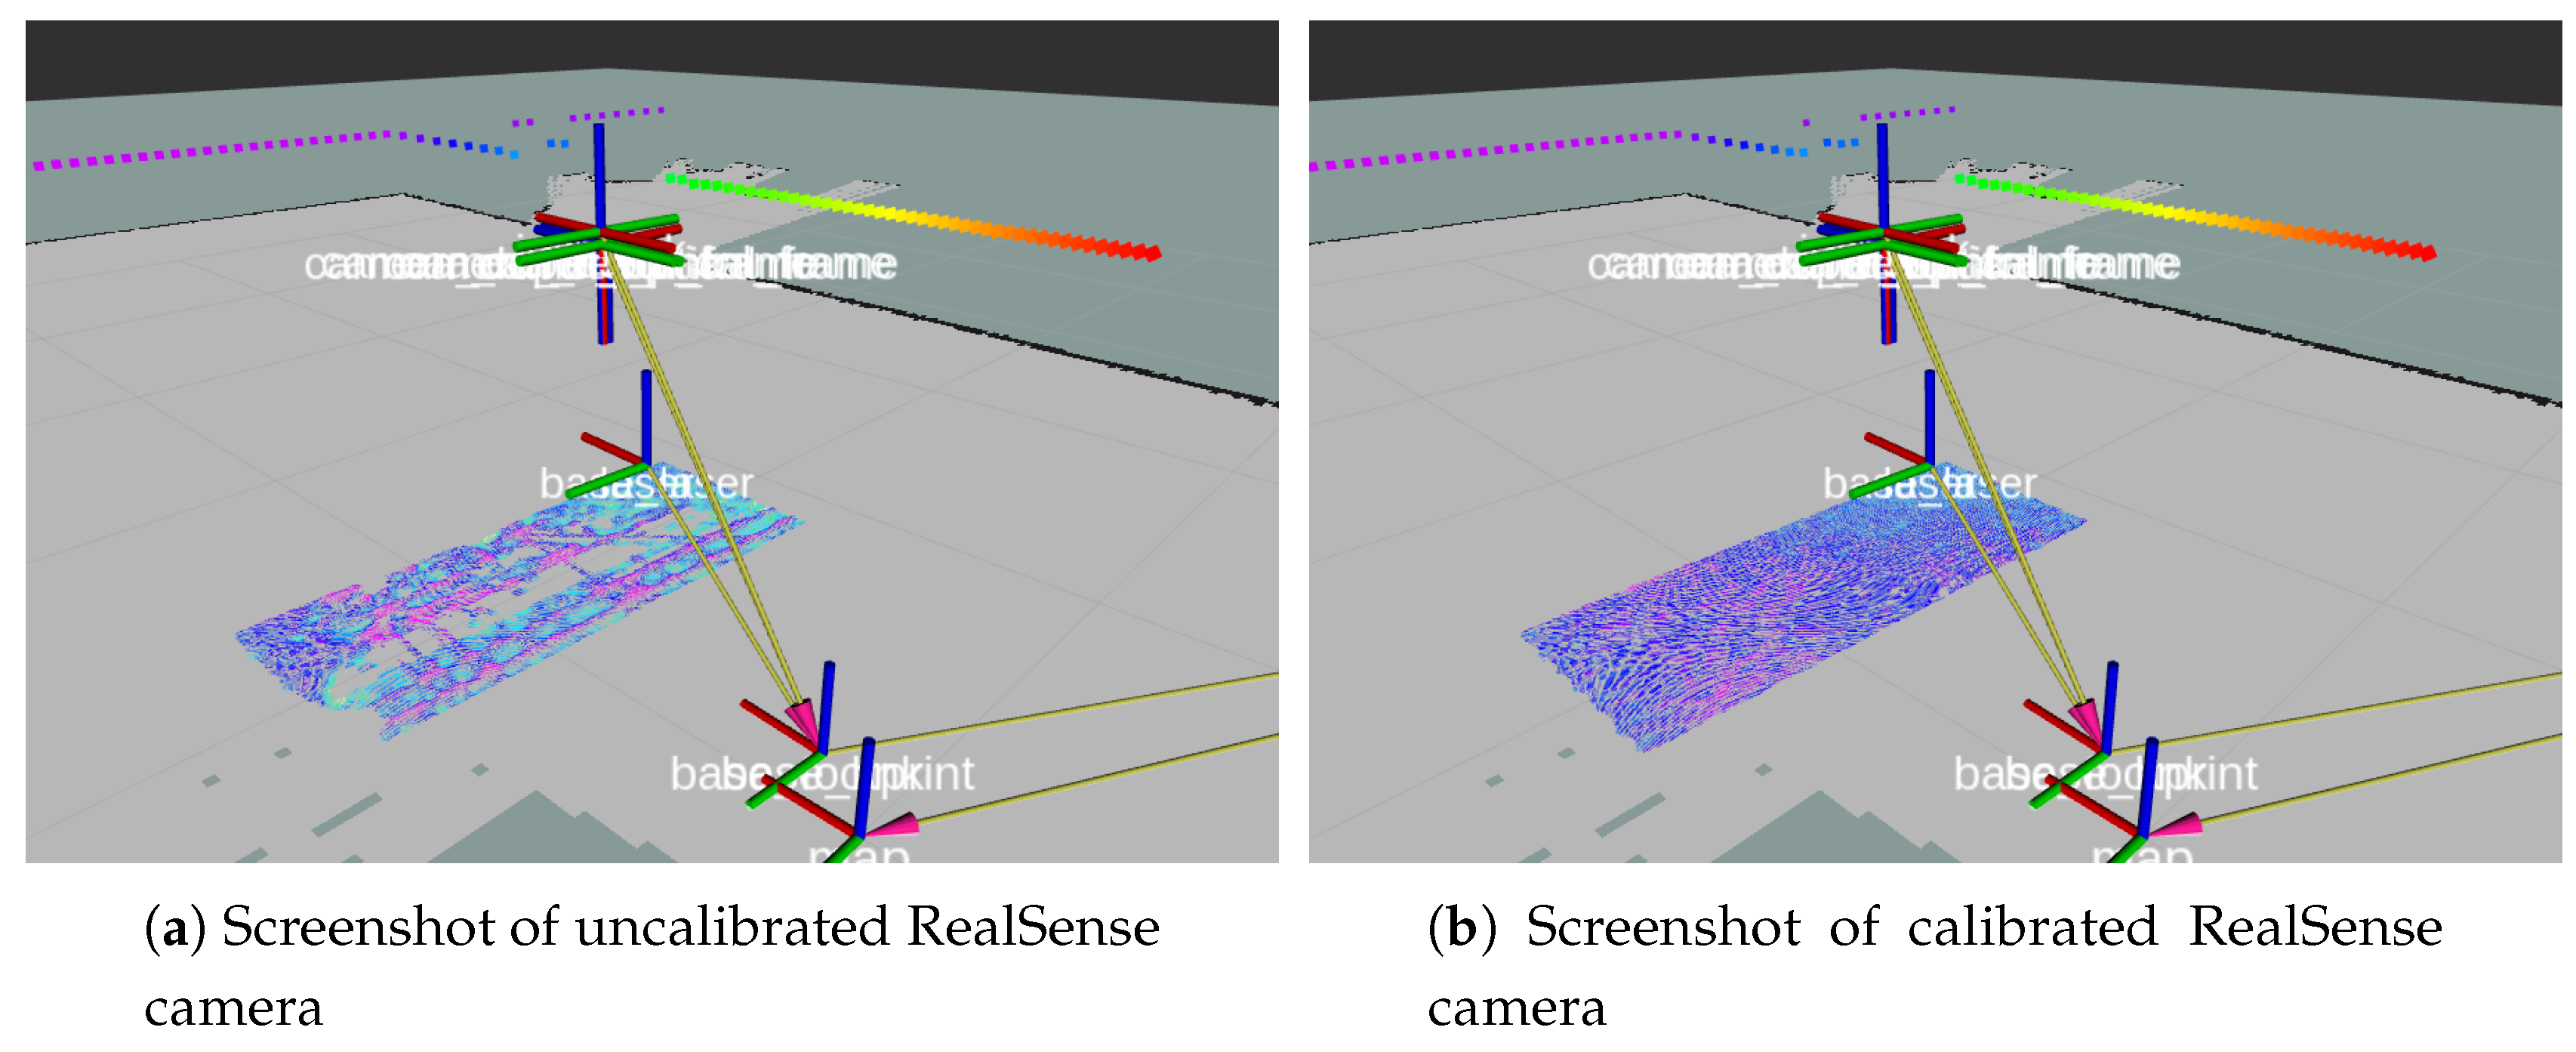
In addition to calibration of the odometry and AMCL, the floor sensor itself must be calibrated prior to testing. The RealSense camera is highly susceptible to infrared light, particularly differences in lighting conditions. This can introduce errors or even result in no measurement. Figure 10a,b highlight the difference between no auto-exposure and an auto-exposed (calibrated) depth cloud. The performance of the RGB-D camera is greatly improved with auto-exposure, capturing a greater region of the view and containing fewer artefacts (missed measurement areas). Errors due to changes in lighting conditions can result in a patterned floor result or even parts of the floor unmeasured (Figure 10a). These errors are overcome through calibrating the RealSense camera (Figure 10b) using the auto-exposure function for 2–5 s.
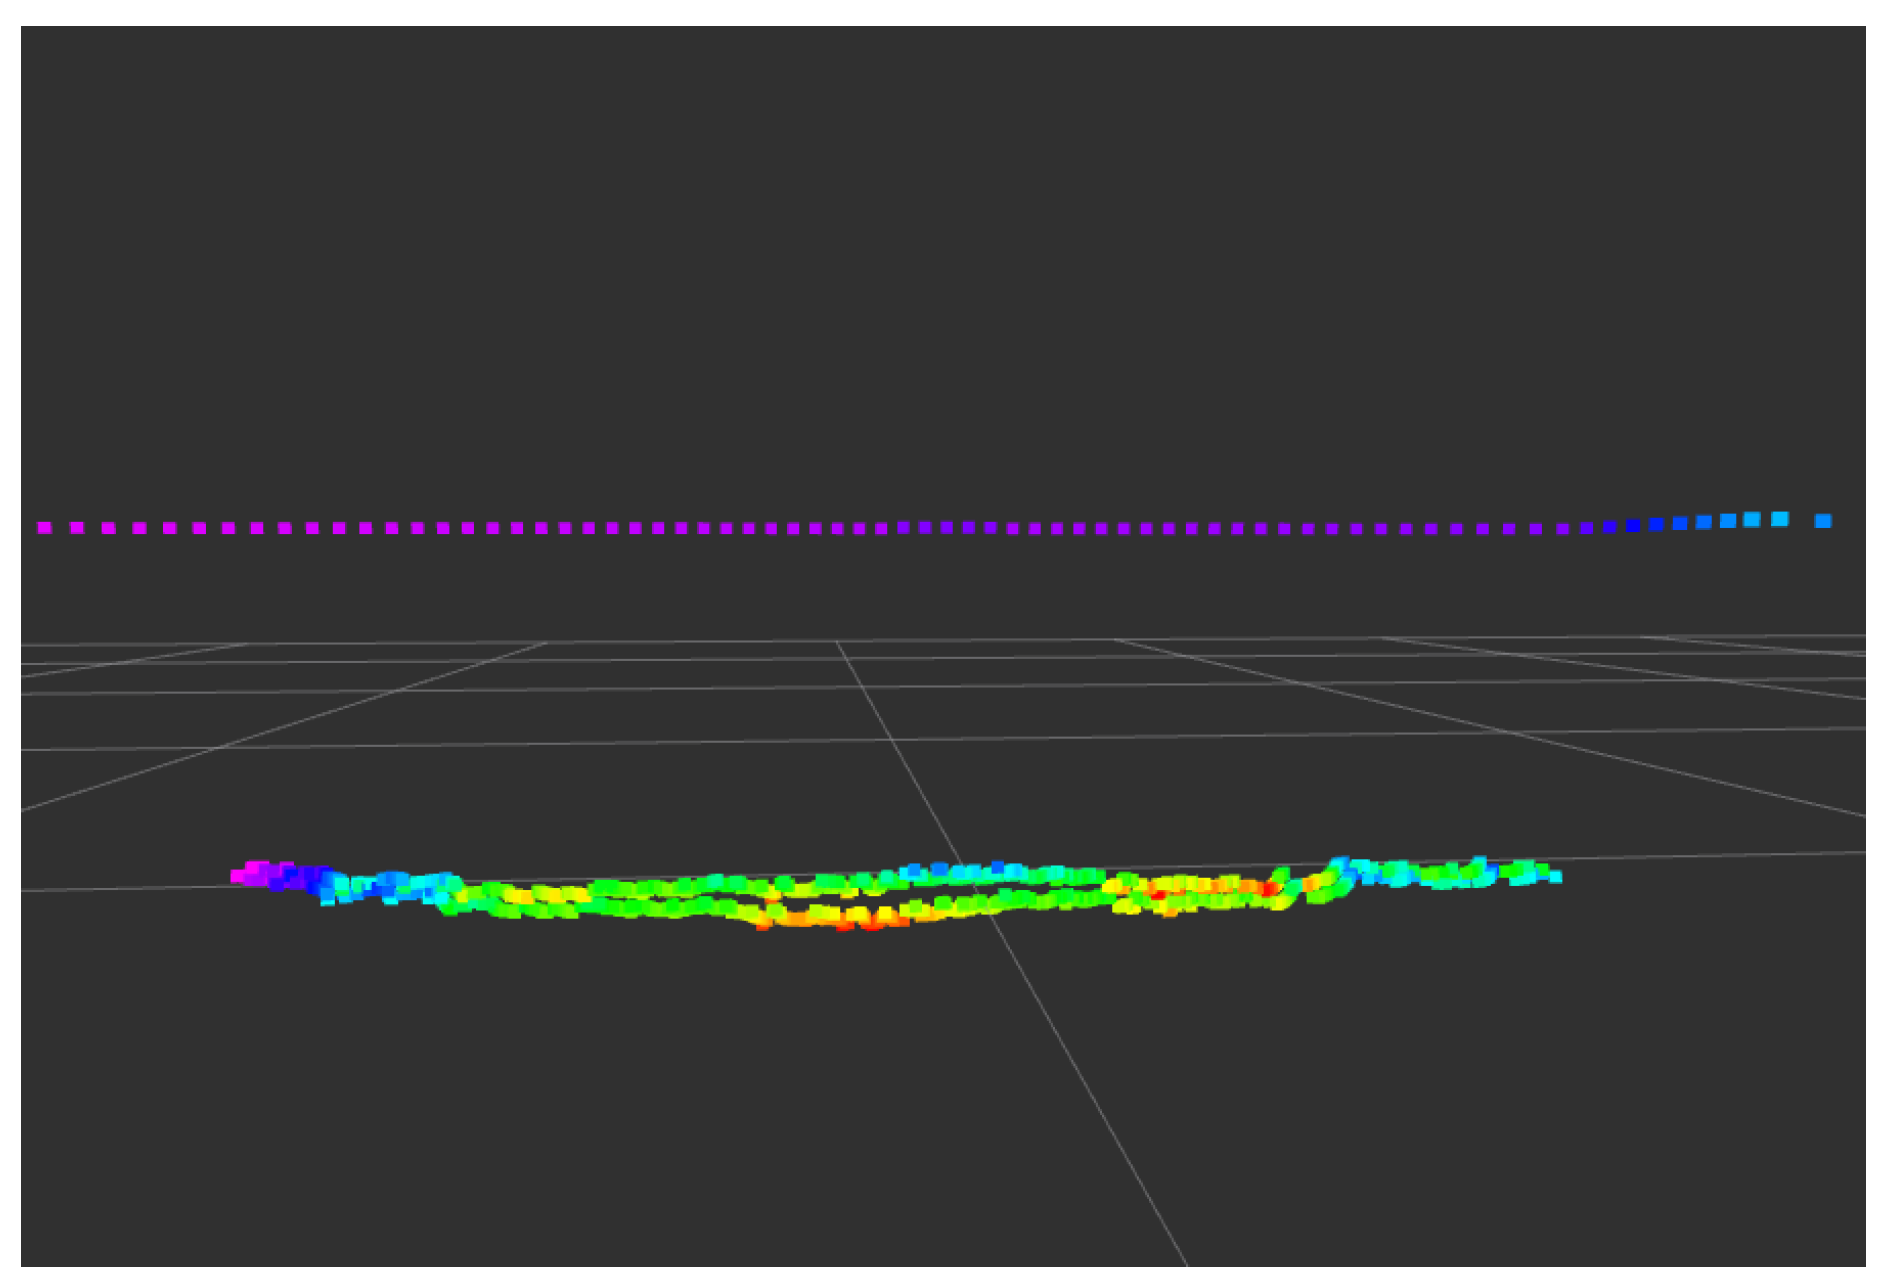
The Hokuyo short range laser scanner produces a laser scan result at angles spanning 270-degrees. The raw laser scan data must be converted from polar coordinates to Cartesian coordinates to accurately capture the floor profile. If this conversion is not performed, the laser scan has an obvious skew, which can be visualized when looking at a flat floor (Figure 11). The uncorrected laser scan of the flat floor has a bent shape (bottom curve of Figure 11), due in particular to the mapping of coordinates and changes in angle of incidence. This can be corrected through remapping the laser scan data points to the correct position relative to the angle of the scan (Equation (2)). In Figure 11, the z height is indicated by colour, with purple corresponding to the highest z value and red to the lowest. This results in a significantly improved measurement of the floor, although the scan still contains noise and measurement errors.
s c a n f i l t e r e d · r a n g e s [ i ] = s c a n f i l t e r e d · r a n g e s [ i ] ± 0.03 e x p ( f a b s ( sin ( a n g l e ) ) )

7.2. Measurement Methods

The final surface point clouds were saved as a .pcd file, which was then imported into MATLAB for analysis. The point clouds were converted into a mesh grid and then smoothed using a Gaussian filter. This helps to reduce noise from erroneous measurements and provides better insight into the surface trends. The resulting point clouds of the surface were compared visually through the aid of a contour plot. The resulting surfaces were checked for deviations and any significant deviations in the floor were inspected manually by visual inspection, touch, and the straight edge approach. This helps identify if the system is correctly detecting high and low areas and not just capturing noise from the sensors. Areas of interest identified by the floor capture process were investigated manually using the straight edge approach.

8. Testing of Improved Floor Surface Capture System

8.1. Experiment Methodology

The improved system was tested using two sensors for comparison. One sensor was the D435 RealSense RGB-D camera, and the other the Hokuyo URG short-range laser scanner. These sensors were compared to identify limitations and the appropriate sensor for testing. The test was set up similar to those in Section 3: first, a 2 m by 2 m area was marked out using black electrical tape. A 2D map of the area was created using Gmapping. A coverage path for the target area was devised and the robot platform then followed this coverage path, capturing the floor surface profile. The laser scans were assembled using the laser_assembler package and then saved as a .pcd file. The RGB-D camera point cloud data was recorded in a bag file and assembled into an Octomap; the result was also saved as a .pcd file. The test was completed on two different surfaces: carpet and coated asphalt (workshop). AMCL was used to assist localization throughout the test, and an IMU was used to assist with estimation of the global z height. The point cloud surfaces were processed using MATLAB, and contour plots of the results were used to identify high and low areas. Any identified areas of deviation were investigated visually, by touch, and with a straight edge.

8.2. Improved Floor Capture Results

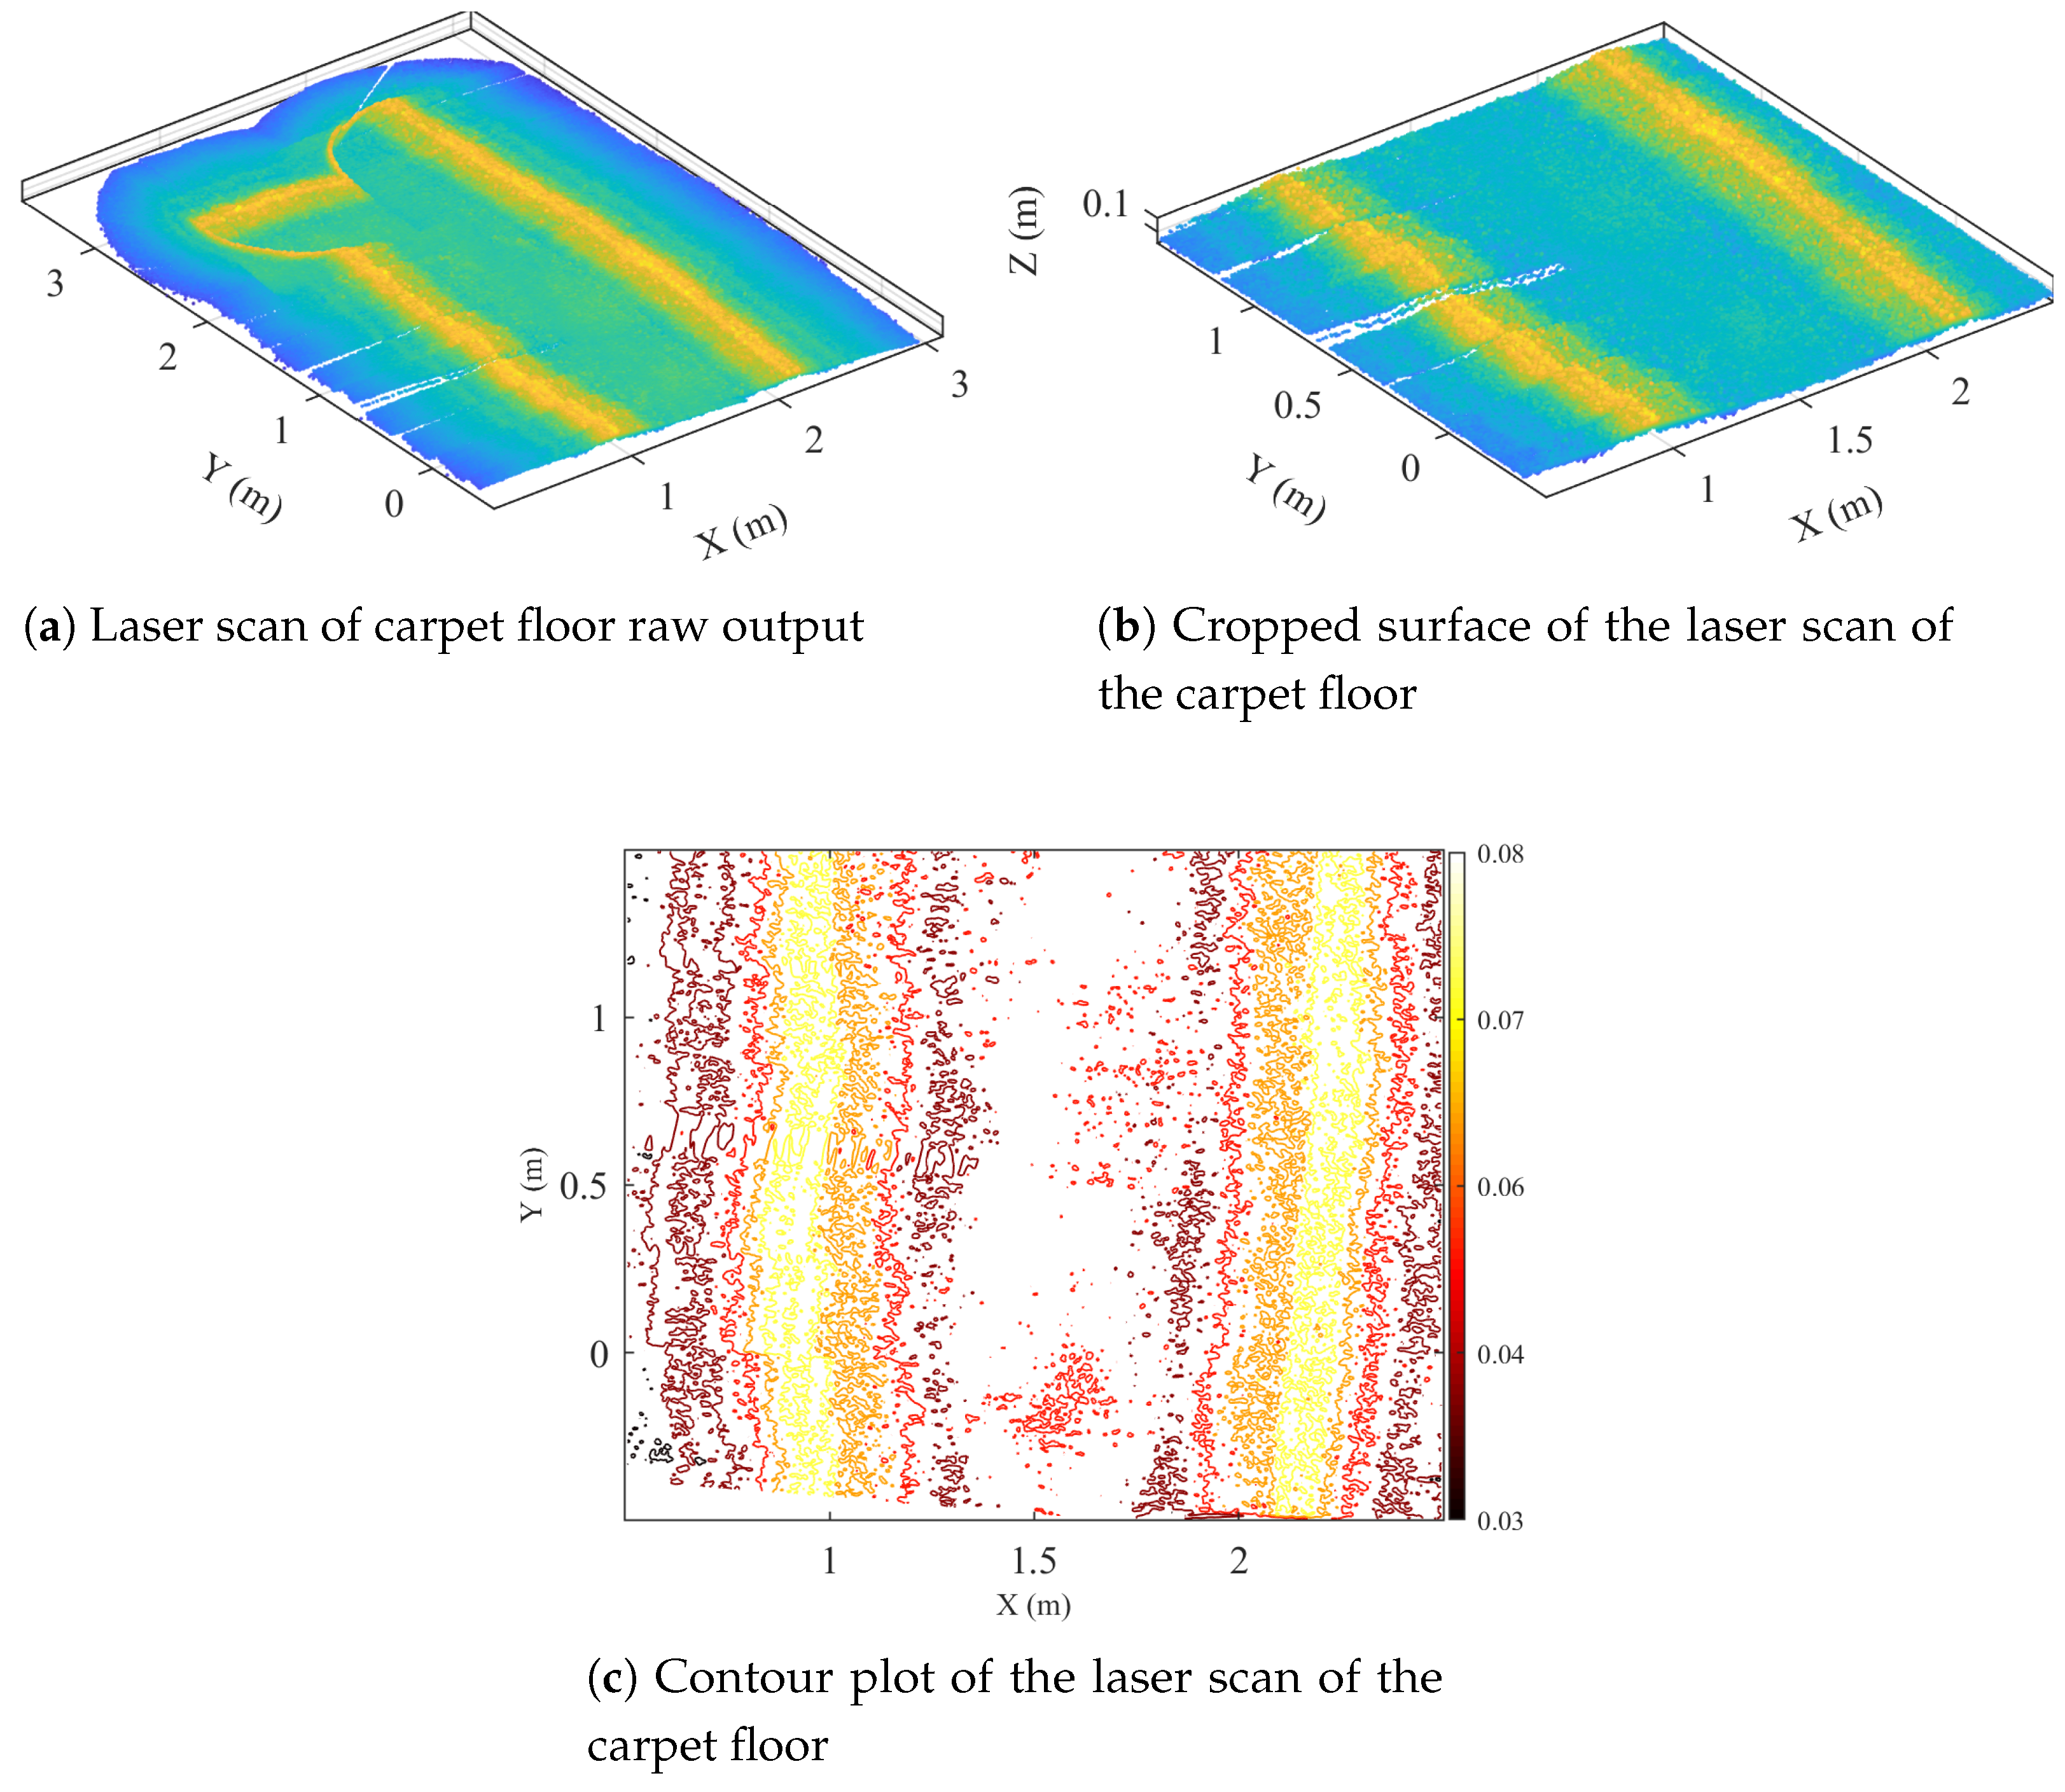
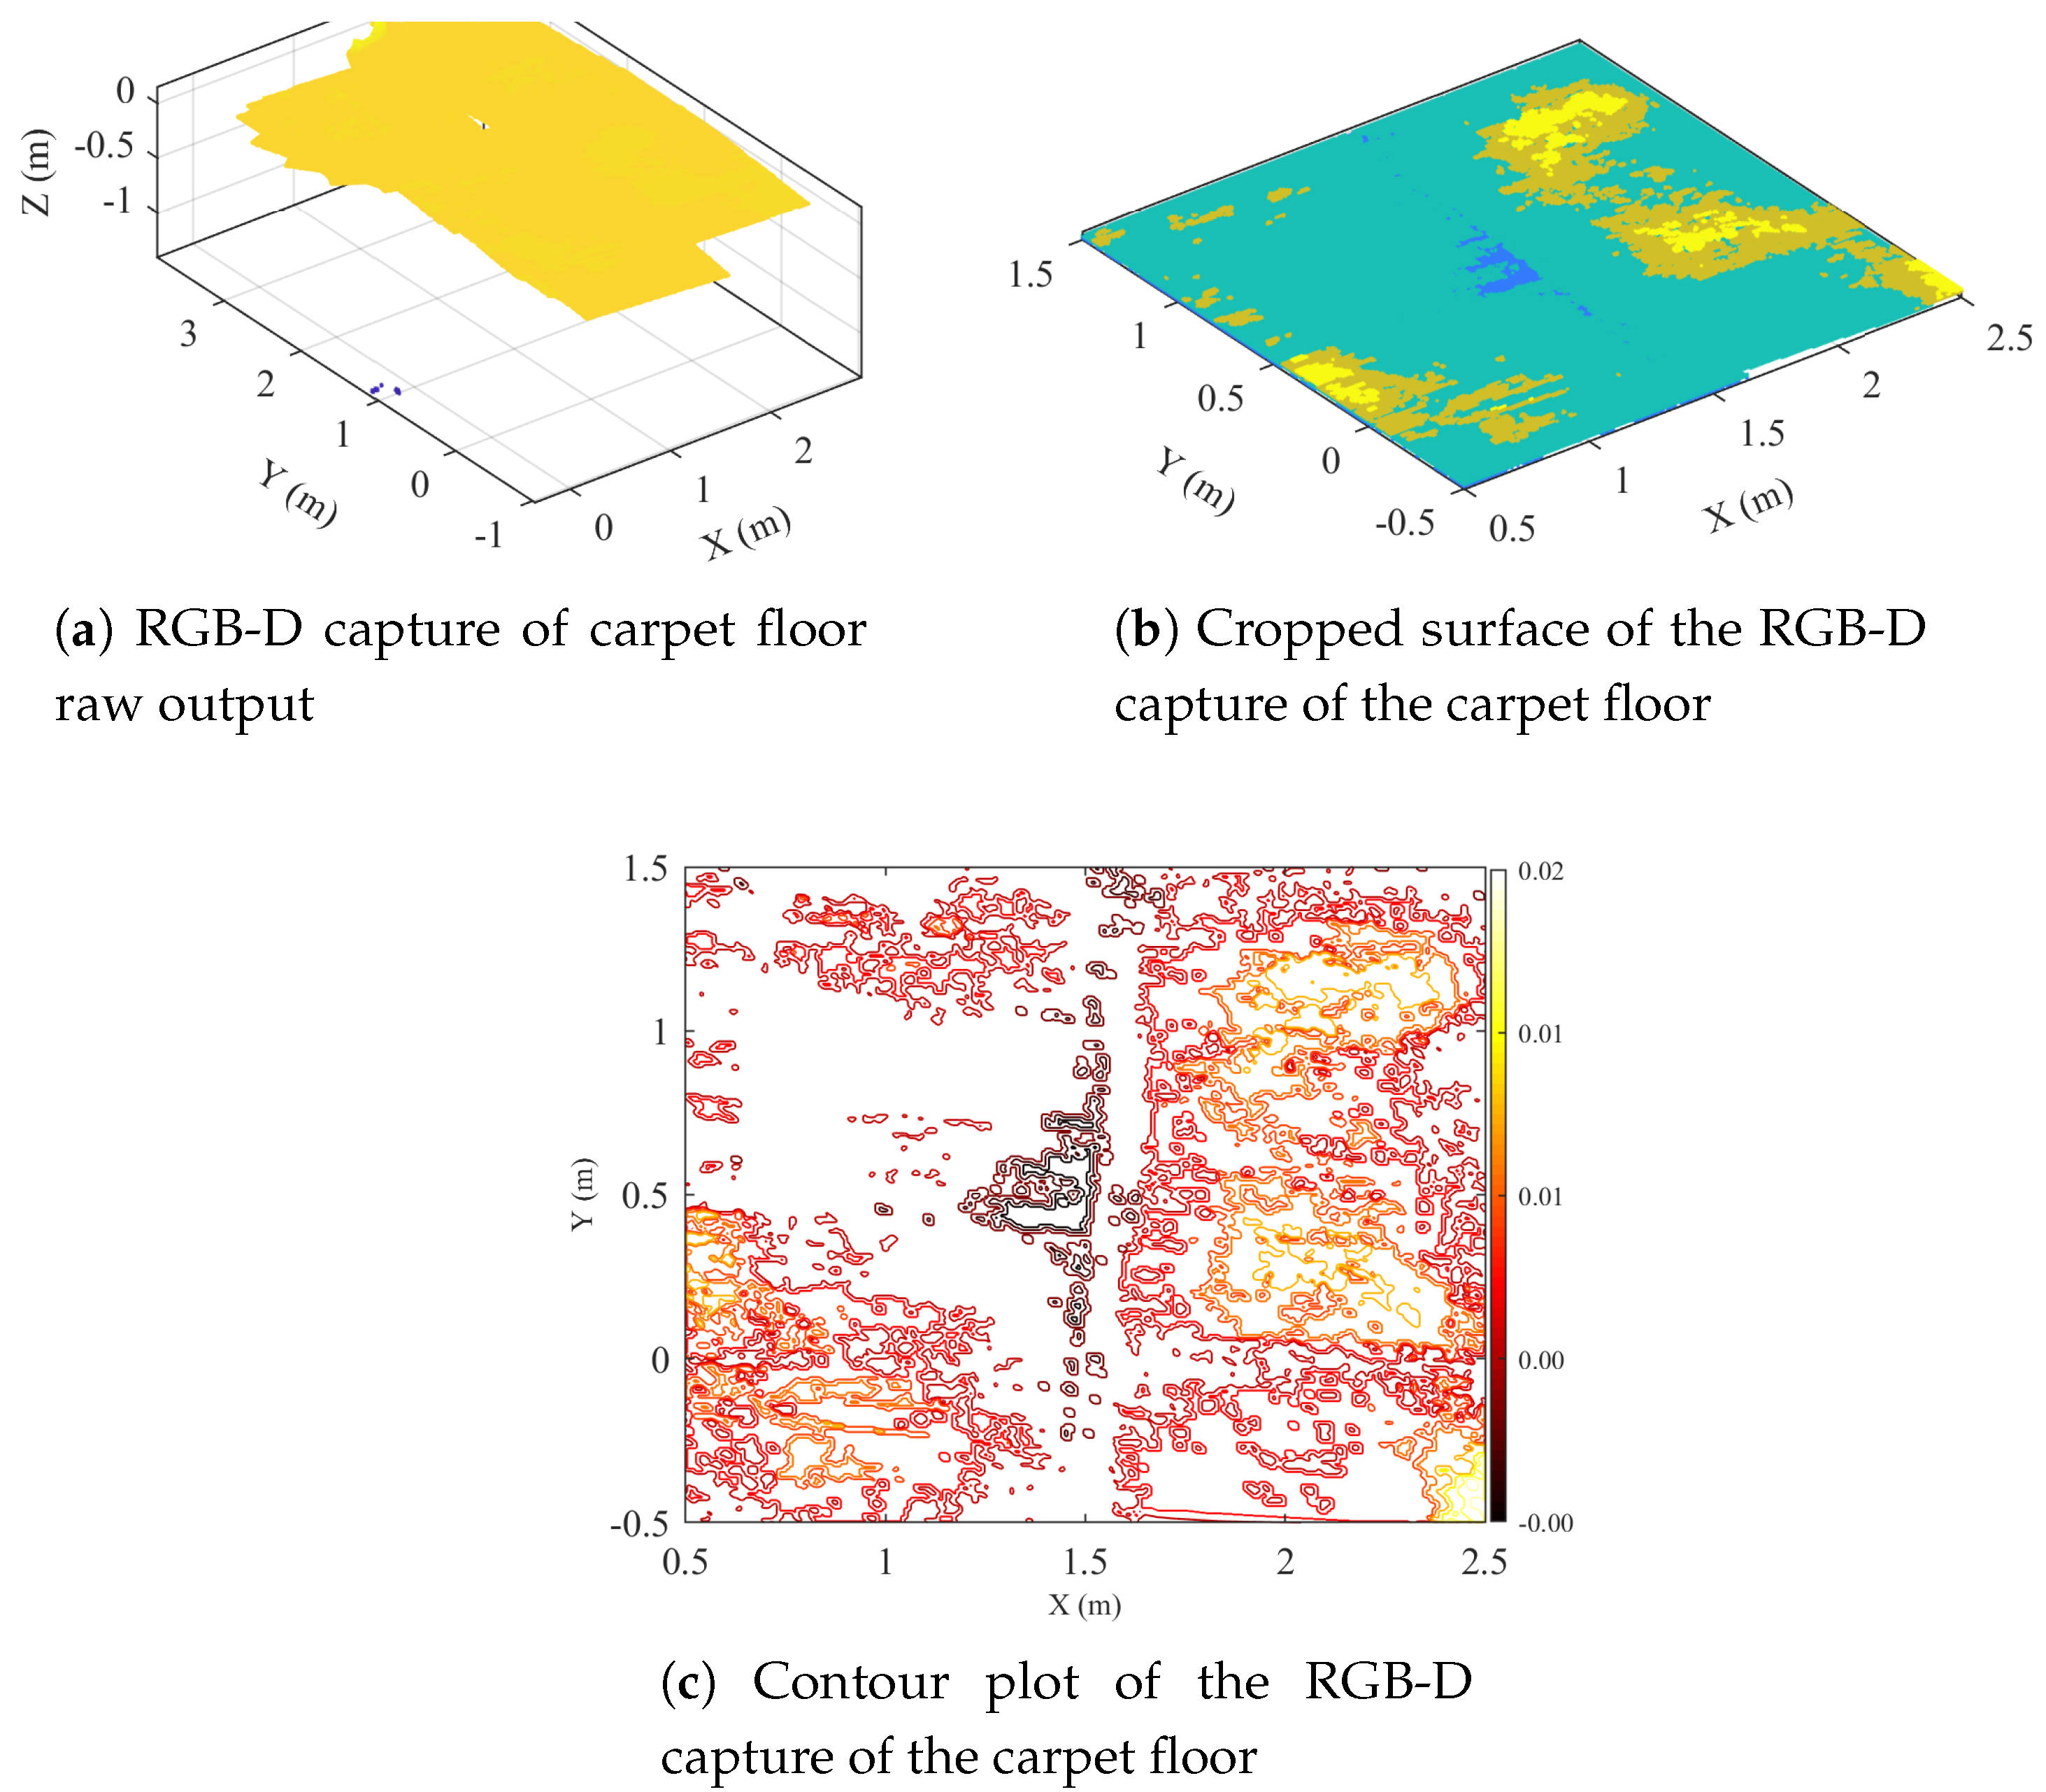
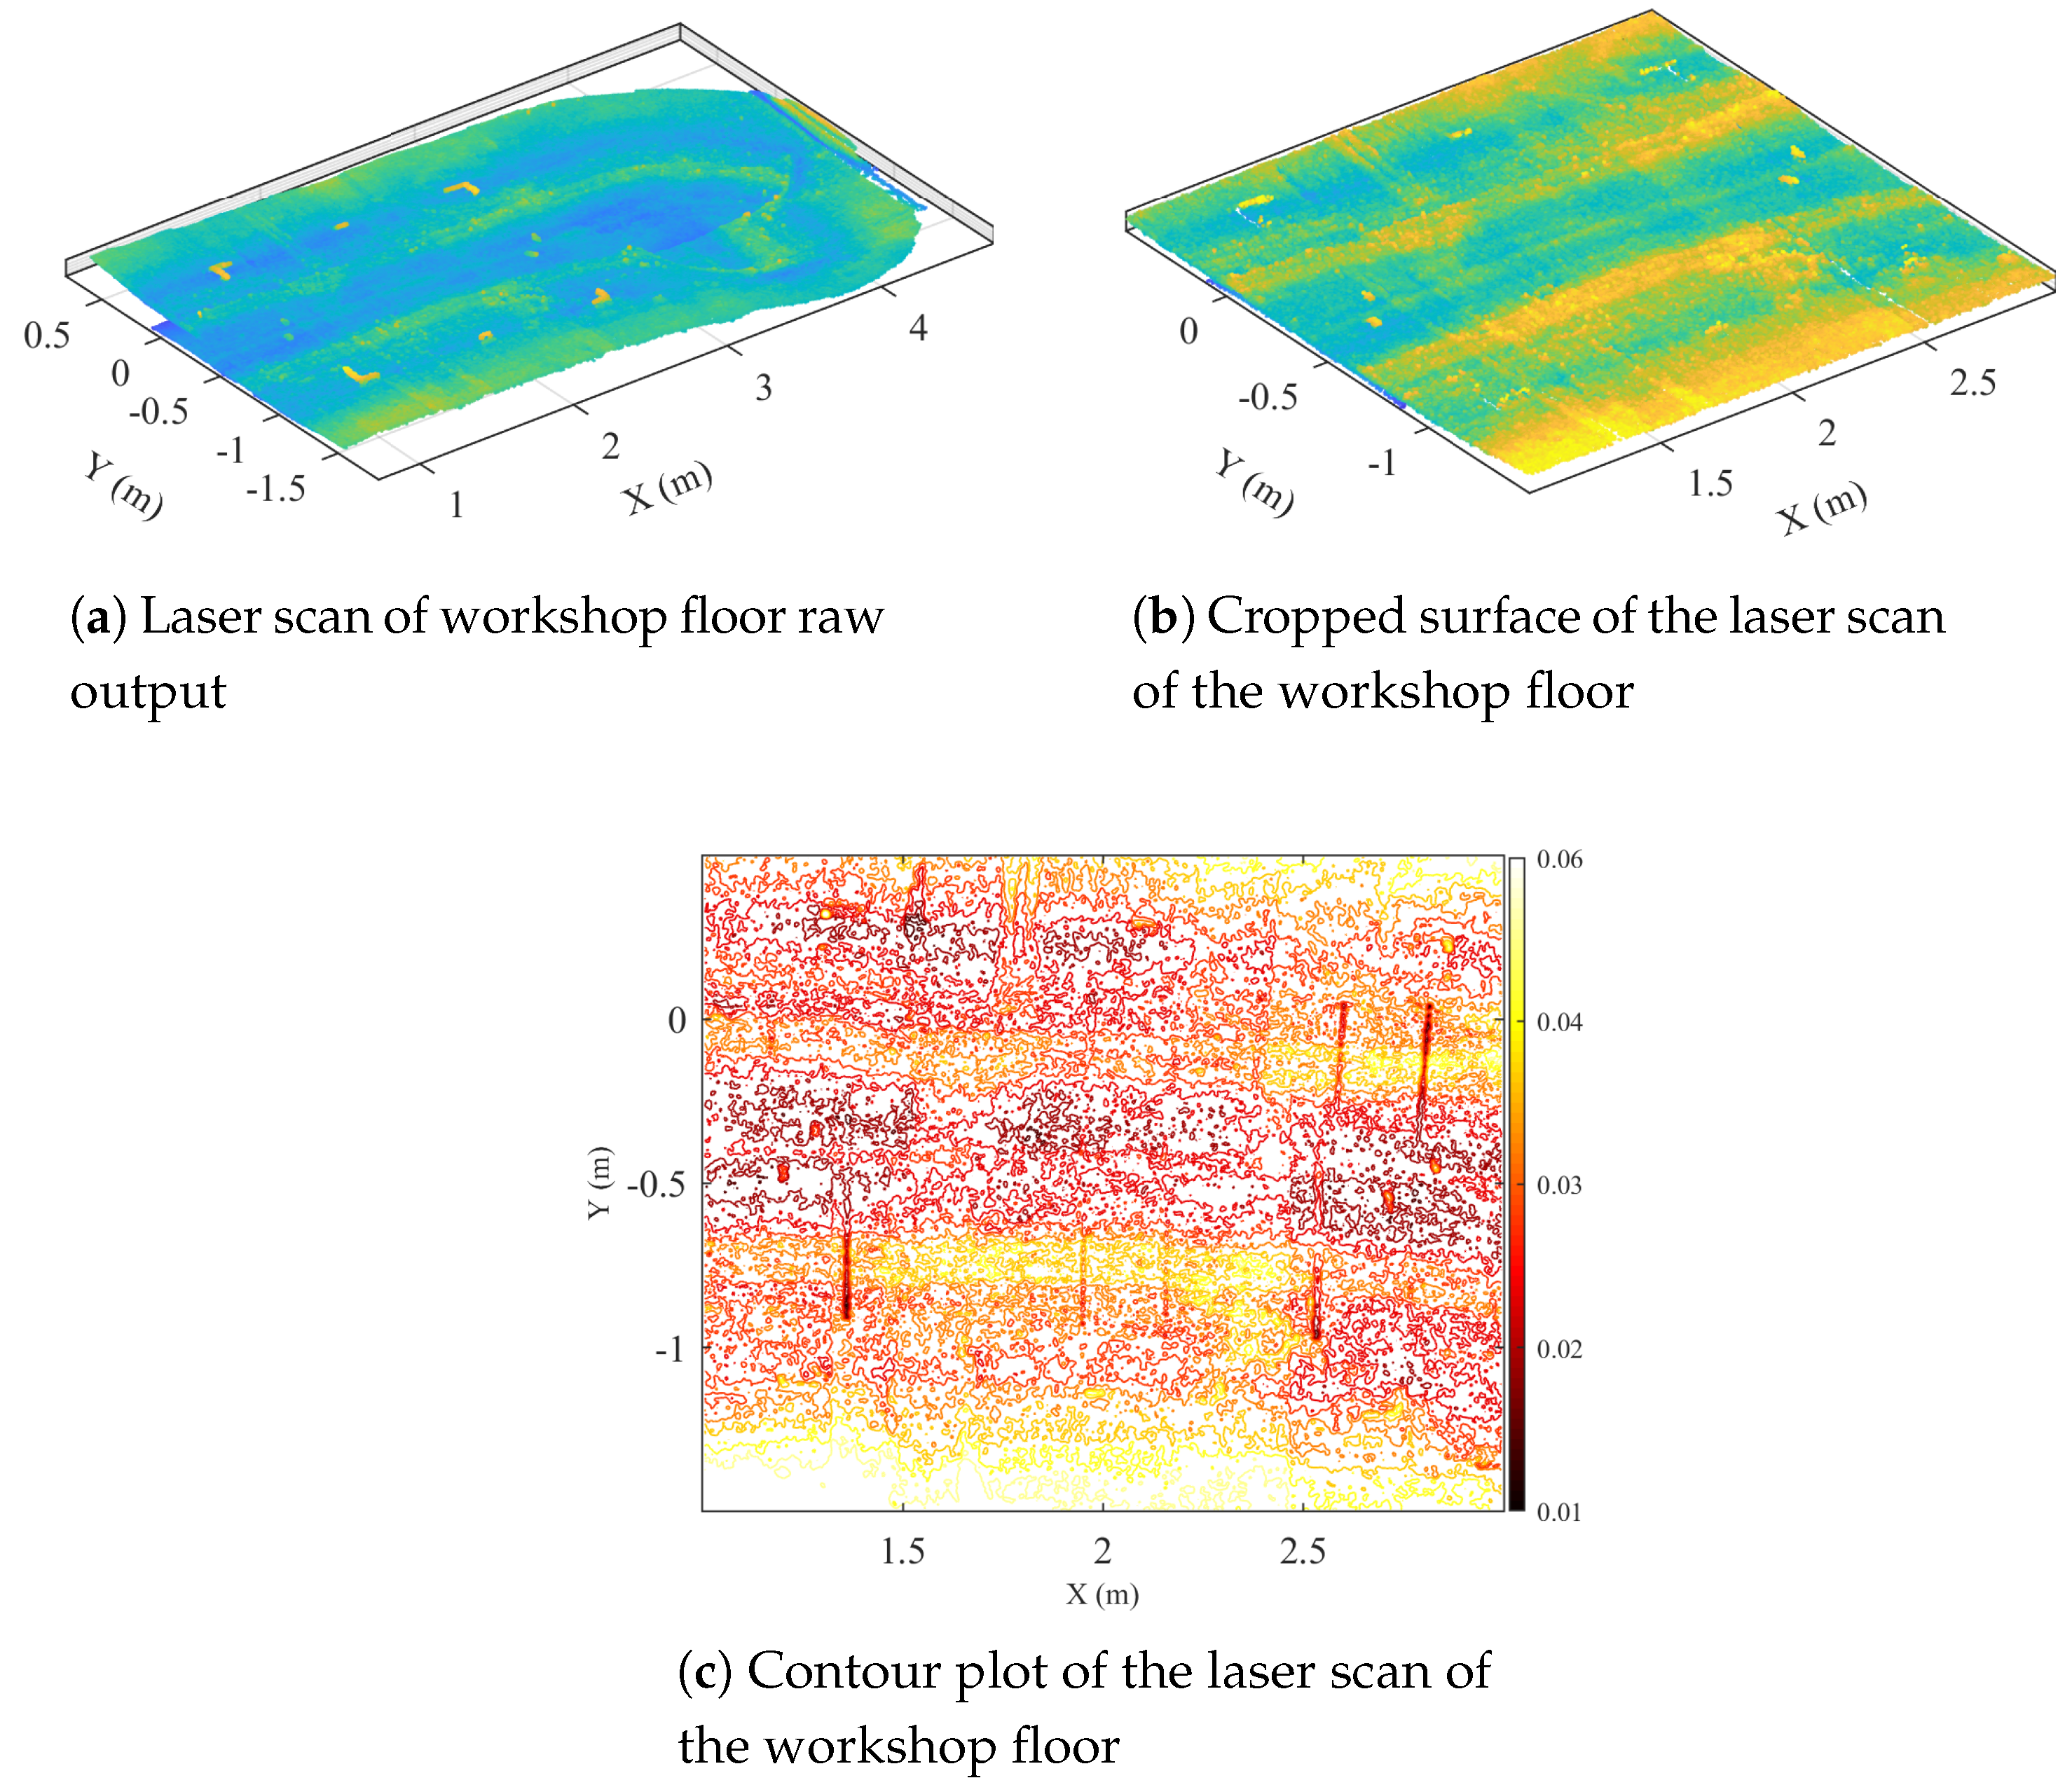
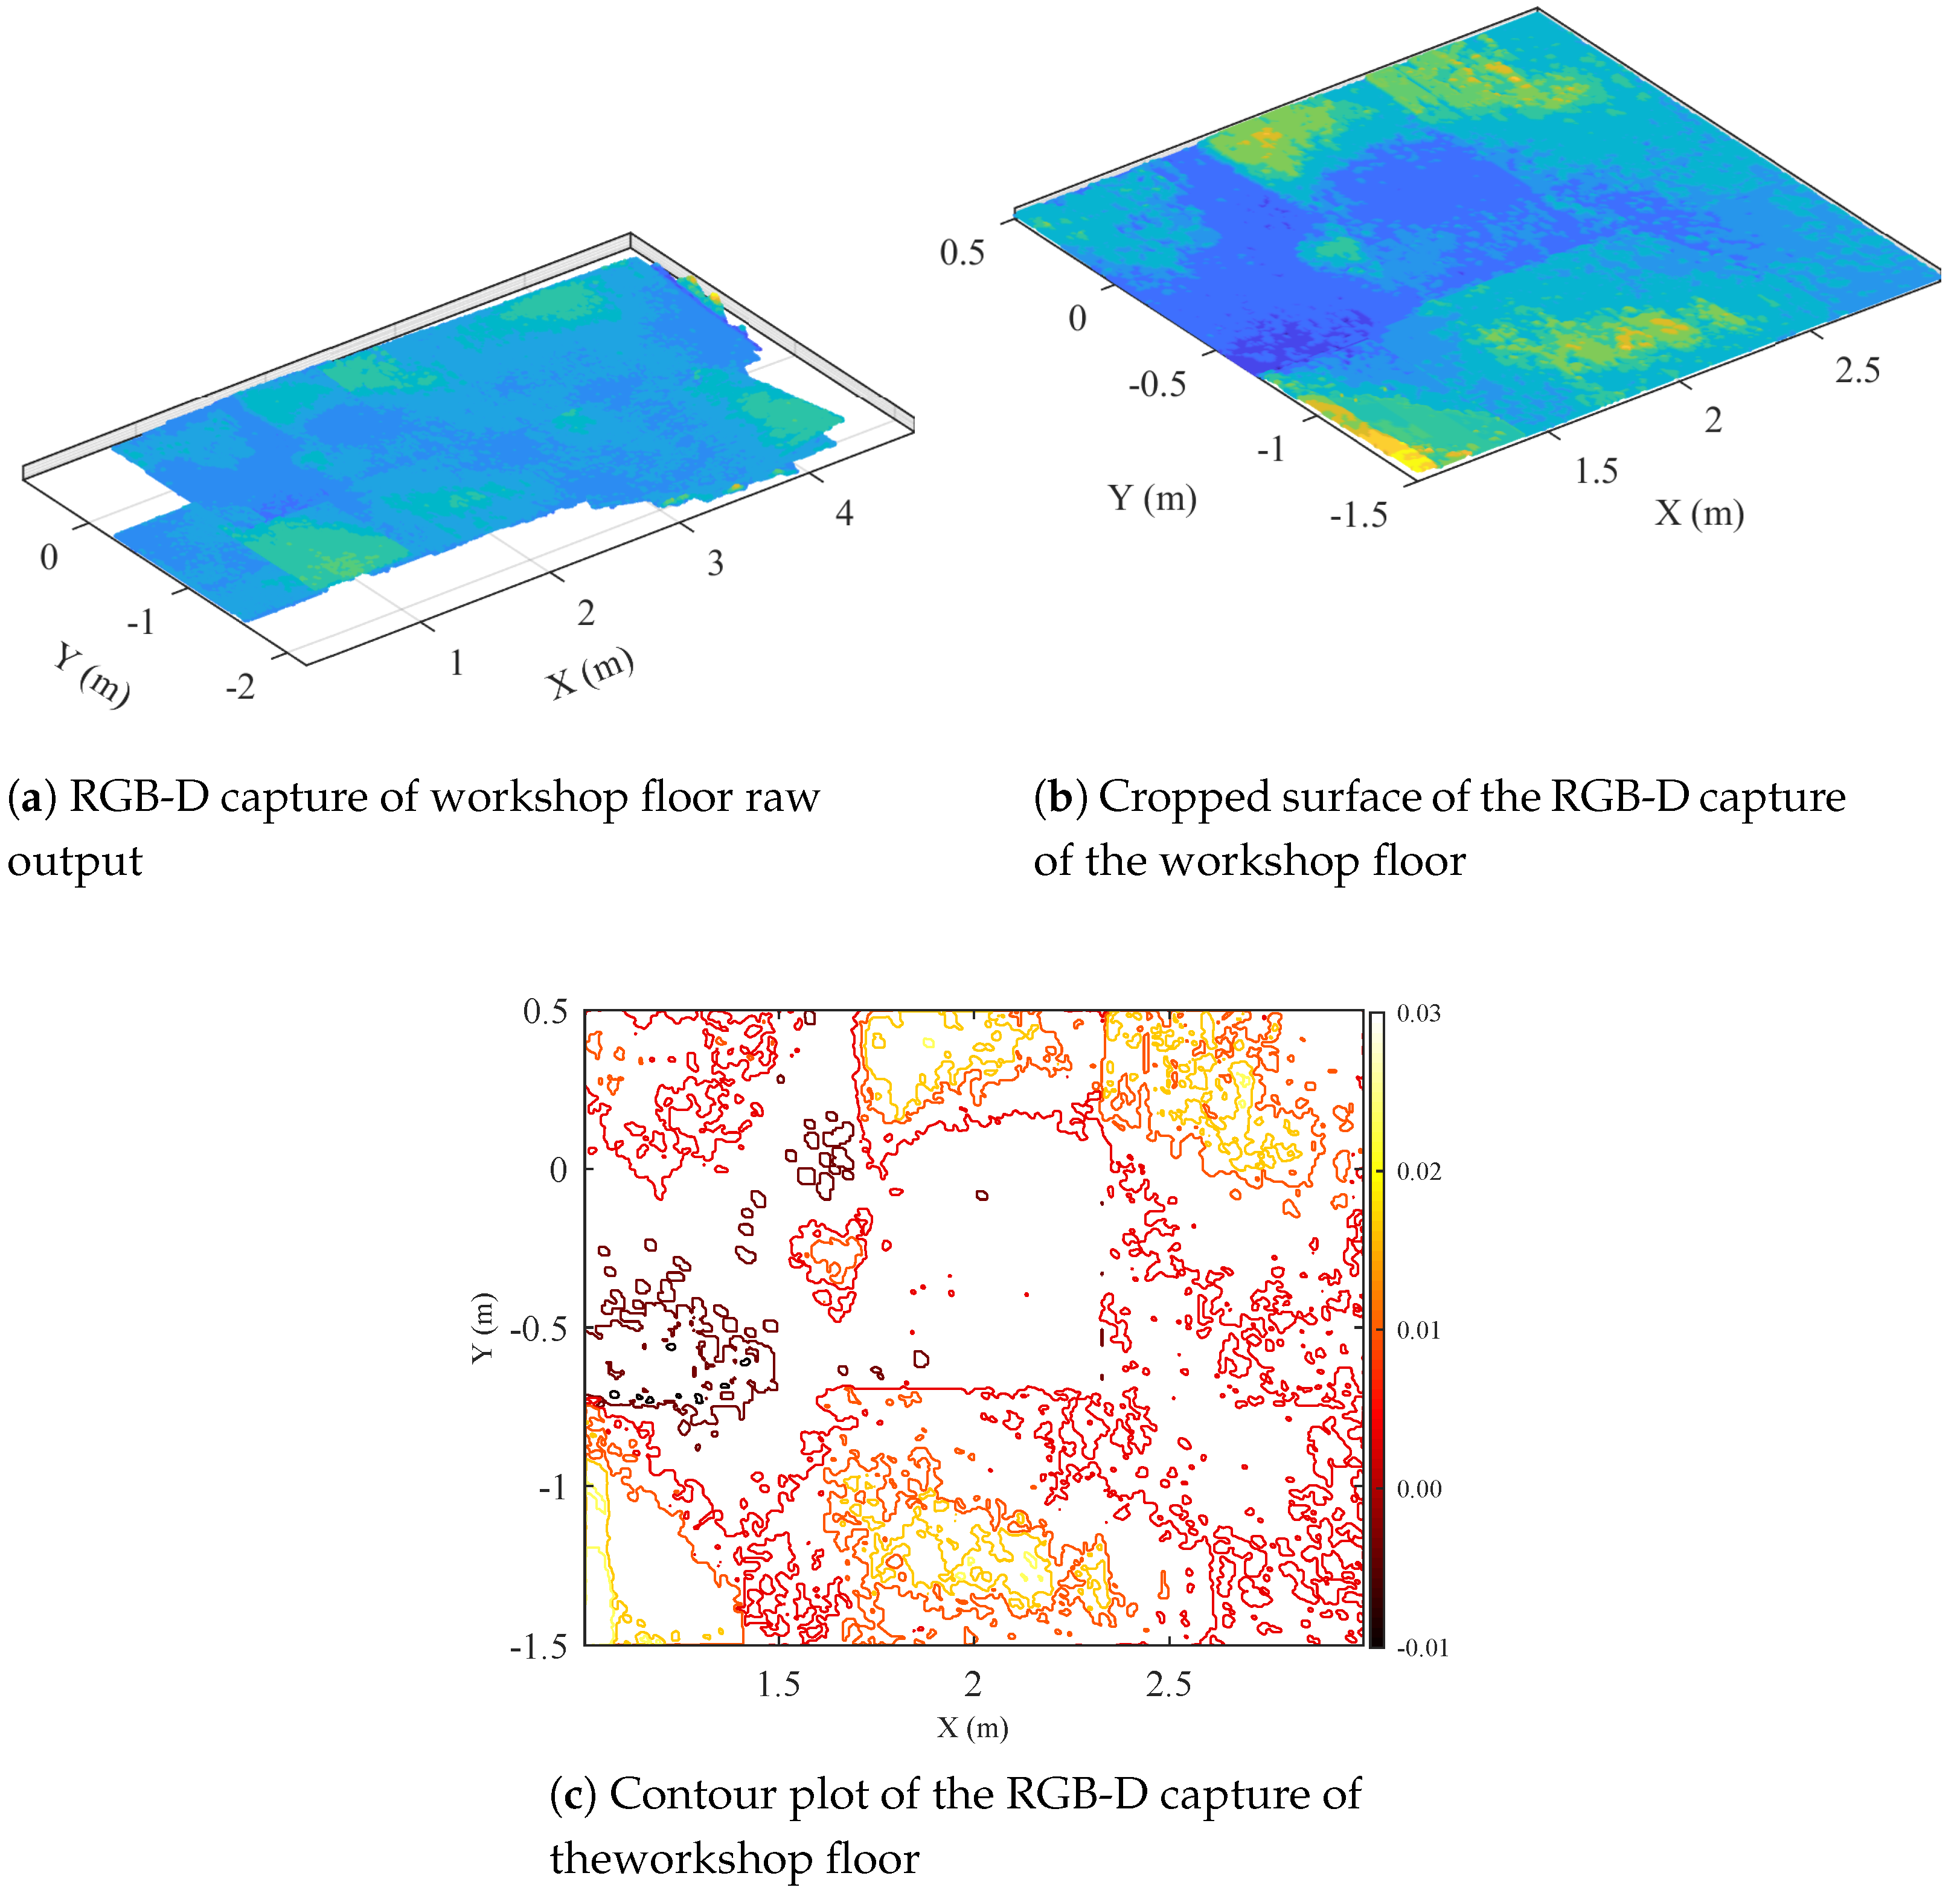
The results of the improved floor capture of the two target surfaces are shown in the Figures below. The floor profiles captured from the laser scan and the RGB-D camera are compared for both the carpet floor and the coated asphalt workshop floor. It can be seen that the laser scan seems to contain a higher level of noise, giving a floor thickness of around 0.02 m. In addition, the laser scan contains consistent high and low measurements regardless of the floor area measured, and are thus systematic errors. The laser scanner fails to detect a number of features indicated by the RGB-D camera, and subsequent inspection reveals that the RGB-D sensor seems to be accurate in its relative floor profile estimation. The changes in height registered by the RGB-D camera are not yet validated and do not seem to correlate with measured deviations via the straight edge. This could be due to the voxel grid size used in the testing.

8.2.1. Capture of Carpeted Floor

The carpeted floor was successfully mapped by both the laser scanner (Figure 12) and the RGB-D camera (Figure 13); however, the laser scanner appears to not have captured some features of the floor as well as introduced systematic errors. The laser scan of this floor (Figure 12b) shows a relatively flat floor with high areas down the middle of each pass. These high areas are consistent with robot position, suggesting systematic error rather than measured deviations. In contrast, the floor captured by the RGB-D camera system (Figure 13b) shows again a relatively flat floor, but with small deviations in certain areas. Visually, the floor looks flat with no obvious deviations in flatness across the measured floor area. Upon closer inspection of the floor using a straight edge, the high areas captured by the RGB-D camera were confirmed.

8.2.2. Capture of Workshop Floor

The workshop floor was captured more successfully by both systems (Figure 14 and Figure 15). The laser scan continued to show the systematic high area in the middle of the scan (Figure 14b) that was observed in the carpet tests. Some deviations from flatness were detected, in particular at the sides of the target area. The RGB-D camera successfully captured (Figure 15b) a number of high areas that were confirmed both visually and with a straight edge. The accuracy of the size of the high areas is not known.

9. Discussion

9.1. Floor Surface Reflectivity

All three surface types are successfully captured by the robot platform, with varying degrees of success. The workshop floor is successfully mapped, with the ability to identify a previously unidentified high spot of the floor. The mapping of the carpet produces consistent point clouds, however, these are thicker than the two other types of floor, and this could be due to the reflectivity and deflection of the material. Interestingly, the black tape shows up as a high point on both the workshop covered asphalt floor and carpet, however, the tape shows up as a low point on the asphalt floor. This highlights the effect of the material reflectivity on the measured value. This system could be used for identifying points of interest in a large area, such as high points or low points. The scanning method does not provide sufficient accuracy for applications that require micro or millimeter resolution, however, this method could provide a fast scan for a large area, where a second high resolution scan could then be applied to key areas. Further, the profile mapping system can autonomously provide a quick means to provide an overview of a large area. There is an observed source of error in the workshop floor test due to the varying reflectivity of the floor. This floor within the 2 m test area is clean, however, outside of this it has some areas of dirt. As observed in Figure 6a, these dirty areas are detected by the mapping system as being higher than the rest of the floor, by 0.01 m. This suggests that the different reflectivity of the dirt area results in the inaccurate measurement of the profile. This would have to be accounted for in application, as it could lead towards false high or low areas.

9.2. Sources of Error

There are some sources of error that are identified through analysis of the results and the robotic system. A key source of error is the laser scanner, providing noisy measurements with a resolution of 0.5 degrees. In addition, upon analysis of the results, across all surfaces, there is a consistent ’low point’ measurement near the center of the laser scan. This low measurement is observed in each pass and does not correlate with any visual deviations of the floor. Another source of error is robot localization. Encoder information is used for tracking the movement of the mobile laser scanning, and so the platform deviates due to inherent errors in odometry. This can be observed in each result by the shift of the middle downward pass of the robot when compared to the two upward passes (Figure 5a, Figure 6a and Figure 7a). It is clear that there is odometry drift when performing the turn at the end of the first pass, which is corrected when performing the opposing turn at the end of the middle pass. This drift could be accounted for using reliable SLAM or through filtering during the processing of the laser scans and point cloud.

9.3. Surface Thickness

In an ideal world with ideal sensors, the measured surface profile would have a thickness of a single measured point. However, it has been observed that the thickness of the point cloud surface varies among floor types, with carpet producing the worst thickness. This point cloud thickness is due to the accuracy of the laser scanner (±1 mm) and the reflectance and diffraction of light by the surface. However, this thickness is not an impediment and it is still possible to identify areas of interest in the floor.

9.4. System Improvements

The mobile profiling system can be improved by addressing the systematic sources of error such as accurate localization and laser scanner. A laser scanner designed for close range measurements could be used to provide a more reliable analysis of the surface floor, likely with less point cloud thickness. Filters or a calibration method could be developed to help minimize center point error and change in surface reflectivity. Accurate localization can be a challenge. SLAM solutions such as gmapping can provide reliable localization, however, unless the gmapping and odometry drift are balanced, this can result in ’jumping’ of the robot pose and orientation, resulting in momentary inaccurate localization. For a floor profile scan, this could result in a sudden shift in the 3D map of the floor. Other SLAM solutions such as hector mapping remove this dependency on odometry information, however, without consistent and accurate laser scans, the scan matching algorithm can result in small shifts of robot pose and orientation. These small shifts could result in similar inaccuracies observed with gmapping. Identifying a reliable and robust solution for locating the robot whilst performing the floor scan remains a challenge. The floor profile creation system was successful. The methodology was able to capture areas of interest in the target zone and provide an overview of the mapped floor. The RGB-D camera provides a larger field of view and this gives greater insight into the floor features; in particular, it is able to better capture both local and global areas of interest. The laser scanner has limitations surrounding the level of noise present in the measurements as well as material surface reflectivity and deflection errors. The laser scanner is sensitive to a change in material, which could introduce errors in some applications. The RGB-D camera also has some limitations; in particular, it must use auto-exposure in dynamic lighting conditions. If the camera is incorrectly exposed, the resulting point cloud and depth images can be poor. In contrast to the laser scanner, the RGB-D camera is less sensitive to different materials. This system can be used for identifying points of interest in a large area, such as high points or low points. The scanning method does not provide sufficient accuracy for applications that require micrometer or millimeter resolution; however, it can produce a fast scan for a large area, and a second, high-resolution scan could then be applied to key areas. Further, the profile mapping system can autonomously provide a quick means of producing an overview of a large area. The floor capture method is able to identify areas of interest, although, the accuracy of the estimated deviation from flatness is not yet validated.

9.5. Sensor Comparison

Overall, the RGB-D sensor captured more features of the floor and suffered from less systematic errors. Some errors due to camera alignment were observed. This is because the camera is required to be initially perfectly level for the system to accurately create the floor profile. In addition, the RGB-D camera was able to detect and highlight high and low areas, however, the scale of these high and low areas is yet to be validated. The short-range laser scanner continued to detect the black tape as a higher section of the floor, particularly in the workshop test. While the RGB-D camera did not detect the black tape to the same extent, the tape could be visually detected at some points throughout the test. The laser scanner measured consistent high areas that did not change with floor profile and robot position, and therefore can be considered to be systematic errors of the laser scanner itself. These could be overcome through a thorough calibration process. Due to Octomap point cloud stitching, this error as well as the surface thickness error is greatly reduced in the RGB-D sensor tests. The laser scanner produced a surface thickness of around 0.02 m when scanning the workshop floor. Due to the voxel grid approach, the RGB-D sensor produced a floor thickness of one voxel, 0.01 m.

9.6. Floor Capture Capability

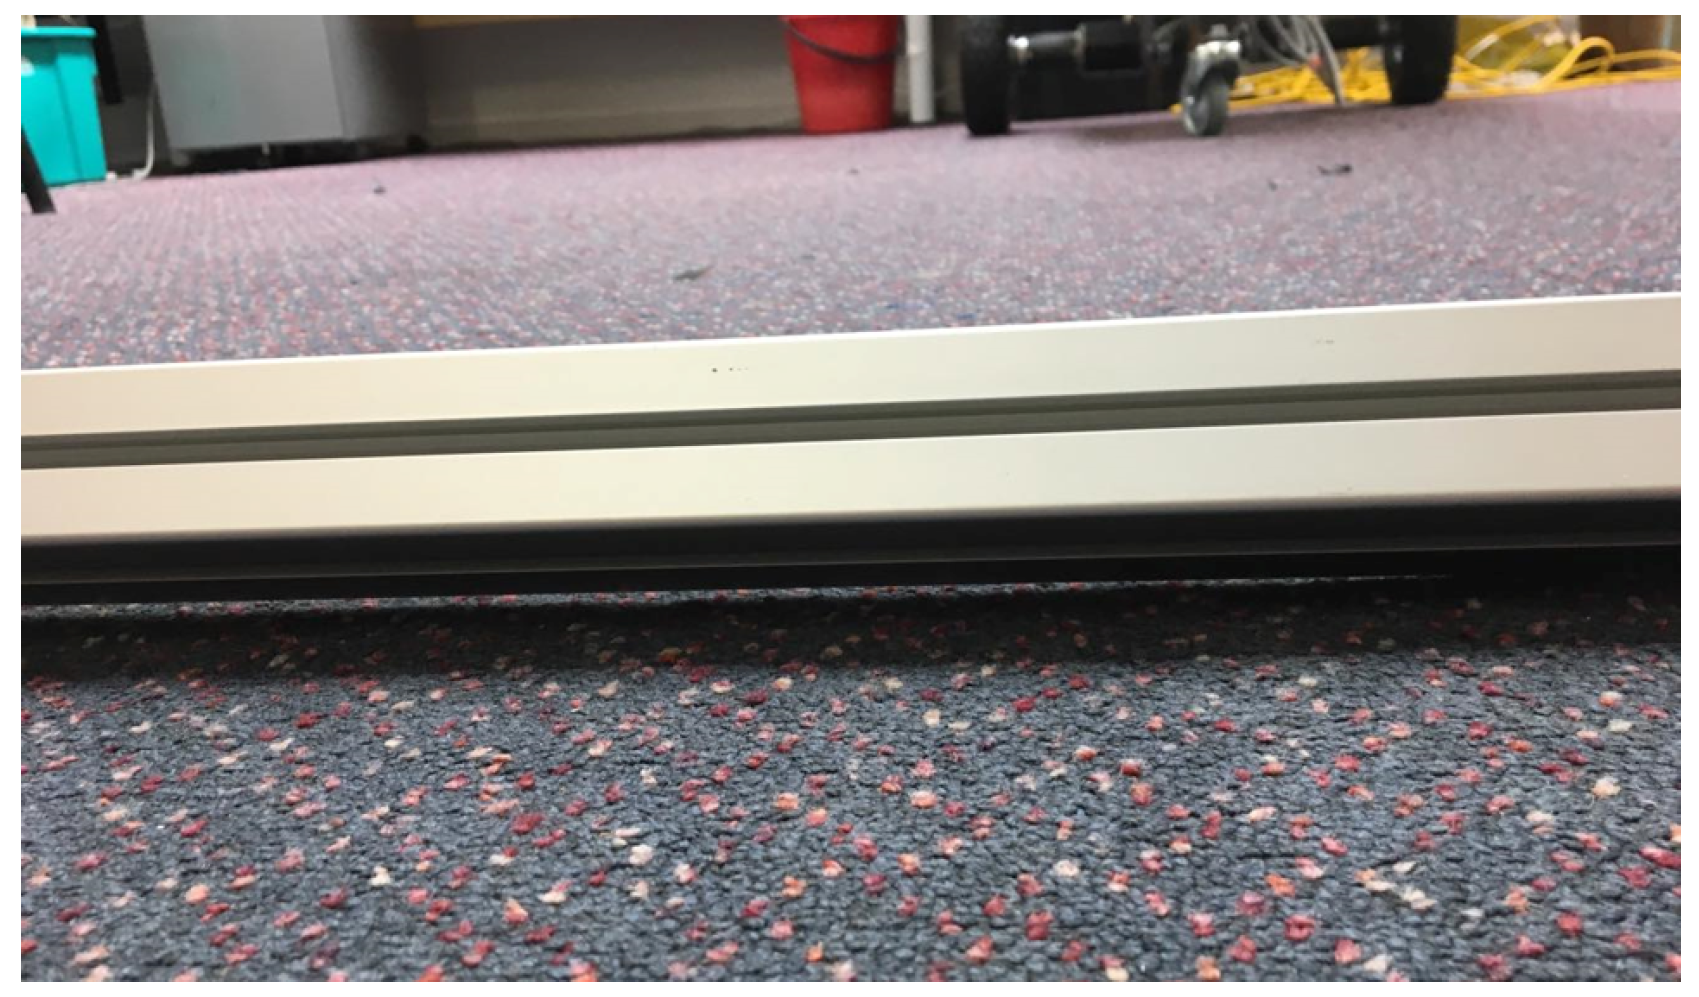
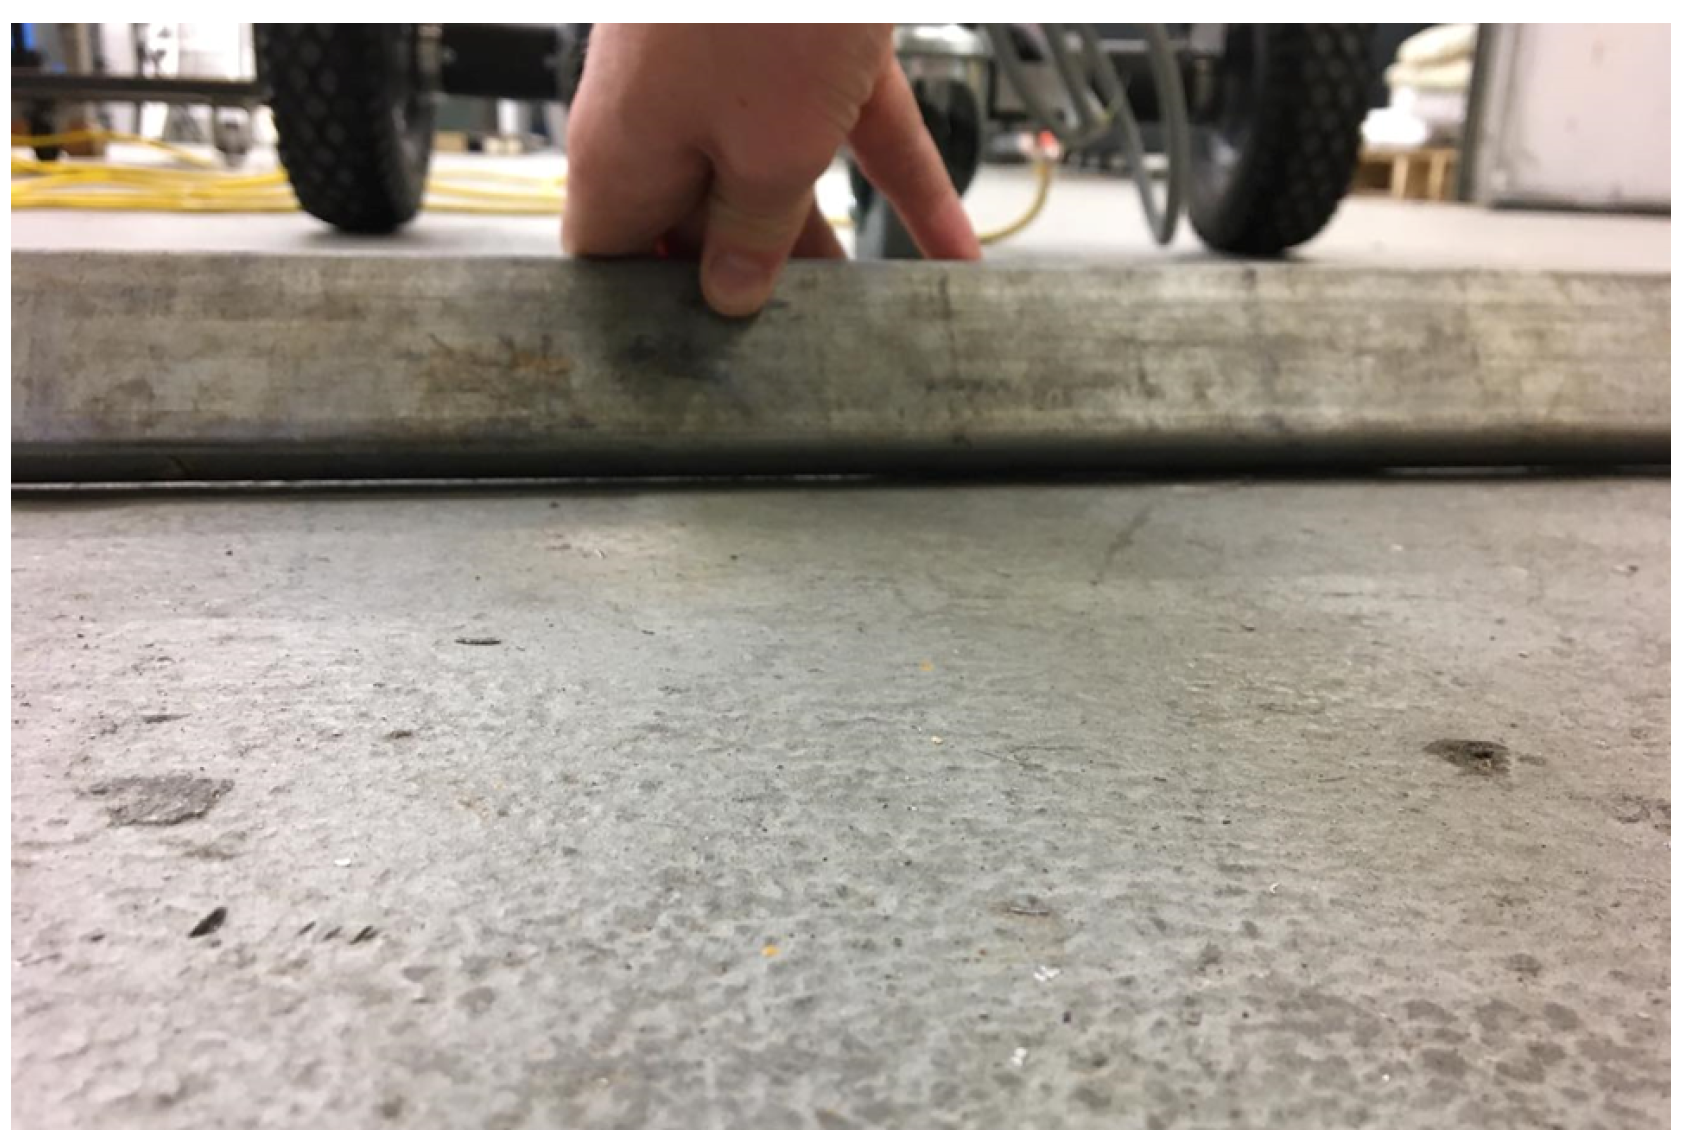
The RGB-D camera was able to highlight areas of interest, particularly high and low areas of the floor. While some errors were observed, the overall floor deviations appear to have been estimated. In the carpet 2 m × 2 m test, the sensor detected a high area in the middle of the first pass (Figure 16). This area was analysed after the test using a straight edge and was confirmed to have a deviation from flatness of around 2 mm over 200 mm of floor (Figure 17).
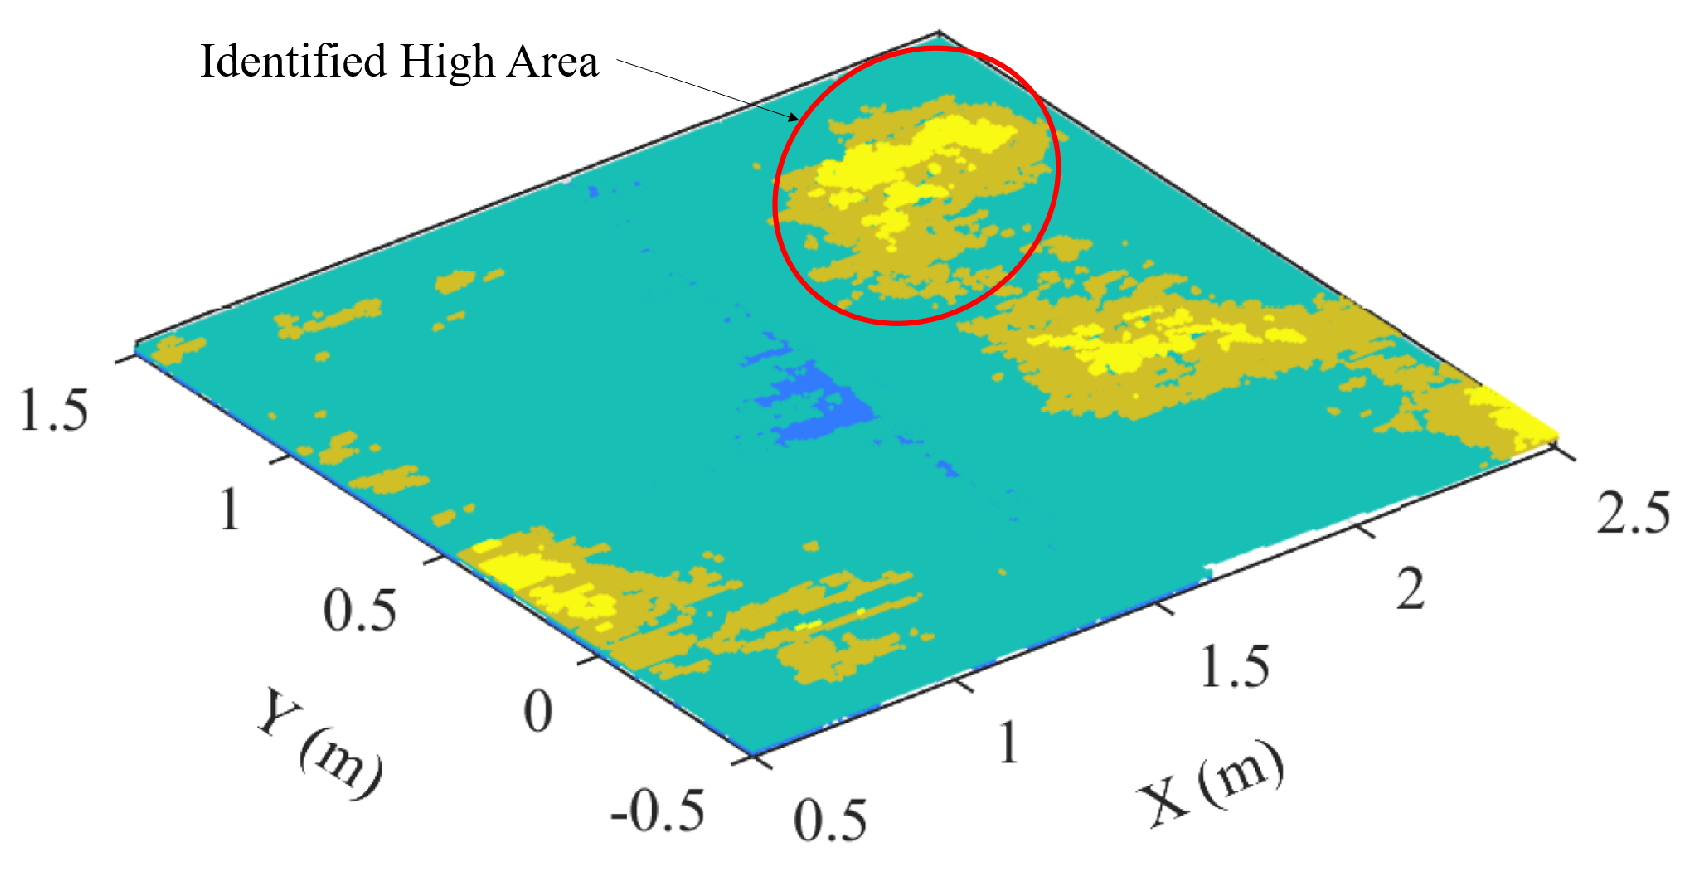
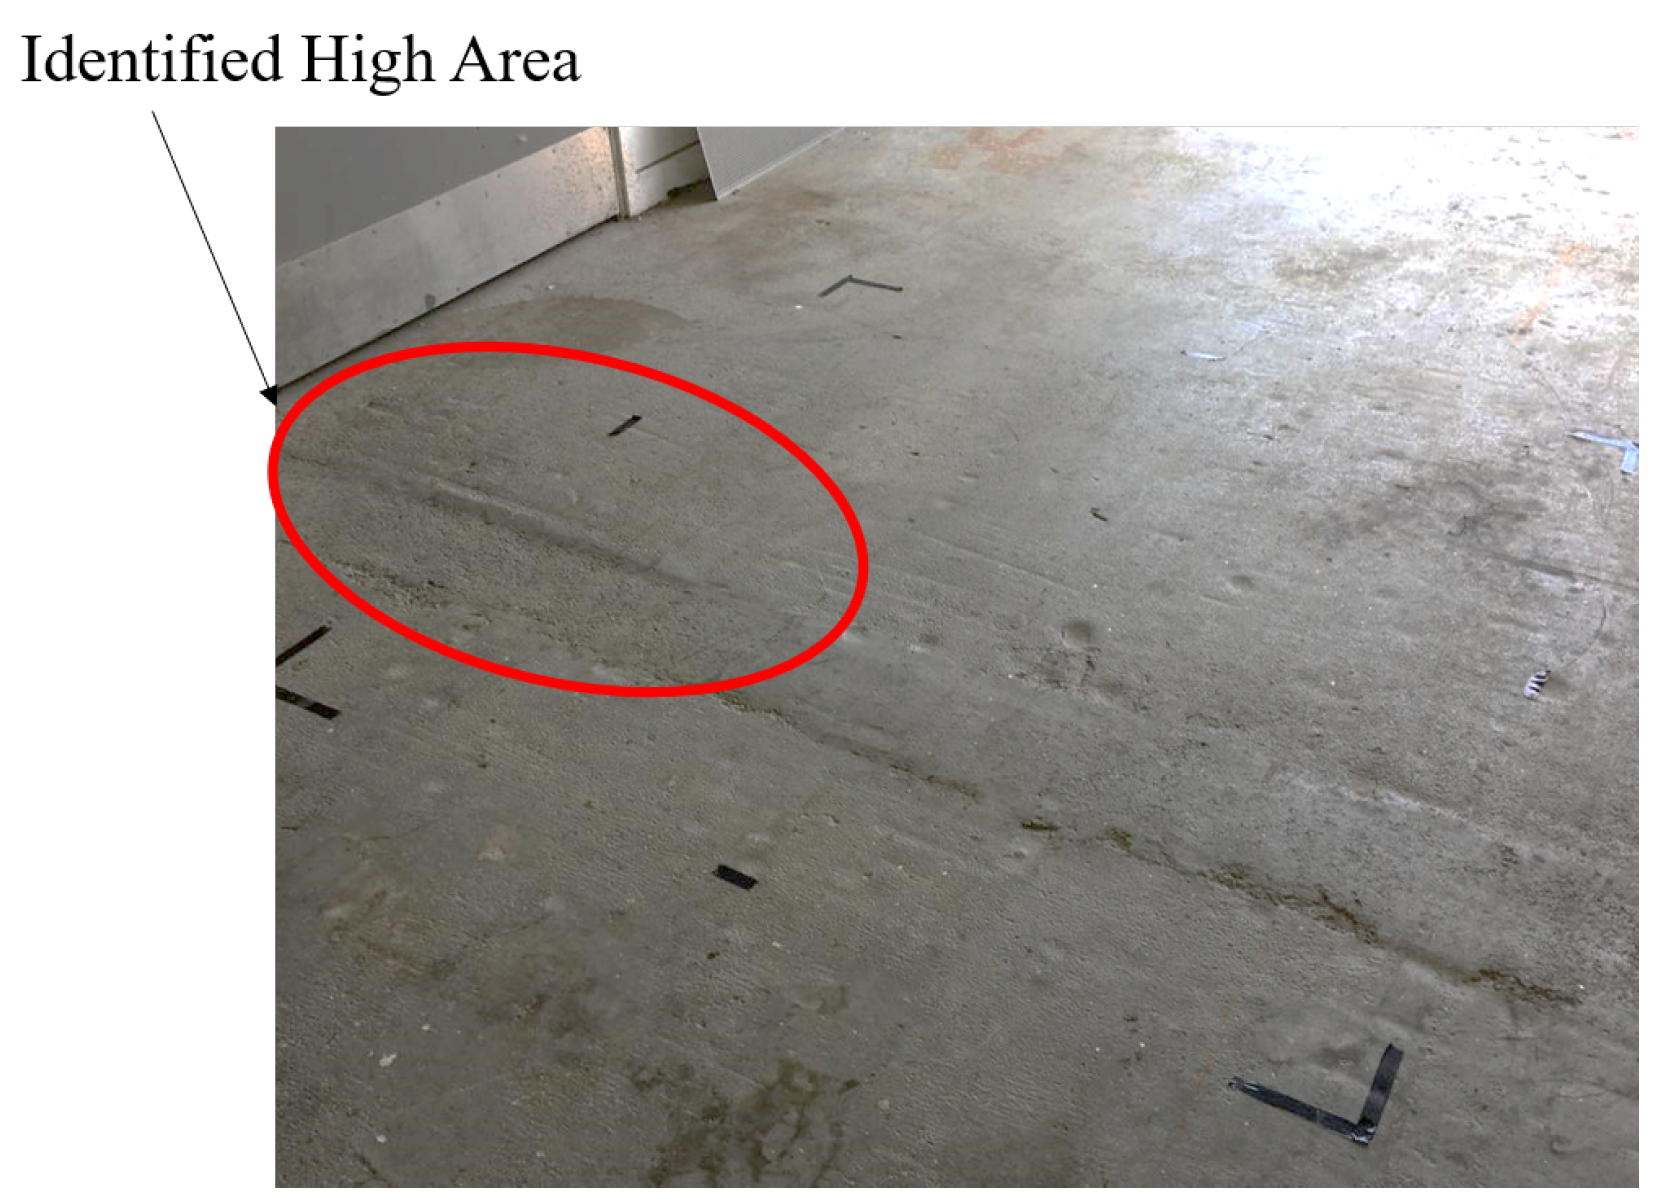
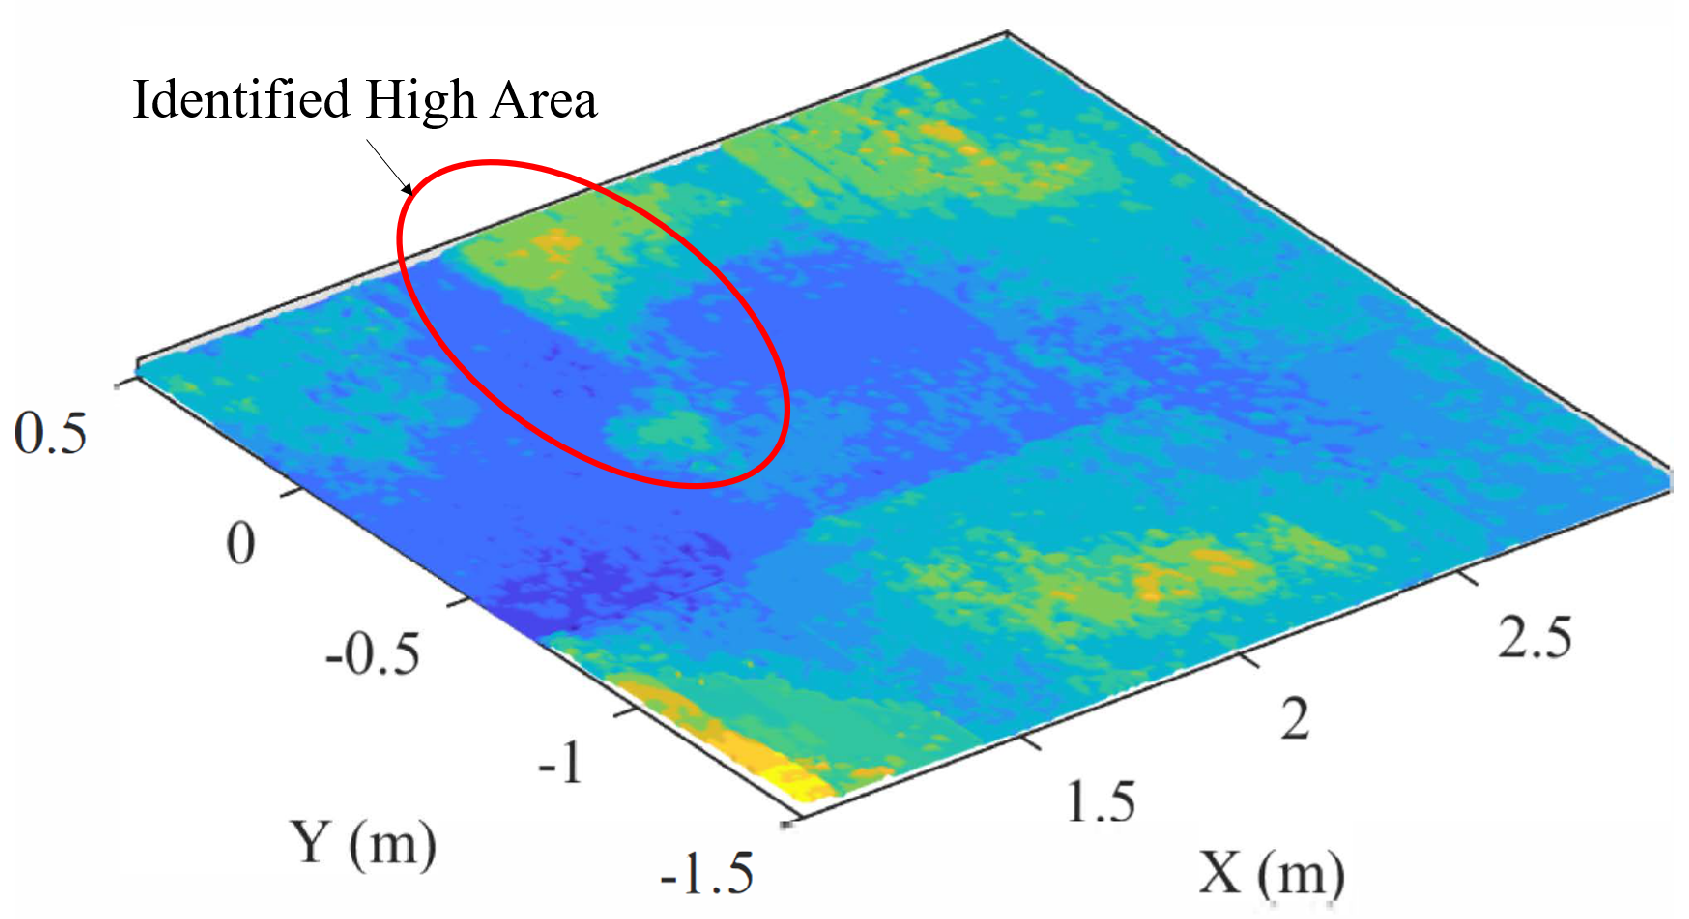
Similar performance was observed in the workshop floor experiments. Areas in the floor that had visually detectable deviations were successfully detected by the RGB-D sensor capture process. There was a significant bump in the workshop floor marked in Figure 18 that was also successfully detected during the floor capture process (Figure 19). A second area of interest was investigated using a straight edge and was also confirmed to be a deviation from flatness (Figure 20). The accuracy of these detected high areas is yet to be validated.

9.7. Surface Thickness

In an ideal world with ideal sensors, the measured surface profile would have a thickness of a single measured point. However, it has been observed that the thickness of the point cloud surface varies between floor types, with carpet producing the worst thickness. Such point cloud thickness is due to the accuracy of the laser scanner (±1 mm) and the reflectance and diffraction of light by the surface. However, this thickness is not an impediment and it is still possible to identify areas of interest in the floor.

9.8. Sources of Error

Some sources of error have been identified through analysis of the results and the robotic system. A key source of error is the floor sensor itself producing significant noise in measurements. The noise was observed in both of the sensors used, the laser scanner and the RGB-D camera. Octomap stitching of the point cloud data helps to reduce the effect of noise through collecting many frames of data. The frames of data are stitched together and the ray tracing method removes any erroneous measurements from previous frames. Due to the high frequency of frames (between 10 and 30 frames per second, depending on CPU load), and the slow movement of the scanning platform, this process successfully reduces the noise in the created floor profile. The IMU is subject to erroneous measurements and drift over time. This can result in a slow change in the z height over time, or, as observed in some tests, in incorrect readings when stopping or starting suddenly. In the testing, this was overcome through careful control and slow acceleration/deceleration of the robot, but remains a source of error that must be considered and mitigated. Any errors in height estimation can lead directly to errors in the captured floor profile. In future work, this error will need to be overcome to produce an improved system.

9.9. Sensor Selection and Limitations

Although the captured floor profile aligns with manual inspection with using a straight edge, the floor profile capture system and methodology have not yet been validated. Validation could be achieved by using a 3D TLS and comparing the captured floor surface of the two systems. This is out of scope for this project due to resource limitations, and remains as future work to be done.

9.9.1. Material Reflection and Laser Scanner

According to the literature surrounding the use of laser scanners, the reflectivity of the material being measured by a laser scanner is a highly important variable [26]. Tests performed throughout the research demonstrated this effect. During the initial floor capturing tests, the black tape used to mark the boundary of the target zones was found to be measured as significantly higher (for the carpet and coated asphalt tests) and significantly lower (for the asphalt tests), due to the reflectivity of the black tape compared with these three materials. In addition, the surface thickness captured for the carpet surface was significantly thicker than for the other surfaces, suggesting a greater amount of noise. This could be due to the fibers in the carpet causing measurement errors and changes in the deflection of the laser.

9.9.2. Light Interference and RGB-D Sensor

A limitation of a RGB-D camera is its sensitivity to light. Due to the projection and capture of infrared light, natural light can interfere with the readings. This can be calibrated and adjusted for through camera settings for indoor and outdoor applications (Section 7). However, this issue persists in applications where the camera is exposed to both indoor and outdoor lighting in a dynamic environment. The camera can continuously auto-expose; however, this can introduce other errors and takes time to complete. Auto-exposure can thus result in erroneous readings. This limitation will have to be considered during application.

9.10. Justification for Improvements

Throughout the development and testing of the research platform, a number of system improvements were made. Many of these were implemented after initial testing revealed limitations in the application and through the literature. Two key decisions are justified in the following sections.

9.10.1. 2D Extrapolation Limitations

AMCL localization using a horizontal 2D laser scanner can provide a relatively accurate method for global localization; however, this only operates in 2D. In order to create an accurate 3D map of a surface, the full 3D orientation and position of the robot is required. This is often achieved by using expensive 3D sensors such as 3D Terrestrial Laser Scanners, but this research aims to utilize cheaper sensors to achieve similar results. In order to extrapolate the 2D location into the 3D environment, the 6 DOF data from the IMU is fused with odometry and AMCL data. This gives the robot location on a 2D map together with the full orientation (roll, pitch, and yaw). However, it does not address the z height of the robot. The z height must be taken into consideration in order for an accurate surface to be created. There are limitations to the methodology applied, in that the IMU is often subject to drifting, and therefore exposes the robot’s 3D location to additional noise. Location noise combined with noise from measurements could result in significantly inaccurate measurements. These limitations remain a challenge and this remains an area for further research improvements. A potential solution is to apply a point cloud registration matching algorithm for z adjustments. This algorithm could utilize common methods of ICP to identify the best-fit point cloud when adjusting only the global z value of the point cloud. This solution works best with a large number of features, whilst a floor typically has minimal features. This challenge therefore remains to be overcome.

9.10.2. Localisation

Global localization was significantly improved throughout the development. Tuning of odometry parameters and utilization of the AMCL node helped increase localization reliability and reduce jumping in x and y position estimation. The localization method used was an adapted 2D approach, where 2D solutions such as finding the x and y global position through AMCL was applied and then extended through the use of an IMU and position estimates. This proved to be an acceptable solution that was capable of successfully mapping a ramp, although the accuracy of the 3D extrapolation could be improved as part of the further development of the robot system. In particular, the use of the IMU makes the system prone to drift and resulting errors. This could be overcome using additional visual sensors, such as a camera for orientation estimation, or through an improved IMU.

10. Conclusions

Capture of the floor surface profile was demonstrated using a prototype robotic research platform with two sensors: a horizontal 2D laser scanner for SLAM, and a second, swappable, sensor to capture the floor data. The experimental results showed that the system was able to capture some features of the floor, but its full capability is yet to be verified. The RGB-D camera performed better than the laser scanner, providing greater insight into the high and low areas of the floor, which were confirmed using a straight edge. The developed system utilizes cheap, accessible sensors to create a 3D floor surface map of the environment that can be used as prior knowledge. This can provide advantage in a number of areas, notably polishing, grinding, cleaning, navigation, inspection, and terrain traversability. There are opportunities to further investigate how a mobile robotic platform can provide reliable and accurate surface profiles of the floor for improved navigation with prior knowledge of the surface. The challenges identified include accurate and consistent localization of the robot and surface reflectivity. Sources of error due to odometry drift and laser scanner accuracy would need to be overcome before the system can be applied in the field. A key finding is that the surface itself is a significant factor on the measured profile, in such that dirt or differing materials could cause false height measurements. Overall the methodology has proved a successful real time solution for creating a point cloud of the floor surface. A number of areas of further research have been identified. Validation of the accuracy of the scanning process remains a requirement for further development. In addition, robust methods of estimating the z height for 3D extrapolation can be explored.
At the invitation of the publisher, we have issued a clarification in the Supplementary Materials to prove that there is no self-plagiarism in this article.

Supplementary Materials

The following are available online at https://www.mdpi.com/2072-4292/11/22/2626/s1.

Author Contributions

Conceptualization, methodology, software, validation, formal analysis, investigation, S.W. and K.M.A.; writing–original draft preparation, S.W.; writing–review and editing, K.M.A.; resources, supervision, project administration, funding acquisition, J.P. and K.M.A.

Funding

This research was funded by the Ministry of Business, Innovation and Employment (MBIE) New Zealand and Massey Ventures Ltd.

Acknowledgments

We would like to thank Jason Torbet from Mega Innovations Ltd. for his invaluable expertise and vision for this project.

Conflicts of Interest

The authors declare no conflict of interest.

References

  1. Wang, Q.; Kim, M.K. Applications of 3D point cloud data in the construction industry: A fifteen-year review from 2004 to 2018. Adv. Eng. Inform. 2019, 39, 306–319. [Google Scholar] [CrossRef]
  2. Bosché, F.; Guenet, E. Automating surface flatness control using terrestrial laser scanning and building information models. Autom. Constr. 2014, 44, 212–226. [Google Scholar] [CrossRef]
  3. Valero, E.; Bosché, F. Automatic Surface Flatness Control using Terrestrial Laser Scanning Data and the 2D Continuous Wavelet Transform. In Proceedings of the International Symposium on Automation and Robotics in Construction (ISARC), Auburn, AL, USA, 18–21 July 2016; Volume 33, p. 1. [Google Scholar]
  4. Alhasan, A.; White, D.J.; De Brabanterb, K. Continuous wavelet analysis of pavement profiles. Autom. Constr. 2016, 63, 134–143. [Google Scholar] [CrossRef]
  5. Chuang, T.Y.; Perng, N.H.; Han, J.Y. Pavement performance monitoring and anomaly recognition based on crowdsourcing spatiotemporal data. Autom. Constr. 2019, 106, 102882. [Google Scholar] [CrossRef]
  6. Tsuruta, T.; Miura, K.; Miyaguchi, M. Mobile robot for marking free access floors at construction sites. Autom. Constr. 2019, 107, 102912. [Google Scholar] [CrossRef]
  7. Gao, F. Interferometry for Online/In-Process Surface Inspection. In Optical Interferometry; InTech: London, UK, 2017; pp. 41–59. [Google Scholar]
  8. Chow, J.C.; Lichti, D.D.; Hol, J.D.; Bellusci, G.; Luinge, H. IMU and multiple RGB-D camera fusion for assisting indoor stop-and-go 3D terrestrial laser scanning. Robotics 2014, 3, 247–280. [Google Scholar] [CrossRef]
  9. Puente, I.; González-Jorge, H.; Martínez-Sánchez, J.; Arias, P. Review of mobile mapping and surveying technologies. Measurement 2013, 46, 2127–2145. [Google Scholar] [CrossRef]
  10. Zlot, R.; Bosse, M. Efficient large-scale 3D mobile mapping and surface reconstruction of an underground mine. In Field and Service Robotics; Springer: Berlin/Heidelberg, Germany, 2014; pp. 479–493. [Google Scholar]
  11. Banica, C.; Paturca, S.V.; Grigorescu, S.D.; Stefan, A.M. Data acquisition and image processing system for surface inspection. In Proceedings of the 2017 10th International Symposium on Advanced Topics in Electrical Engineering (ATEE), Bucharest, Romania, 23–25 March 2017; pp. 28–33. [Google Scholar]
  12. Wen, C.; Qin, L.; Zhu, Q.; Wang, C.; Li, J.J. Three-dimensional indoor mobile mapping with fusion of two-dimensional laser scanner and RGB-D camera data. IEEE Geosci. Remote Sens. Lett. 2014, 11, 843–847. [Google Scholar]
  13. Quigley, M.; Conley, K.; Gerkey, B.; Faust, J.; Foote, T.; Leibs, J.; Wheeler, R.; Ng, A.Y. ROS: An open-source Robot Operating System. In Proceedings of the ICRA Workshop on Open Source software, Kobe, Japan, 17 May 2009; Volume 3, p. 5. [Google Scholar]
  14. AG, S. LMS200/211/221/291 Laser Measurement Systems. 2006. Available online: http://sicktoolbox.sourceforge.net/docs/sick-lms-technical-description.pdf (accessed on 26 March 2018).
  15. Grisetti, G.; Stachniss, C.; Burgard, W. Improved techniques for grid mapping with rao-blackwellized particle filters. IEEE Trans. Robot. 2007, 23, 34–46. [Google Scholar] [CrossRef]
  16. Grisettiyz, G.; Stachniss, C.; Burgard, W. Improving grid-based slam with rao-blackwellized particle filters by adaptive proposals and selective resampling. In Proceedings of the 2005 IEEE International Conference on Robotics and Automation, ICRA 2005, Barcelona, Spain, 18–22 April 2005; pp. 2432–2437. [Google Scholar]
  17. Thrun, S.; Fox, D.; Burgard, W.; Dellaert, F. Robust Monte Carlo localization for mobile robots. Artif. Intell. 2001, 128, 99–141. [Google Scholar] [CrossRef] [Green Version]
  18. RobotShop. Hokuyo URG Scanning Laser Rangefinder. 2019. Available online: https://www.robotshop.com/en/hokuyo-urg-04lx-ug01-scanning-laser-rangefinder.html (accessed on 19 August 2019).
  19. Intel. Intel RealSense Depth Camera D435. 2018. Available online: https://click.intel.com/intelr-realsensetm-depth-camera-d435.html (accessed on 19 August 2019).
  20. Engine, N. NextEngine 3D Scanner Tech Specs. 2019. Available online: http://www.nextengine.com/assets/pdf/scanner-techspecs-uhd.pdf (accessed on 19 August 2019).
  21. Wilson, S.; Potgieter, J.; Arif, K. Floor surface mapping using mobile robot and 2D laser scanner. In Proceedings of the 2017 24th International Conference on Mechatronics and Machine Vision in Practice (M2VIP), Auckland, New Zealand, 21–23 November 2017; pp. 1–6. [Google Scholar]
  22. Borenstein, J.; Feng, L. Measurement and correction of systematic odometry errors in mobile robots. IEEE Trans. Robot. Autom. 1996, 12, 869–880. [Google Scholar] [CrossRef] [Green Version]
  23. Droeschel, D.; Schwarz, M.; Behnke, S. Continuous mapping and localization for autonomous navigation in rough terrain using a 3D laser scanner. Robot. Auton. Syst. 2017, 88, 104–115. [Google Scholar] [CrossRef]
  24. Hornung, A.; Wurm, K.M.; Bennewitz, M.; Stachniss, C.; Burgard, W. OctoMap: An efficient probabilistic 3D mapping framework based on octrees. Auton. Robot. 2013, 34, 189–206. [Google Scholar] [CrossRef]
  25. Endres, F.; Hess, J.; Sturm, J.; Cremers, D.; Burgard, W. 3-D mapping with an RGB-D camera. IEEE Trans. Robot. 2014, 30, 177–187. [Google Scholar] [CrossRef]
  26. Boehler, W.; Vicent, M.B.; Marbs, A. Investigating laser scanner accuracy. Int. Arch. Photogramm. Remote Sens. Spat. Inf. Sci. 2003, 34, 696–701. [Google Scholar]
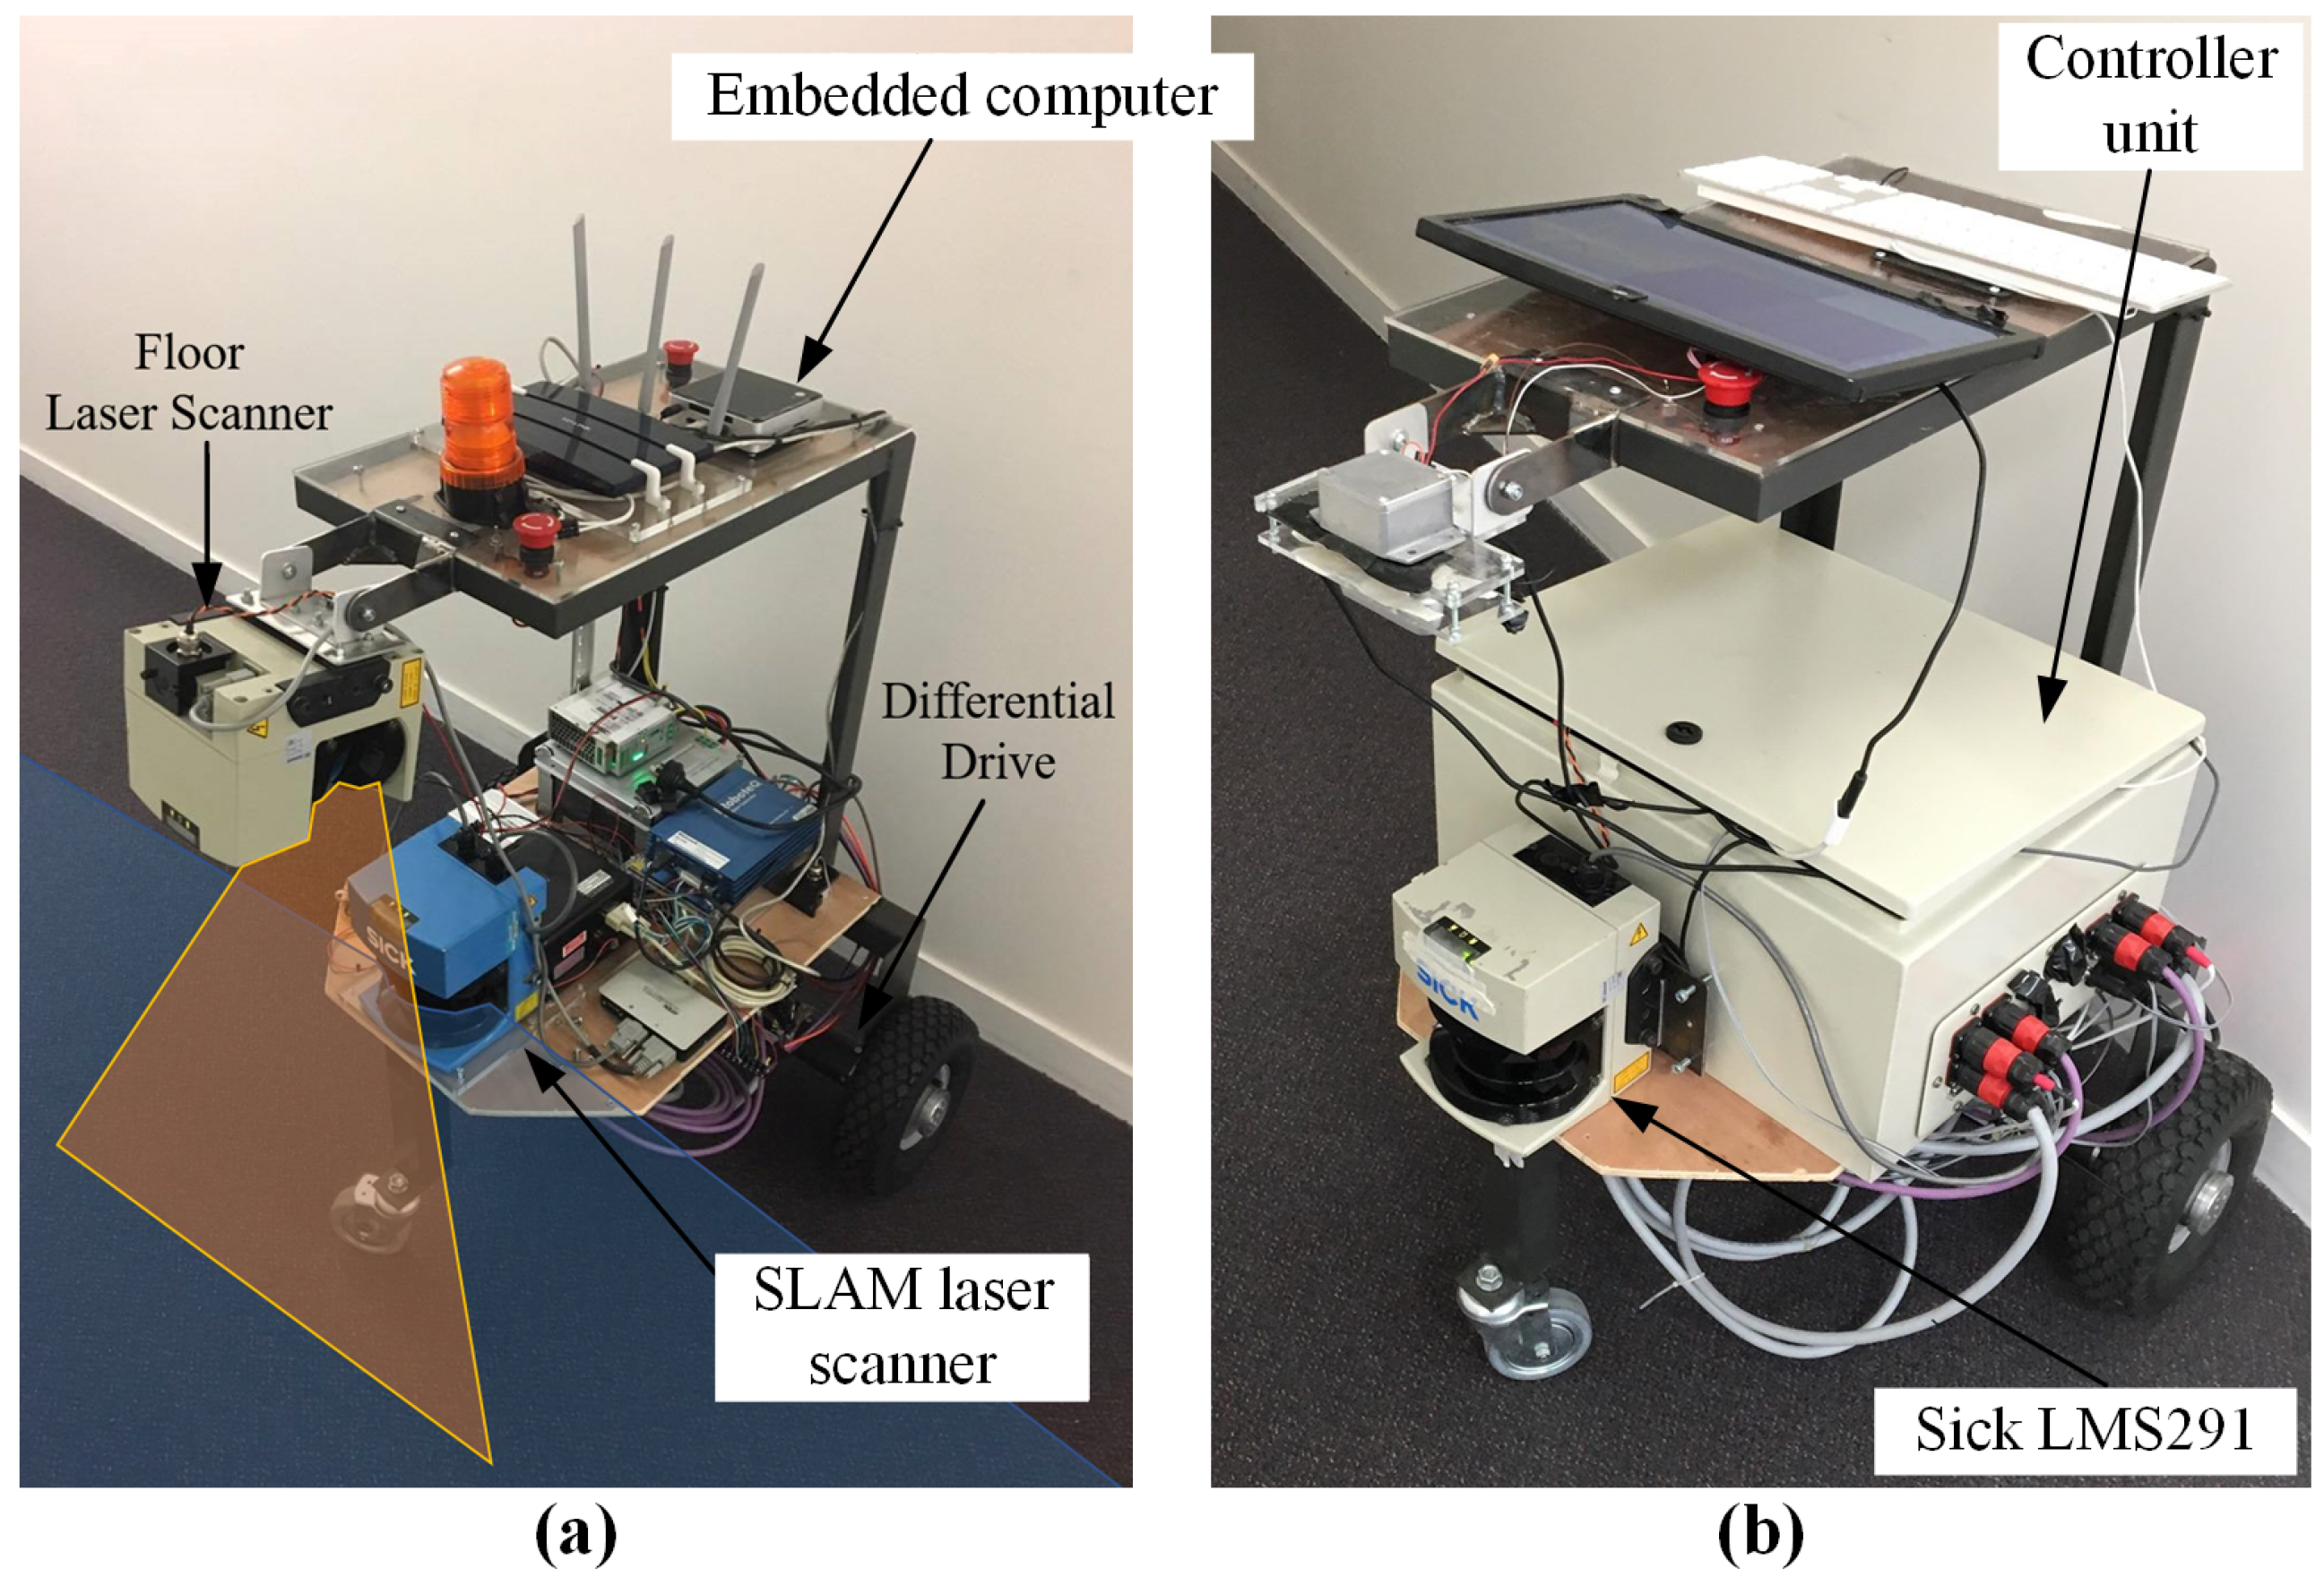
Figure 1. Mobile robotic platform. (a) Platform with two laser scanners for SLAM and floor scanning. (b) Platform with a SLAM laser scanner and a floor scanning RGB-D camera.
Remotesensing 11 02626 g001
Figure 2. ROS system architecture.
Remotesensing 11 02626 g002
Figure 3. Test surfaces used for mapping.
Remotesensing 11 02626 g003
Figure 4. Coverage path for scan area.
Remotesensing 11 02626 g004
Figure 5. Results for carpeted surface.
Remotesensing 11 02626 g005
Figure 6. Results for coated asphalt surface.
Remotesensing 11 02626 g006
Figure 7. Results for asphalt surface.
Remotesensing 11 02626 g007
Figure 8. 3D extrapolation verification test.
Remotesensing 11 02626 g008
Figure 9. Diagram of robot floor measurement on a slope.
Remotesensing 11 02626 g009
Figure 10. RealSense lighting calibration.
Remotesensing 11 02626 g010
Figure 11. Corrected laser scan (above) shown with raw laser scan (below).
Remotesensing 11 02626 g011
Figure 12. Laser scan results for carpet floor.
Remotesensing 11 02626 g012
Figure 13. RGB-D capture results for carpet floor.
Remotesensing 11 02626 g013
Figure 14. Laser scan results for workshop floor.
Remotesensing 11 02626 g014
Figure 15. RGB-D capture results for workshop floor.
Remotesensing 11 02626 g015
Figure 16. Captured high point in carpet floor.
Remotesensing 11 02626 g016
Figure 17. Investigation of corresponding high point in carpet floor using straight edge.
Remotesensing 11 02626 g017
Figure 18. Workshop floor with significant bump highlighted.
Remotesensing 11 02626 g018
Figure 19. Capture of workshop floor high point.
Remotesensing 11 02626 g019
Figure 20. Investigation of high point in workshop floor using straight edge.
Remotesensing 11 02626 g020
Table 1. Sensor Specifications.
SensorRangeAccuracyResolutionPrice
SICK LMS2918 m or up to 80 m±35 mm and 50 mm0.25 degreesUS$6000
Hokuyo URG20 mm to 5600 mm±30 mm0.36 degreesUS$1080
Intel D43510 mnot stated640 × 480 pixelsUS$180
NextEngine 3D200 mm±0.30 mm3.50US$2995