Article

Orange Snow—A Saharan Dust Intrusion over Romania During Winter Conditions

1
Remote Sensing Department, National Institute of Research and Development for Optoelectronics INOE 2000, Str. Atomiştilor 409, Măgurele, RO077125 Ilfov, Romania
2
Department of Physics, Politehnica University of Bucharest, Spl. Independenţei 313, RO060042 Bucureşti, Romania
3
Faculty of Electronics, Telecommunications and Information Technology, Politehnica University of Bucharest, Bd. Iuliu Maniu 1–3, RO061071 Bucureşti, Romania
4
Department for Advanced Surface Processing and Analysis by Vacuum Technologies, National Institute of Research and Development for Optoelectronics, Str. Atomiştilor 409, Măgurele, RO077125 Ilfov, Romania
5
INCDO INOE 2000 Research Institute for Analytical Instrumentation, Str. Donath 67, RO400293 Cluj-Napoca, Romania
*
Author to whom correspondence should be addressed.
Remote Sens. 2019, 11(21), 2466; https://doi.org/10.3390/rs11212466
Submission received: 2 October 2019 / Revised: 18 October 2019 / Accepted: 19 October 2019 / Published: 23 October 2019

Abstract

:
On the morning of 23 March 2018, an unusual phenomenon was observed over Romania where the southeastern part of the country was covered in a fresh-layer of orange snow. The event was extensively reported in mass-media and social-media and raised questions about the origin and the possible impact of the orange snow. Even if this type of events, intrusions of Saharan dust, have been reported before in Romania, and in Europe in general, their occurrence during negative temperature conditions is very rare. Saharan dust intrusion occurs over Europe mainly during spring and, in general, is not accompanied by snow at low altitudes. In this article, for the first time, the synoptic-scale conditions leading to the Saharan dust intrusion over Romania and the chemical and physical properties of the deposited dust particles in a snow layer were analyzed. The Saharan dust event affected a permanent atmospheric measurement research infrastructure located southwest of Bucharest, the capital city of Romania. In-situ and remote sensing measurements conducted at this research infrastructure allowed the identification of the dust source as the north Sahara. The source was confirmed by the elemental ratios of the main components (e.g., Al, Ca, Mg, Fe, K). For example, the (Ca+Mg)/Fe ratio of 1.39 was characteristic for the north Sahara. The dust morphology and the minerals were analyzed by scanning electron microscopy with energy disperse X-ray spectrometry (SEM/EDX). The size distribution of the particle geometric diameter showed that they are centred on 1 μ m, but larger particles up to 40 μ m are also present. To visualize the minerals, an approach was developed which emphasized the presence of the calcite, quartz or clay minerals. The optical parameters of dust were measured by re-suspending the particles. Values of the optical parameters (i.e., asymmetry parameter at 550 nm was 0.604, single scattering albedo was 0.84–0.89) were similar to those measured for Saharan dust intrusions over the Iberian Peninsula. Also, the non-refractory particles found in the dust-contaminated snow layer were analyzed, indicating the presence of HULIS-like compounds, most probably advected from the Mediterranean sea.

Graphical Abstract

1. Introduction

Every year, approximately 1.2–1.8 Gt yr 1 of dust is released into the atmosphere reaching the medium and upper troposphere [1,2,3,4]. Of this, approximately 50.7% is transported from the Sahara to Europe [5]. The most affected European countries by the Saharan dust transport are those from the Mediterranean basin [6]. This dust transport can have a direct and indirect effect on the radiative budget, human health and terrestrial and aquatic ecosystems [7]. Dust intrusions were observed up to 6 km altitude, and their transport directly influenced the Alps, the Apennines, the Pyrenees, and the Carpathian Mountains [4,8]. Di Mauro et al. [9] showed that dust deposition changes the snow melt-out dates, altering the hydrological cycle in the Alps. Also, dust is influencing the severity of respiratory conditions (e.g., asthma) especially when significant quantities of particulate matter (PM) including dust are present in the air (i.e., an increase of more than 10 μ g m 3 in PM 10 , [10]). Saharan dust particles can also carry bacteria over long distances (e.g., the Alps) despite the low temperatures and UV radiation at which the are exposed during transport [11]. Dust deposition can also have beneficial effects, for example, the high Fe content of dust can act as a soil nutrient [12].
The transport of Saharan dust over Europe has been extensively analyzed during the last decades. This was facilitated by the developments of remote sensing techniques and networks using ground-based measurements e.g., [13,14,15,16], in-situ measurements e.g., [17,18], satellite-based measurements e.g., [4,19,20,21,22], and numerical modelling e.g., [23,24]. To understand the seasonality of dust intrusions over Europe, Marinou et al. [4] performed a 9-year study of Saharan dust transport based on satellite data from Cloud-Aerosol Lidar and Infrared Pathfinder Satellite Observation (CALIPSO) and lidar ground-based measurements from the European Aerosol Research Lidar Network (EARLINET). The study showed, that during the spring, dust aerosols are transported from Sahara to Europe, with the highest incidence of dust intrusion over the Mediterranean region. Similar results concerning the seasonal variation of dust over Europe were obtained by Mandija et al. [23] using a modelling approach.
Not only the countries bordering the Mediterranean Sea ([16,24] for Greece) but also those located in central and southeastern Europe (e.g., [25] for Romania, [26] for Hungary) are affected by Saharan dust transport which can negatively impact the daily activities. Thus, under certain meteorological conditions the dust can reach high altitudes later being detected at the ground due to the dry and wet depositions (e.g., [26]). Over southeastern Europe, Saharan dust is reported more frequently during the spring (March–May) compared with other periods of the year [23].
One example, is the event that occurred on 22–23 March 2018 when Saharan dust was deposited at the ground over southeastern Romania. A particularity of this event is that the dust was deposited together with snow. Previous studies on Saharan dust deposited onto snow surfaces focused on events that occurred at high altitudes over central Europe (e.g., [8,27] for the Alps). There are very few studies on Saharan dust deposition by rainfalls (e.g., [26]) over southeastern Europe, and no studies, to the authors knowledge, analyzing the dust deposition by snowfall.
The purpose of this article is to analyze for the first time the characteristics of a long-range Saharan dust transport event accompanied by snowfall that occurred over southeastern Europe between 22–23 March 2018. The analysis is based on the continuous measurements performed at the Romanian Atmospheric 3D Observatory (RADO) situated near Bucharest which allowed the analysis of the type of mineral particles transported, the chemical composition of the refractory or non-refractory aerosols and their physical properties. This article is structured as follows. Section 2 describes the sampling site, the data and the methodology, including discussions on its main limitations. Section 3 provides the synoptic context of the dust transport and the local environment before the dust event. The dust particle morphology, their chemical composition and their optical properties are also described in Section 3. Finally, Section 4 summarizes the results of this paper.

2. Methodology

To better understand the evolution and the impact of the dust transport event from 22–23 March 2018 over the sampling site (Section 2.1), a combined approach was used based on: (i) meteorological observations; (ii) numerical weather prediction data (Section 2.2); (iii) aerosols measurements performed during the dust event (Section 2.3); and (iv) the chemical and physical analysis of the collected dust and snow sample (Section 2.4).

2.1. Sampling Site

The in-situ measurements and experiments were performed at Măgurele city (44.35 N, 26.03 E, 93 m ASL), a peri-urban area near Bucharest (Figure 1a). This area is influenced by road traffic, local industry (e.g., concrete factory, power plant) and domestic activities (e.g., residential heating, agricultural fires). The site is situated approximately 10 km south-west from the center of Bucharest at RADO part of the National Institute of Research and Development for Optoelectronics (INOE) [28,29,30]. RADO is one of the observatories included in Aerosol, Clouds and Trace Gases Research Infrastructure (ACTRIS, https://www.actris.eu/, accessed on 25 September 2019). Over the sampling site, the average PM 10 concentration is lower than 50 μ g m 3 (i.e., 36 μ g m 3 in March–May, 44 μ g m 3 in June–August, 40 μ g m 3 September–November, 53 μ g m 3 in December–February), which is characteristic for rural sites [31,32]. At the sampling site, during Spring (March–May), the non-refractory PM 1 is dominated by organics (e.g., hydrocarbon organic aerosols, biomass burning organic aerosols) (46%) and in a lower proportion sulfate(29%), nitrate (11%), ammonium (12%), and chloride (2%) while the other months are dominated by organics with a percent higher than 50% [33].

2.2. Meteorological Data

The general meteorological context was analyzed for a domain between 25 N–55 N and 15 W–50 E using ERA-Interim reanalysis provided by ECMWF, MSG-SEVIRI desert dust RGB imagery from EUMETSAT, and Copernicus Atmosphere Monitoring Service global near-real time (CAMS) analysis and forecast. ERA-Interim reanalysis dataset of mean sea level pressure (MSLP), 700 hPa geopotential height, and 850 hPa temperature at a spatial resolution of 0.125 × 0.125 [34] were used to emphasize the main synoptic processes during the event. The MSG-SEVIRI desert dust RGB composite imagery is based on a combination of 8.7 μ m, 10.8 μ m, and 12.0 μ m infrared channels. This product enabled the detection of desert dust clouds, but also the phase of the clouds during day and night time [35]. To analyze the dust intrusion dynamics from its source towards southeastern Europe, the CAMS NRT analysis and forecasts of dust optical depth (DOD) at 550 nm were used. The CAMS service provides daily analyses and forecasts based on ECMWF Integrated Forecasting System with data assimilation of reactive trace gases, greenhouse gases, and aerosol concentrations [36,37]. The model includes the aerosol parametrization using bin representation for aerosols of natural origin. Dust particles are represented by three bins (i.e., 0.03–0.55, 0.55–0.9, 0.9–20 μ m) and thus roughly 10, 20, and 70% of total mass is included in these size limits [36]. These information were analyzed in conjunction with the data from a 14-channel Humidity And Temperature PROfiler (HATPRO) microwave radiometer (MWR, Rose et al. [38]) located at RADO and manufactured by Radiometer Physics (RPG, GmbH, Meckenheim, Germany). The RPG-HATPRO provides observations in the 21–31 GHz (7 channels) and 51–58 GHz (7 channels) microwave spectral domain. The data provided by this instrument were used to extract vertical profiles (39 levels up to 10 km) of temperature (accuracy up to ±1 K RMS) and humidity (accuracy of ±0.4 g m 3 RMS) every 90 s during the snow event, thus supplementing the radiosonde observation from the Bucharest site available only at 0000 UTC and 1200 UTC (LT + 2 h). Surface observations for this event were obtained from the Filaret (Bucharest) weather station situated at approximately 9 km north-northeast from RADO.

2.3. Ambient Aerosols Measurements before Dust Snow Event

Aerosol particles present in the atmosphere at the ground level were collected continuously between 22–23 March through a gravimetric method (i.e., Low Volume Sampler–LVS3, manufactured by LECKEL, Berlin, Germany) with a filter changed every 24 h and using a 2.5 μ m inlet and a pump flow rate of 2.3 Nm 3 h 1 on quartz filter (i.e., 47 mm diameter Pallflex Tissuquartz filters manufactured by Pall Corporation, New York, NY, USA) with the purpose to analyze their morphology and elemental composition. Continuous measurements of aerosol particles were conducted with Aerodynamic Particle Sizer (APS 3321, manufactured by TSI, Shoreview, MN, USA) [39] and optical particle counter (Environmental Dust Monitoring-EDM180 manufactured by GRIMM, Ainring, BGL, Germany [40]) with time resolution of 10 min and 1 min, respectively.

2.4. Dust Deposition Measurements

To analyze the dust from the snow layer, a sample was collected on 24 March, the next day after the snow has ceased. The sample (approximately 1.1 kg) was extracted from the snow layer with the highest intensity color based on visual inspection at the RADO site (Figure 1b). To minimize the possible contamination of the deposited particles during the snow episode, the sample was stored in a sterile zip bag and kept at −18 C for further analyses. The snow sample was divided into smaller samples that were treated separately in order to evidence different particularities and properties. To determine the morphology, 4 g of snow were melted and then filtered, the solid particles being then analyzed. Optical properties were determined by re-suspending the particles contained in 100 mL of melted snow using an atomizer (3076 TSI, manufactured by TSI, Shoreview, MN, USA) and an ultrasounds system (Emmi-20 HC EMAG) (Figure 2). To quantify the dust concentration and to determine the chemical composition of the sample, the snow was melted and then the water evaporated at 100 C. After evaporation, the mass concentration of the solid particles in the sample was 1.1524 g L 1 . Next, to determine the metal content, 10.5 mL of the total collected sample was evaporated and then treated with 7 mL HNO 3 (65%) and 21 mL HCl (37%) to solubilize the metals.
Several methods were used to determine dust characteristics: (i) Inductively Coupled Plasma-Optical Emission Spectrometry (ICP-OES, using 3500 Optima DV, Perkin Elmer, Waltham, MA, USA) for dust chemical composition; (ii) catalytic combustion and non-dispersive infrared detection using a Multi N/C 2100 S Analyser (Analytic, Jena, Germany) for total organic carbon determination; and (iii) Scanning Electron Microscopy (SEM) using a Microscope TM 3030PLUS (Hitachi, Japan) with energy disperse X-ray spectrometry (EDX) system Quantax70 (Bruker, Billerica, MA, USA) to determine the morphology and the elemental composition.
The chemical composition of each particle was highlighted by constructing a false color image based on SEM/EDX data following the procedure described below. In the generation of the merged image, Fiji software [41] was used to produce a mask from the SEM image to outline the particles shape and to remove the filter texture. The EDX image for each chemical element was cropped with this mask. In the final step, a color was assigned to each chemical element and the images were superimposed. A decision concerning the color used was made by using the normalized weight of each elemental component and the each pixels value to create a composite images (Figure 3).
The microphysical and optical parameters of mineral dust particles were analyzed after re-suspension using the set-up shown on Figure 2. Not all instruments were used at the same time as the required flow would have been too high. Therefore, different configurations were used (Figure 2 while continuously monitoring the size distribution (tacking into account that we analyzed the same sample). The size distribution of the particles re-suspended from snow aqueous solution was determined using an optical particle counter (i.e., GRIMM EDM 180) that measure in the 0.25–32 μ m range on 31 channels with a time resolution of 1 min.
A nephelometer (3563 TSI, manufactured by TSI, Shoreview, MN, USA) was continuously operated with a temporal resolution of 5 min at 5l min 1 for 30 min (Figure 2). The instrument was calibrated before the measurements using dry air and CO 2 . The Anderson and Ogren et al. [42] correction factors were applied for measured values to consider Lambertian and truncation errors of the instrument and to obtain the backscattering and scattering coefficients at three wavelengths (i.e., 450, 550, and 700 nm). Two parameters—Scattering Ångström exponent (SAE, Equation (A1) in Appendix A) and asymmetry parameter (g, Equation (A2) in Appendix A)—were calculated based on scattering and backscattering coefficients.
The aerosol absorption was determined at seven wavelengths (i.e., 370, 470, 520, 590, 660, 880, and 950 nm) using Aethalometer (AE33, Magee Scientific Inc., Berkeley, CA, USA). The principle of this instrument is based on light attenuation measurements. The attenuation (ATN, Equation (A3) in Appendix A) is further converted into absorption coefficient for each wavelength [43,44]. Further correction of the data was not necessary since the instrument internally uses the algorithm described in [43] to compensate for the loading effect [44]. The absorption Ångström exponent (AAE, Equation (A4) in Appendix A) was calculated for all wavelengths.
The single scattering albedo (SSA, Equation (A5) in Appendix A) represents an important parameter that provides information about the aerosol cooling or warming effect into the atmosphere. SSA was used to assess the dominant properties of the transported dust particles. To compute this parameter, the absorption coefficient was interpolated to find similar wavelength as those from nephelometer.
Finally, to identify the non-refractory signature of the dust transported aerosol, QACSM (Quadrupole Aerosol Chemical Speciation Monitor) was used to conduct measurements on submicron aerosol concentrations and determine the principal chemical species (i.e., organic, sulphate, nitrate, ammonium and chloride). The instrument, described in details by [45], is based on the vaporisation of particles under vacuum at approximately 600 C, ionization, and then analyzed using a quadrupole mass spectrometer [46,47]. The ACSM data treatment have been done using the standard operational procedure developed by ACTRIS [48].

3. Results

3.1. Synoptic Context

Generally, the long range dust transport from Sahara towards Europe is associated with the cyclogenetic processes over North Africa. These processes are triggered by an upper level trough enhancing the thermal contrasts between polar air mass advections and the warmer sea surfaces. Occasionally, the cold spells expand southward over North Africa and regions such as southern Atlas Mountains (northwestern Africa) and eastern Hoggar Mountains (central Sahara) became cyclogenetic areas (e.g., [49,50]). Alpert and Zivcite [51] noted that cyclones can also form or intensify over Libya. These cyclones, termed Sharav or Khamsin cyclones, are considered to be the main cause for dust transport towards the eastern Mediterranean. Around these low pressure systems, both the horizontal winds and vertical motions are very strong and the joint effect of these two flows causes uplifting of the dust and its long range transportation along their associated fronts [52]. Fiedler et al. [53] studied the influence of low pressure systems from North Africa on mineral dust emission and showed that the largest dust emission occurs during the springtime which coincide with the presence of cyclones over wide areas in Libya.
On 21 March 2018 at 1200 UTC a low pressure system was triggered over Libya (Figure 4a). During the incipient cyclogenetic processes a significant amount of dust particles were uplifted, as it is emphasized in the MSG dust product (Figure 4b). In its path, the cyclone reached eastern Mediterranean and the Balkans affecting Greece, Bulgaria, southern Romania, Turkey, the Black Sea surroundings, and southern Russia (Figure 4c,e,g,i). Although visible in satellite imagery within the first 24 h (Figure 4b,d), the dust plume was embedded within the front of the low pressure system, during its transition over the Balkans and the Black Sea (Figure 4f,h,j).
As the cloud cover in satellite imagery limits the observations with respect to dust presence, complementary sources were used in order to follow the evolution of the dust event. For the synoptic and regional analysis, CAMS analyses and forecasts were used in conjunction with the data from the RPG-HATPRO microwave radiometer (Figure 5). As the cyclone slowly moved eastward over the Balkans, the warm front stretched over southern Romanian (Figure 5a–c). According to the observations, the snowfalls associated with the front were recorded between 1400 UTC on 22 March and 1500 UTC on 23 March. The CAMS analysis emphasizes the dust advection between 2100 UTC on 22 March and 0300 UTC on 23 March over Bucharest (i.e., dust aerosol optical depth between 0.1 and 0.2) with a maximum dust advection over southeastern Romania (i.e., dust aerosol optical depth between 1.0 and 1.5) (Figure 5d–e). Over Bucharest, the vertical profile of dust mixing ratio retrieved from CAMS, shows that the dust was mainly present in the layer between 700 and 500 hPa with a maximum in dust mixing ration around 600 hPa (Figure 5g–i).

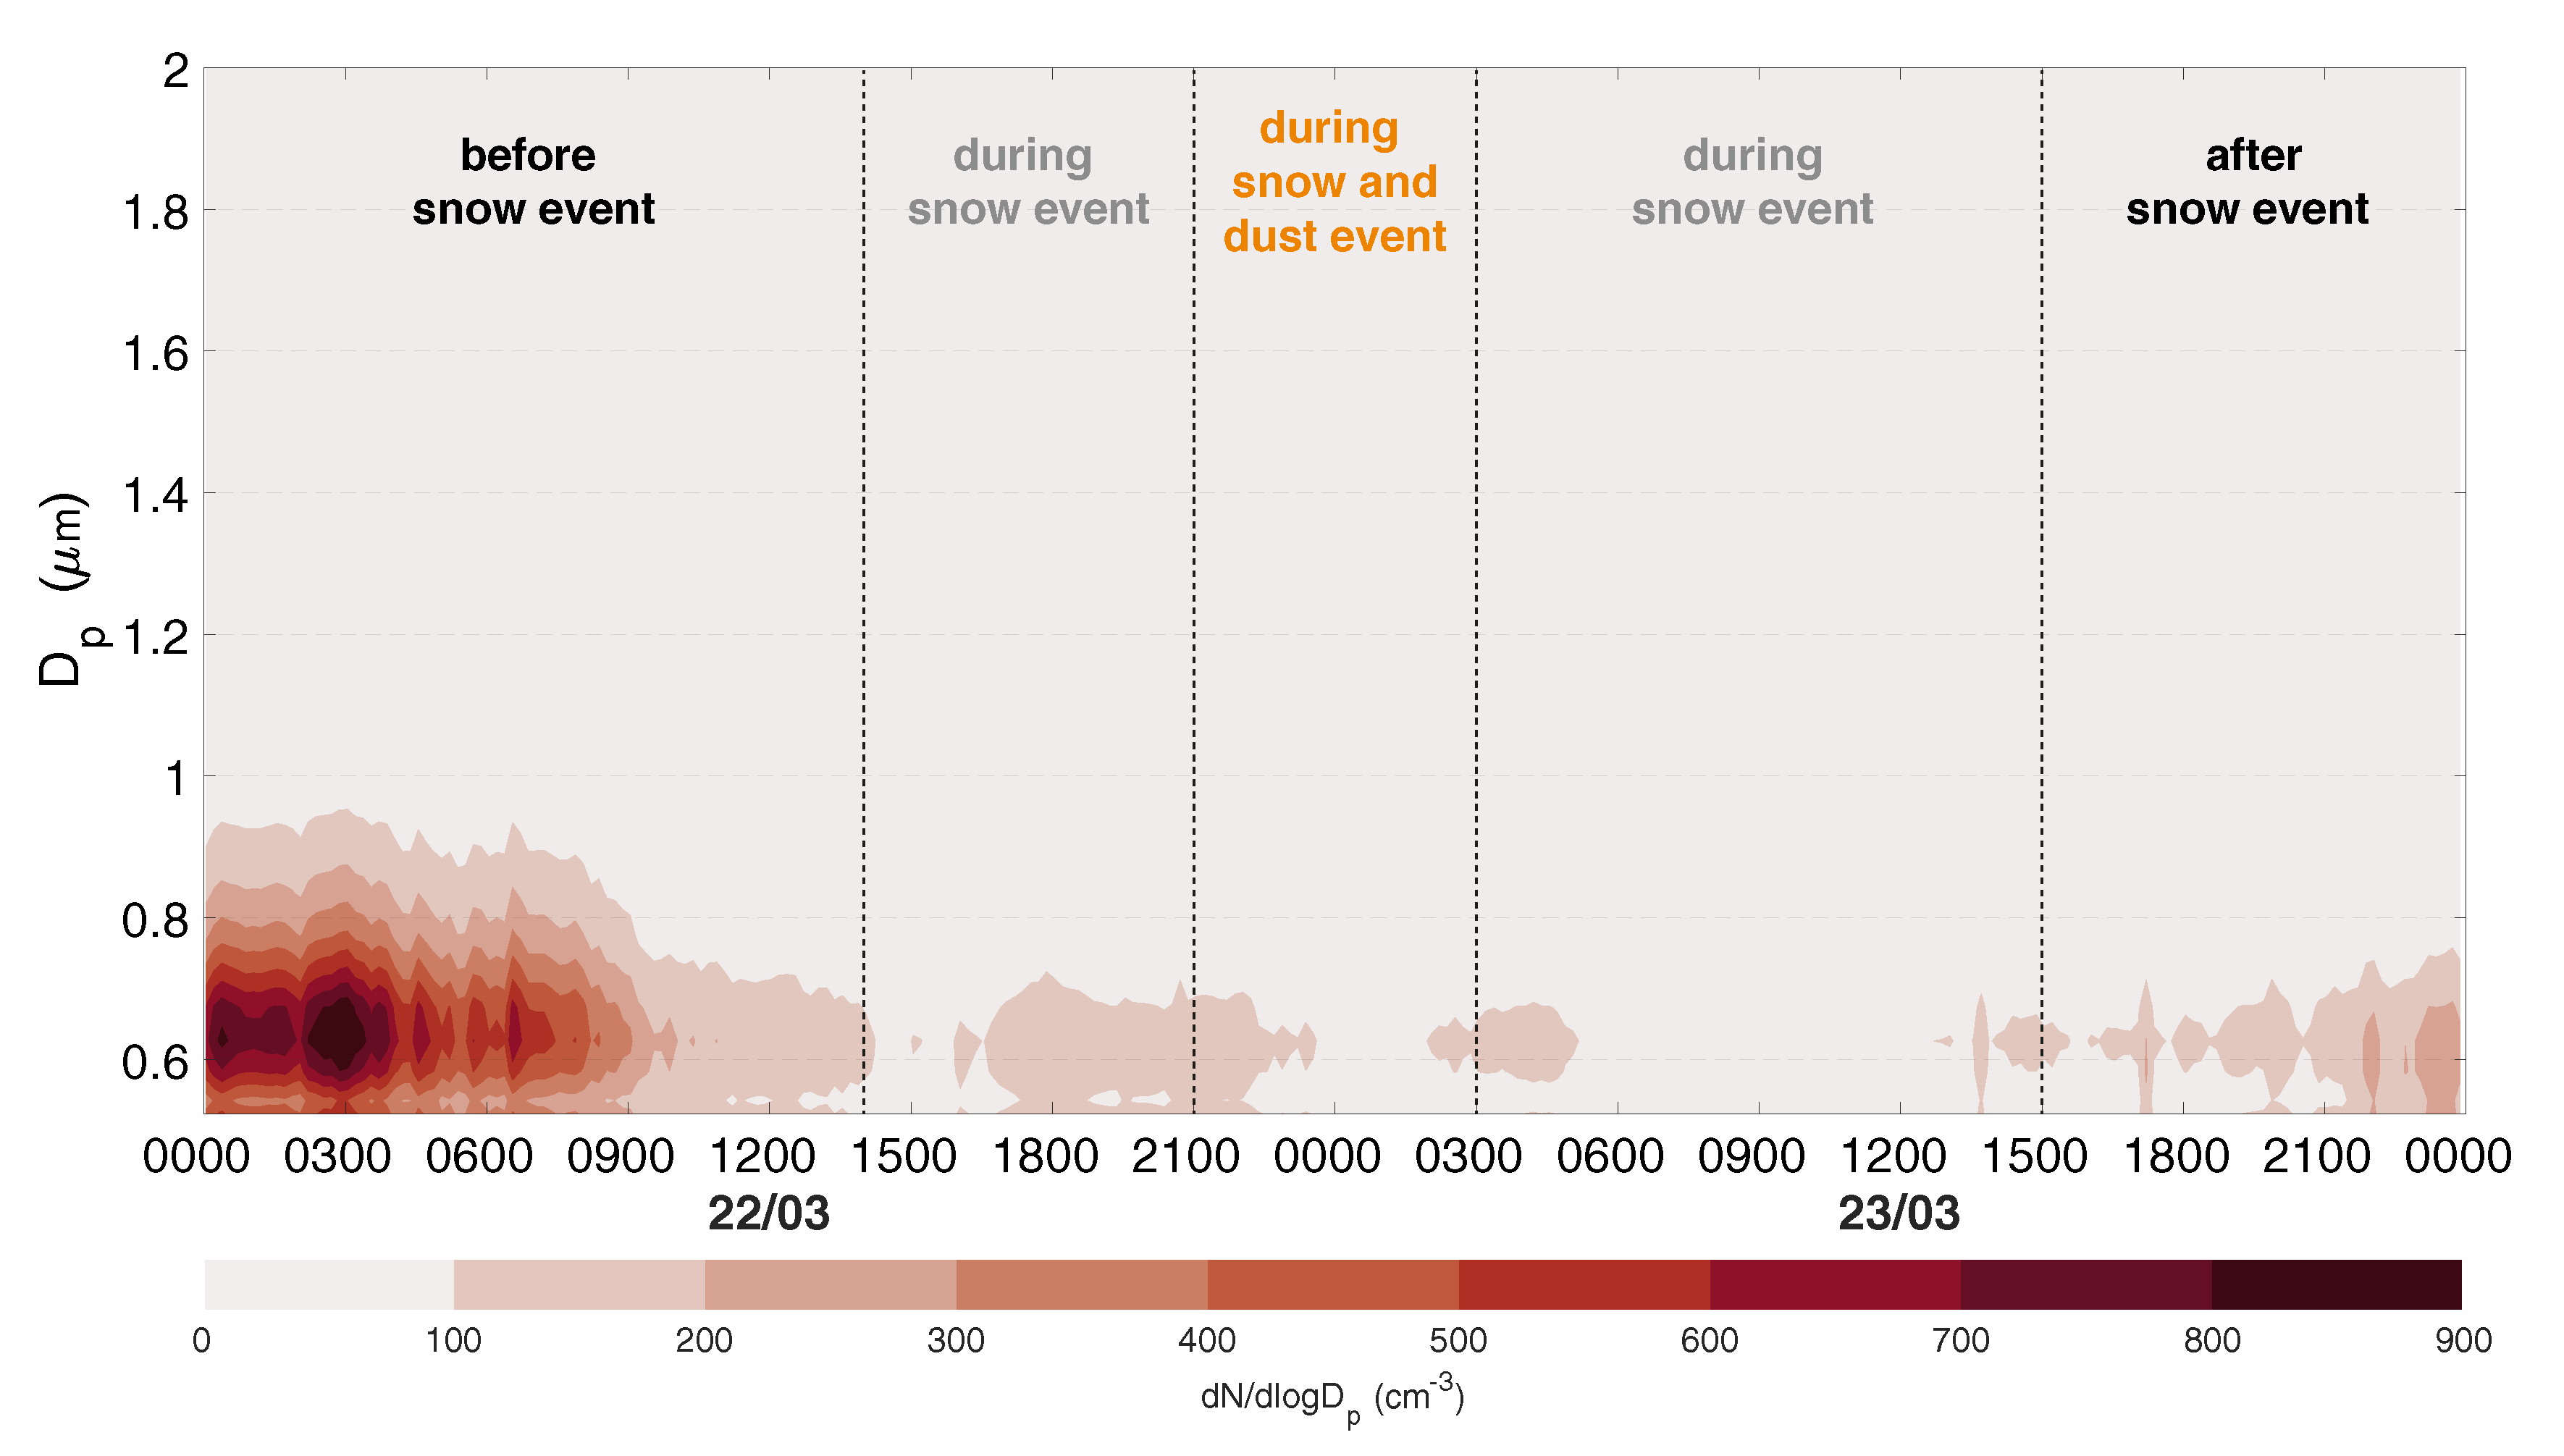
3.2. Local Conditions before Dust Snow Event

To accurately describe the dust event from 22–23 March 2018, the possible local influences (i.e., traffic, residential heating) were also analyzed for the previous hours of the event. The snowfall that occurred during the dust event influenced the PM concentration from GRIMM-EDM180 loading through wet scavenging. Thus, the PM 10 concentration measured at ground level decreased from an average of 26.13 μ g m 3 during the snow event but before the dust intrusion to an average of 18.04 μ g m 3 during the combined snow and dust event (Figure 6). During the same time interval, the aerosol size distribution highlights the presence of sub-micron particles as the dominant fraction centered on 600–700 nm (Figure 7). Before the snow (i.e., 21 March 1400 UTC–22 March 1400 UTC) the PM 10 concentrations was 49.2 μ g m 3 almost double than the recorded concentration during the snow event. During the event, the dust upper atmospheric layer arrived over Romania, was deposited at soil level together with snow.
All the filters collected with LVS3 were analyzed by SEM to highlight the morphology of the particles present in the atmosphere at ground level before and during the snow event. Most of the particles collected on the filters exhibited a round amorphous morphology (Figure 8). The elemental composition of the particles is dominated by Al, Mg, Fe, Ca, and carbonic particles. The particles identified are specific for local combustion sources or traffic and can also be used as road dust markers for events without snow [54]. Silica containing particles, characteristic to dust, were not identified on the quartz filters. It should be noted however that the background Si signal of the filter is masking the EDX signal of the particles, making the discrimination between the two very difficult.
The particles collected at the ground level, on filters, were analyzed for metals through ICP-OES methods. Very small quantities of chemical elements were found above the detection limits of the instruments (i.e., Na 2.20 μ g m 3 , K 0.6 μ g m 3 ).

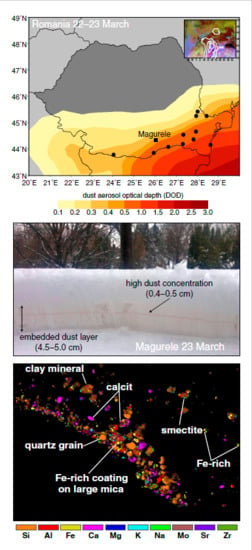
3.3. Saharan Dust Signature in Snow Layer

The SEM analysis indicates a size distribution with a peak around 1 μ m (Figure 9), in accordance with Mahowald et al. [55], but larger particles up to 40 μ m can be found as well. Even if it is unusual to find particles so large at a distance over 2000 km [56], recent studies [57] demonstrate that under special circumstances like high turbulent conditions or electrical forces that compensate the particles weight, giant particles can be transported at more than 3000 km. In our case we assume that particles larger than 20 μ m are mainly new conglomerates particles, but we do not exclude the possibility that these larger particles to be directly transported from the Saharan desert. The size distribution from Figure 9 is based on the particle counting after the mask was applied using the Fiji software, and assuming spherical particles.
Because the snow started few hours (i.e., 1400 UTC on 22 March) before the dust layer occurred over Romania (i.e., 2100 UTC on 22 March), a clear snow stratification with dust layers was observed. The highest dust concentration layer was of ≃0.5 cm (Figure 1b). The layers dust deposition was favored by the snowfall intensity. The snowfall increased from light continuous starting with 1800 UTC on 22 March 2018 to moderate continuous snowfall at 0000 UTC on 23 March 2018 followed by a drop down to light continuous snowfall at 0100 UTC, that can explain the dust deposition in a concentrated layer. The snow contaminated with dust, was analyzed to identify the chemical and physical characteristics of the particles transported.

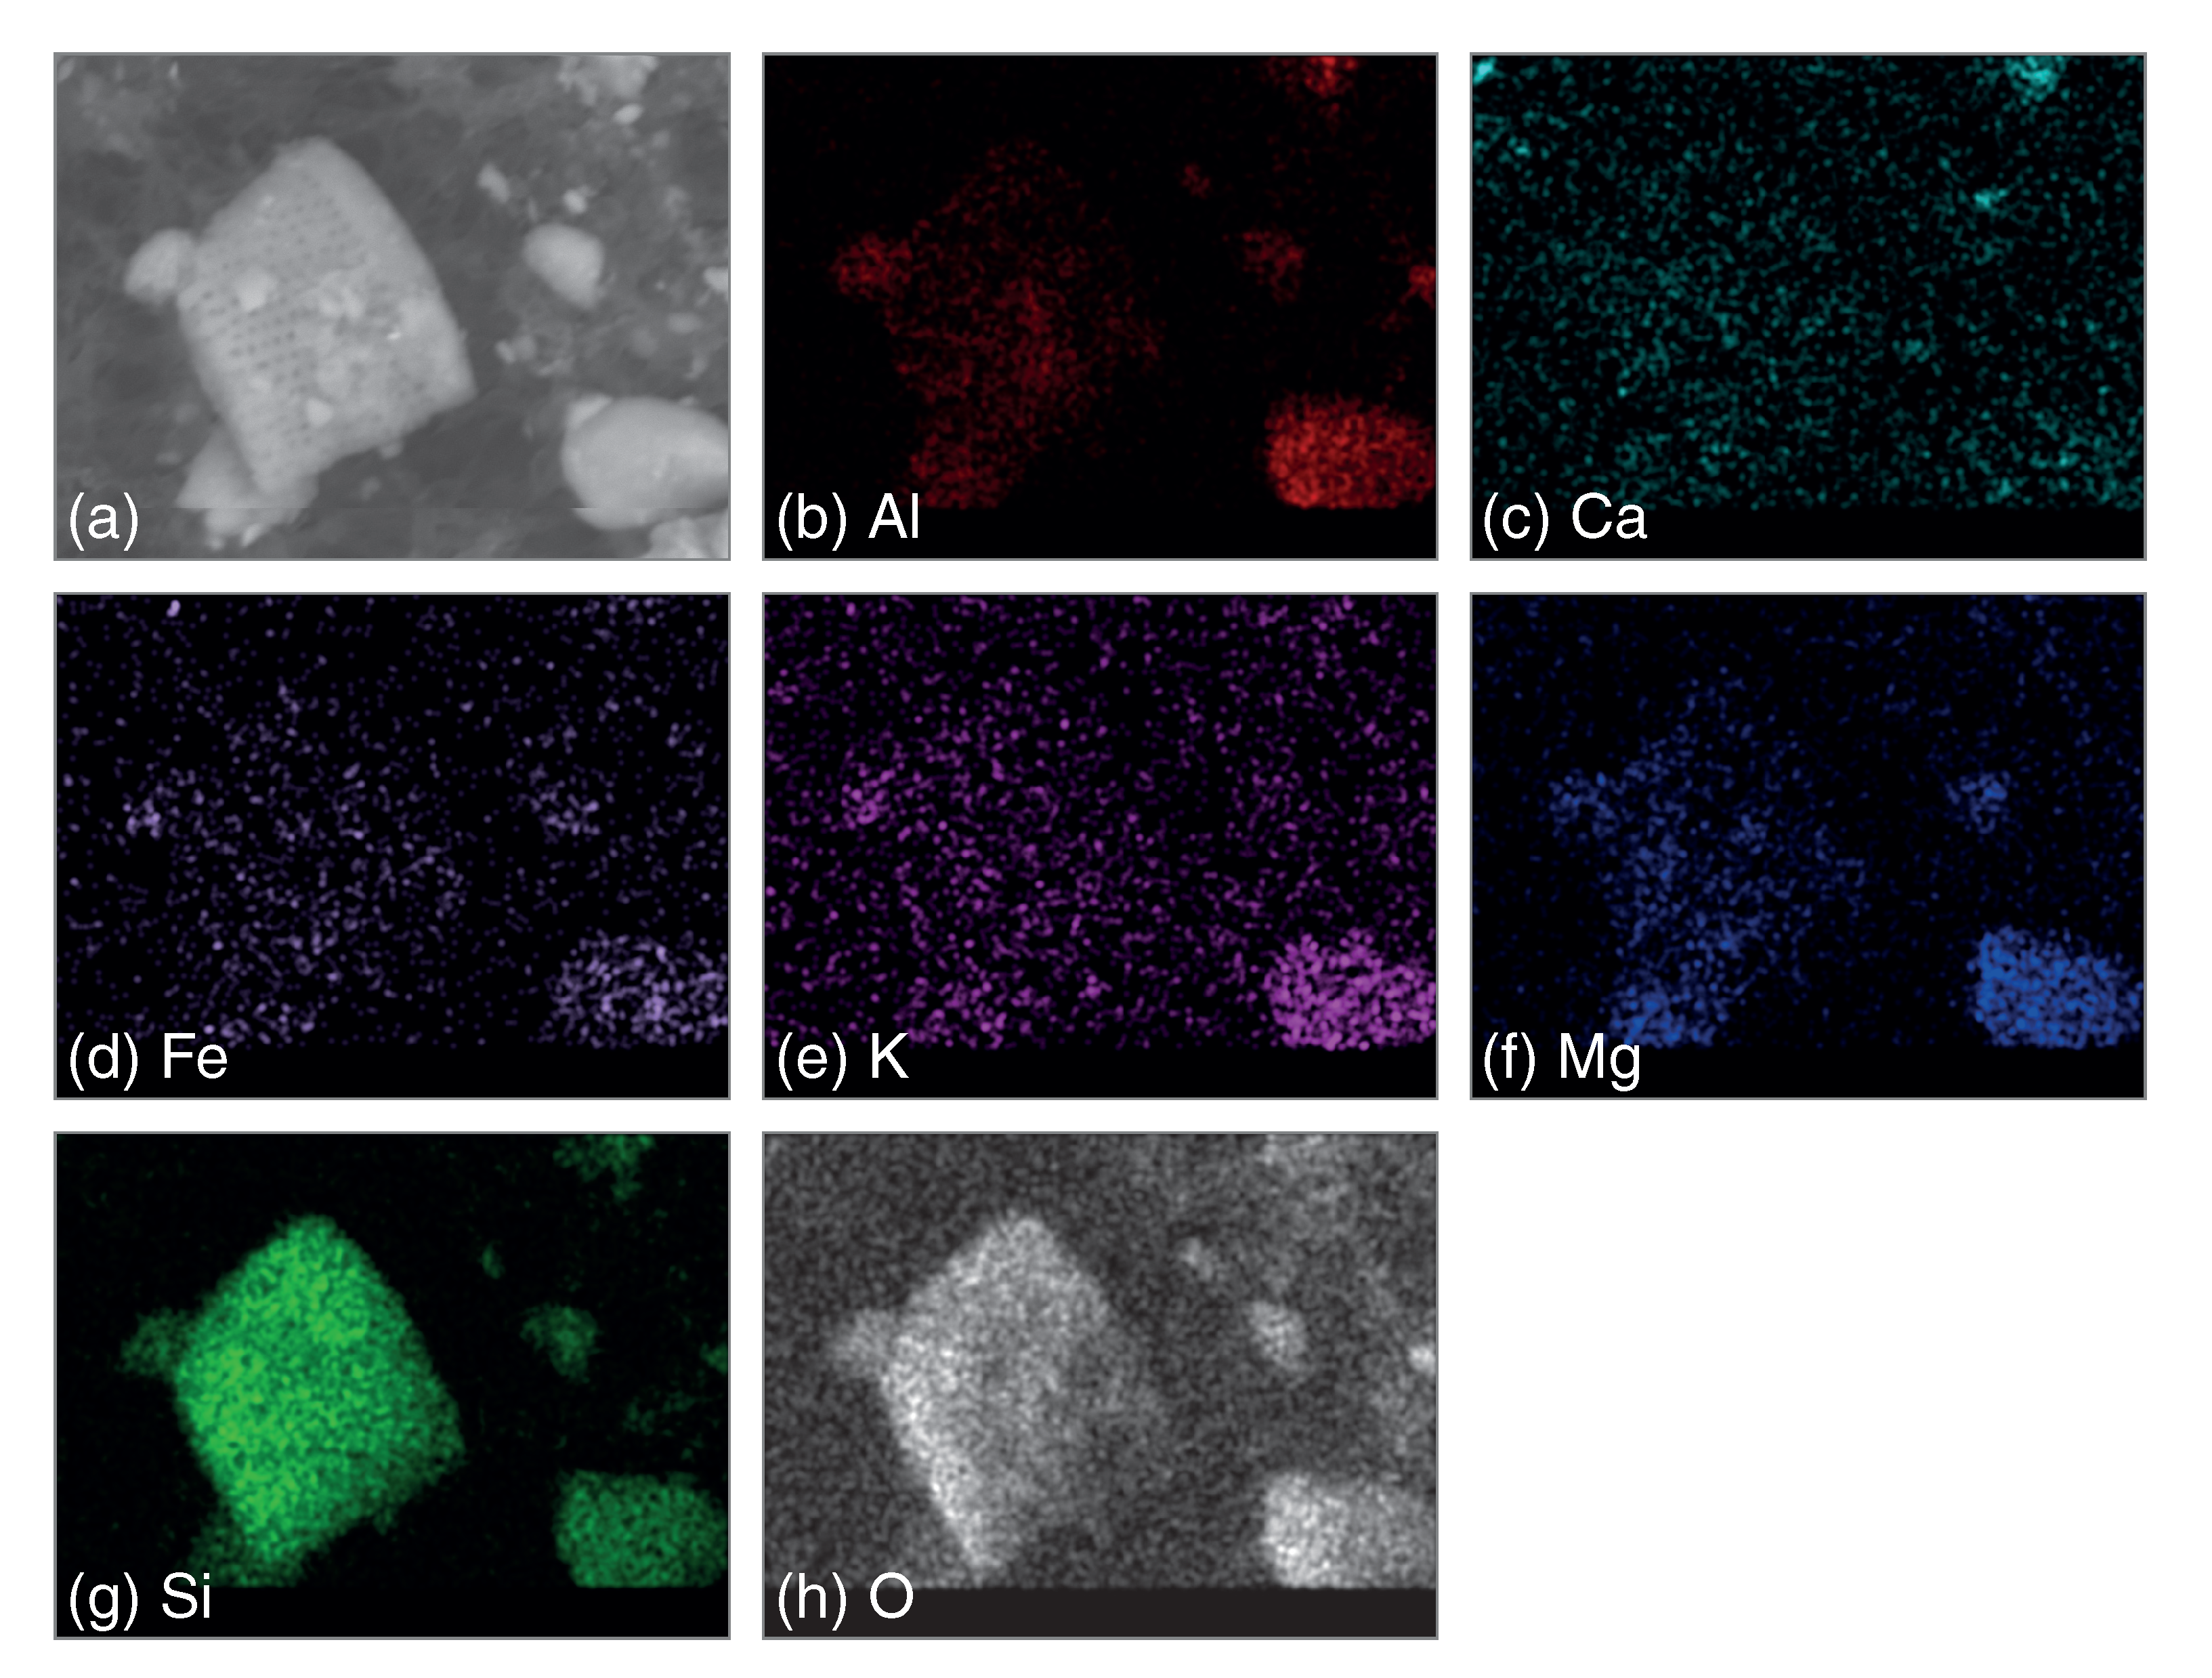
3.3.1. Particle Morphology and Chemical Composition

The collected sample was used to determine the chemical composition and the morphology of the particles from the snow layers contaminated with Saharan dust. In general, Saharan dust is dominated by silicates (e.g., clay minerals, feldspars, quartz) and, depending on its origin, carbonates (e.g., calcium carbonate). Previous studies [8] have used a series of markers (e.g., elemental ratio, diatoms) to identify the dust source. In this article, elemental mapping coupled with SEM/EDX imaging was used to show the distribution of the components on the collected samples. SEM measurements were used to evaluate the average composition of the filtered dust from snow sample and to compare it with chemical analysis determined through the ICP-OES method.
The chemical composition of the sample, determined through the ICP-OES method, was: Al 17.7 (±6%), Fe 15.9 (±6%), Ca 13.5 (±5%), K 4.1 (±5%), Mg 7.4 (±5%), and Na 2.3 (±8%) mg L 1 . Using the ICP-OES method, Si and Ti cannot determined as shown by [58]. Thus, the ratio in which these two elements were involved was calculated from SEM/EDX. Elemental ratio (i.e., Si/Al, (Ca+Mg)/Fe, Fe/Al, K/Al, Ca/Al, Na/Al, Ti/Al) were used, following Scheuvens et al. [59], to characterize the particles origin (Table 1). The Al and Si are found in sample as aluminum-silicates (e.g., quartz and mica groups) which can indicate a north African origin [60].
In Table 1 the ratios obtained through elemental analysis (i.e., ICP-OES) are presented together with those obtained through SEM/EDX method. There are differences between the two methods, as SEM/EDX is a semi-quantitative method and is not very sensitive to sub-micron particles and to the deeper layers of the mineral dust. Particles analyzed by SEM/EDX are those deposited after the melting of approximately 4 g of snow contaminated with Saharan dust directly on the filter, thus soluble fractions in the liquid sample are not quantified through this method.
The Saharan dust source can be characterized by the (Ca+Mg)/Fe ratio. This ratio is sensitive to the geographical origin [59]. For the analyzed sample, the (Ca+Mg)/Fe ratio was 1.39 which indicates a source located in Algeria, Libya, or Egypt, lower values (i.e., ratio of 1.2) being reported for the Sub-Saharan belt [59] (Table 1). Lafont et al. [62] used Ca as an indicator for the dust main source, with high quantities of Ca indicating a North African origin. The Ca/Al ratio, 0.76 in our sample, has been also used to classify the sources of Saharan dust [62]. A ratio lower than 0.5 being attributed to the southern part of the Saharan Desert while higher value indicated northern origin. Desboeufs and Cautenet [63] showed that Ca content in mineral dust has a regional variation, the calcite (CaCO 3 ) amount increasing from the southern to northern Saharan desert by more than 10%. The calcite in our sample was highlighted on the quartz filter, carbon being internal mixed with calcium.
The SEM/EDX value for Ca/Al ratio (i.e., 0.53) is lower than the one obtained from ICP-OES (i.e., 0.76). The difference in Ca/Al ratio between SEM/EDX and ICP-OES can be explained by Ca solubility. Thus, the ICP-OES method can used to emphasize the presence of soluble Ca. In the melted and then filtered sample, the Ca concentration was 11.4 mg L 1 , and in the total dried sample the concentration was 13.5 mg L 1 which can explain the underestimation of Ca concentration obtained using the SEM/EDX method. The same issue related to solubility was observed in the case of Fe in combination with other organic compounds [64]. The Ca concentration is almost double compared with the Mg concentration (i.e., 7.4 mg L 1 ) which indicate the presence of dolomite (CaMg(CO 3 ) 2 ) in association with calcite (CaCO 3 ), these minerals being specific for north African desert [59]. Another marker for north Africa is the Mg/Al ratio. For our sample, this ratio was 0.41 which is lower than the 75th percentile (i.e., 0.43) reported in literature for Libya [65].
The dust event from 22–23 March was observed over Romania during a period characterized by low surface temperatures. Thus, local contamination from biomass burning (i.e., residential heating) of the snow sample was expected. The contamination can be highlighted by the K/Al ratio [66]. The ratio obtained from our sample was 0.23 (Table 1) similar with values obtained for mineral dust by Formenti et al. [66] for uncontaminated dust aerosols (i.e., 0.2).
The SEM/EDX analysis also indicated that the dust particles collected from the melted snow sample are dominated by crystal morphologies (i.e., rhombohedral and scalenohedral) (Figure 3), angular and spherical Fe particles (i.e., hematite–Fe 2 O 3 , goethite–FeO-OH) single or in combination with clay minerals. Ti particles were found in combination with other minerals (i.e., TiO 2 ) as part of conglomerates structures (Figure 10).
Figure 3 shows the association between elements and the presence of different minerals like: quartz, calcite or other clay minerals. Few amorphous particles, classified as fossil diatoms (i.e., species Aulacoseira, Figure 11) were found in our sample. The diatoms have been previously documented as characteristic to Bodélé Depression (Sub-Saharan belt, [11]). The presence of diatoms in our snow sample shows a contamination of the dust with particles from the Sub-Saharan belt area during our event or during previous dust storms and then transported during the event described in this article.

3.3.2. The Optical Parameters of Re-Suspended Transported Dust Particles

The optical properties of dust have been previously studied especially in the proximity of sources [17], but the transport processes, can influence in a significant way the absorption or scattering properties of the dust particles. Through direct measurement using SEM/EDX the dust physical diameter on filters was determined. The values vary from 0.5 μ m (instrument detection limit) to larger than 40 μ m, which is unusual for Romania, considering the distance from the source that is more than 2000 km. The size distribution show a maximum centred on 1 μ m, that represent also the highest contributing fraction (Figure 9). The re-suspended size distribution of the mineral dust was measured with GRIMM EDM180 showing a distribution centred on 300 nm with PM 1 , PM 2.5 , and PM 10 on average of 22.65 μ g m 3 , 25.43 μ g m 3 , and respectively 27.37 μ g m 3 . Thus, the optical parameters are evaluated for mainly fine re-suspended dust fraction from direct measurements.
The Scattering Ångström exponent (SAE), derived from direct measurements, at 450/700 wavelengths, of dust particle re-suspended as aerosols, is 0.93 which is characteristic for transported dust [67]. Values for SAE of 0.5 are characteristic for dust near the sources [15] and values around 1.3 are characteristic for urban sites [17]. For sample analyzed in this article, there was very likely a contamination of the dust with marine and anthropogenic aerosols during the transport over the Mediterranean Sea and southern Europe. This contamination can then influence the optical properties of the sample. The SAE values recorded in Romania are similar with those reported for the Iberian Peninsula [17]. Previous studies showed that during the dust intrusion episodes the SAE is decreasing, while the absorption Ångström exponent (AAE) is increasing [17]. This was also observed in the case of the dust episode over Romania, as the AAE was 1.95 for 450/700 nm, obtained through interpolation.
The single scattering albedo (SSA) was computed for each scattering wavelengths of nephelometer using a fitting curve for absorption coefficient at the same wavelengths obtained from aethalometer. Depending of the wavelength, SSA varied from 0.84 at 450 nm to 0.89 at 700 nm. The SSA values previously reported [12] were anti-correlated with the Fe content, small values for SSA (i.e., 0.86 at 405 nm) being characteristic for dust with a high Fe content (i.e., 30%). In our sample, SSA was 0.84–0.89 corresponding the Fe content of 15.9 mg L 1 .
The asymmetry parameter (g) is in radiative transfers models and thus it is important to measured for Saharan dust intrusion events. For the sample analyzed in this study, g measured at 550 nm [68] had a value of 0.604 which is also similar with values reported previously for sites in Iberian Peninsula [17]. Other in-situ measurements for Saharan dust events showed that g can take values between 0.5 and 0.75 [18]. Values of 0.81 ± 0.008 to 0.92 ± 0.004 for SSA and 0.61–0.69 for g, were reported in Italy during a North Africa Saharan dust event [69].

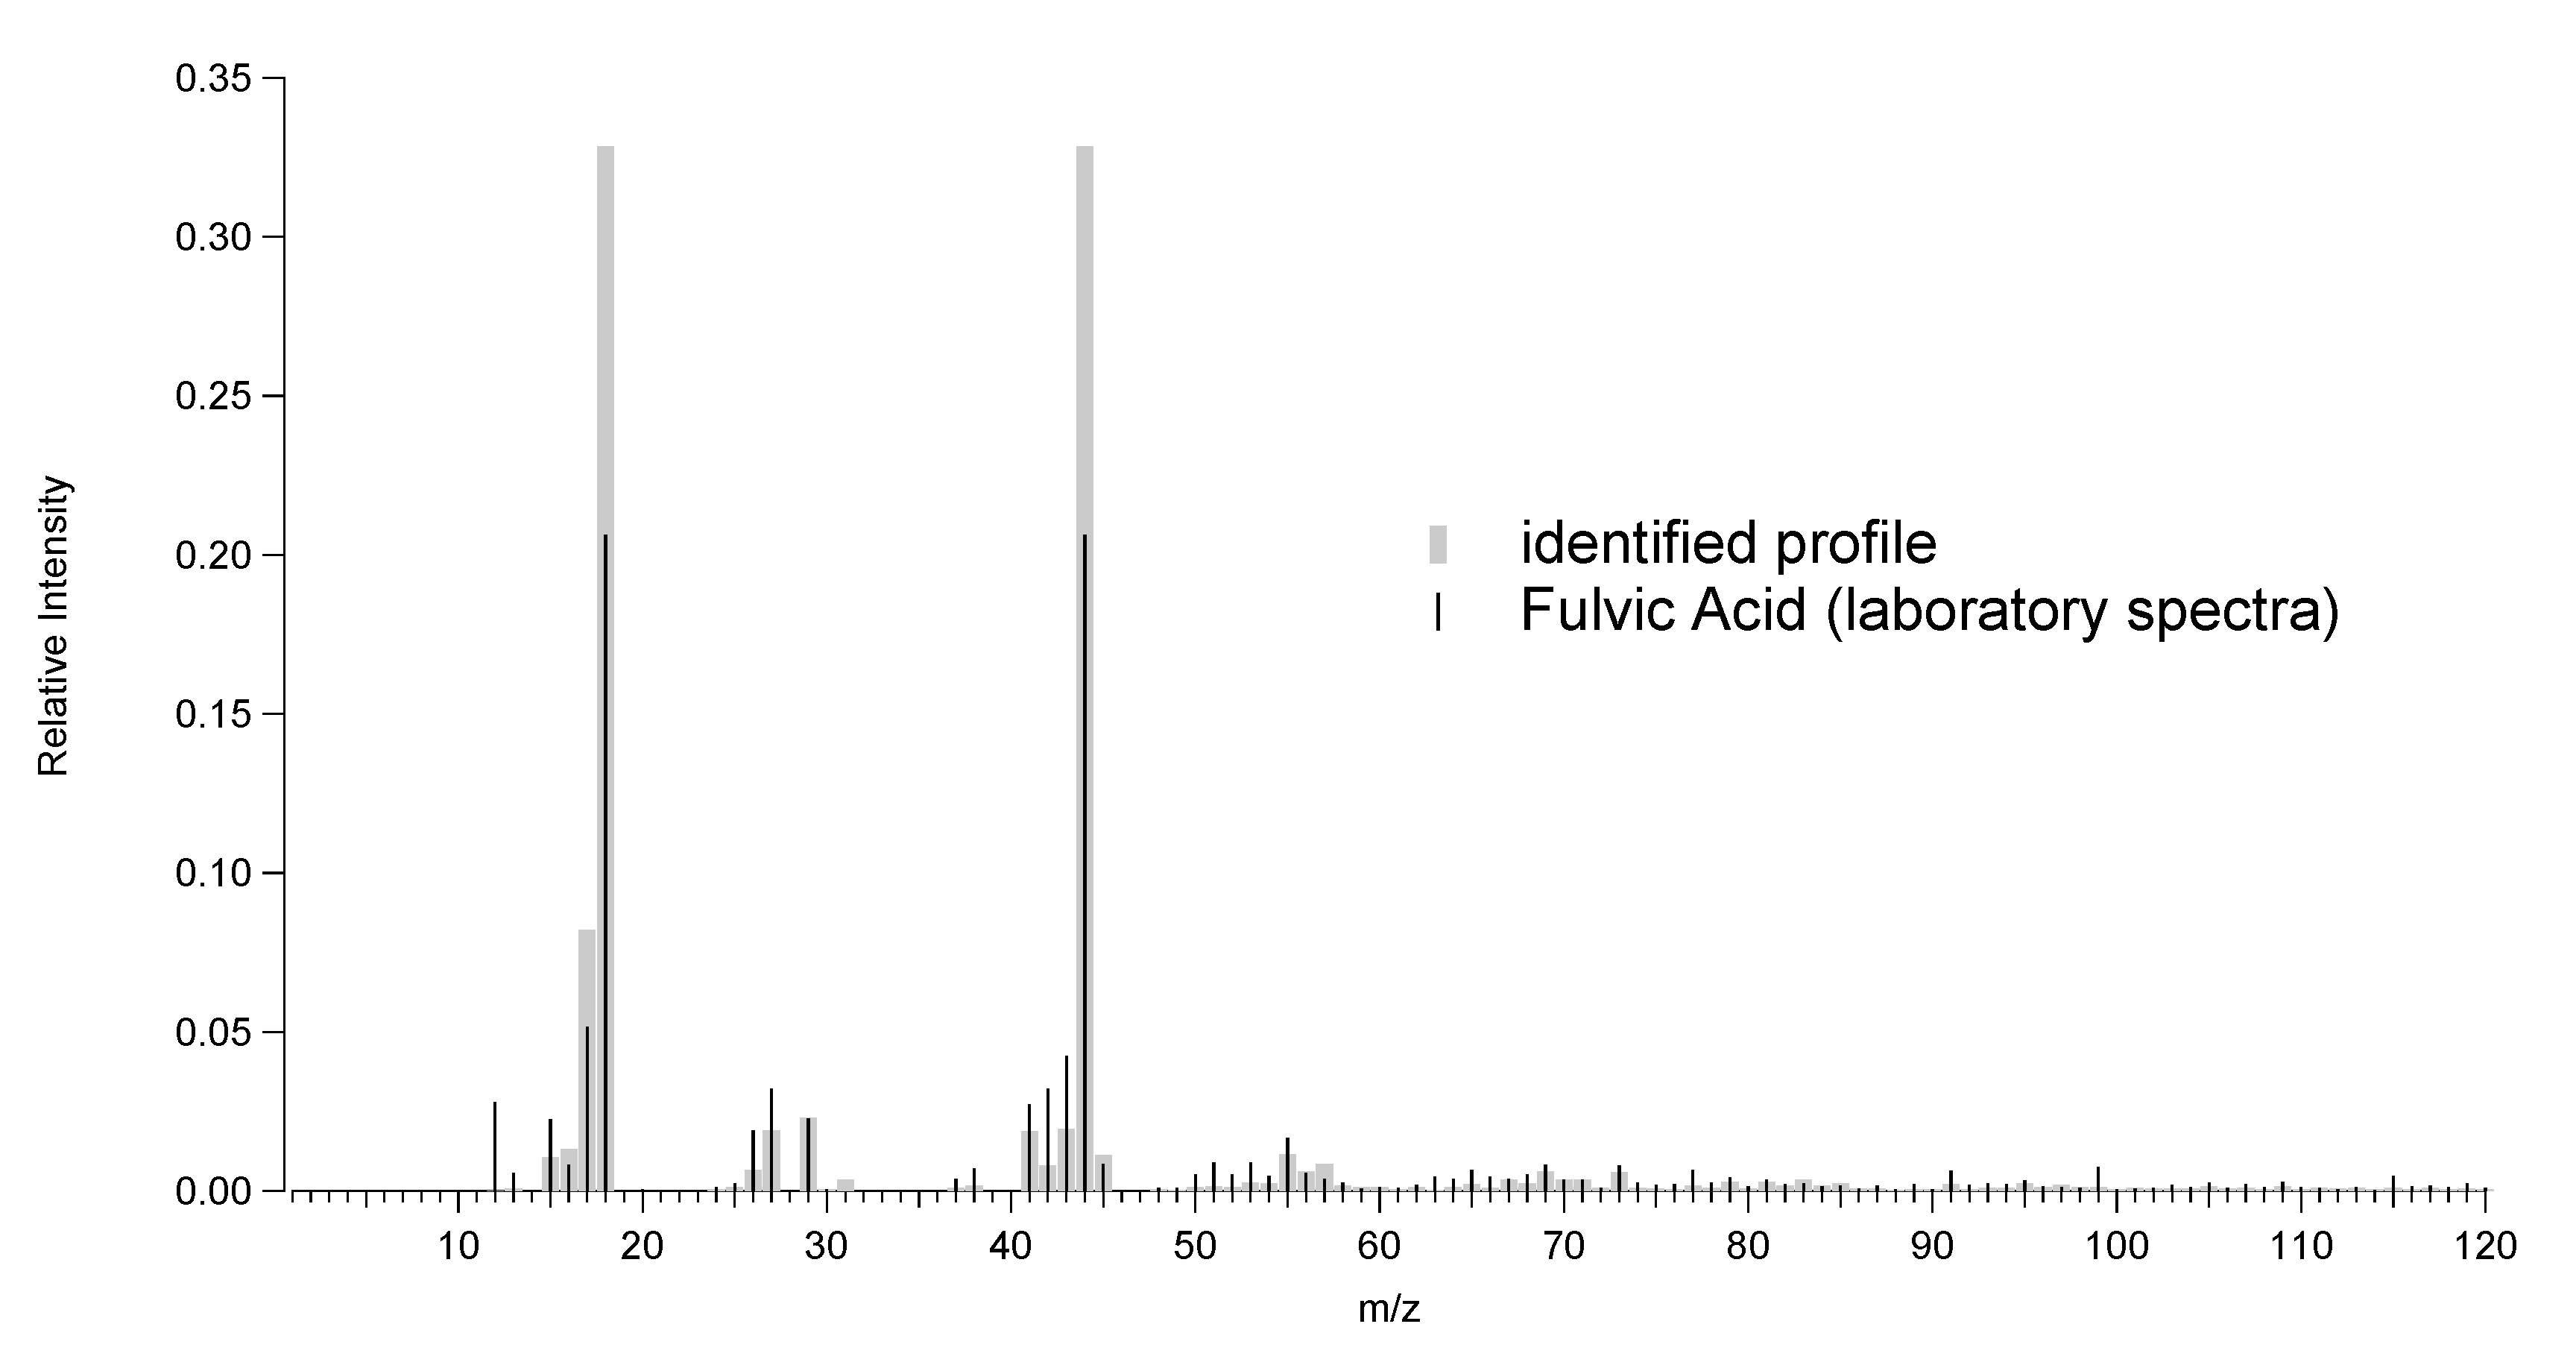
3.3.3. Nonrefractory Mass Fraction Signature of Transported Dust Particles

The chemical composition of the re-suspended sub-micronic aerosols was analyzed to determine the non-refractory fraction. The results shows that the particles are dominated by organic compounds collected during long-distance transport. The organic and inorganic mass fractions of transported dust particles represent components with a significant time residence into the atmosphere and thus can influence the cloud condensation nuclei activity [70].
Total organic carbon was 7.2 mg L 1 in the melted filtered snow sample. After the re-suspension of the particles without previous filtration, the organic component as well as the inorganic fraction was analyzed using QACSM. The values obtained for sub-micronic non-refractory particles confirmed that the main component is represented by organics in proportion of 89.23% with a high degree of oxidation. The inorganic fraction is dominated by nitrate (mean value of 1.54 μ g m 3 ) and sulphate (mean value of 0.83 μ g m 3 ) with a percent of 6.33% respectively 3.45% while ammonium and chloride represent a negligible fraction of 0.91% (mean value of 0.22 μ g m 3 ) respectively 0.05% (mean value 0.01 μ g m 3 ) in the range of the detection limit of the instrument. The detection limit was computed for 30 min to be 0.23 μ g m 3 for ammonium and 0.04 μ g m 3 for chloride.
The analysis of the mass spectrum and specific markers for the degree of oxidized organics was performed. Figure 12 shows the mass spectrum (i.e., relative intensity as a function of m/z—the mass to charge ratio). From the spectrum, the f44 (f43) was calculated as the ratio between the specific concentration of m/z 44 (43) to the total organic concentration. The results shows an oxidized content, due to the dominance of f44 (average value of 0.30) over f43 that is almost negligible (average value of 0.05). The m/z spectrum for the organic fraction shows peaks of m/z 18 (that is proportional with m/z 44 signal) and m/z 44 resulting from the decarboxylation reactions of di- and poly-acids [71]. Smaller peaks can be observed for m/z 55 and m/z 57 that are associated in general with hydrocarbon organic aerosol (HOA). Even so, m/z 55 is higher than m/z 57 being a tracer for oxygenated organics also due to C 3 H 3 O + presence (Figure 12). The overall spectra obtained is similar the laboratory spectra for fulvic acids (HULIS) [72]. Fulvic acid was found previously in rain samples [64]. A source of HULIS can be the Mediterranean Sea as shown by Williams et al. [73]. In our data, the chloride, which usually is used as marker for sea air masses is absent. The absence of chloride can be explained by depletion through heterogeneous reactions that appear during long-range transport.
HNO 3 ( g ) + NaCl ( s ) NaNO 3 ( s ) + HCl ( g )
H 2 SO 4 ( g ) + 2 NaCl ( s ) Na 2 SO 4 ( s ) + 2 HCl ( g )
The specific markers for local biomass burning organic aerosol of f60 or f73 are very low (Figure 12), that is in accordance with chemical analyses made for our sample, where K/Al ratio indicate no contamination from biomass burning.

4. Conclusions

In this study, a Saharan dust intrusion event that occurred on 22–23 March 2018 over Romania is analyzed. This event had a great impact over southern Europe, where a record-breaking dust episode was observed (i.e., the concentration of dust at the surface over Crete, Greece, exceeded 6 mg m 3 ). The event also impacted Romania and especially the southern part of the country where the dust was observed at the ground together with snow. The event was widely covered on social media and news agencies due to the orange color of the snow associated with the Saharan dust. This is one of the few events recorded in Europe of dust deposition with snow at low altitudes, previous studies focused only on such events at high altitude. Furthermore, to the authors’ knowledge, this is the first time when Saharan dust intrusion accompanied by snow occurred over Romania. The event was observed over Bucharest and the surrounding areas where the RADO/ACTRIS site is located which allowed the collection of detailed measurements. The complementary measurements made at RADO were focused on the description of atmospheric initial conditions, physical parameters and the chemical composition of dust particles deposited at ground level.
The main conclusions are as follows:
  • The chemical analyses and the ratios computed from elemental concentrations (confirmed by the synoptic scale circulations) allowed the identification of the dust origin as the north Sahara; for example, the ratio between (Ca+Mg)/Fe was 1.39 for the sample analyzed in this article, values greater that 1.20 being characteristics for Algeria, Libya or Egypt as shown in previous studies. Other ratios between elemental concentrations (e.g., Ca/Al, Mg/Al) supported this conclusion,
  • The presence of biological markers (i.e., diatoms), characteristics for Bodélé Depression, indicate the possible contamination of the dust from our sample with particles from the Sub-Saharan belt area during our event or during previous dust storms,
  • A new approach was developed to highlight different mineral associations. In this approach, images for each elemental compound are merged; the presence of clay minerals, quartz or calcite were evidenced through this analyses,
  • Optical parameters were measured for re-suspended Saharan dust fine fraction; the obtained values are similar with that obtain in the Iberian Peninsula regularly affected by dust intrusions,
  • The pattern of organic spectra obtained, indicates the possible contamination of the dust with marine aerosols due to presence of highly oxidized organics as HULIS-like compounds.
This study, which focused on a complex dust observational analyses, highlights North Africa as the mineral dust origin, the advection and deposition processes as well as the transport of dust plume for more than 2000 km. The origin was attributed using dust mineralogy, optical properties and chemical composition analyses.

Author Contributions

L.M. carried out the research design. L.M. and C.M. conceived, planned and carried out the in-situ experiments. S.A. conducted the meteorological analyses. D.E. performed the analysis of the remote sensing observations. M.B. developed and conducted the SEM/EDX image processing. C.V. provided the SEM/EDX images. O.C. and E.L. contributed to the chemical analysis of the snow sample. B.A. contributed to writing–review and editing of the manuscript. J.V. review the manuscript. All authors provided critical feedback and helped shape the research, analysis and manuscript.

Funding

The work presented in this article was performed in the frame of the projects PROINSTITUTIO, contract no.19 PFE/17.10.2018 financed by Romanian National Authority for Scientific Research and Innovation, by Romanian National Core Program Contract No.18N/2019 financed by Ministry of Research and Innovation and by the European Regional Development Fund through Competitiveness Operational Programme 2014–2020, POC-A.1-A.1.1.1- F- 2015, project Research Centre for environment and Earth Observation CEO-Terra, SMIS code 108109. The SEM-EDX experiments were carried out by using the equipment acquired by the infrastructure project INOVAOPTIMA SMIS code 49164, contract No. 658/2014 with the Romanian National Authority for Scientific Research and Innovation.

Acknowledgments

The work presented in this article was performed in the frame of the projects PROINSTITUTIO, contract no.19 PFE/17.10.2018 financed by Romanian National Authority for Scientific Research and Innovation, by Romanian National Core Program Contract No.18N/2019 financed by Ministry of Research and Innovation, by the European Regional Development Fund through Competitiveness Operational Programme 2014–2020, POC-A.1-A.1.1.1- F- 2015, project Research Centre for environment and Earth Observation CEO-Terra, SMIS code 108109, by COST Action “COLOSSAL” under grant agreement CA16109 and by COST Action “InDust” under grant agreement CA16202. The SEM-EDX experiments were carried out by using the equipmentacquired by the infrastructure project INOVAOPTIMA SMIS code 49164, contract No. 658/2014 with the Romanian National Authority for Scientific Research and Innovation. The photo showed in Figure 1b was provided by Flori Ţoancă from INOE2000.

Conflicts of Interest

The authors declare no conflict of interest.

Appendix A

The Scattering Ångström exponent (SAE) that evaluate the wavelength dependence of aerosol scattering coefficient is defined as
S A E = ln σ s λ 1 σ s λ 2 λ 1 λ 2
where σ s is the total scattering. Higher value of SAE (> 1) are related with smaller particles, being associated with anthropogenic aerosols, while lower values are associated with coarse mode particles like mineral dust.
The asymmetry parameter (g) was computed with the following formula following [68]
g = 7.143 σ b σ s 3 + 7.464 σ b σ s 2 3.963 σ b σ s + 0.9893
where σ s is total scattering coefficient and σ b is backscattering coefficient; λ 1 and λ 2 are the wavelength used.
The attenuation (ATN) is defined as
A T N = 100 ln I I 0 ,
where I 0 is the intensity of light that pass through a clean filter tape (unexposed to the aerosols), I represent the intensity of light that passes through the filter where the particles were deposited.
The absorption Ångström exponent (AAE) is defined as
A A E = ln σ a b s λ 1 σ a b s λ 2 λ 1 λ 2
where σ a b s λ 1 and σ a b s λ 2 are absorption coefficients at different wavelengths.
The single scattering albedo (SSA) is defined as
S S A λ = σ s c a t λ σ s c a t λ + σ a b s λ
where σ s c a t λ is the aerosol scattering coefficient (expressed in Mm 1 ), σ a b s λ the aerosol absorption coefficient (Mm 1 ) and λ the wavelength (nm).

References

  1. Querol, X.; Tobías, A.; Pérez, A.; Karanasioua, A.; Amato, F.; Stafoggia, M.; García-Pando, C.P.; Ginoux, P.; Forastiere, F.; Gumy, S.; et al. Monitoring the impact of desert dust outbreaks for air quality for health studies. Environ. Int. 2019, 130, 104867. [Google Scholar] [CrossRef] [PubMed]
  2. D’Almeida, G.A. A model for saharan dust transport. J. Appl. Meteorol. Climatol. 1986, 25, 903–916. [Google Scholar] [CrossRef]
  3. Prospero, J.M.; Blades, E.; Mathison, G.; Naidu, R. Interhemispheric transport of viable fungi and bacteria from Africa to the Caribbean with soil dust. Aerobiologia 2005, 21, 1–19. [Google Scholar] [CrossRef] [Green Version]
  4. Marinou, E.; Amiridis, V.; Binietoglou, I.; Tsikerdekis, A.; Solomos, S.; Proestakis, E.; Konsta, D.; Papagiannopoulos, N.; Tsekeri, A.; Vlastou, G.; et al. Three-dimensional evolution of Saharan dust transport towards Europe based on a 9-year EARLINET-optimized CALIPSO dataset. Atmos. Chem. Phys. 2017, 17, 5893–5919. [Google Scholar] [CrossRef] [Green Version]
  5. Goudie, A.S. Desert dust and human health disorders. Environ. Int. 2014, 63, 101–113. [Google Scholar] [CrossRef] [PubMed]
  6. Shao, Y.; Wyrwoll, K.H.; Chappell, A.; Huang, J.; Lin, Z.; McTainsh, G. Dust cycle: An emerging core theme in Earth system science. Aeolian Res. 2005, 2, 181–204. [Google Scholar] [CrossRef]
  7. IPCC. Climate Change 2013: The Physical Science Basis. Contribution of Working Group I to the Fifth Assessment Report of the Intergovernmental Panel on Climate Change; Cambridge University Press: Cambridge, UK, 2013; p. 1535. [Google Scholar] [CrossRef]
  8. Telloli, C.; Chicca, M.; Pepi, S.; Vaccaro, C. Saharan dust particles in snow samples of Alps and Apennines during an exceptional event of transboundary air pollution. Environ. Monit. Assess. 2018, 190, 37. [Google Scholar] [CrossRef]
  9. Di Mauro, B.; Garzonio, R.; Rossini, M.; Filippa, G.; Pogliotti, P.; Galvagno, M.; di Cella, U.M.; Migliavacca, M.; Baccolo1, G.; Clemenza, M.; et al. Saharan dust events in the European Alps: Role in snowmelt and geochemical characterization. Cryosphere 2019, 13, 1147–1165. [Google Scholar] [CrossRef]
  10. Zhang, X.; Zhao, L.; Tong, D.Q.; Wu, G.; Dan, M.; Teng, B. A systematic review of global desert dust and associated human health effects. Atmosphere 2016, 7, 158. [Google Scholar] [CrossRef]
  11. Meola, M.; Lazzaro, A.; Zeyer, J. Bacterial composition and survival on Sahara dust particles transported to the European Alps. Front Microbiol. 2015, 6, 1454. [Google Scholar] [CrossRef]
  12. Moosmüller, H.; Engelbrecht, J.P.; Skiba, M.; Frey, G.; Chakrabarty, R.K.; Arnott, W.P. Single scattering albedo of fine mineral dust aerosols controlled by iron concentration. J. Geophys. Res. 2012, 117, D11210. [Google Scholar] [CrossRef]
  13. Mona, L.; Amodeo, A.; Pandolfi, M.; Pappalardo, G. Saharan dust intrusions in the Mediterranean area: Three years of Raman lidar measurements. J. Geophys. Res. 2006, 111, D16203. [Google Scholar] [CrossRef]
  14. Papayannis, A.; Amiridis, V.; Mona, L.; Tsaknakis, G.; Balis, D.; Bösenberg, J.; Chaikovski, A.; De Tomasi, F.; Grigorov, I.; Mattis, I.; et al. Systematic lidar observations of Saharan dust over Europe in the frame of EARLINET (2000–2002). J. Geophys. Res. 2008, 113, D10204. [Google Scholar] [CrossRef]
  15. Müller, D.; Ansmann, A.; Freudenthaler, V.; Kandler, K.; Toledano, C.; Hiebsch, A.; Gasteiger, J.; Esselborn, M.; Tesche, M.; Heese, B.; et al. Mineral dust observed with AERONET Sun photometer, Raman lidar, and in situ instruments during SAMUM 2006: Shape-dependent particle properties. J. Geophys. Res. 2010, 115, D11207. [Google Scholar] [CrossRef]
  16. Binietoglou, I.; Basart, S.; Alados-Arboledas, L.; Amiridis, V.; Argyrouli, A.; Baars, H.; Baldasano, J.M.; Balis, D.; Belegante, L.; Bravo-Aranda, J.A.; et al. A methodology for investigating dust model performance using synergistic EARLINET/AERONET dust concentration retrievals. Atmos. Meas. Tech. 2015, 8, 3577–3600. [Google Scholar] [CrossRef] [Green Version]
  17. Ealo, M.; Alastuey, A.; Ripoll, A.; Pérez, N.; Minguillón, M.; Querol, X.; Pandolfi, M. Detection of Saharan dust and biomass burning events using near-real-time intensive aerosol optical properties in the north-western Mediterranean. Atmos. Chem. Phys. 2016, 16, 12567–12586. [Google Scholar] [CrossRef] [Green Version]
  18. Ogren, J.A.; Andrews, E.; McComiskey, A.; Sheridan, P.; Jefferson, A.; Fiebig, M. New insights into aerosol asymmetry parameter. In Proceedings of the 16th ARM Science Team Meeting, Albuquerque, NM, USA, 27–31 March 2006. [Google Scholar]
  19. Barnaba, F.; Gobbi, G.P. Aerosol seasonal variability over the Mediterranean region and relative impact of maritime, continental and Saharan dust particles over the basin from MODIS data in the year 2001. Atmos. Chem. Phys. 2004, 4, 2367–2391. [Google Scholar] [CrossRef] [Green Version]
  20. Marey, H.S.; Gille, J.C.; El-Askary, H.M.; Shalaby, E.A.; El-Raey, M.E. Aerosol climatology over Nile Delta based on MODIS, MISR and OMI satellite data. Atmos. Chem. Phys. 2011, 11, 10637–10648. [Google Scholar] [CrossRef] [Green Version]
  21. Tegen, I.; Schepanski, K.; Heinold, B. Comparing two years of Saharan dust source activation obtained by regional modelling and satellite observations. Atmos. Chem. Phys. 2013, 13, 2381–2390. [Google Scholar] [CrossRef] [Green Version]
  22. Banks, J.R.; Schepanski, K.; Heinold, B.; Hünerbein, A.; Brindley, H.E. The influence of dust optical properties on the colour of simulated MSG-SEVIRI Desert Dust imagery. Atmos. Chem. Phys. 2018, 18, 9681–9703. [Google Scholar] [CrossRef]
  23. Mandija, F.; Chavez-Perez, V.M.; Nieto, R.; Sicard, M.; Danylevsky, V.; Añel, J.A.; Gimeno, L. The climatology of dust events over the European continent using data of the BSC-DREAM8b model. Atmos. Res. 2018, 209, 144–162. [Google Scholar] [CrossRef] [Green Version]
  24. Solomos, S.; Kalivitis, N.; Mihalopoulos, N.; Amiridis, V.; Kouvarakis, G.; Gkikas, A.; Binietoglou, I.; Tsekeri, A.; Kazadzis, S.; Kottas, M.; et al. From tropospheric folding to Khamsin and Foehn winds: How atmospheric dynamics advanced a record-breaking dust episode in Crete. Atmosphere 2018, 9, 240. [Google Scholar] [CrossRef]
  25. Nemuc, A.; Vasilescu, J.; Talianu, C.; Belegante, L.; Nicolae, D. Assessment of aerosol’s mass concentrations from measured linear particle depolarization ratio (vertically resolved) and simulations. Atmos. Meas. Tech. 2013, 6, 3243–3255. [Google Scholar] [CrossRef]
  26. Varga, G.; Cserháti, C.; Kovács, J.; Szeberényi, J.; Bradák, B. Saharan dust deposition in the Carpathian Basin and its possible effects on interglacial soil formation. Aeolian Res. 2016, 22, 1–12. [Google Scholar] [CrossRef] [Green Version]
  27. Collaud Coen, M.; Weingartner, E.; Schaub, D.; Hueglin, C.; Corrigan, C.; Henning, S.; Schwikowski, M.; Baltensperger, U. Saharan dust events at the Jungfraujoch: Detection by wavelength dependence of the single scattering albedo and first climatology analysis. Atmos. Chem. Phys. 2004, 4, 2465–2480. [Google Scholar] [CrossRef]
  28. Cârstea, E.; Fragkos, K.; Siomos, N.; Antonescu, B.; Belegante, L. Columnar aerosol measurements in a continental southeastern Europe site: Climatology and trends. Theor. Appl. Climatol. 2019, 137, 3149–3159. [Google Scholar] [CrossRef]
  29. Fragkos, K.; Antonescu, B.; Giles, D.M.; Ene, E.; Boldeanu, M.; Efstathiou, G.A.; Belegante, L.; Nicolae, D. Assessment of the total precipitable water from a sun photometer, microwave radiometer and radiosondes at a continental site in southeastern Europe. Atmos. Meas. Tech. 2019, 12, 1979–1997. [Google Scholar] [CrossRef] [Green Version]
  30. Marin, C.A.; Mărmureanu, L.; Radu, C.; Dandocsi, A.; Stan, C.; Ţoancă, F.; Preda, L.; Antonescu, B. Wintertime variations of gaseous atmospheric constituents in Bucharest peri-Urban area. Atmosphere 2019, 10, 478. [Google Scholar] [CrossRef]
  31. Ţoancă, F.; Ştefan, S. Temporal variability of atmospheric aerosols (PM10) in Magurele during 2006 and 2007. In Book of Abstracts, Annual Scientific Conference; University of Bucharest: Bucharest, Romania, 2012; pp. 30–31. [Google Scholar]
  32. Mărmureanu, L.; Vasilescu, J.; Nemuc, A.; Nicolae, D.; Belegante, L. Aerosol characterization based on chemical composition and optical properties. Rom. Journ. Phys. 2016, 61, 1635–1650. [Google Scholar]
  33. Marin, C.; Mărmureanu, L.; Vasilescu, J. Seasonal variability of submicronic aerosols in Romania. Eur. Aerosol Conf. 2017, 16, 2491–2496. [Google Scholar]
  34. Dee, D.P.; Uppala, S.M.; Simmons, A.J.; Berrisford, P.; Poli, P.; Kobayashi, S.; Andrae, U.; Balmaseda, M.; Balsamo, G.; Bauer, P.; et al. The ERA-Interim reanalysis: Configuration and performance of the data assimilation system. Q. J. R. Meteorol. Soc. 2011, 137, 553–597. [Google Scholar] [CrossRef]
  35. Lensky, I.M.; Rosenfeld, D. Clouds-Aerosols-Precipitation Satellite Analysis Tool (CAPSAT). Atmos. Chem. Phys. 2008, 8, 6739–6753. [Google Scholar] [CrossRef] [Green Version]
  36. Morcrette, J.J.; Boucher, O.; Jones, L.; Salmond, D.; Bechtold, P.; Benedetti, A.; Bonet, A.; Kaiser, J.W.; Razinger, M.; Schulz, M.; et al. Aerosol analysis and forecast in the ECMWF integrated forecast system: Forward modelling. J. Geophys. Res. 2009, 114, D06206. [Google Scholar] [CrossRef]
  37. Benedetti, A.; Morcrette, J.J.; Boucher, O.; Dethof, A.; Engelen, R.J.; Fisher, M.; Flentjes, H.; Huneeus, N.; Jones, L.; Kaiser, J.W.; et al. The GEMS-AER team. Aerosol analysis and forecast in the ECMWF Integrated Forecast System: 2. Data assimilation. J. Geophys. Res. 2009, 114, D13205. [Google Scholar] [CrossRef]
  38. Rose, T.; Crewell, S.; Löhnert, U.; Simmer, C. A network suitable microwave radiometer for operational monitoring of the cloudy atmosphere. Atmos. Res. 2005, 75, 183–200. [Google Scholar] [CrossRef]
  39. Pfeifer, S.; Müller, T.; Weinhold, K.; Zikova, N.; dos Santos, S.M.; Marinoni, A.; Bischof, O.F.; Kykal, C.; Ries, L.; Meinhardt, F.; et al. Intercomparison of 15 aerodynamic particle size spectrometers (APS 3321): Uncertainties in particle sizing and number size distribution. Atmos. Meas. Tech. 2016, 9, 1545–1551. [Google Scholar] [CrossRef]
  40. Wang, Y.Q.; Zhang, X.Y.; Sun, J.Y.; Zhang, X.C.; Che, H.Z.; Li, Y. Spatial and temporal variations of the concentrations of PM10, PM2.5 and PM1 in China. Atmos. Chem. Phys. 2015, 15, 13585–13598. [Google Scholar] [CrossRef] [Green Version]
  41. Schindelin, J.; Arganda-Carreras, I.; Frise, E.; Kaynig, V.; Longair, M.; Pietzsch, T.; Rueden, C.; Saalfeld, S.; Schmid, B.; White, D.J.; et al. Fiji: An open-source platform for biological-image analysis. Nat Methods 2012, 9, 676–682. [Google Scholar] [CrossRef]
  42. Anderson, T.L.; Ogren, J.A. Determining Aerosol Radiative Properties Using the TSI 3563 Integrating Nephelometer. Aerosol. Sci. Tech. 1998, 29, 57–69. [Google Scholar] [CrossRef] [Green Version]
  43. Weingartner, E.; Saathoff, H.; Schnaiter, M.; Streit, N.; Bitnar, B.; Baltensperger, U. Absorption of light by soot particles: Determination of the absorption coefficient by means of aethalometers. Aerosol Sci. 2003, 34, 1445–1463. [Google Scholar] [CrossRef]
  44. Drinovec, L.; Močnik, G.; Zotter, P.; Prévôt, A.S.H.; Ruckstuhl, C.; Coz, E.; Rupakheti, M.; Sciare, J.; Müller, T.; Wiedensohler, A.; et al. The “dual-spot” Aethalometer: An improved measurement of aerosol black carbon with real-time loading compensation. Atmos. Meas. Tech. 2015, 8, 1965–1979. [Google Scholar] [CrossRef]
  45. Ng, N.L.; Herndon, S.C.; Trimborn, A.; Canagaratna, M.R.; Croteau, P.L.; Onasch, T.B.; Sueper, D.; Worsnop, D.R.; Zhang, Q.; Sun, Y.L.; et al. An aerosol chemical speciation monitor (ACSM) for routine monitoring of the composition and mass concentrations of ambient aerosol. Aerosol. Sci. Tech. 2011, 45, 780–794. [Google Scholar] [CrossRef]
  46. Minguillón, M.C.; Ripoll, A.; Pérez, N.; Prévôt, A.S.H.; Canonaco, F.; Querol, X.; Alastuey, A. Chemical characterization of submicron regional background aerosols in the western Mediterranean using an Aerosol Chemical Speciation Monitor. Atmos. Chem. Phys. 2015, 15, 6379–6391. [Google Scholar] [CrossRef] [Green Version]
  47. Petit, J.E.; Favez, O.; Sciare, J.; Crenn, V.; Sarda-Estève, R.; Bonnaire, N.; Močnik, G.; Dupont, J.C.; Haeffelin, M.; Leoz-Garziandia, E. Two years of near real-time chemical composition of submicron aerosols in the region of Paris using an Aerosol Chemical Speciation Monitor (ACSM) and a multi-wavelength Aethalometer. Atmos. Chem. Phys. 2015, 15, 2985–3005. [Google Scholar] [CrossRef] [Green Version]
  48. Freney, E.; Zhang, Y.; Croteau, P.; Amodeo, T.; Williams, L.; Truong, F.; Petit, J.; Sciare, J.; Sarda-Esteve, R.; Bonnaire, N.; et al. The second ACTRIS inter-comparison (2016) for Aerosol Chemical Speciation Monitors (ACSM): Calibration protocols and instrument performance evaluations. Aerosol Sci. Technol. 2019, 53, 830–842. [Google Scholar] [CrossRef]
  49. Maheras, P.; Flocas, H.; Patrikas, I.; Anagnostopoulou, C. A 40 year objective climatology of surface cyclones in the Mediterranean region: Spatial and temporal distribution. Int. J. Clim. 2001, 21, 109–130. [Google Scholar] [CrossRef]
  50. Schepanski, K.; Knippertz, P. Soudano-Saharan depressions and their importance for precipitation and dust: A new perspective on a classical synoptic concept. Q. J. R. Meteor. Soc. 2011, 137, 1431–1445. [Google Scholar] [CrossRef]
  51. Alpert, P.; Ziv, B. The Sharav cyclone: Observations and some theoretical considerations. J. Geophys. Res. 1989, 94, 18495–18514. [Google Scholar] [CrossRef]
  52. Barkan, J.; Alpert, P.; Kutiel, H.; Kishcha, P. Synoptics of dust transportation days from Africa toward Italy and central Europe. J. Geophys. Res. 2005, 110, D07208. [Google Scholar] [CrossRef]
  53. Fiedler, S.; Schepanski, K.; Knippertz, P.; Heinold, B.; Tegen, I. How important are atmospheric depressions and mobile cyclones for emitting mineral dust aerosol in North Africa? Atmos. Chem. Phys. 2014, 14, 8983–9000. [Google Scholar] [CrossRef] [Green Version]
  54. Kulmala, M.; Lehtinen, K.E.J.; Laaksonen, A. Cluster activation theory as an explanation of the linear dependence between formation rate of 3nm particles and sulphuric acid concentration. Atmos. Chem. Phys. 2006, 6, 787–793. [Google Scholar] [CrossRef] [Green Version]
  55. Mahowald, N.; Albani, S.; Kok, J.F.; Engelstaeder, S.; Scanza, R.; Ward, D.S.; Flanner, M.G. The size distribution of desert dust aerosols and its impact on the Earth system. Aeolian Res. 2014, 15, 53–71. [Google Scholar] [CrossRef] [Green Version]
  56. Tegen, I.; Lacis, A.A. Modeling of particle size distribution and its influence on the radiative properties of mineral dust aerosol. J. Geophys. Res. 1996, 101, 19237–19244. [Google Scholar] [CrossRef] [Green Version]
  57. van der Does, M.; Knippertz, P.; Zschenderlein, P.; Harrison, R.; Stuut, J.B.W. The mysterious long-range transport of giant mineral dust particles. Sci. Adv. 2018, 12, eaau2768. [Google Scholar] [CrossRef]
  58. Formenti, P.; Schütz, L.; Balkanski, Y.; Desboeufs, K.; Ebert, M.; Kandler, K.; Petzold, A.; Scheuvens, D.; Weinbruch, S.; Zhang, D. Recent progress in understanding physical and chemical properties of African and Asian mineral dust. Atmos. Chem. Phys. 2011, 11, 8231–8256. [Google Scholar] [CrossRef] [Green Version]
  59. Scheuvens, D.; Schütz, L.; Kandler, K.; Ebert, M.; Weinbruch, S. Bulk composition of northern African dust and its source sediments—A compilation. Earth. Sci. Rev. 2013, 16, 170–194. [Google Scholar] [CrossRef]
  60. Journet, E.; Balkanski, Y.; Harrison, S.P. A new data set of soil mineralogy for dust-cycle modeling. Atmos. Chem. Phys. 2014, 14, 3801–3816. [Google Scholar] [CrossRef] [Green Version]
  61. Blanco, A.; Tomasi, F.D.; Filippo, E.; Manno, D.; Perrone, M.R.; Serra, A.; Tafuro, A.M.; Tepore, A. Characterization of African dust over southern Italy. Atmos. Chem. Phys. 2003, 3, 2147–2159. [Google Scholar] [CrossRef] [Green Version]
  62. Lafon, S.; Sokolik, I.N.; Rajot, J.L.; Caquineau, S.; Gaudichet, A. Characterization of iron oxides in mineral dust aerosols: Implications for light absorption. J. Geophys. Res. 2006, 111, D21207. [Google Scholar] [CrossRef]
  63. Desboeufs, K.V.; Cautenet, G. Transport and mixing zone of desert dust and sulphate over tropical Africa and the Atlantic Ocean region. Atmos. Chem. Phys. Discuss. 2005, 5, 5615–5644. [Google Scholar] [CrossRef]
  64. Paris, R.; Desboeufs, K.V. Effect of atmospheric organic complexation on iron-bearing dust solubility. Atmos. Chem. Phys. 2013, 13, 4895–4905. [Google Scholar] [CrossRef] [Green Version]
  65. Marconi, M.; Sferlazzo, D.M.; Becagli, S.; Bommarito, C.; Calzolai, G.; Chiari, M.; di Sarra, A.; Ghedini, C.; Gómez-Amo, J.L.; Lucarelli, F.; et al. Saharan dust aerosol over the central Mediterranean Sea: PM10 chemical composition and concentration versus optical columnar measurements. Atmos. Chem. Phys. 2014, 14, 2039–2054. [Google Scholar] [CrossRef] [Green Version]
  66. Formenti, P.; Elbert, W.; Maenhaut, W.; Haywood, J.; Andreae, M. Chemical composition of mineral dust aerosol during the Saharan Dust Experiment (SHADE) airborne campaign in the Cape Verde region. J. Geophys. Res. 2003, 108, 8576. [Google Scholar] [CrossRef]
  67. Hallar, A.G.; Petersen, R.; Andrews, E.; Michalsky, J.; McCubbin, I.B.; Ogren, J.A. Contributions of dust and biomass burning to aerosols at a Colorado mountain-top site. Atmos. Chem. Phys. 2015, 15, 13665–13679. [Google Scholar] [CrossRef] [Green Version]
  68. Andrews, E.; Sheridan, P.J.; Fiebig, M.; McComiskey, A.; Ogren, J.A.; Arnott, P.; Covert, D.; Elleman, R.; Gasparini, R.; Collins, D.; et al. Comparison of methods for deriving aerosol asymmetry parameter. J. Geophys. Res. 2006, 111, D05S04. [Google Scholar] [CrossRef]
  69. Donateo, A.; Feudo, T.L.; Marinoni, A.; Dinoi, A.; Avolio, E.; Merico, E.; Calidonna, C.; Contini, D.; Bonasoni, P. Characterization of In Situ Aerosol Optical Properties at Three Observatories in the Central Mediterranean. Atmosphere 2018, 9, 369. [Google Scholar] [CrossRef]
  70. Hatch, C.D.; Gierlus, K.M.; amd, V.H. Grassian, J.D. Water adsorption and cloud condensation nuclei activity of calcite and calcite coated with model humic and fulvic acids. Atmos. Environ. 2008, 42, 5672–5684. [Google Scholar] [CrossRef]
  71. Zhang, Q.; Alfarra, M.R.; Worsnop, D.R.; Allan, J.D.; Coe, H.; Canagaratna, M.R.; Jimenez, J.L. Deconvolution and quantification of hydrocarbon-like and oxygenated organic aerosols based on aerosol mass Sspectrometry. Environ. Sci. Technol. 2005, 39, 4938–4952. [Google Scholar] [CrossRef]
  72. Alfarra, M.R.; Paulsen, D.; Gysel, M.; Garforth, A.A.; Dommen, J.; Prévôt, A.S.H.; Worsnop, D.R.; Baltensperger, U.; Coe, H. A mass spectrometric study of secondary organic aerosols formed from the photooxidation of anthropogenic and biogenic precursors in a reaction chamber. Atmos. Chem. Phys. 2006, 6, 5279–5293. [Google Scholar] [CrossRef] [Green Version]
  73. Williams, J.; Gros, V.; Atlas, E.; Maciejczyk, K.; Batsaikhan, A.; Schöler, H.F.; Forster, C.; Quack, B.; Yassaa, N.; Sander, R.; et al. Possible evidence for a connection between methyl iodide emissions and Saharan dust. J. Geophys. Res. 2007, 112, D07302. [Google Scholar] [CrossRef]
Figure 1. (a) Dust aerosol optical depth over Romania as derived from Copernicus Atmosphere Monitoring Service (CAMS) data, accumulated between 22 March 2100 UTC–23 March 0600 UTC, shaded according to the scale. The black circles represent the sites from which there was a visual confirmation of the dust present at the ground. The black square represents the location of the Romanian Atmospheric 3D Observatory (RADO, Măgurele, Romania); (b) A section of the snow layer at RADO showing the embedded dust layer (the thickness of the embedded dust layer is indicated together with the thickness of the high dust concentration layer).
Remotesensing 11 02466 g001
Figure 2. The experiment set-up for re-suspended dust analyses.
Remotesensing 11 02466 g002
Figure 3. Saharan dust deposited on carbon filter visualized using (a) scanning electron microscope; and (b) Energy-dispersive X-ray spectroscopy. In (b) the image was obtained using all elemental pixel values maps. Based on elemental composition the calcite, quartz, and Fe-rich particles were emphasized.
Remotesensing 11 02466 g003
Figure 4. The evolution of the dust event between 21–23 March (every 12 h), starting from 21 March 1200UTC (a,b) and ending on 23 March 1200UTC (i,j). The left panels show mean sea level pressure (white contours, every 5 hPa), 700 hPa geopotential height (black contours, every 5 gdam) and temperature at 850 hPa (shaded according to the scale) retrieved from ERA-Interim. The right panels show MSG-SEVIRI dust RGB images and the sea level pressure (white contours, every 5 hPa) from ERA-Interim.
Remotesensing 11 02466 g004
Figure 5. The synoptic analysis based on ECMWF data for (a) 22 March 2100 UTC; (b) 23 March 0000 UTC; and (c) 23 March 0300 UTC showing the surface pressure (white contours, every 5 hPa), the 500 hPa geopotential (black contours, every 5 gdam) and the dust aerosol optical depth retrieved from CAMS (shaded according to the scale on the bottom left). The regional scale analysis is shown in (df) for the area indicate by a dashed rectangle in (ac) and for the same time steps. Also, for the same time steps as in (ac), the hourly averaged vertical profiles of temperature and dew point temperature from RPG-HATPRO microwave radiometer are shown on Skew-T/log-P diagrams (red curve for temperature and green curve for dew point temperature) in (gi). For each pressure level on the Skew-T/log-P diagrams, the dust mixing ratio provided by CAMS forecast are displayed in (gi) (shaded according to the scale in the bottom right). Red and green dotted curves in (h) represents the profiles from the Bucharest–Băneasa sounding at 0000 UTC.
Remotesensing 11 02466 g005
Figure 6. The variations of temperature ( C, red line) and dew point temperature ( C, blue line) between 22–23 March as recorded at the Filaret (Bucharest) weather station part of the Romanian network of surface stations. The period with snow at the Filaret station (22 March 1400 UTC–23 March 1500 UTC) is indicated by the green bars for light and continuous snow, and moderate and continuous snow. The concentration of the PM 10 and PM 2.5 is indicated on the top for the period before the beginning of the snow (black, 21 March 1400 UTC–22 March 1400 UTC), during the snow but before the dust intrusion was observed over Bucharest (gray, 22 March 1400 UTC–2100 UTC), during the snow and dust intrusion episode (orange, 22 March 2100 UTC–23 March 0300 UCT), during the snow event but after the dust intrusion over Bucharest (gray, 23 March 0300 UTC–1500 UTC), and after cessation of snow (black, 23 March 1500 UTC–24 March 1500 UTC).
Remotesensing 11 02466 g006
Figure 7. The evolution between 22 March 0000 UTC–24 March 0000 UTC of the aerosol size distribution obtained from Aerodynamic Particle Sizer (APS).
Remotesensing 11 02466 g007
Figure 8. Single particle SEM/EDX map collected by Low Volume Sampler (LVS3) on a quartz filter for 24 h starting on 22 March 1500 UTC. (a) SEM image, (b)–(i) elemental composition derived from EDX for C, Mg, Al, Si, K, Ca, Ti, Fe.
Remotesensing 11 02466 g008
Figure 9. Number size distribution of dust particles derived from SEM/EDX map.
Remotesensing 11 02466 g009
Figure 10. SEM/EDX elemental maps of Ti reach conglomerate structure. (a) SEM image, (bh) elemental composition derived from EDX for Al, Ca, Fe, K, Mg, Si, Ti.
Remotesensing 11 02466 g010
Figure 11. SEM/EDX map of biological marker (i.e., species Aulacoseira) found in dust sample. (a) SEM image, (bh) elemental composition derived from EDX for Al, Ca, Fe, K, Mg, Si, O.
Remotesensing 11 02466 g011
Figure 12. Mass spectra of the organic fraction obtained from snow re-suspended particles.
Remotesensing 11 02466 g012
Table 1. Elemental ratios obtained from ICP-OES, SEM/EDX analyses of the collected dust sample and the ratios found in the literature specific for the north African desert.
Element RatioICP-OESSEM/EDX[59,61]
Si/Al-2.912.5–7
(Ca+Mg)/Fe1.310.980.8–2.2
Fe/Al0.890.720.5–2.5
K/Al0.2310.300.1–0.5
Ca/Al0.760.53>0.5
Na/Al0.120.29<0.45
Ti/Al-0.006<0.1
Mg/Al0.410.170.34–1.54
K/Ca0.3030.570.73–1.25
Fe/Ca1.171.350.6 -0.83

