1. Introduction
Currently, half of the world’s population lives in urban areas; according to the UN, this number will increase to 60% in two decades. Cities consume a considerable amount of energy, but they can also produce it. Solar energy has the advantage of being able to be generated in the same place it can be consumed due to the possibilities offered by the integration of photovoltaic systems in buildings.
As reflected in Directive 2010/31/EU, 40% of the total energy consumption in the European Union corresponds to buildings. These conditions have caused the EU to promote the development of photovoltaic energy as part of improvement programs for the energy efficiency of buildings. By the end of 2020, at least 25% of new or refurbished buildings will be obliged to comply with the high energy efficiency and bidding requirements for energy consumption, which should be obtained from renewable sources.
Solar energy is the largest and cleanest source of renewable energy. Current technologies enable high performance in the generation of energy from the sun. The potential of solar energy on roofs can be calculated from images, shade estimation, and meteorological data. At the same time, the amount of greenhouse gas emissions avoided in the city with the use of this energy is also estimated [
1]. Geographic information systems (GIS) are useful tool for this analysis [
2,
3].
Work was recently performed based on data obtained with LiDAR technology [
4,
5,
6]. The accuracy of the results depends on the quality and reliability of the input data. The simplest methods consider the horizontal surface of a roof without taking into account the morphology of a building or the shape of the roof [
7]. However, for greater accuracy in the three-dimensional analysis of buildings, other variables, such as the orientation of a roof or even the slope of a roof, must be taken into account without ruling out the effect of shadows [
8]. The alternatives presented are based mostly on sophisticated methodologies, commercial tools, and/or complex models.
This paper presents a method for analysing the solar potential of the roofs of urban buildings based on LiDAR data. The method is easily replicable and is based on open data and non-commercial tools that produce high-precision results (1 sqm). In addition, an urban 3D model is generated and semantized with solar potential data for subsequent visualization in a 3D web tool. The integration of information from different domains in a single urban 3D model enables further information retrieval and analysis.
The remaining article is structured as follows: The proposed workflow for solar potential analysis and the urban 3D model creation are explained in
Section 2. In
Section 3, the workflow is validated in the case study of Vitoria-Gasteiz, Spain.
Section 4 contains a discussion of the work, and the main conclusions obtained from the work described in this paper are presented in
Section 5.
2. Materials and Methods
To calculate the solar potential and generate the urban 3D model, the following software tools were employed:
- -
QGIS: GIS open source tool that is used to process layers of geographic information.
- -
LASTools [
9]: powerful LiDAR data-processing tool that is used for data format conversion and the filtering of points that represent the selected urban objects.
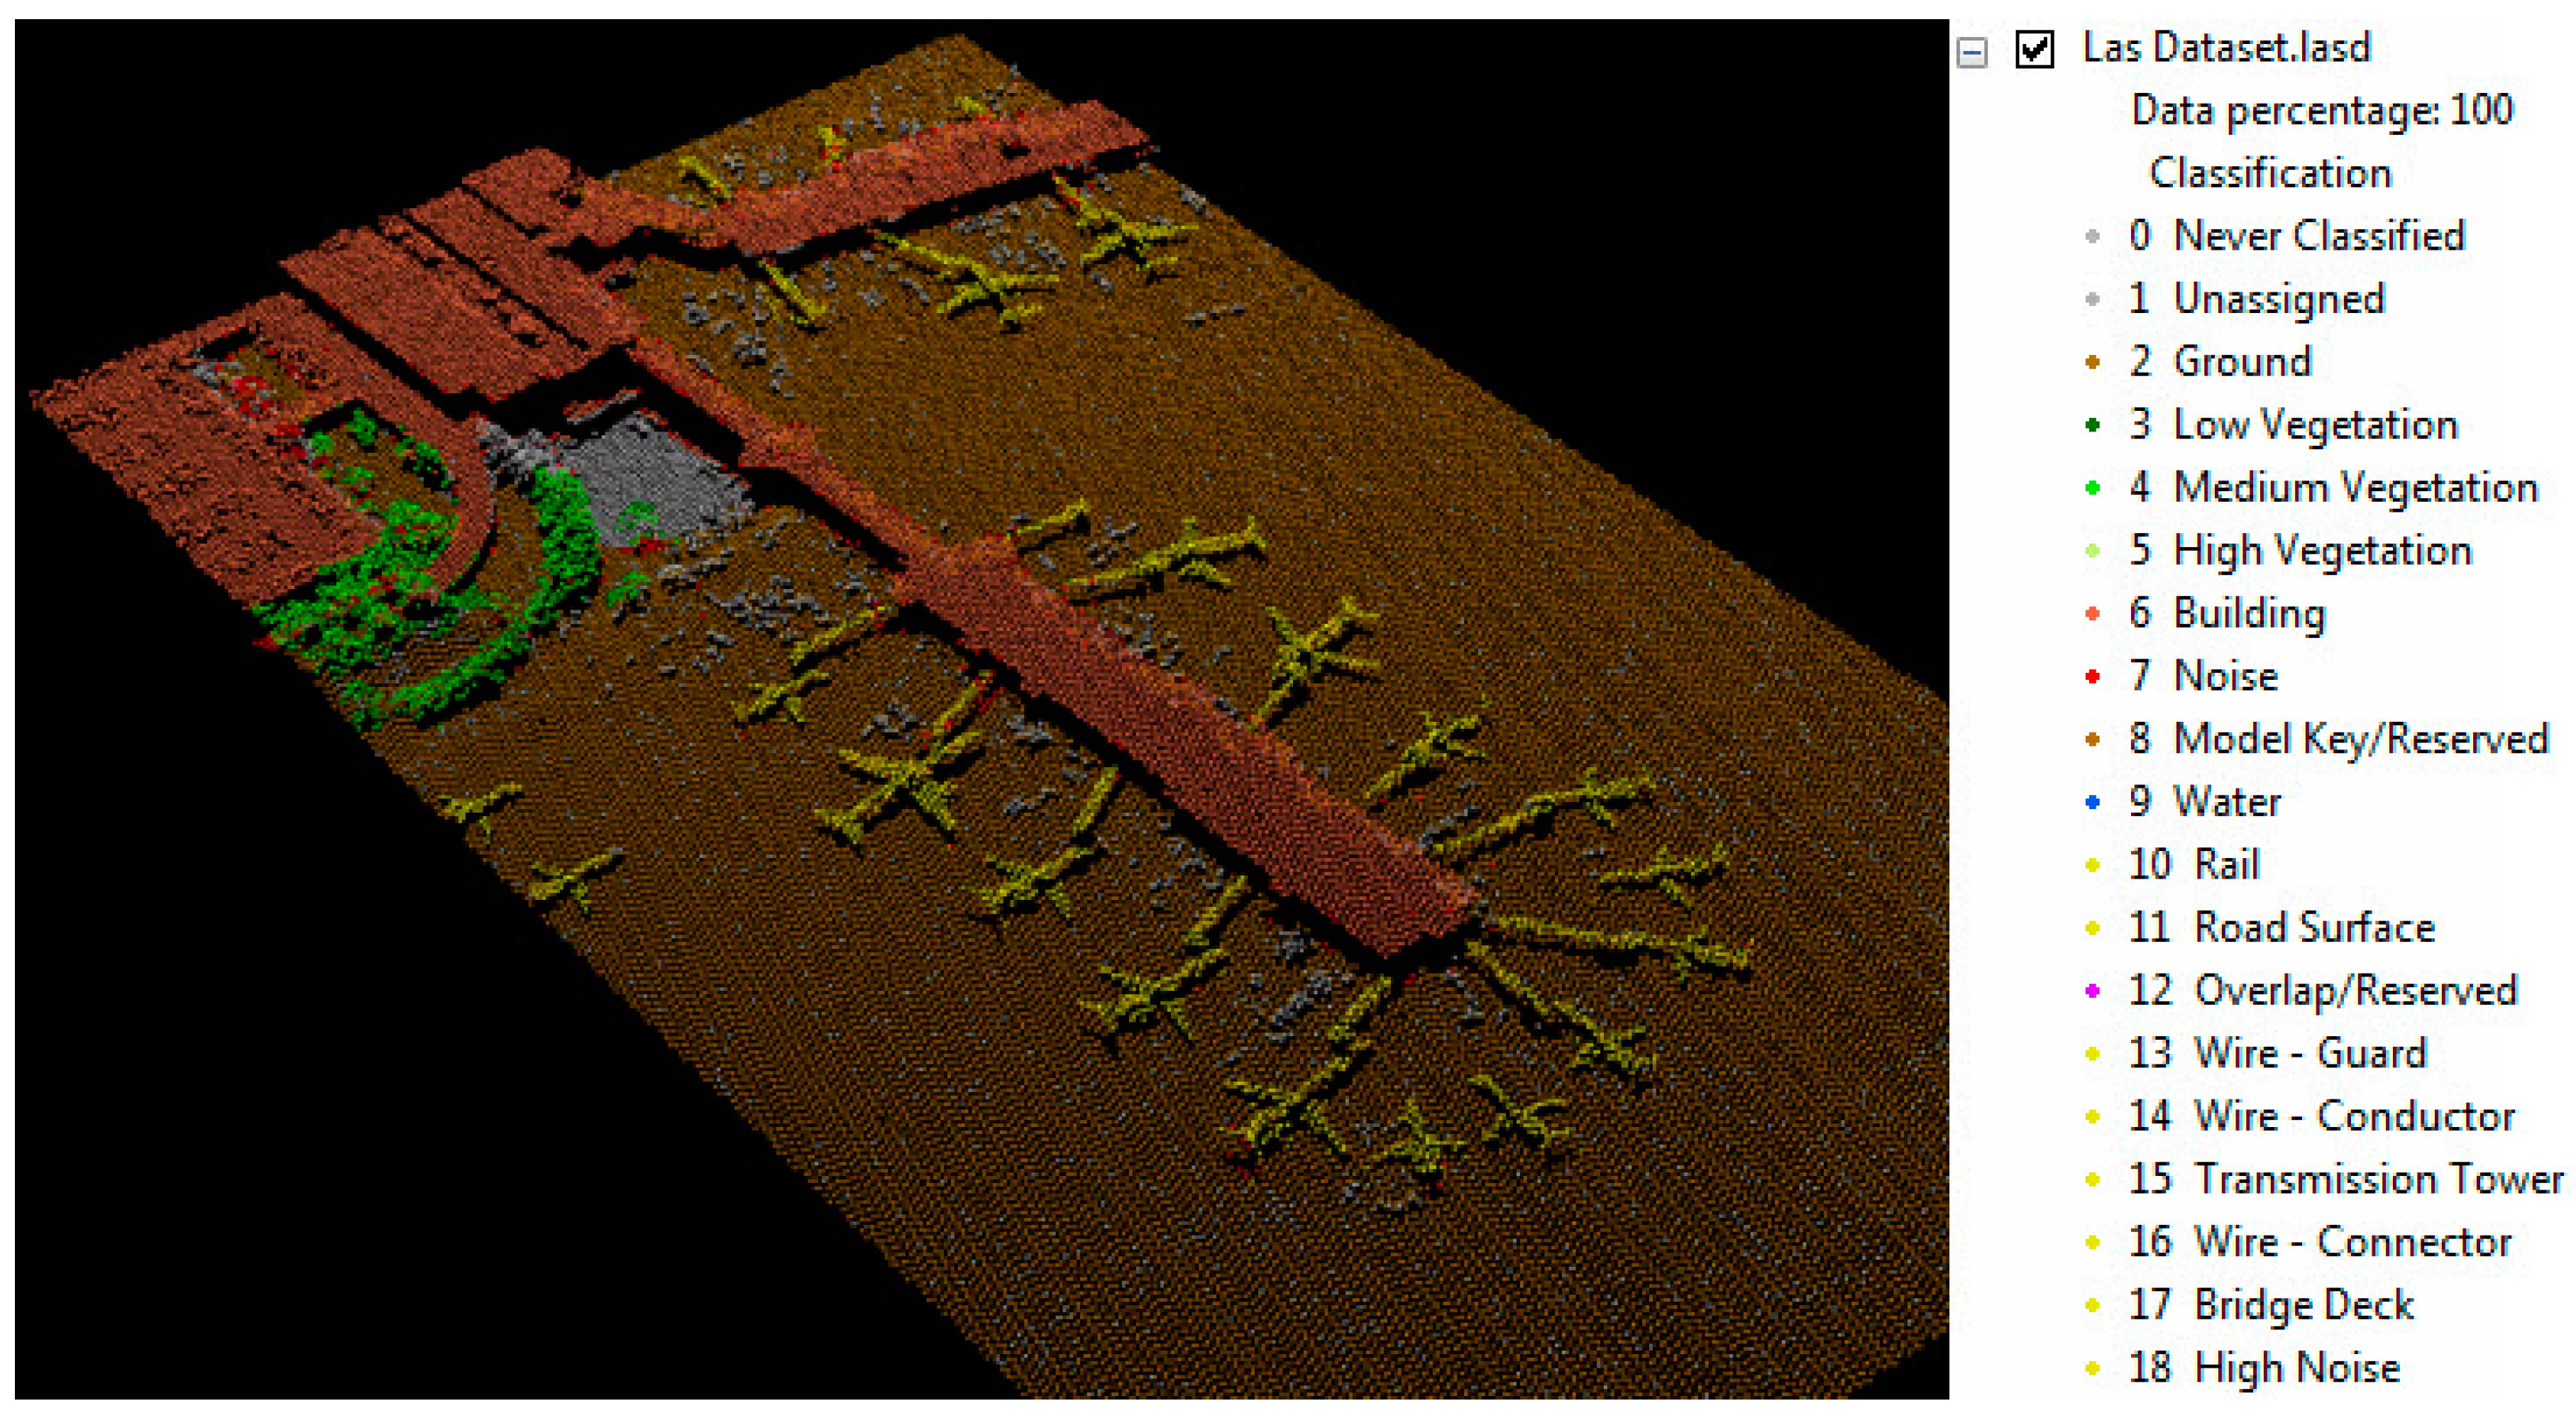
Figure 1 represents the classification of elements in a LiDAR data file.
- -
Urban Multi-Scale Environmental Predictor—UMEP Tools [
11]: group of environmental services that are implemented as a QGIS plugin. The following services were utilized:
UMEP MetPreprocessor: facilitates the adaptation of the EnergyPlus climate file to the meteorological parameters required by the SEBE tool.
UMEP Aspect and Height Calculation: calculates the orientations and heights of the facades of buildings from a digital surface model (DSM). Wall aspect is provided in degrees, where a north-facing-wall pixel has a value of zero.
- -
Solar Energy on Building Envelopes—SEBE Tool [
12]: a plugin for QGIS that is used to calculate the pixel-wise potential solar energy using ground and building DSMs.
- -
CityGML Generation Tool [
13]: developed by the authors of this paper to generate a 3D urban model based on the CityGML standard using cadastre, DSM, and digital terrain model (DTM) data [
14]. Other tools enable the generation of CityGML models [
15].
- -
The input data used during the process are described as follows:
- -
Digital Surface Model (DSM): LiDAR file with elevation data of the urban environment, including the elevations of urban elements such as buildings, vegetation or roads.
- -
Digital Terrain Model (DTM): LiDAR file with elevation data of the ground, on which the urban environment is based (base level of urban elements).
- -
Weather Data [
16]: Detailed climate file of the study area.
- -
Cadastre Data: GIS file that includes georeferenced dimensions and attributes of land parcels.
Based on these tools and data,
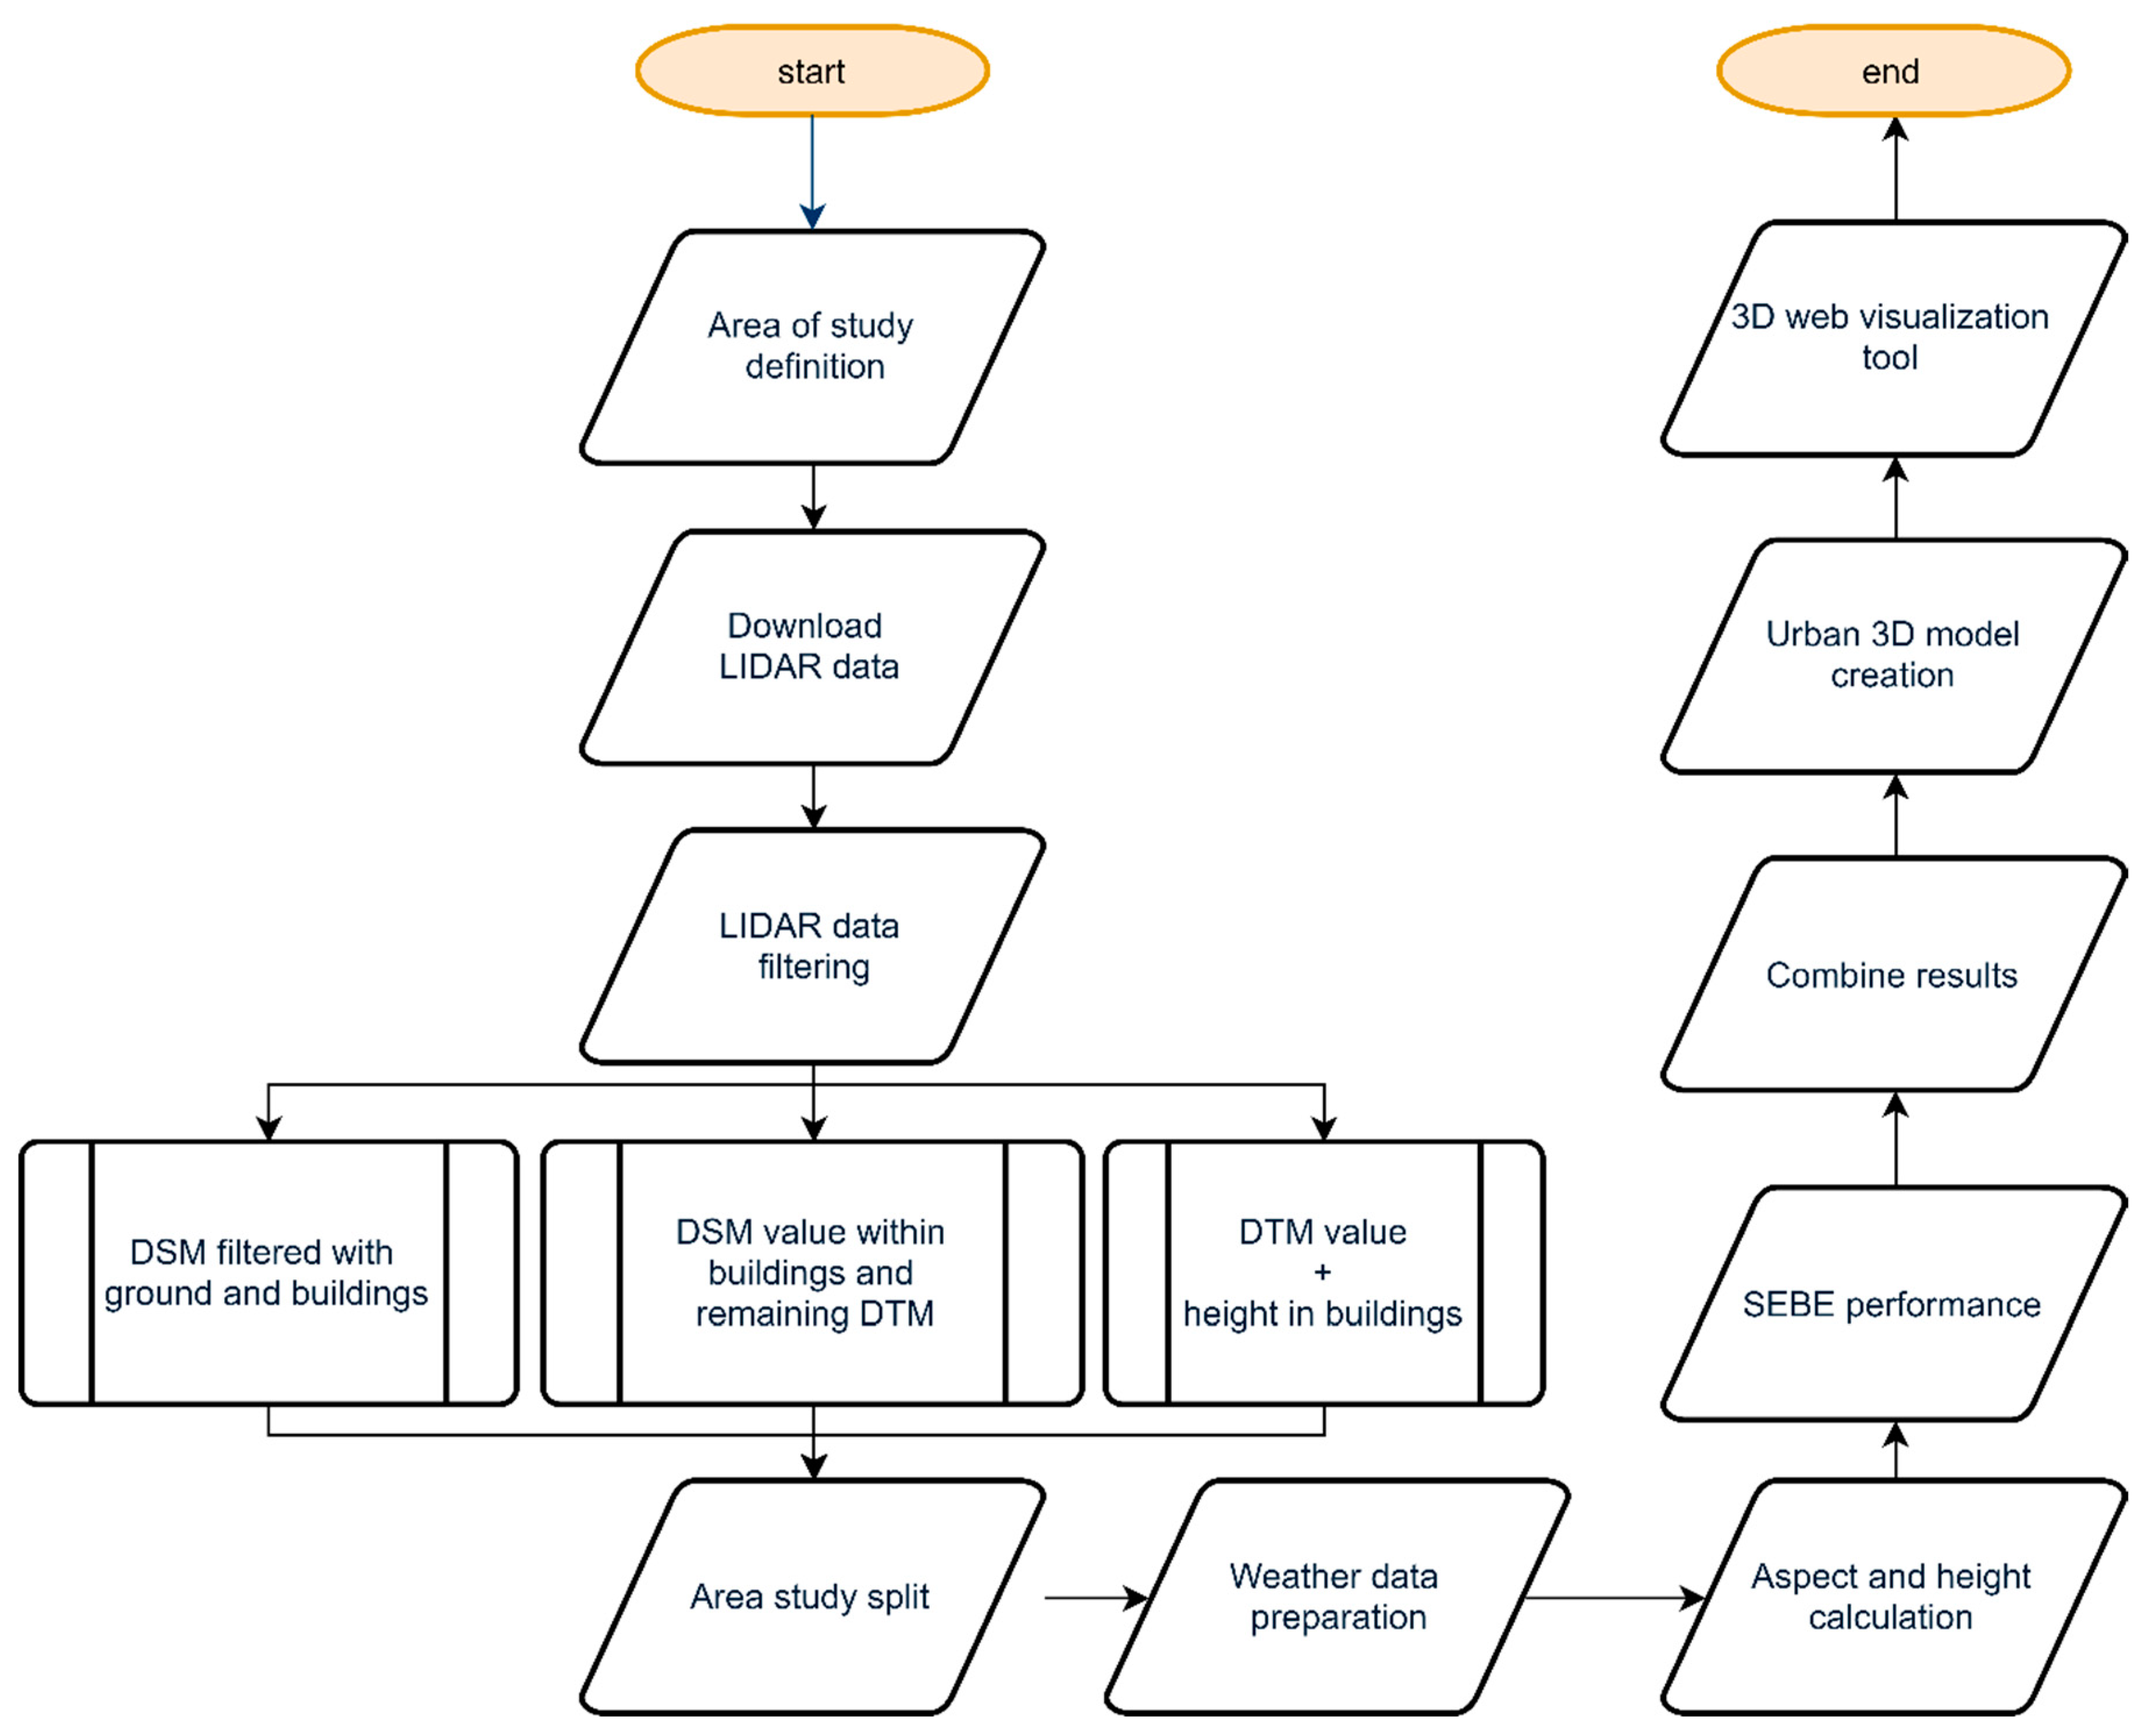
Figure 2 shows the process for the analysis of solar generation potential based on an urban 3D model. The workflow is described here.
The process starts with a definition of the study area (Area of study definition). Once the area of study is defined, the required LiDAR files (DSM and/or DTM, depending in the availability) are downloaded (Download LiDAR data). The LiDAR files must completely address the area of study. The LiDAR data need to be filtered prior to their usage (LiDAR data filtering) using LASTools. As output of this process, a raster file that contains only ground and building points, without vegetation or other objects, is needed. Depending on the availability of the LiDAR data and its quality, three different ways for obtaining this raster file were identified:
- -
DSM filtered with ground and buildings. In the first approach, only DSM LiDAR files are used. These LiDAR files must be in LAS or LAZ format. In this case, the DSM file is filtered by selecting only the points that are classified as 2 (ground) and 6 (building).
- -
DSM value within buildings and remaining DTM. If the DSM classification quality is not as accurate as needed, another approach that uses DTM and DSM data can be used. In this approach, a raster file is created with the DSM values for buildings and DTM values for the surrounding study area.
- -
DTM value + height in buildings. The third approach pertains to cases in which DTM data are available, but DSM data are not available. In addition, we need a building geometry layer (Cadastre GIS file) with a height value as a parameter. In this way, a raster file is created with DTM values (ground) for the study area, with the exception of buildings, for which DTM and building height values are added and a DTM + buildings with flat roof rasters is obtained. Although the quality and precision of this approach are less accurate, a solar potential analysis can be performed in a similar way.
Whichever approach is selected, another step needs to be performed to obtain a complete raster file. Using the QGIS, a geo-process that fills raster regions that lack data values is performed by interpolation from edges. The values for the regions without data are calculated by the surrounding pixel values using inverse distance weighting. Before starting the solar potential analysis, the resulting point cloud for the study area needs to be split into different sections (
Area study split), which must be rectangular. The creation of a unique raster file to calculate the solar potential is not feasible, as the UMEP tool is not able to perform calculations with such a large raster file. Each section will be independently analyzed using the UMEP tool. The remaining input data required to perform the solar analysis comprises a meteorological file. This file needs to be created in a specific format. The UMEP MetPreprocessor tool enables
Weather data preparation starting from an EnergyPlus weather file. First, weather data from EnergyPlus [
12] are downloaded. From the EnergyPlus weather file, a Comma-Separated Values (CSV) file needs to be created. Second, in the MetPreprocessor tool, a matching between EnergyPlus weather data and UMEP meteorological parameters needs to be defined and performed.
Table 1 presents this matching.
Last, the UMEP meteorological file, which is subsequently used in the SEBE tool, is obtained. For a detailed calculation of the solar incidence of the building roofs, a prior processing of the raster file of the study area is required to calculate the orientations and heights of the facades of the buildings. This process is performed using the UMEP tool, specifically the Aspect and height calculation functionality. This functionality is used to identify the wall pixels and their heights from ground and building digital surface models (DSM) using a filter. The wall aspect can be estimated using a specific linear filter. The wall aspect is given in degrees, where a north-facing-wall pixel has a value of zero. As a result, intermediate files are obtained based on the raster generated for each section of the study area. Intermediate files obtained in this step and the meteorological file that was previously generated are utilized by the SEBE tool to calculate the pixel-wise potential solar energy (SEBE performance) using ground and building digital surface models (DSMs). The SEBE calculation needs to be performed for each section of the study area. After the solar potential analysis is performed for all sections, the results are combined in a unique raster layer (Combine the results). In addition, the resultant raster layer can be cut with the city geometry to obtain the solar potential for the city limits. The previously calculated solar potential map is bounded to the boundaries of the municipality using the municipality boundary layer. In addition, a radiation threshold was defined for the implementation of solar collection technologies in roofs, in particular 800 kW/m2 year, and the potential of radiation of the roofs was calculated. As a result of this process, a GIS building layer constructed with solar potential data was obtained. This layer includes the following parameters related to solar potential: (1) useful roof surface (m2), (2) percentage of useful roof surface (%), (3) total solar radiation (Kwh/year), and (4) solar radiation per sqm (Kwh/m2·year).
The last step of the process is the generation of a 3D urban model (
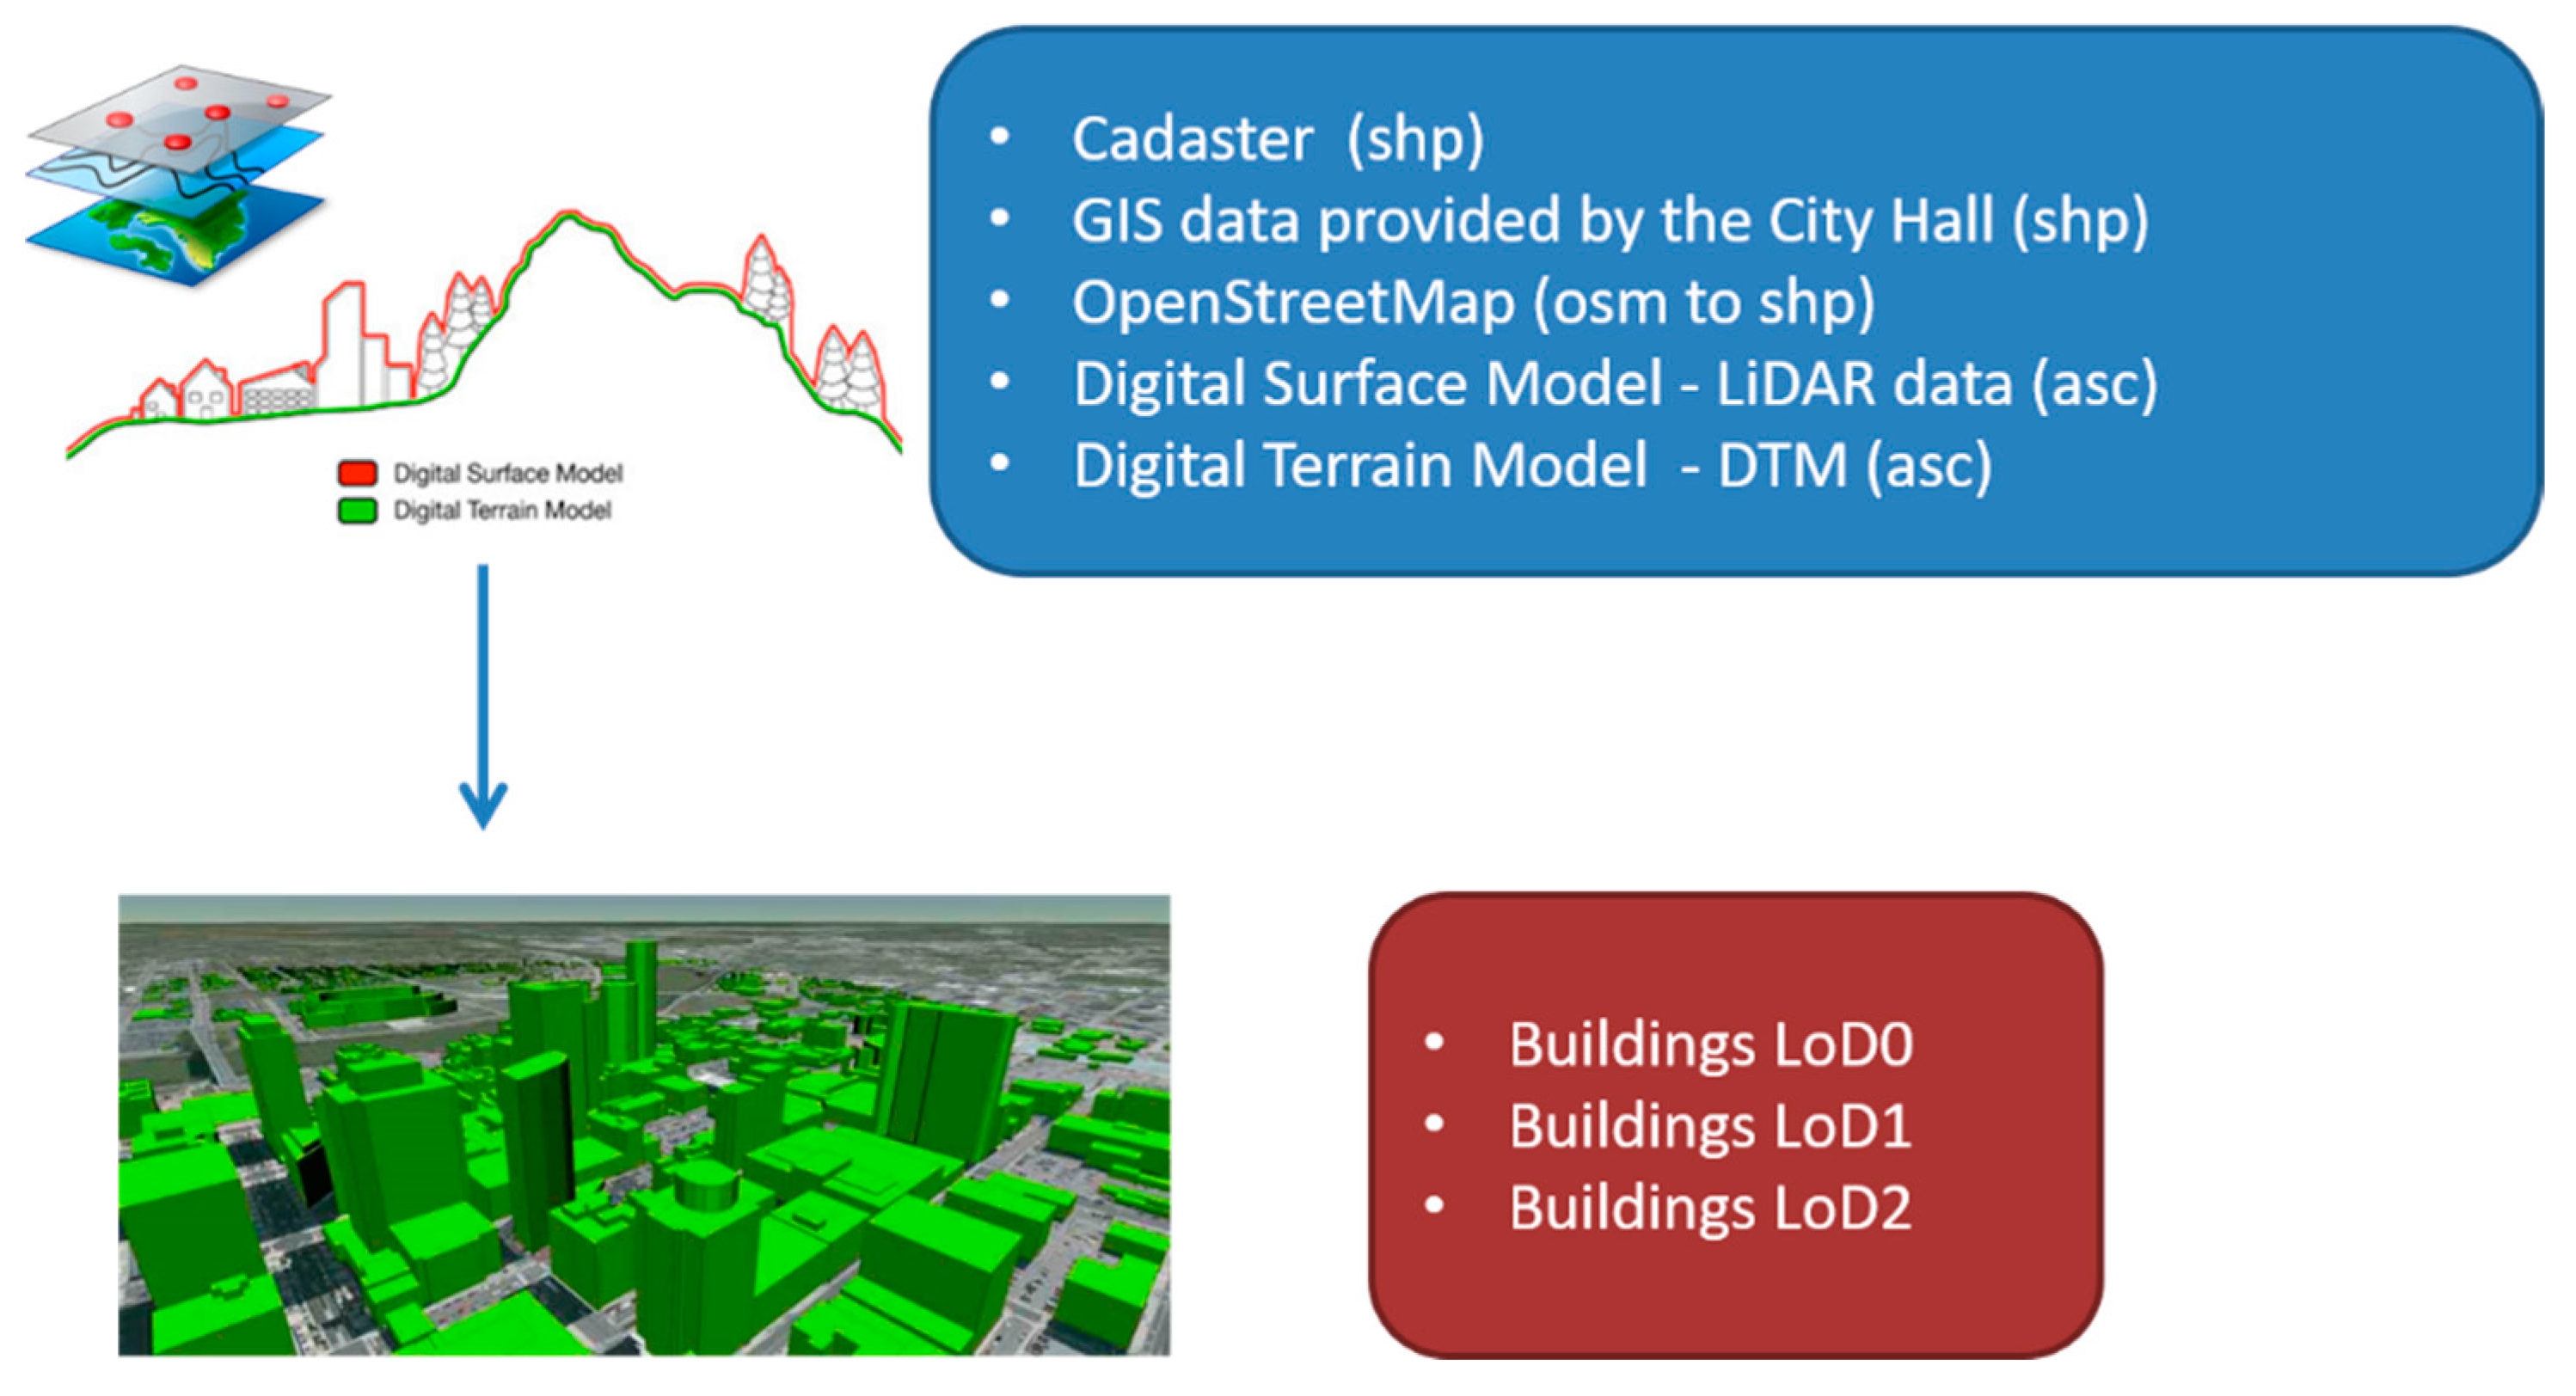
Urban 3D model creation) that incorporates the results obtained from the solar analysis and facilitates the visualization and interpretation of the information contained. The model is based on the CityGML standard defined by the Open Geospatial Consortium (OGC), which combines geometric and semantic information in the same model with different levels of detail. The model generation was performed using the CityGML generation tool. Using DSM and DTM data, the real heights of the buildings are obtained. In this way, 3D buildings can be generated with their real heights and georeferenced, both in position and altitude (on the digital terrain model). As a result, buildings are generated in CityGML LoD2 (refer to
Figure 3). The urban 3D model is semantized with the calculated parameters. In this way, all buildings of a city have solar potential analysis values.
The results are presented in a 3D web tool that enables the visualization of building basic data and solar potential analysis data (3D web visualization tool). The information included in the 3D urban model that was previously generated enables the identification of the geographical distribution of the typologies of buildings in the study area. This typological analysis enables the identification of priority areas or districts for solar panel installation, identification of synergies between buildings and adjustment of budget items.
3. Results
In this section, the proposed workflow for the solar potential analysis applied to the Vitoria-Gasteiz case study is presented. The process was performed using the data sources in
Table 2.
3.1. Solar Potential Analysis
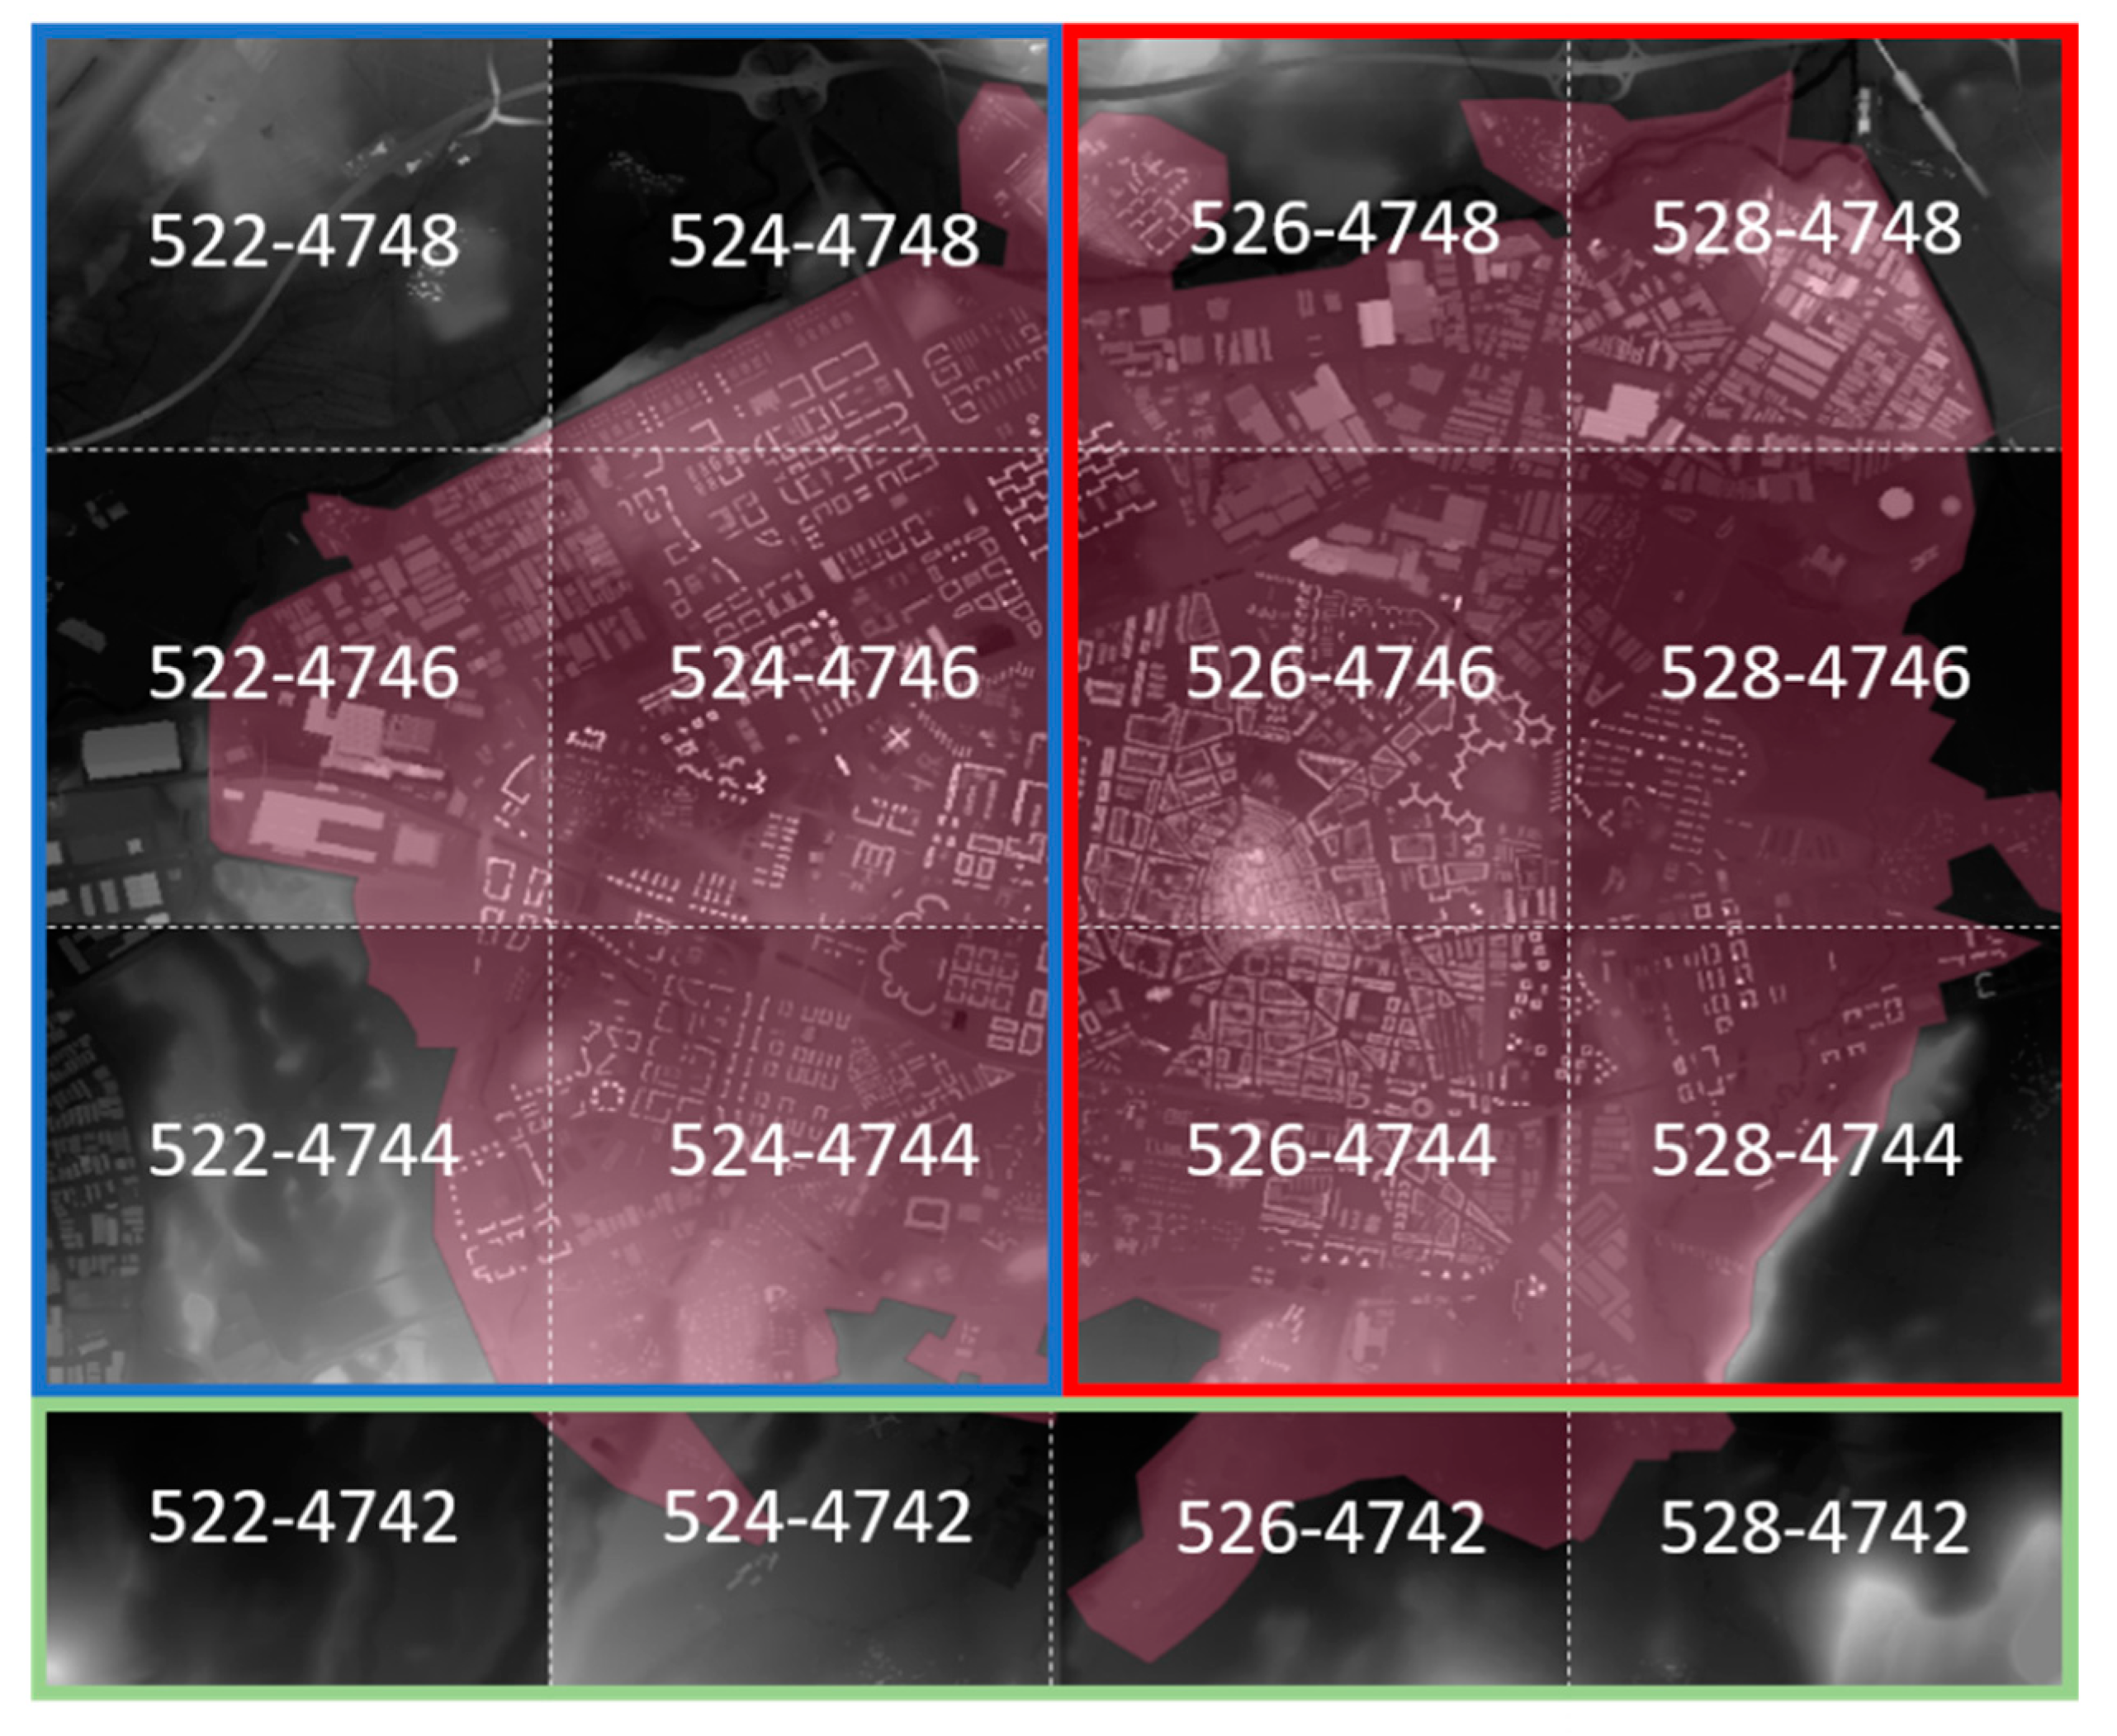
The selected area of study is the city of Vitoria-Gasteiz in Spain. Sixteen DSM LiDAR files were downloaded for this case study. We performed filtering with ground and buildings points in each file, as the quality of the LiDAR DSM data is sufficient. Three different sections that combine the DSM LiDAR files (as shown in
Figure 4) were defined for processing in the UMEP tool.
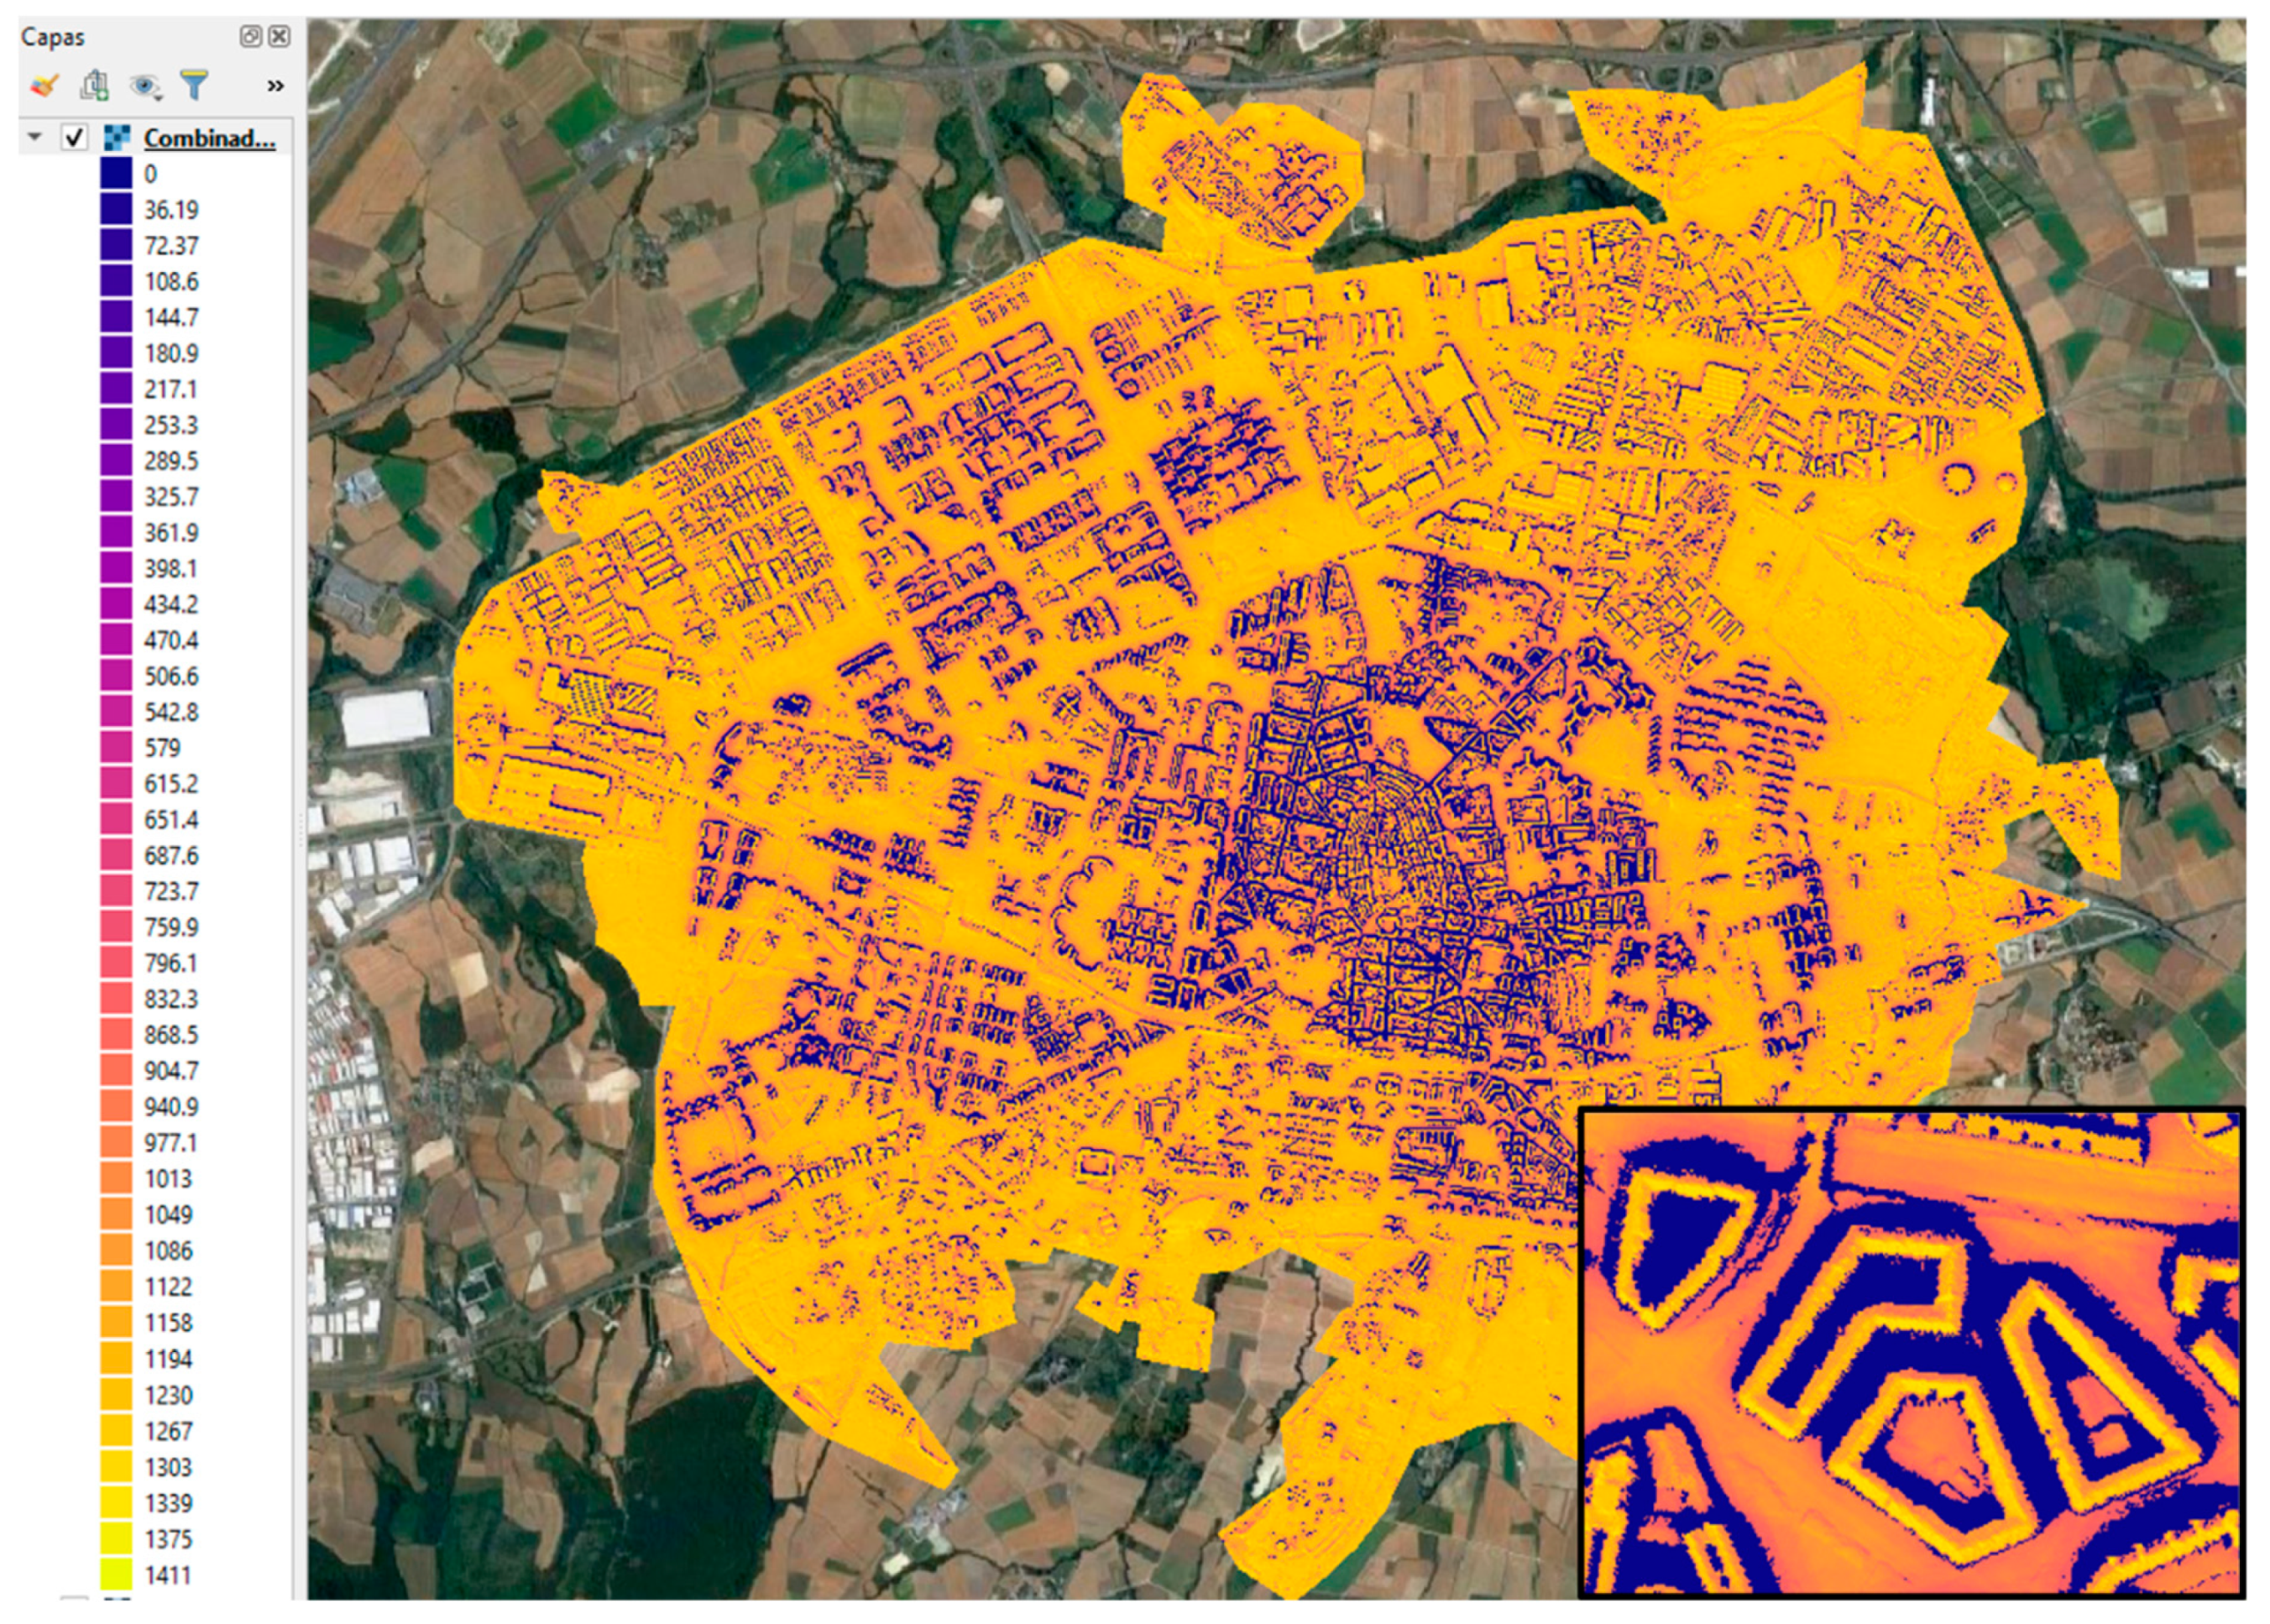
EnergyPlus weather data for Vitoria-Gasteiz was downloaded (Vitoria 080800). These data were processed to obtain UMEP meteorological weather files. The UMEP tool was employed for aspect and height calculations, and the SEBE tool was utilized once for each section, using the same weather file and configuration parameters. The resultant raster layer was combined with the city boundaries to obtain the solar radiation of the study area with a resolution of 1 square metre (refer to
Figure 5). The solar radiation map of Vitoria-Gasteiz presents the annual cumulative incident radiation per square meter for roofs in Kwh/m
2·year. The yellow values represent areas of maximum sun exposure, while the blue areas correspond to shadow areas within the city.
3.2. Urban 3D Model Generation
An urban 3D model was generated based on LiDAR (16 DSM and 12 DTM files) and cadastre data presented in
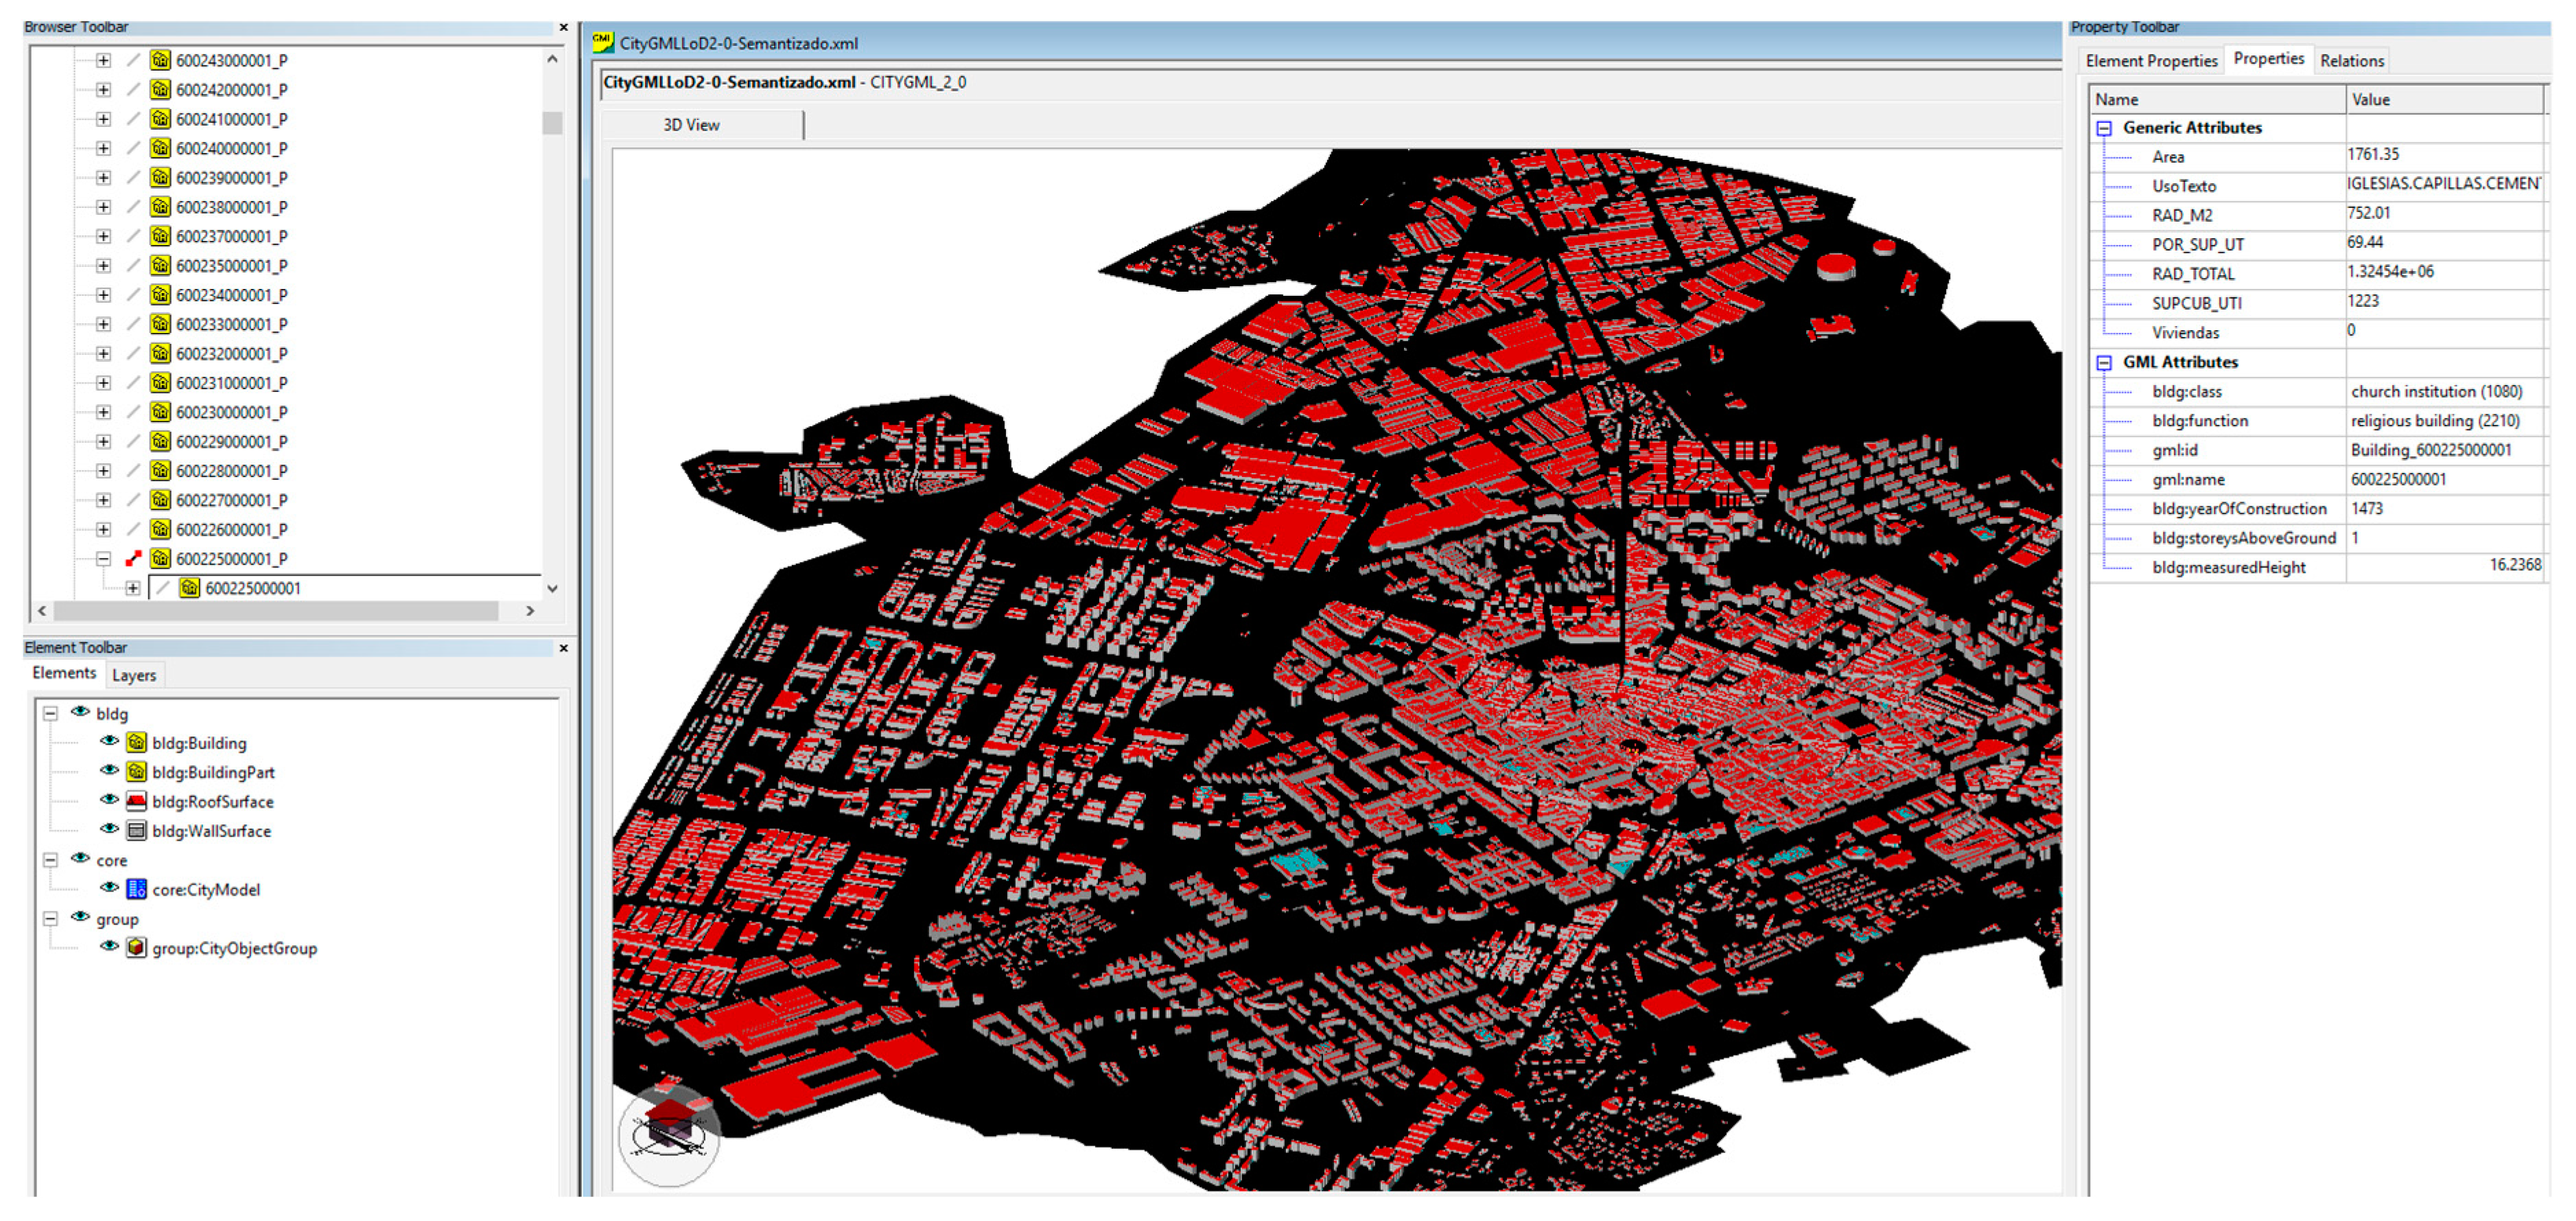
Table 2. The urban 3D model was semantized using previously calculated parameters on a building scale (refer to
Figure 6). As a result, the following parameters are included in each building in the urban 3D model: (1) gml_id, (2) citygml_measured_height, (3) citygml_measured_height_units, (4) citygml_class, (5) citygml_year_of_construction, (6) citygml_storeys_above_ground, (7) area, (8) rad_total, (9) por_sup_ut, (10) supcub_uti, and (11) rad_m2.
3.3. 3D Web Visualization Tool
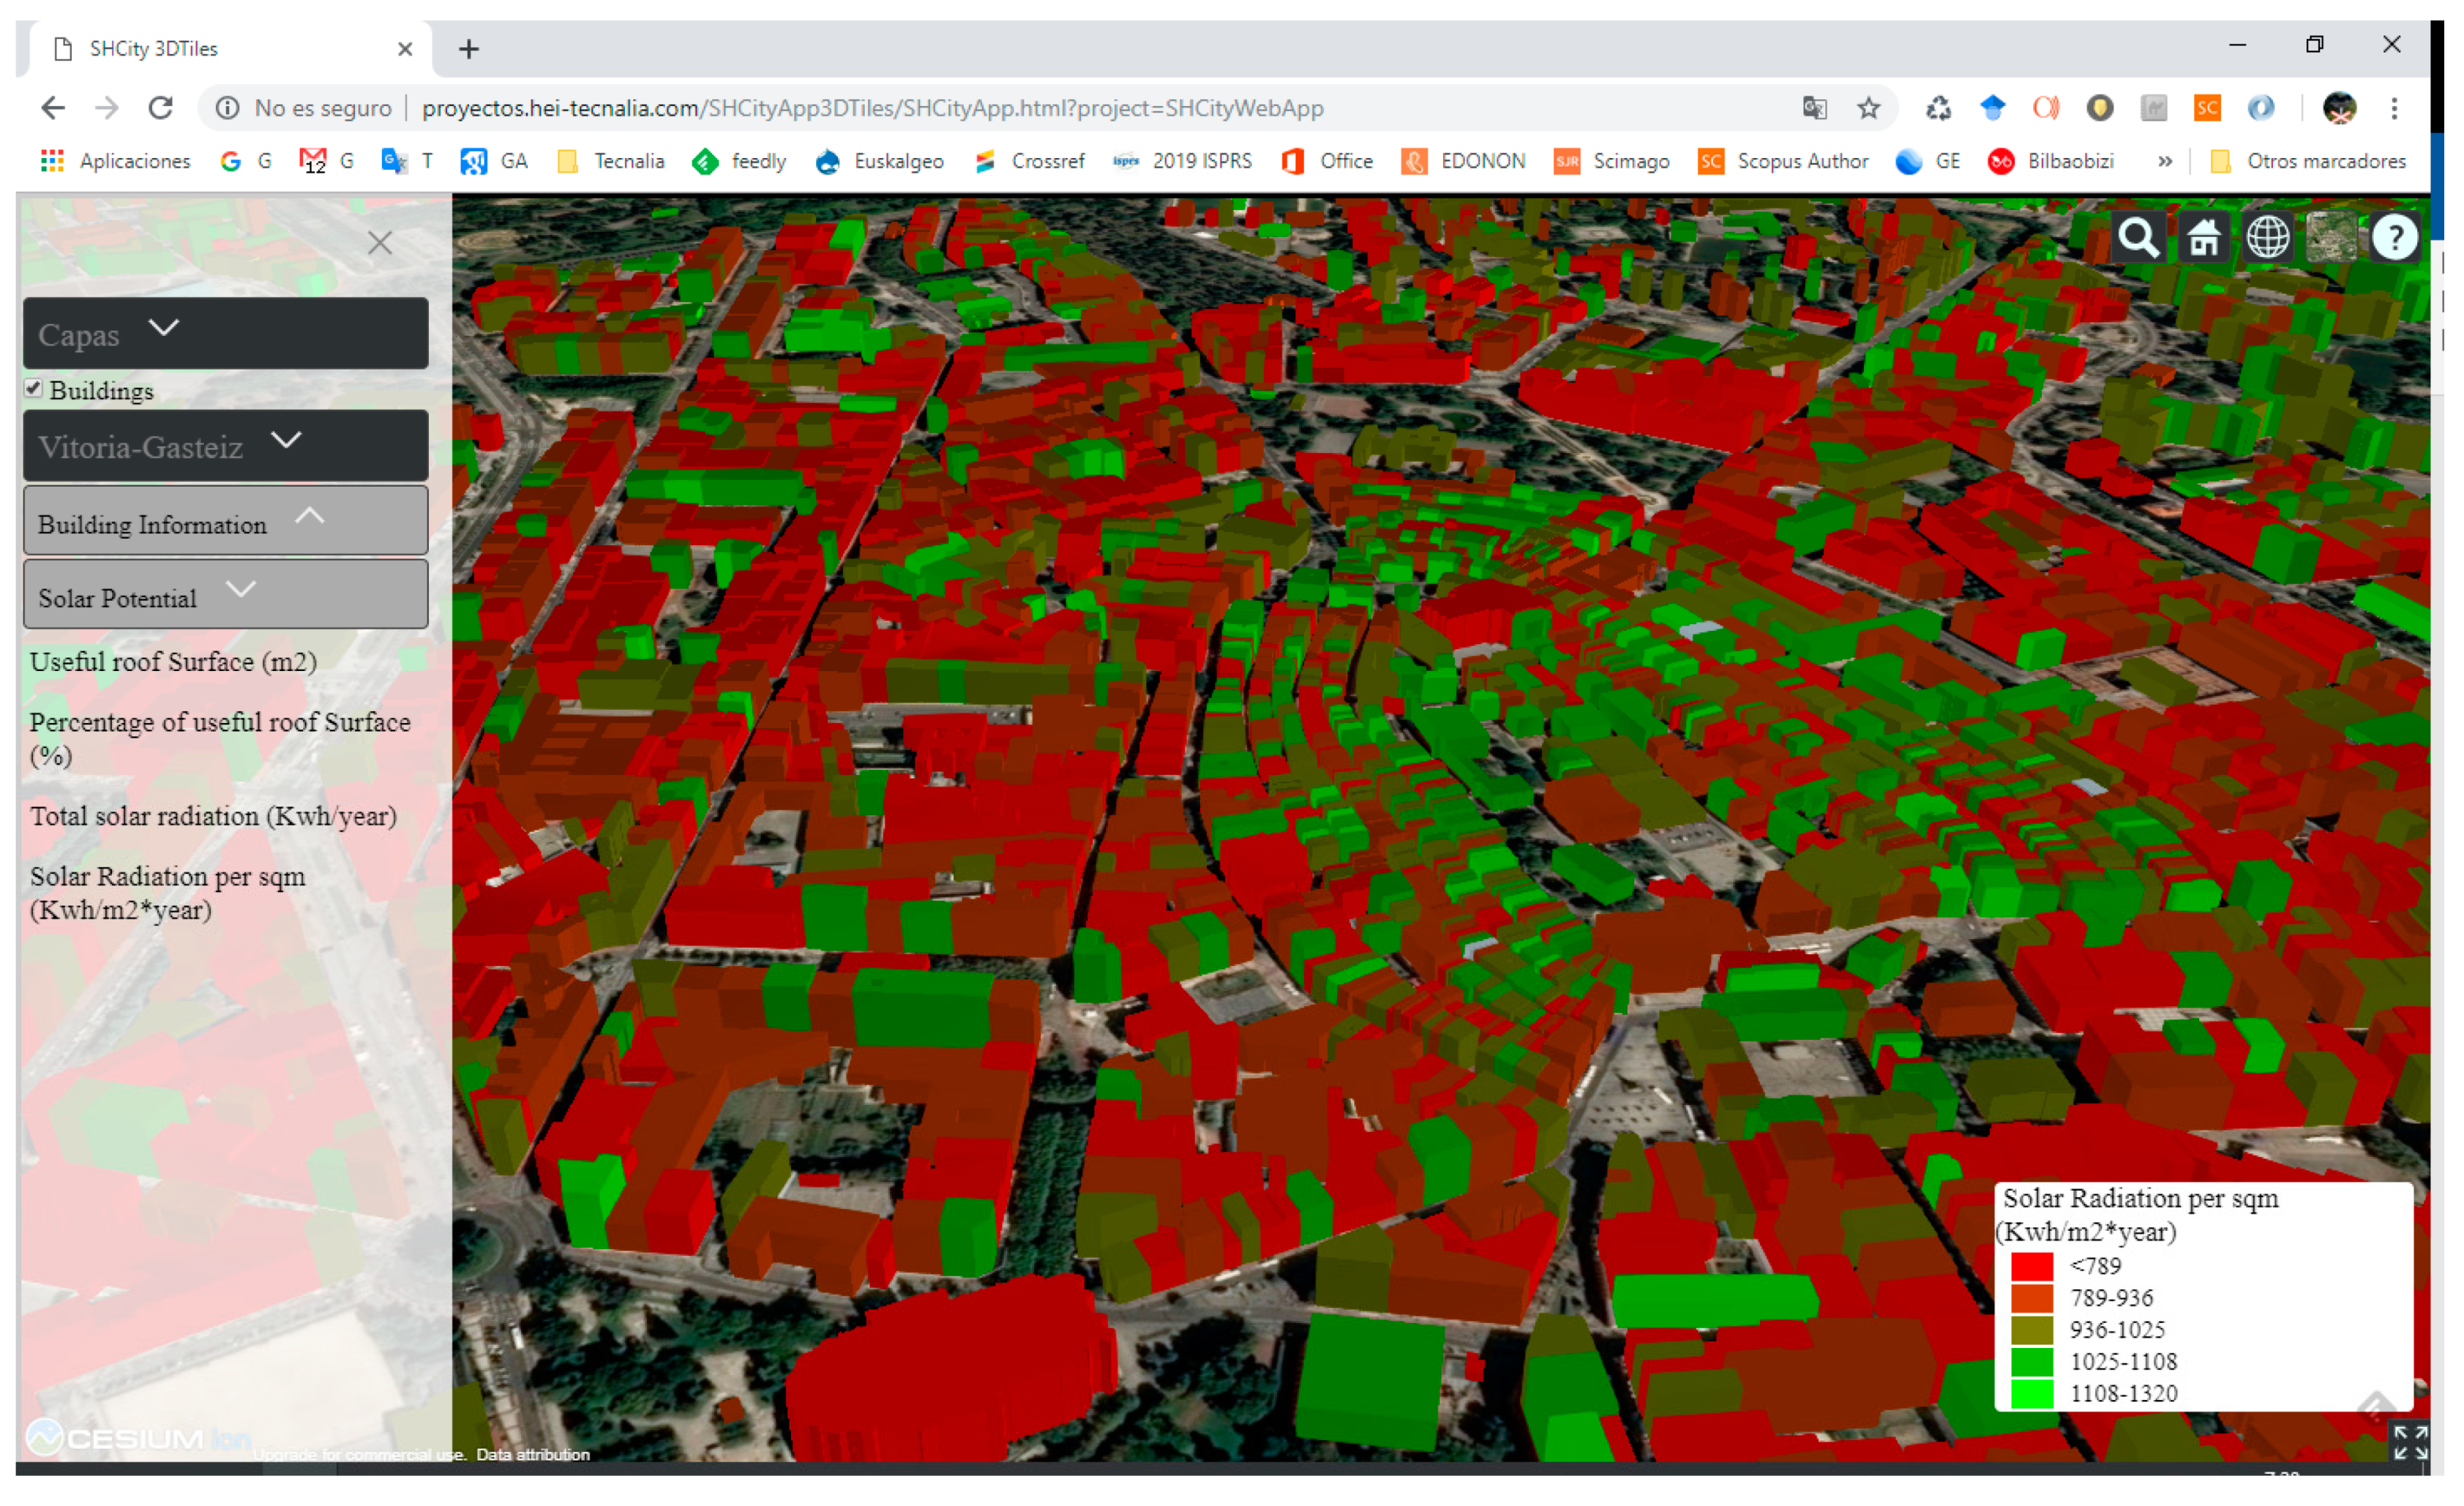
The 3D web visualization tool integrates a 3D viewer that facilitates the identification and location of buildings in the municipality. For this visualization, the previously generated 3D model is employed. Navigation and interaction are intuitive, as demonstrated in Google Earth, via a 3D map visualization Cesium library. A typological analysis is performed by filters and the combination of several predetermined filters. The visualization of the results is presented through colored maps and statistical data of the results of each type.
The urban 3D model enables a precise and standardized way for the main characteristics of the buildings. The representation of the values of the calculated indicators can be displayed by the 3D viewer for the elements of the model in the study area (refer to
Figure 7).
4. Discussion
In this section, we discuss the rationale for some of the main decisions made to develop the proposal in this paper.
First, an approach to the solar potential analysis on an urban scale is presented. To calculate the solar potential, we have presented three data input alternatives: DSM with ground buildings; DSM of the building and DTM of the remainder; and DTM + adding height to buildings. The premise is to adapt to different area studies, which usually have different data available. After the analysis of the solar potential in multiple different places, we identified the necessity of systematization in the LiDAR data preparation process to achieve uniformity in the quality and precision.
The results of the study for the city of Vitoria-Gasteiz present values that are similar to the figures offered by the main sources of local and national meteorological data (Basque energy entity—EVE, Spanish National Institute of Meteorology–AEMET). These sources establish the solar radiation incident on the roofs in the city of Vitoria-Gasteiz for a horizontal surface that does not have shadows is 1.390 Kwh/m
2·year, as indicated in the report [
19]. This value is very similar to the maximum values obtained using the method proposed in this study.
Second, a 3D city model that is based on the CityGML standard was developed and semantized with all data available on the building level. As a result, a CityGML model is obtained by combining data from different data sources, such as cadastre or solar potential. This model can be subsequently employed as the data layer in different applications, which can involve different agents in the field of municipalities or architects.
As a final advantage of our proposal, previous work (solar potential analysis and the CityGML model) was gathered in a 3D web visualization tool that enables the visualization of the solar potential of each building on the city level.
This research has future limitations that need to be addressed. Adapting the workflow when performing solar potential analysis on large scales (territory). Whether solar potential analysis data can be mapped with existing CityGML ADE, such as CityGML Energy ADE or Solar ADE, should be analyzed.
5. Conclusions
This paper describes the methodology that was followed to perform an analysis of the solar potential-based on LiDAR and the visualization of the results in a 3D web visualization tool. The proposed method is systematic, easily replicable, and based on high-resolution open-data sources and non-commercial software. The results offer high precision and take into account the 3D geometry of buildings, including roof orientation, slope, and the surroundings’ orography.
The development of 3D city models that are based on the OGC CityGML standard enables city and building levels to be integrated within a single model that includes both semantic information and geometric information. This model can be used to support multiple applications that different agents, such as urban planners, managers, and citizens, may employ.
The described 3D web visualization tool recognizes the solar potential of each building in the city in a quick, visual, and intuitive way. In addition, the 3D web tool helps to geographically analyze the behaviors of buildings.
The workflow was validated in the city of Vitoria-Gasteiz in Spain. A solar potential analysis was performed, and the urban 3D model was generated and semantized with solar potential data. All gathered data were presented and can be filtered/selected in a 3D web visualization tool.
The results presented in this paper contribute several possibilities for future work. First, the solar potential analysis can be replicated in other municipalities, following the described workflow. Furthermore, the visualization of the results in a 3D web visualization tool eases the interpretation of the data on an urban scale and further information retrieval and analysis.
