On C-Band Quad-Polarized Synthetic Aperture Radar Properties of Ocean Surface Currents

 ,
,  ,
, 
Abstract

1. Introduction
2. Data and Model Approach
2.1. Data
2.2. Model Approach
3. Scattering Signatures
3.1. Atmospheric Gravity Waves
3.2. Oceanic Internal Waves
3.3. SST Fronts
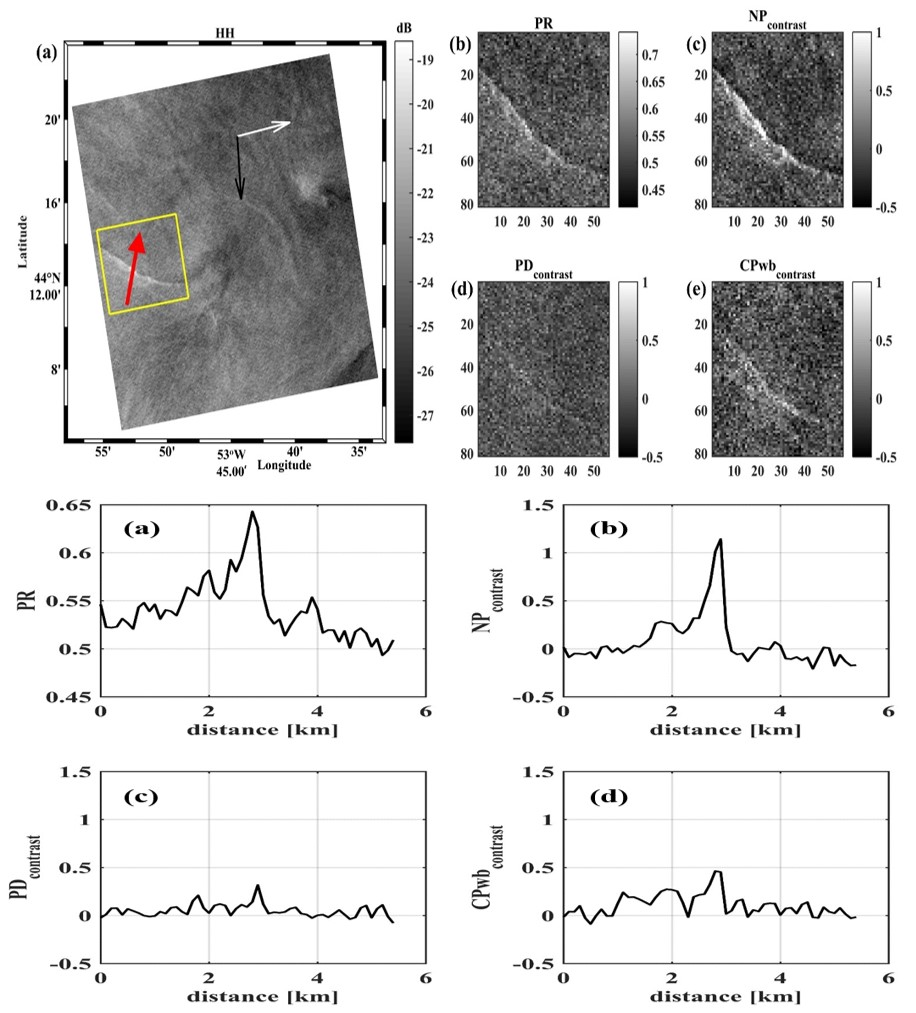
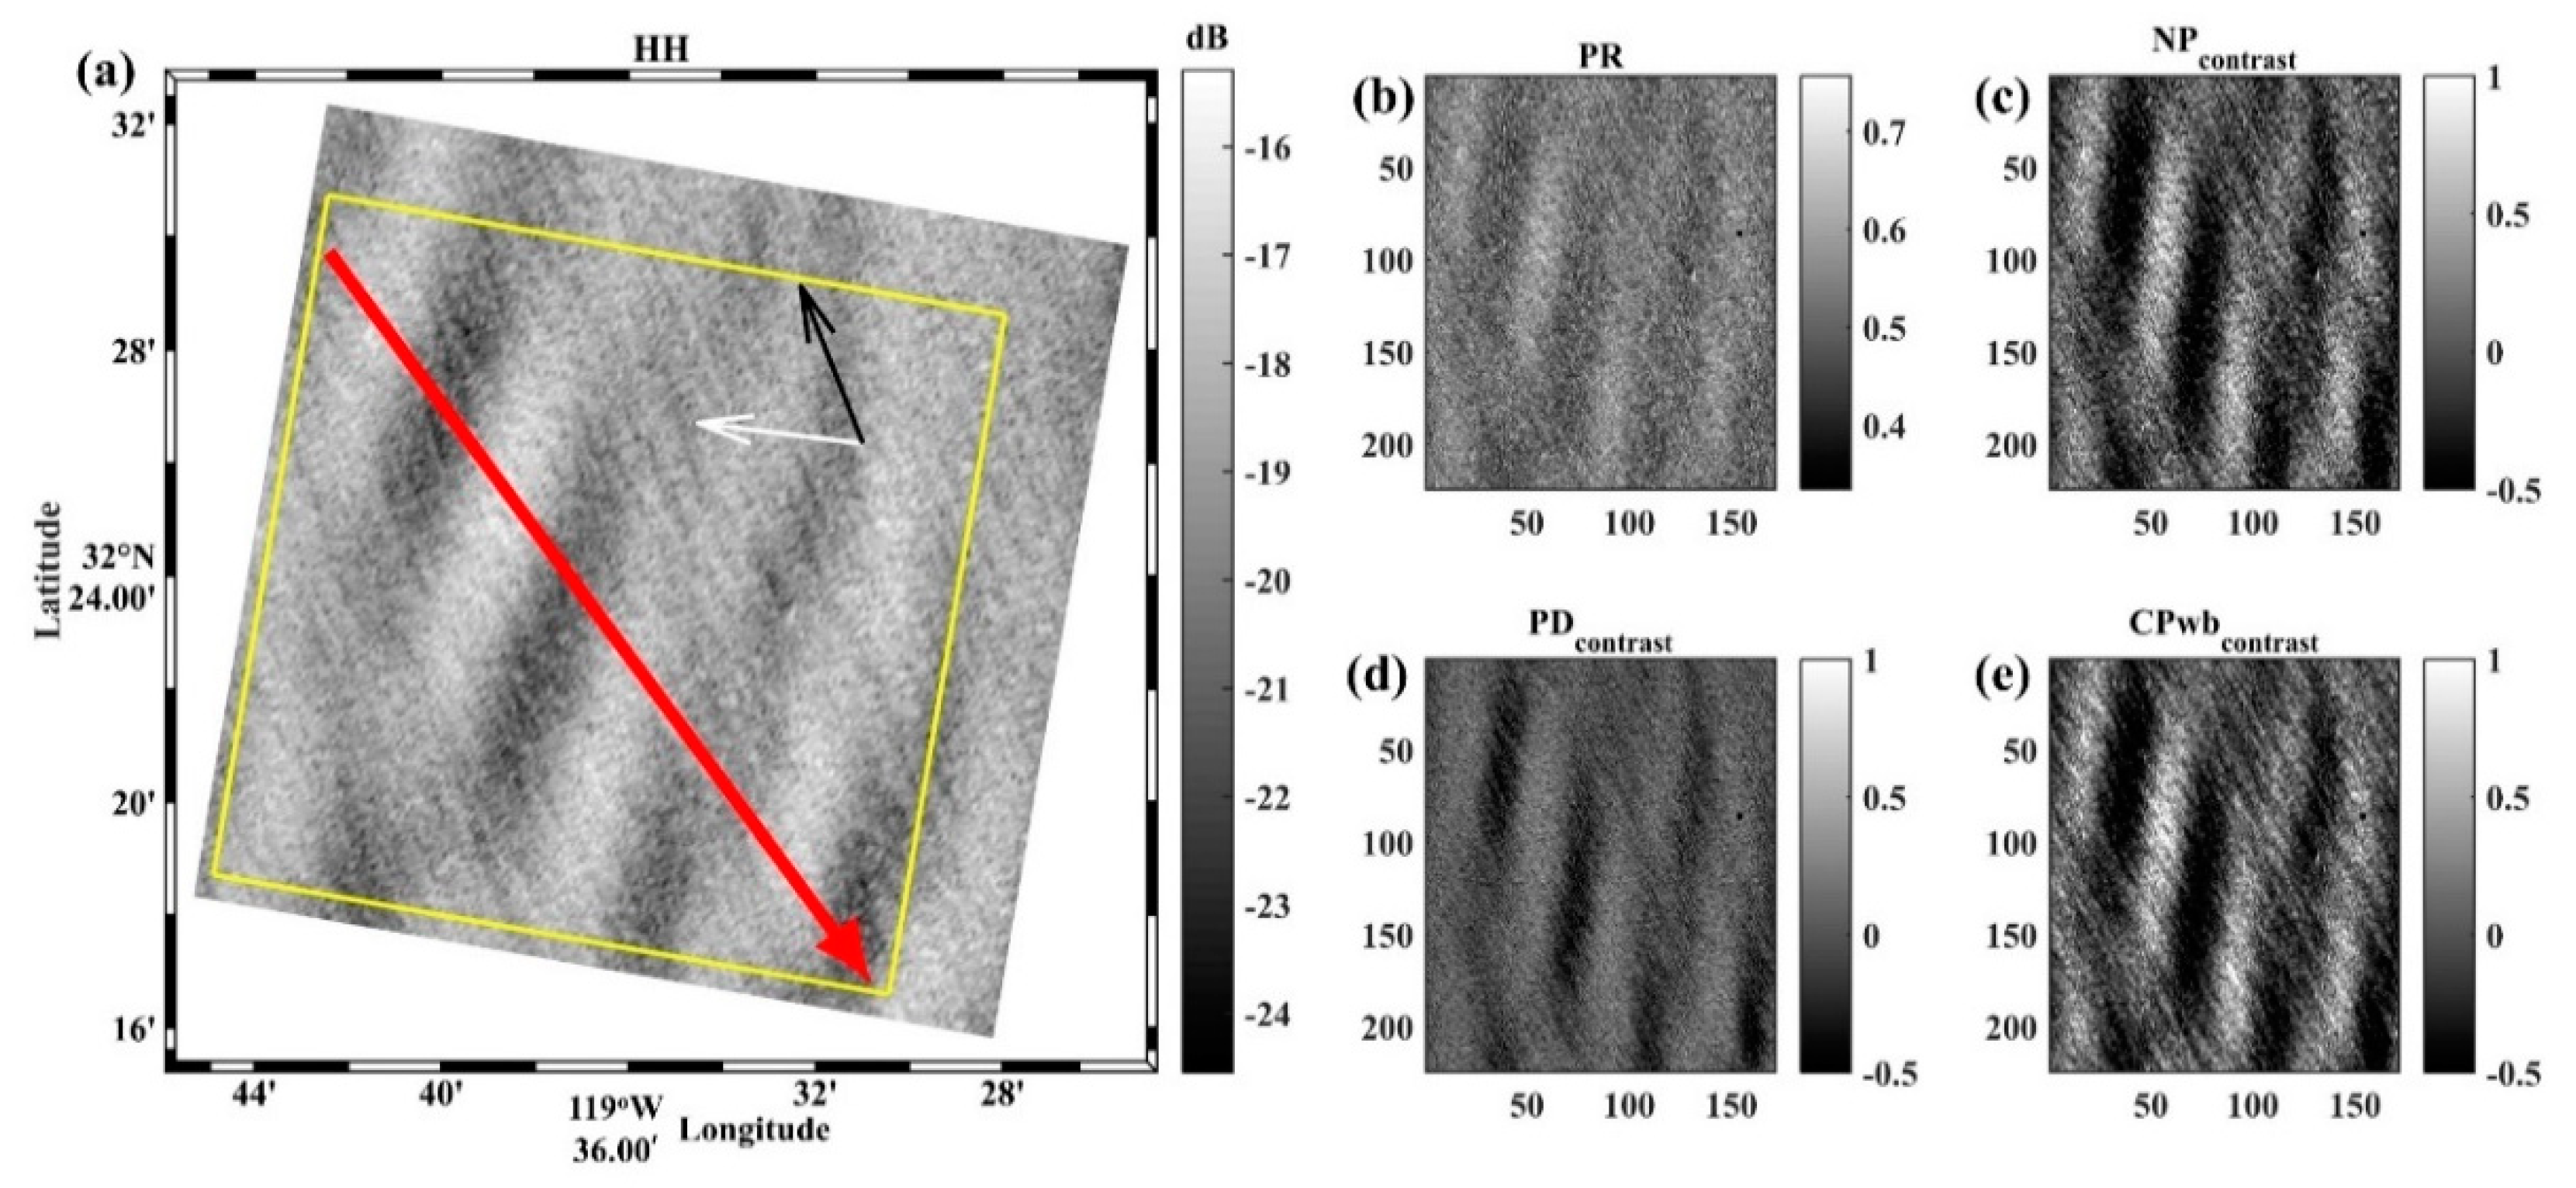
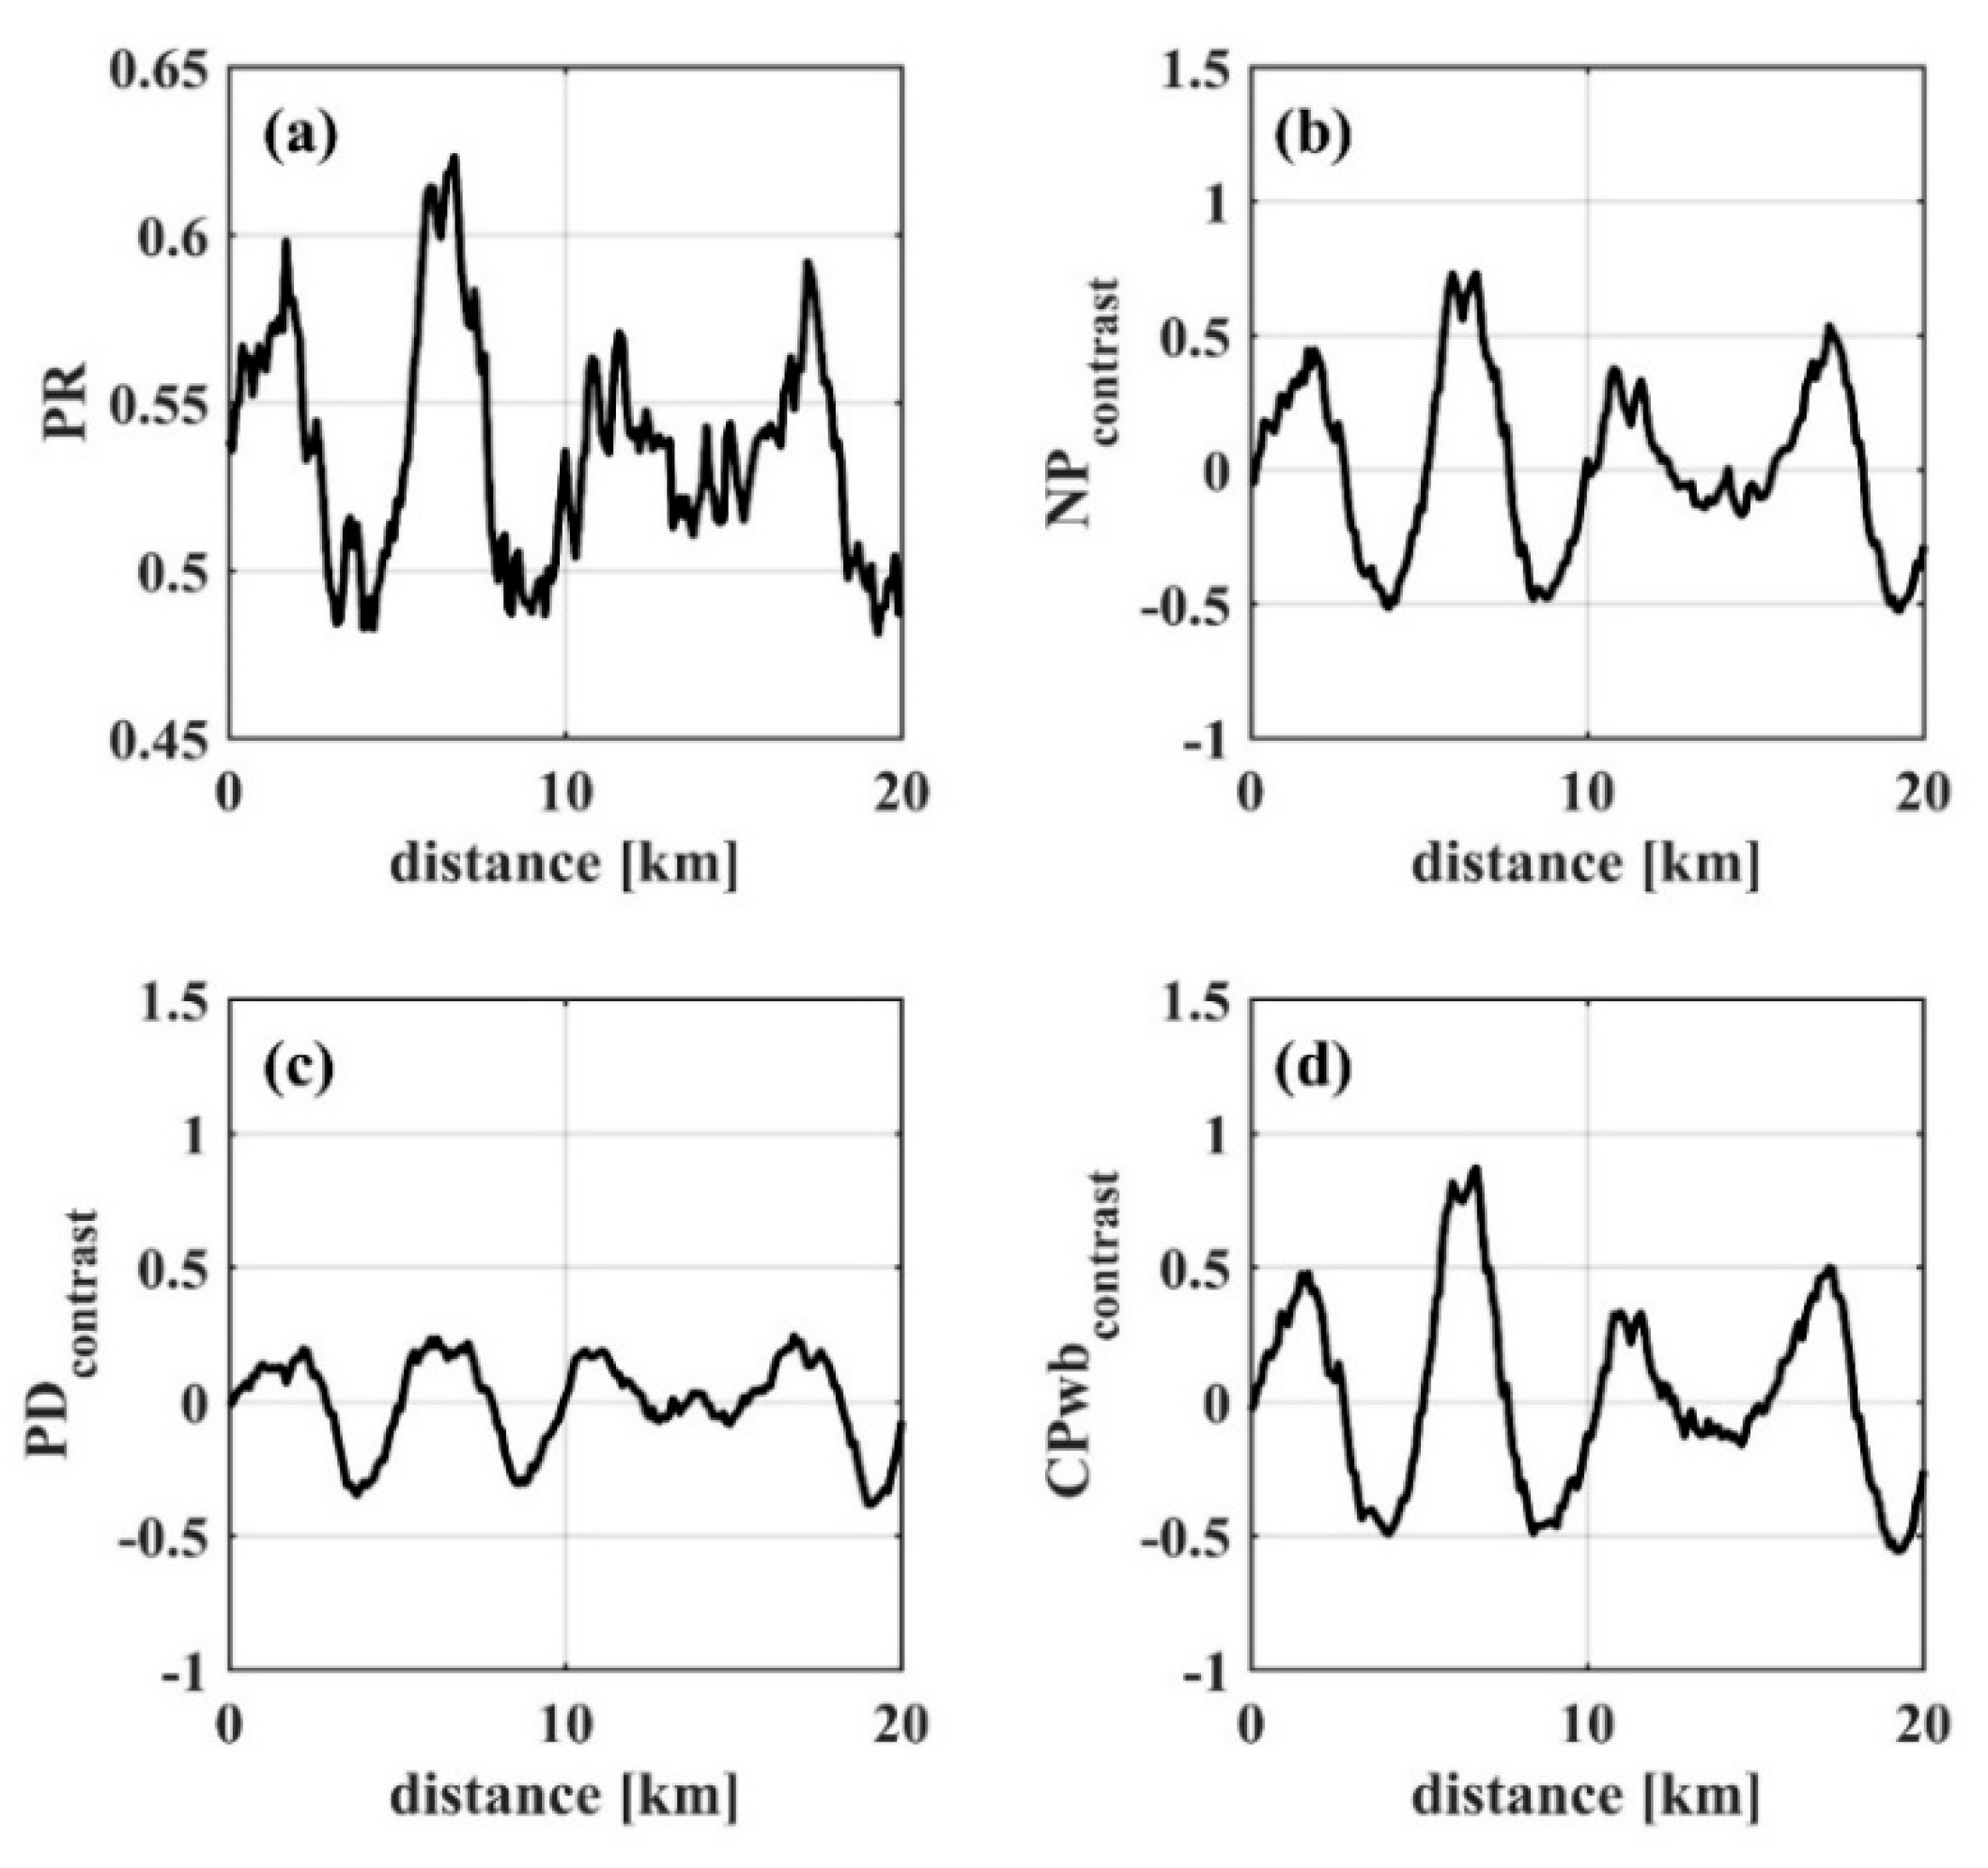
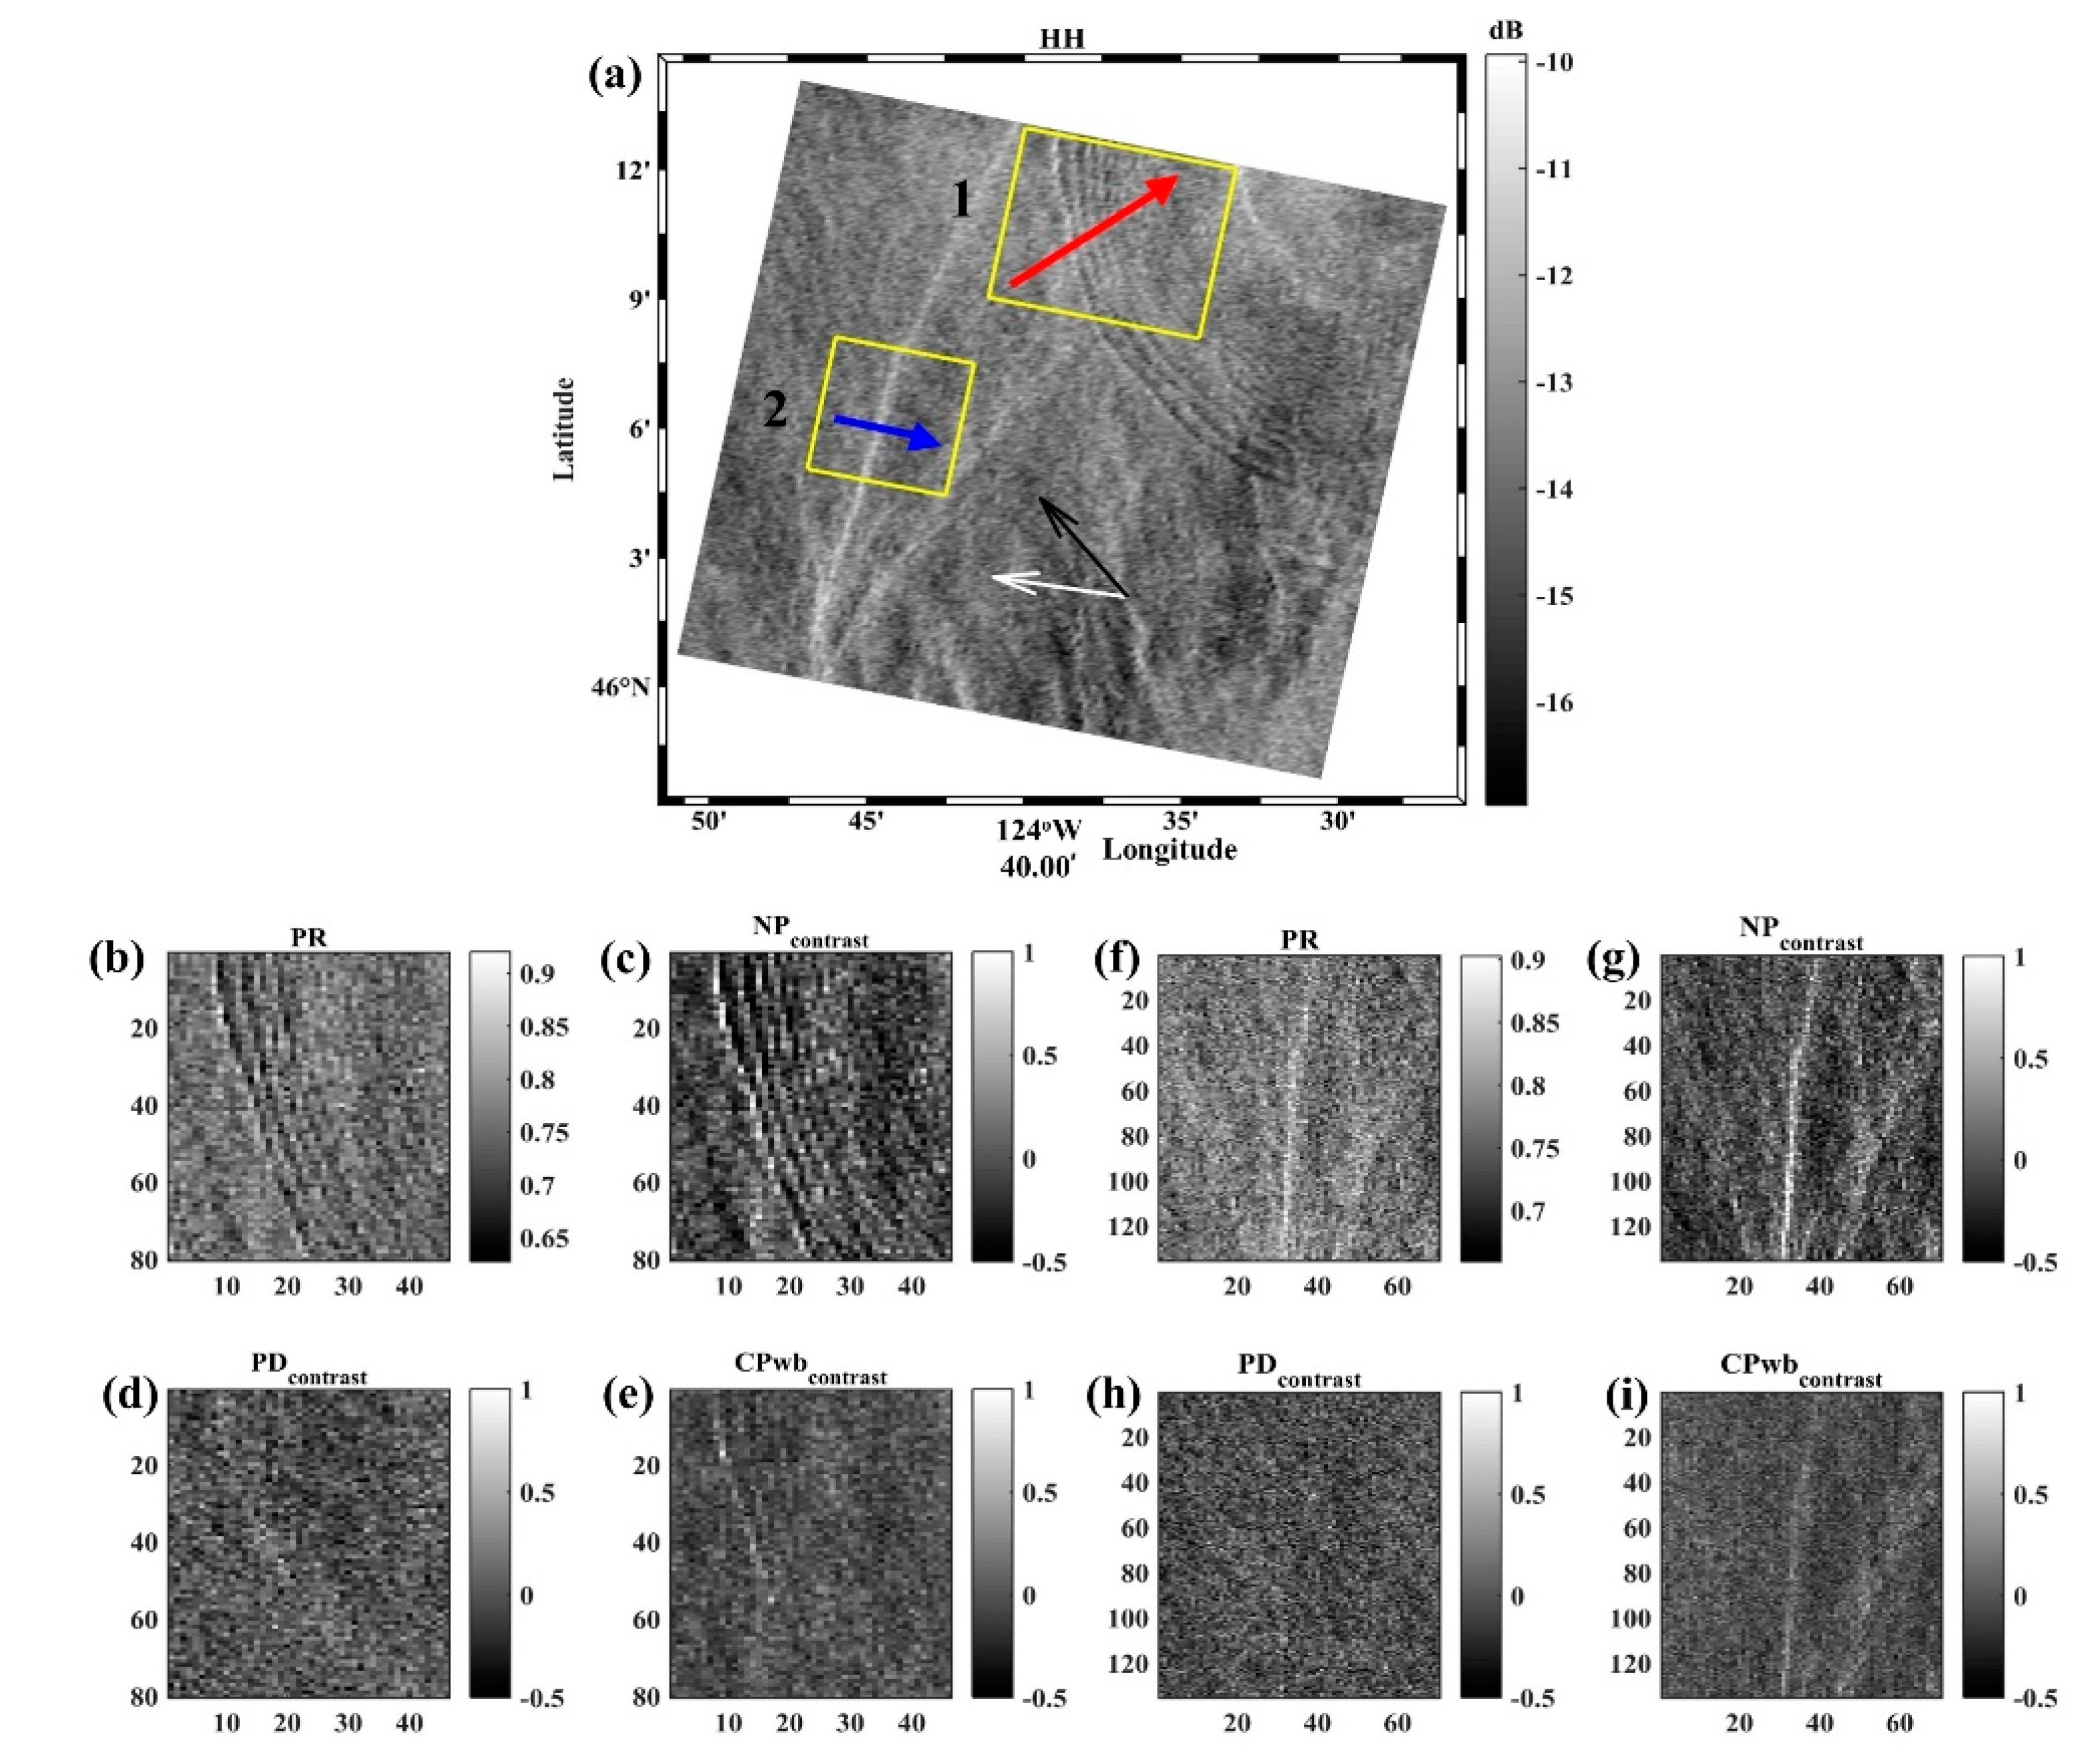
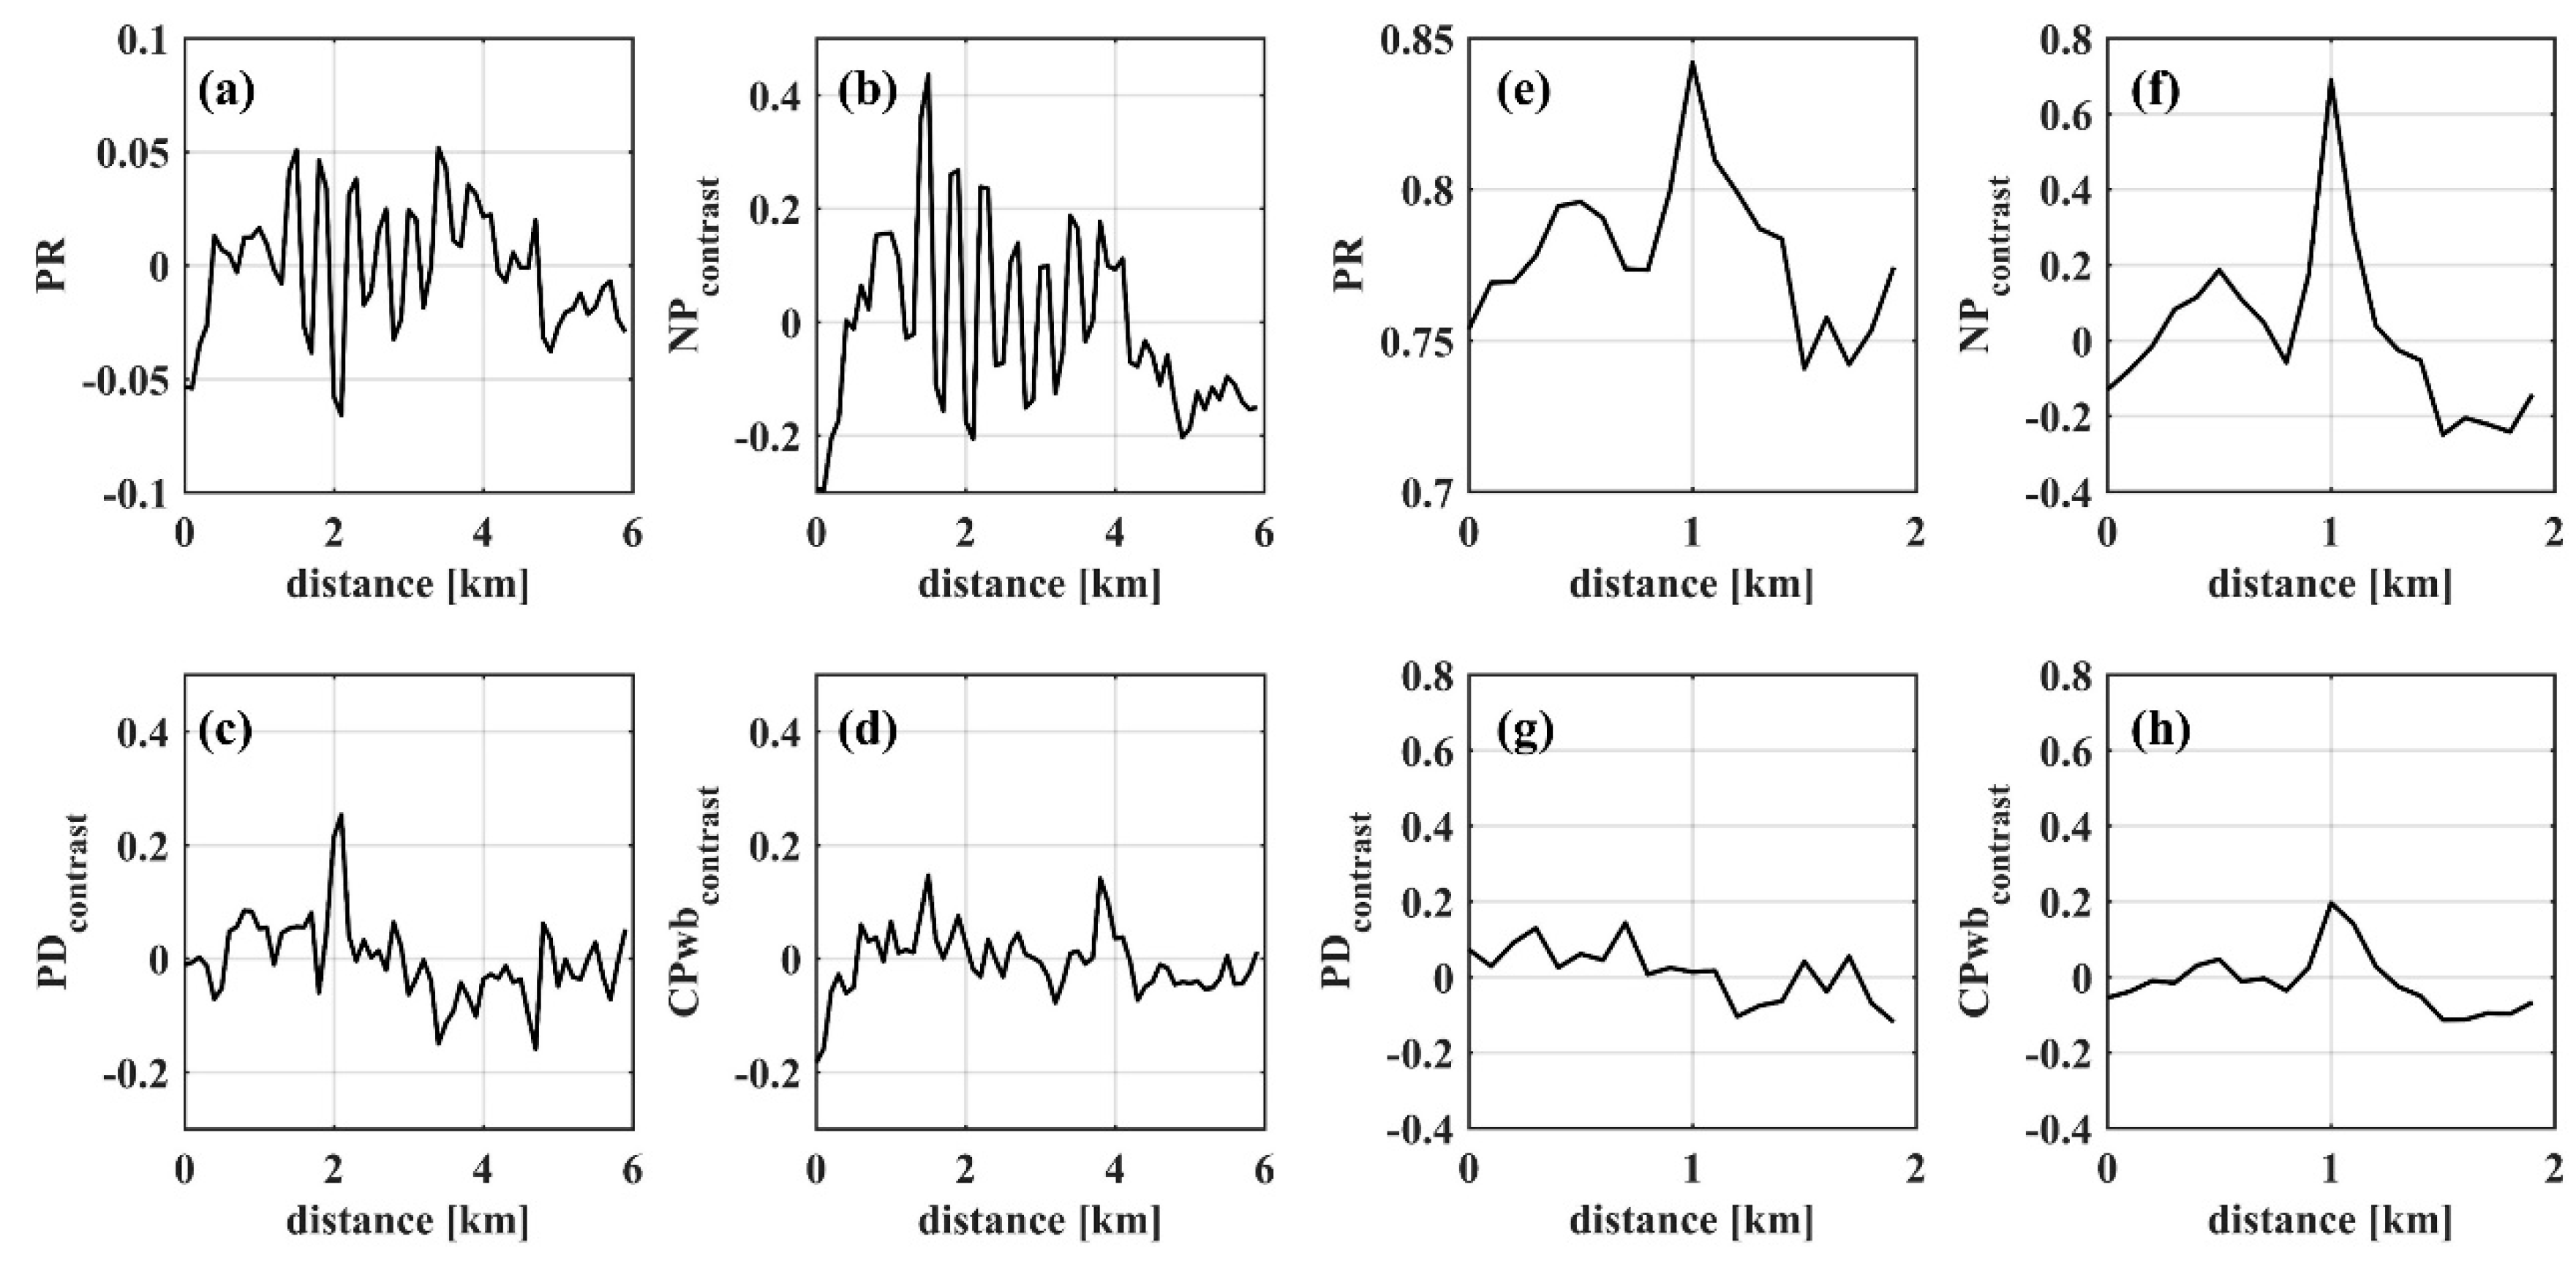
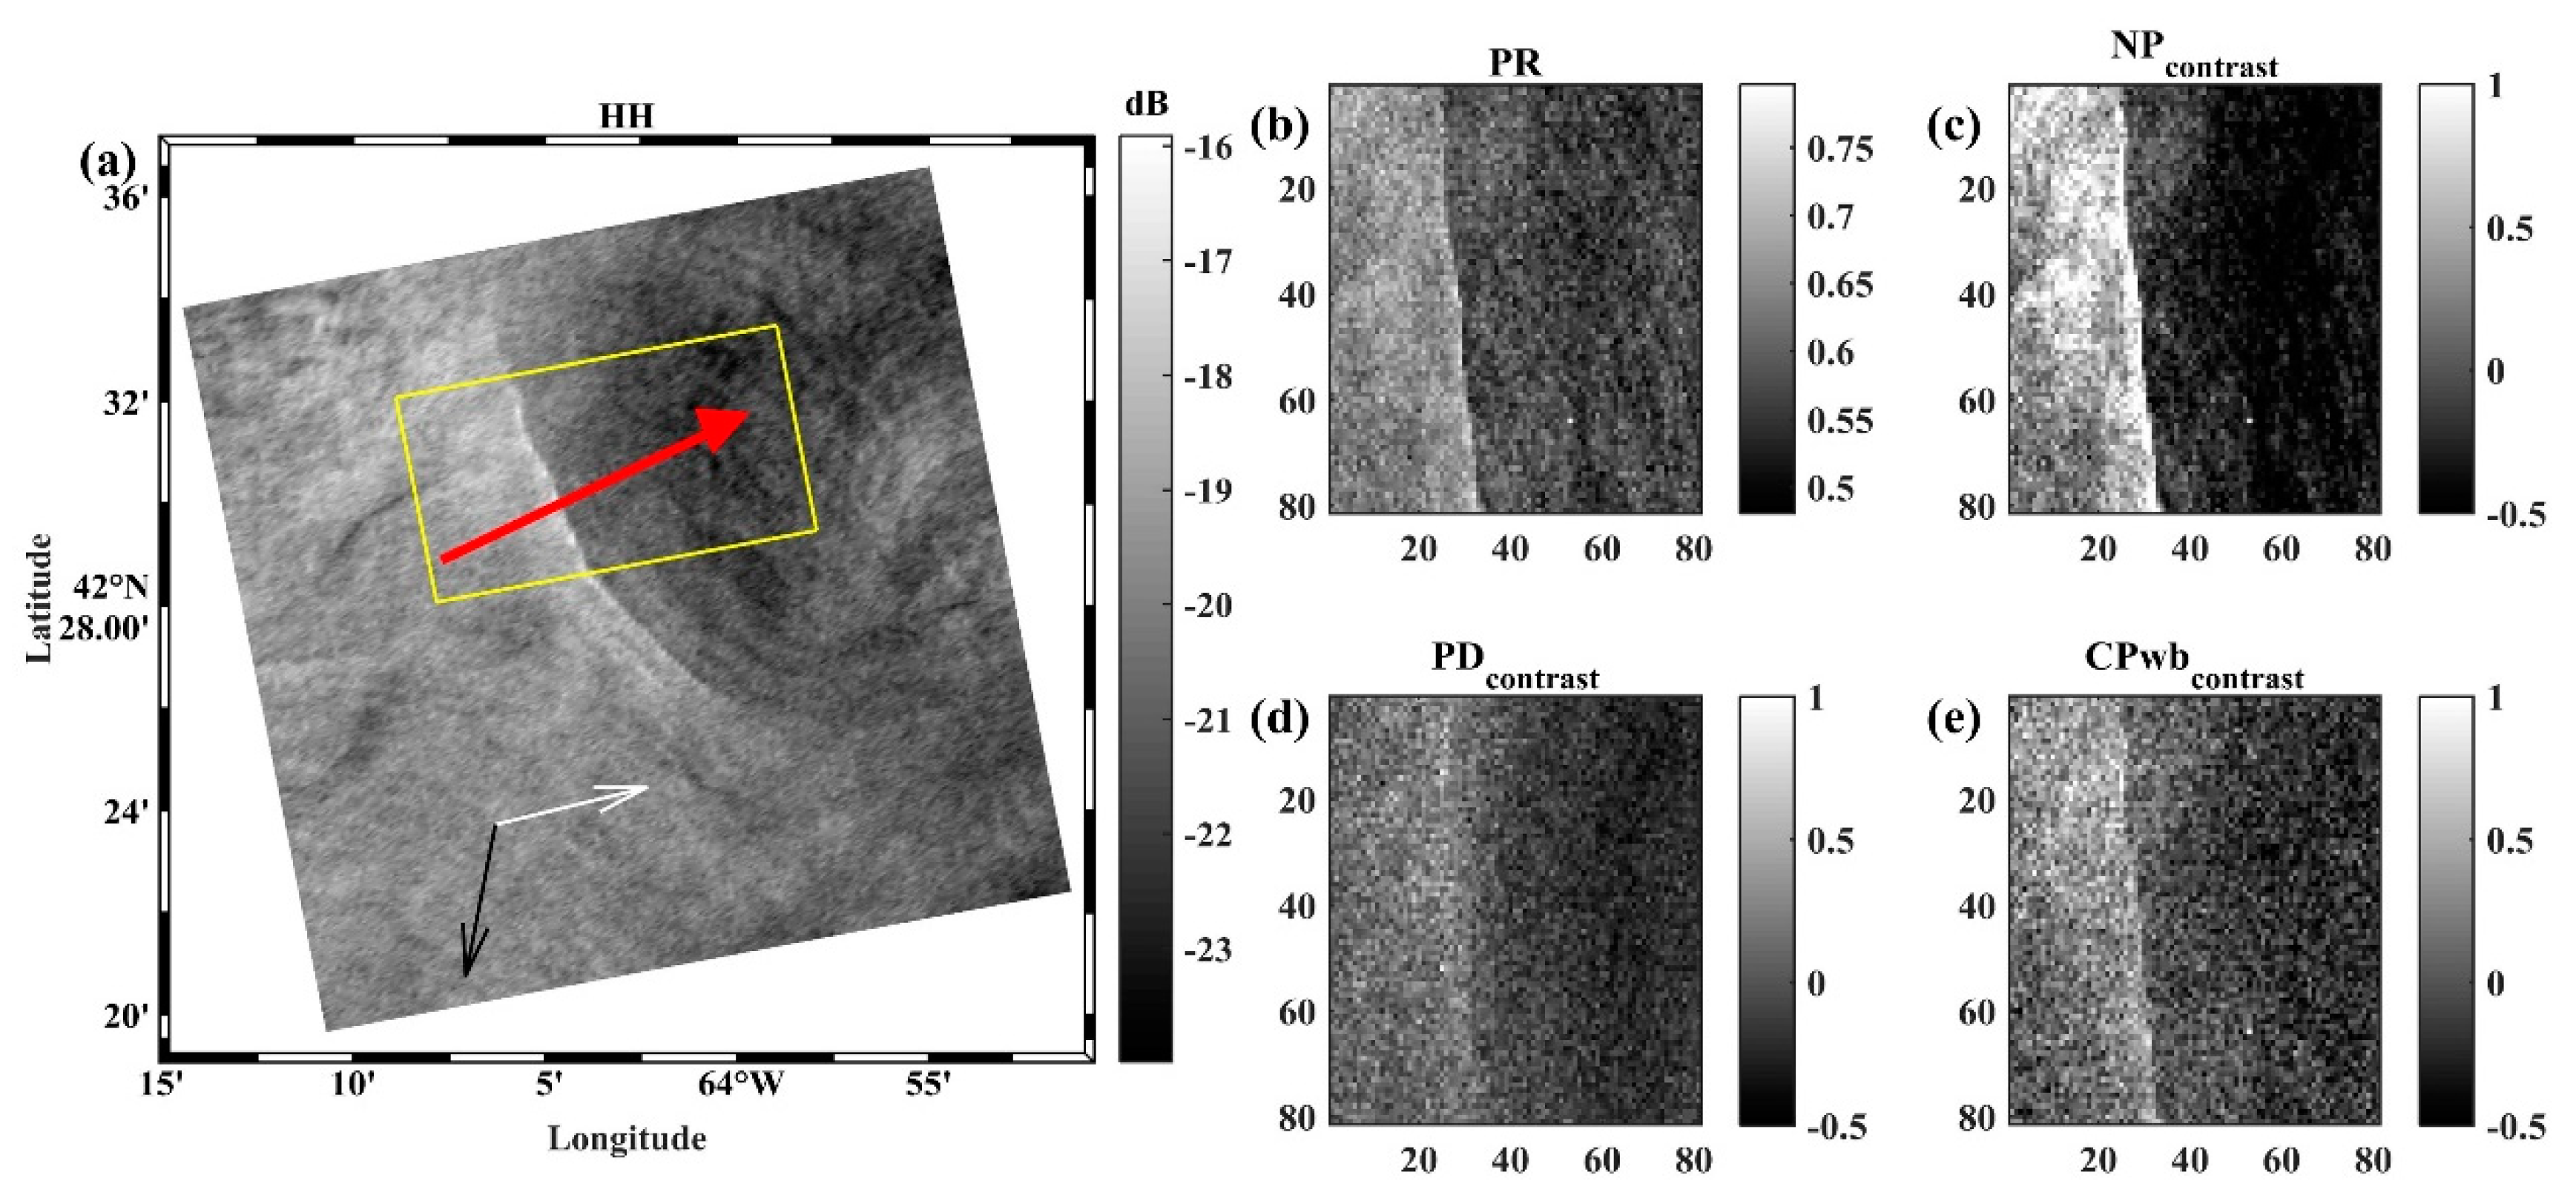
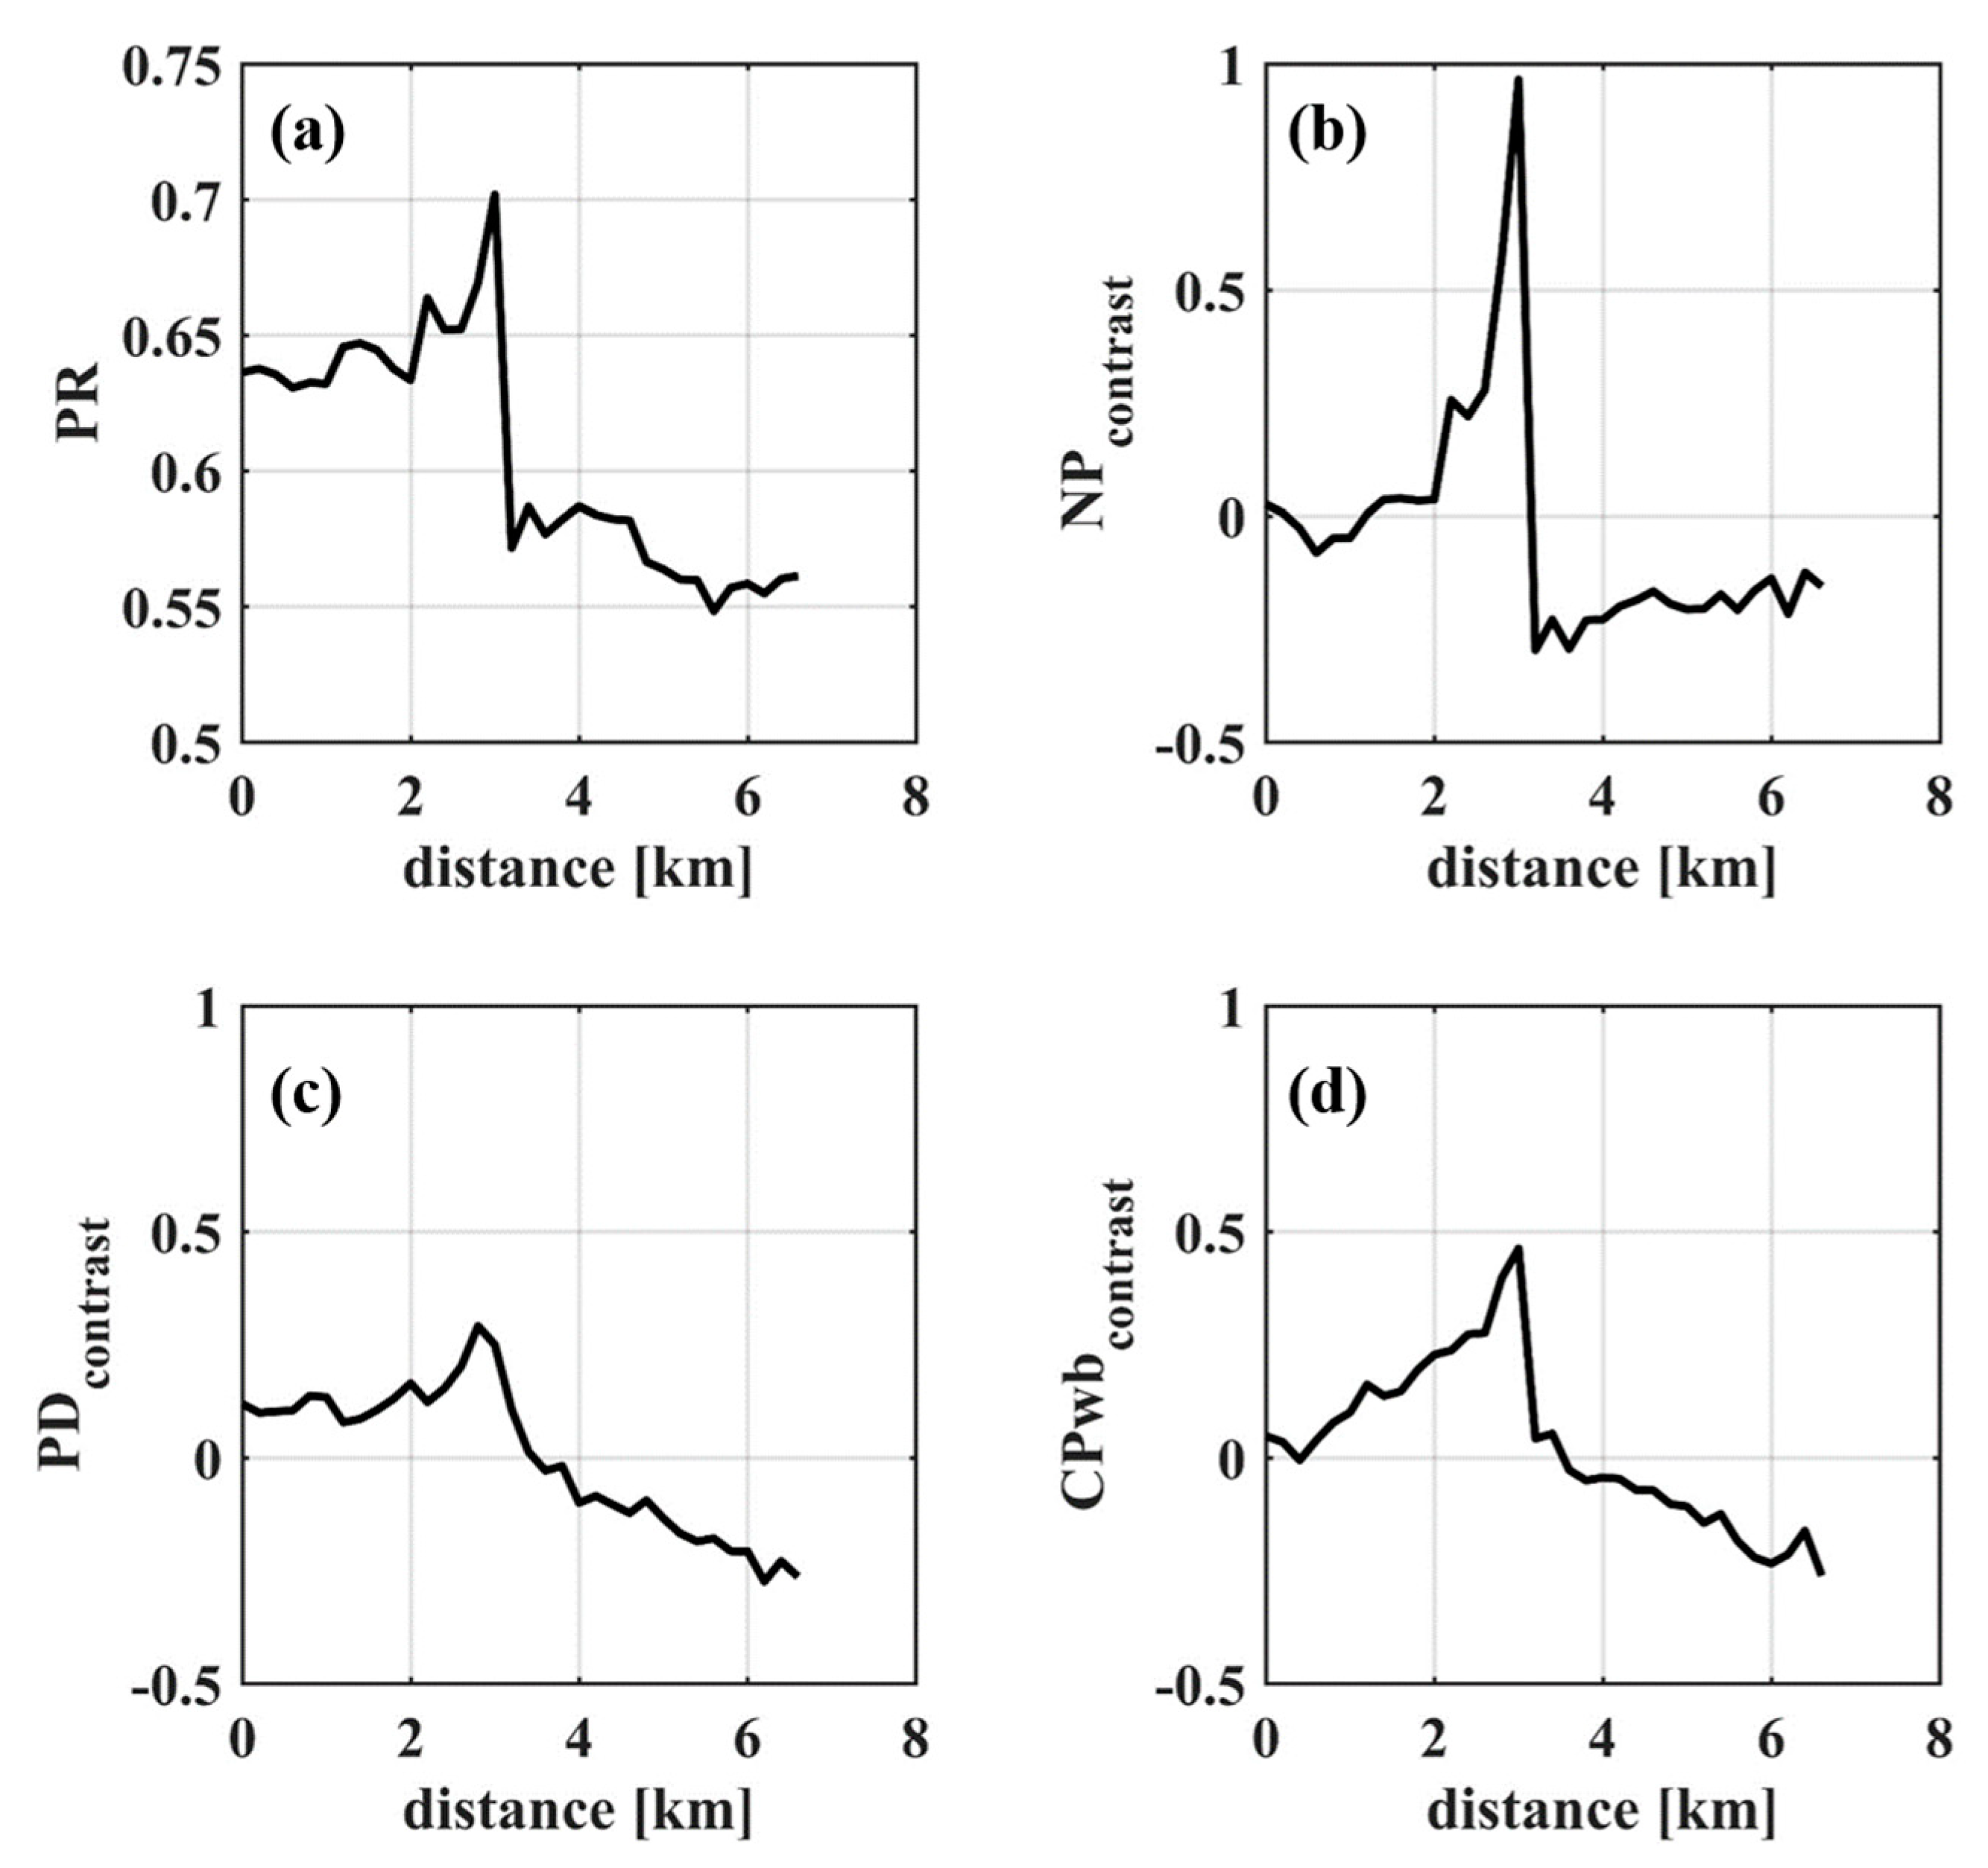
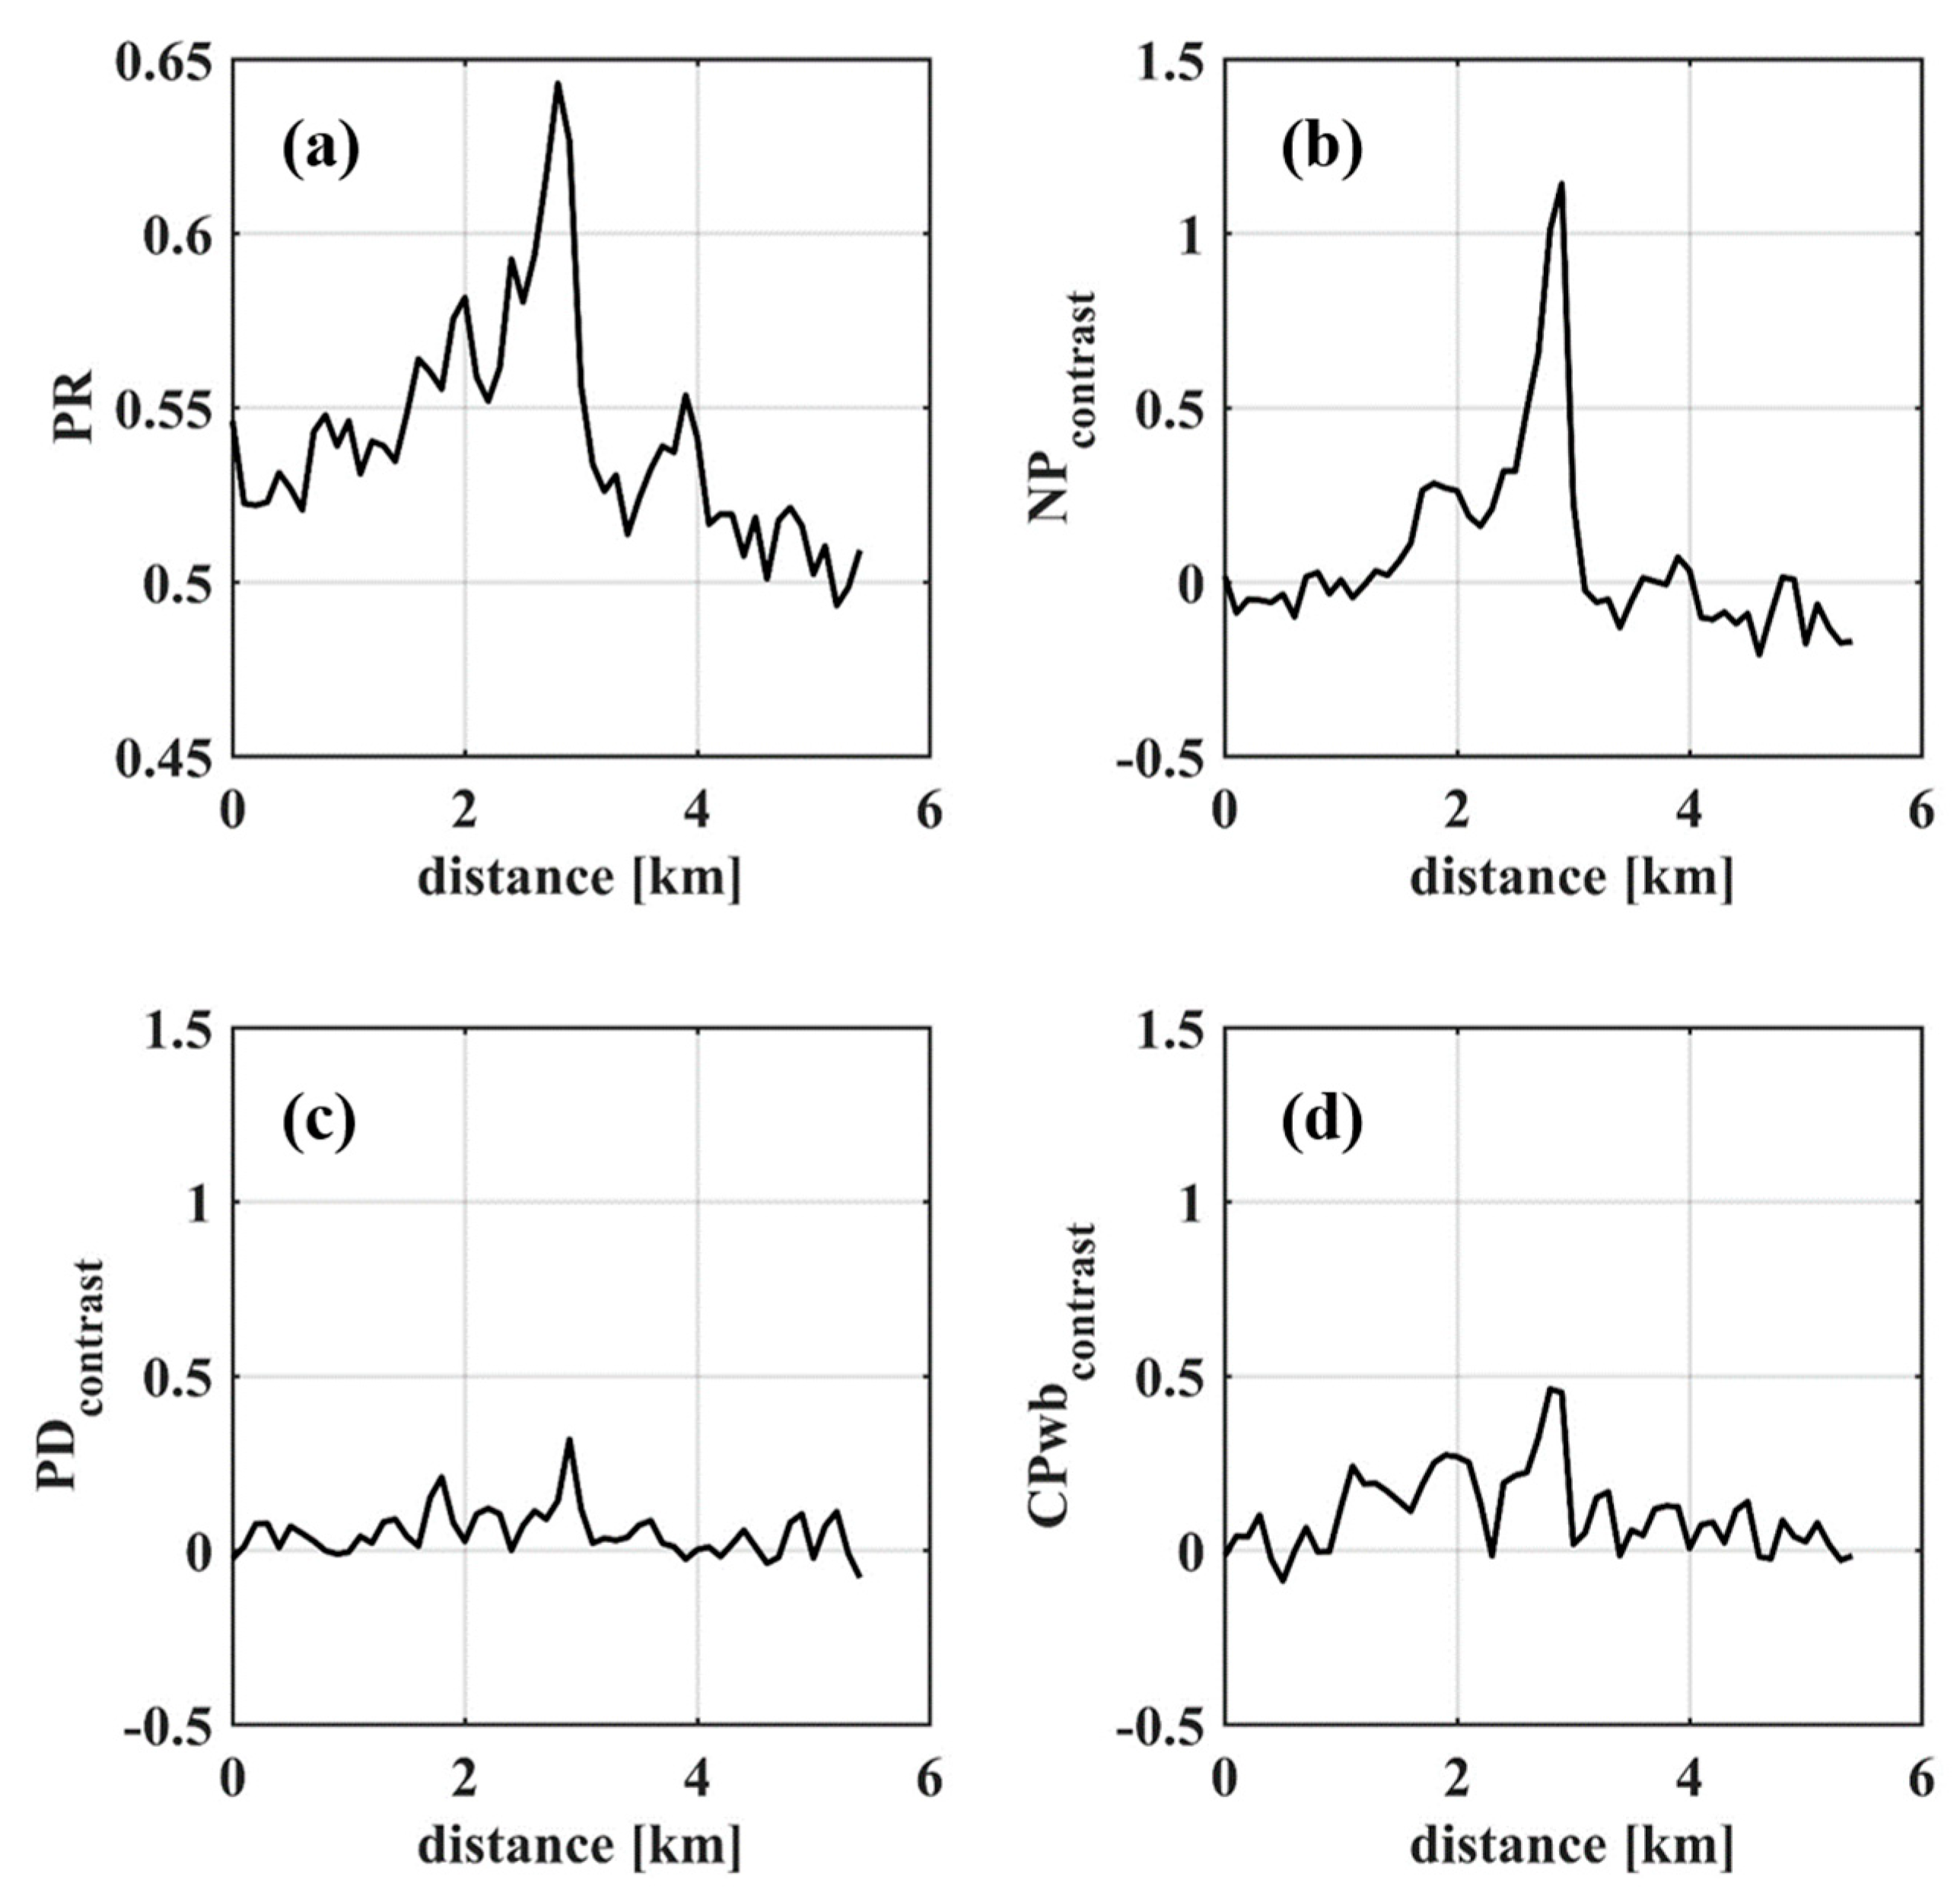
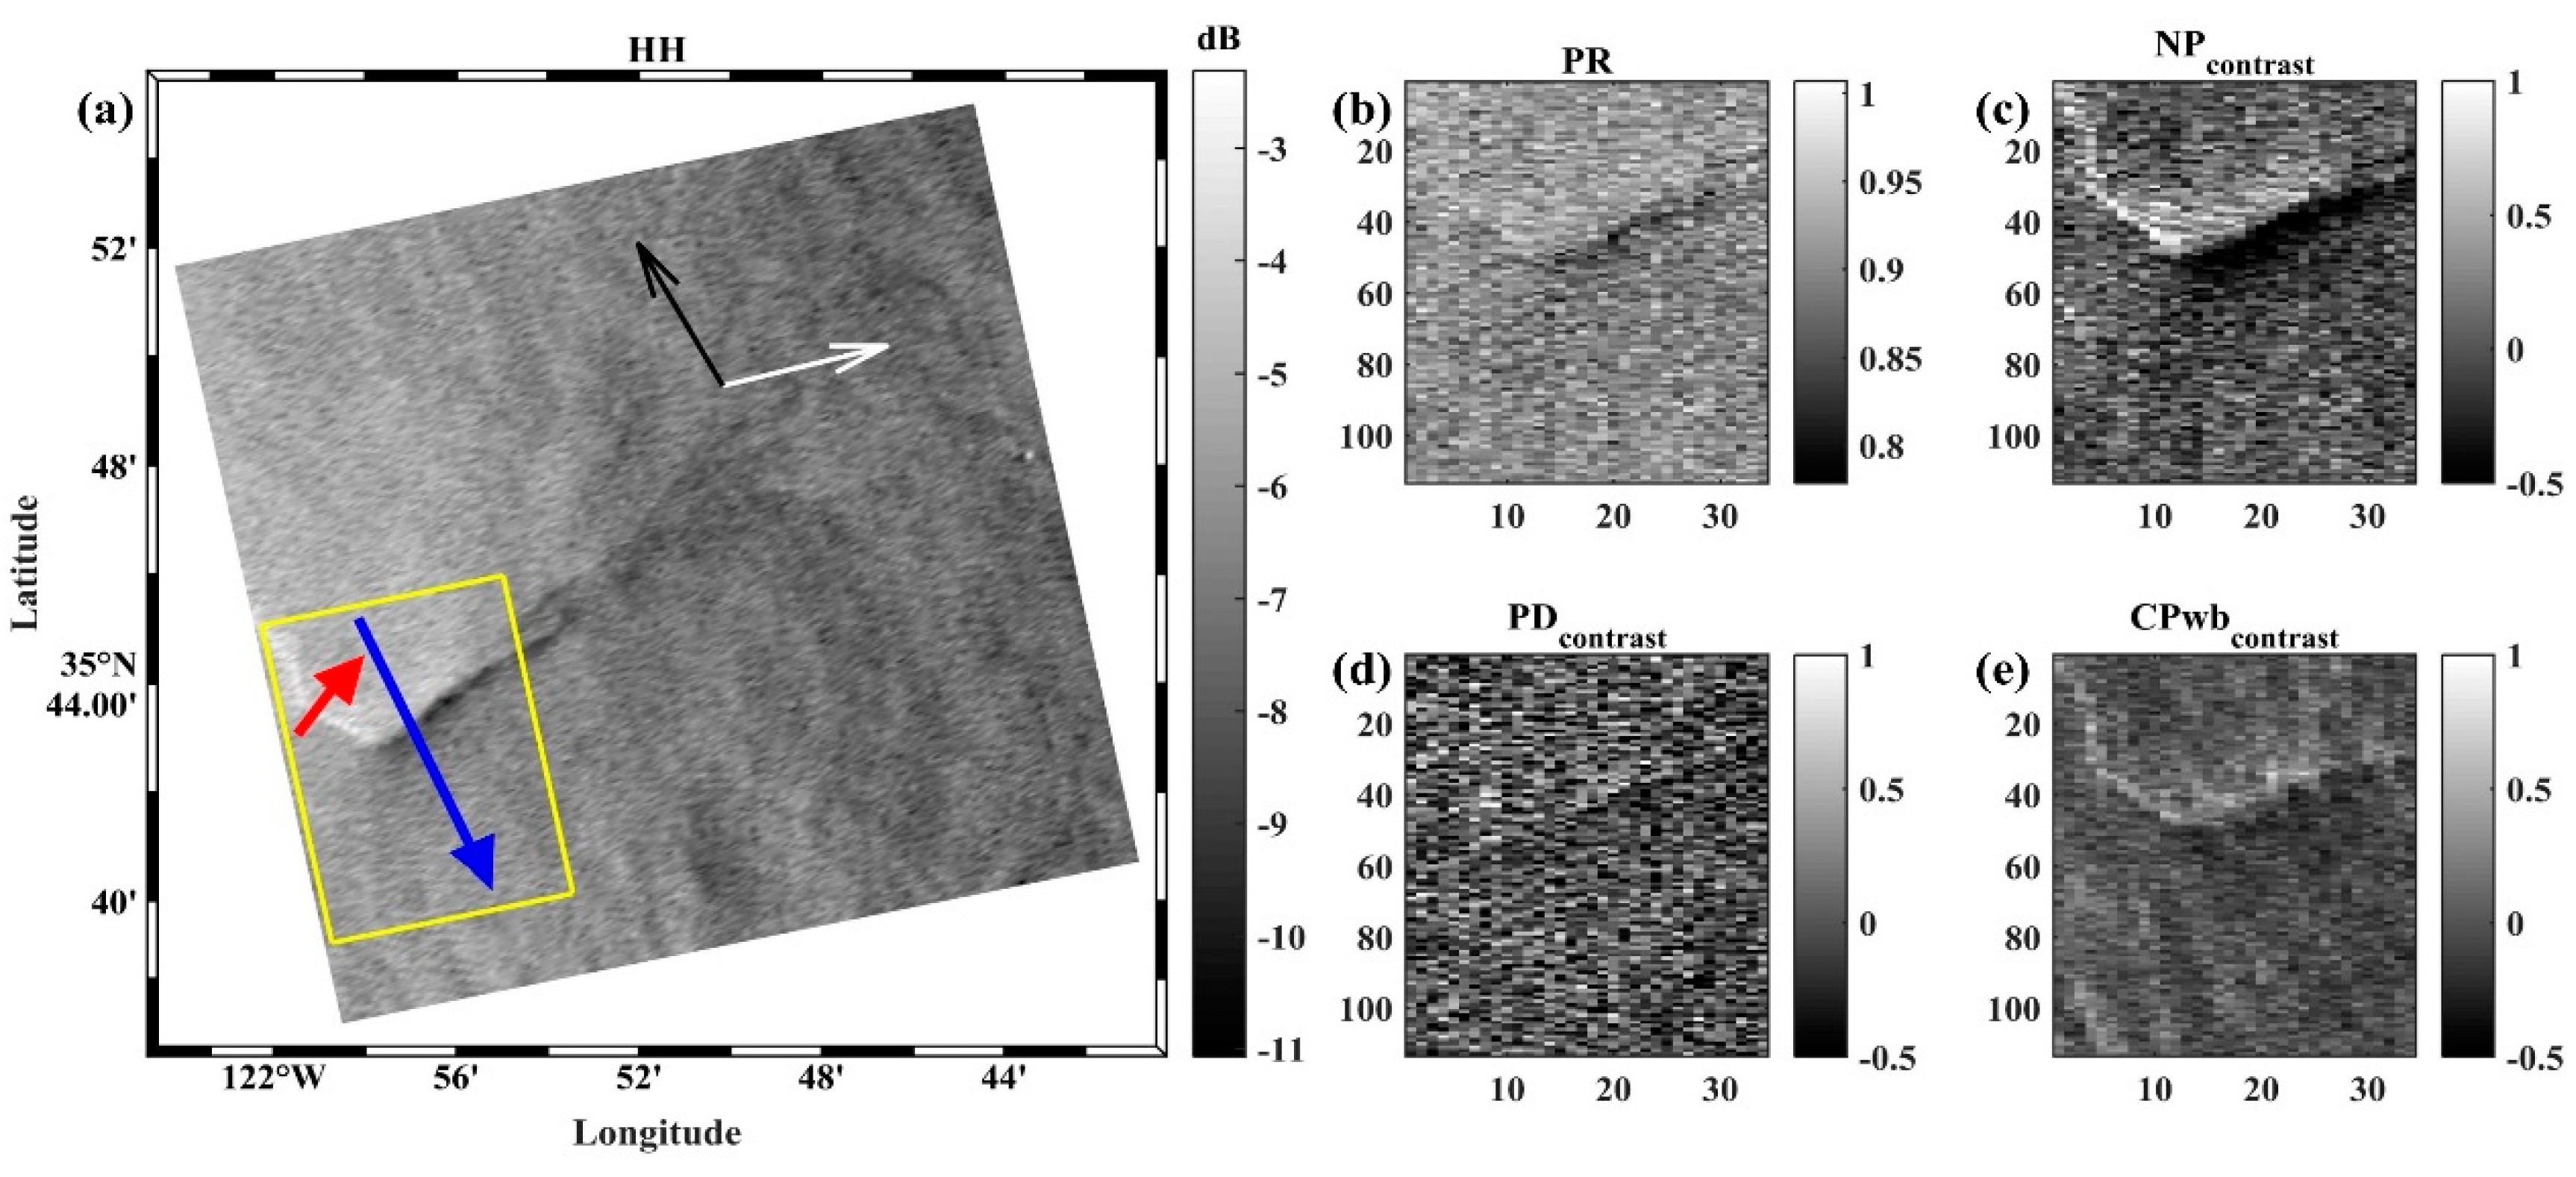
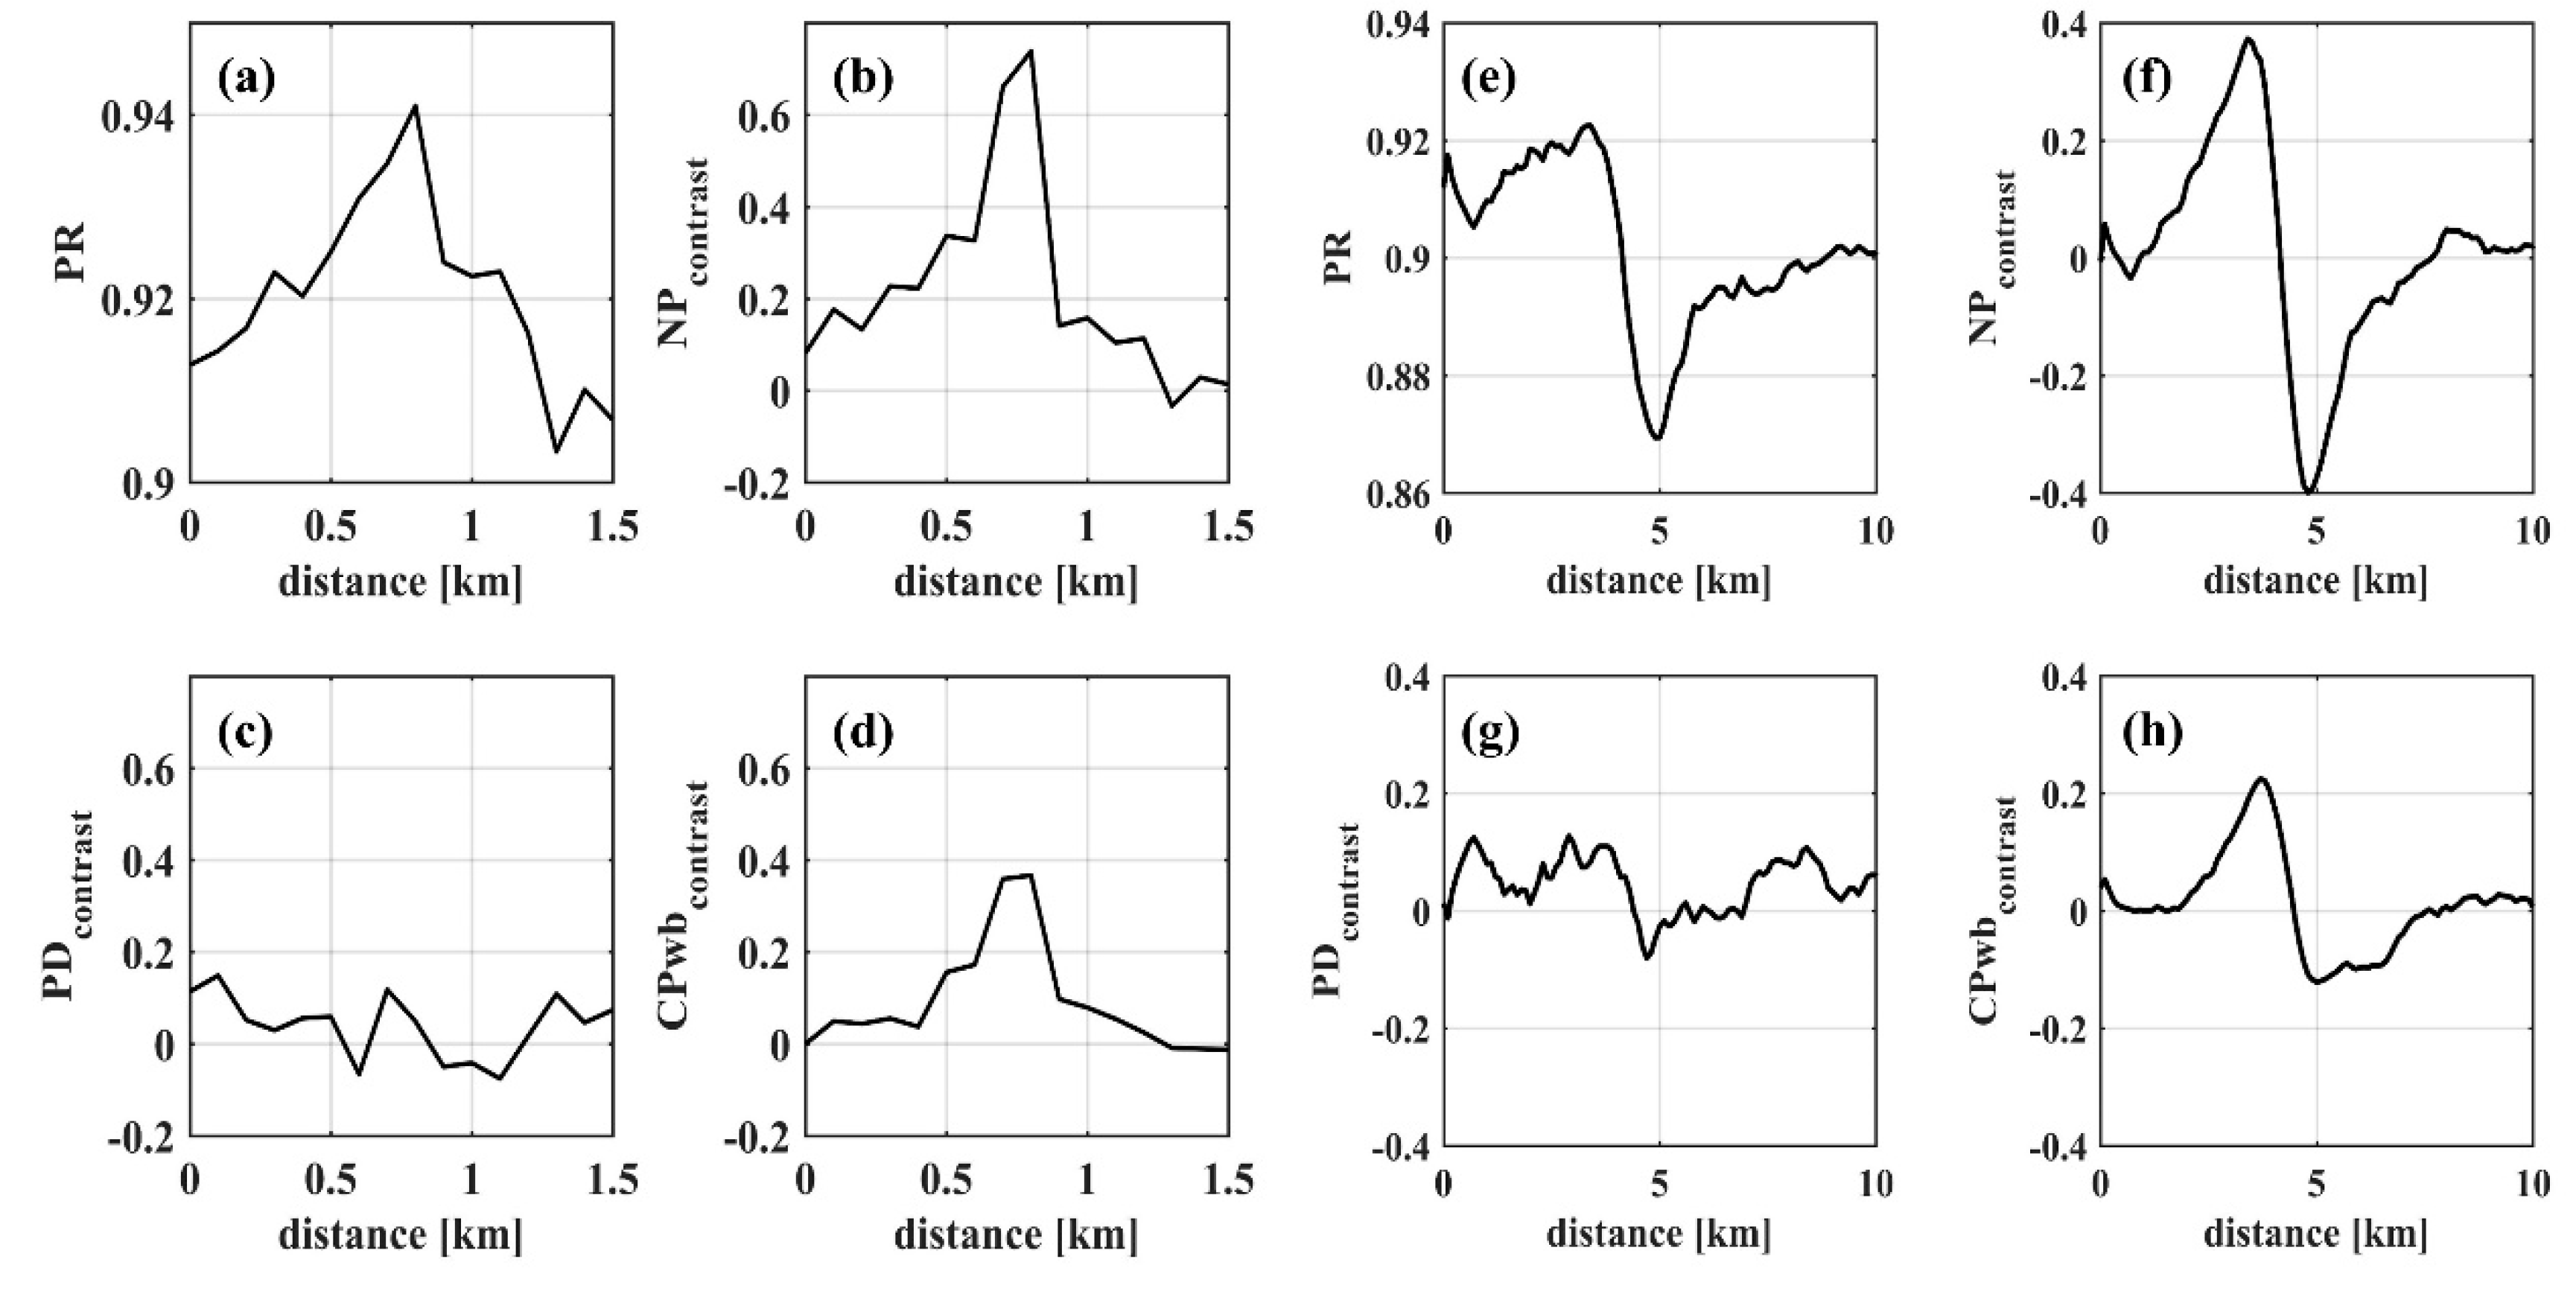
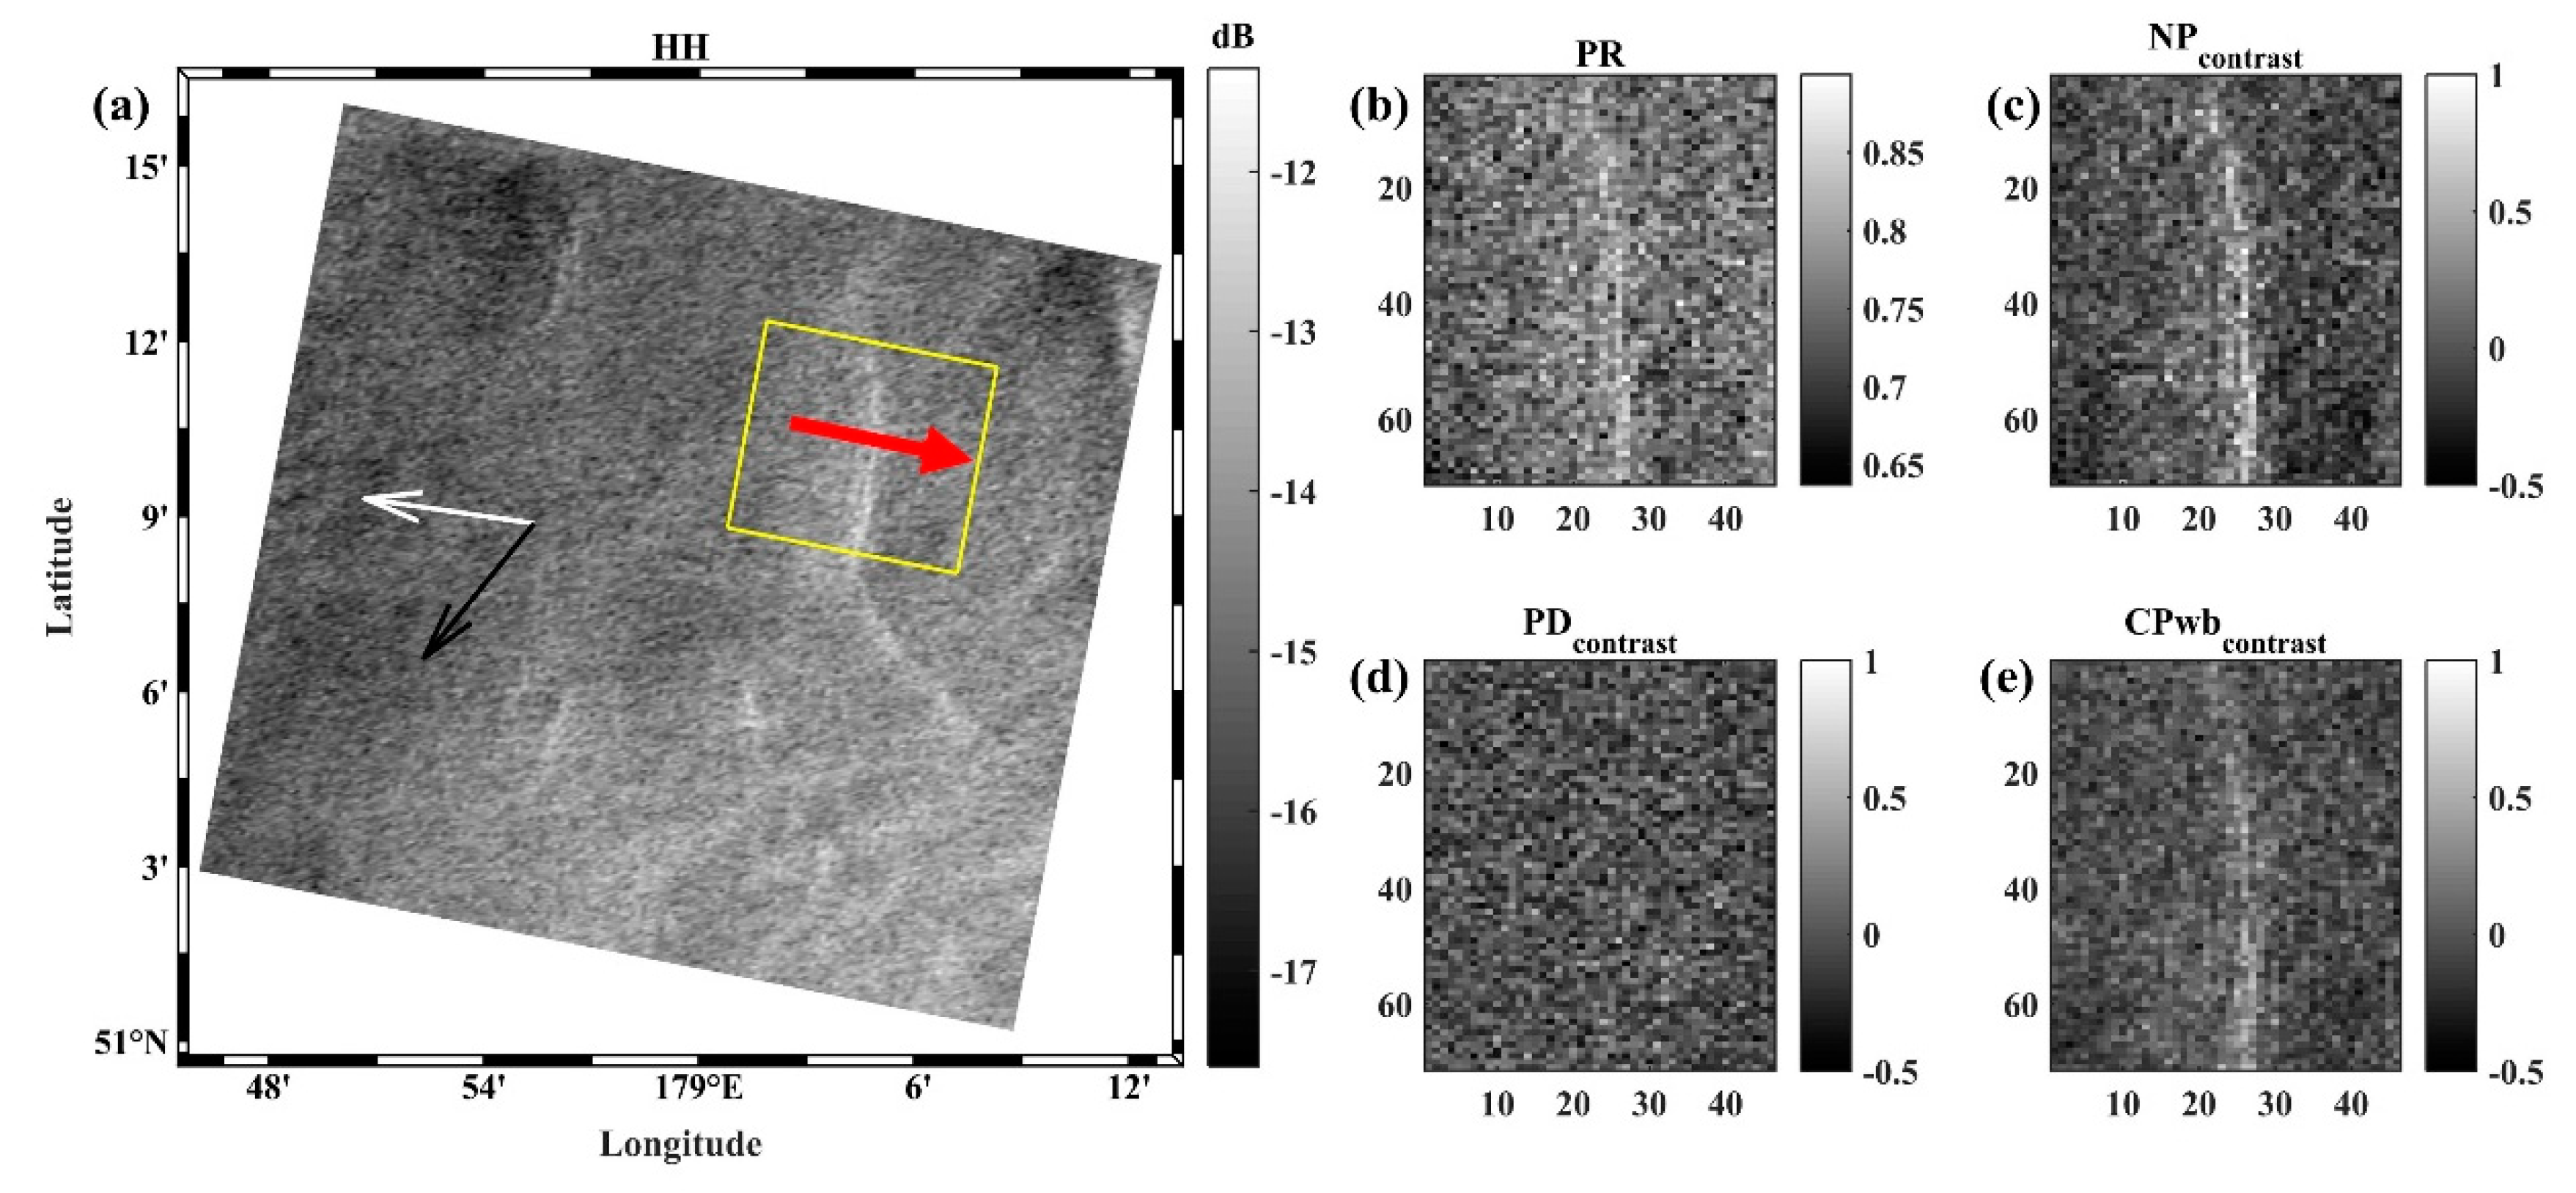
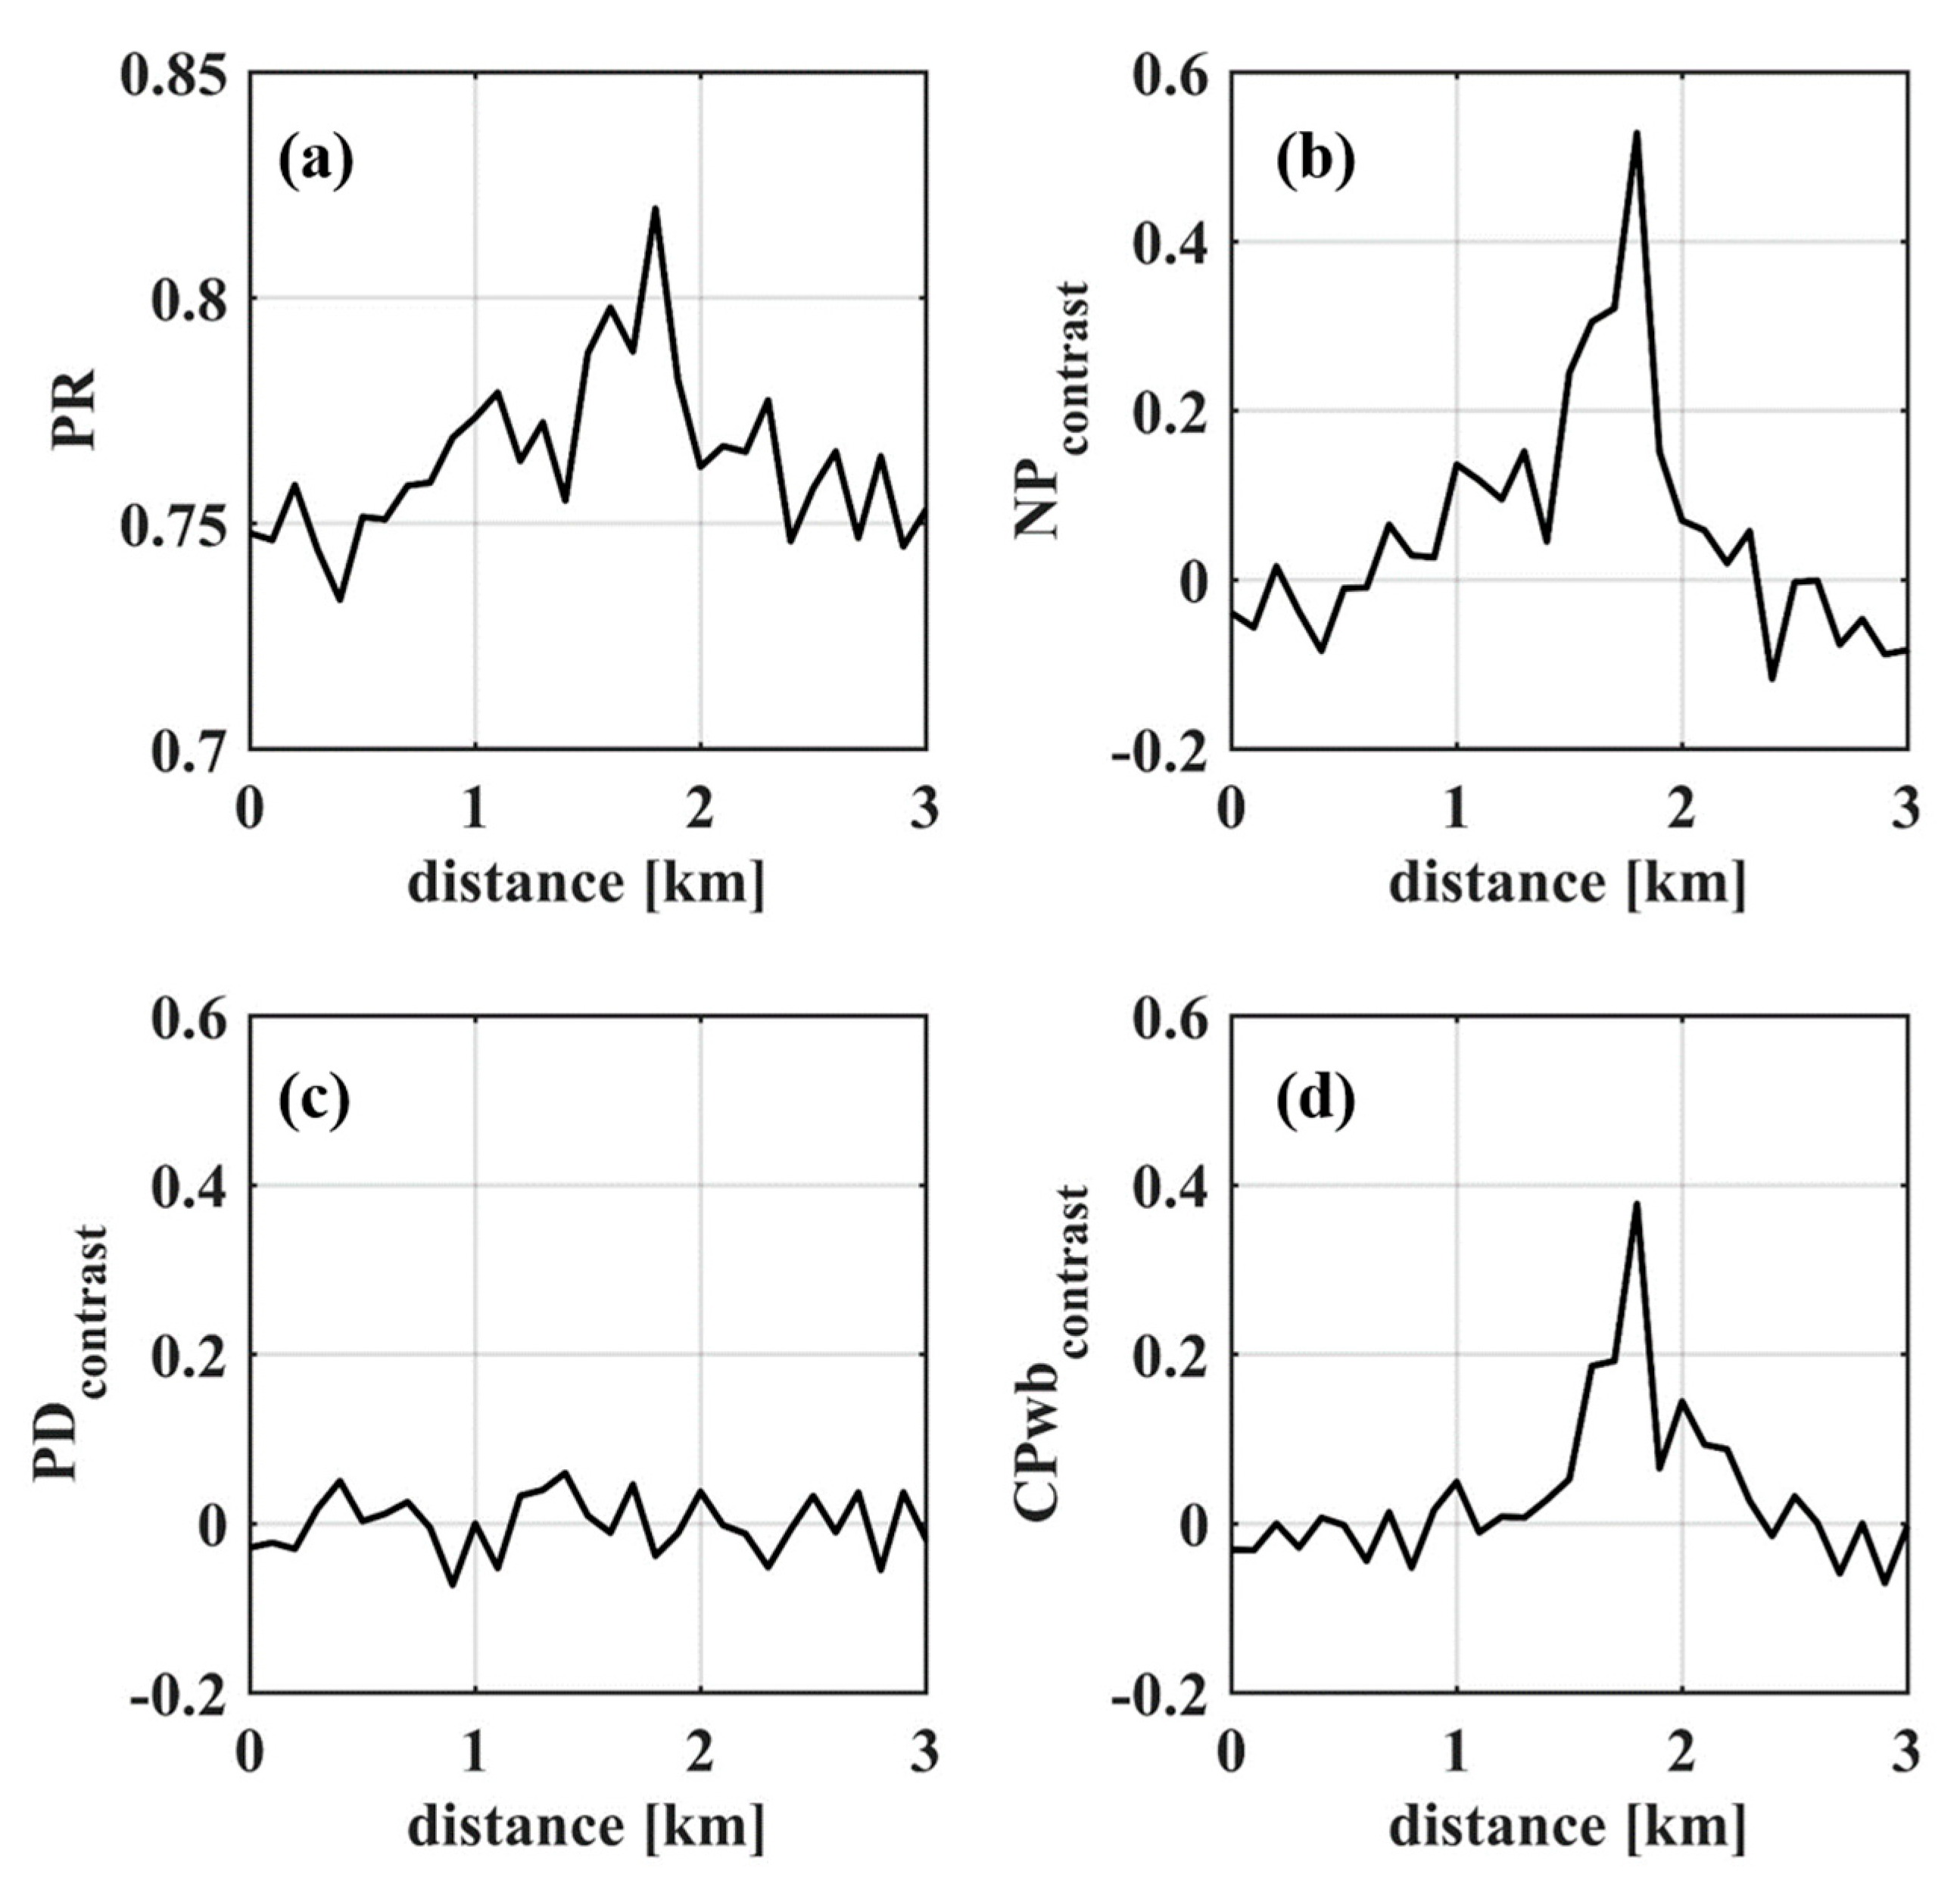
3.4. Ocean Currents
4. Discussion
5. Conclusions
Author Contributions
Funding
Acknowledgments
Conflicts of Interest
References
- Lumpkin, R.; Pazos, M. Measuring surface currents with Surface Velocity Program drifters: The instrument, its data, and some recent results. In Lagrangian Analysis and Prediction of Coastal and Ocean Dynamics; Cambridge University Press: Cambridge, UK, 2007; pp. 39–67. [Google Scholar]
- Lund, B.; Graber, H.C.; Hessner, K.; Williams, N.J. On shipboard marine X-band radar near-surface current “calibration”. J. Atmos. Ocean. Technol. 2015, 32, 1928–1944. [Google Scholar] [CrossRef]
- Weber, B.L.; Barrick, D.E. On the nonlinear theory for gravity waves on the ocean’s surface: Part I. Derivations. J. Phys. Oceanogr. 1977, 7, 3–10. [Google Scholar] [CrossRef]
- Broche, P.; Maistre, J.C.; Forget, P. Measure par radar de´came´trique coh e´rent des courants superficiels engendre´s par le vent. Oceanol. Acta 1983, 6, 43–53. [Google Scholar]
- Chapron, B.; Collard, F.; Ardhuin, F. Direct measurements of ocean surface velocity from space: Interpretation and validation. J. Geophys. Res. Oceans 2005, 110, 1–17. [Google Scholar] [CrossRef]
- Johannessen, J.A.; Chapron, B.; Collard, F.; Kudryavtsev, V.; Mouche, A.; Akimov, D.; Dagestad, K.-F. Direct ocean surface velocity measurements from space: Improved quantitative interpretation of Envisat ASAR observations. Geophys. Res. Lett. 2008, 35, 1–6. [Google Scholar] [CrossRef]
- Romeiser, R.; Suchandt, S.; Runge, H.; Steinbrecher, U.; Grünler, S. First analysis of TerraSAR-X along-track InSAR-derived current fields. IEEE Trans. Geosci. Remote Sens. 2010, 48, 820–829. [Google Scholar] [CrossRef]
- Romeiser, R.; Runge, H.; Suchandt, S.; Kahle, R.; Rossi, C.; Bell, P.S. Quality assessment of surface current fields from TerraSAR-X and TanDEM-X along-track interferometry and doppler centroid analysis. IEEE Trans. Geosci. Remote Sens. 2014, 52, 2759–2772. [Google Scholar] [CrossRef]
- Kudryavtsev, V.; Myasoedov, A.; Chapron, B.; Johannessen, J.A.; Collard, F. Joint sun-glitter and radar imagery of surface slicks. Remote Sens. Environ. 2012, 120, 123–132. [Google Scholar] [CrossRef]
- Kudryavtsev, V.; Myasoedov, A.; Chapron, B.; Johannessen, J.; Collard, F. Imaging meso-scale upper ocean dynamics using SAR and optical data. J. Geophys. Res. Oceans. 2012, 117, 1–13. [Google Scholar] [CrossRef]
- Alpers, W.; Hennings, I. A theory of the imaging mechanism of underwater bottom topography by real and synthetic aperture radar. J. Geophys. Res. Oceans. 1984, 89, 10529–10546. [Google Scholar] [CrossRef]
- Holliday, D.; St-Cyr, G.; Woods, N.E. A radar ocean imaging model for small to moderate incidence angles. Int. J. Remote Sens. 1986, 7, 1809–1834. [Google Scholar] [CrossRef]
- Lyzenga, D.R.; Bennett, J.R. Full-spectrum modeling of synthetic aperture radar internal wave signatures. J. Geophys. Res. Oceans 1988, 93, 12345–12354. [Google Scholar] [CrossRef]
- Thompson, D.R. Calculation of radar backscatter modulations from internal waves. J. Geophys. Res. Oceans 1988, 93, 12371–12380. [Google Scholar] [CrossRef]
- Romeiser, R.; Alpers, W. An improved composite surface model for the radar backscattering cross section of the ocean surface: 2. Model response to surface roughness variations and the radar imaging of underwater bottom topography. J. Geophys. Res. Oceans 1997, 102, 25251–25267. [Google Scholar] [CrossRef]
- Cooper, A.L.; Chubb, S.R.; Askari, F.; Valenzuela, G.R.; Keller, W.C.; Bennett, J.R. Radar surface signatures for the two-dimensional tidal circulation over Phelps Bank, Nantucket shoals: A comparison between theory and experiment. J. Geophys. Res. Oceans 1994, 99, 7865–7883. [Google Scholar] [CrossRef]
- Kudryavtsev, V.; Akimov, D.; Johannessen, J.; Chapron, B. On radar imaging of current features: 1. Model and comparison with observations. J. Geophys. Res. Oceans 2005, 110, 1–27. [Google Scholar] [CrossRef]
- Lyzenga, D.R. Effects of Wave Breaking on Sar Signatures Observed Near the Edge of the Gulf Stream. In Proceedings of the International Geoscience & Remote Sensing Symposium, Lincoln, NE, USA, 31 May 1996. [Google Scholar]
- Wetzel, L.B. On Microwave Scattering by Breaking Waves, in Wave Dynamics and Radio Probing of the Ocean Surface; Phillips, O.M., Hasselmann, K., Eds.; Springer: New York, NY, USA, 1986; pp. 273–284. [Google Scholar]
- Chubb, S.; Cooper, A.; Jansen, R.; Fusina, R.; Askari, F.; Lee, J.-S. Radar backscatter from breaking waves in Gulf Stream current convergence fronts. IEEE Trans. Geosci. Remote Sens. 1999, 37, 1951–1966. [Google Scholar] [CrossRef]
- Jansen, R.W.; Shen, C.Y.; Chubb, S.R.; Cooper, A.L.; Evans, T.E. Subsurface, surface, and radar modeling of a Gulf Stream current convergence. J. Geophys. Res. Oceans 1998, 103, 18723–18743. [Google Scholar] [CrossRef]
- Snyder, R.L.; Kennedy, R.M. On the formation of whitecaps by a threshold mechanism: 1. Basic formation. J. Phys. Oceanogr. 1983, 13, 1482–1492. [Google Scholar] [CrossRef]
- Hughes, B.A. The effect of internal waves on surface wind waves: 2. Theoretical analysis. J. Geophys. Res. Oceans 1978, 83, 455–465. [Google Scholar] [CrossRef]
- Kudryavtsev, V.; Kozlov, I.; Chapron, B.; Johannessen, J.A. Quad-polarization SAR features of ocean currents. J. Geophys. Res. Oceans 2014, 119, 6046–6065. [Google Scholar] [CrossRef]
- Zhang, G.; Perrie, W. Dual-Polarized Backscatter Features of Surface Currents in the Open Ocean during Typhoon Lan (2017). Remote Sens. 2018, 10, 875. [Google Scholar] [CrossRef]
- Kudryavtsev, V.; He, Y.; Zhang, B.; Liu, G.; Hu, H.; Perrie, W.; Shen, H. Radar imaging of intense nonlinear Ekman divergence. Geophys. Res. Lett. 2016, 43, 9810–9818. [Google Scholar]
- Jones, C.T.; Sikora, T.D.; Vachon, P.W.; Buckley, J.R. Ocean feature analysis using automated detection and classification of sea-surface temperature front signatures in RADARSAT-2 images. Bull. Am. Meteorol. Soc. 2014, 95, 677–679. [Google Scholar] [CrossRef]
- Kudryavtsev, V.; Hauser, D.; Caudal, G.; Chapron, B. A semiempirical model of the normalized radar cross-section of the sea surface 1. Background model. J. Geophys. Res. Oceans 2003, 108, 1–24. [Google Scholar] [CrossRef]
- Kudryavtsev, V.N.; Chapron, B.; Myasoedov, A.G.; Collard, F.; Johannessen, J.A. On Dual Co-Polarized SAR Measurements of the Ocean Surface. IEEE Geosci. Remote Sens. Lett. 2013, 10, 761–765. [Google Scholar] [CrossRef]
- Hansen, M.W.; Kudryavtsev, V.; Chapron, B.; Brekke, C.; Johannessen, J.A. Wave Breaking in Slicks: Impacts on C-Band Quad-Polarized SAR Measurements. IEEE J. Sel. Top. Appl. Earth Obs. Remote Sens. 2016, 9, 1–12. [Google Scholar] [CrossRef]
- Kudryavtsev, V.N.; Fan, S.; Zhang, B.; Mouche, A.A.; Chapron, B. On Quad-Polarized SAR Measurements of the Ocean Surface. IEEE Trans. Geosci. Remote Sens. 2019, 1–9. [Google Scholar] [CrossRef]
- Slade, B. RADARSAT-2 Product Description. Issue 1/6, RN-SP-52-1238. Available online: http://gs.mdacorporation.com/products/sensor/radarsat2/RS2_Product_Description.pdf (accessed on 1 January 2018).
- Lu, Y.; Zhang, B.; Perrie, W.; Mouche, A.A.; Li, X.; Wang, H. A C-Band Geophysical Model Function for Determining Coastal Wind Speed Using Synthetic Aperture Radar. IEEE J. Sel. Top. Appl. Earth Obs. Remote Sens. 2018, 11, 2417–2428. [Google Scholar] [CrossRef]
- Beal, R.; Kudryavtsev, V.; Thompson, D.; Grodsky, S.; Tilley, D.; Dulov, V.; Graber, H. The influence of the marine atmospheric boundary layer on ERS-1 synthetic aperture radar imagery of the Gulf Stream. J. Geophys. Res. Oceans 1997, 102, 5799–5814. [Google Scholar] [CrossRef]
- Kuang, H.-L.; Perrie, W.; Xie, T.; Zhang, B.; Chen, W. Retrievals of sea surface temperature fronts from SAR imagery. Geophys. Res. Lett. 2012, 39, 1–7. [Google Scholar] [CrossRef]
- Voronovich, A.G.; Zavorotny, V.U. Theoretical model for scattering of radar signals in Ku- and C-bands from a rough sea surface with breaking waves. Waves Random Media 2001, 11, 247–269. [Google Scholar] [CrossRef]
- Walker, D.T.; Lyzenga, D.R.; Ericson, E.; Lung, D.E. Radar backscatter and surface roughness measurements from stationary breaking waves. Philos. Trams. R. Soc. Lond. Ser. A 1996, 452, 1953–1984. [Google Scholar]
- Phillips, O.M. Spectral and statistical properties of the equilibrium range in wind-generated gravity waves. J. Fluid Mech. 1985, 156, 505–531. [Google Scholar] [CrossRef]
- Yurovskaya, M.V.; Dulov, V.A.; Chapron, B.; Kudryavtsev, V.N.; Yurovskaya, M.; Dulov, V. Directional short wind wave spectra derived from the sea surface photography. J. Geophys. Res. Oceans 2013, 118, 4380–4394. [Google Scholar] [CrossRef]


| PR | |
| PD | |
| NP | |
| CP | |
| CPwb | |
| contrast |
| SAR Observation Time (UTC) | Feature | (deg) | (m/s) | (deg) | ||||
|---|---|---|---|---|---|---|---|---|
| 13:53, May 24, 2012 | Atmospheric IWs | 44 | 11 | 59 | 1.07 | 0.98 | 0.48 | 0.93 |
| 14:35, Aug 15, 2009 | IW train | 29 | 6 | 39 | 0.25 | 0.71 | −0.05 | −0.1 |
| solitary IW | 0.35 | 0.96 | 0.06 | 0.19 | ||||
| 22:07, Mar 18, 2009 | SST front | 33 | 4 | 112 | 0.39 | 0.95 | 0.33 | 0.92 |
| 21:30, Apr 26, 2009 | current | 39 | 6 | 96 | 0.36 | 0.79 | 0.17 | 0.69 |
| 01:57, Aug 9, 2009 | current (red) | 23 | 12 | 108 | 0.54 | 0.97 | 0.02 | 0.07 |
| current (blue) | 0.42 | 0.92 | 0.02 | 0.07 | ||||
| 18:20, Sept 14, 2009 | current | 34 | 10 | 60 | 0.55 | 0.85 | −0.02 | −0.07 |
© 2019 by the authors. Licensee MDPI, Basel, Switzerland. This article is an open access article distributed under the terms and conditions of the Creative Commons Attribution (CC BY) license (http://creativecommons.org/licenses/by/4.0/).
Share and Cite
Fan, S.; Kudryavtsev, V.; Zhang, B.; Perrie, W.; Chapron, B.; Mouche, A. On C-Band Quad-Polarized Synthetic Aperture Radar Properties of Ocean Surface Currents. Remote Sens. 2019, 11, 2321. https://doi.org/10.3390/rs11192321
Fan S, Kudryavtsev V, Zhang B, Perrie W, Chapron B, Mouche A. On C-Band Quad-Polarized Synthetic Aperture Radar Properties of Ocean Surface Currents. Remote Sensing. 2019; 11(19):2321. https://doi.org/10.3390/rs11192321
Chicago/Turabian StyleFan, Shengren, Vladimir Kudryavtsev, Biao Zhang, William Perrie, Bertrand Chapron, and Alexis Mouche. 2019. "On C-Band Quad-Polarized Synthetic Aperture Radar Properties of Ocean Surface Currents" Remote Sensing 11, no. 19: 2321. https://doi.org/10.3390/rs11192321
APA StyleFan, S., Kudryavtsev, V., Zhang, B., Perrie, W., Chapron, B., & Mouche, A. (2019). On C-Band Quad-Polarized Synthetic Aperture Radar Properties of Ocean Surface Currents. Remote Sensing, 11(19), 2321. https://doi.org/10.3390/rs11192321